Synthesis and Optimization of Multiwalled Carbon Nanotubes–Ferrihydrite Hybrid Composite


Department of Geosciences, Georgia State University, 38 Peachtree Center Ave NE, Langdale Hall 730, Atlanta, GA 30303, USA
*
Author to whom correspondence should be addressed.
J. Compos. Sci. 2021, 5(1), 5; https://doi.org/10.3390/jcs5010005
Submission received: 8 December 2020
/
Revised: 21 December 2020
/
Accepted: 23 December 2020
/
Published: 26 December 2020
(This article belongs to the Special Issue Composite Nanostructures for Energy and Environment Applications)
Abstract
:Carbon nanotubes (CNT) are a family of carbon nanomaterials that have uses in many technological and medical applications due to their unique properties. However, compared to other nanomaterials, CNT have a significantly lower specific surface areas (SSA), which is a critical limitation for applications. To overcome this limitation, here, we report a new protocol to synthesize a hybrid material composed of varying ratios of multiwalled carbon nanotubes (MWCNT) and ferrihydrite (FHY). Furthermore, through a series of physical and electrochemical characterization tests, we determined that 36% FHY and 64% MWCNT is the optimum ratio for a composite that maximizes both SSA and specific capacitance. The calculated SSA of the composite was 190 m2·g−1, 2.9 times higher than that of MWCNT alone. Moreover, the composite retained valuable electrochemical properties of CNT with an estimated specific capacitance of 100 F·g−1. This composite is a promising multifunctional nanomaterial for environmental and technological applications requiring electrochemical reactivity and high specific areas such as environmental biosensors, and capacitive deionization for wastewater remediation, and water softening.
1. Introduction
In 1991, carbon nanotubes (CNT) was characterized by Iijima [1] and have since received increased attention in both research and development due to their remarkable electrical conductivity, wide thermal operating range, chemical and physical stability, and high aspect ratios [2,3,4]. Unlike other conventional carbon materials, CNT have a 3D structure of cylindrically rolled-up chicken wire tubes made from covalently bonded carbon atoms resulting in the two main types of CNT: (1) single-walled CNT (SWCNT) consisting of a single layer of cylindrical graphene sheet [5,6] and (2) multiwalled carbon nanotubes (MWCNT) consisting of multilayered graphene sheets [1,6].
Due to their desirable high aspect ratios and electrochemical performance, CNT is good candidate for many applications, including as potential adsorbents for contaminants in water and supercapacitor electrode materials [6,7,8,9,10]. The reported specific surface area (SSA) for MWCNT range from 170 to 280 m2·g−1 [11], whereas values for activated carbon nanomaterials, for instance, are higher than 500 m2·g−1 [12]. MWCNT’s overall lower SSA limits their popularity for commercial applications. To overcome this obstacle, some researchers have developed CNT-based hybrid materials that showed a significant improvement in their surface area by including materials such as mesoporous carbon, activated carbon, nanofibers, nanoporous anodic alumina, and ferrihydrite (FHY) [13,14,15,16,17,18].
FHY is a naturally occurring nanocrystalline iron oxyhydroxide, with reported SSA up to 650 m2·g−1 [19]. It plays a significant role in trapping contaminants from groundwater and moving them across terrestrial environments [20,21]. Several studies have combined FHY with MWCNT [17,18] to improve the adsorption capacity of MWCNT in adsorbing aqueous contaminants. However, these studies only considered a single point of composition ratio between MWCNT and FHY and assessed changes of only the physical properties, i.e., crystal structure, morphology, and SSA, of the hybrid mixture [17,18]. Moreover, no other studies investigated the electrochemical performance of an FHY/MWCNT composite. The novelty of this work is that we expand on past studies by synthesizing composites of FHY and MWCNT at five different composition ratios and present a comprehensive characterization and optimization of their physical and electrochemical properties. To our knowledge, this is the first study to comprehensively characterize the promising FHY/MWCNT material. The detailed characterization encompassed determination of the SSA by a Brunauer–Emmett–Teller (BET) analysis, morphologies by transmission electron microscopy (TEM), crystallinity by X-ray powder diffraction (XRD), and electrochemical properties by cyclic voltammetry (CV). Additionally, the composites exhibited physicochemical properties, e.g., density and dispersibility, that proved problematic in preparation procedures traditionally used for the characterization methods we utilized. Thus, this study also reports on newly developed protocols for synthesizing and characterizing the physical, chemical, and electrochemical properties of these composite materials. These procedures may be adopted in future studies that seek to develop and investigate these composites or others containing metal oxides/hydroxides.
2. Materials and Methods
2.1. Materials and Preparation
Prior to the experiment, all equipment and glassware were treated with ethanol and 10% nitric acid solution to reduce organic and metal contaminations, respectively [22]. MWCNT (> 97% purity) were purchased from Shenzhen Nanotech Port Co. Ltd. (Shenzhen, China) and manufactured by catalytic decomposition of methane. According to manufacturer MSDS, their outer diameter ranged between 40 and 60 nm and lengths between 5 and 15 μm.
MWCNT were refluxed in 2.6 M HNO3 solution at 140 °C for 24 h and then washed repeatedly under vacuum filtration with 18.2 MΩ.cm deionized H2O until the effluent pH reached 7.0 ± 0.2. The MWCNT was dried in an oven at 100 °C for 24 h. The acid refluxing step was intended to remove any residual catalyst or metal impurities from the manufacturing processes and functionalize the surface of the MWCNT with carboxyl groups. This functionalization was necessary to enhance the dispersion, surface area, and electrical properties of the MWCNT [23,24,25].
2.2. FHY/MWCNT Composite Synthesis
The composite materials were synthesized at 5 wt% ratios of FHY/MWCNT 100/0, 75/25, 50/50, 25/75, and 0/100 as follows. Appropriate masses of MWCNT and iron nitrate (Fe(NO3)3•9(H2O), ACS grade, ACROS Organics) were mixed in glass beakers, then added to 200 mL of 18.2 MΩ.cm H2O, magnetically stirred for 10 min, and sonicated for another 30 min for even dispersion. These well-dispersed suspensions were treated according to a modified Schwertmann and Cornell’s 2-line FHY synthesis protocol [26], which calls for titrating with 1 M potassium hydroxide solution (KOH, Laboratory Grade, Carolina) to pH 7.5± 0.2 to induce FHY precipitation. The precipitates were washed repeatedly with 18.2 MΩ.cm H2O using vacuum filtration until the conductivity of effluent solutions reached a value below 20 µS·cm−1. On the average, analyzed samples showed that most of the Fe3+(aq) (mass balance, >92%) was driven into a solid phase and precipitated onto the surface of MWCNT. The synthesized composites were dried first under a vacuum desiccator for 24 h and then under a fume hood for an additional 24 h to ensure complete water evaporation. The dry composites were stored into sealed containers that were placed in a freezer at −18 °C pending for analysis.
2.3. X-ray Powder Diffraction (XRD) Analysis
Samples were analyzed on a XPERT PRO MPD X-ray diffractometer (Malvern PANalytical, Malvern, UK), operating at 45 kV and 40 mA, from 5° to 80° 2θ, using a Cu anode and a graphite crystal monochromator to eliminate Fe fluorescence.
2.4. Transmission Electron Microscope (TEM) Analysis
TEM was used to study the surface morphologies, structure orientations, topography, and uniformity of the composite. Approximately a solution of 0.5 mg/mL of samples in ethanol was dispersed using sonication under >20 kHz for a few minutes. These suspensions were then dropped on a LC300-Cu-150 TEM grid, with 150 nm openings lacey C support (Electron Microscopy Sciences, Hatfield, PA, USA) for successive TEM analysis. Samples were analyzed on a JEOL-2100 LaB6 TEM (JEOL, Peabody, MA, USA), with a point resolution of 0.194 nm, operated at 200 keV.
The TEM is equipped with a JEOL EX-230 Silicon Drift Detector (JEOL, Peabody, MA, USA) with a 60 mm2 window of acquisition for energy dispersive X-ray analysis (EDS). Scanning transmission electron microscopy (STEM) digital scanning images were acquired while collecting EDS maps with a JEOL EM-245111SIOD (JEOL, Peabody, MA, USA) bright-field STEM detector that has a resolution of 1 nm.
2.5. Brunauer–Emmett–Teller (BET) Surface Area Analysis
The specific surface areas of the dried composites were evaluated by conducting a 7-point BET N2 adsorption isotherms at 77 K ET using a Quantachrome Autosorb-1 (Quantachrome Instruments, Boynton Beach, FL, USA). Before the measurements, the samples were degassed overnight at 80 °C. A low degassing temperature was selected to prevent the removal of the structural water of FHY and hence its transformation. The sample mass utilized for the analysis varied from 0.08 to 0.31 g, depending on the density of each composite ratio.
2.6. Cyclic Voltammetry (CV) Analysis
2.6.1. Thin-Film Deposition for Working Electrodes (WE)
CV was used to analyze the specific capacitance of each composite at various scan rates. In order to perform the CV measurements, it was important to develop an effective method of depositing the composites on metal plate substrates. MWCNT have been a popular material for supercapacitors, and there are several standard methods for MWCNT thin-film deposition [27,28,29,30,31]. However, the FHY/MWCNT composites had new electrochemical properties compared to either CNTs or FHY alone. Attempts at conventional thin-film deposition techniques such as chemical vapor deposition, electrophoretic deposition, and doctor blade technique were unsuccessful. To solve this problem, a 5 wt% Nafion ionomer solution (C7HF13O5S·C2F4, Ion Power) was used as a binder to deposit the composites on stainless steel substrate plates. Nafion has been used in previous electrochemical studies as a binder that does not interfere with the signal of target analytes [32,33,34]. Working electrodes (WE) were made from stainless steel (ASTM A240, 16 Ga) with dimensions of 1.5 cm × 0.19 cm × 1 cm. These electrodes were cleaned by acetone prior to the CV analysis.
Suspensions combining each composite and Nafion at a density of 2 mg·mL−1 were prepared and sonicated for at least 30 min. Then, 50 µL of these mixtures was drop-casted on each side of the electrodes. The electrodes were placed on a rack in a sealed chamber and suspended over an ethanol bath to avoid cracking due to rapid drying. The elevated ethanol vapor pressure in the chamber slowed the evaporation rate sufficiently to allow the composite to deposit evenly on the surface of the electrodes. These electrodes were then air dried for at least 15 more min before the CV experiments to ensure complete evaporation. Three WE samples were made at each composite ratio. The deposited amount of material on these electrodes were recorded for later mass-based calculations; the deposited mass was kept under 5 mg.
2.6.2. CV Setup
A standardized potentiostat (Reference 600, Gamry instruments, PA, USA) was used for the CV analysis in a standard three-electrode system. The WEs were the stainless-steel plates with composite material deposited as described in Section 2.6.1. The counter electrode (CE) was a platinum plate (Gesswein, CT, USA) and the reference electrode (RE) Ag/AgCl in 3 M saturated NaCl solution (BASi, IN, USA)
The potentials of WE were measured against the RE with negatively charged CE. The electrolyte in these experiments was 0.5 M Na2SO4 solution. Unlike other organic electrolytes, Na2SO4 solution has a lower equivalent series resistance and pore size requirement [35]. Measurements were made within a potential window of 1 V with an upper and lower limit of 0.5 and −0.5 V, respectively. This potential window was limited to the 1 V range because water could breakdown at 1.23 V [36]. Each composite was run three times and scanned at the following scan rates of 100, 70, 50, 20, and 2 mV·s−1. The following equation was used to determine the specific capacitance (Cs, in F·g−1) of samples at various sweep rates [35,37].
where was the integrated area of the CV plots; v (in V·s−1) was the scan rate; m (in g) was the mass of loaded material on the WE; and Vb and Va (in V) were the upper and lower voltage limit of the scan, respectively.
3. Results and Discussion
3.1. XRD Patterns of the FHY/MWCNT Composite
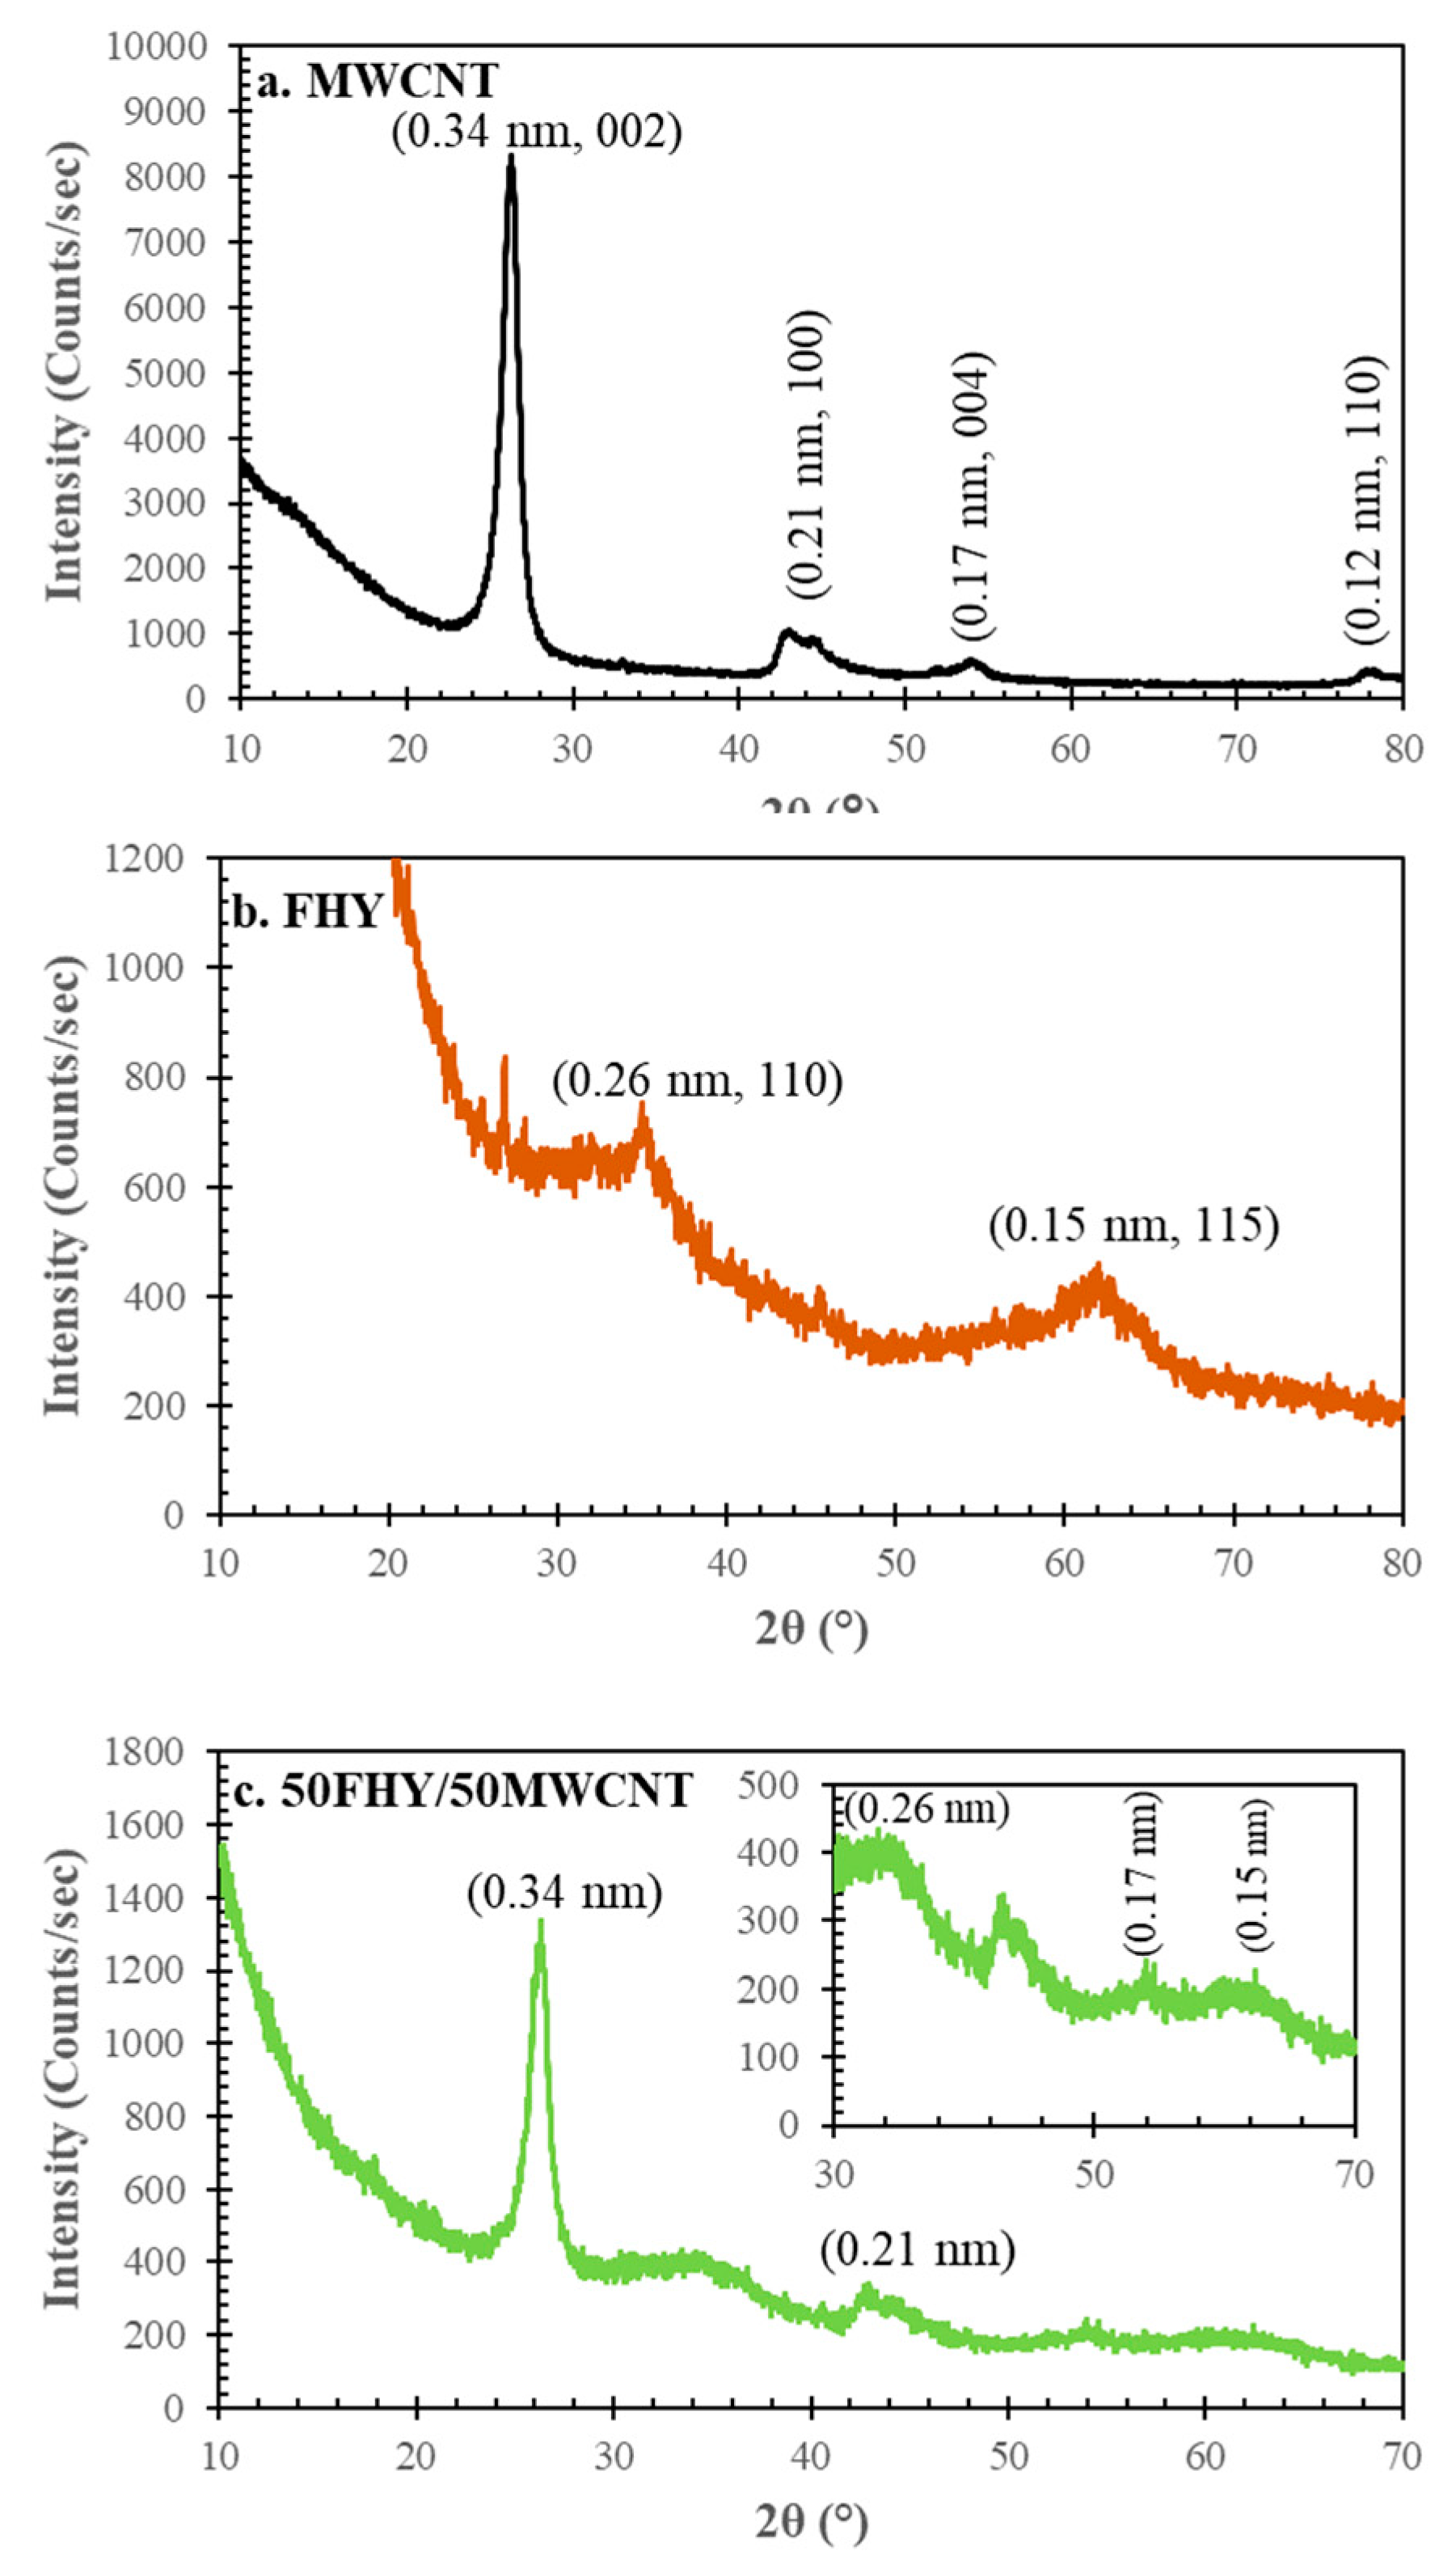
Figure 1 shows representative X-ray diffractograms for the 0/100, 50/50, and 100/0 FHY/MWCNT materials. MWCNT presented a high-intensity diffraction peak around 26° (d = 0.34 nm), and three lower intensity diffraction peaks around 44° (d = 0.21 nm), 53° (d = 0.17 nm), and 78° (d = 0.12 nm) (Figure 1a). These peaks correspond respectively to the (002), (100), (004), and (110) diffraction patterns of typical graphite, which indicates that the acid-treated MWCNT in this study were well graphitized [38]. All these peaks, except the (110), were present in the pattern of the 50/50 FHY/MWCNT composite (Figure 1c). Based on the similarity of our XRD patterns with those from Atchudan et al. (2015), we conclude equally that neither MWCNT nor FHY/MWCNT composites contain significant carbonaceous or metal impurities. We conclude that the quality of the starting materials is not compromised during the synthesis of the composite material. In Figure 1b, the pattern for pure FHY showed two main diffraction peaks around 34° (d = 0.26 nm) and 61° (d = 0.15 nm) corresponding,, respectively to the (110) and (115) diffraction patterns of a 2-line FHY [39]. These peaks were also evident in Figure 1c of the FHY/MWCNT composite revealing FHY was successfully synthesized in the composite.
The XRD data indicate that the FHY/MWCNT composite inherited the characteristics XRD patterns of both FHY and MWCNT. Hence, the synthesis procedure we developed for the composite materials did not interfere with the formation of FHY or the integrity of the MWCNT. Moreover, the crystallinity signature of each composite samples is qualitatively representative of each of its end-member.
3.2. TEM Results
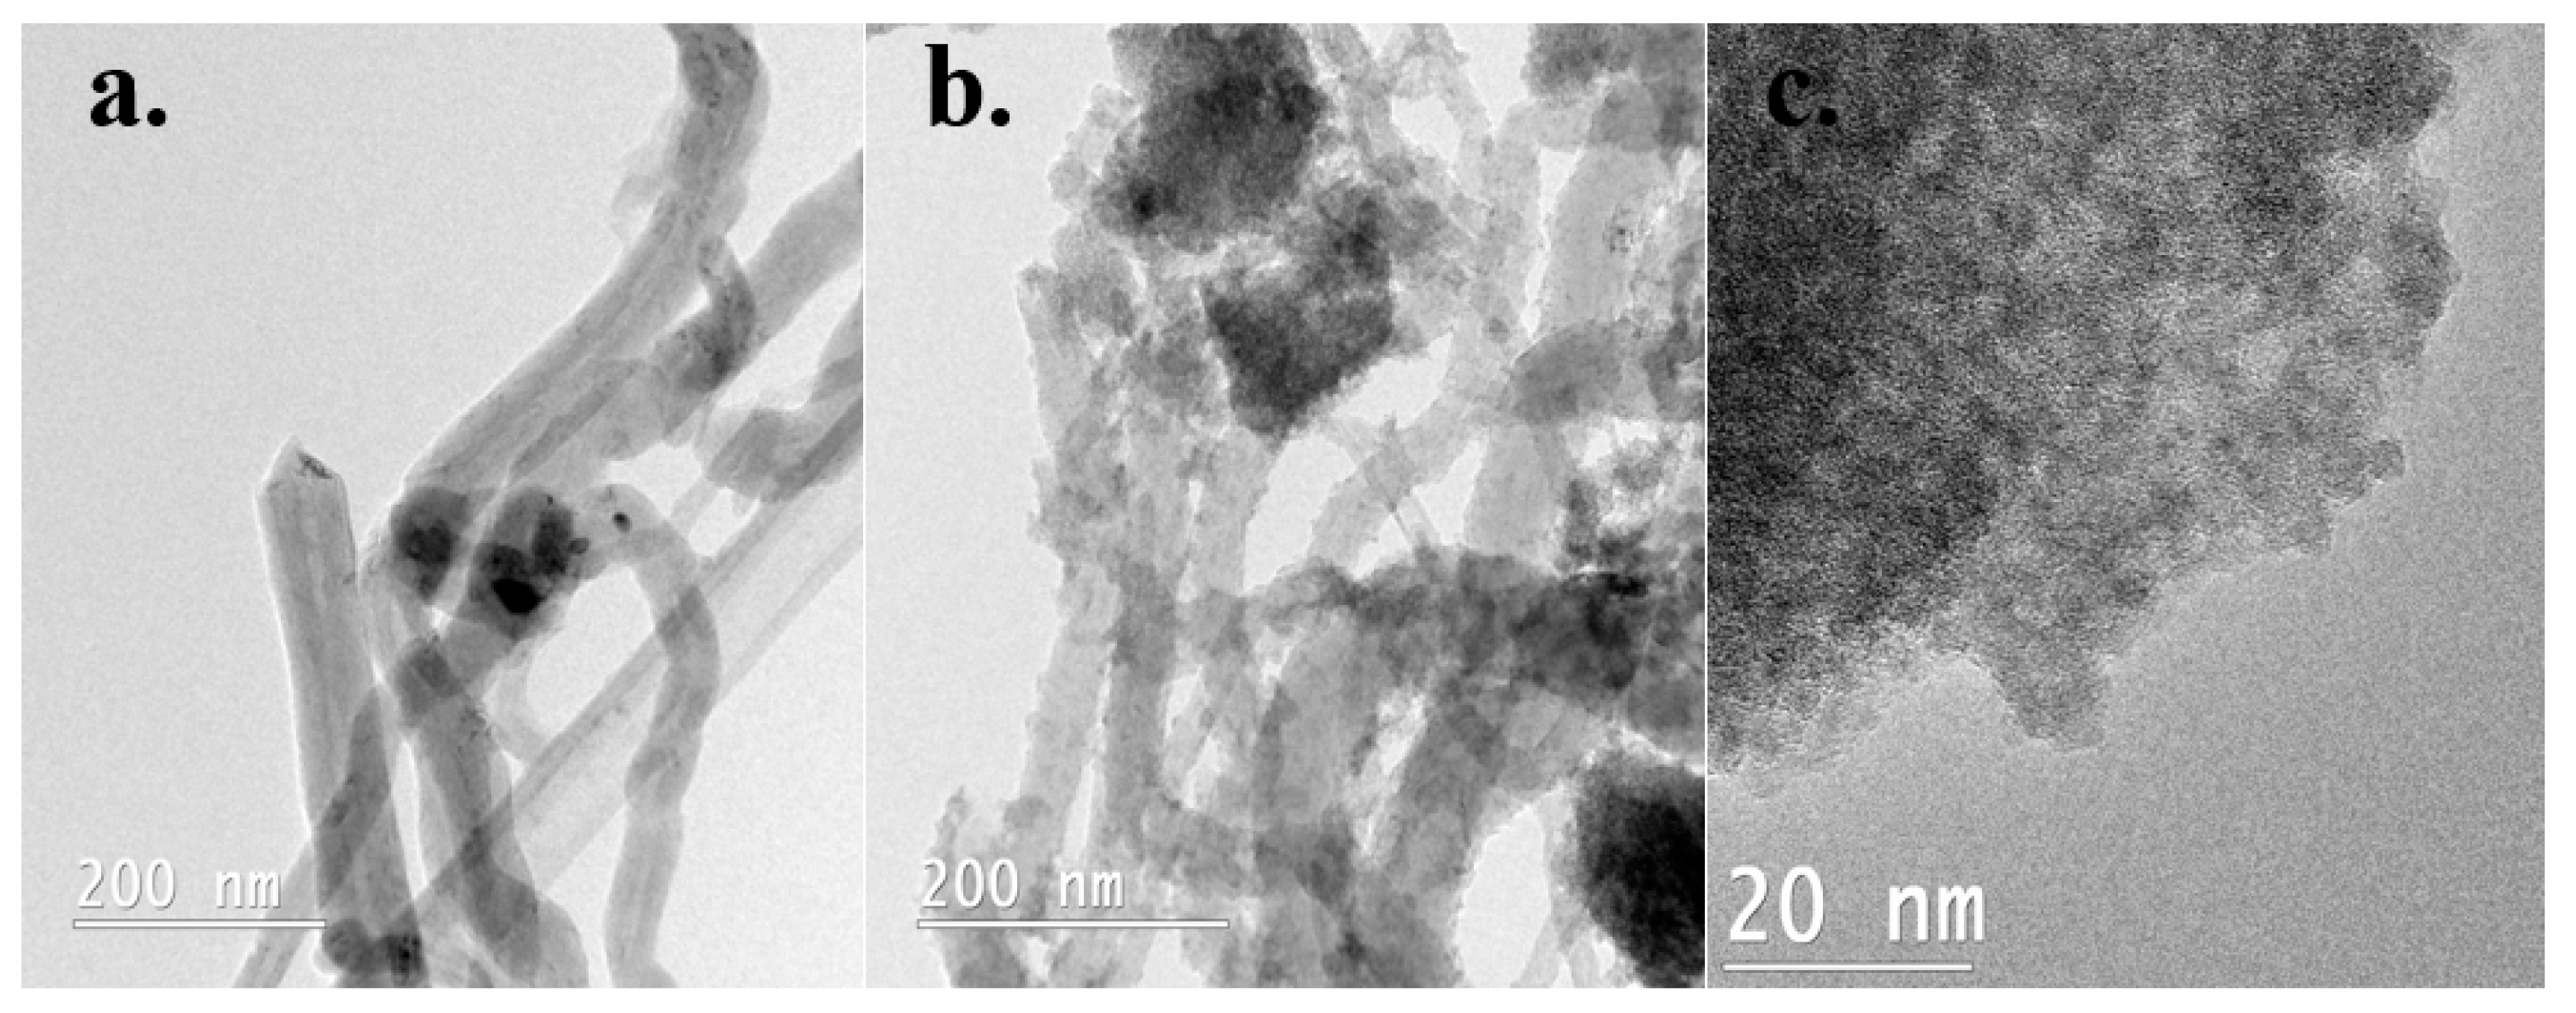
Figure 2a shows the morphology of acid-treated MWCNT, which consisted of regular tubular structures of outer diameter in the range of 30–50 nm and length reported by the manufacturer to be 5–15 µm. Figure 2c reveals the morphology of synthesized FHY particles, i.e., composite sample 100/0. FHY particles were nanocrystalline with a particle size estimated roughly at 3 nm, similar to two-line FHY reported in earlier studies [40,41,42]. The 50 FHY/50 MWCNT samples (Figure 2b) consisted of MWCNT covered with an agglomerated layer of FHY particles coating the surface of the tubes. While most of the tubes surface appears to be covered by FHY, some regions had higher density of FHY deposition as evident from the higher contrast regions. This morphology confirmed the presence of a two-phase solid made of FHY and MWCNT. Based on the distribution of FHY on the MWCNT seen in Figure 2b, we conclude that there is a strong bonding between these two materials in the composite materials since the FHY remained intact on the MWCNT despite the extensive sonication administered prior to TEM analysis. During the HNO3 refluxing step, the surface of MWCNT was functionalized with carboxylic groups with pKa values of 1.8–2.4 [43]. At the pH values of 6–7.0, reached during the synthesis and subsequent washing, we expect the carboxylic groups to fully deprotonate and the MWCNT to carry an overall negative charge. The point of zero charge (pHpzc) of FHY is reported between 7.5 and 8.2 [44,45,46], and thus in our experiment, the synthesized FHY nanoparticles carry a positive charge. We postulate that ionic bonds between the carboxyl groups on the MWCNT and the hydroxyl groups on FHY underlie the attachment of FHY and MWCNT in the hybrid composites.
3.3. Surface Area (BET) and Specific Capacitance (CV) Analysis of the FHY/MWCNT Composites
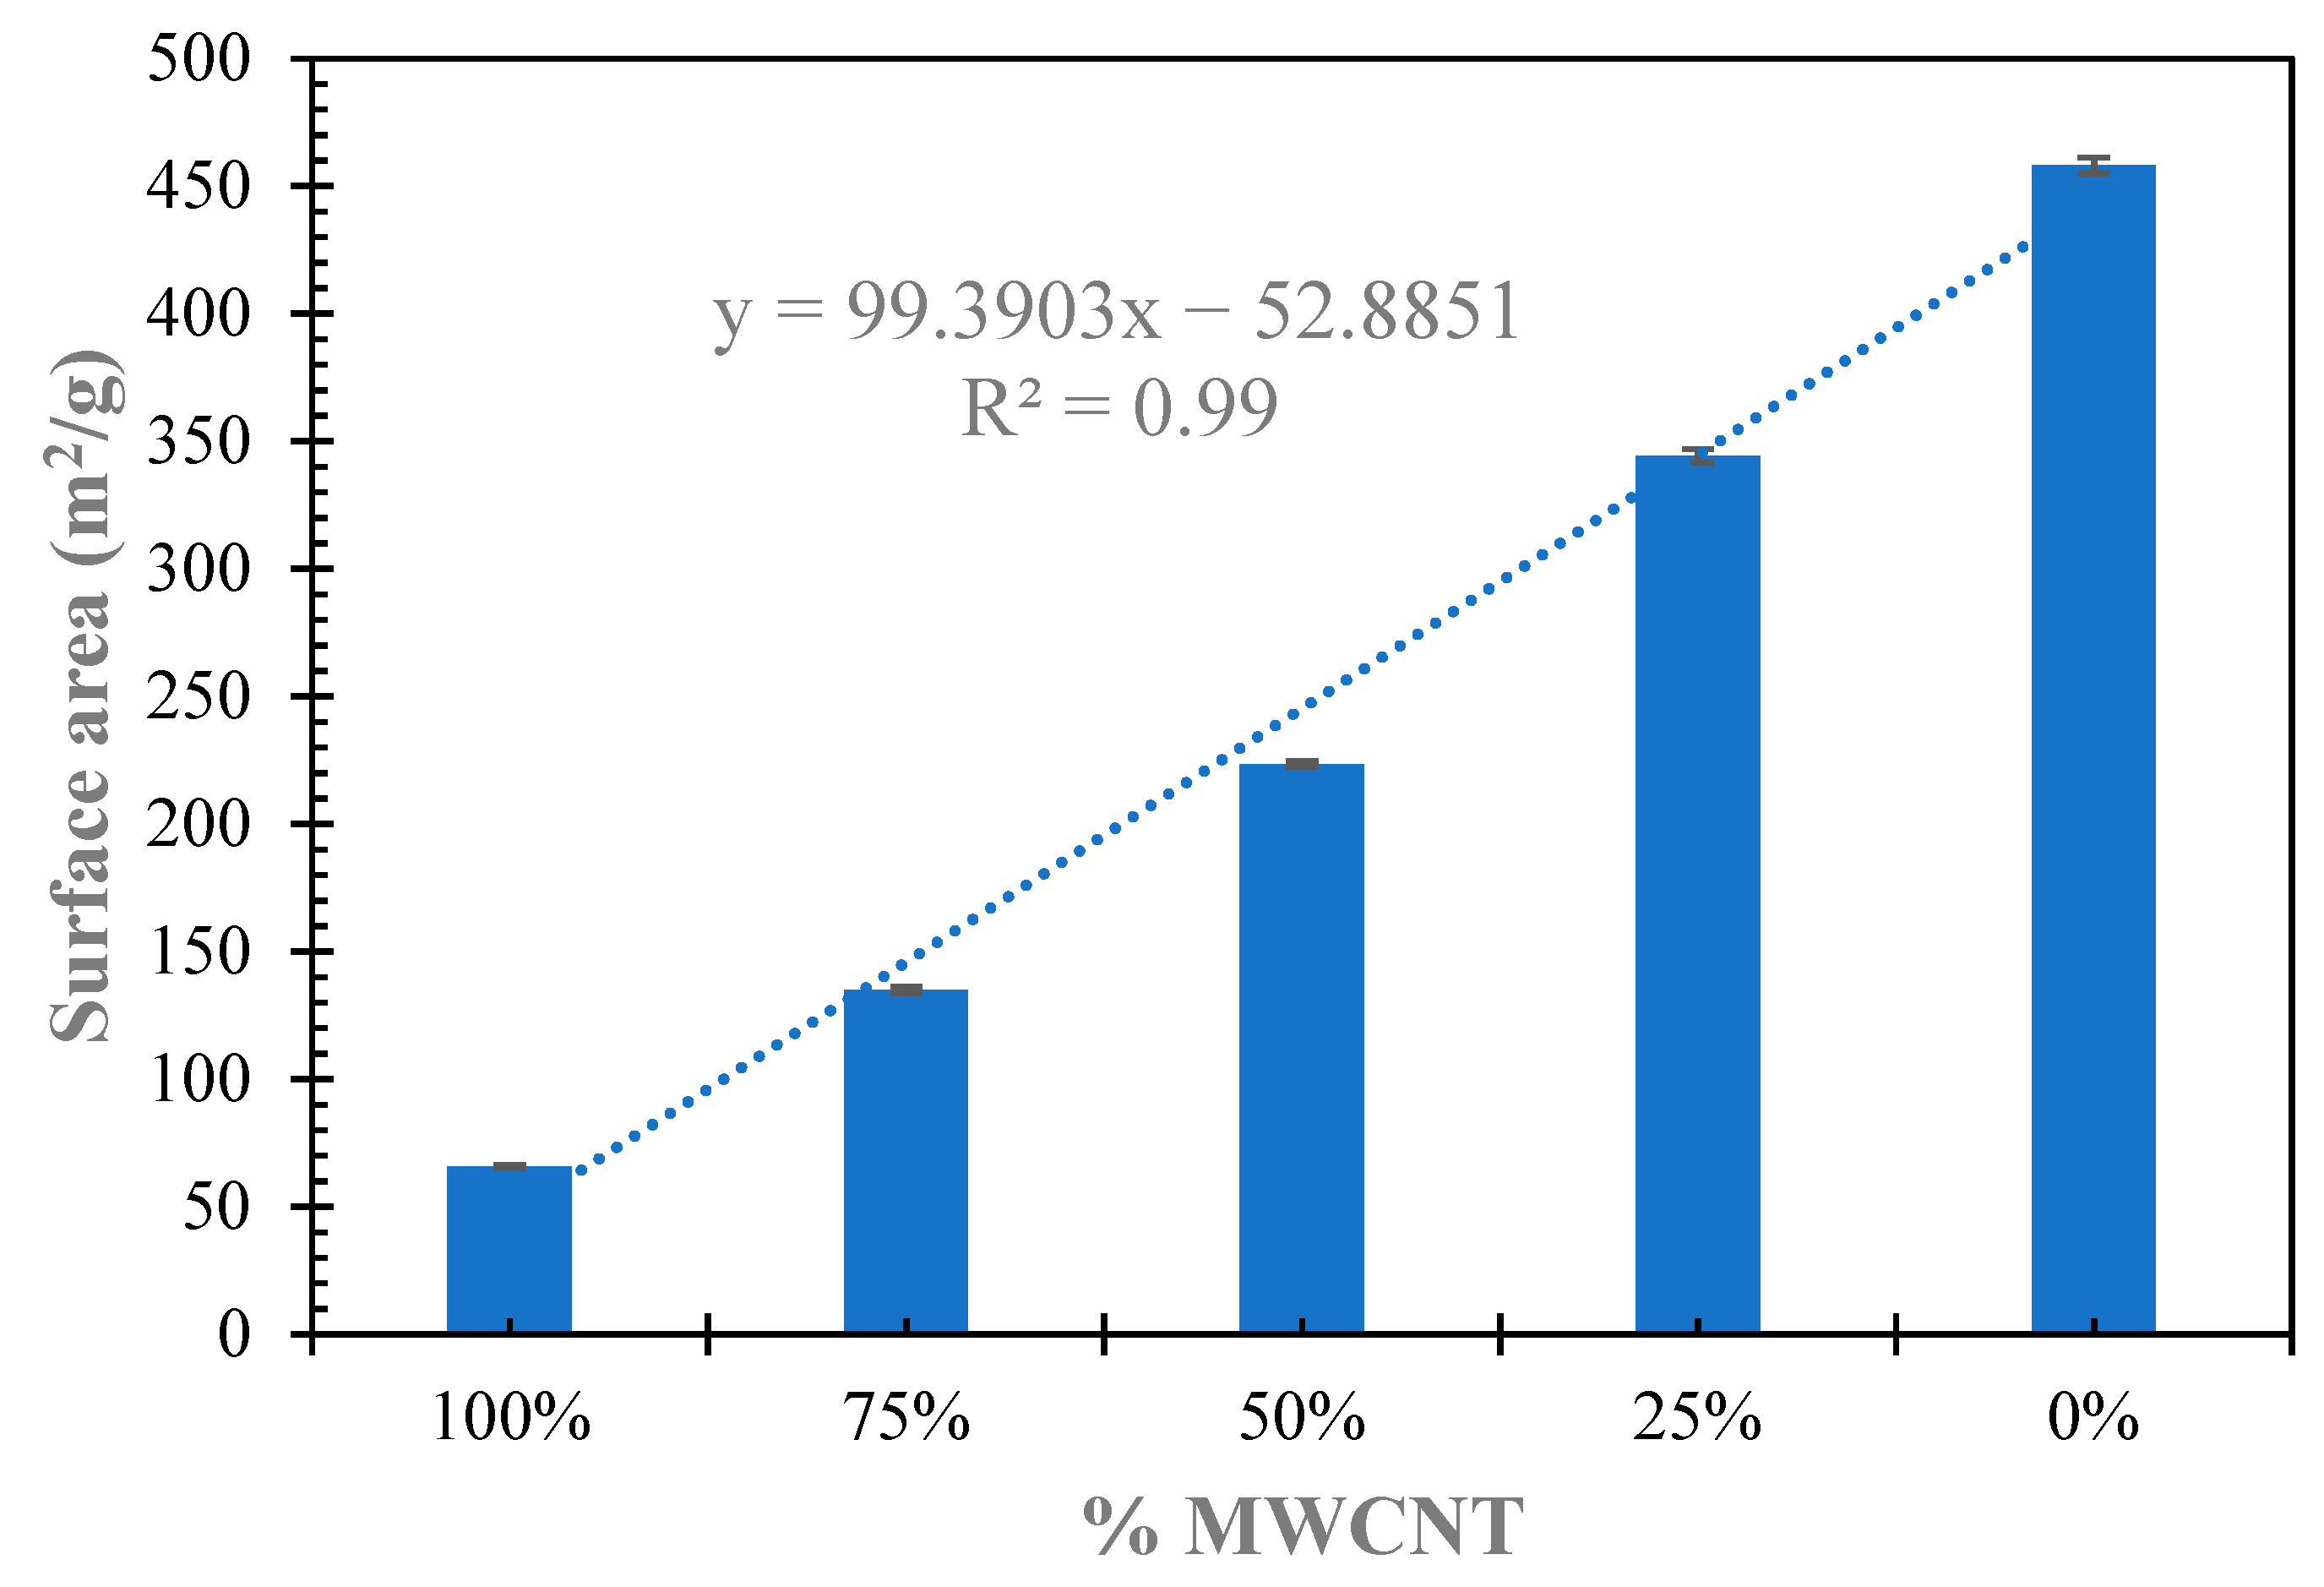
Figure 3 shows a strong correlation between the measured SSA and the % FHY in the composite material (R2 = 0.99). The SSA increased with increasing % FHY in the composite samples. Since FHY had the highest SSA of 458.02 m2·g−1, which was almost 7 times higher than that measured for MWCNT (65.76 m2·g−1), the observed trend supports the viability of incorporating FHY with MWCNT to increase SSA. On average, the surface area would increase by approximately 5.97% with every percent increase in % FHY in the composite ratio. Additionally, the SSA value obtained for untreated MWCNT (54.23 m2·g−1) was 1.2 times lower than that of acid-treated MWCNT, which indicated that refluxing MWCNT with HNO3 can also be used to increase the surface area of MWCNT material.
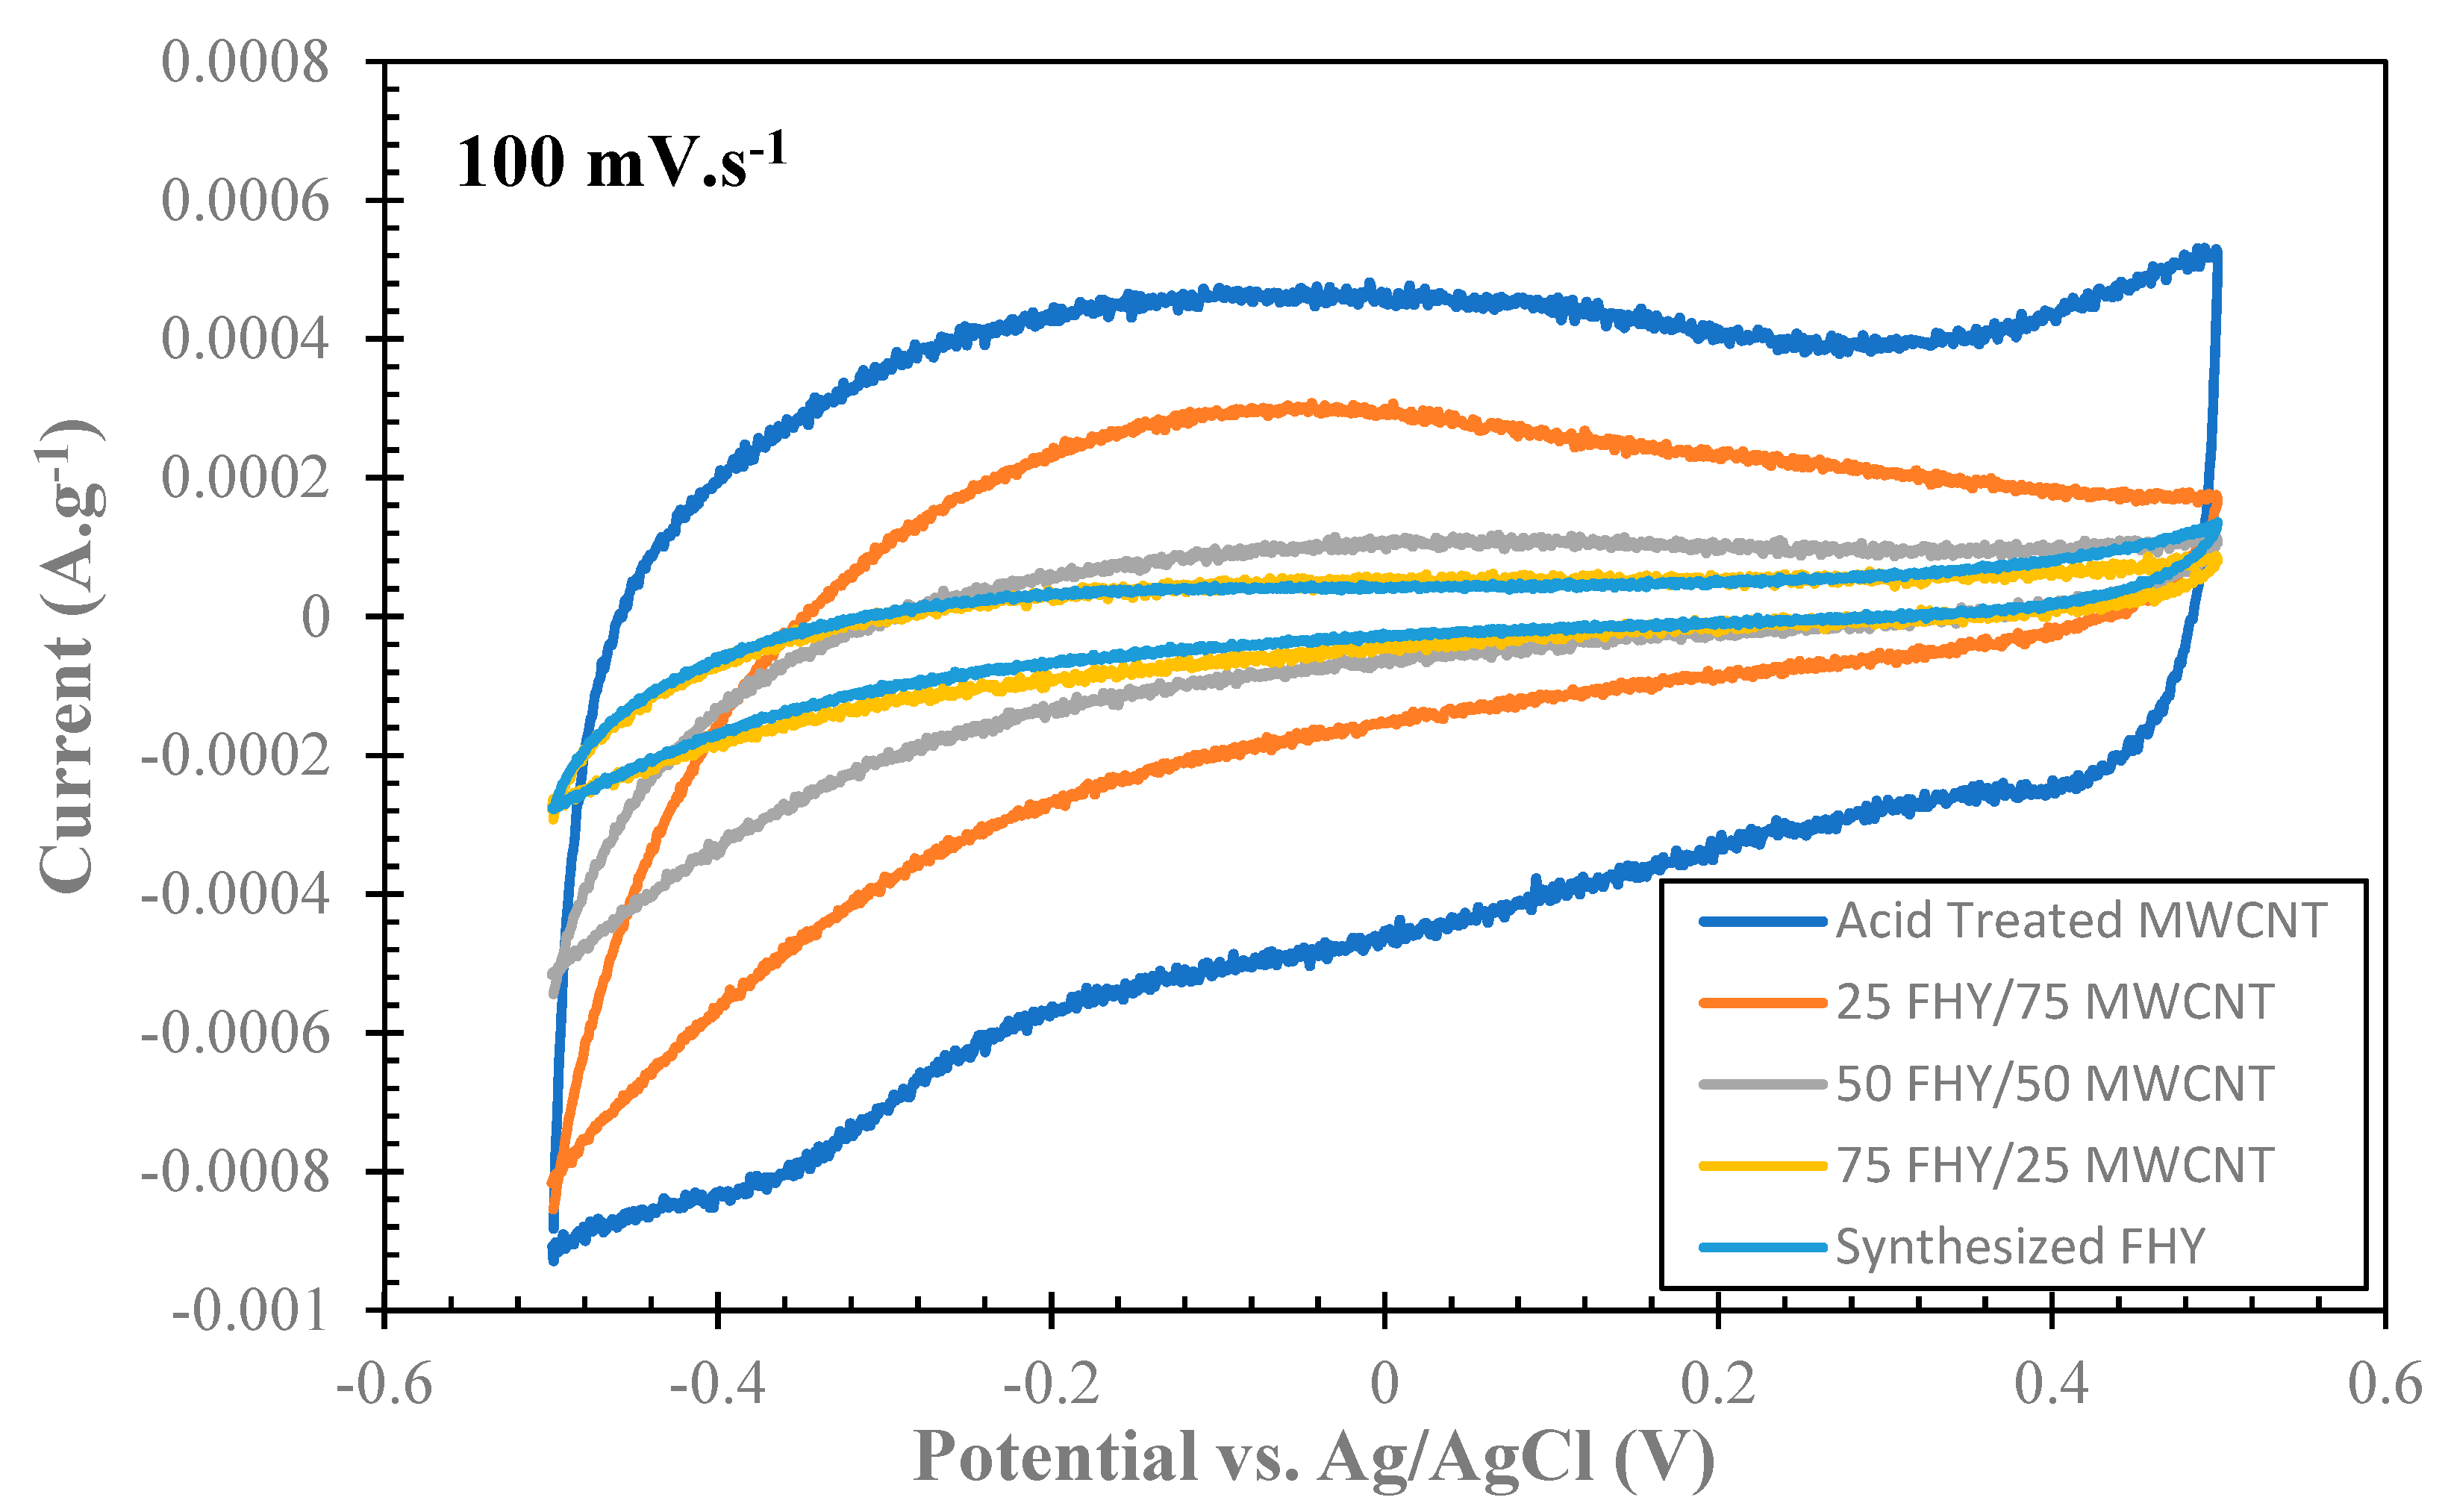
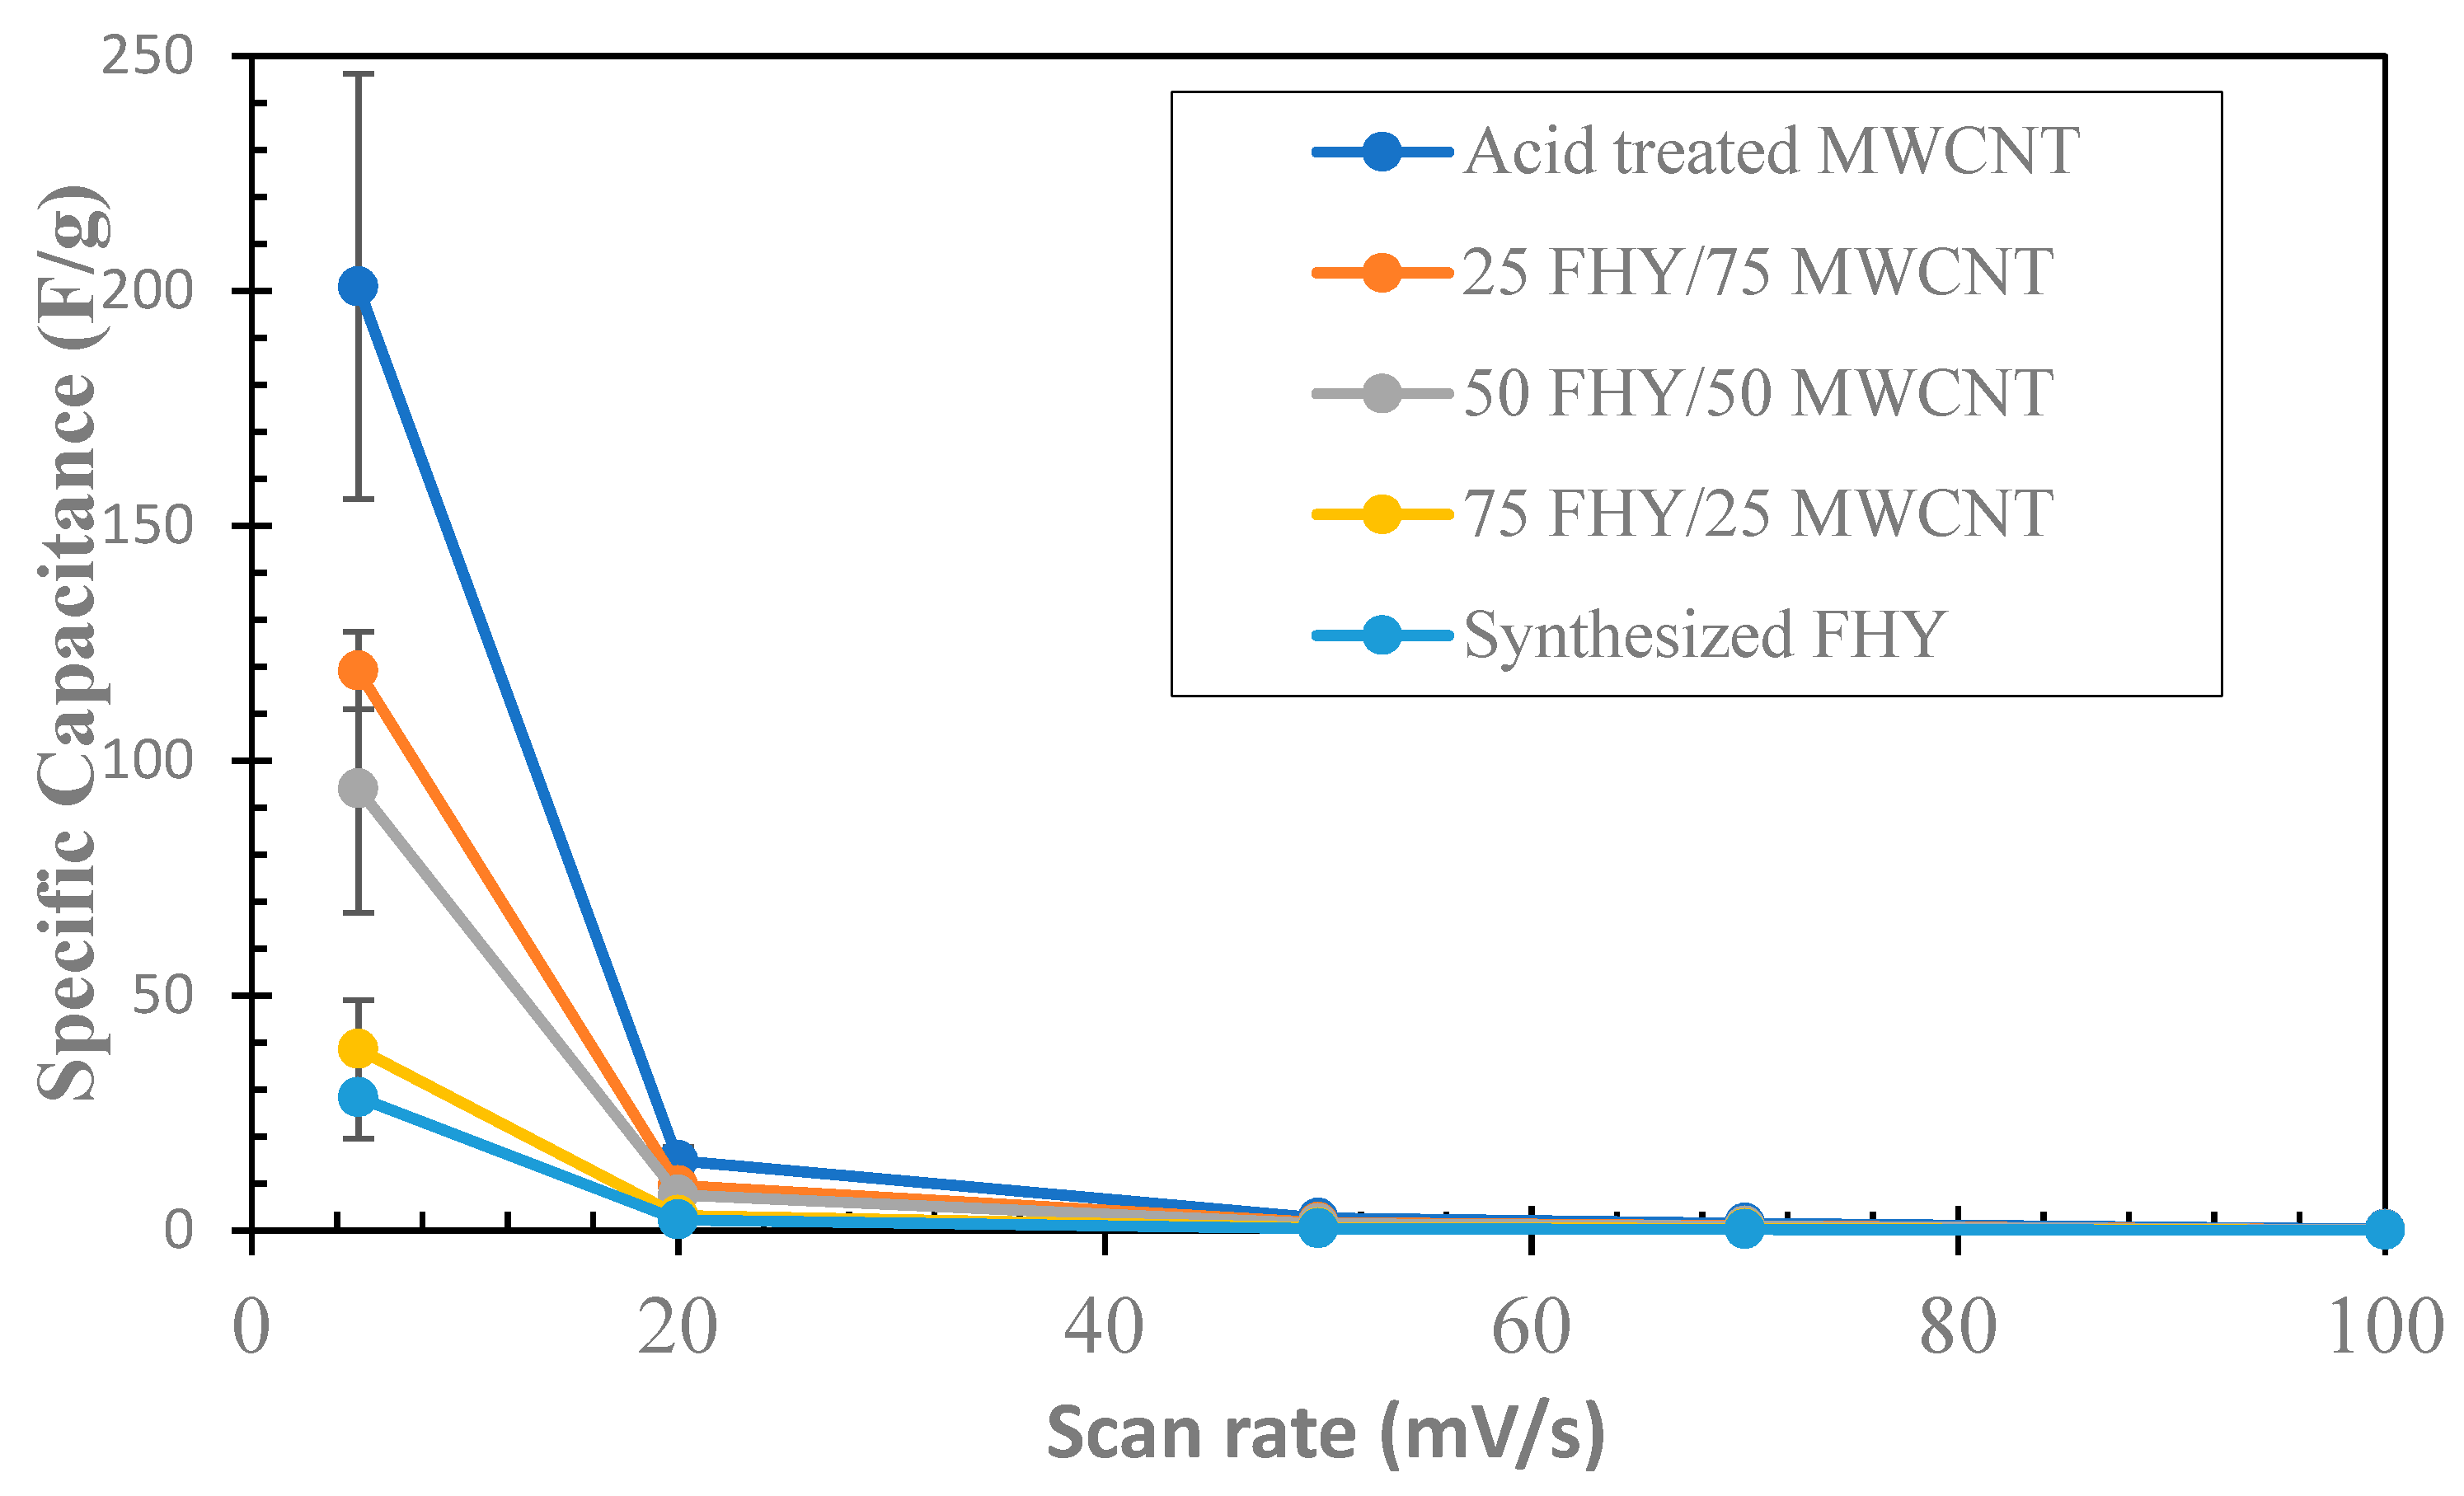
Figure 4 shows the CV plots of all samples ran at a scan rate of 100 mV·s−1. The current density increased with increasing % MWCNT in all composite samples, indicating more electrolyte ions in the electrical double layer at the surface of the composite electrode with higher % MWCNT [35,37]. Moreover, the CV plot of the MWCNT had a near rectangular shape indicating the characteristic of an effective capacitor [35,37]. The plots for the hybrid composite materials deviated further from the ideal rectangle shape with increases in % FHY suggesting a lower electrochemical performance in these samples. The negative impact of increasing % FHY on the electrochemical performance is also observed at all other scan rates tested (Figure 5).
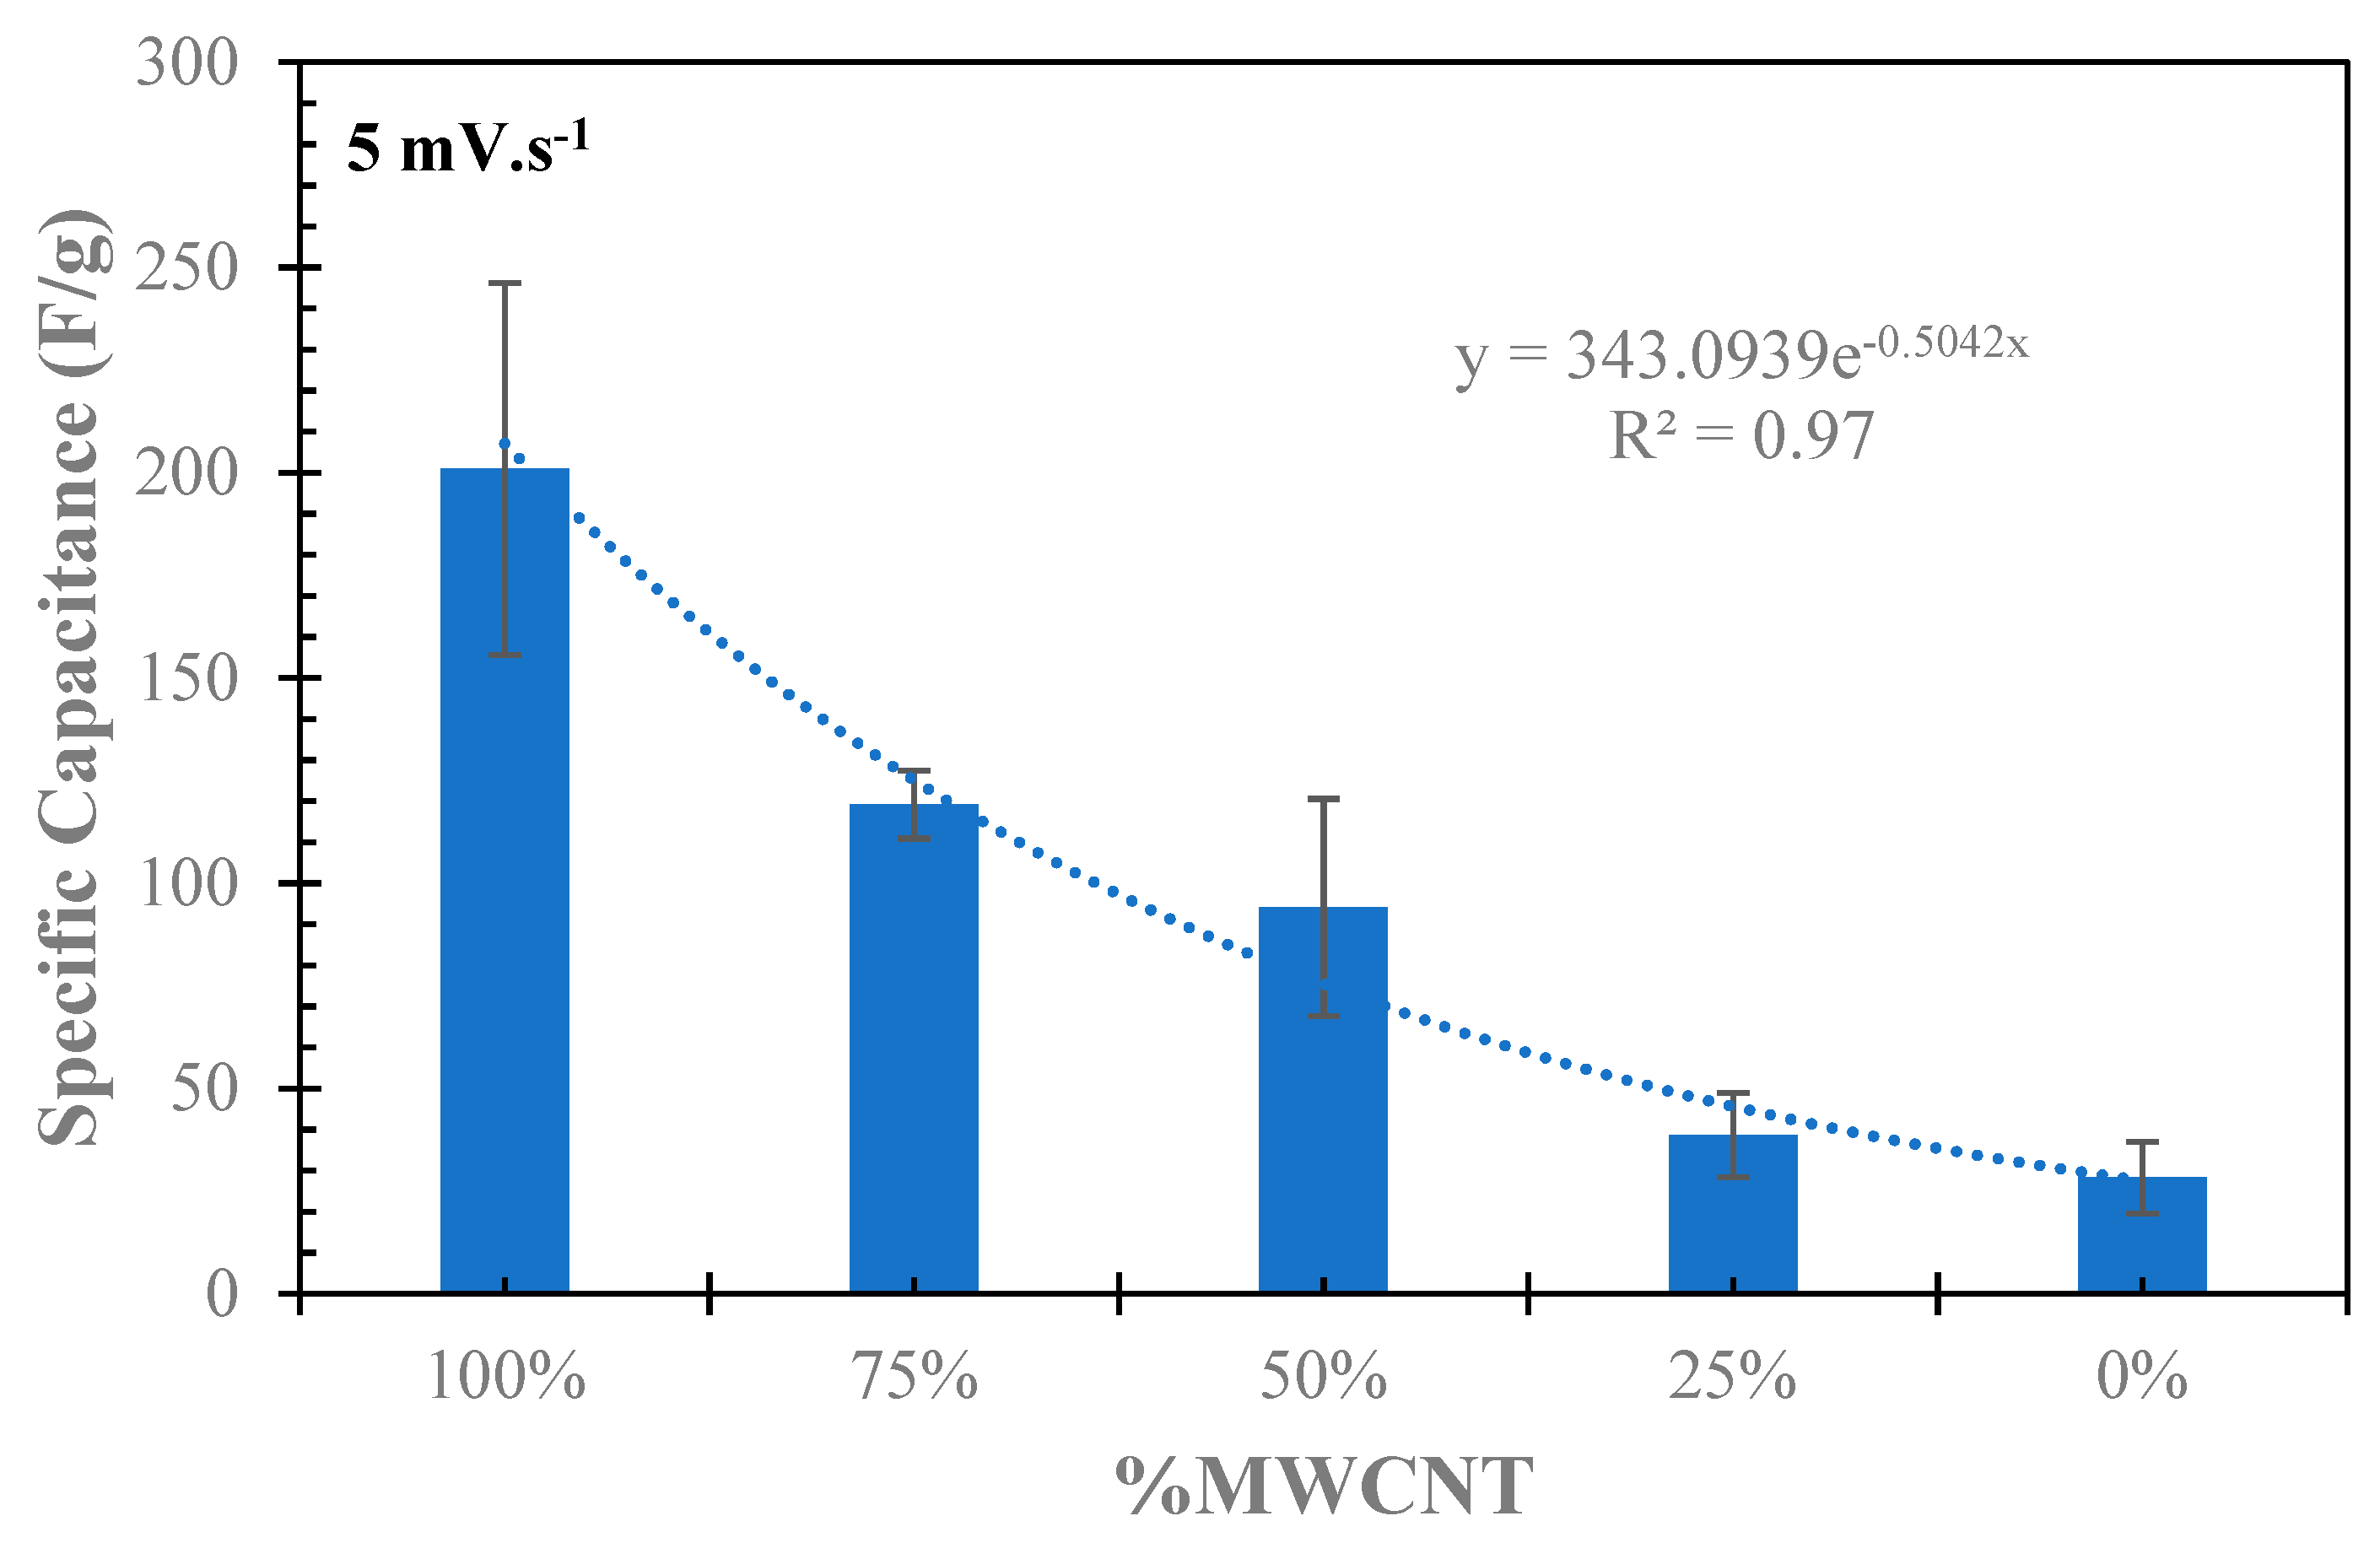
Figure 6 shows the highest observed specific capacitance of these samples at 5 mV·s−1 for easier comparison. It is noteworthy to mention that the precision of 50 FHY/50 MWCNT may have been compromised by the loss of one sample in the three replications during the analysis. Instead of excluding the sample, we chose to include it to highlight the trend in the analysis. Obtaining CV data for these hybrid composites proved extremely challenging due to the difficulties in achieving evenly coated electrodes with no factures despite the use of a delayed-evaporation chamber. This challenge highlights the need to further improve the electrochemical characterization methods as this or other composite materials are synthesized and primed for future applications. As expected, the samples with higher % MWCNT exhibit higher specific capacitance indicating better electrochemical characteristics. At 5 mV·s−1, the calculated specific capacitance of MWCNT was 200.91 F·g−1, almost 7.1 times higher than that of the FHY alone (28.35 F·g−1). Furthermore, the effect of increasing MWCNT content on specific capacitance of the composite was close to exponential growth, with R2 = 0.97. On average, the specific capacitance would increase 2.75% for every increased percent of MWCNT in the composite ratio.
3.4. Optimal FHY/MWCNT Composite Ratio Prediction
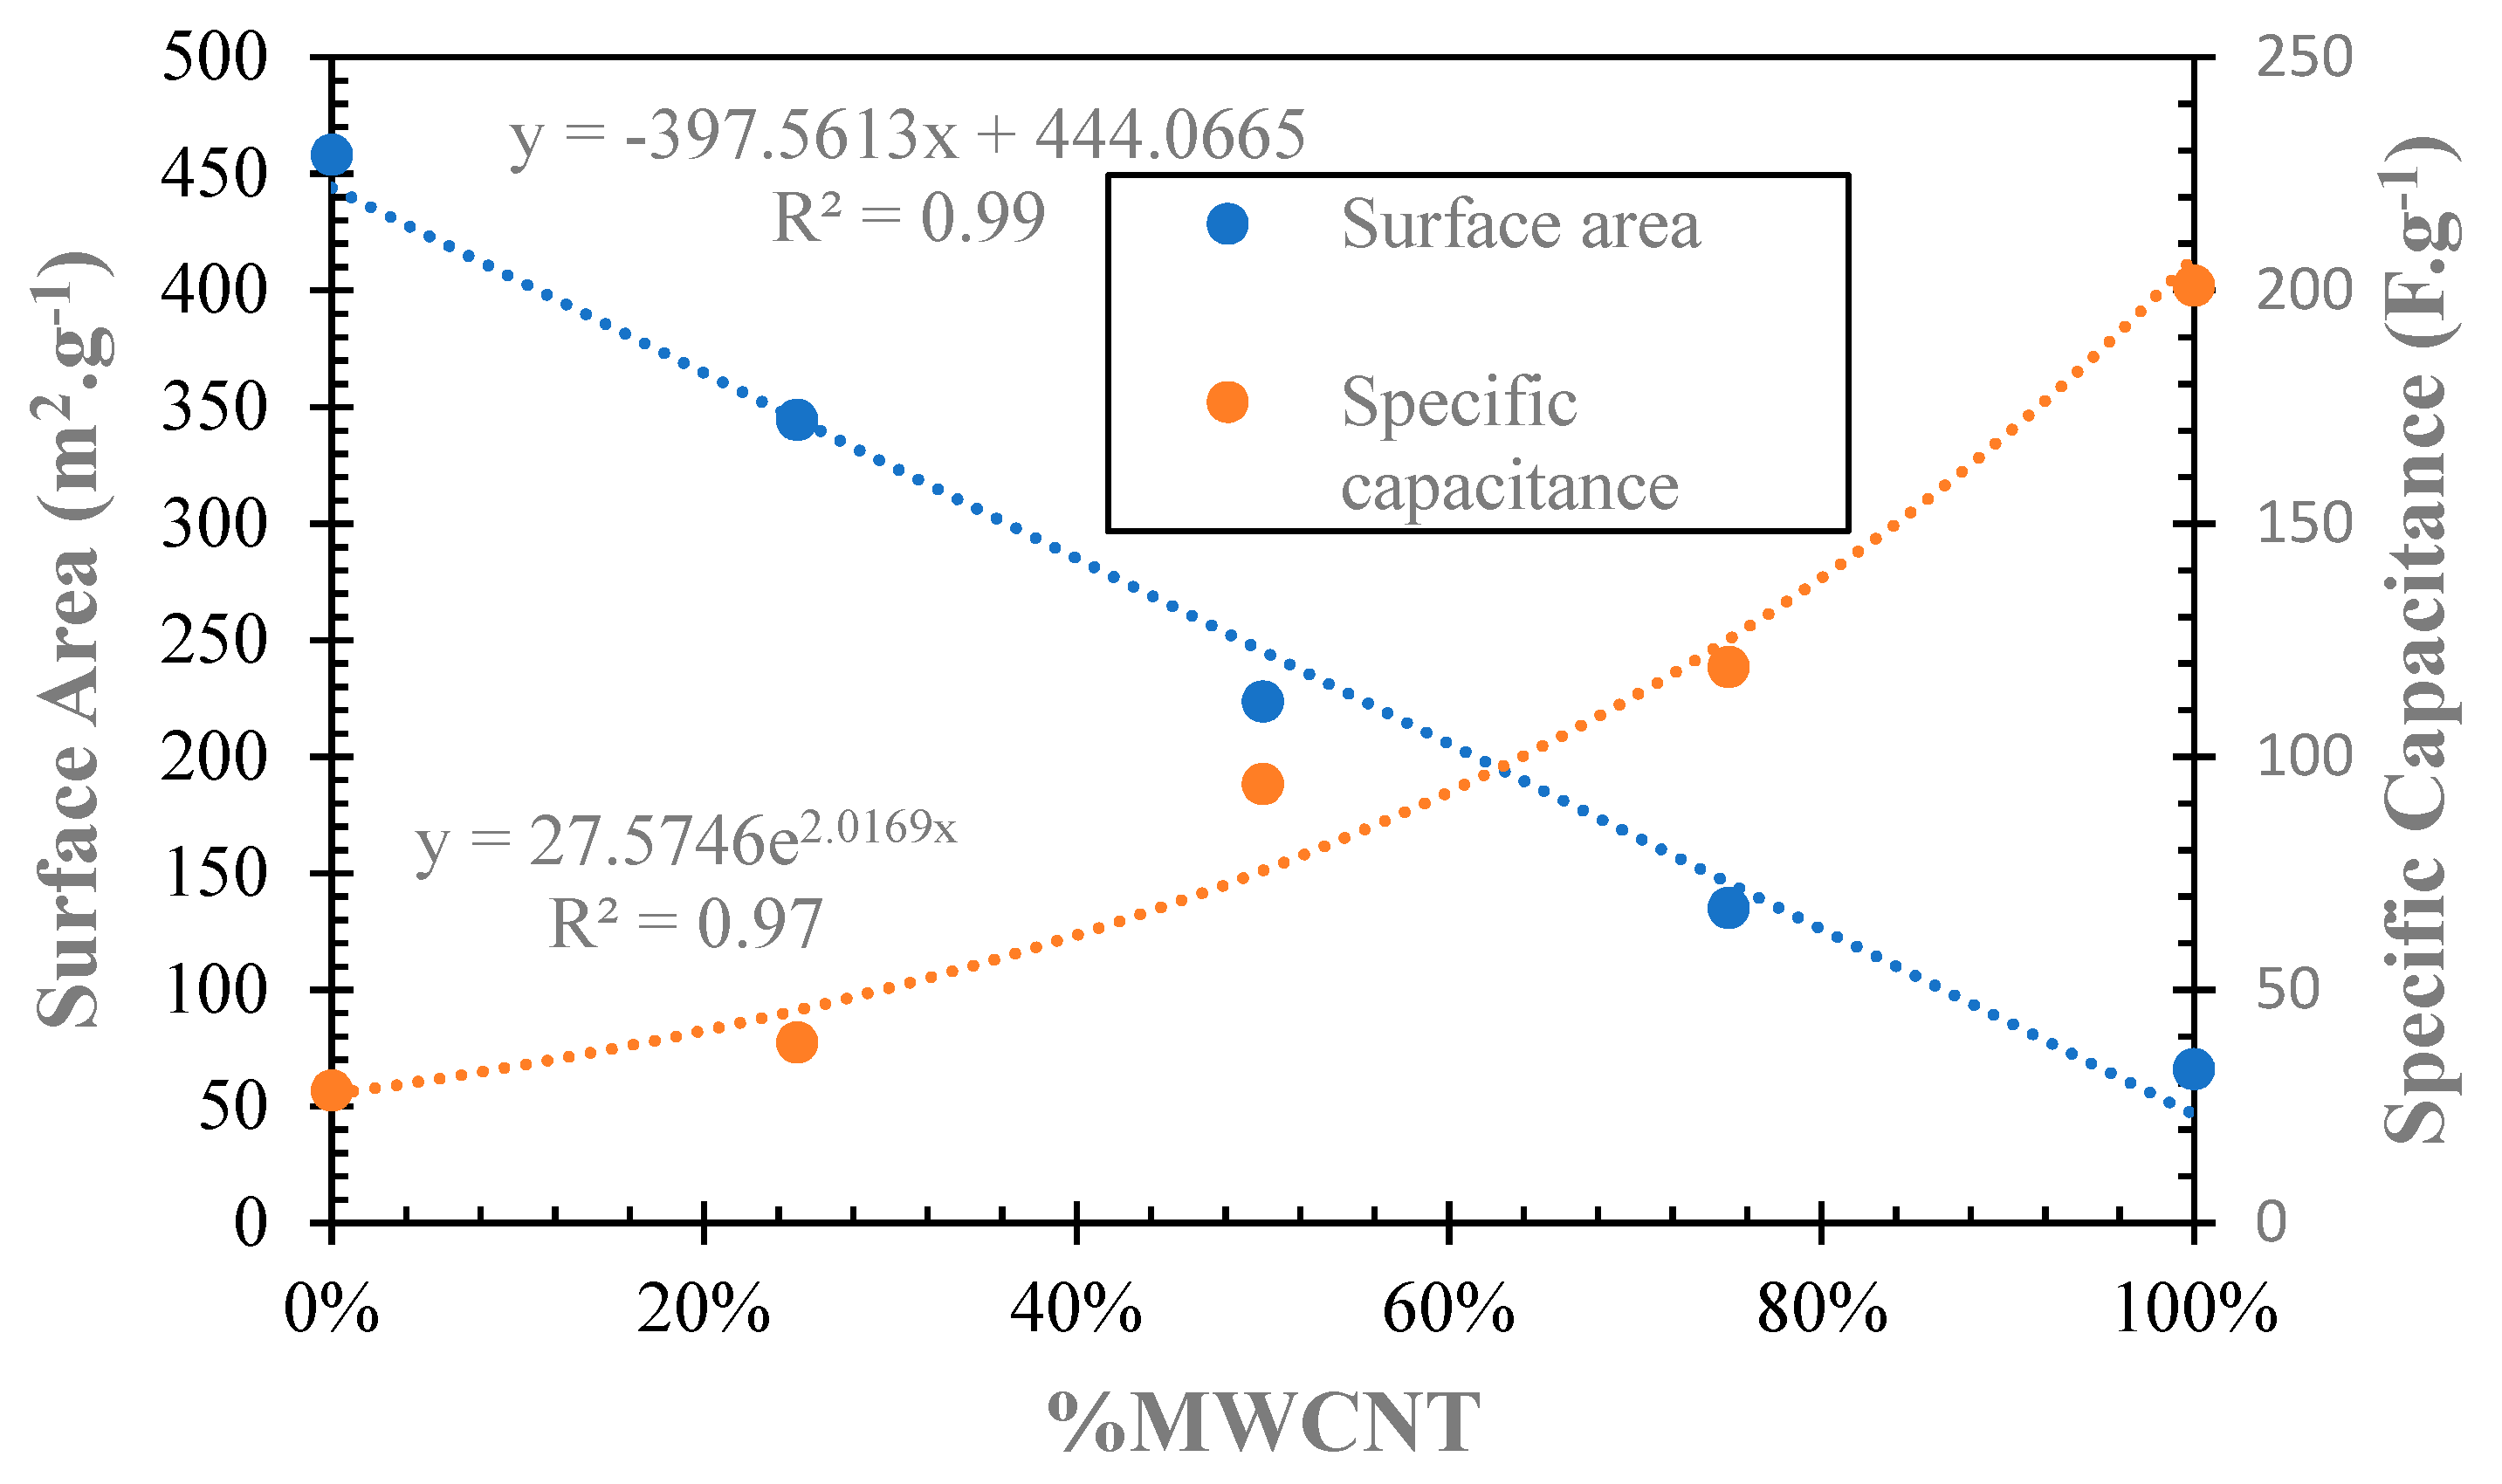
Taken cumulatively, our results indicate that both MWCNT and FHY impart desirable and undesirable properties on the composite materials. MWCNT enhance the specific capacitance but reduce the specific surface area, while the opposite effects are true for FHY. Therefore, to determine the optimum ratio for a composite material with the highest SSA and specific capacitance, we plotted SSA and specific capacitance simultaneously in search of the intersection point, which represent the optimal composition (Figure 7).
The relationship between SSA and specific capacitance with % MWCNT in the composite materials could be explained by the nature of the properties measured in the composite samples. BET N2 adsorption responds to changes in the surface of the composite materials. Therefore, if the materials are synthesized carefully and the target ratio of FHY to MWCNT in the composite is achieved, as it is in our study, the measured SSA will increase proportionally and linearly with the mass of FHY. In contrast, the pathways of ion movement during electrochemical measurements are potentially more complicated. These pathways determine the current density, and hence directly affect the calculated specific capacitance of the materials. As mentioned, based on TEM data, FHY coated most of the of MWCNT surface in the composite samples, but tended to be aggregated together in samples with higher % FHY. These FHY aggregates could have prevented the transport of solvent ions and reduced the observed specific capacitance of those materials.
The intersection between the two curves occurred at about 36% FHY and 64% MWCNT. This optimal composite ratio yields a calculated surface area of 190 m2·g−1 and estimated specific capacitance of 100 F·g−1 at 5 mV·s−1. In comparison, the SSA of this composite was 2.9 times higher than that of MWCNT alone and about 3.5 times higher in specific capacitance at 5 mV·s−1 than pure FHY.
4. Conclusions, Technical Implication, and Future Directions
The main goal of this study was developing a synthesis procedure to create a novel hybrid material that could address deficiencies of traditional MWCNT’s SSA when compared to conventional carbon nanomaterials. Our results demonstrate that the SSA of MWCNT could be increased by doping it with FHY. Yet, to preserve a desirable electrochemical reactivity, we estimate an optimal composite ratio of 36% FHY and 64% MWCNT. This ratio will yield a hybrid material whose SSA is 2.9 times higher and specific capacitance 2.0 times lower than those of MWCNT alone.
It is noteworthy to mention again that this new material displayed unique physicochemical properties (density and dispersibility) that could not be analyzed by traditional characterization methods especially for electrochemical (CV) analysis. Based on available resources and knowledge, the authors had tried their best to analyze the electrochemical aspects of this material. We believe future studies should be developed to perform more complex electrochemical analysis for this material and reveal more insights about this promising nanomaterial. For example, future studies could be directed at obtaining an even coating/adsorption of FHY onto MWCNT surfaces to improve on the specific capacitance and analysis of the hybrid material.
Moreover, this study stopped at synthesis and present convenient yet comprehensive and wholistic characterization of the FHY/MWCNT composite. Hence, future real application studies should be developed further to emphasize the novelty of this material. In fact, our team is developing different sorption studies of this nanomaterial with various environmental contaminants as our next steps. We also are going to investigate the biofouling merits of this material for environmental applications Additionally, the newly synthesized material will also have direct uses in applications that already utilize CNT and other metal oxides, such as capacitive deionization technologies as applied to water treatment.
Author Contributions
Conceptualization, T.T. and D.M.D.; methodology, T.T and D.M.D.; software, T.T.; validation, T.T., D.M.D., and N.K.; formal analysis, T.T.; investigation, T.T.; resources, D.M.D. and N.K.; data curation, T.T.; writing—original draft preparation, T.T.; writing—review and editing, T.T., D.M.D., and N.K.; visualization, T.T.; supervision, D.M.D. and N.K.; project administration, T.T. and D.M.D.; funding acquisition, D.M.D. and N.K. All authors have read and agreed to the published version of the manuscript.
Funding
This research was funded by the NSF grant 1029020 and the American Chemical Society Petroleum Research Fund Grant 50759UR2.
Institutional Review Board Statement
Not applicable.
Informed Consent Statement
Not applicable.
Data Availability Statement
Data sharing not applicable. No new data were created or analyzed in this study. Data sharing is not applicable to this article.
Acknowledgments
The BET and TEM experiments were supported by the Virginia Tech National Center for Earth and Environmental Nanotechnology Infrastructure (NanoEarth), a member of the National Nanotechnology Coordinated Infrastructure (NNCI), supported by NSF (ECCS 1542100). Thanks also to Gangli Wang & Maksim Kvetny for their electrochemistry guidance and the GSU Department of Geosciences for student support.
Conflicts of Interest
The authors declare no conflict of interest. The funders had no role in the design of the study; in the collection, analyses, or interpretation of data; in the writing of the manuscript; or in the decision to publish the results.
References
- Iijima, S. Helical microtubules of graphitic carbon. Nature 1991, 354, 56–58. [Google Scholar] [CrossRef]
- Khan, I.; Saeed, K.; Khan, I. Nanoparticles: Properties, applications and toxicities. Arab. J. Chem. 2019, 12, 908–931. [Google Scholar] [CrossRef]
- Jeevanandam, J.; Barhoum, A.; Chan, Y.S.; Dufresne, A.; Danquah, M.K. Review on nanoparticles and nanostructured materials: History, sources, toxicity and regulations. Beilstein J. Nanotechnol. 2018, 9, 1050–1074. [Google Scholar] [CrossRef] [PubMed] [Green Version]
- Li, R.; Zhang, L.; Wang, P. Rational design of nanomaterials for water treatment. Nanoscale 2015, 7, 17167–17194. [Google Scholar] [CrossRef] [Green Version]
- Bethune, D.S.; Klang, C.H.; de Vries, M.S.; Gorman, G.; Savoy, R.; Vazquez, J.; Beyers, R. Cobalt-catalysed growth of carbon nanotubes with single-atomic-layer walls. Nature 1993, 363, 605–607. [Google Scholar] [CrossRef]
- Thostenson, E.T.; Ren, Z.; Chou, T.-W. Advances in the science and technology of carbon nanotubes and their composites: A review. Compos. Sci. Technol. 2001, 61, 1899–1912. [Google Scholar] [CrossRef] [Green Version]
- Pan, H.; Li, J.; Feng, Y.P. Carbon nanotubes for supercapacitor. Nanoscale Res. Lett. 2010, 5, 654–668. [Google Scholar] [CrossRef] [Green Version]
- Das, R.; Ali, M.E.; Hamid, S.B.A.; Ramakrishna, S.; Chowdhury, Z.Z. Carbon nanotube membranes for water purification: A bright future in water desalination. Desalination 2014, 336, 97–109. [Google Scholar] [CrossRef]
- Gupta, V.K.; Ali, I.; Saleh, T.A.; Nayak, A.; Agarwal, S. Chemical treatment technologies for waste-water recycling—An overview. RSC Adv. 2012, 2, 6380–6388. [Google Scholar] [CrossRef]
- Fornasiero, F.; Park, H.G.; Holt, J.K.; Stadermann, M.; Grigoropoulos, C.P.; Noy, A.; Bakajin, O. Ion exclusion by sub-2nm carbon nanotube membranes. Mater. Res. Soc. Symp. Proc. 2008, 105, 17250–17255. [Google Scholar] [CrossRef] [Green Version]
- Peigney, A.; Laurent, C.; Flahaut, E.; Bacsa, R.R.; Rousset, A. Specific surface area of carbon nanotubes and bundles of carbon nanotubes. Carbon 2001, 39, 507–514. [Google Scholar] [CrossRef] [Green Version]
- Bergna, D.; Varila, T.; Romar, H.; Lassi, U. Comparison of the Properties of Activated Carbons Produced in One-Stage and Two-Stage Processes. J. Carbon Res. 2018, 4, 41. [Google Scholar] [CrossRef] [Green Version]
- Peng, Z.; Zhang, D.; Shi, L.; Yan, T. High performance ordered mesoporous carbon/carbon nanotube composite electrodes for capacitive deionization. J. Mater. Chem. 2012, 22, 6603–6612. [Google Scholar] [CrossRef]
- Zhang, D.; Shi, L.; Fang, J.; Dai, K. Removal of NaCl from saltwater solution using carbon nanotubes/activated carbon composite electrode. Mater. Lett. 2006, 60, 360–363. [Google Scholar] [CrossRef]
- Wang, X.Z.; Li, M.G.; Chen, Y.W.; Cheng, R.M.; Huang, S.M.; Pan, L.K.; Sun, Z.; Wang, X.Z.; Li, M.G.; Chen, Y.W.; et al. Electrosorption of ions from aqueous solutions with carbon nanotubes and nanofibers composite film electrodes Electrosorption of ions from aqueous solutions with carbon nanotubes and nanofibers composite film electrodes. Appl. Phys. Lett. 2006, 89, E23–E26. [Google Scholar] [CrossRef]
- Alsawat, M.; Altalhi, T.; Santos, A.; Losic, D. Carbon Nanotubes—Nanoporous Anodic Alumina Composite Membranes: Influence of Template on Structural, Chemical, and Transport Properties. J. Phys. Chem. C. 2017, 121, 13634–13644. [Google Scholar] [CrossRef]
- Poinern, G.; Parsonage, D.; Issa, T.B.; Ghosh, M.K.; Paling, E.; Singh, P. Preparation, characterization and As (V) adsorption behaviour of CNT-ferrihydrite composites. Int. J. Eng. Sci. Technol. 2010, 2, 13–24. [Google Scholar] [CrossRef] [Green Version]
- Peng, X.; Luan, Z. Carbon nanotubes-iron oxides magnetic composites as adsorbent for removal of Pb (II) and Cu (II) from water. Carbon 2005, 43, 855–894. [Google Scholar] [CrossRef]
- Hiemstra, T.; van Riemsdijk, W.H. A surface structural model for ferrihydrite I: Sites related to primary charge, molar mass, and mass density. Geochim. Cosmochim. Acta 2009, 73, 4423–4436. [Google Scholar] [CrossRef]
- Jia, Y.; Demopoulos, G.P. Adsorption of Arsenate onto Ferrihydrite from Aqueous Solution: Influence of Media (Sulfate vs Nitrate), Added Gypsum, and pH Alteration. Environ. Sci. Technol. 2005, 39, 9523–9527. [Google Scholar] [CrossRef]
- Raven, K.P.; Jain, A.; Loeppert, R.H. Arsenite and Arsenate Adsorption on Ferrihydrite: Kinetics, Equilibrium, and Adsorption Envelopes. Environ. Sci. Technol. 1998, 32, 344–349. [Google Scholar] [CrossRef]
- U.S. Environmental Protection Agency. Standard Operating Procedure for Determination of Lead in TSP by Inductively Coupled Plasma Mass Spectrometry (ICP-MS) with Hot Block Dilute Acid and Hydrogen Peroxide Filter Extraction; U.S. Environmental Protection Agency: Washington, DC, USA, 2010.
- Liao, Q.; Sun, J.; Gao, L. Adsorption of chlorophenols by multi-walled carbon nanotubes treated with HNO3 and NH3. Carbon 2008, 46, 553–555. [Google Scholar] [CrossRef]
- Le, V.T.; Ngo, C.L.; Le, Q.T.; Ngo, T.T. Surface modification and functionalization of carbon nanotube with some organic compounds. Adv. Nat. Sci. Nanosci. Nanotechnol. 2013, 3, 035017. [Google Scholar] [CrossRef]
- Zhang, D.; Shi, L.; Fang, J.; Li, X.; Dai, K. Preparation and modification of carbon nanotubes. Mater. Lett. 2005, 59, 4044–4047. [Google Scholar] [CrossRef]
- Schwertmann, U.; Cornell, R.M. Iron Oxides in the Laboratory: Preparation and Characterization, 2nd ed.; Wiley-VCH: Weinheim, Germany, 2007. [Google Scholar]
- Kamat, P.V.; Thomas, K.G.; Barazzouk, S.; Girishkumar, G.; Vinodgopal, K.; Meisel, D.; Uni, V.; Dame, N.; Uni, I.; Northwest, V. Self-Assembled Linear Bundles of Single Wall Carbon Nanotubes and Their Alignment and Deposition as a Film in a dc Field. J. Am. Chem. Soc. 2004, 126, 10757–10762. [Google Scholar] [CrossRef] [PubMed]
- Thomas, B.J.C.; Boccacciniw, R.A. Multi-Walled Carbon Nanotube Coatings Using Electrophoretic Deposition (EPD). J. Am. Ceram. Soc. 2005, 88, 980–982. [Google Scholar] [CrossRef]
- Karakaya, M.; Zhu, J.; Raghavendra, A.J. Roll-to-roll production of spray coated N-doped carbon nanotube electrodes for supercapacitors. Appl. Phys. Lett. 2014, 105, 263103. [Google Scholar] [CrossRef]
- Sarkar, A.; Daniels-Race, T. Electrophoretic Deposition of Carbon Nanotubes on 3-Amino-Propyl-Triethoxysilane (APTES) Surface Functionalized Silicon Substrates. Nanomaterials 2013, 3, 272–288. [Google Scholar] [CrossRef] [Green Version]
- Wang, Q.; Moriyama, H. Carbon Nanotube-Based Thin Films: Synthesis and Properties; InTech: London, UK, 2011. [Google Scholar] [CrossRef] [Green Version]
- Fortier, G.; Vaillancourt, M.; Bélanger, D. Evaluation of nafion as media for glucose oxidase immobilization for the development of an amperometric glucose biosensor. Electroanalysis 1992, 4, 275–283. [Google Scholar] [CrossRef]
- Harrison, D.J.; Manz, A.; Fan, Z.; Widmer, H.M. Capillary Electrophoresis and Sample Injection Systems Integrated on a Planar Glass Chip. Anal. Chem. 1992, 64, 1926–1932. [Google Scholar] [CrossRef]
- Wang, J.; Musameh, M.; Lin, Y. Solubilization of Carbon Nanotubes by Nafion toward the Preparation of Amperometric Biosensors. J. Am. Chem. Soc. 2003, 125, 2408–2409. [Google Scholar] [CrossRef] [PubMed]
- Gudavalli, G.S.; Turner, J.N.; Dhakal, T.P. Chemical Vapor-Deposited Carbon Nanotubes as Electrode Material for Supercapacitor Applications. MRS Adv. 2017, 2, 3263–3269. [Google Scholar] [CrossRef]
- Frackowiak, E. Carbon materials for supercapacitor application. Phys. Chem. Chem. Phys. 2007, 9, 1774–1785. [Google Scholar] [CrossRef] [PubMed]
- Zhu, Y.Q.; Yi, H.T.; Chen, X.Y.; Xiao, Z.H. Temperature-Dependent Conversion of Magnesium Citrate into Nanoporous Carbon Materials for Superior Supercapacitor Application by a Multitemplate Carbonization Method. Ind. Eng. Chem. Res. 2015, 54, 4956–4964. [Google Scholar] [CrossRef]
- Atchudan, R.; Pandurangan, A.; Joo, J. Effects of Nanofillers on the Thermo-Mechanical Properties and Chemical Resistivity of Epoxy Nanocomposites. J. Nanosci. Nanotechnol. 2015, 15, 4255–4267. [Google Scholar] [CrossRef]
- Liu, J.; Yu, Y.; Zhu, S.; Yang, J.; Song, J.; Fan, W.; Yu, H.; Bian, D.; Huo, M. Synthesis and characterization of a magnetic adsorbent from negatively-valued iron mud for methylene blue adsorption. PLoS ONE 2018, 13, e0191229. [Google Scholar] [CrossRef] [Green Version]
- Rout, K.; Mohapatra, M.; Anand, S. 2-Line ferrihydrite: Synthesis, characterization and its adsorption behaviour for removal of Pb(ii), Cd(ii), Cu(ii) and Zn(ii) from aqueous solutions. Dalton Trans. 2012, 41, 3302. [Google Scholar] [CrossRef]
- Liu, G.; Debnath, S.; Paul, K.W.; Han, W.; Hausner, D.B.; Hosein, H.; Michel, F.M.; Parise, J.B.; Sparks, D.L.; Strongin, D.R.; et al. Characterization and Surface Reactivity of Ferrihydrite Nanoparticles Assembled in Ferritin. Langmuir 2006, 22, 9313–9321. [Google Scholar] [CrossRef]
- Mikutta, C.; Mikutta, R.; Bonneville, S.; Wagner, F.; Voegelin, A.; Christl, I.; Kretzschmar, R. Synthetic coprecipitates of exopolysaccharides and ferrihydrite. Part I: Characterization. Geochim. Cosmochim. Acta 2008, 72, 1111–1127. [Google Scholar] [CrossRef]
- Harris, D. Quantitative Chemical Analysis, 8th ed.; W.H. Freeman and Company: New York, NY, USA, 2010. [Google Scholar]
- Pereira, R.C.; Anizelli, P.R.; di Mauro, E.; Valezi, D.F.; da Costa, A.C.S.; Zaia, C.T.B.V.; Zaia, D.A.M. The effect of pH and ionic strength on the adsorption of glyphosate onto ferrihydrite. Geochem. Trans. 2019, 20, 3. [Google Scholar] [CrossRef]
- Zhou, S.; Sato, T.; Otake, T. Dissolved Silica Effects on Adsorption and Co-Precipitation of Sb(III) and Sb(V) with Ferrihydrite. Minerals 2018, 8, 101. [Google Scholar] [CrossRef] [Green Version]
- Parks, G.A. The Isoelectric Points of Solid Oxides, Solid Hydroxides, and Aqueous Hydroxo Complex Systems. Chem. Rev. 1965, 65, 177–198. [Google Scholar] [CrossRef]
Figure 1.
XRD patterns of (a) acid-treated multiwalled carbon nanotubes (MWCNT), (b) synthesized ferrihydrite (FHY) (blue), and (c) 50 FHY/50 MWCNT composite; the inset in (c) showed smaller intensity XRD peaks at smaller scale for better illustration. All XRD peaks in these figures were labeled with their corresponding 2θ angles and d-spacings in nm, and their characterized XRD patterns from previous studies in (a) and (b).

Figure 2.
TEM images of (a) pure acid-treated MWCNT, (b) 50 FHY/50 MWCNT composite, and (c) pure synthesized FHY.
Figure 2.
TEM images of (a) pure acid-treated MWCNT, (b) 50 FHY/50 MWCNT composite, and (c) pure synthesized FHY.

Figure 3.
Specific surface area data for all composite and end-member samples. Trendline and equation showing the relationship between the % MWCNT in the composite material and its measured BET specific surface area. Error bars represent the standard deviation of triplicate samples.
Figure 3.
Specific surface area data for all composite and end-member samples. Trendline and equation showing the relationship between the % MWCNT in the composite material and its measured BET specific surface area. Error bars represent the standard deviation of triplicate samples.

Figure 4.
Cyclic voltammetry (CV) plot of all composite samples and controls at 100 mV·s−1 in 0.5 mol·L−1 Na2SO4 electrolyte solution.
Figure 4.
Cyclic voltammetry (CV) plot of all composite samples and controls at 100 mV·s−1 in 0.5 mol·L−1 Na2SO4 electrolyte solution.

Figure 5.
Specific capacitance of all composite samples and controls at various scan rate. Error bars reveal the standard deviation obtained from triplicate electrodes measurements.
Figure 5.
Specific capacitance of all composite samples and controls at various scan rate. Error bars reveal the standard deviation obtained from triplicate electrodes measurements.

Figure 6.
Specific capacitance data of all composite samples and controls at the scan rate of 5 mV·s−1. Trendline and equation showing the relationship between composite ratio and specific capacitance were included.
Figure 6.
Specific capacitance data of all composite samples and controls at the scan rate of 5 mV·s−1. Trendline and equation showing the relationship between composite ratio and specific capacitance were included.

Figure 7.
The combination plot showed the fluctuation of both specific capacitance and specific surface area with different ratios of MWCNT and FHY in the composite material.
Figure 7.
The combination plot showed the fluctuation of both specific capacitance and specific surface area with different ratios of MWCNT and FHY in the composite material.

Publisher’s Note: MDPI stays neutral with regard to jurisdictional claims in published maps and institutional affiliations. |
© 2020 by the authors. Licensee MDPI, Basel, Switzerland. This article is an open access article distributed under the terms and conditions of the Creative Commons Attribution (CC BY) license (http://creativecommons.org/licenses/by/4.0/).
Share and Cite
MDPI and ACS Style
Tran, T.; Deocampo, D.M.; Kabengi, N. Synthesis and Optimization of Multiwalled Carbon Nanotubes–Ferrihydrite Hybrid Composite. J. Compos. Sci. 2021, 5, 5. https://doi.org/10.3390/jcs5010005
AMA Style
Tran T, Deocampo DM, Kabengi N. Synthesis and Optimization of Multiwalled Carbon Nanotubes–Ferrihydrite Hybrid Composite. Journal of Composites Science. 2021; 5(1):5. https://doi.org/10.3390/jcs5010005
Chicago/Turabian StyleTran, Thien, Daniel M. Deocampo, and Nadine Kabengi. 2021. "Synthesis and Optimization of Multiwalled Carbon Nanotubes–Ferrihydrite Hybrid Composite" Journal of Composites Science 5, no. 1: 5. https://doi.org/10.3390/jcs5010005