Article

Polydopamine-Coated Paraffin Microcapsules as a Multifunctional Filler Enhancing Thermal and Mechanical Performance of a Flexible Epoxy Resin

1
Department of Industrial Engineering and INSTM Research Unit, University of Trento, Via Sommarive 9, 38123 Trento, Italy
2
Leibniz-Institut für Polymerforschung, Hohe Str. 6, D01069 Dresden, Germany
*
Authors to whom correspondence should be addressed.
J. Compos. Sci. 2020, 4(4), 174; https://doi.org/10.3390/jcs4040174
Submission received: 19 October 2020 / Revised: 14 November 2020 / Accepted: 19 November 2020 / Published: 22 November 2020
(This article belongs to the Special Issue Feature Papers in Journal of Composites Science in 2020)

Abstract

:
This work focuses on flexible epoxy (EP) composites containing various amounts of neat and polydopamine (PDA)-coated paraffin microcapsules as a phase change material (PCM), which have potential applications as adhesives or flexible interfaces with thermal management capability for electronics or other high-value-added fields. After PDA modification, the surface of PDA-coated capsules (MC-PDA) becomes rough with a globular appearance, and the PDA layer enhances the adhesion with the surrounding epoxy matrix, as shown by scanning electron microscopy. PDA deposition parameters have been successfully tuned to obtain a PDA layer with a thickness of 53 ± 8 nm, and the total PDA mass in MC-PDA is only 2.2 wt %, considerably lower than previous results. This accounts for the fact that the phase change enthalpy of MC-PDA is only marginally lower than that of neat microcapsules (MC), being 221.1 J/g and 227.7 J/g, respectively. Differential scanning calorimetry shows that the phase change enthalpy of the prepared composites increases with the capsule content (up to 87.8 J/g) and that the enthalpy of the composites containing MC-PDA is comparable to that of the composites with MC. Dynamic mechanical analysis evidences a decreasing step in the storage modulus of all composites at the glass transition of the EP phase, but no additional signals are detected at the PCM melting. PCM addition positively contributes to the storage modulus both at room temperature and above T g of the EP phase, and this effect is more evident for composites containing MC-PDA. As the capsule content increases, the mechanical properties of the host EP matrix also increase in terms of elastic modulus (up to +195%), tensile strength (up to +42%), Shore D hardness (up to +36%), and creep compliance (down to −54% at 60 min). These effects are more evident for composites containing MC-PDA due to the enhanced interfacial adhesion.

1. Introduction

Phase change materials (PCMs) are attracting increasing attention for thermal energy storage (TES) and thermal management applications thanks to their ability to store a large amount of excess heat and release it where and when needed, thereby filling the mismatch between energy availability and demand [1,2,3]. Among the different PCM classes, the most diffused and researched for applications in the temperature range 0–100 °C are organic solid–liquid PCMs, such as paraffin waxes. In fact, they are characterized by large latent heat of phase transition, narrow melting/crystallization temperature range, congruent melting, negligible supercooling, low density, inexpensiveness, large availability, chemical stability, and noncorrosiveness [2,4,5]. Their main disadvantage is the need for confinement to avoid leakage above the melting temperature [6,7]. One of the most effective confining techniques is micro-/nanoencapsulation, which also limits unwanted interactions with the external environment, increases thermal stability, facilitates handling, and partially accommodate the volume variation during the phase change of the core [3,8,9,10].
Organic PCMs are widely used for thermal management applications aimed at maintaining indoor temperature in the comfort range [11,12,13], avoiding ice accretion [14], and preventing overheating of electronic devices [15,16,17,18,19]. Concerning this last application, it has become increasingly difficult to effectively avoid excessive temperature rise of electronic components due to their increasing miniaturization, power, and integration [20,21]. Overheating is among the most frequent causes of failure, as approximately 55% of failures are related to high temperature problems or poor thermal management. It has been reported that a decrease of 1 °C can decrease the failure rate of up to 4%, and an increase of 10–20 °C can double the failure probability [16]. Hence, PCMs are becoming an appealing alternative to bulky equipment such as natural or forced convection systems. When a device is in a power peak and the temperature starts rising, the PCM melts and absorbs excess heat, thereby helping to maintain the temperature below a safety threshold [22]. For effective management of weight and volume of the final component, it could be advantageous to embed the PCM in an already existing part of the electronic device. For example, polymers and polymer composites, and epoxy composites in particular, are widely used in electronics to build not only packaging, substrates, boards, and sealing materials but also crucial components such as thermal interface materials (TIM) due to their lightness, flexibility, easy processing, excellent chemical stability, and durability [21]. To improve heat dissipation of polymers, the common strategy is to increase their thermal conductivity by adding conductive nanofillers [20,21,23]. An alternative or complementary strategy could be to introduce PCMs as a functional filler in order to increase the total absorbed heat and simultaneously keep the temperature in the safety range.
The scientific literature reports many examples of thermoplastic or thermosetting matrices containing microencapsulated or variously stabilized PCMs [4,12,24,25,26,27,28,29]. Our group has recently developed numerous polymer matrices and reinforced polymer composites that combine good mechanical properties and TES capability—for example, polyamide/glass laminates enhanced with a microencapsulated or a shape-stabilized paraffinic PCM [30,31,32], polyamide-based composites containing discontinuous carbon fibers and paraffin microcapsules [33,34], epoxy/carbon composites containing microencapsulated or shape-stabilized paraffin [35,36,37,38,39,40], laminates based on a reactive thermoplastic resin and paraffin microcapsules [41,42], polypropylene filaments containing a microencapsulated PCM [43], and a biodegradable laminate composed of ultrathin wood laminae, thermoplastic starch, and a poly(ethylene glycol) as the PCM [44].
In a polymer composite, the filler–matrix interface is crucial for the final thermomechanical properties. When the filler is constituted by PCM microcapsules, interfacial defects can originate not only from poor chemical compatibility and/or a mismatch in the thermal expansion coefficients, but also from repeated volume variations associated with PCM phase change in multiple thermal cycles. To avoid damage at the interface, a decrease in the overall mechanical properties, and premature failure of the component, it is fundamental to study and optimize the interphase zone and enhance the interfacial adhesion [45,46]. Thanks to their thermal stability, low cost, and easily controlled production process [45], the most widely used materials for PCM capsule shells are melamine-urea-formaldehyde (MUF) and melamine-formaldehyde (MF) resins. However, previous research [30,31,33,41,47] highlighted a nonoptimal adhesion especially between MF microcapsules and polymers such as epoxy, acrylic resins, and polyamides due to the lack of reactive sites on a fully cured MF surface. This surface state also hinders the a posteriori treatment of the microcapsules, especially when addressed with traditional surface modification techniques (e.g., silane chemistry).
A possible alternative is represented by the deposition of polydopamine (PDA), a bioinspired synthetic polymer able to adhere to a great variety of substrates and materials [48,49]. PDA is formed by the oxidative self-polymerization of dopamine and can be deposited as continuous films featuring a remarkable assortment of reactive functional groups, thus drastically modifying the surface activity of the substrate. PDA has been successfully deposited onto reinforcing fibers with chemically inert surfaces, such as ultrahigh molecular weight polyethylene (UHMWPE) and poly(p-phenylene-2,6-benzobisoxazole) (PBO) fibers [50,51], with consequent improvement of the interfacial interaction with the surrounding polymer matrix. PDA has also been used by our group to functionalize PCM microcapsules with a MF shell [52], and the modification remarkably improved the adhesion with a rigid epoxy resin (glass transition temperature = 95 °C). An analysis using X-ray photoelectron spectroscopy (XPS) highlighted that, unlike MF, PDA is able to react with oxirane groups of the epoxy resin, thereby forming covalent groups and increasing the adhesion by chemical interaction. The deposited PDA layer had a thickness of a few hundred nanometers, featured a noticeable surface roughness that increased the interaction with the matrix by mechanical interlocking, and represented 14.3 wt % of the total PDA-coated microcapsule sample [52].
The present work aims, for the first time, to produce and characterize flexible epoxy-based composites containing different amounts of neat and PDA-modified PCM microcapsules. Taking off from the results of [52], PDA deposition parameters have been tuned to obtain a thinner PDA layer, which would be advantageous since a thick layer would unnecessarily decrease the core-to-shell mass ratio of the microcapsules and, therefore, the total melting enthalpy per unit mass, since the only contribution to the phase change enthalpy comes from the paraffinic core. Moreover, previous results [52] suggest that the main adhesion mechanism is chemical interaction between the surface functional groups of PDA and the oxirane groups of the epoxy resin, and this mechanism would also be active with a thinner PDA layer. Moreover, electron microscopy techniques were employed to characterize the surface state of the microcapsules before and after PDA deposition, as well as the fracture surface of the composites and shell/epoxy interfacial adhesion. The work then focuses on the impact of PDA modification on the thermal properties of the PCM microcapsules and on the effect of neat and PDA-coated microcapsules on the thermal, viscoelastic, and short- and long-term mechanical performance of the prepared composites. The potential applications of the investigated composites include adhesives or flexible interfaces with thermal management capability for electronics or other high-value-added fields.

2. Materials and Methods

2.1. Materials

Microencapsulated PCM Microtek MPCM43D, labeled MC in the remainder of the text, was purchased from Microtek Laboratories (Dayton, OH, USA). The PCM phase (core) is composed of a paraffin wax with a melting temperature of 43 °C, encapsulated into formaldehyde-based resin shells constituting approximately 10%–15% of the mass. The average diameter is 17–20 μm, and the declared melting enthalpy is 190–200 J/g. The bi-component epoxy system Elan-tech® EC251/W242 NF was kindly provided by Elantas Europe S.r.l. (Collecchio, Italy). Dopamine hydrochloride (DH) (CAS 62-31-7), and amino-2-(hydroxymethyl)propane-1,3-diol (TRIS buffer, Trizma®) (CAS 77-86-1) were acquired from Sigma-Aldrich (Steinheim, Germany). Acetone (CAS 67-64-1) was supplied by Fisher Scientific (Nidderau, Germany). Deionized water was prepared by employing a PURELAB Chorus 2+® water purification system (Elga LabWater, High Wycombe, UK).

2.2. Sample Preparation

2.2.1. Modification of Microcapsules with PDA

The coating of the microcapsules with a PDA layer was carried out in a manner similar to the one described in a previous paper by our group [52] and briefly reported here. 1.0 g dopamine hydrochloride was added to 600 mL of TRIS solution (0.1 mol/L) and dissolved in an ultrasonic bath at room temperature. Then, 3 g microcapsules were slowly added to the dopamine solution under vigorous magnetic stirring. The suspension was stirred for 10 h at room temperature, and then the PDA-coated microcapsules were filtered, rinsed with deionized water until the washing solution stayed colorless, and dried under vacuum at room temperature for 2 h. The progression of the drying procedure was based on mass determination of the sample and performed until the weight of the sample was constant, which is an indication of complete removal of solvent. After modification, the formerly white microcapsules were brown, which indicated the presence of insoluble and irreversibly bonded PDA layers on their surfaces. The microcapsules obtained with this DH concentration had a slightly lighter shade of brown than those obtained with a more concentrated DH solution described in [52], which suggested the presence of a thinner PDA layer.

2.2.2. Preparation of Epoxy-Based Composites

The epoxy base and hardener were poured in a glass beaker in a weight ratio of 100:40, as suggested by the producer. Neat or PDA-coated microcapsules were sieved with a 100-µm metallic sieve to remove bigger agglomerates, and they were added to the beaker in different weight fractions. The mixture was vigorously stirred with a magnetic stirrer at 300 rpm for 10 min to ensure good mixing, degassed with a vacuum pump to remove entrapped air bubbles, and cast in silicon molds for the subsequent characterization. The cast specimens were cured for 24 h at room temperature and then postcured for 15 h at 60 °C, as indicated by the producer. The prepared samples with nominal weight compositions are listed in Table 1.

2.3. Experimental Techniques

The microstructures of the prepared samples were investigated by acquiring SEM micrographs of the PDA-modified microcapsules and the tensile fracture surfaces of the composites with an FE-SEM Zeiss Supra 60 (Carl Zeiss AG, Oberkochen, Germany) at different magnification levels, after Pt-Pd sputtering.
Fourier-transform infrared (FTIR) spectroscopy was carried out in attenuated total reflectance (ATR) mode with a Perkin-Elmer Spectrum One instrument (Perkin Elmer GmbH, Waltham, MA, USA), equipped with the Perkin-Elmer Universal ATR module (diamond/ZnSe crystal, 1 bounce). Data were collected in the wavenumber range 650–4000 cm−1, and four scans were superimposed for each spectrum (spectral resolution 4 cm−1). Spectra were acquired on small specimens machined from cast samples and baseline-corrected with automatic correction of the instrument’s software (Spectrum v. 6.3.5).
Differential scanning calorimetry (DSC) was performed on neat and PDA-coated microcapsules and on the cured composites with a Mettler DSC 30 calorimeter (Mettler Toledo, Inc., Columbus, OH, USA), at 10 °C/min, between −30 and 80 °C under a nitrogen flow of 100 mL/min. Specimens of approximately 5 mg were sealed in aluminum crucibles and subjected to a first heating scan, a cooling scan, and a second heating scan. The test allowed the measurement of the glass transition temperature ( T g ) of the epoxy phase and the melting and crystallization temperatures ( T m , T c ) and enthalpy values ( Δ H m , Δ H c ) of the microencapsulated PCM.
Thermogravimetric analysis (TGA) was carried out with a Q5000IR thermobalance (TA Instruments, Inc., New Castle, DE, USA). Specimens of approximately 5 mg were tested at a heating rate of 10 °C/min from 40 °C to 700 °C, under a nitrogen flow of 10 mL/min. The test allowed the measurement of the temperatures corresponding to a mass loss of 1 wt %, 3 wt %, and 5 wt % ( T 1 % , T 3 % ,   T 5 % ), which are commonly selected to describe the initial degradation steps when it is difficult to identify a precise degradation onset temperature. Moreover, the test allowed the measurement of the degradation temperature ( T d ), intended as the peak of the mass loss derivative signal and corresponding to the temperature at the maximum degradation kinetics, and the residual mass after the test ( m r ).
Dynamic mechanical thermal analysis (DMTA) was performed with the TA Instruments DMA Q800 equipped with a load cell of 16 N at room temperature, on as-cast specimens with nominal dimensions of 30 × 10 × 5 mm3. Tests were performed in single cantilever mode between −30 and 80 °C at 3 °C/min with a strain amplitude of 0.05% applied at a frequency of 1 Hz. The distance between the grips was fixed at 17.5 mm. One specimen was tested per each composition. The precision of the instrument on data of modulus is ± 1%. Multifrequency DMTA tests were performed with the same experimental setup described for single-frequency scans at the frequency values of 0.3, 1, 3, 10, and 30 Hz and heating rate 0.3 °C/min. The activation energy ( E a ) of the glass transition of the EP phase was determined through the Arrhenius approach, from the slope of the linear regression of the natural logarithm of the applied frequency plotted versus the reverse of the E peak temperatures, as reported in Equation (1), as
E a =   R ( d ( l n ν ) d ( 1 T p _ E   ) ) ,
where R is the universal gas constant, equal to 8.314 J/(mol·K), ν is the applied frequency, and T p _ E is the peak temperature of E .
Quasistatic tensile tests were performed at room temperature with a universal electromechanical dynamometer Instron 5969 equipped with a 100 N load cell othermograms of some representative compositions, i.e., EP, EP-MC20no remarkable additional signals related to the me and EP-MC20-PDA, while the most important DMTA results for all composites n as-cast specimens with ISO 527-2-1BA geometry. The dimensions of the specimens were the following: length of the narrow parallel sided portion = 30 ± 0.5 mm, width of the narrow portion = 5 ± 0.5 mm, thickness = 2 mm, and gauge length = 25 ± 0.5 mm. For each composition, four specimens were tested at a crosshead speed of 0.25 mm/min for the measurement of the elastic modulus using a resistance extensometer Instron 2620 with a gauge length of 12.5 mm. According to ISO 527, the elastic modulus ( E ) was measured as the secant modulus on the stress–strain curve between strain values of 0.05% and 0.25%. Four additional specimens were tested at a crosshead speed of 10 mm/min until failure; the test allowed the determination of the stress and strain at break ( σ b ,   ε b ). The stress at break was always correspondent to the maximum stress and was thus regarded as the ultimate tensile strength ( U T S ).
Shore D hardness tests were carried out according to ASTM D2240 with a Hildebrand Durometer Operating Stand Model OS-2 (Hildebrand Prüf- und Meßtechnik GmbH, Oberboihingen, Germany). The tests were carried out on as-cast specimens at room temperature and each measurement was acquired after 5 s from the moment in which the hardness tip touched the specimen. Ten measurements were acquired for each composition, on at least three different as-cast specimens.
Creep tests were performed at 30 °C with the TA Instruments DMA Q800, on as-cast specimens with nominal geometry of 30 × 5 × 2 mm3. A constant tensile stress of 1 MPa was applied for 60 min and the recorded displacement was used to calculate the creep compliance as a function of time, D ( t ) , determined as the ratio between the measured strain and the constant stress.

3. Results and Discussion

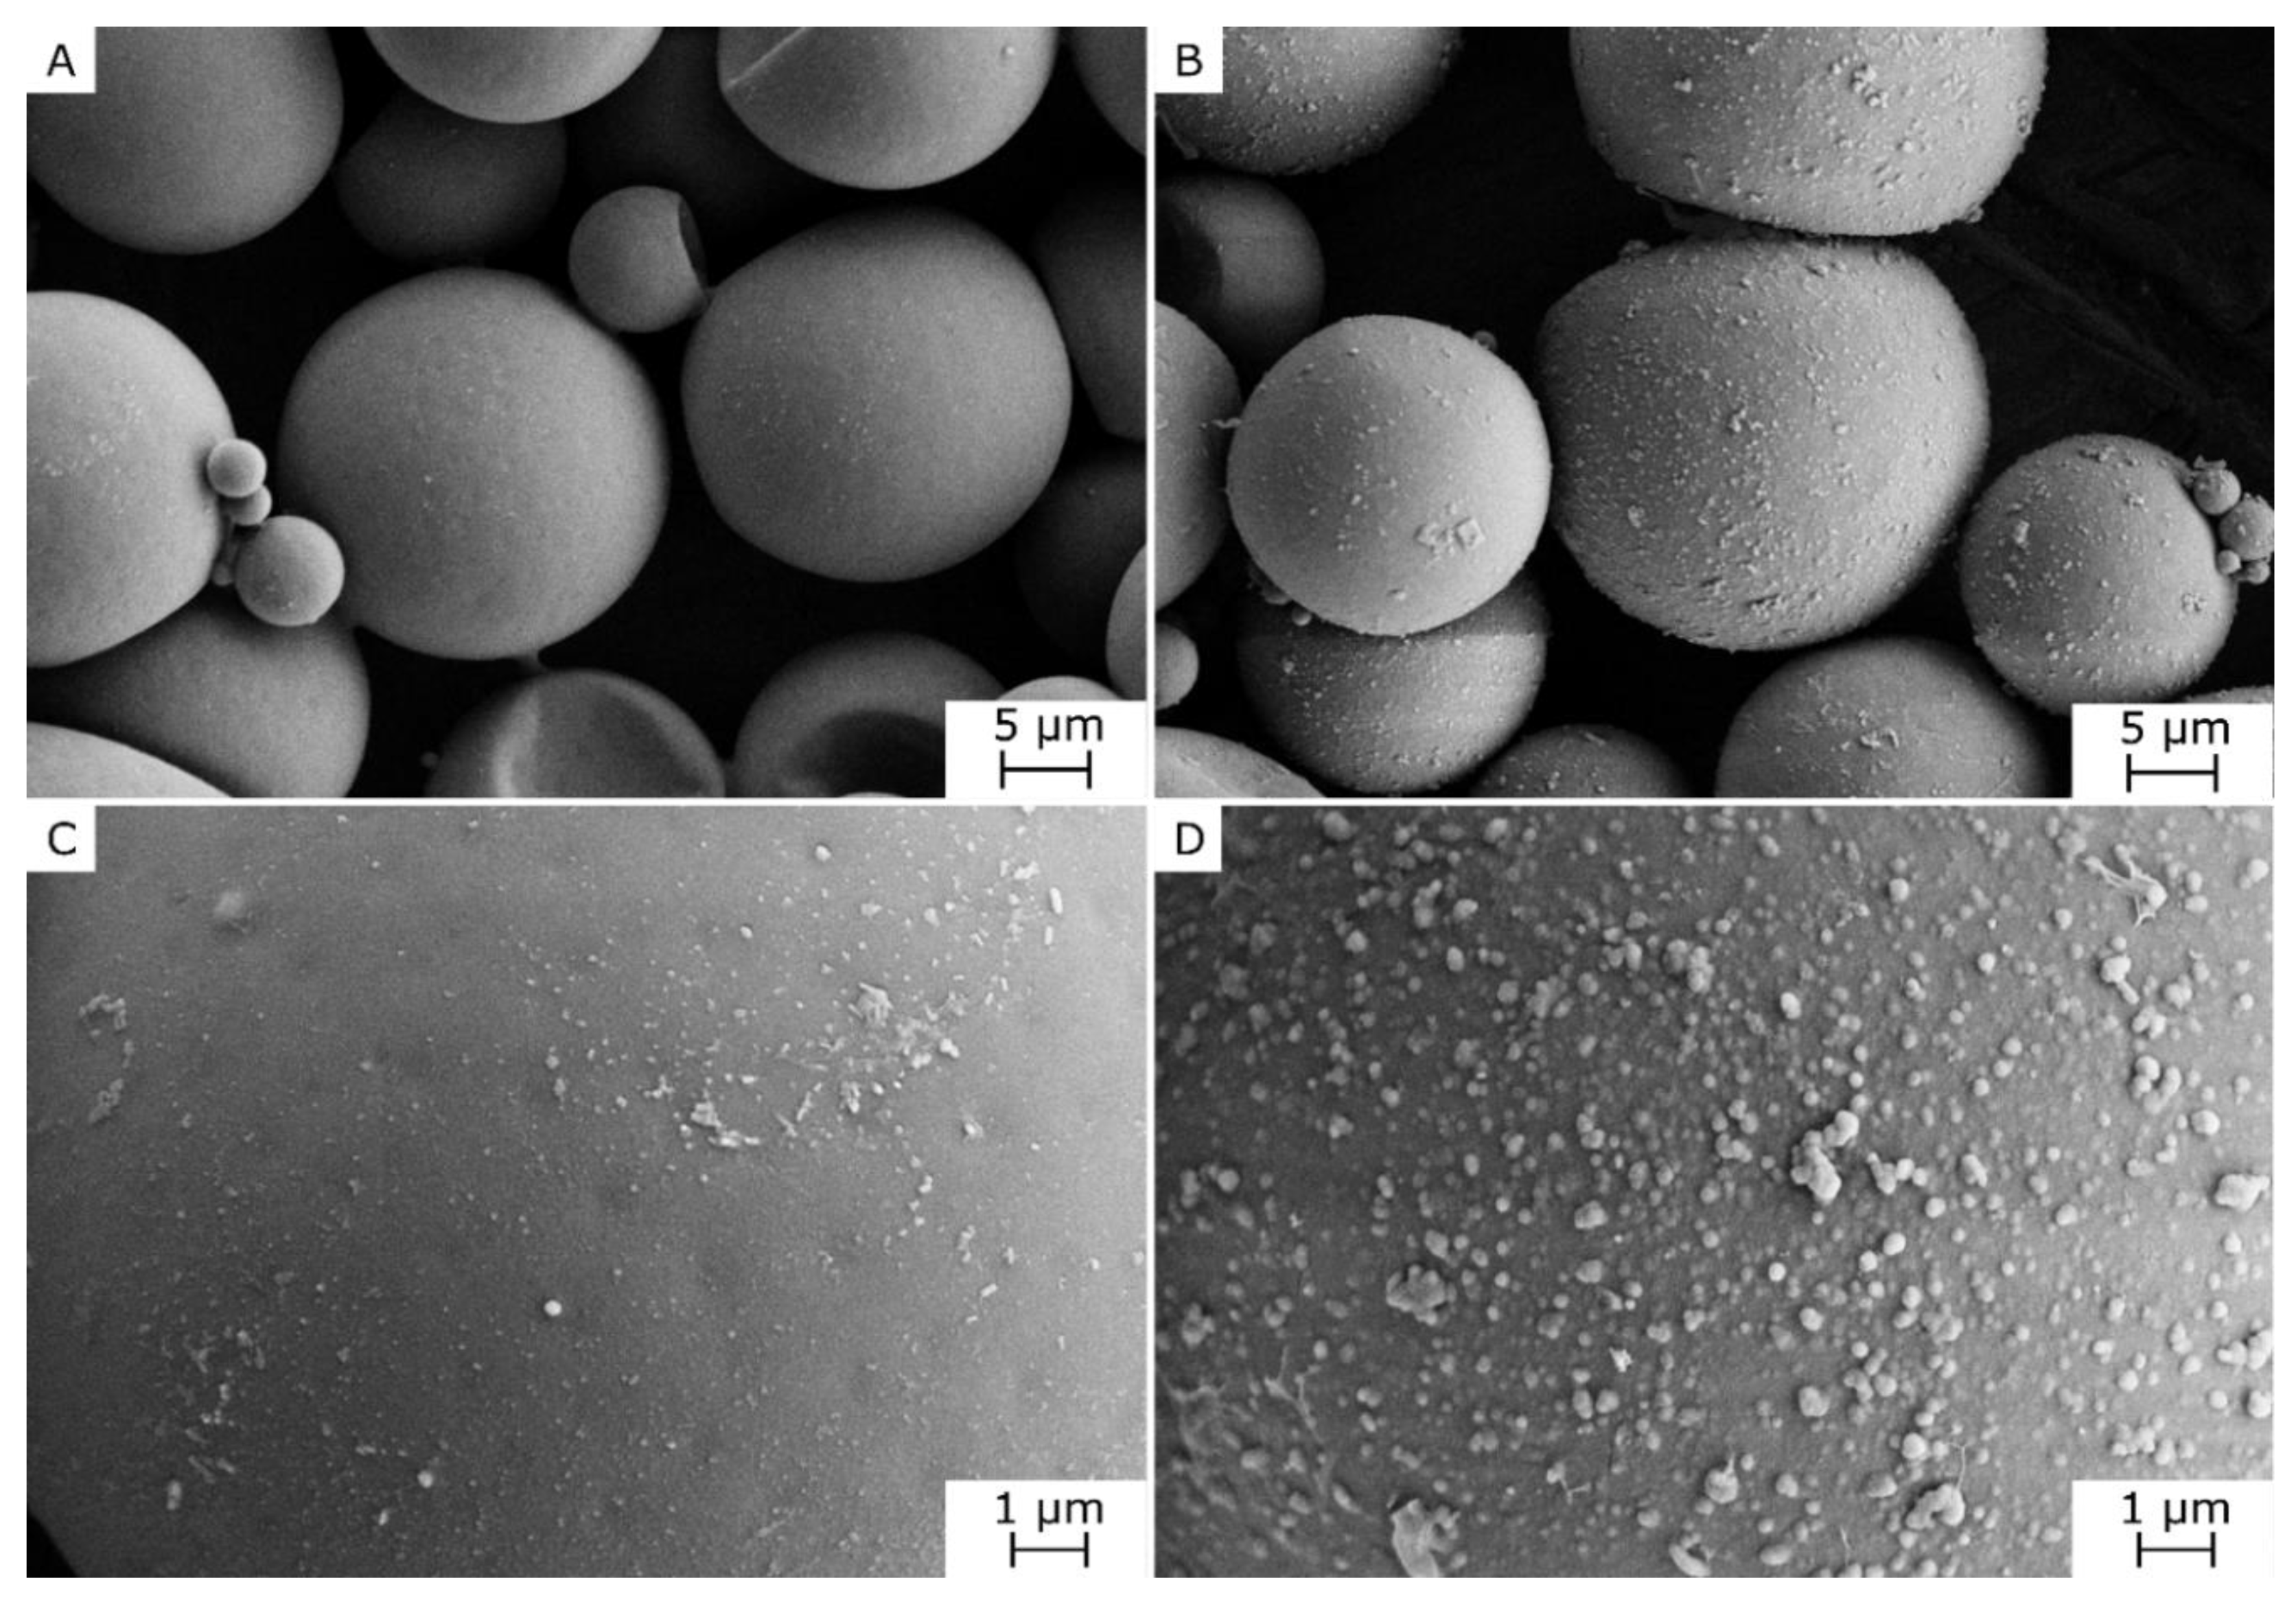
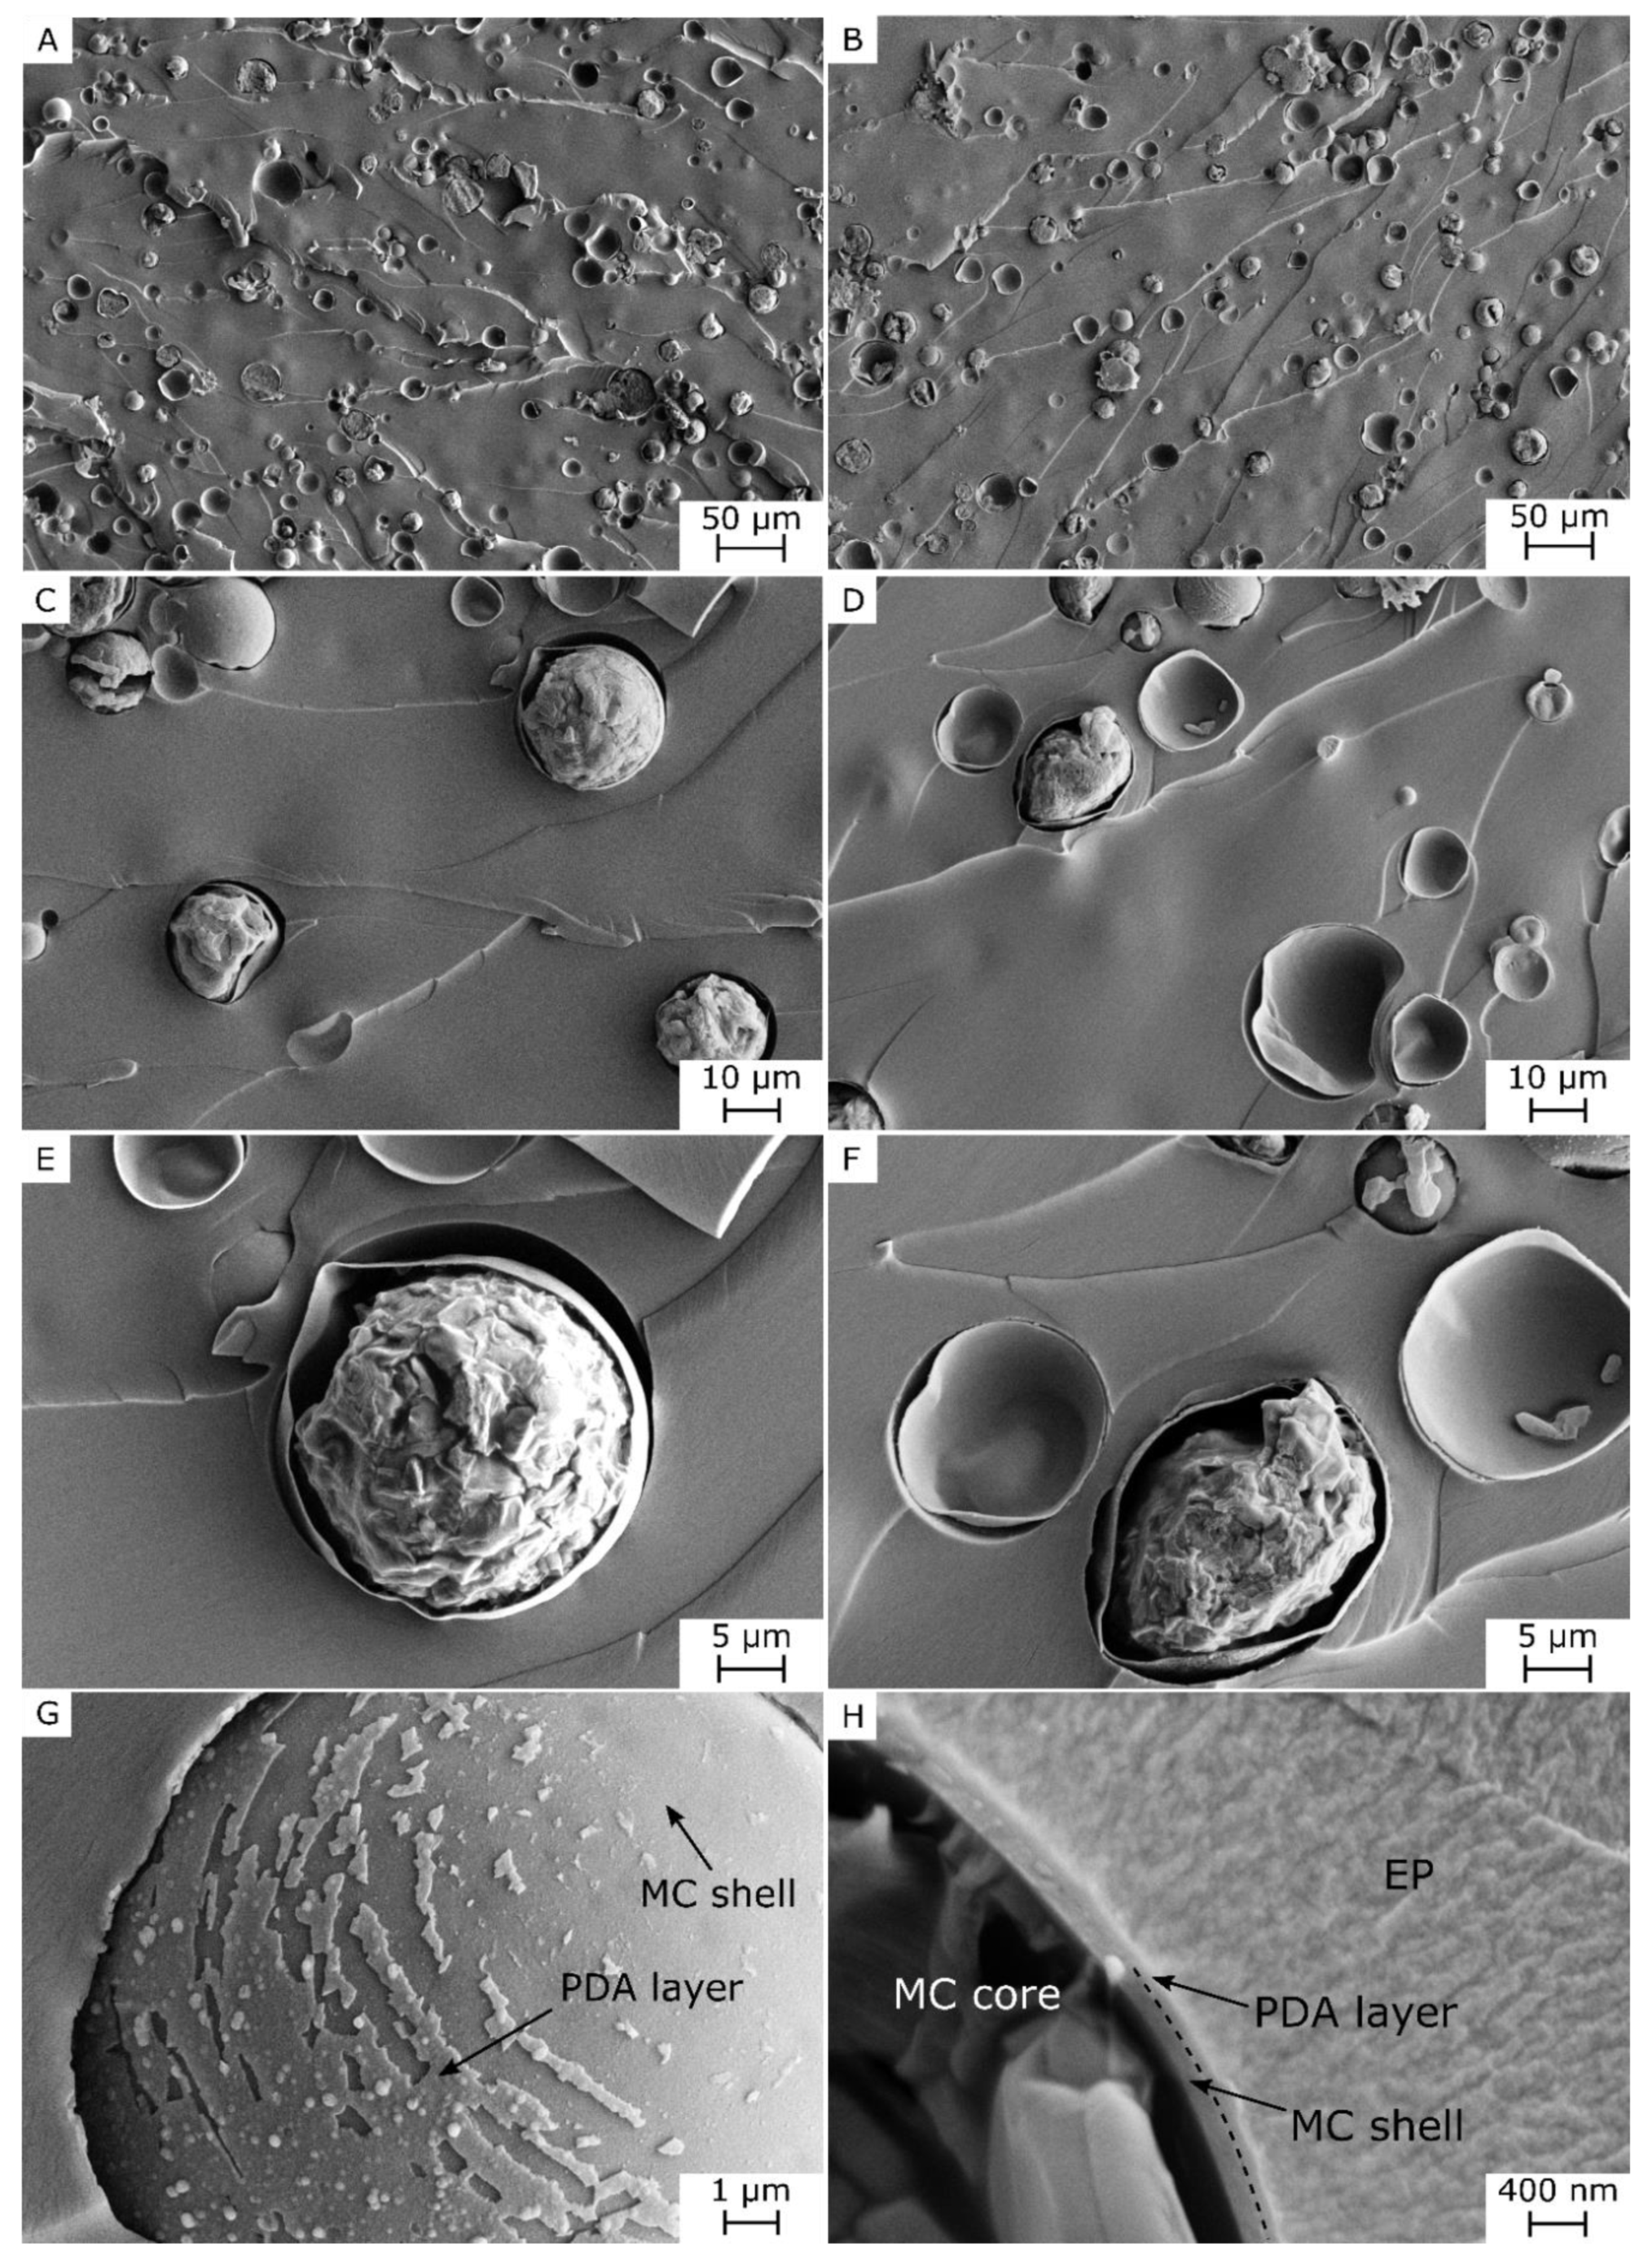
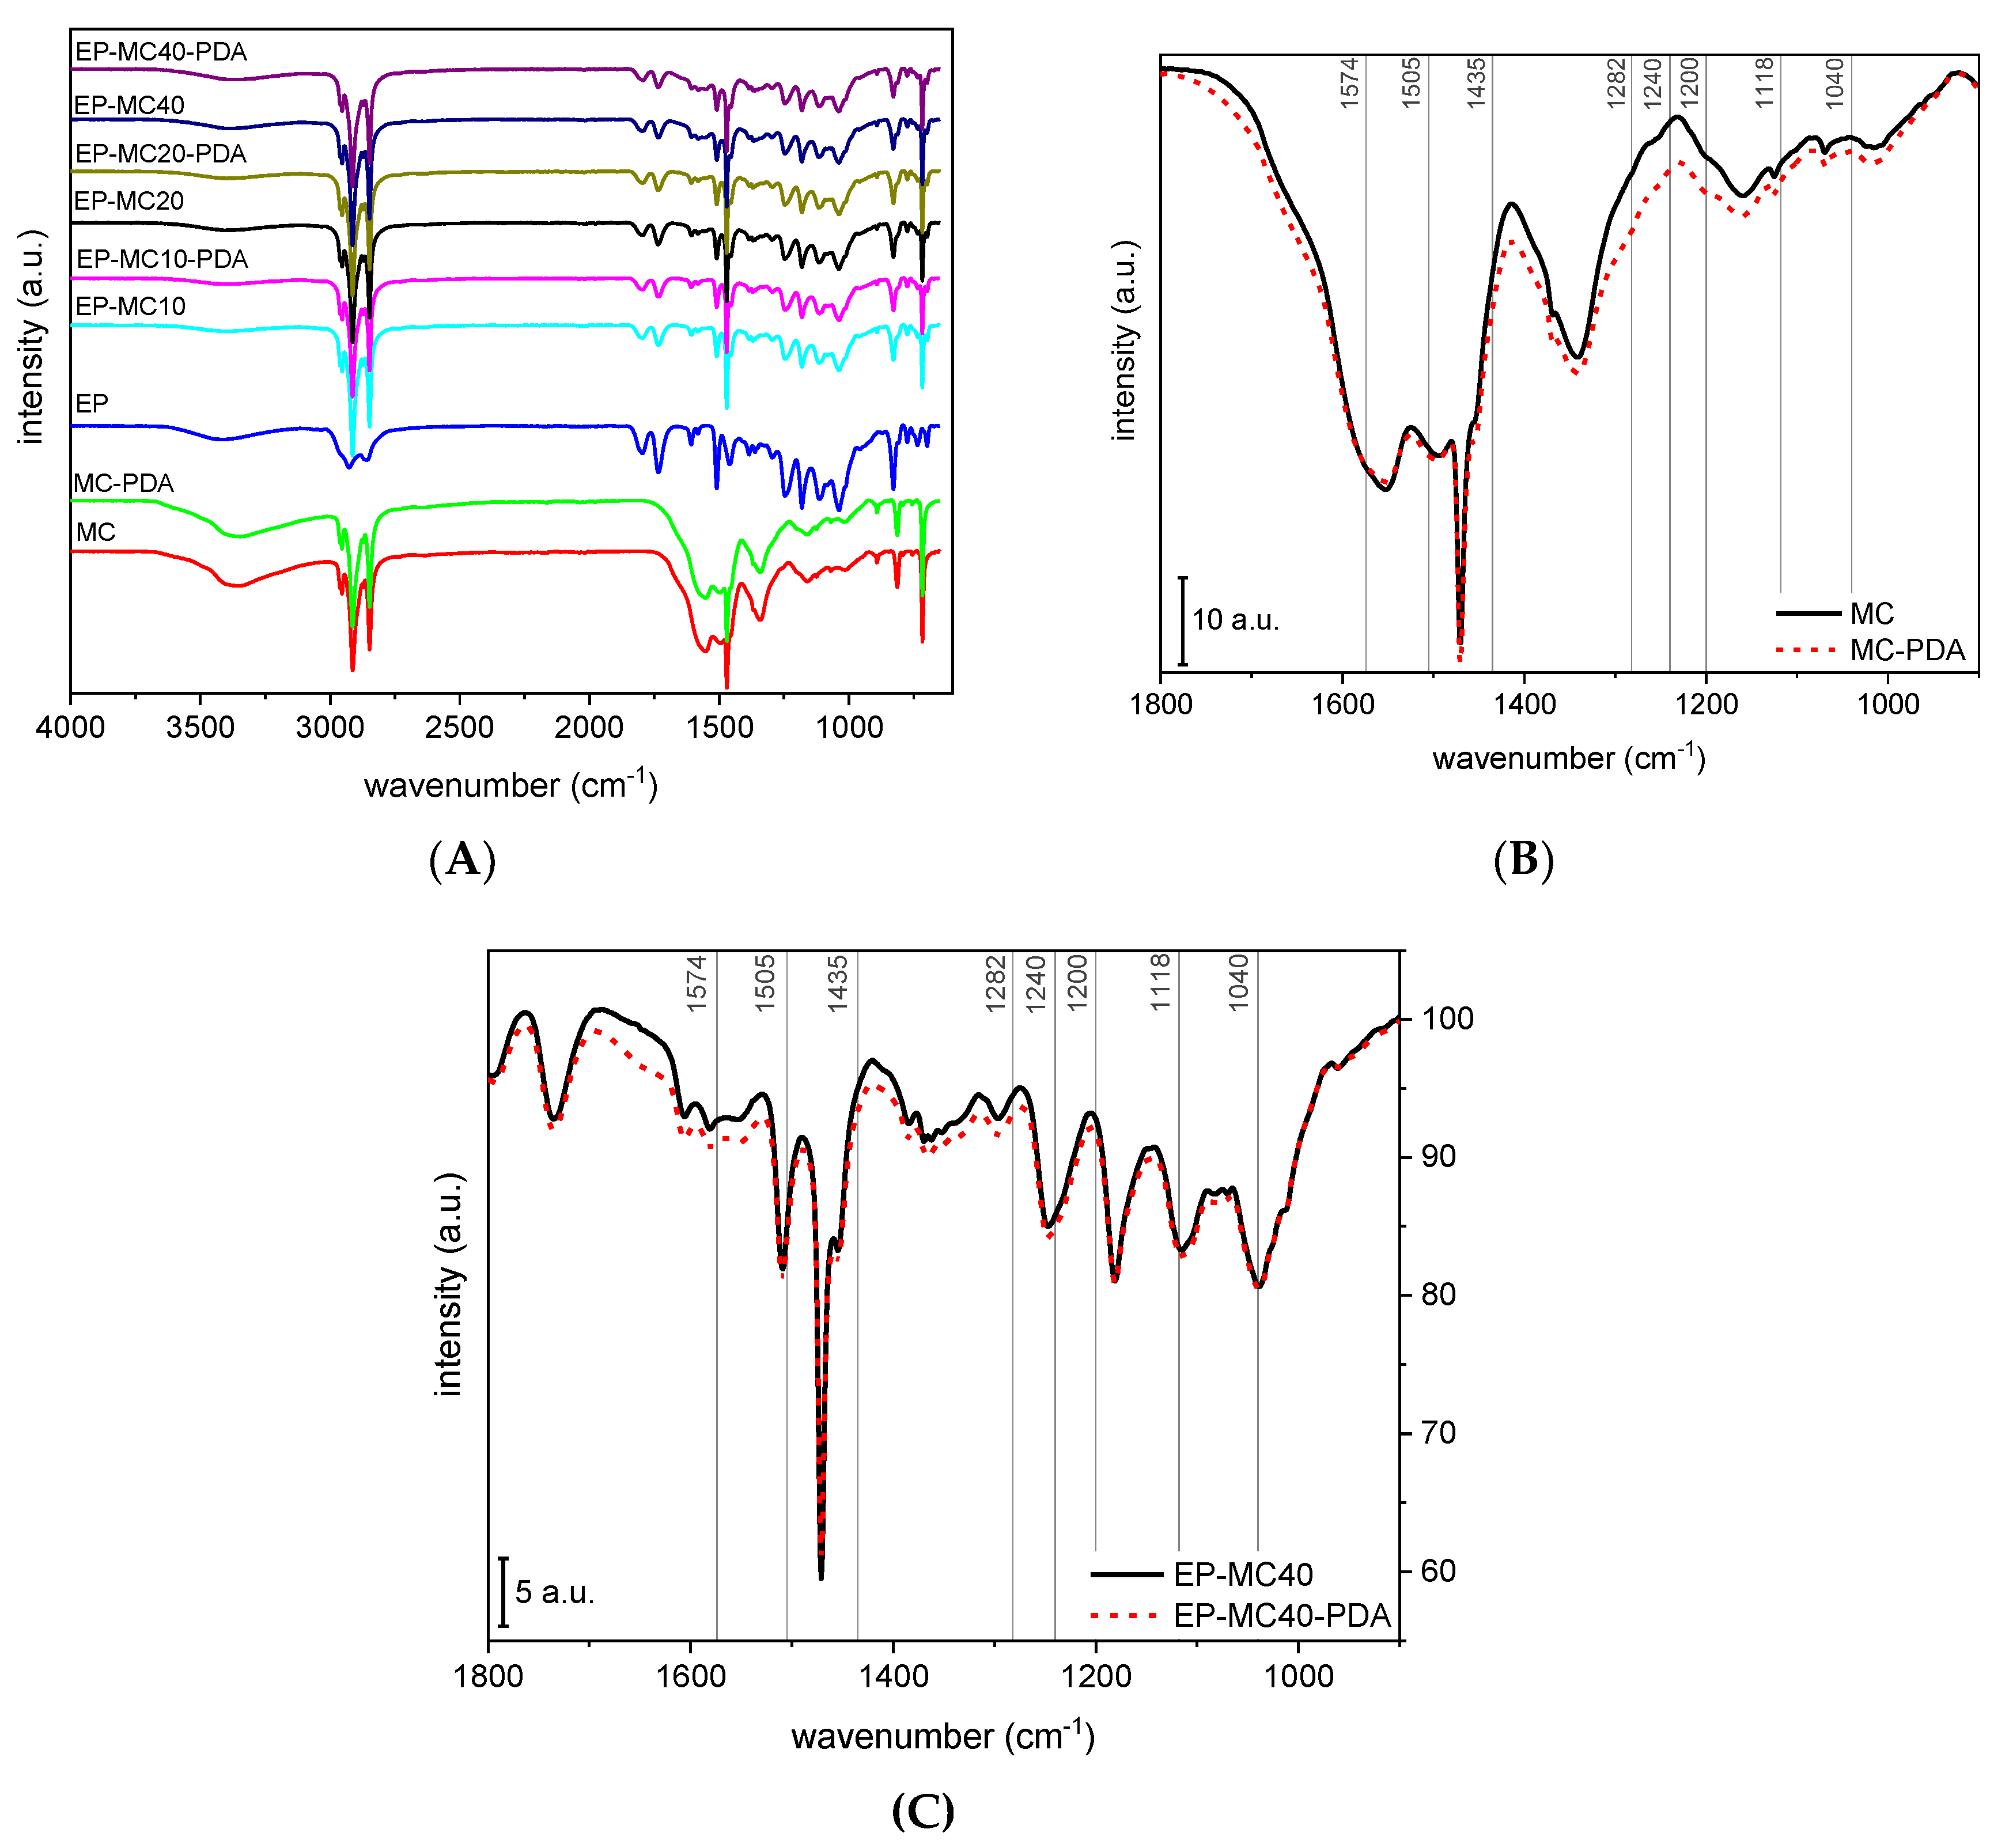
3.1. Microstructural and Spectroscopic Properties

Figure 1 shows SEM micrographs of neat and PDA-coated microcapsules. Neat microcapsules have a spherical shape and a smooth surface, while the surface of PDA-coated microcapsules is rougher with a globular appearance, which could further improve the filler–matrix interfacial interaction by mechanical interlocking. A similar surface state has already been observed in our previous work about PDA coating of the microcapsules [52]. However, the deposition parameters applied in this case, and especially the lower DH concentration and reaction time, resulted in the formation of a more homogeneous PDA coating with a lower roughness and smaller spheroidal PDA domains. In previous work, it was demonstrated that the complex surface chemistry of the PDA layer is able to react with oxirane groups, thereby improving the interfacial adhesion not only by mechanical interlocking but also by forming covalent bonds with the epoxy resin. The same phenomenon is likely to occur also with the PDA coating and the epoxy precursor of the present work, and since this was the main adhesion mechanism, the adhesion is expected to increase also with a thinner and smoother PDA layer.
Figure 2 shows SEM micrographs of the fracture surface obtained during tensile tests (see Section 3.3) of the composites with a capsule weight fraction of 10 wt %, i.e., the samples EP-MC10 and EP-MC10-PDA. As already observed for MC-containing composites with a high- T g epoxy matrix [39,52], also in this case most of the microcapsules are broken, which indicates that the fracture propagates across the microcapsules and not at the capsule–matrix interface, for both neat and PDA-coated microcapsules. The low-magnification micrographs of both composites (Figure 2A,B) show that the microcapsules are homogeneously distributed in the matrix, which suggests that this filler can be well dispersed in this epoxy matrix both with and without PDA coating.
As will be illustrated with tensile tests results (see Section 3.3), the fracture occurs at large deformations (from 20% to 55% depending on the composition), but the fracture surface does not show signs of plasticization. However, these large values of ε b are accompanied by the fracture of most microcapsules and an evident debonding between the capsule shell and the EP matrix, for both the neat and PDA-coated capsules (Figure 2C–F). From an analysis of many SEM micrographs, it was found that the interfacial gap is generally smaller for composites containing PDA-coated microcapsules, which is a sign of a greater interphase strength, associated with generally higher values of ε b .
From selected micrographs at higher magnification (Figure 2G,H), the thickness of PDA coating was estimated as 53 ± 8 nm. Assuming that the PDA has a density of 1.52 g/cm3 [53] and that the microcapsules are spherical and have an average diameter of 20 μm and a density of 0.9 g/cm3 (data from the manufacturer’s datasheet), the mass fraction of PDA in PDA-coated capsules can be estimated to be 2.6 ± 0.4 wt %, in good agreement with DSC results (see Section 3.2). Both the coating thickness and the total PDA mass fraction are considerably lower than those found in our previous work [52] (approximately 250 nm and 14.3 wt %, respectively), which is a consequence of the reduced concentration of DH in the coating solution. This is positive because a thinner PDA coating has a smaller influence on the properties depending on the effective mass fraction of the core, i.e., the melting enthalpy.
The results of the FTIR tests are reported in Figure 3A–C Although FTIR is a powerful and nondestructive technique to investigate many polymeric materials and compounds, it is not easy to apply FTIR to characterize the structure of PDA in detail [52]. A thorough analysis of ATR–FTIR signals of neat and PDA-coated microcapsules was reported in previous work [52] and briefly summarized here. As PDA contains different subunits with various oxidation states and chemical bonding [54], the FTIR spectrum of PDA does not contains narrow bands but rather broad and overlapping absorption bands. For this reason, and by the fact that the deposited PDA layer is quite thin, the FTIR spectra of neat and PDA-coated microcapsules are not remarkably different from each other. However, the contribution of the thin PDA layer is visible from the higher intensity of the MC-PDA spectrum in some specific regions, between 1000 and 1800 cm−1 (Figure 3B), in correspondence of the bands of the PDA phase found in [52] and evidenced by vertical reference lines. The other signals in the spectra of MC and MC-PDA are attributed to the paraffinic core (sharp bands) or the melamine-formaldehyde shell (broader bands), as already described in detail in [52].
The IR spectrum of EP shows the typical contributions of a cured bisphenol-A-derived epoxy resin, i.e., a broad band at 3400 cm−1 of O-H stretching deriving from pendant hydroxyl groups, the small bands at 3062 and 3035 cm−1 of the C-H stretching of the aromatic ring, the bands at 2926 and 2859 cm−1 of the aliphatic asymmetric and symmetric C–H stretching vibration of methyl (CH3) and methylene (CH2) groups, the intense band at 1796 cm−1 of the C=O stretching, and the contributions at 608, 1580, and 1509 cm−1 of the aromatic carbon-carbon stretching vibrations [55]. Conversely, the signals of the oxirane ring (908 cm−1) are not present, which indicates that the curing reaction was complete. The IR spectra of the EP-MCx and EP-MCx-PDA composites contain signals of both EP and MC phases, as partially observable from a detail of the spectra of EP-MC40 and EP-MC40-PDA (Figure 3C). It can also be seen in this case that the spectrum of the composite containing PDA-modified microcapsules exhibits a higher intensity in correspondence of the bands of the PDA phase, evidenced by vertical lines. However, the expected interfacial bands due to the chemical interaction between PDA and the epoxy matrix, already observed and discussed in [52], are not detectable due to the limited instrument resolution and the small amount of PDA in the whole composite.

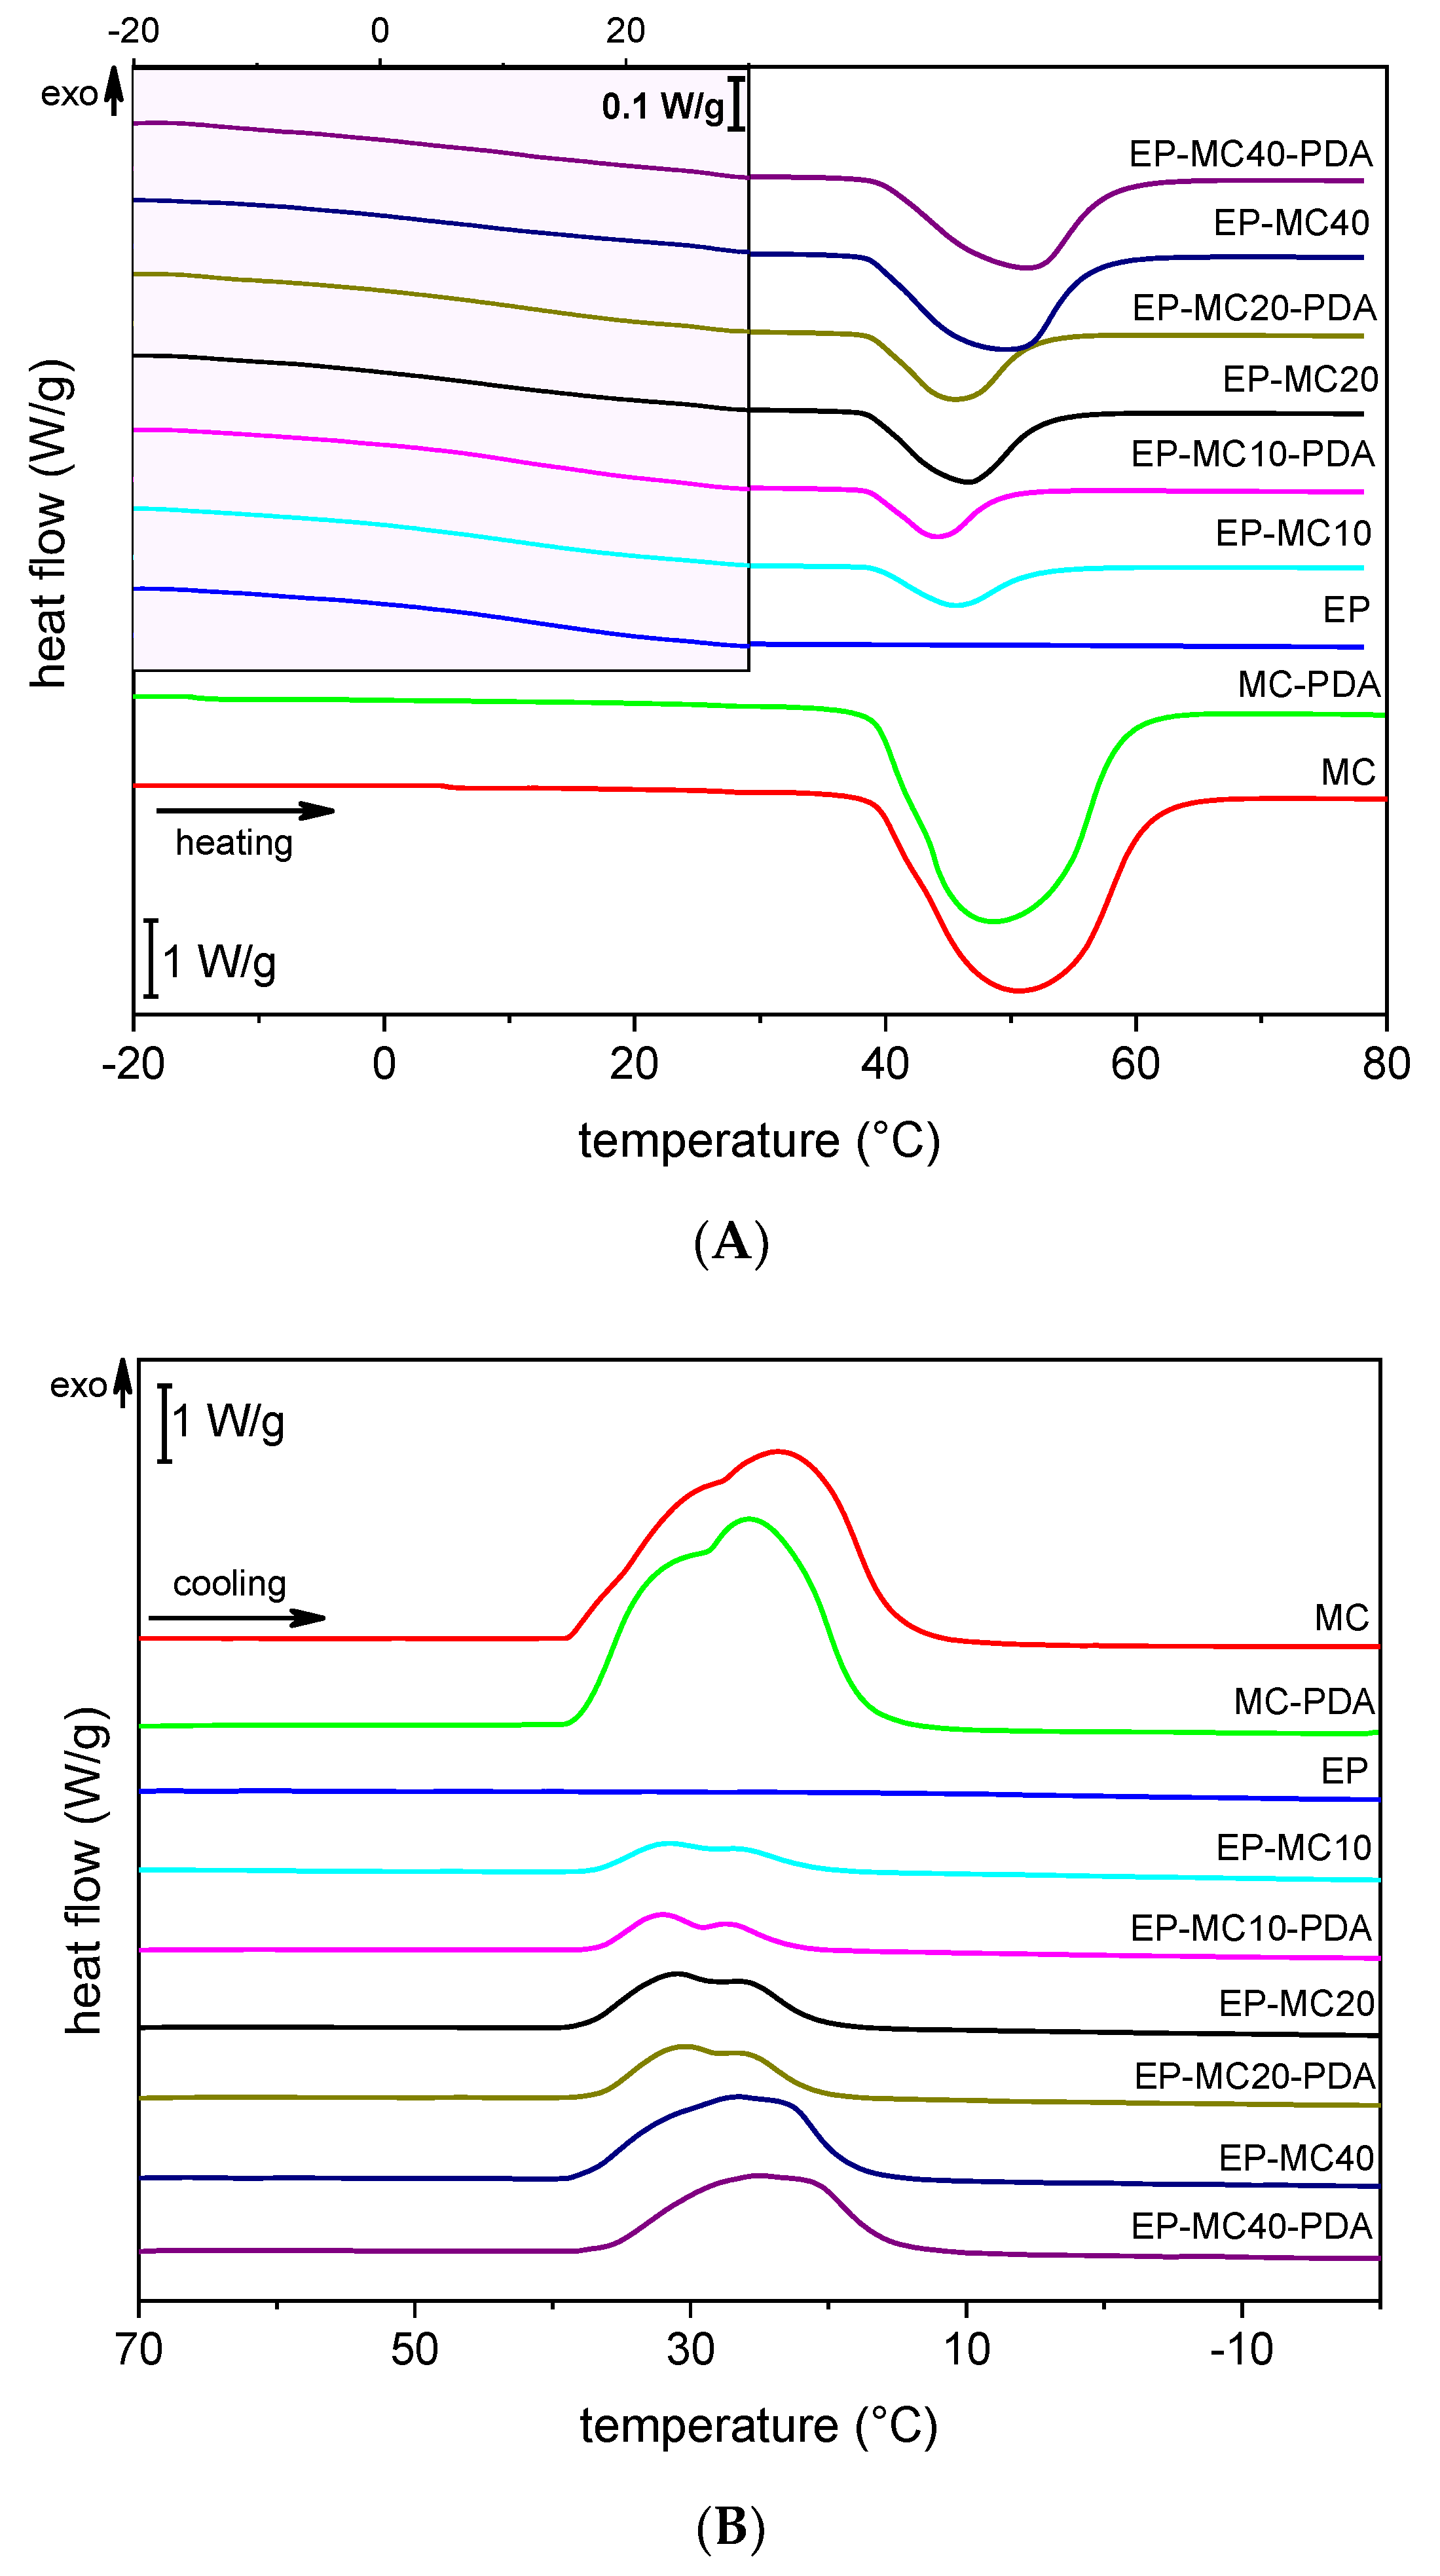
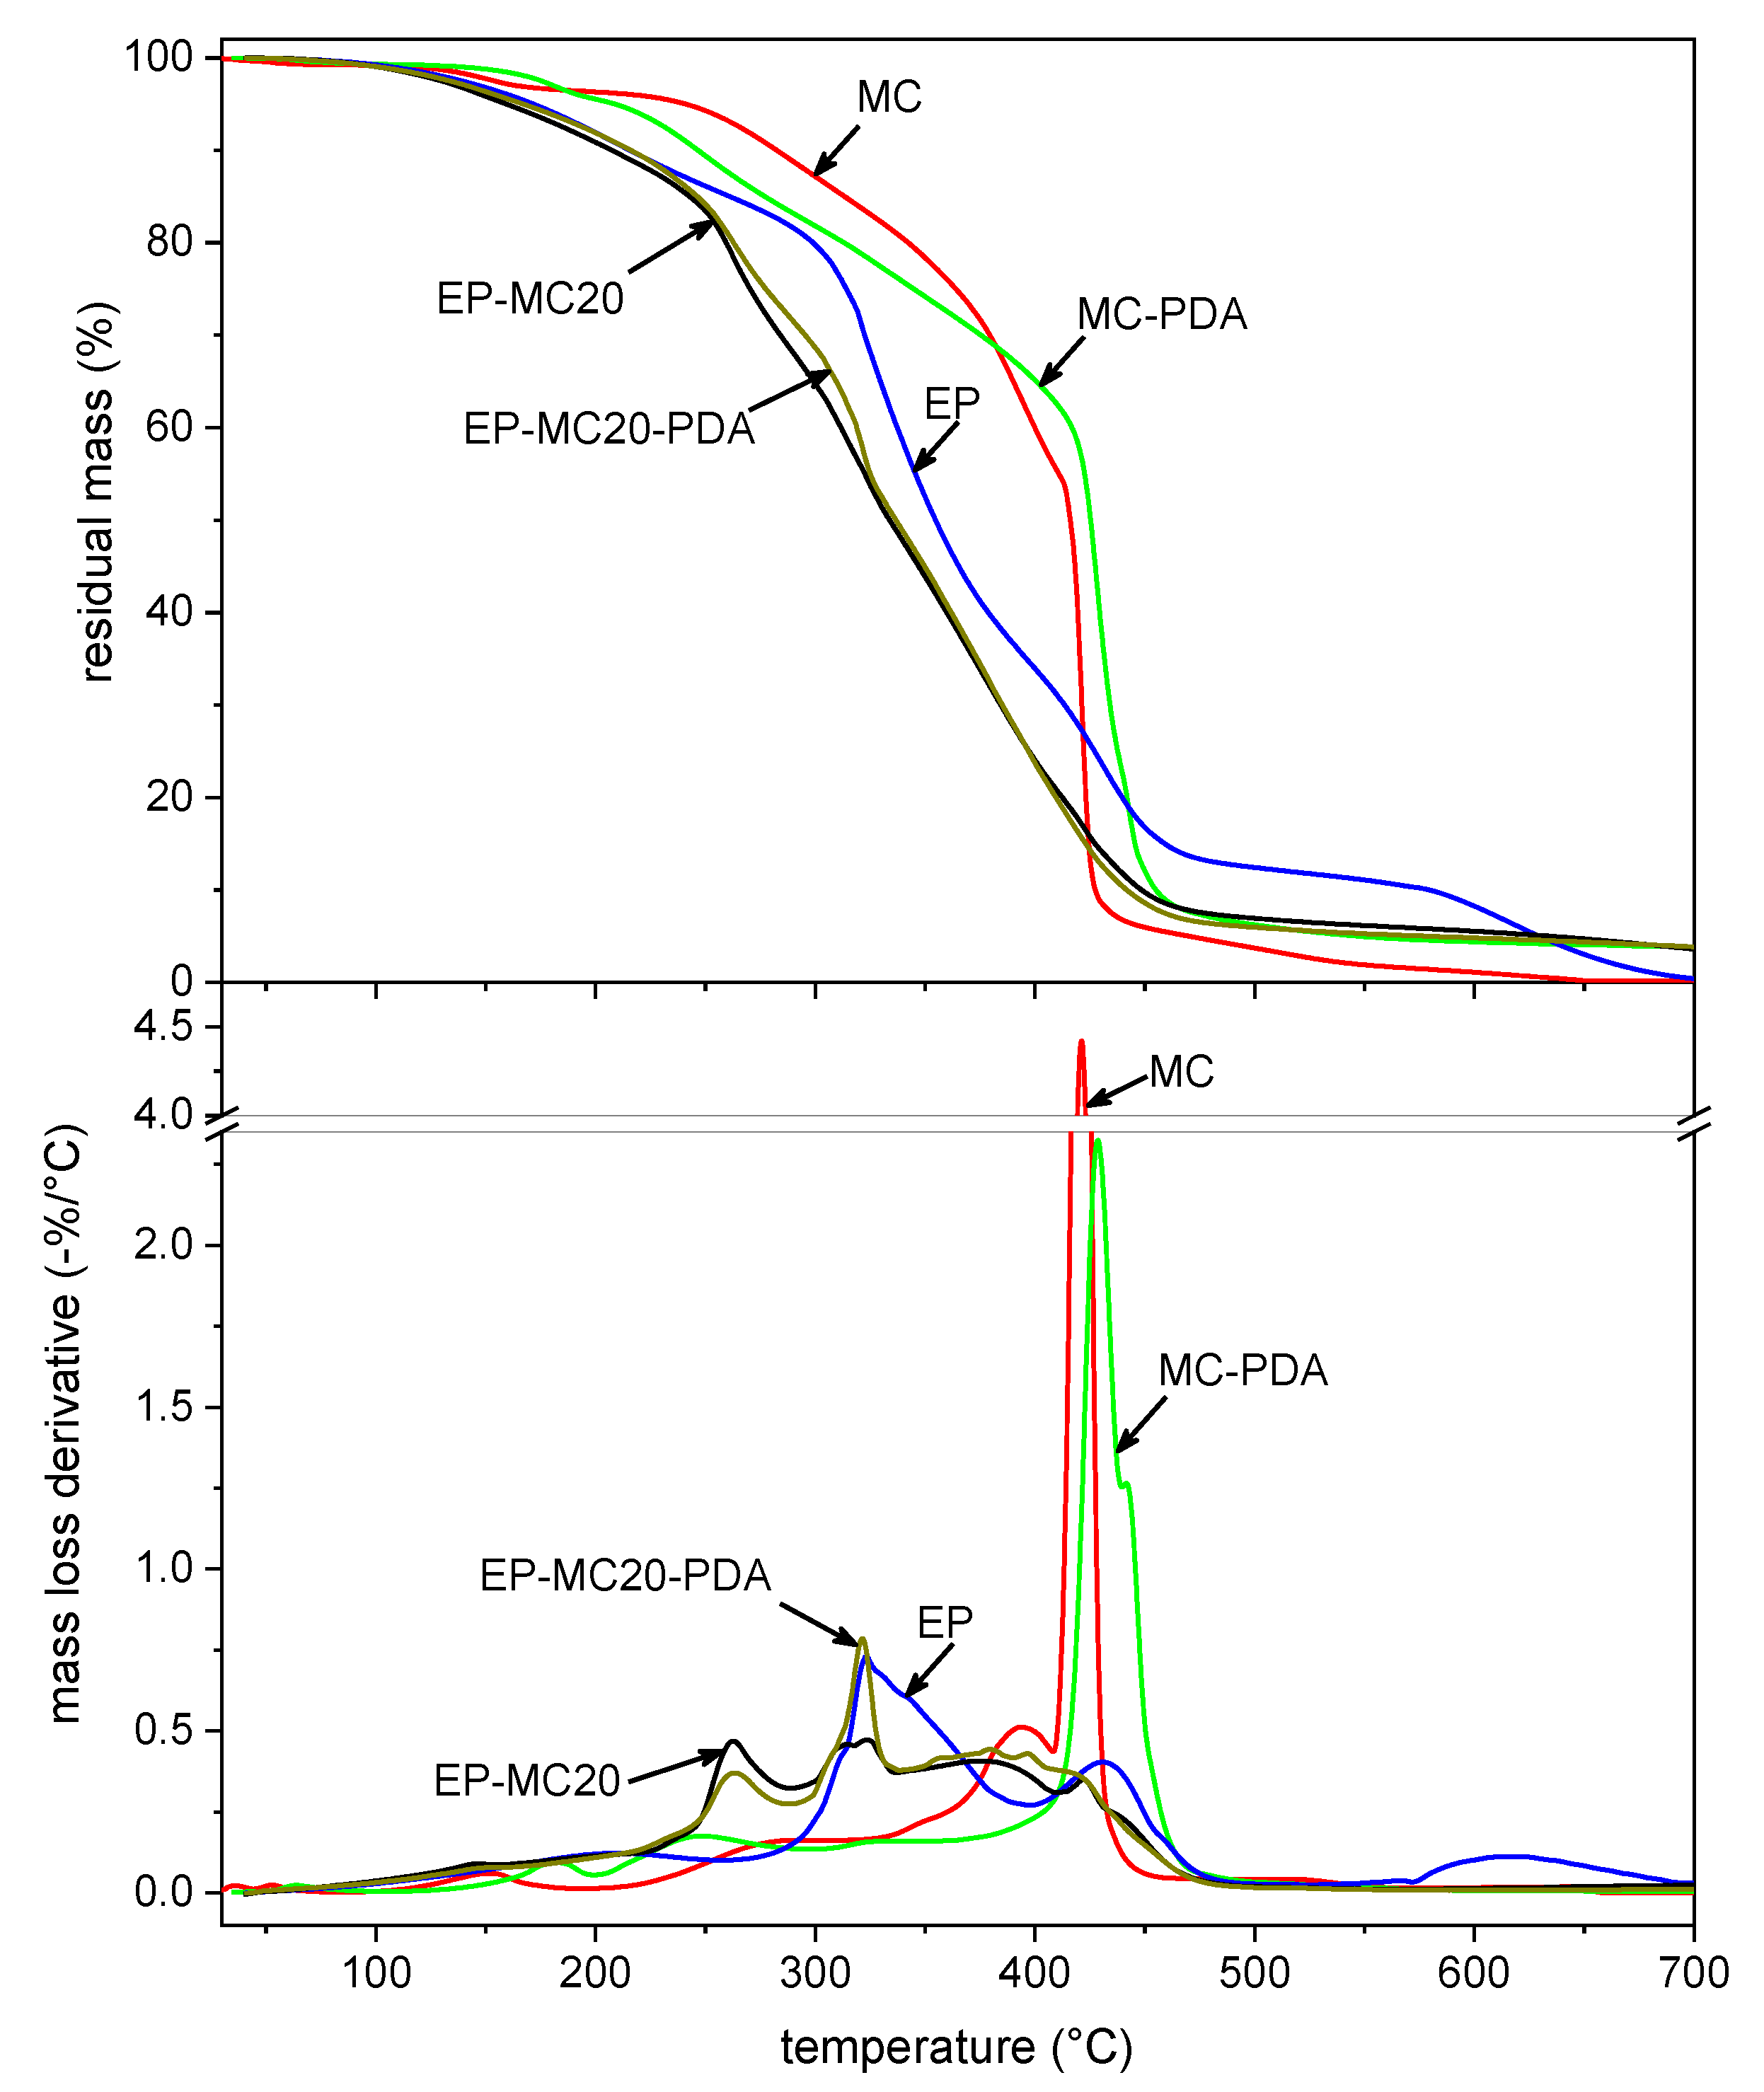
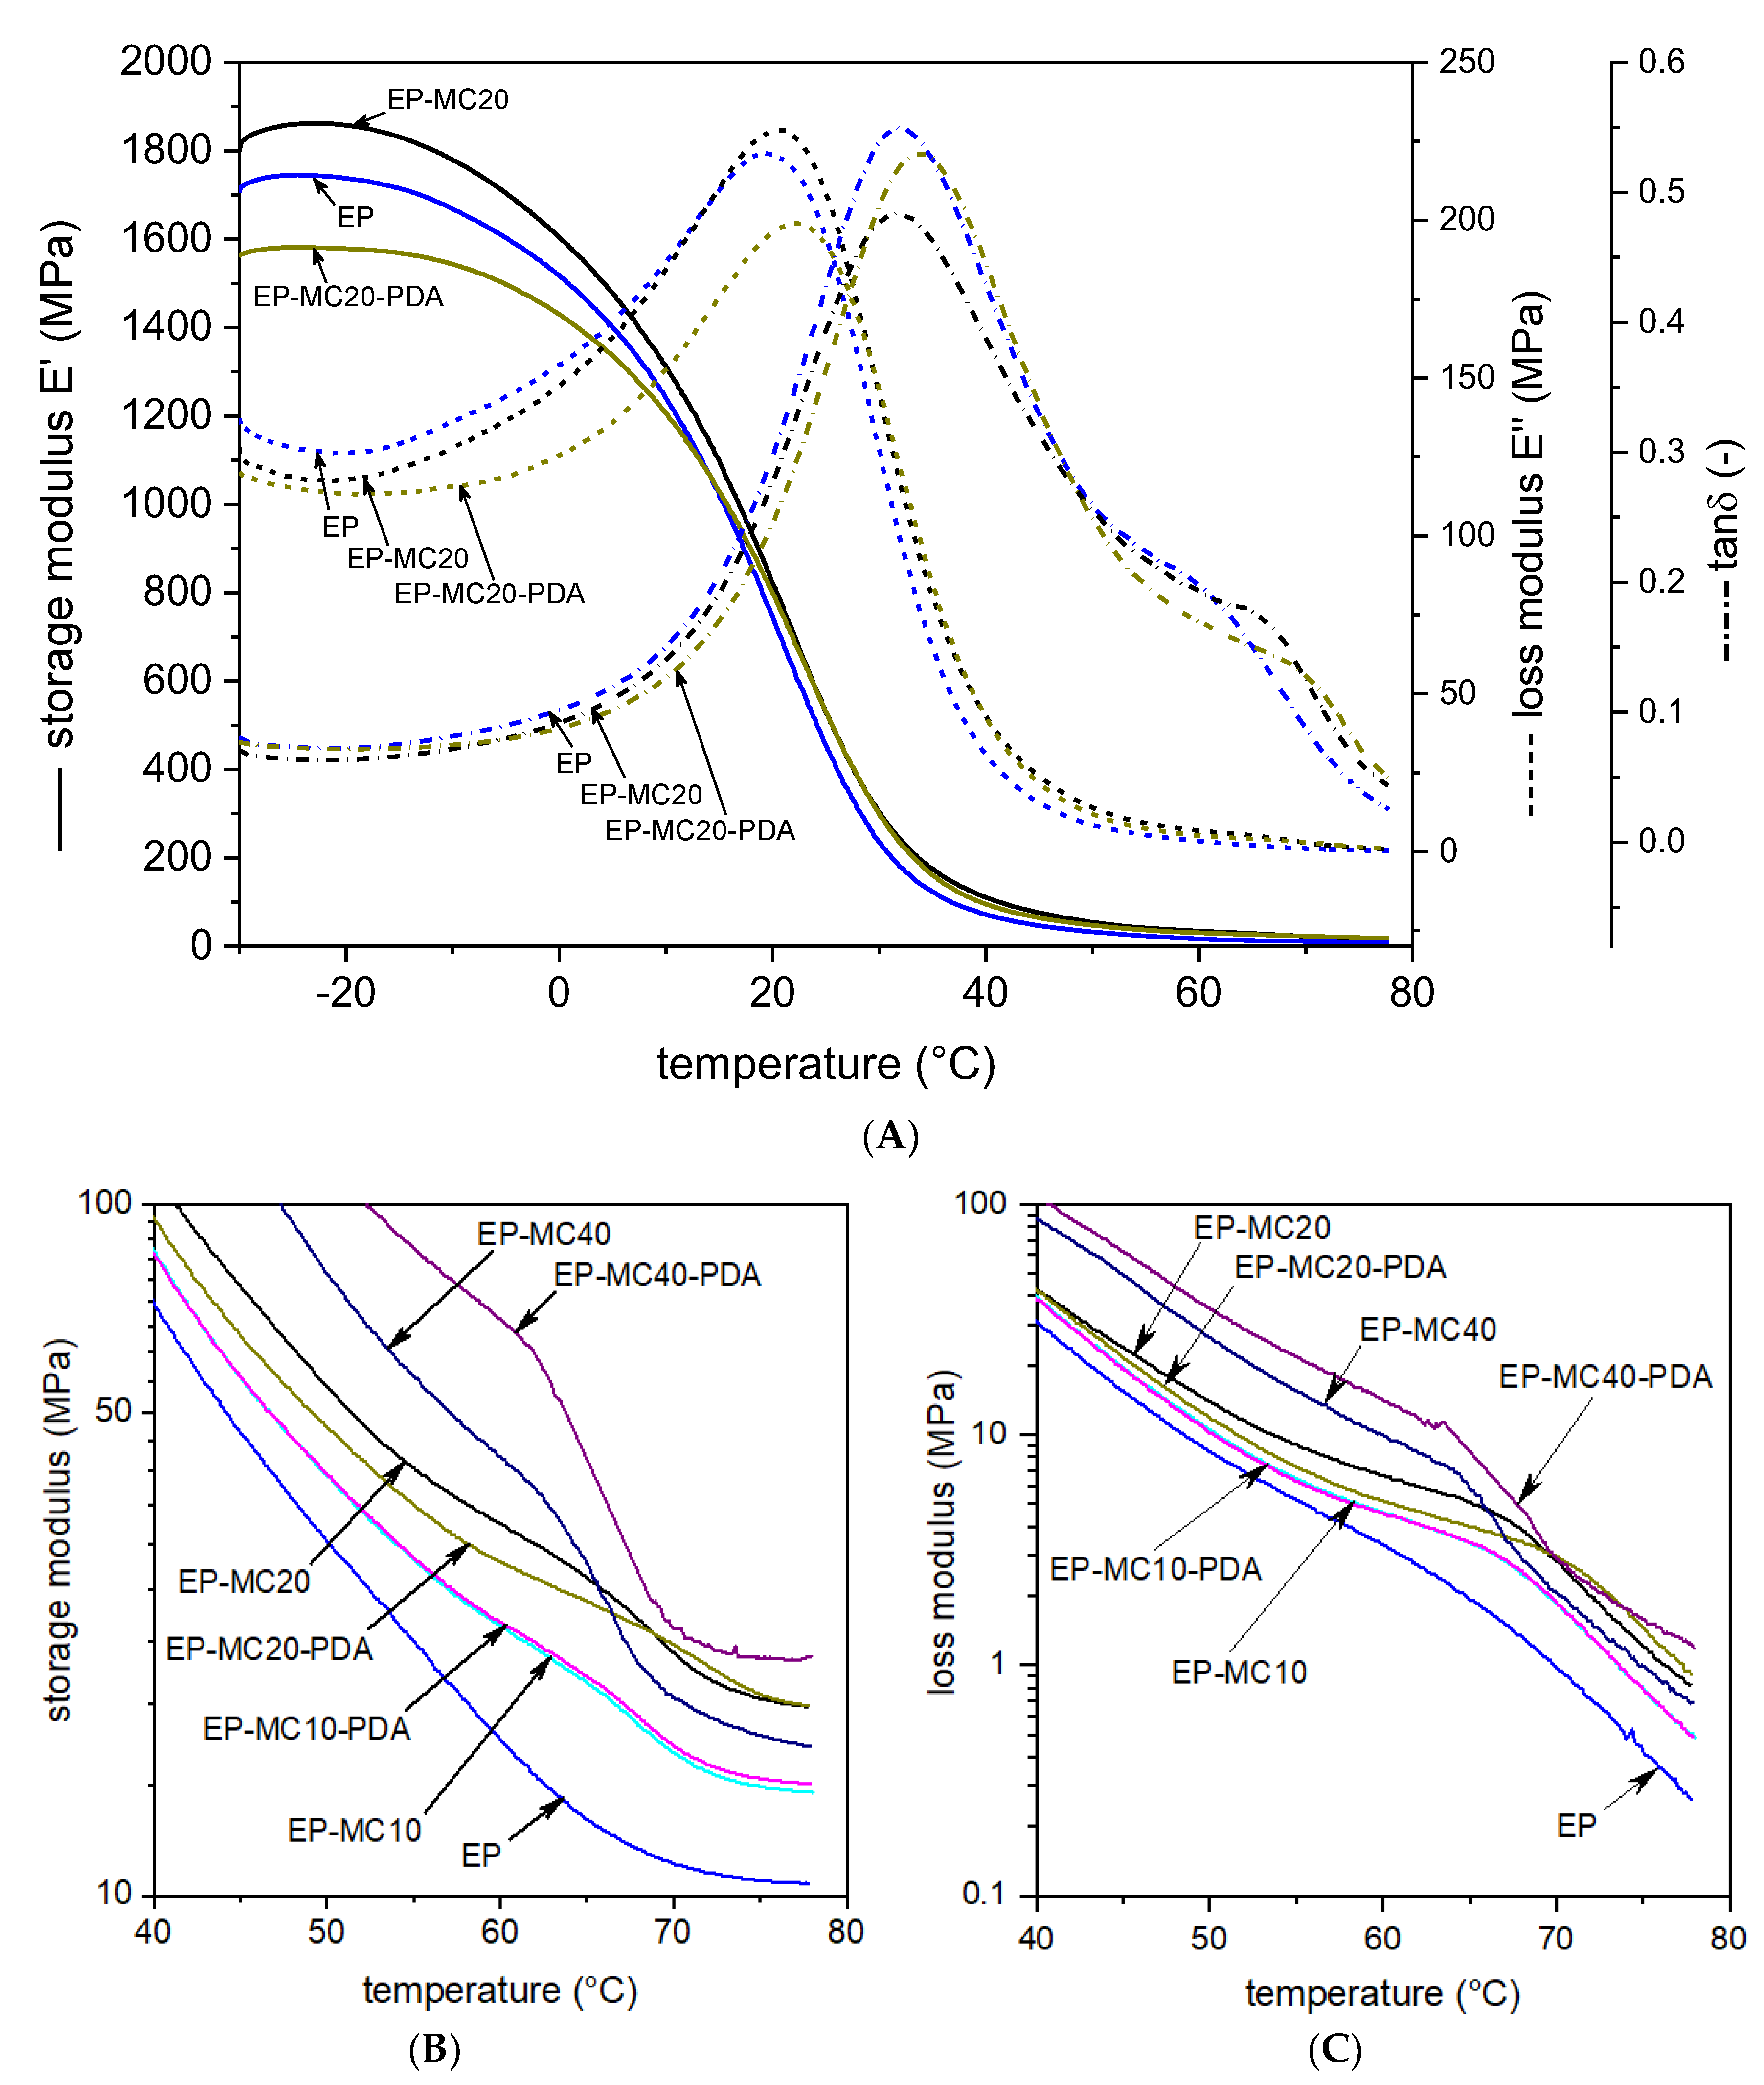
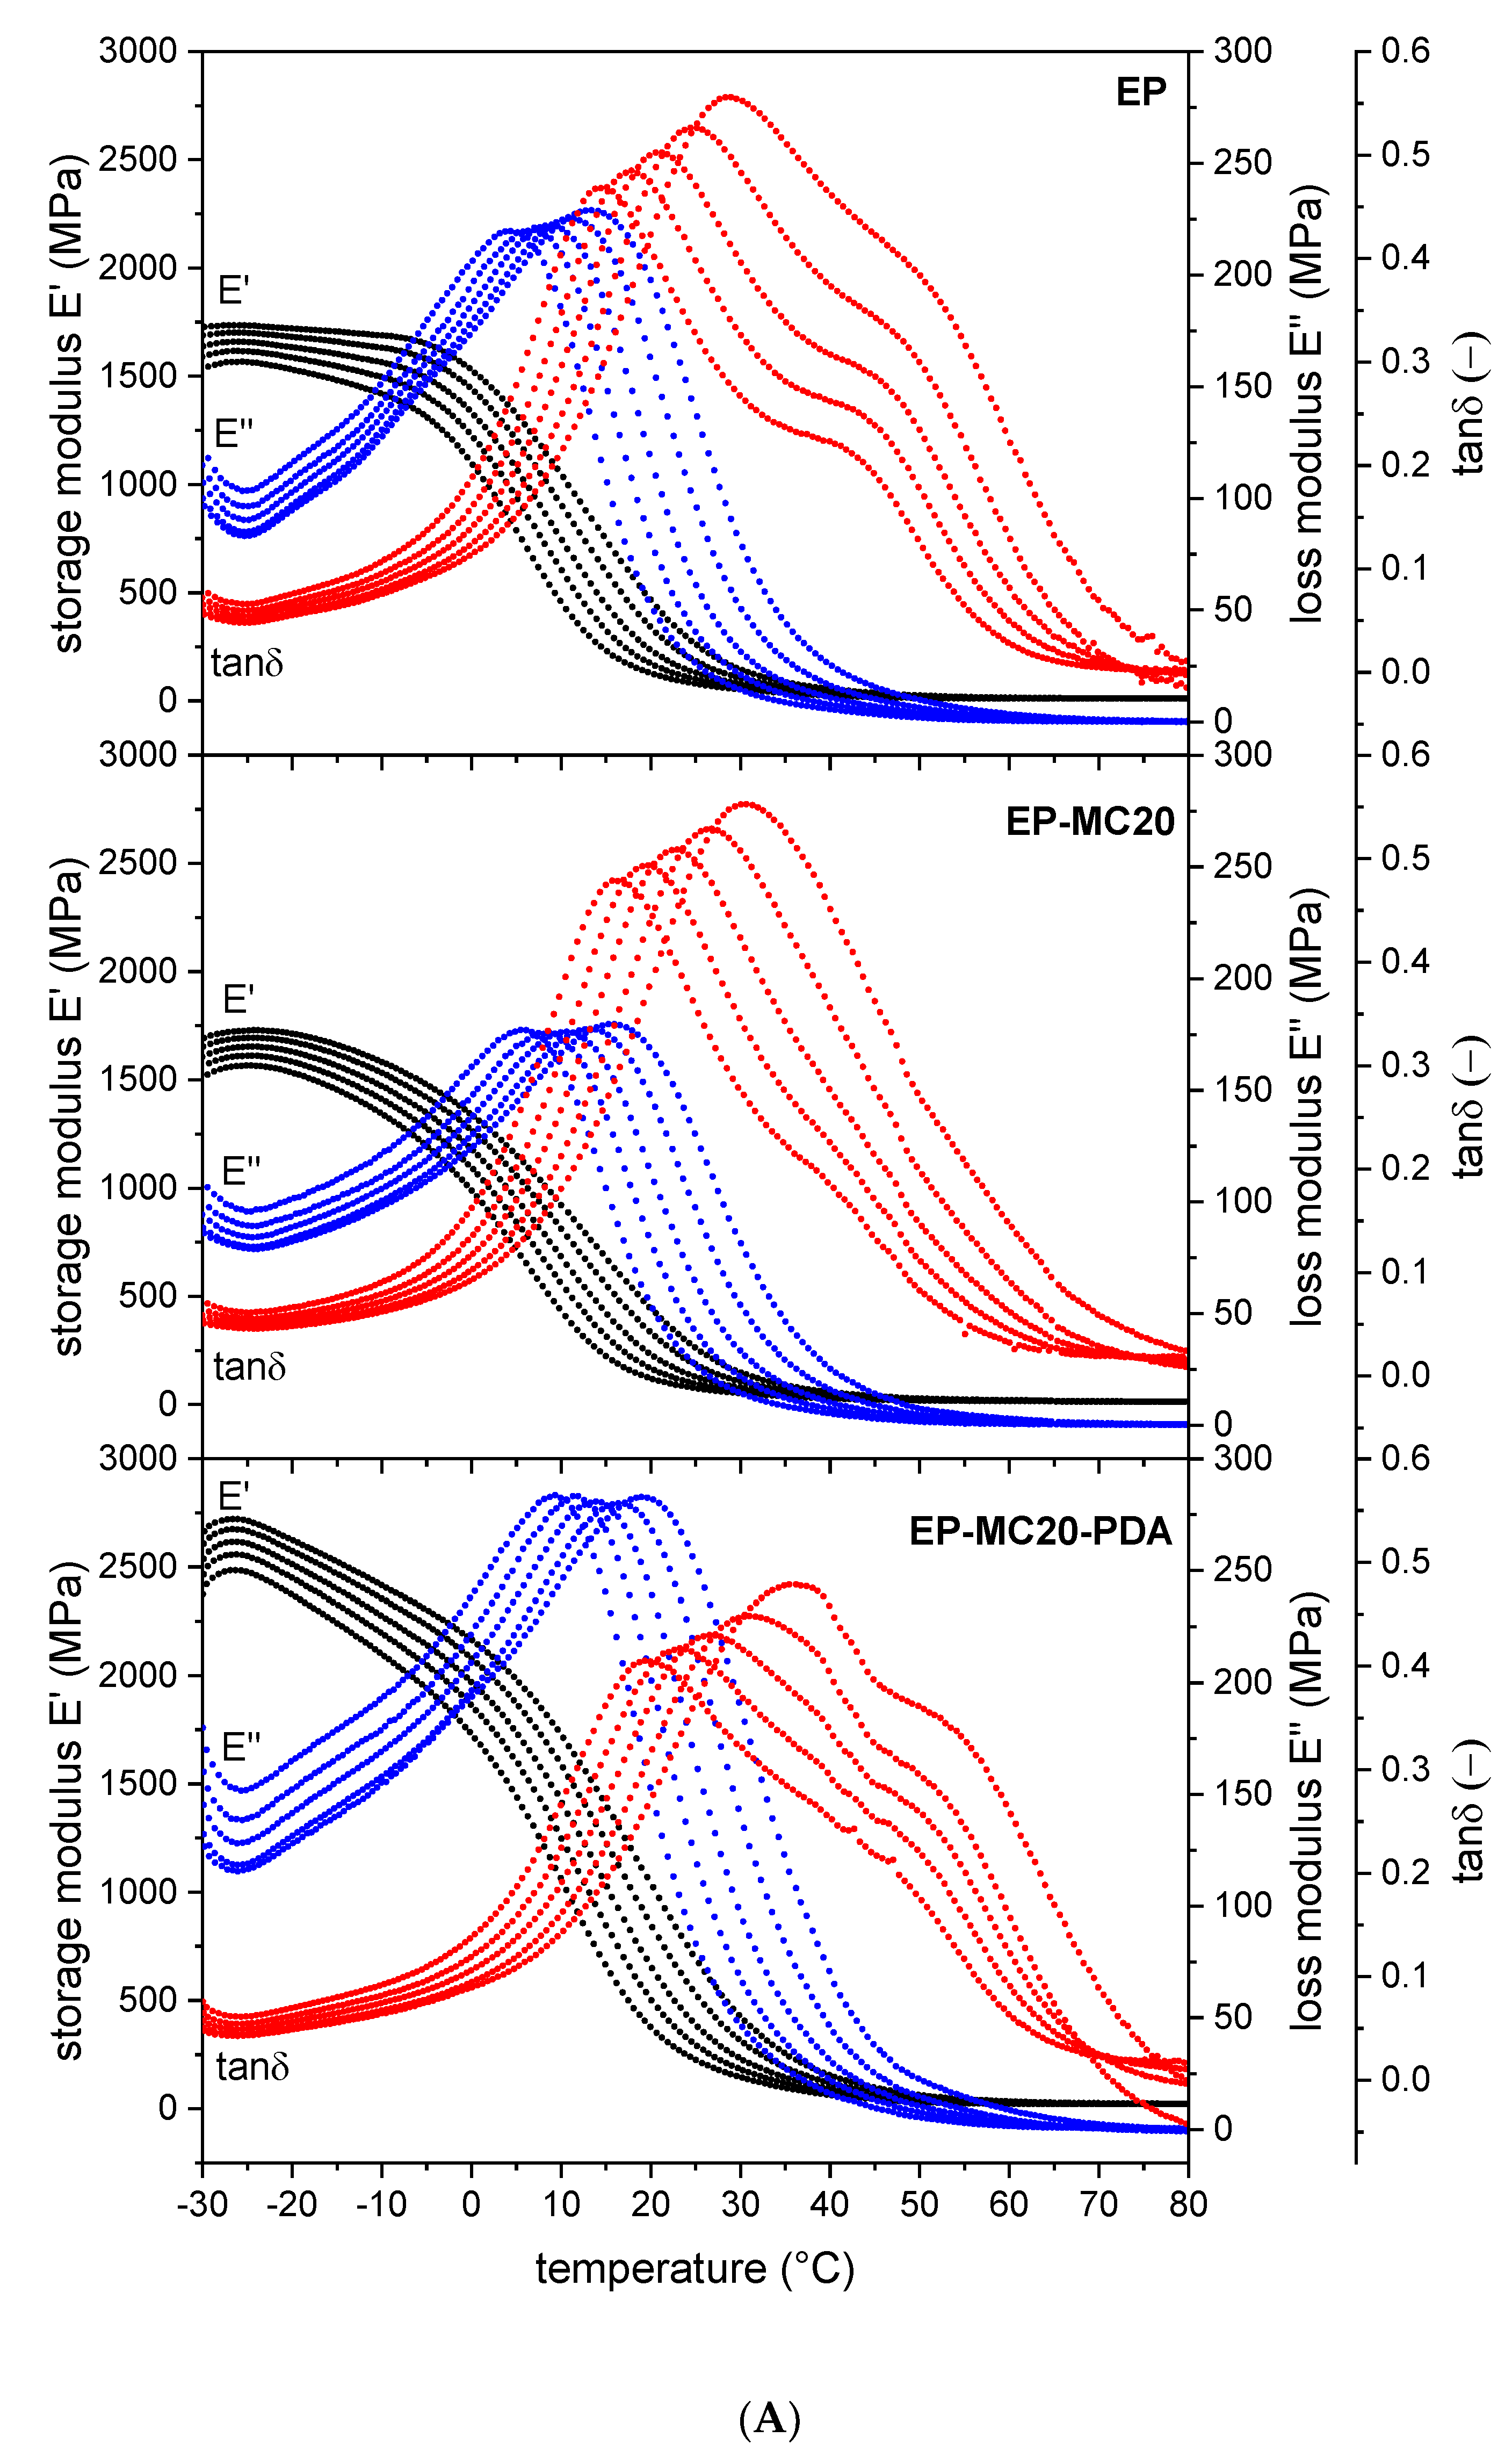
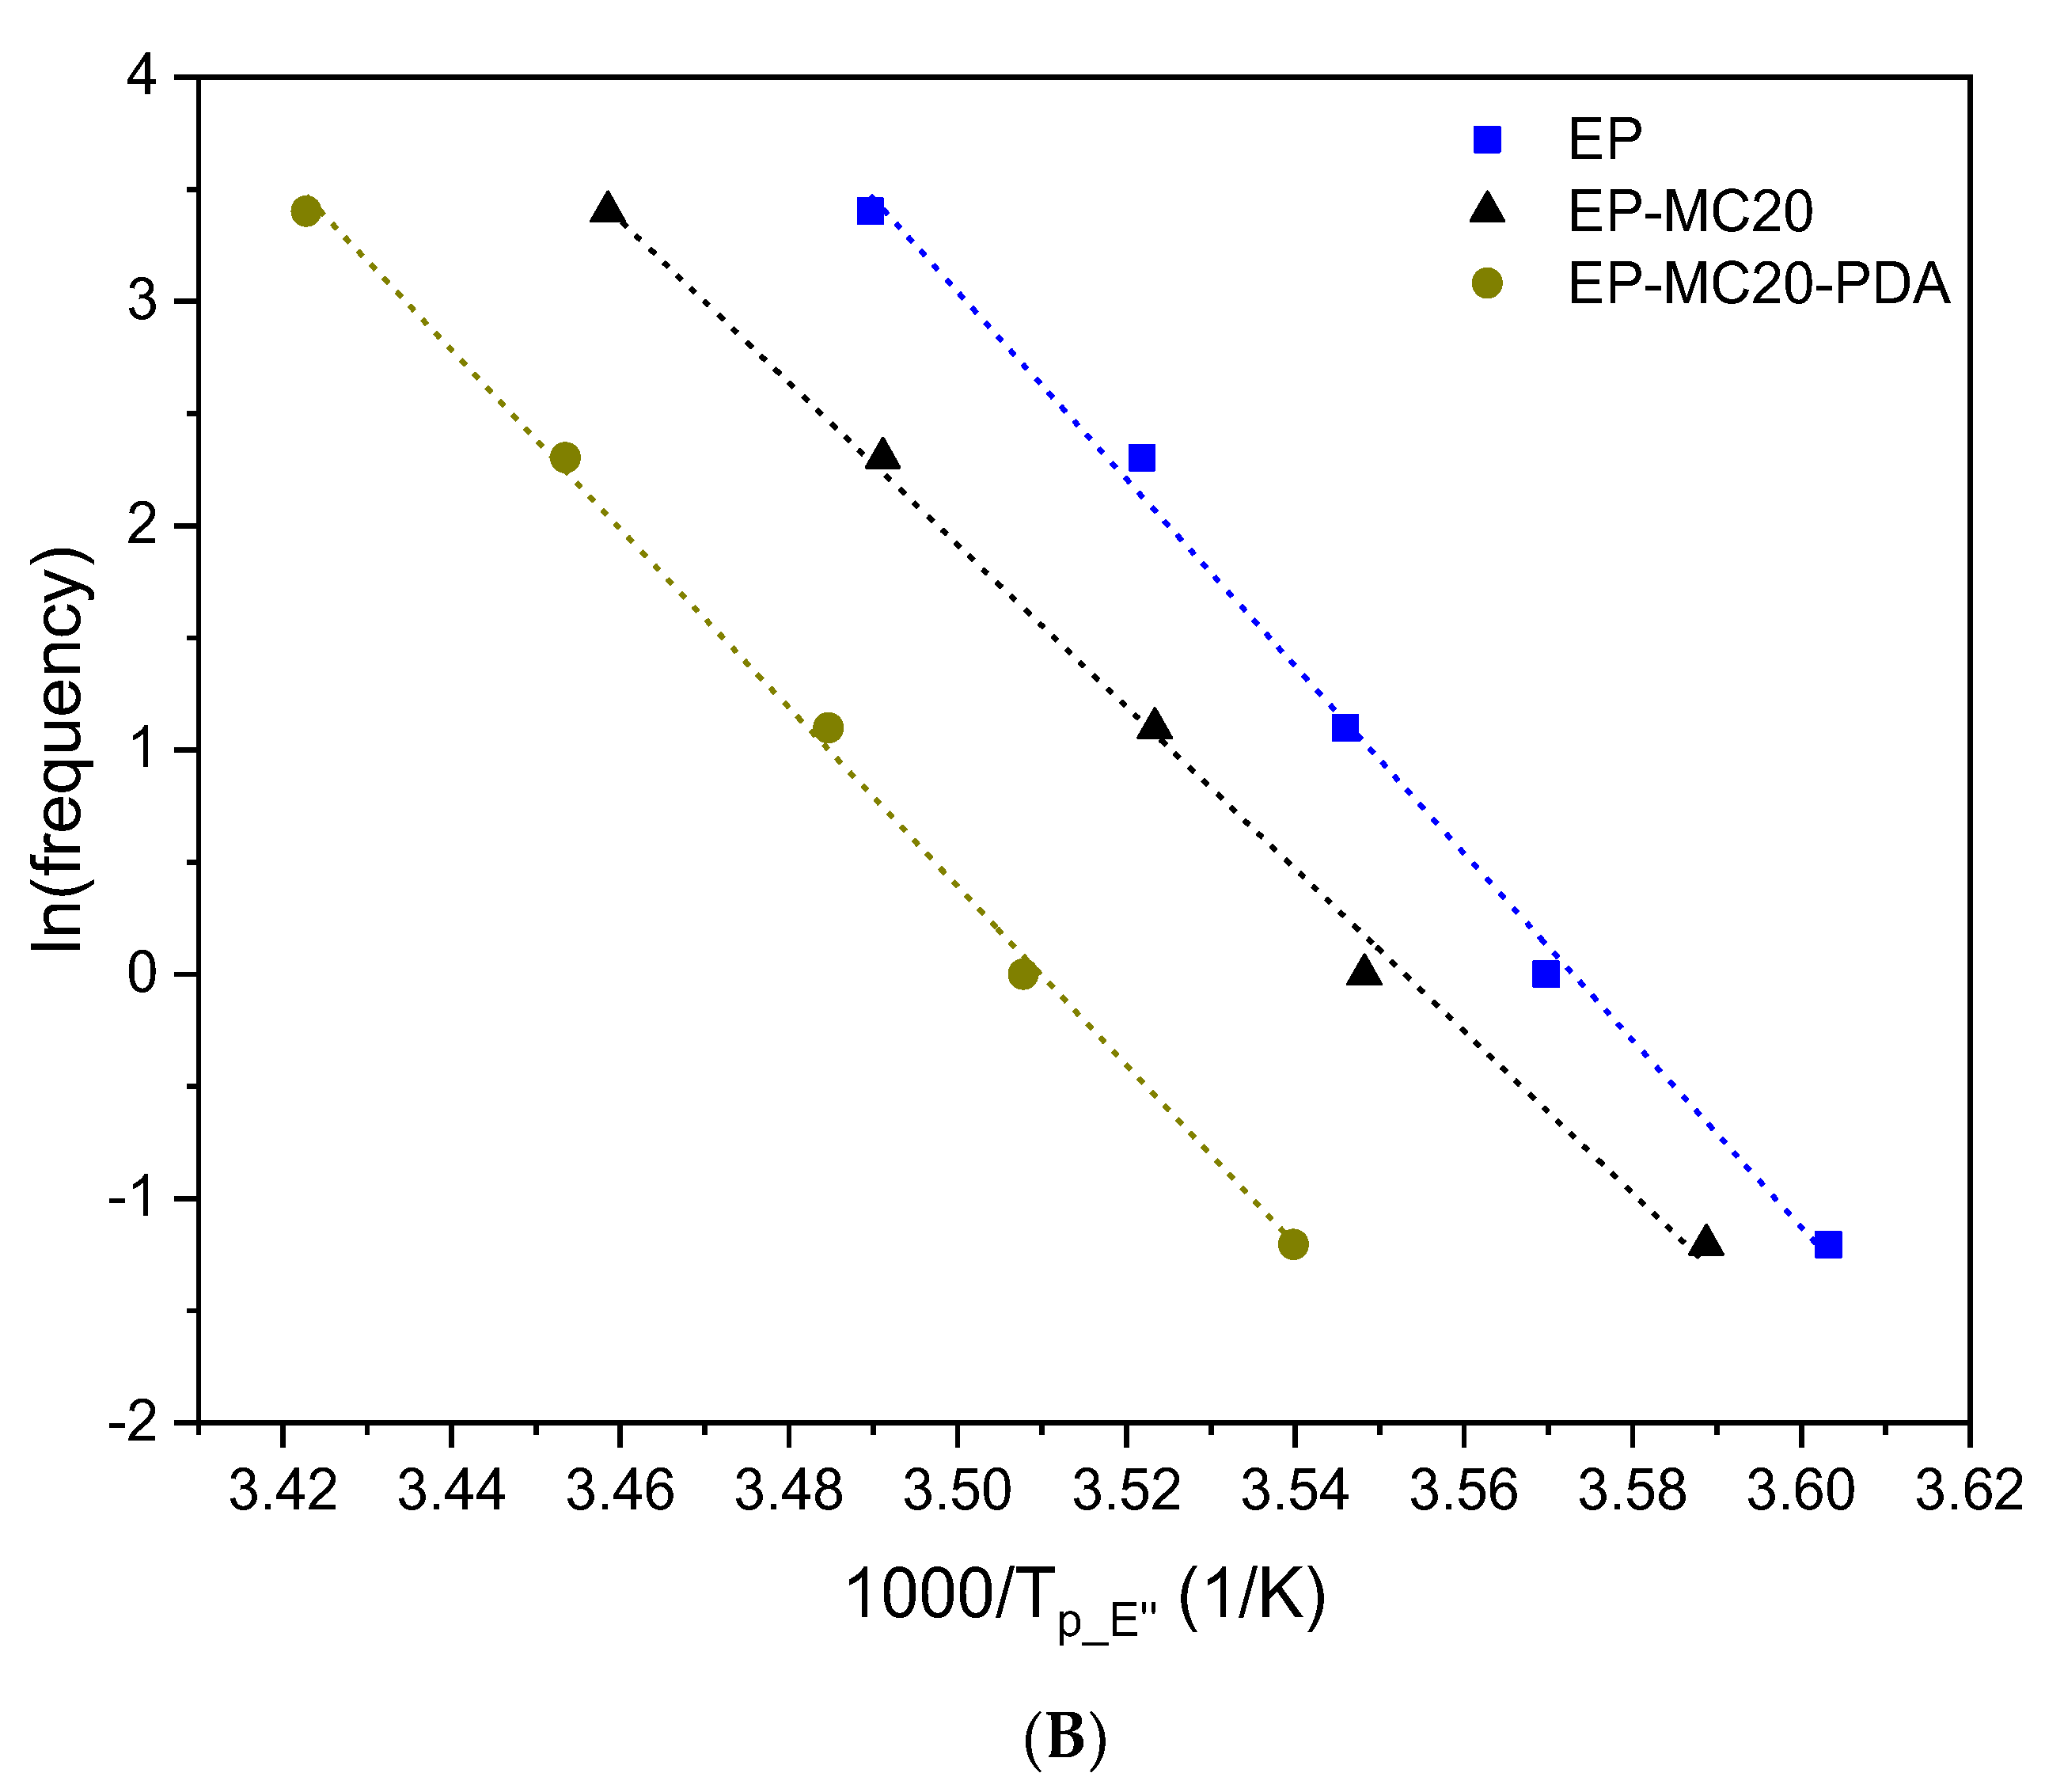
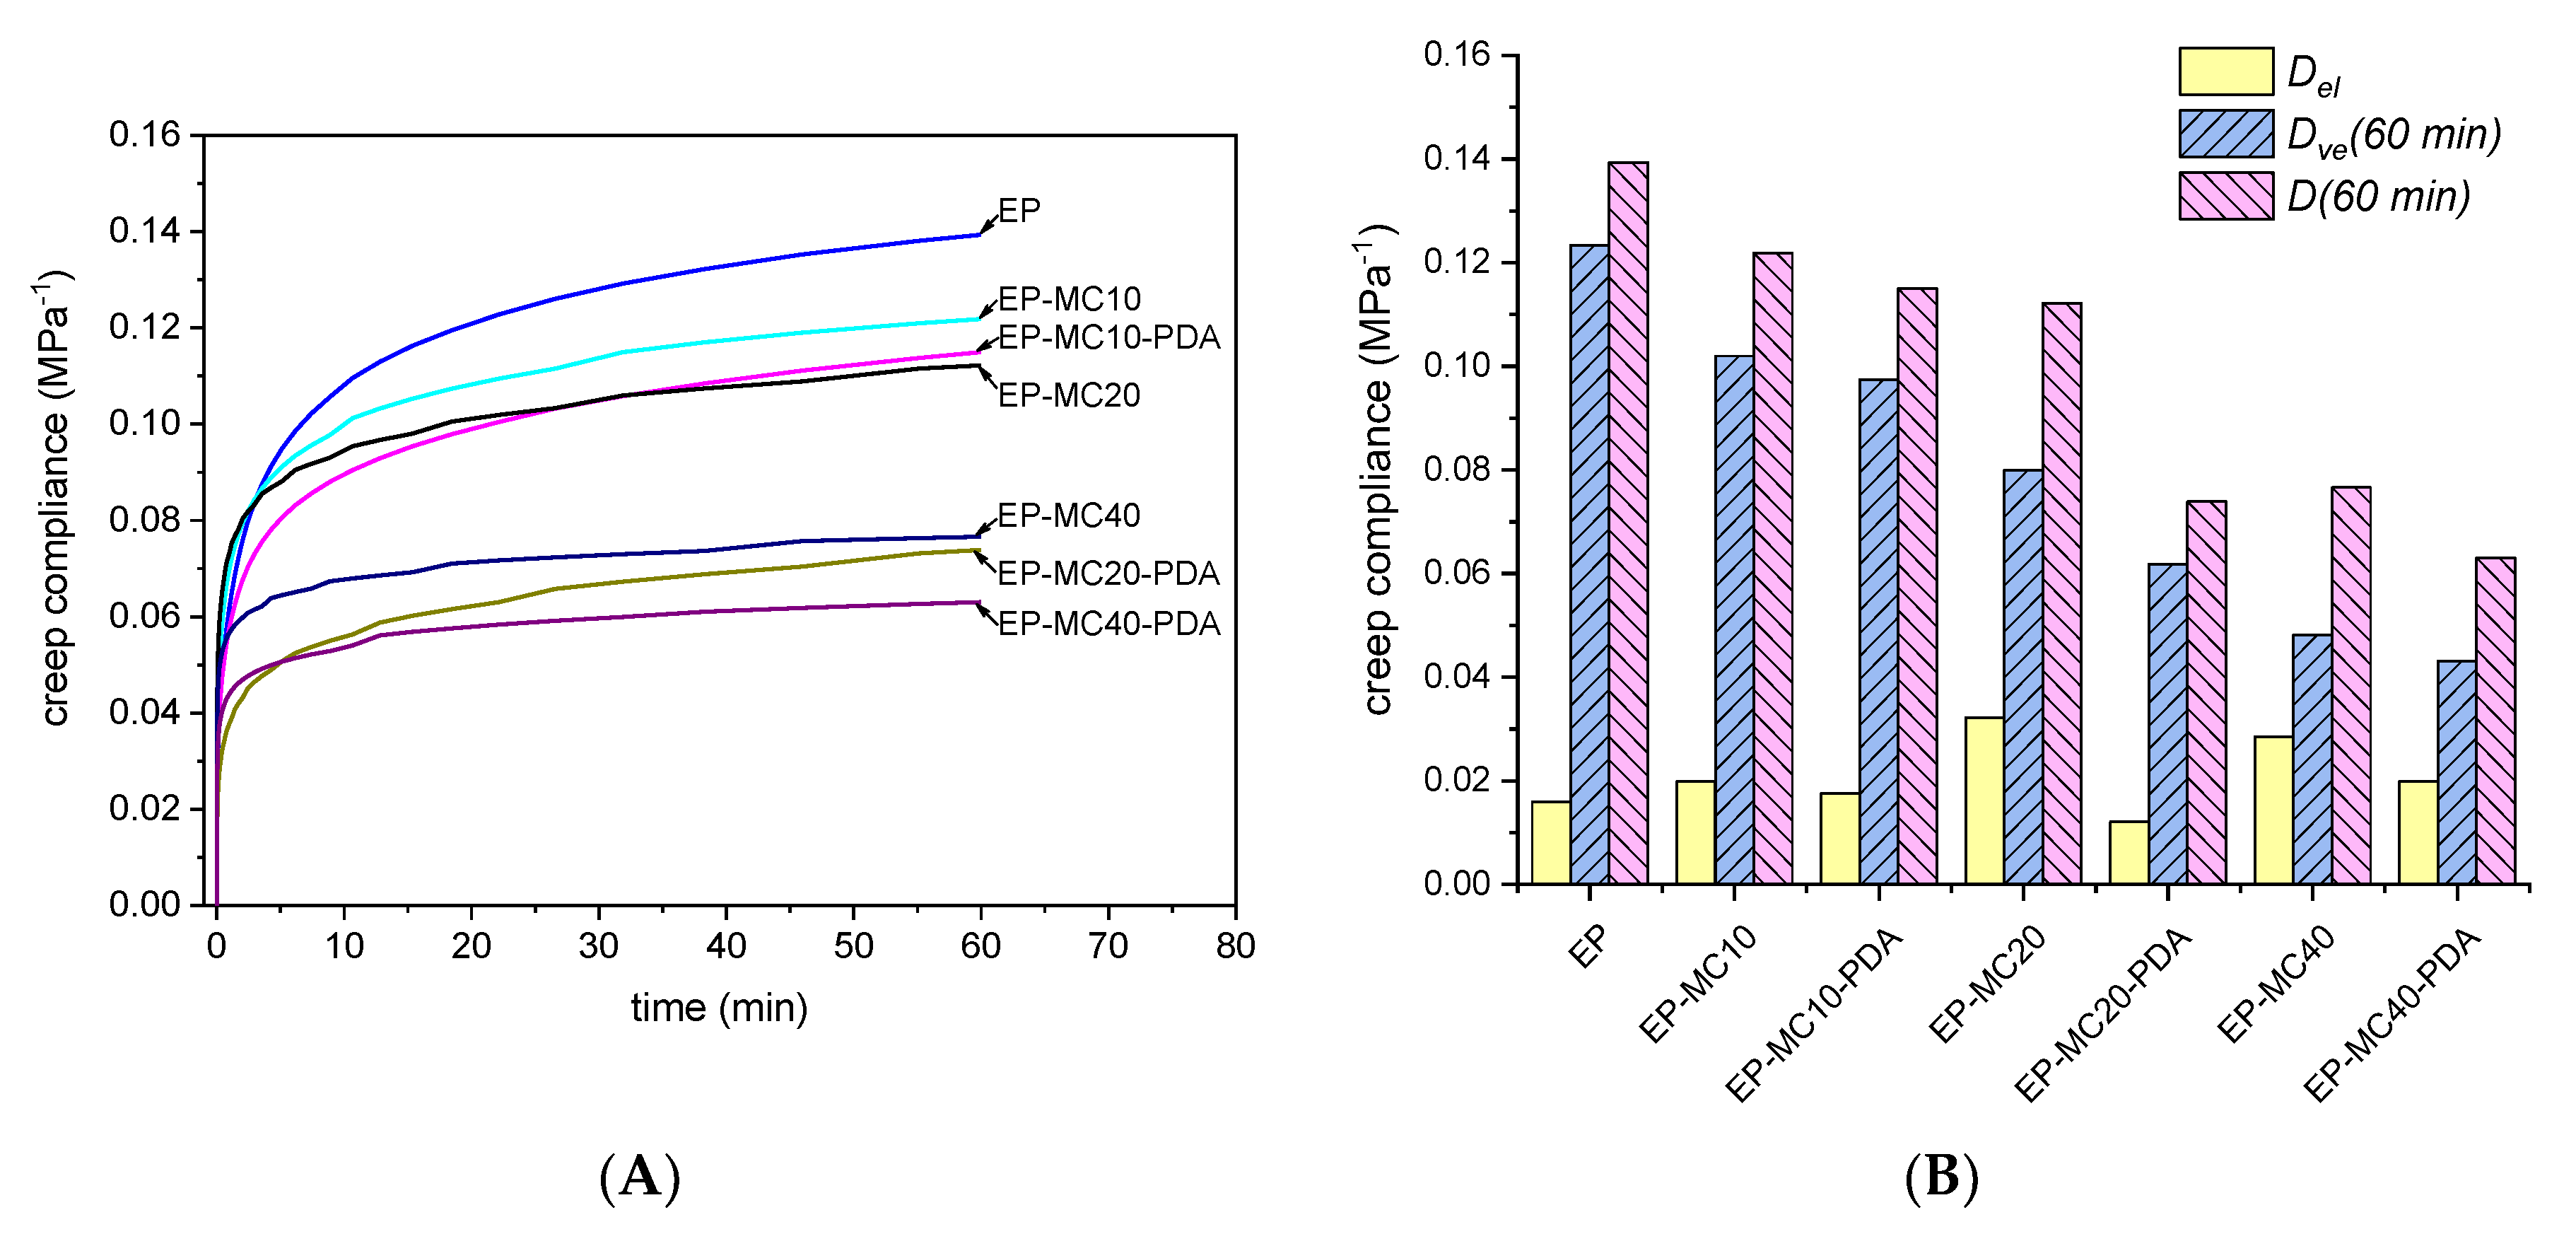
3.2. Thermal and Dynamic Mechanical Properties

Figure 4A,B report DSC thermograms of the first heating scan and cooling scan of neat and PDA-coated microcapsules and prepared composites, while Table 2 summarizes the main DSC results. Although the first heating scan in DSC is affected by the thermal history of the samples, all specimens have been subjected to the same thermal treatments and have been tested at the same time; therefore, the first heating scan is representative of the thermal behavior of the samples and capable of showing differences among the specimens as a function of the MC concentration. Moreover, since these DSC heating/cooling scans are performed at 10 °C/min, considerably higher than the temperature variation rate to which these materials would be subjected in service, the second heating scan is less representative of the effective behavior of the samples than the first. Furthermore, the second heating scan is not substantially different from the first, in terms of transition temperatures and enthalpies.
MC and MC-PDA show an endothermic peak at the core’s melting transition in the first heating scan at approximately 45 °C and the exothermic peak of the reverse (crystallization) transition in the cooling scan at approximately 29 °C. Both transitions for both samples are the superposition of at least two component peaks, which is observable especially in the cooling scan and associated to subsequent thermal transitions. As already described in previous works regarding similar PCMs [33,41,42,43,52], in the heating scan the solid–solid transition from the crystalline phase to the rotator phase RII is followed by the solid–liquid phase change, and analogous transitions are observable in the cooling scan. The DSC thermogram of MC-PDA is similar to that of MC, and since PDA is not subjected to any phase transitions in the investigated temperature range but only the capsule core reversibly melts and crystallizes, it is reasonable to expect that the phase change enthalpy of MC-PDA is lower than that of MC. More specifically, the phase change enthalpy of MC-PDA is 97.8% ± 0.7% of that of MC (mean and standard deviation calculated on Δ H m , Δ H c , and Δ H m _ 2 , reported in Table 2). Assuming that the phase change enthalpy is proportional to the content of microcapsules, this percentage also represents the total MC mass in the MC-PDA sample; therefore, the total PDA mass in the MC-PDA sample is approximately 2.2 wt %. This calculated PDA weight fraction is considerably lower than that calculated for the PDA-coated microcapsules prepared from a highly concentrated DH solution and reported in a previous article of this group (14.3 wt %) [52]. In that case, the enthalpy of the PDA-coated microcapsules was 192.1 J/g, while in this case the reduction in enthalpy due to PDA coating is marginal. This minor enthalpy reduction is reflected in the fact that enthalpy of the EP-MCx-PDA is only slightly lower than that of the EP-MCx composites with the same nominal capsule weight fraction, as reported in Table 2. In any case, all composites containing a PCM exhibit the same endothermic peak of PCM melting in the heating scan and exothermic peak of PCM crystallization in the cooling scan, which are found at approximately the same temperatures.
The epoxy phase is not capable of storing and releasing latent heat, as it does not undergo any melting/crystallization transition, as illustrated in Figure 4A,B. Therefore, the transition enthalpy measured on the composites should be proportional to the nominal amount of MC or MC-PDA. To assess if the phase change enthalpy measured on the composites was close to the theoretical one, a relative melting enthalpy ( Δ H m r e l ) was calculated through Equation (2), as
Δ H m r e l =   Δ H m ω P C M · Δ H m P C M · 100 ,
where Δ H m is the melting enthalpy measured on the composites, ω P C M is the nominal weight fraction of MC or MC-PDA in each composite, and Δ H m P C M is the melting enthalpy of MC or MC-PDA. The resulting relative enthalpy values reported in Table 2 are close to 100%, which indicate that the PCM weight fraction contained in the composites after processing is close to the nominal (initial) fraction, and that the PCM retains its capability of melting and crystallizing also when embedded in this epoxy matrix. Some values of Δ H m r e l are slightly above 100%, but this is probably related to a local concentration of PCM slightly greater than the nominal one. On average, the relative enthalpy of the composites containing neat MC is 99.2% ± 2.9%, which is not significantly different from that of the composites containing MC-PDA, equal to 98.4% ± 1.3%. These data confirm that the PDA-coated microcapsules are not damaged by the production process applied to fabricate the epoxy composites exactly as the neat microcapsules. This is in good agreement with previous studies about neat and PDA-coated microcapsules embedded in an epoxy matrix [38,47,52].
The thermograms of the prepared composites exhibit another thermal transition, i.e., the glass transition of the epoxy resin at approximately 10 °C. To highlight this transition on the thermograms in Figure 4A, the corresponding temperature interval (shaded region) was reported with a magnified scale. The position of the glass transition temperature ( T g ) is not remarkably affected either by the PCM content or by the PDA modification, as reported in Table 2. However, the T g   signals have a small intensity, and it can be difficult to precisely locate the inflection point. Therefore, a more accurate analysis was performed with DMTA (see Section 3.2).
The thermal degradation behavior of the prepared composites was studied through TGA. Figure 5 shows the TGA thermograms of some selected compositions, while Table 3 reports the main TGA results for all the prepared composites. As previously observed [38], the thermal degradation of MC starts with several small steps between 100 and 250 °C, related to the degradation of free paraffin and low-molecular-weight compounds, while the spike in the mass loss derivative signal at approximately 420 °C is related to the rapid degradation of the shell and the abrupt release of the core. This sharp peak, observed also in repeated measurements, is considerably reduced in the MC-PDA thermogram, and the peak position slightly increases from 421 °C to 428 °C, which indicates a modest rise in thermal degradation resistance. The same is observed for the values of T 1 % and T 3 % , while T 5 % slightly decreases, which is probably related to the initial degradation of the PDA coating. Nonetheless, the degradation starts amply above the working temperature intended for these materials, i.e., around the thermal transition of the PCM (25–50 °C).
The degradation of the EP sample involves a broad temperature range, with values of T 1 % at 108 °C and T d at 323 °C. The same degradation trend is observed in all prepared composites, which show a decrease in T 1 % ,   T 3 % , and T 5 % with an increase in the PCM content, for both neat and PDA-coated microcapsules. The PDA coating helps retaining the thermal degradation resistance of the neat EP, as the values of T 1 % ,   T 3 % , and T 5 % are higher for the EP-MCx-PDA samples given the same microcapsule content. The residual mass after the test also increases with the MC weight fraction and is higher for composites containing PDA-coated microcapsules.
Figure 6A shows DMTA thermograms of some representative compositions, i.e., EP, EP-MC20 and EP-MC20-PDA, while the most important DMTA results for all composites are collected in Table 4. For the neat EP sample, the storage modulus E decreases with increasing temperature, especially in the temperature interval between −10 °C and 10 °C, where the material undergoes glass transition. Analogously, the signals of loss modulus E and t a n δ show broad and asymmetric peaks, whose peak temperatures are reported in Table 4 as T p _ E and T p _ t a n δ , respectively. In these thermograms, an additional transition can be appreciated as a high-temperature shoulder of the main peak, which could be attributed to chain motions in the rubbery state and associated to the normal-mode (n-mode) relaxation, as described in previous works [56]. The samples EP-MC20 and EP-MC20-PDA exhibit a similar trend. More specifically, there is no remarkable additional signals related to the melting of the PCM at approximately 45 °C, which was instead observed in a previous work on the same MC embedded in a high- T g epoxy resin [39]. In that work, the melting phase change was evidenced by a remarkable decreasing step in E and peak in E and t a n δ at approximately 40–50 °C, while at that temperature the epoxy matrix was still in the glassy state ( T g = 95 °C). In the present work, the dynamic mechanical glass transition of the EP matrix and the PCM melting occur at relatively close temperatures. However, a small additional contribution can be appreciable by plotting E and E on logarithmic y axes, as shown in Figure 6B,C. This small contribution is not present for neat EP and is increasingly evident for increasing PCM concentrations; therefore, it is likely related to the PCM melting. The fact that the decreasing step in E is small may indicate that the material’s stiffness is not considerably affected by the PCM melting, which is desirable for the intended application.
The contribution of the microcapsules can be also observed in a general increase in E with the PCM weight fraction, as observable from the values of E at 25 °C (room temperature) and 60 °C (above T g ) reported in Table 4. The same is true also for the values of E at −20 °C (below T g ), though to a lower extent. These values are generally slightly higher for the EP-MCx-PDA composites at the same amount of PCM. For example, the value of E 60   ° C is 16.8 MPa for EP, 43.0 MPa for EP-MC40 (+256%), and 68.1 MPa for EP-MC40-PDA (+405%), which indicate that the microcapsules help to retain some of the mechanical stiffness also above the T g of the EP phase and the T m of the paraffinic core. Moreover, the peak temperatures of E and t a n δ (Table 4) generally increase with the PCM content, which indicate that the glass transition of the EP phase is shifted to higher temperatures. The introduction of a filler with surface functionalities able to react with oxirane groups might affect the stoichiometry of the host epoxy resin, since oxirane groups could be depleted, thereby leaving amine groups of the hardener partially unreacted. If this happens, the stoichiometry of the system is shifted away from the optimum value that coincides with maximum T g [57], thereby counterbalancing the filler-related restriction in molecular mobility that would instead increase the T g . This effect is commonly observed in polymer matrices containing nanofillers with a reactive surface [57]; in these systems, the extensive surface area remarkably affects the T g , which increases when reduced molecular mobility dominates (generally for volume fractions of nanofiller below a certain threshold) and decreases when the stoichiometry is displaced too far from the optimum balance. In the case of the present system, the addition of a filler in the micrometric range with a reactive surface does not remarkably modify the T g , likely due to the fact that the total surface area is too low to influence the stoichiometry of the system considerably. However, the slight T g increase may suggest a reduction in molecular mobility, and this effect is more evident with PDA-modified capsules due to an increased interfacial interaction. Moreover, as thoroughly explained in [52], dopamine undergoes oxidative polymerization during deposition, and the resulting polydopamine has a complex structure, in which most of the primary amino groups are transferred to secondary amino groups or cyclic structures with a drastically reduced or disappeared reactivity against oxirane rings. Only polymeric substructures containing primary and secondary amino groups as well as self-assembled oligomers or remaining monomers are assumed to react.
To further investigate the contribution of the PCM on the dynamic mechanical behavior of the EP phase, multifrequency DMTA was performed on some selected compositions, i.e., the samples EP, EP-MC20, and EP-MC20-PDA. The results of these tests are reported in Figure 7A,B and Table 5. For all samples, the increase in frequency determines a shift of all viscoelastic parameters to higher temperatures, and this effect is more evident at the T g of the EP phase. These tests allowed the calculation of the activation energy of the glass transition from the E peak temperatures. As reported in the seminal book of John D. Ferry [58], a linear trend can be established between the logarithm of the test frequency and the inverse of absolute temperature of various transition peaks of amorphous polymers, such as the alpha, beta, gamma, delta, and epsilon transition peaks of polystyrene. This holds for relaxation measured with mechanical, dielectric, and nuclear magnetic resonance (NMR) tests. The authors are also aware that the traditional Arrhenius approach may not be the most suitable to fit these experimental data, and that the authors of some works in the literature (e.g., [59]) proposed modified Arrhenius equations to fit the experimental data more accurately. However, in the present work, the values of activation energy found with these approaches lead to the same conclusions as those reported here, and a precise and accurate calculation of the activation energy for these systems is not the main goal of this work.
The results of this analysis, presented in Figure 7B, confirm that the T g is higher for the samples containing microcapsules and show that E a   slightly decreases with the addition of PCM, unlike what was reported previously for a high- T g epoxy containing the same microcapsules [39]. However, the calculated values of E a are not remarkably different from one another.

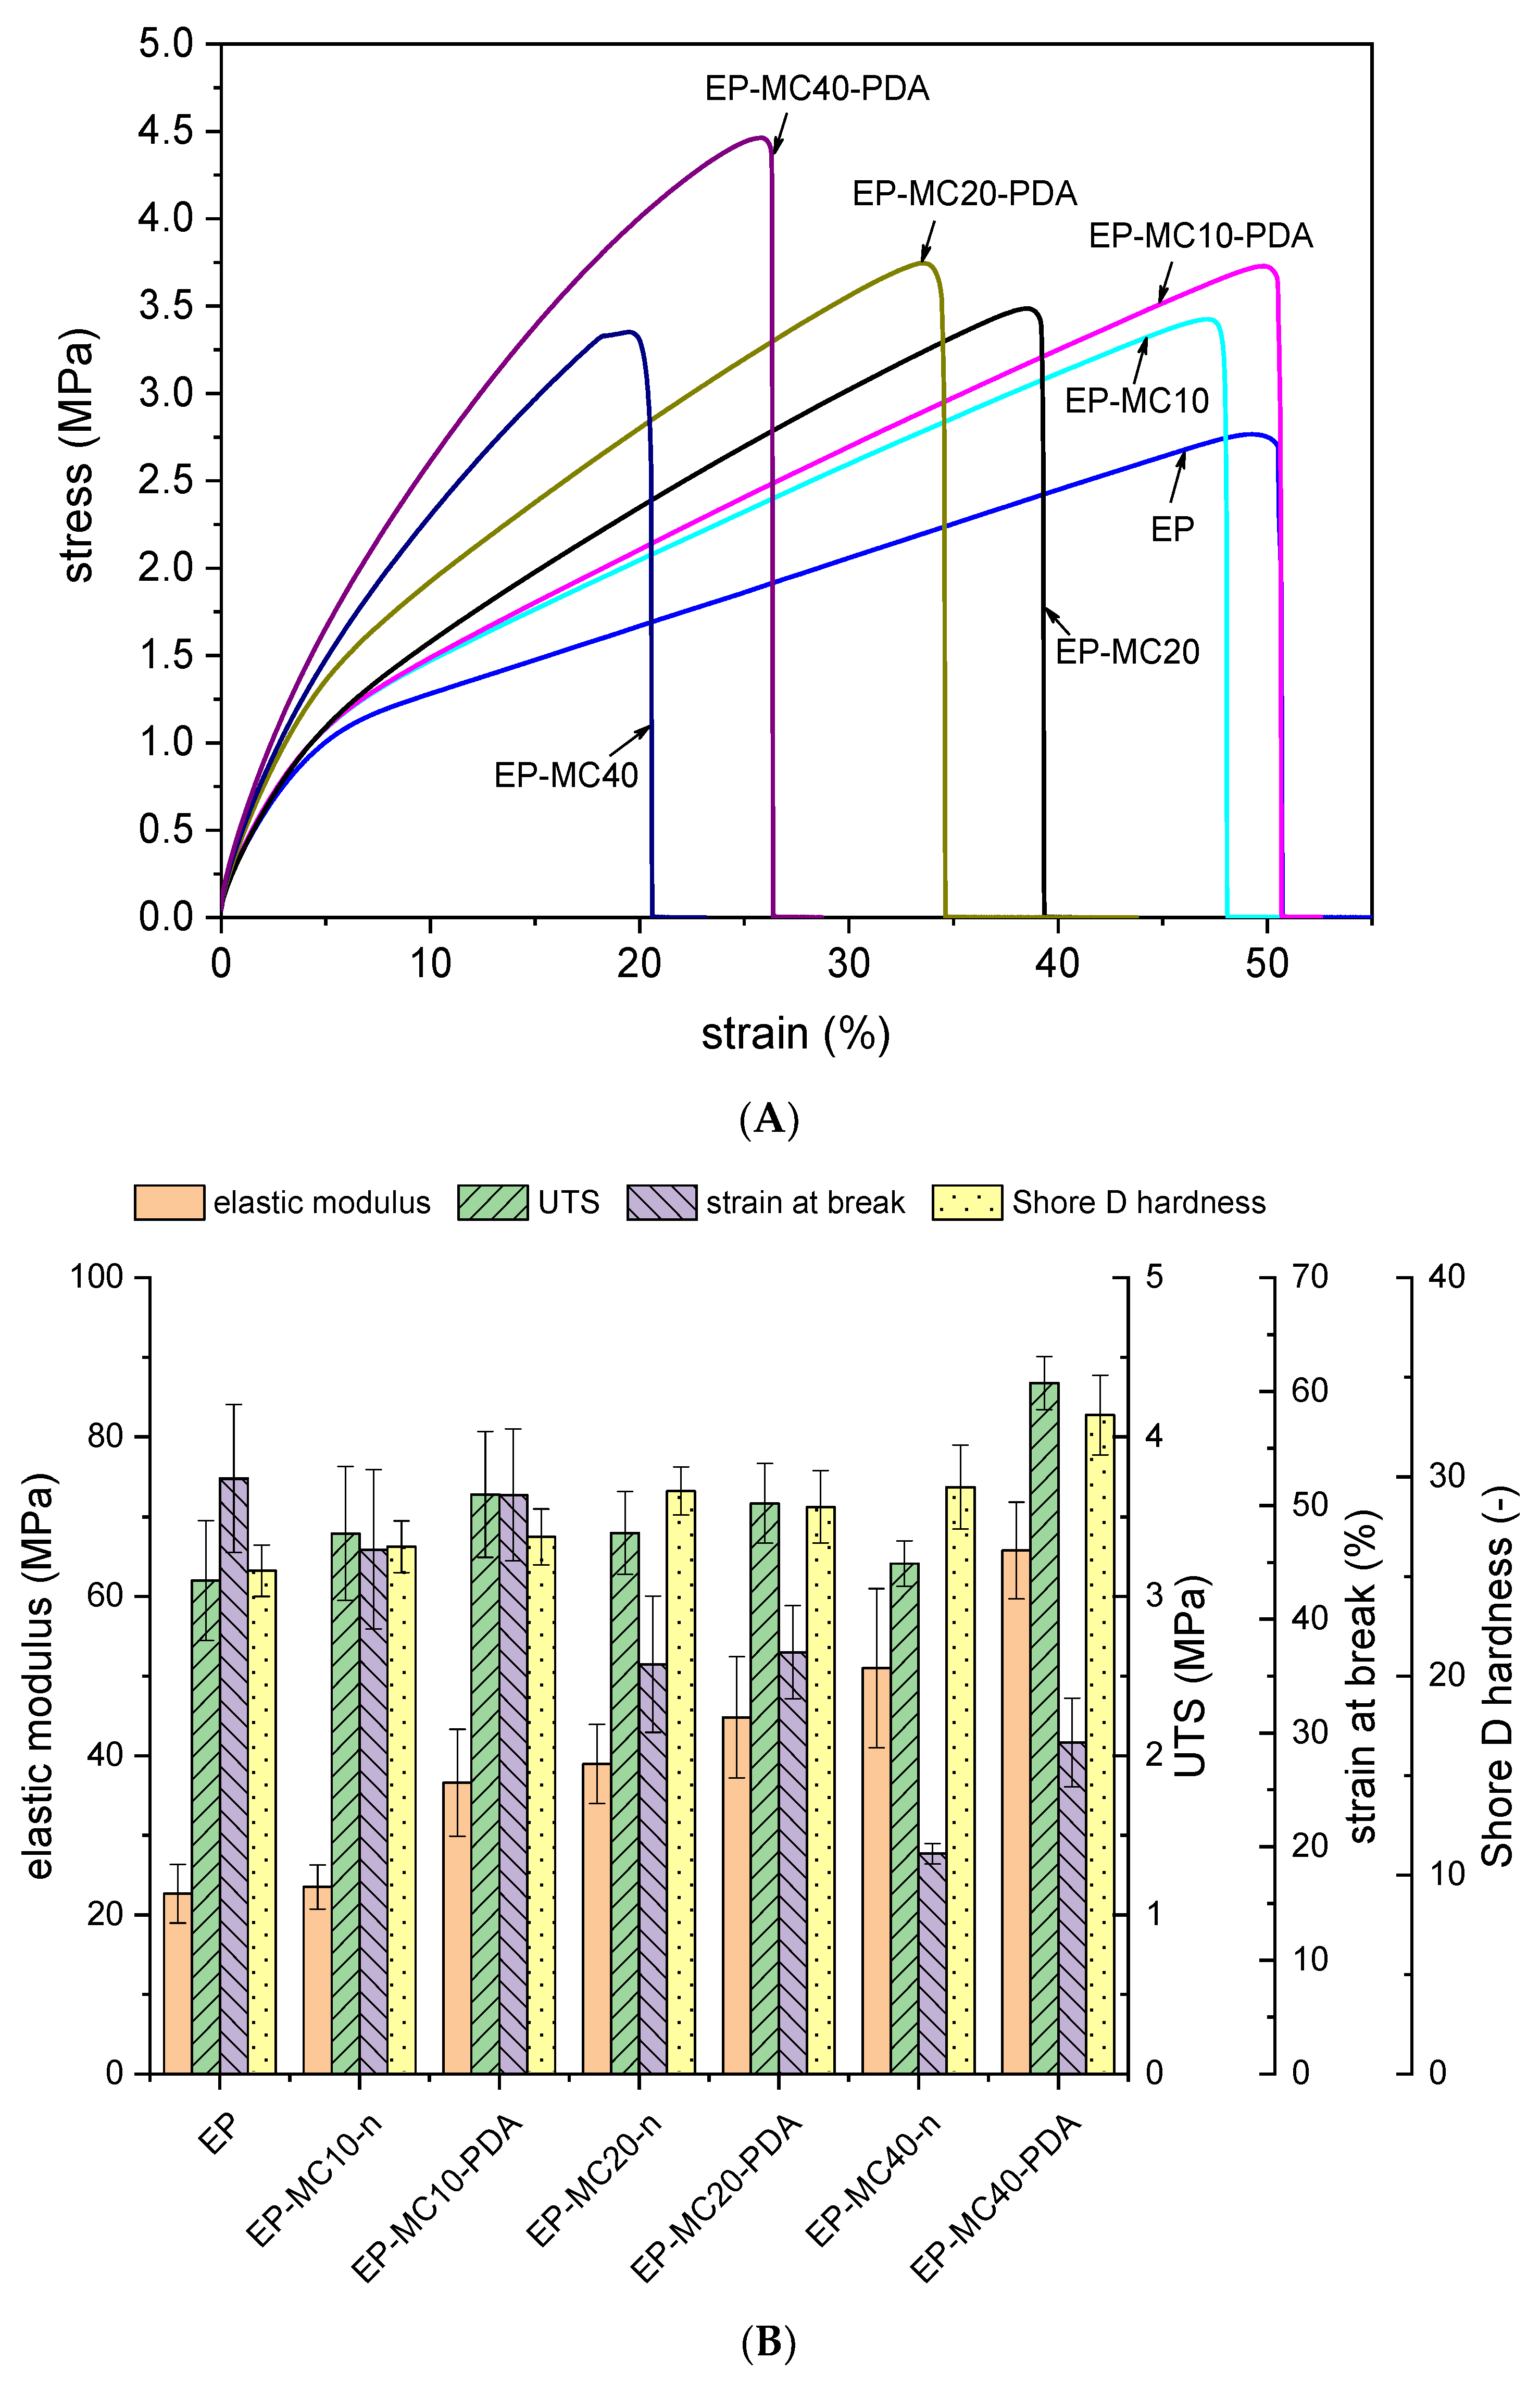
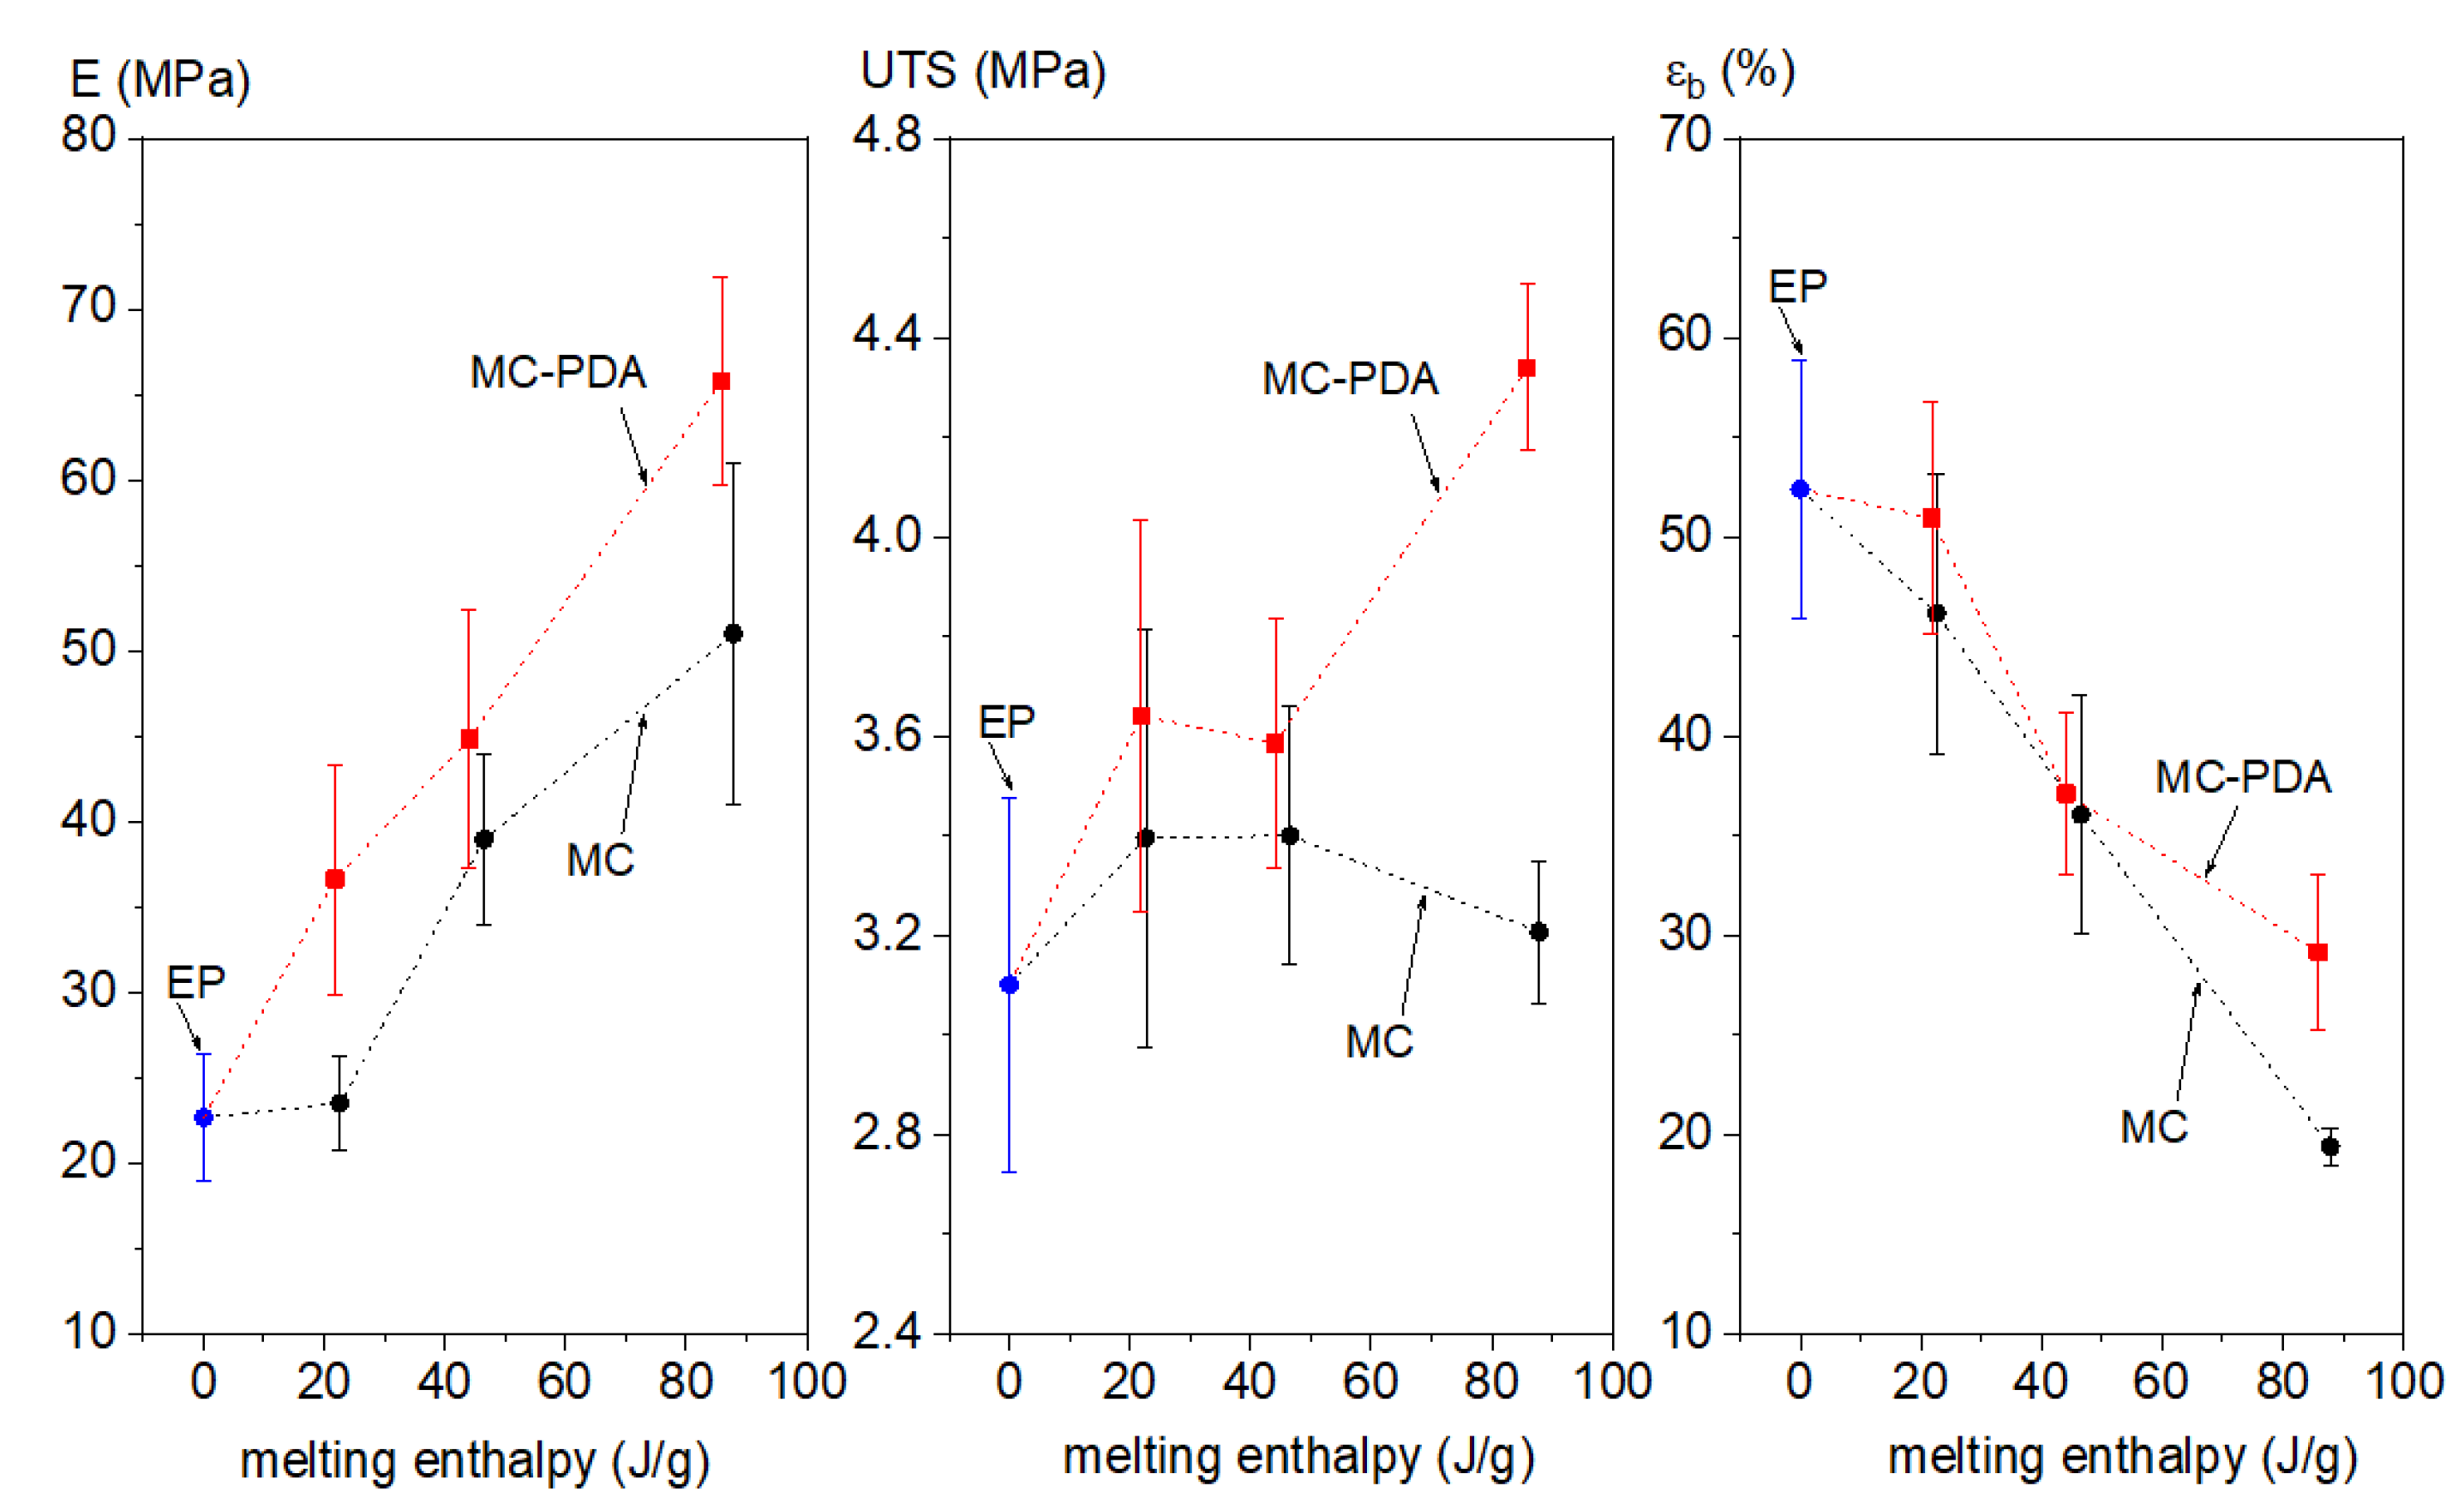
3.3. Mechanical Properties

Lastly, this work investigates the effect of neat and PDA-coated microcapsules on the short- and long-term mechanical properties of the host EP matrix. Figure 8A,B show representative tensile stress–strain curves and the main results of tensile and Shore D hardness tests. The stress–strain curve of EP exhibits an initial steep region followed by a change in slope at a strain of approximately 5%, while the second part of the curve is less steep and nearly linear until fracture. The PCM-containing composites show a similar trend. Fracture occurs at large deformation values (from 20% to 55% depending on the composition), but fracture surfaces are smooth and exhibit no signs of plastic deformation, as already observed in Figure 2.
The introduction of microcapsules increases the stiffness and strength of the composites and impairs their ductility, as demonstrated by an increment in E and U T S and a reduction of ε b with an increase in the PCM content. Considering the same PCM fraction, the composites containing PDA-coated capsules show a higher elastic modulus and higher stress and strain at break compared to the composites with uncoated capsules. The same trend can be observed for the Shore D hardness values, also reported in Figure 8B. This suggests that the PDA coating positively contributes to the stiffness of the composites and help to retain the pristine deformability, and this occurs likely due to an increased interfacial adhesion. Therefore, even though MC-PDA has a slightly lower melting enthalpy than MC, this is compensated by their contribution to the mechanical performance of the composites, as illustrated in Figure 9, which reports the tensile properties as a function of melting enthalpy for the prepared composites. This implies, in this case, that the introduced PCM is a truly multifunctional filler that is able to enhance both mechanical performance and thermal management properties. Moreover, the decrease in strain at break is nearly marginal for PCM fractions up to 20 wt %, which suggests that the composition must be tuned to obtain the optimal set of properties according to the specific application.
The introduction of microcapsules also improves long-term mechanical performance, as proved by creep tests; this is useful to investigate the material behavior where the component is subjected to prolonged load and must retain dimensional stability. Figure 10A,B show representative creep compliance curves as a function of time and the main results of the creep test.
The total creep compliance as a function of time in the linear viscoelastic region ( D ( t ) ) can be seen as the sum of an elastic component, which is instantaneous and reversible ( D e l ) , and a time-dependent viscoelastic component ( D v e ( t ) ), as represented in Equation (3) [60]:
D ( t ) =   D e l + D v e ( t )
The introduction of microcapsules evidently improves the creep behavior of the host matrix. A higher MC content corresponds to a lower total compliance at the end of the creep stage, D ( 60 m i n ) , and also to lower values of D v e ( 60 m i n ) , determined as the difference between D ( 60 m i n ) and D e l , as illustrated in Figure 10B. It can also be seen in this case that the creep performance of EP-MCx-PDA composites overcomes that of EP-MCx composites at the same microcapsule weight fraction, as evidenced by lower values of D e l , D v e ( 60 m i n ) , and D ( 60 m i n ) .

4. Conclusions

In this work, flexible epoxy composites containing different amounts of neat and PDA-modified PCM microcapsules were produced and characterized. SEM analysis showed that the surface of PDA-coated microcapsules was rough and with a globular appearance, and that the PDA layer increased the adhesion with the surrounding epoxy matrix. The PDA deposition parameters were successfully tuned to obtain a thin PDA layer with a thickness of 53 ± 8 nm and a total PDA mass of only 2.2 wt %, considerably lower than those obtained in previous works. This accounted for the fact that the phase change enthalpy of MC-PDA was only slightly lower than that of the neat MC, being 221.1 J/g and 227.7 J/g, respectively. DSC tests also highlighted that the phase change enthalpy increased with the PCM content (up to 87.8 J/g for the composite EP-MC40) and that the enthalpy of the composites containing PDA-coated microcapsules was not remarkably lower than that of the EP-MCx composites. DMTA analysis evidenced a decreasing step in the storage modulus of all composites at the glass transition of the EP phase and a small additional signal was detected as a high-temperature shoulder of the main T g peak, attributed to PCM melting. The presence of MC positively contributed to the storage modulus both at room temperature and above T g , and this effect was more evident for composites containing PDA-coated microcapsules. The contribution of the PCM was also remarkable for the mechanical properties of the host EP matrix, as they promoted an increase in elastic modulus (up to +195%) and tensile strength (up to +42%). Shore D hardness also increased (up to +36%) and the creep compliance decreased with an increase in the PCM weight fraction; this effect was more evident for composites containing PDA-coated microcapsules due to the enhanced interfacial adhesion. Therefore, this PCM is a truly multifunctional filler for this matrix, able to increase both the mechanical performance and the thermal management properties. However, the strain at break was impaired by PCM addition (down to −64%), but the PDA treatment helped to retain some of the pristine deformability. This work highlighted the potential of the investigated composites for applications such as adhesives or flexible interfaces with thermal management capability in electronics or other high-value-added fields.

Author Contributions

G.F.: conceptualization, investigation, methodology, formal analysis, writing—original draft, writing—review and editing; C.Z.: conceptualization, methodology, writing—review and editing; C.S.: writing—review and editing; A.P.: resources, supervision, writing—review and editing. All authors have read and agreed to the published version of the manuscript.

Funding

This research received no external funding

Acknowledgments

Lorenzo Moschini and Claudia Gavazza (Department of Industrial Engineering, University of Trento) are gratefully acknowledged for performing the SEM analysis. André Krauß (Department of Reactive Processing of the Leibniz Institute of Polymer Research Dresden) is gratefully acknowledged for carrying out the PDA modification.

Conflicts of Interest

The authors declare no conflict of interest

References

  1. Pielichowska, K.; Pielichowski, K. Phase change materials for thermal energy storage. Prog. Mater. Sci. 2014, 65, 67–123. [Google Scholar] [CrossRef]
  2. Fleischer, A.S. Thermal Energy Storage Using Phase Change Materials—Fundamentals and Applications; Series Springer Briefs in Thermal Engineering and Applied Science; Springer: Heidelberg, Germany, 2015. [Google Scholar]
  3. Khadiran, T.; Hussein, M.Z.; Zainal, Z.; Rusli, R. Encapsulation techniques for organic phase change materials as thermal energy storage medium: A review. Sol. Energy Mater. Sol. Cells 2015, 143, 78–98. [Google Scholar] [CrossRef]
  4. Zhang, P.; Xiao, X.; Ma, Z.W. A review of the composite phase change materials: Fabrication, characterization, mathematical modeling and application to performance enhancement. Appl. Energy 2016, 165, 472–510. [Google Scholar] [CrossRef]
  5. Abhat, A. Low temperature latent heat thermal energy storage: Heat storage materials. Sol. Energy 1983, 30, 313–332. [Google Scholar] [CrossRef]
  6. Agyenim, F.; Hewitt, N.; Eames, P.; Smyth, M. A review of materials, heat transfer and phase change problem formulation for latent heat thermal energy storage systems (lhtess). Renew. Sustain. Energy Rev. 2010, 14, 615–628. [Google Scholar] [CrossRef]
  7. Baştürk, E.; Kahraman, M.V. Preparation and performances of uv-cured methacrylated polyacrylic acid-based core-shell hybrid phase change materials. Polym. Eng. Sci. 2018, 58, 2166–2174. [Google Scholar] [CrossRef]
  8. Bayés-García, L.; Ventolà, L.; Cordobilla, R.; Benages, R.; Calvet, T.; Cuevas-Diarte, M.A. Phase change materials (pcm) microcapsules with different shell compositions: Preparation, characterization and thermal stability. Sol. Energy Mater. Sol. Cells 2010, 94, 1235–1240. [Google Scholar] [CrossRef]
  9. Zhou, J.; Cui, Y.; Yao, H.; Ma, J.; Ren, H. Nanocapsules containing binary phase change material obtained via miniemulsion polymerization with reactive emulsifier: Synthesis, characterization, and application in fabric finishing. Polym. Eng. Sci. 2019, 59, E42–E51. [Google Scholar] [CrossRef]
  10. Fredi, G.; Dirè, S.; Callone, E.; Ceccato, R.; Mondadori, F.; Pegoretti, A. Docosane-organosilica microcapsules for structural composites with thermal energy storage/release capability. Materials 2019, 12, 1286. [Google Scholar] [CrossRef] [Green Version]
  11. Cui, Y.; Xie, J.; Liu, J.; Pan, S. Review of phase change materials integrated in building walls for energy saving. Procedia Eng. 2015, 121, 763–770. [Google Scholar] [CrossRef] [Green Version]
  12. Kastiukas, G.; Zhou, X.M.; Castro-Gomes, J. Development and optimisation of phase change material-impregnated lightweight aggregates for geopolymer composites made from aluminosilicate rich mud and milled glass powder. Constr. Build. Mater. 2016, 110, 201–210. [Google Scholar] [CrossRef]
  13. Biswas, K.; Lu, J.; Soroushian, P.; Shrestha, S. Combined experimental and numerical evaluation of a prototype nano-pcm enhanced wallboard. Appl. Energy 2014, 131, 517–529. [Google Scholar] [CrossRef]
  14. Zhu, K.; Li, X.; Su, J.; Li, H.; Zhao, Y.; Yuan, X. Improvement of anti-icing properties of low surface energy coatings by introducing phase-change microcapsules. Polym. Eng. Sci. 2018, 58, 973–979. [Google Scholar] [CrossRef]
  15. Fok, S.C.; Shen, W.; Tan, F.L. Cooling of portable hand-held electronic devices using phase change materials in finned heat sinks. Int. J. Sci. 2010, 49, 109–117. [Google Scholar] [CrossRef]
  16. Sahoo, S.K.; Das, M.K.; Rath, P. Application of tce-pcm based heat sinks for cooling of electron components: A review. Renew. Sustain. Energy Rev. 2016, 59, 550–582. [Google Scholar] [CrossRef]
  17. Tomizawa, Y.; Sasaki, K.; Kuroda, A.; Takeda, R.; Kaito, Y. Experimental and numerical study on phase change material (pcm) for thermal management of mobile devices. Appl. Therm. Eng. 2016, 98, 320–329. [Google Scholar] [CrossRef] [Green Version]
  18. Ianniciello, L.; Biwolé, P.H.; Achard, P. Electric vehicles batteries thermal management systems employing phase change materials. J. Power Sources 2018, 378, 383–403. [Google Scholar] [CrossRef]
  19. Lazrak, A.; Fourmigué, J.-F.; Robin, J.-F. An innovative practical battery thermal management system based on phase change materials: Numerical and experimental investigations. Appl. Therm. Eng. 2018, 128, 20–32. [Google Scholar] [CrossRef]
  20. Ji, C.; Wang, Y.; Ye, Z.; Tan, L.; Mao, D.; Zhao, W.; Zeng, X.; Yan, C.; Sun, R.; Kang, D.J.; et al. Ice-templated mxene/ag-epoxy nanocomposites as high-performance thermal management materials. ACS Appl. Mater. Interfaces 2020, 12, 24298–24307. [Google Scholar] [CrossRef]
  21. Xiao, C.; Guo, Y.; Tang, Y.; Ding, J.; Zhang, X.; Zheng, K.; Tian, X. Epoxy composite with significantly improved thermal conductivity by constructing a vertically aligned three-dimensional network of silicon carbide nanowires/ boron nitride nanosheets. Compos. Part B Eng. 2020, 187, 107855. [Google Scholar] [CrossRef]
  22. Kandasamy, R.; Wang, X.-Q.; Mujumdar, A.S. Application of phase change materials in thermal management of electronics. Appl. Therm. Eng. 2007, 27, 2822–2832. [Google Scholar] [CrossRef]
  23. Cui, Y.; Li, M.; Hu, Y. Emerging interface materials for electronics thermal management: Experiments, modeling, and new opportunities. J. Mater. Chem. C 2020, 8, 10568–10586. [Google Scholar] [CrossRef]
  24. Dorigato, A.; Ciampolillo, M.V.; Cataldi, A.; Bersani, M.; Pegoretti, A. Polyethylene wax/epdm blends as shape-stabilized phase change materials for thermal energy storage. Rubber Chem. Technol. 2017, 90, 575–584. [Google Scholar] [CrossRef]
  25. Rigotti, D.; Dorigato, A.; Pegoretti, A. 3d printable thermoplastic polyurethane blends with thermal energy storage/release capabilities. Mater. Today Commun. 2018, 15, 228–235. [Google Scholar] [CrossRef]
  26. Resch-Fauster, K.; Hengstberger, F.; Zauner, C.; Holper, S. Overheating protection of solar thermal façades with latent heat storages based on paraffin-polymer compounds. Energy Build. 2018, 169, 254–259. [Google Scholar] [CrossRef]
  27. Resch-Fauster, K.; Feuchter, M. Thermo-physical characteristics, mechanical performance and long-term stability of high temperature latent heat storages based on paraffin-polymer compounds. Thermochim. Acta 2018, 663, 34–45. [Google Scholar] [CrossRef]
  28. Wu, Y.; Chen, C.; Jia, Y.; Wu, J.; Huang, Y.; Wang, L. Review on electrospun ultrafine phase change fibers (pcfs) for thermal energy storage. Appl. Energy 2018, 210, 167–181. [Google Scholar] [CrossRef]
  29. Jeong, S.-G.; Kim, S.; Huh, W. Preparation of epoxy resin using n-hexadecane based shape stabilized pcm for applying wood-based flooring. J. Adhes. Sci. Technol. 2014, 28, 711–721. [Google Scholar] [CrossRef]
  30. Fredi, G.; Dorigato, A.; Pegoretti, A. Multifunctional glass fiber/polyamide composites with thermal energy storage/release capability. Express Polym. Lett. 2018, 12, 349–364. [Google Scholar] [CrossRef]
  31. Dorigato, A.; Fredi, G.; Pegoretti, A. Novel Phase Change Materials Using Thermoplastic Composites. In Proceedings of the AIP Conference—9th International Conference “Times of Polymers and Composites” (TOP), Ischia, Italy, 17–21 June 2018. [Google Scholar] [CrossRef]
  32. Dorigato, A.; Fredi, G.; Meneghini, T.; Pegoretti, A. Thermo-mechanical behaviour of thermoplastic composite laminates with thermal energy storage/release capability. In Proceedings of the ECCM 2018—18th European Conference on Composite Materials, Megaron Athens International Conference Centre (MAICC), Athens, Greece, 24–28 June 2018. [Google Scholar]
  33. Fredi, G.; Dorigato, A.; Unterberger, S.; Artuso, N.; Pegoretti, A. Discontinuous carbon fiber/polyamide composites with microencapsulated paraffin for thermal energy storage. J. Appl. Polym. Sci. 2019, 136, 47401–47408. [Google Scholar] [CrossRef]
  34. Fredi, G.; Dorigato, A.; Fambri, L.; Pegoretti, A. Multifunctional polymer composites reinforced with discontinuous carbon fibers for thermal energy storage. In Proceedings of the ECCM 2018—18th European Conference on Composite Materials, Megaron Athens International Conference Centre (MAICC), Athens, Greece, 24–28 June 2018. [Google Scholar]
  35. Fredi, G.; Dorigato, A.; Fambri, L.; Pegoretti, A. Wax confinement with carbon nanotubes for phase changing epoxy blends. Polymers 2017, 9, 405. [Google Scholar] [CrossRef] [PubMed] [Green Version]
  36. Fredi, G.; Dorigato, A.; Fambri, L.; Pegoretti, A. Multifunctional epoxy/carbon fiber laminates for thermal energy storage and release. Compos. Sci. Technol. 2018, 158, 101–111. [Google Scholar] [CrossRef]
  37. Fredi, G.; Dorigato, A.; Fambri, L.; Pegoretti, A. Thermal Energy Storage with Polymer Composites. In Proceedings of the American Society for Composites—34th Technical Conference, Atlanta, GA, USA, 23–25 September 2019. [Google Scholar]
  38. Fredi, G.; Dorigato, A.; Fambri, L.; Pegoretti, A. Detailed experimental and theoretical investigation of the thermo-mechanical properties of epoxy composites containing paraffin microcapsules for thermal management. Polym. Eng. Sci. 2020, 60, 1202–1220. [Google Scholar] [CrossRef]
  39. Fredi, G.; Dorigato, A.; Fambri, L.; Unterberger, S.H.; Pegoretti, A. Effect of phase change microcapsules on the thermo-mechanical, fracture and heat storage properties of unidirectional carbon/epoxy laminates. Polym. Test. 2020, 91, 106741–106747. [Google Scholar] [CrossRef]
  40. Fredi, G.; Dirè, S.; Dorigato, A.; Fambri, L.; Pegoretti, A. Multifunctional carbon fiber/epoxy laminates for thermal energy storage and release. In Proceedings of the ECCM 2018—18th European Conference on Composite Materials, Megaron Athens International Conference Centre (MAICC), Athens, Greece, 24–28 June 2018. [Google Scholar]
  41. Fredi, G.; Dorigato, A.; Pegoretti, A. Novel reactive thermoplastic resin as a matrix for laminates containing phase change microcapsules. Polym. Compos. 2019, 40, 3711–3724. [Google Scholar] [CrossRef]
  42. Fredi, G.; Dorigato, A.; Pegoretti, A. Dynamic-mechanical response of carbon fiber laminates with a reactive thermoplastic resin containing phase change microcapsules. Mech. Time-Depend. Mater. 2020, 24, 395–418. [Google Scholar] [CrossRef]
  43. Fredi, G.; Brünig, H.; Vogel, R.; Scheffler, C. Melt-spun polypropylene filaments containing paraffin microcapsules for multifunctional hybrid yarns and smart thermoregulating thermoplastic composites. Express Polym. Lett. 2019, 13, 1071–1087. [Google Scholar] [CrossRef]
  44. Dorigato, A.; Fredi, G.; Negri, M.; Pegoretti, A. Thermo-mechanical behaviour of novel wood laminae-thermoplastic starch biodegradable composites with thermal energy storage/release capability. Front. Mater. 2019, 6, 1–12. [Google Scholar] [CrossRef]
  45. Su, J.-F.; Wang, X.-Y.; Wang, S.-B.; Zhao, Y.-H.; Zhu, K.-Y.; Yuan, X.-Y. Interface stability behaviors of methanol-melamine-formaldehyde shell micropcms/epoxy matrix composites. Polym. Compos. 2011, 32, 810–820. [Google Scholar] [CrossRef]
  46. Su, J.-F.; Zhao, Y.-H.; Wang, X.-Y.; Dong, H.; Wang, S.B. Effect of interface debonding on the thermal conductivity of microencapsulated-paraffin filled epoxy matrix composites. Compos. Pt. A Appl. Sci. Manuf. 2012, 43, 325–332. [Google Scholar] [CrossRef]
  47. Dorigato, A.; Fredi, G.; Pegoretti, A. Application of the thermal energy storage concept to novel epoxy/short carbon fiber composites. J. Appl. Polym. Sci. 2019, 136, 47431–47434. [Google Scholar] [CrossRef]
  48. Lynge, M.E.; Van Der Westen, R.; Postmab, A.; Stadler, B. Polydopamine—A nature-inspired polymer coating for biomedical science. Nanoscale 2011, 3, 4916–4928. [Google Scholar] [CrossRef] [PubMed]
  49. Jeong, Y.K.; Park, S.H.; Choi, J.W. Mussel-inspired coating and adhesion for rechargeable batteries: A review. Acs Appl Mater. Interfaces 2018, 10, 7562–7573. [Google Scholar] [CrossRef] [PubMed]
  50. Tang, Y.; Dong, W.; Tang, L.; Zhang, Y.; Kong, J.; Gu, J. Fabrication and investigations on the polydopamine/kh-560 functionalized pbo fibers/cyanate ester wave-transparent composites. Compos. Commun. 2018, 8, 36–41. [Google Scholar] [CrossRef]
  51. Shanmugam, L.; Feng, X.; Yang, J. Enhanced interphase between thermoplastic matrix and uhmwpe fiber sized with cnt-modified polydopamine coating. Compos. Sci. Technol. 2019, 174, 212–220. [Google Scholar] [CrossRef]
  52. Fredi, G.; Simon, F.; Sychev, D.; Melnyk, I.; Janke, A.; Scheffler, C.; Zimmerer, C. Bioinspired polydopamine coating as an adhesion enhancer between paraffin microcapsules and an epoxy matrix. ACS Omega 2020, 5, 19639–19653. [Google Scholar] [CrossRef]
  53. Nishizawa, N.; Kawamura, A.; Kohri, M.; Nakamura, Y.; Fujii, S. Polydopamine particle as a particulate emulsifier. Polymers 2016, 8, 62. [Google Scholar] [CrossRef]
  54. Roldán, M.L.; Centeno, S.A.; Rizzo, A. An improved methodology for the characterization and identification of sepia in works of art by normal raman and sers, complemented by ftir, py-gc/ms, and xrf. J. Raman Spectrosc. 2014, 45, 1160–1171. [Google Scholar] [CrossRef]
  55. Alyamaç, E. Self-Stratifying Coatings. PhD Thesis, The Graduate Faculty of The University of Akron, Akron, OH, USA, 2009. [Google Scholar]
  56. Ding, R.; Torres, S.W.; Messman, J.; Bowen, D.E.; Bowler, N. Dynamics of model polycyclic aromatic hydrocarbon compound-epoxy composites: A dielectric study. Polymer 2018, 136, 6–16. [Google Scholar] [CrossRef]
  57. Vryonis, O.; Andritsch, T.; Vaughan, A.S.; Lewin, P.L. Effect of surfactant molecular structure on the electrical and thermal performance of epoxy/functionalized-graphene nanocomposites. Polym. Compos. 2020, 41, 2753–2767. [Google Scholar] [CrossRef]
  58. Ferry, J.D. Viscoelastic Properties of Polymers, 3rd ed.; John Wiley & Sons: Hoboken, NJ, USA, 1980. [Google Scholar]
  59. Bohn, M.A. The connection between the parameters of wlf equation and of arrhenius equation. Propellants Explos. Pyrotech. 2019, 44, 696–705. [Google Scholar] [CrossRef]
  60. Kolařík, J.; Pegoretti, A. Proposal of the boltzmann-like superposition principle for nonlinear tensile creep of thermoplastics. Polym. Test. 2008, 27, 596–606. [Google Scholar] [CrossRef]
Figure 1. SEM micrographs of the external surface of neat and PDA-coated microcapsules at different magnification levels. (A,C) Neat microcapsules, MC; (B,D) PDA-coated microcapsules, MC-PDA.
Jcs 04 00174 g001
Figure 2. SEM micrographs of tensile-test fracture surface of some selected compositions, at different magnification levels. (A,C,E) EP-MC10; (B,D,F,G,H) EP-MC10-PDA.
Jcs 04 00174 g002
Figure 3. Results of attenuated total reflectance–Fourier-transform infrared spectroscopy (ATR–FTIR). (A) Overview of the spectra of all the investigated samples. (B) Detail of Fourier-transform infrared spectroscopy (FTIR) spectra of neat and PDA-coated microcapsules. (C) Detail of FTIR spectra of composites EP-MC40 and EP-MC40-PDA. Vertical lines indicate typical IR absorption bands of PDA. Intensity is reported in percentage points.
Jcs 04 00174 g003
Figure 4. Results of DSC tests on neat and PDA-coated microcapsules and prepared composites. (A) First heating scan. The shaded box reports the thermograms with a magnified y-scale to highlight the glass transition of the EP matrix. (B) Cooling scan.
Jcs 04 00174 g004
Figure 5. Results of thermogravimetric analysis (TGA) tests on the neat and PDA-coated microcapsules and the prepared composites. Residual mass and mass loss derivative as a function of temperature.
Jcs 04 00174 g005
Figure 6. Results of dynamic mechanical thermal analysis (DMTA) tests. (A) Storage modulus ( E ), loss modulus ( E ), and t a n δ as a function of temperature for some selected compositions (EP, EP-MC20, and EP-MC20-PDA). (B) Detail of storage modulus in logarithmic scale. (C) Detail of loss modulus in logarithmic scale.
Jcs 04 00174 g006
Figure 7. Results of the DMA multifrequency scans on the samples EP, EP-MC20, and EP-MC20-PDA. Investigated frequencies: 0.3–1–3–10–30 Hz. (A) DMA thermograms with trends of E , E , and t a n δ . (B) Natural logarithm of frequency as a function of 1000/ T p _ E . The dashed lines represent the result of the linear fitting.
Jcs 04 00174 g007aJcs 04 00174 g007b
Figure 8. Results of quasistatic tensile tests and Shore D hardness tests on the prepared composites. (A) Representative stress–strain curves; (B) elastic modulus, ultimate tensile strength (UTS), strain at break, and Shore D hardness for the prepared composites (mean value and standard deviation).
Jcs 04 00174 g008
Figure 9. Elastic modulus ( E ), tensile strength ( U T S ), and strain at break ( ε b ) as a function of melting enthalpy of the prepared composites.
Jcs 04 00174 g009
Figure 10. Results of creep tests on the prepared composites. (A) Creep compliance as a function of time; (B) initial (elastic) compliance ( D e l ), viscoelastic component of the compliance at 60 min ( D v e ( 60 m i n ) ), and total final creep compliance at the end of the test ( D ( 60 m i n ) ).
Jcs 04 00174 g010
Table 1. List of the prepared samples with nominal weight compositions. EP—epoxy.
SampleEpoxy Resin (Base + Hardener)
(wt %)
Neat or PDA-Modified Microcapsules
(wt %)
EP1000
EP-MC109010
EP-MC10-PDA9010
EP-MC208020
EP-MC20-PDA8020
EP-MC406040
EP-MC40-PDA6040
Table 2. Main results of DSC tests on the neat and PDA-coated microcapsules and the prepared composites.
Sample T g _ 1 ( ° C ) T m _ 1 ( ° C ) Δ H m _ 1 ( J / g ) Δ H m r e l ( % ) T c ( ° C ) Δ H c ( J / g ) T g _ 2 ( ° C ) T m _ 2 ( ° C ) Δ H m _ 2 ( J / g )
MC-44.7227.710029.0224.2-44.4226.1
MC-PDA-45.7221.110029.3220.8-45.5220.9
EP11.1-----9.3--
EP-MC1011.344.022.699.232.822.97.844.023.4
EP-MC10-PDA10.743.121.898.632.921.78.843.121.7
EP-MC207.544.646.6102.232.646.58.244.546.1
EP-MC20-PDA11.144.244.099.631.843.89.944.043.8
EP-MC408.647.087.896.428.988.89.146.587.3
EP-MC40-PDA10.749.685.897.126.685.49.949.585.6
T g _ 1   = glass transition temperature (first heating scan); T m _ 1 = melting temperature (first heating scan); Δ H m _ 1 = melting enthalpy (first heating scan); Δ H m r e l = relative melting enthalpy, compared to the enthalpy of MC or MC-PDA; T c = crystallization temperature; Δ H c = crystallization enthalpy; T g _ 2 = glass transition temperature (second heating scan); T m _ 2 = melting temperature (second heating scan); Δ H m _ 2 = melting enthalpy (second heating scan).
Table 3. Main results of TGA tests on the neat and PDA-coated microcapsules and the prepared composites.
Sample T 1 %   ( ° C ) T 3 %   ( ° C ) T 5 %   ( ° C ) T d   ( ° C ) m r   ( % )
MC118.4164.0241.2421.20.12
MC-PDA140.4180.9209.0428.73.81
EP107.7147.0172.0323.30.39
EP-MC10105.9140.2164.7321.21.35
EP-MC10-PDA116.0153.9179.2319.54.89
EP-MC20101.4136.9159.6323.43.60
EP-MC20-PDA101.9141.5167.1321.43.85
EP-MC40100.8139.5158.5330.23.10
EP-MC40-PDA112.1150.7176.9337.14.31
T 1 % , T 3 % ,   T 5 % = temperatures corresponding to a mass loss of 1 wt %, 3 wt %, and 5 wt %; T d = degradation temperature, intended as the peak of the mass loss derivative signal; m r = residual mass at the end of the test (%).
Table 4. Main results of DMTA tests on the prepared composites.
Sample E 20   ° C   ( MPa ) E 25   ° C   ( MPa ) E 60   ° C   ( ° C ) T p _ E   ( ° C ) T p _ t a n δ   ( ° C )
EP1737454.516.820.131.8
EP-MC101720535.324.521.833.5
EP-MC10-PDA1490514.224.822.033.5
EP-MC201859527.734.520.831.4
EP-MC20-PDA1579530.130.422.434.0
EP-MC402045841.943.024.435.2
EP-MC40-PDA33001137.668.122.837.8
E 20   ° C = storage modulus at −20 °C (MPa); E 25   ° C = storage modulus at 25 °C (MPa); E 60   ° C = storage modulus at 60 °C (MPa); T p _ E = peak temperature of the loss modulus (°C); T p _ t a n δ = peak temperature of tanδ (°C).
Table 5. Main results of DMA multifrequency tests on the prepared composites. Activation energy ( E a ) and value of R 2 of the linear fit.
Sample E a   ( kJ / mol ) R 2
EP346 ± 130.996
EP-MC20300 ± 100.997
EP-MC20-PDA331 ± 80.998
Publisher’s Note: MDPI stays neutral with regard to jurisdictional claims in published maps and institutional affiliations.

