Article

Effect of Structural Parameters on the Deformational Behaviors of Multiply 3D Layer-by-Layer Angle-Interlock Para-Aramid Fabric for Fiber-Reinforcement Composite

1
Faculty of Science and Technology, University of Lille, Nord de France, 59000 Lille, France
2
École Nationale Supérieure des Arts et Industries Textiles (ENSAIT), GEMTEX lab. 2 Allée Louise et Victor Champier, 59056 Roubaix, France
3
Faculty of Textiles—Leather Engineering and Industrial Management, ‘Gheorghe Asachi’ Technical University of Iasi, Leather Dimitrie Mangeron Bd., 53, 700050 Iasi, Romania
4
College of Textile and Clothing Engineering, Soochow University, 178 G.J. D. Road, Suzhou 215021, China
*
Author to whom correspondence should be addressed.
J. Compos. Sci. 2020, 4(4), 145; https://doi.org/10.3390/jcs4040145
Submission received: 28 August 2020 / Revised: 12 September 2020 / Accepted: 16 September 2020 / Published: 24 September 2020
(This article belongs to the Special Issue Dynamic Behavior and Failure Analysis of Composites)

Abstract

:
Materials used in the technical application including composite reinforcements and ballistic fabrics should show not only good mechanical performance but also better deformational behaviors. Meanwhile, three dimensional (3D) warp interlock fabrics have been widely employed in such applications to substitute the two dimensional (2D) fabrics because of their enhanced through-the-thickness performance and excellent formability. The deformational behaviors of such 3D warp interlock fabrics have been also influenced by various internal and external parameters. To understand and fill this gap, the current paper investigates the effects of the warp yarn interchange ratios inside the fabric structure on the formability behaviors of dry 3D warp interlock p-aramid fabrics. Four 3D warp interlock architecture types made with different binding and stuffer warp yarn interchange ratios were designed and manufactured. An adapted hydraulic-driven stamping bench along with hemispherical punch was utilized for better forming behavior analysis such as in-plane shear angle and its recovery, material drawing-in and its recovery, deformational depth recovery, and required stamping forces. Based on the investigation of various formability behaviors, the formability of (3D) warp interlock fabrics were greatly influenced by the binding and stuffer warp yarns interchange ratio inside the 3D warp interlock structure. For example, preform 3D-8W-0S exhibited a maximum deformational height recovery percentage of 5.1%, whereas 3D-4W-8S recorded only 0.72%. Preform 3D-8W-4S and 3D-8W-8S revealed 1.45% and 4.35% recovery percentages toward the deformational height at maximum position. Besides, sample 3D-4S-8W revealed the maximum drawing-in recovery percentage of 43.13% and 46.98% in the machine and cross direction, respectively, around the preform peripheral edges. On the contrary, samples with higher binding warp yarns as 3D-8W-0S show the maximum drawing-in recovery percentages values of 31.21% and 34.99% in the machine and cross directions respectively.

1. Introduction

Different research studies have used 2D and UD (Unidirectional) fabrics to develop various fiber-reinforced composite parts and soft body armor panels for the past many years [1,2,3]. Those textile materials should also possess not only mechanical and ballistic performances but also good bending and molding properties without affecting the final performances of the product. However, selecting appropriate fabric type parameters including fabric architecture, weave type, yarn count, fabric density, yarn composition, etc., are some of the most important steps that can help to achieve the combined behaviors for the specific applications. Besides, the forming of the textile materials could be affected by various factors [4,5,6] and become nowadays a common manufacturing technique for various technical products including composite parts and body armor [7,8,9]. In general, such kind of techniques mainly applied either on the liquid or solid materials depending on the final application and the types of forming devices used. Moreover, the forming process could be achieved using a dry or heated punch on the material to create the intended form. Apart from developing different parts, such kind of techniques are also used to develop a three-dimensional shape product from single pieces of material without involving any kind of stitching system [10,11]. The advantage of such a manufacturing process is to improve not only the final product performance but also reduce the raw material wastages and production time. For example, forming techniques can be used in the manufacturing of the frontal panels of women’s soft body armor to resemble the female torso shape by properly accommodating the bust [12,13,14,15]. In response, the designed product could then give both the comfort and enhanced ballistic performance by removing the stitching and other material weakening surface during for example traditional manufacturing. However, understanding the different formability characteristics of the fabric before applying to any kind of technical application i.e., body armor and composite parts are very important.
Nowadays, 3D warp interlock fabrics have become a promising fabric structure to be used as woven textile-reinforced composites. Such textile-reinforced composites have been also increasingly used in various engineering fields such as aerospace (as a framework, T- and X-shape panels, aircraft wings leading edges, etc.,) [16], civil structure and construction [17], automotive (in engine rotors, nozzles, and engine mount, etc.,) [18], medicine [19], sports [20], and defense applications [21] because of their distinctive advantages over traditional materials such as metals and ceramics. Fiber-reinforced composite materials are lightweight, stiff, and strong. They have good fatigue and impact resistance [22]. Their directional and overall properties can be tailored to fulfill the specific needs of different end uses by changing constituent material types and fabrication parameters. Different definitions and classifications have been propped about 3D warp interlock fabric for the last many decades by various research studies [23,24,25], with the latest being [26] which proposed a complete and precise description in their recent studies considering the different structure and yarn components of the 3D warp interlock. According to this study, the 3D warp interlock structures have been classified mainly into four categories as orthogonal–layer-to-layer (O-L), orthogonal–through-the-thickness (O-T), angle–layer-to-layer (A-L), and angle–through-the-thickness (A-T) as shown in Figure 1. Such classification mainly depends on the orientation and interlacing angles of the different weft layers by the binding warp yarns. For example, A–T and A–L structure weft layers were bound in a diagonal direction completely or according to different layers respectively. Whereas, in the O–T and O–L configuration, the different binding warp yarns link the entire thickness or some of the layers respectively following an orthogonal direction.
Because of this different structure inside the fabrics, the 3D warp interlock fabric provides good mechanical properties and delivers good ballistic performance along with good delamination properties compared to the 2D fabrics [26,27,28]. Moreover, even though it has some difficulty with numerical modeling [29] due to its geometrical and structural complexity, various studies agree on its capabilities to substitute the traditional (2D and UD) fabrics. This is mainly due to their various advantages including low shear rigidity and excellent formability behaviors [30]. For example, studies have successfully worked on developing a single piece of the helmet using the 3D warp interlock as fibrous reinforcement for composite by avoiding cutting the fabric [10,31,32,33]. The 3D warp interlock structures also exhibited less fabric damage mechanisms during forming processes [34]. Another study also developed a new monitoring approach with sensor yarns inside the fabric thickness to measure and quantify different 3D warp interlock fabric behaviors during forming [35]. In the forming process, apart from the external factors, the formability properties of 3D warp interlock fabric are affected by several internal parameters. One of our studies focused on the design and manufacturing of 3D warp interlock fabrics made of high-performance 930dTex para-aramid yarn to investigate the influences of the fabric density on mechanical and molding behaviors [36]. Based on this research, the yarn and the overall fabric density greatly influence both the forming and its recovery properties of the 3D warp interlock fabric.
It was also revealed that weft layers inside 3D warp interlock fabrics are greatly interconnected together through the binding yarn to produce thick reinforcement for different technical applications [37,38]. The binding warp yarns also greatly help to dissipate loads in different directions and keep the yarns by stabilizing the integrity of the entire structure [39]. In the 3D warp interlock structure, the location of a binding yarn [20] ensures better mechanical properties in the thickness direction as compared to stacked 2D fabrics. Besides, 3D woven fabrics are also involved in ballistic protection due to the enhanced mechanical properties in the thickness direction as compared to two-dimensional (2D) fabrics [40,41]. Even though the numerical and analytical studies are mostly limited to 2D woven fabrics, the study revealed that 3D textile structures have a higher resistance to multi-impacts with the easier and cheaper achievement of complex shape structures in comparison with the 2D fabrics [14]. 3D warp interlock structures also show a high performance in ballistic lightweight protection with good molding ability and display a better performance as compared to 2D structures [42,43].
The main goal of the current study is to investigate the influences of the warp yarns interchange ratio on the forming characteristics of 3D warp interlock fabrics. Four different 3D warp interlock fabrics with different warp yarns interchange ratios were designed and manufactured with the same yarn density in the warp and weft directions. All the fabrics were produced with the same parameters including material type (high-performance aramid fibers, Twaron CT-709 930dTex). A predefined single-curved hemispherical shape punch with a pneumatic punching bench was used. Different formability and recovery behaviors of the preforms were measured and discussed. In general, the research would help to further improve the overall understanding of the influences of the warp yarn interchange ratio on the formability behaviors of 3D warp interlock preforms.

2. Materials and Experimental Methods

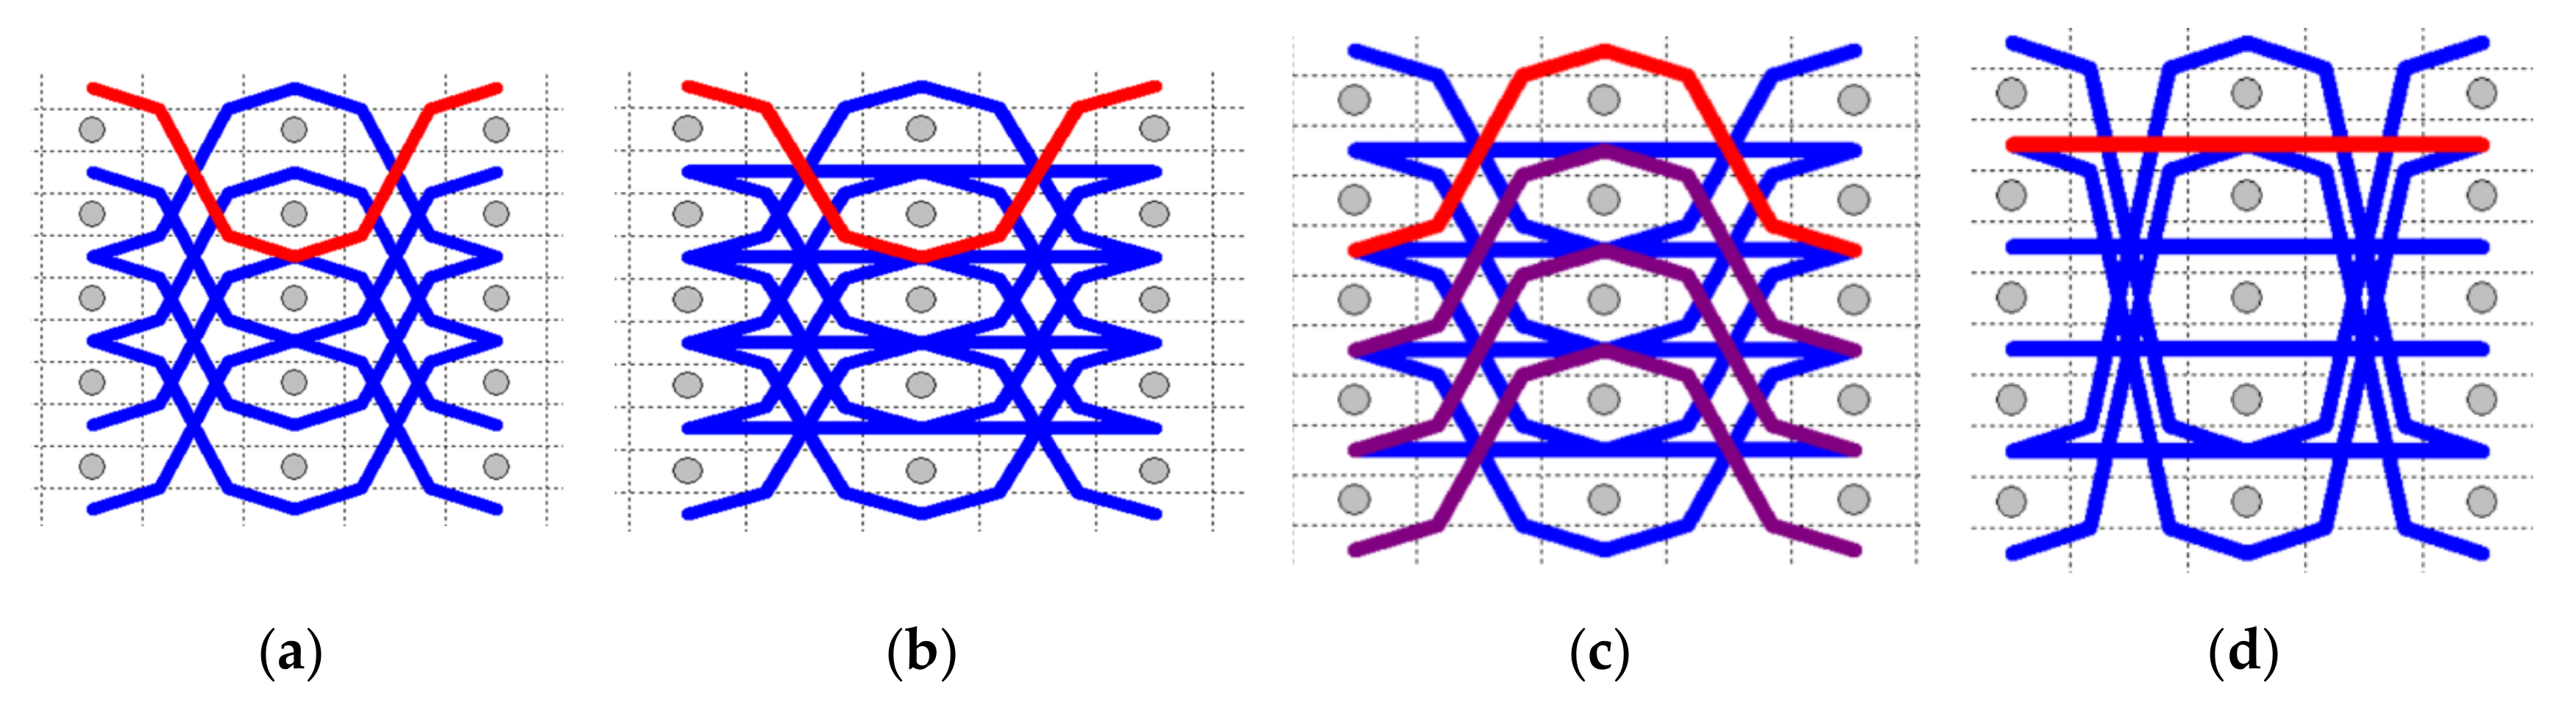
2.1. Materials and Preform Preparations

2.1.1. Materials

Different variants of 3D warp interlock para-aramid orthogonal layer-to-layer (O-L) fabrics that involve different warp yarns interchange ratios were produced and used in the forming behavior investigations. The interchange ratio corresponds to the different proportion of binding and stuffer warp yarns inside the 3D warp interlock structure. For the current study, four different ratios, corresponding respectively to X% of binding warp yarn and Y% of stuffer war yarns (written as binding warp yarns ratio (B) and stuffer warp yarns ratio (S)) have been chosen as 100–0% (B8:0S), 66–33% (B8:4S), 50–50% (B8:8S), and 33–66% (B4:8S). Based on this ratio, the binding warp yarns that are used to build a link between the different layers of the fabric following a diagonal direction will be different. However, all these fabrics were manufactured with the same high-performance p-aramid fibers 930 dTex yarns (Twaron® produced by Teijin Aramid from the Netherland) with a yarn twist of 25 twists/m in the Z direction for both warp and weft yarns and a breaking strength at 225 N. Moreover, the manufactured fabrics possessed similar weft layers (five layers) and yarn densities (48 ends per cm and 50 picks/cm). The actual areal density of all the fabrics was 970 g/m2 but was found slightly different after the production due to the degradation and other process factors. All four 3D warp interlock fabrics were designed geometrically using WiseTex® software (an open source software licensed under the General Public License developed at the KU Leuven, Belgium) as shown in Figure 2. The fabric was achieved on the DB-weave software before being transferred to the weaving machine for production. A semi-automatic ARM dobby weaving loom was used to manufacture the different 3D warp interlock fabric structures. The complete yarn and fabric characteristics are illustrated in Table 1.
A total of 24 beams, equipped with a warp tension controlling device, were used on the adapted warp beam creel during manufacturing. Moreover, 24 heddle shafts in which each shaft consists of 100 heddles were installed on the machine to allocate one warp beam per shaft.

2.1.2. Preform Preparations

Squared samples of each fabric with the dimensions of 250 mm × 250 mm were prepared, but with different fabric thickness because of the binding effects of the warp yarn in each fabric. For better tracking, monitoring, and analysis of the different important forming characteristics, a defined reference tracer line by joining the specific indicator points were carefully drawn on the surface of the preforms. Six surface reference lines each were drawn both in the machine (warp) and cross (weft direction) with equal distance and amounts.
As illustrated in Figure 3, the different reference lines are designated as 0-0′, 1-1′ 2-2′, 3-3′, 4-4′, and 5-5′ in the machine (warp) direction and respectively 0-5, D-D’, C-C’, B-B’, A-A’, and 0′-5′ in the cross (weft) directions. Normally, such reference line tracers were drawn only on the quarter regions (1/4th) of the active preform regions to investigate the different forming characteristics. This is because the application of double-curved shape forming using the hemispherical punching test at the center of the sample would give a uniformly distributed forming behavior on all surfaces of the preform regions. This means that analyzing different forming characteristics on one quadrant (1/4th) is assumed to give more probably uniform and similar forming behavior results for the rest of other sub-regions due to the quasi-symmetrical hemispherical punching.

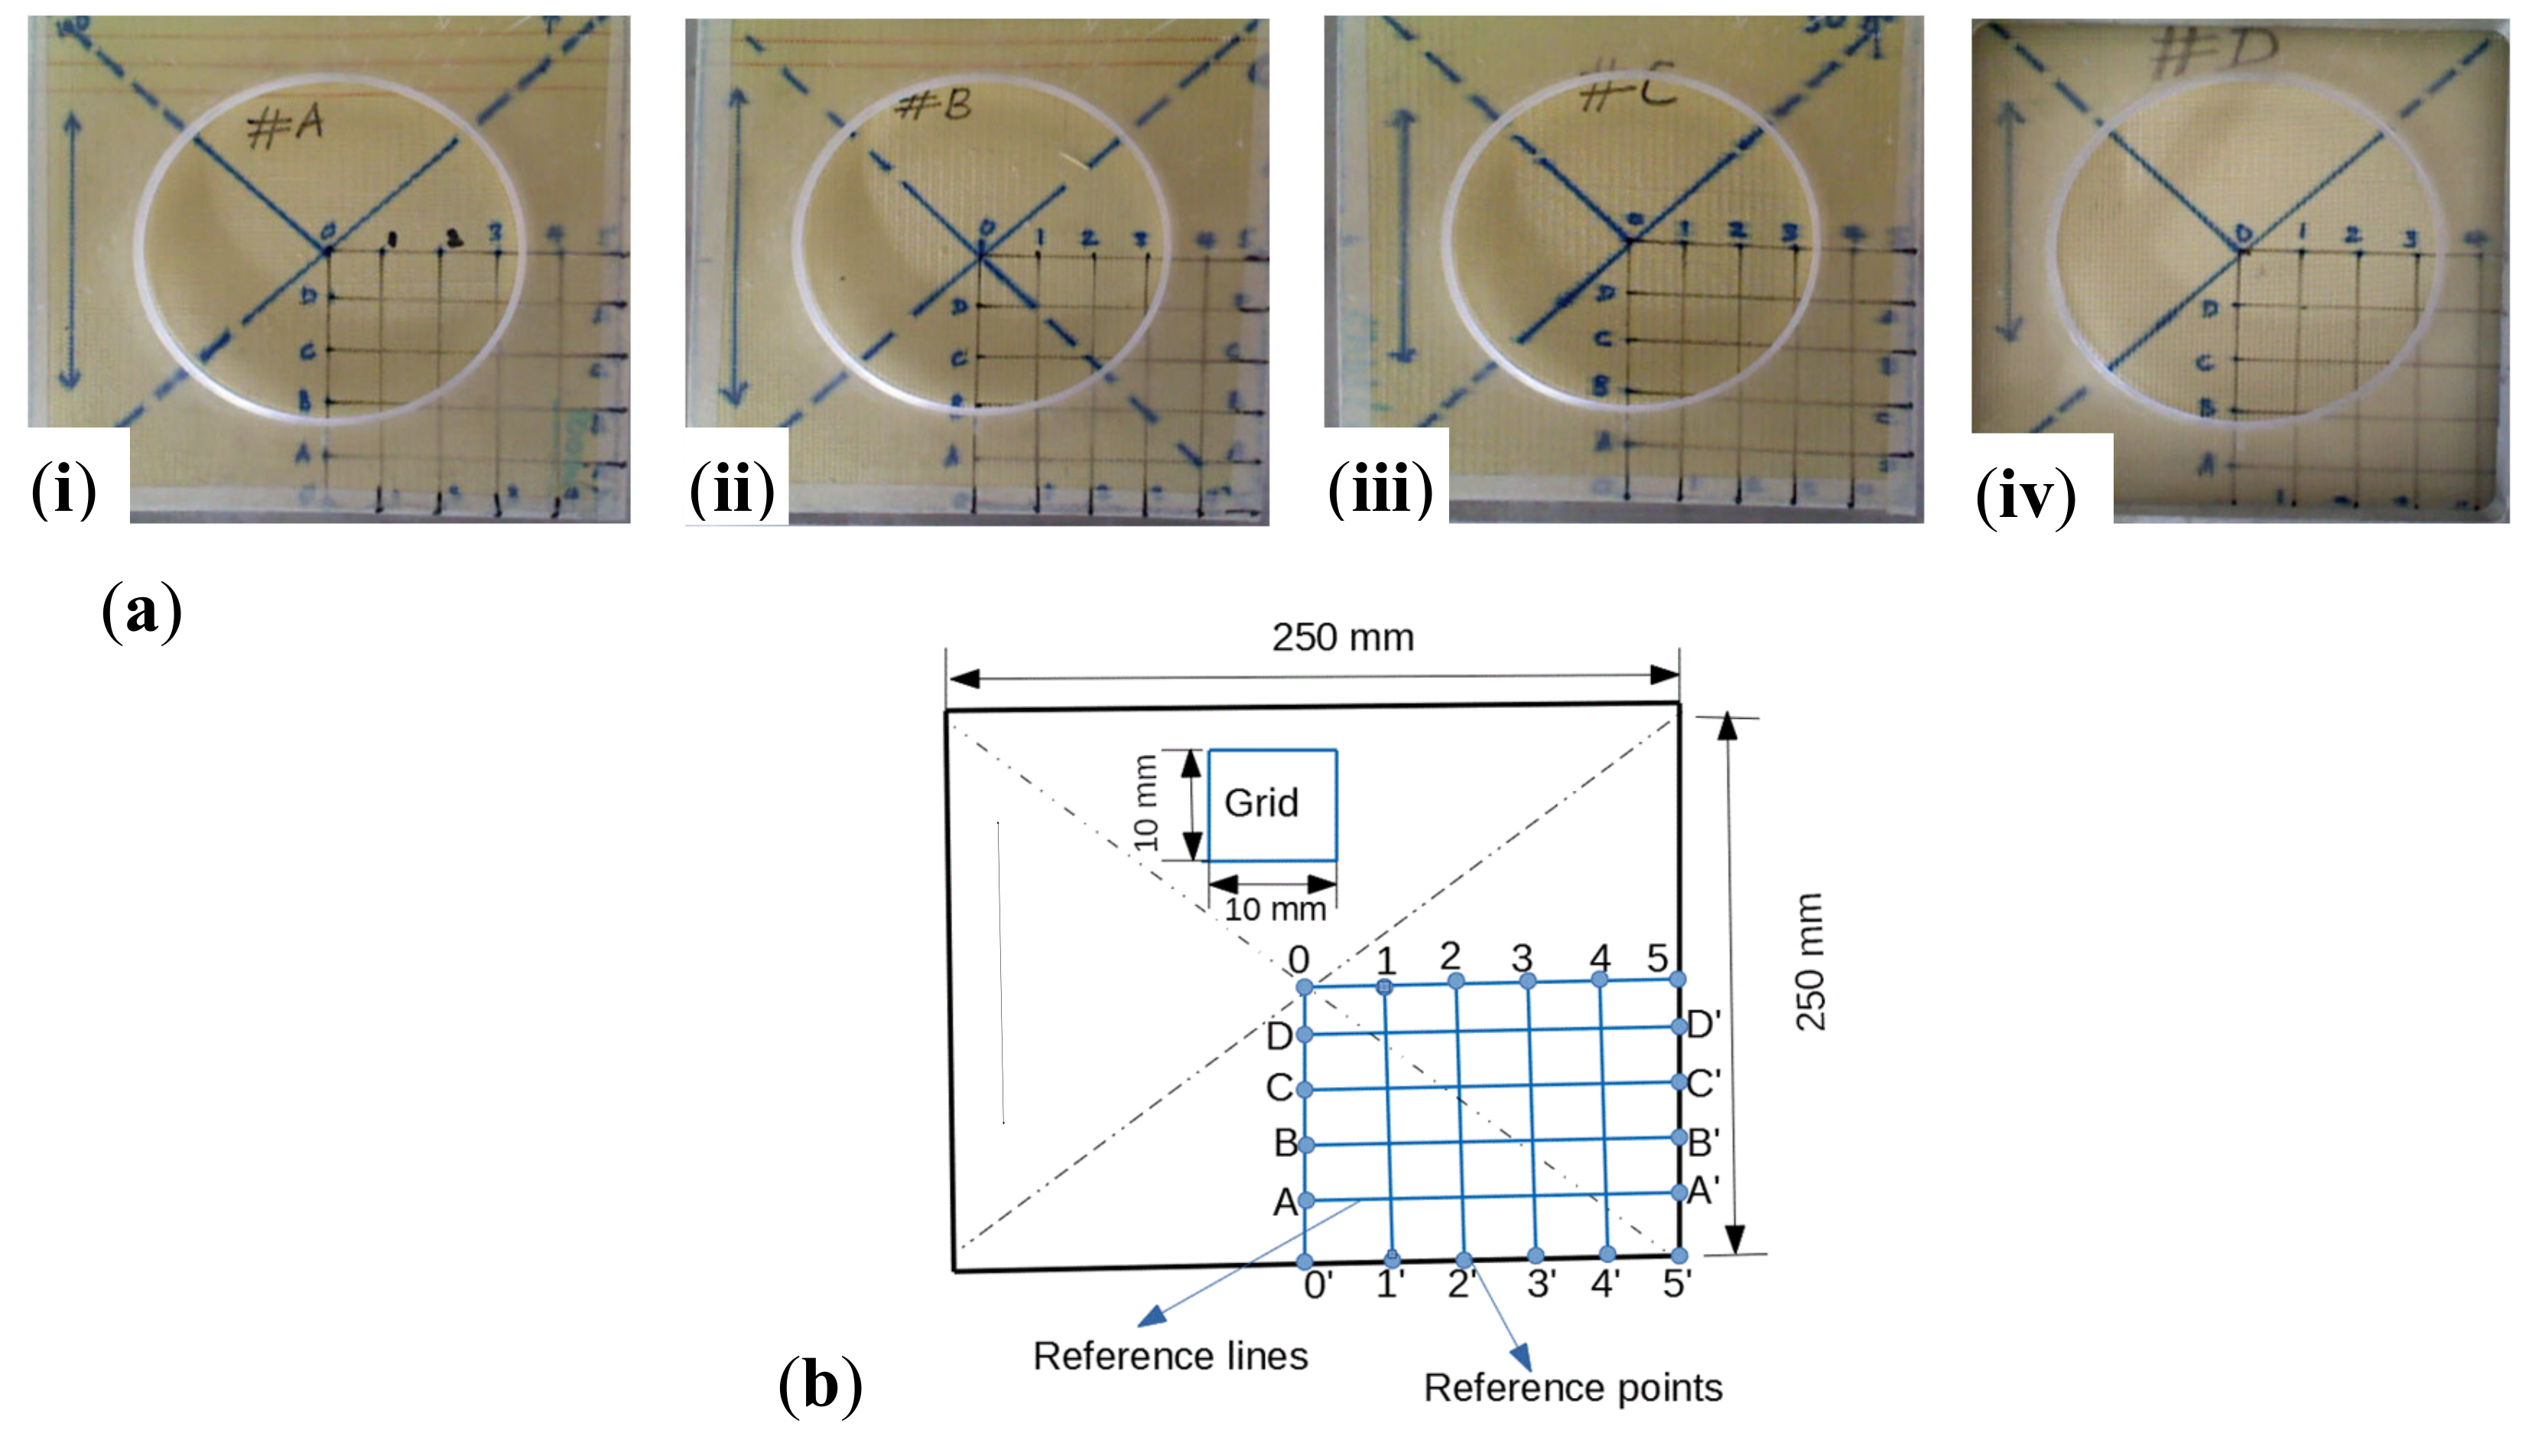
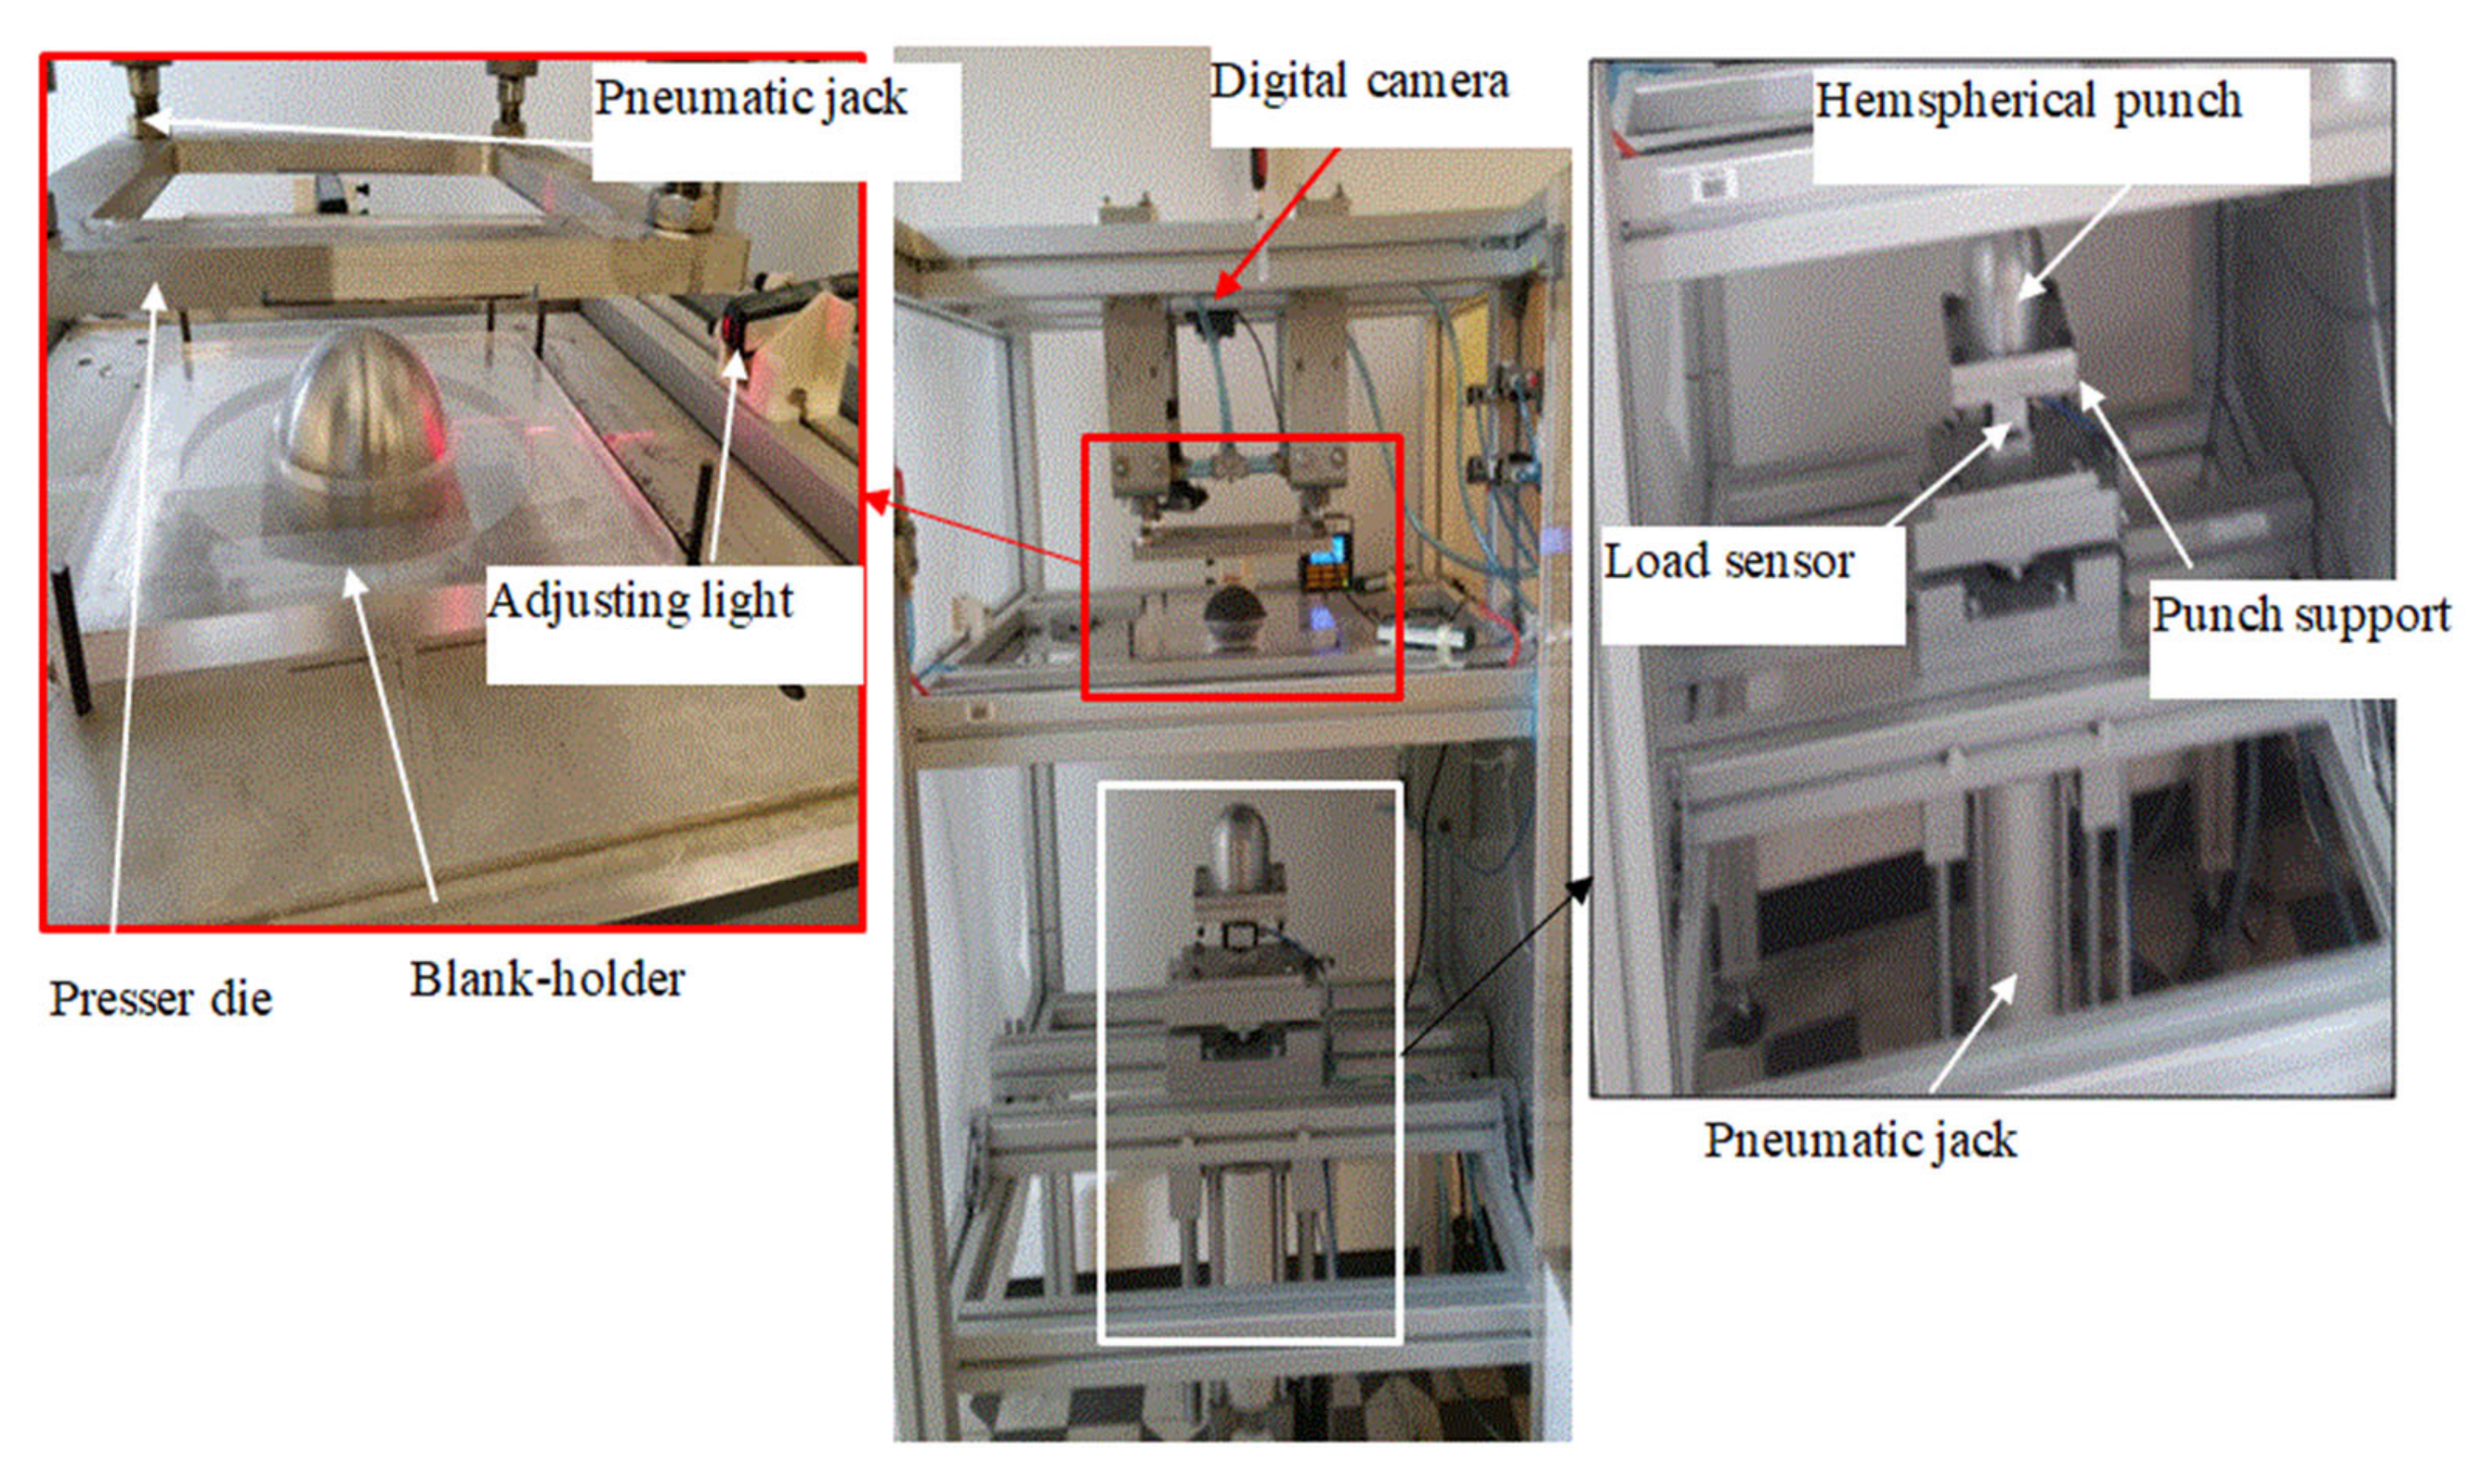
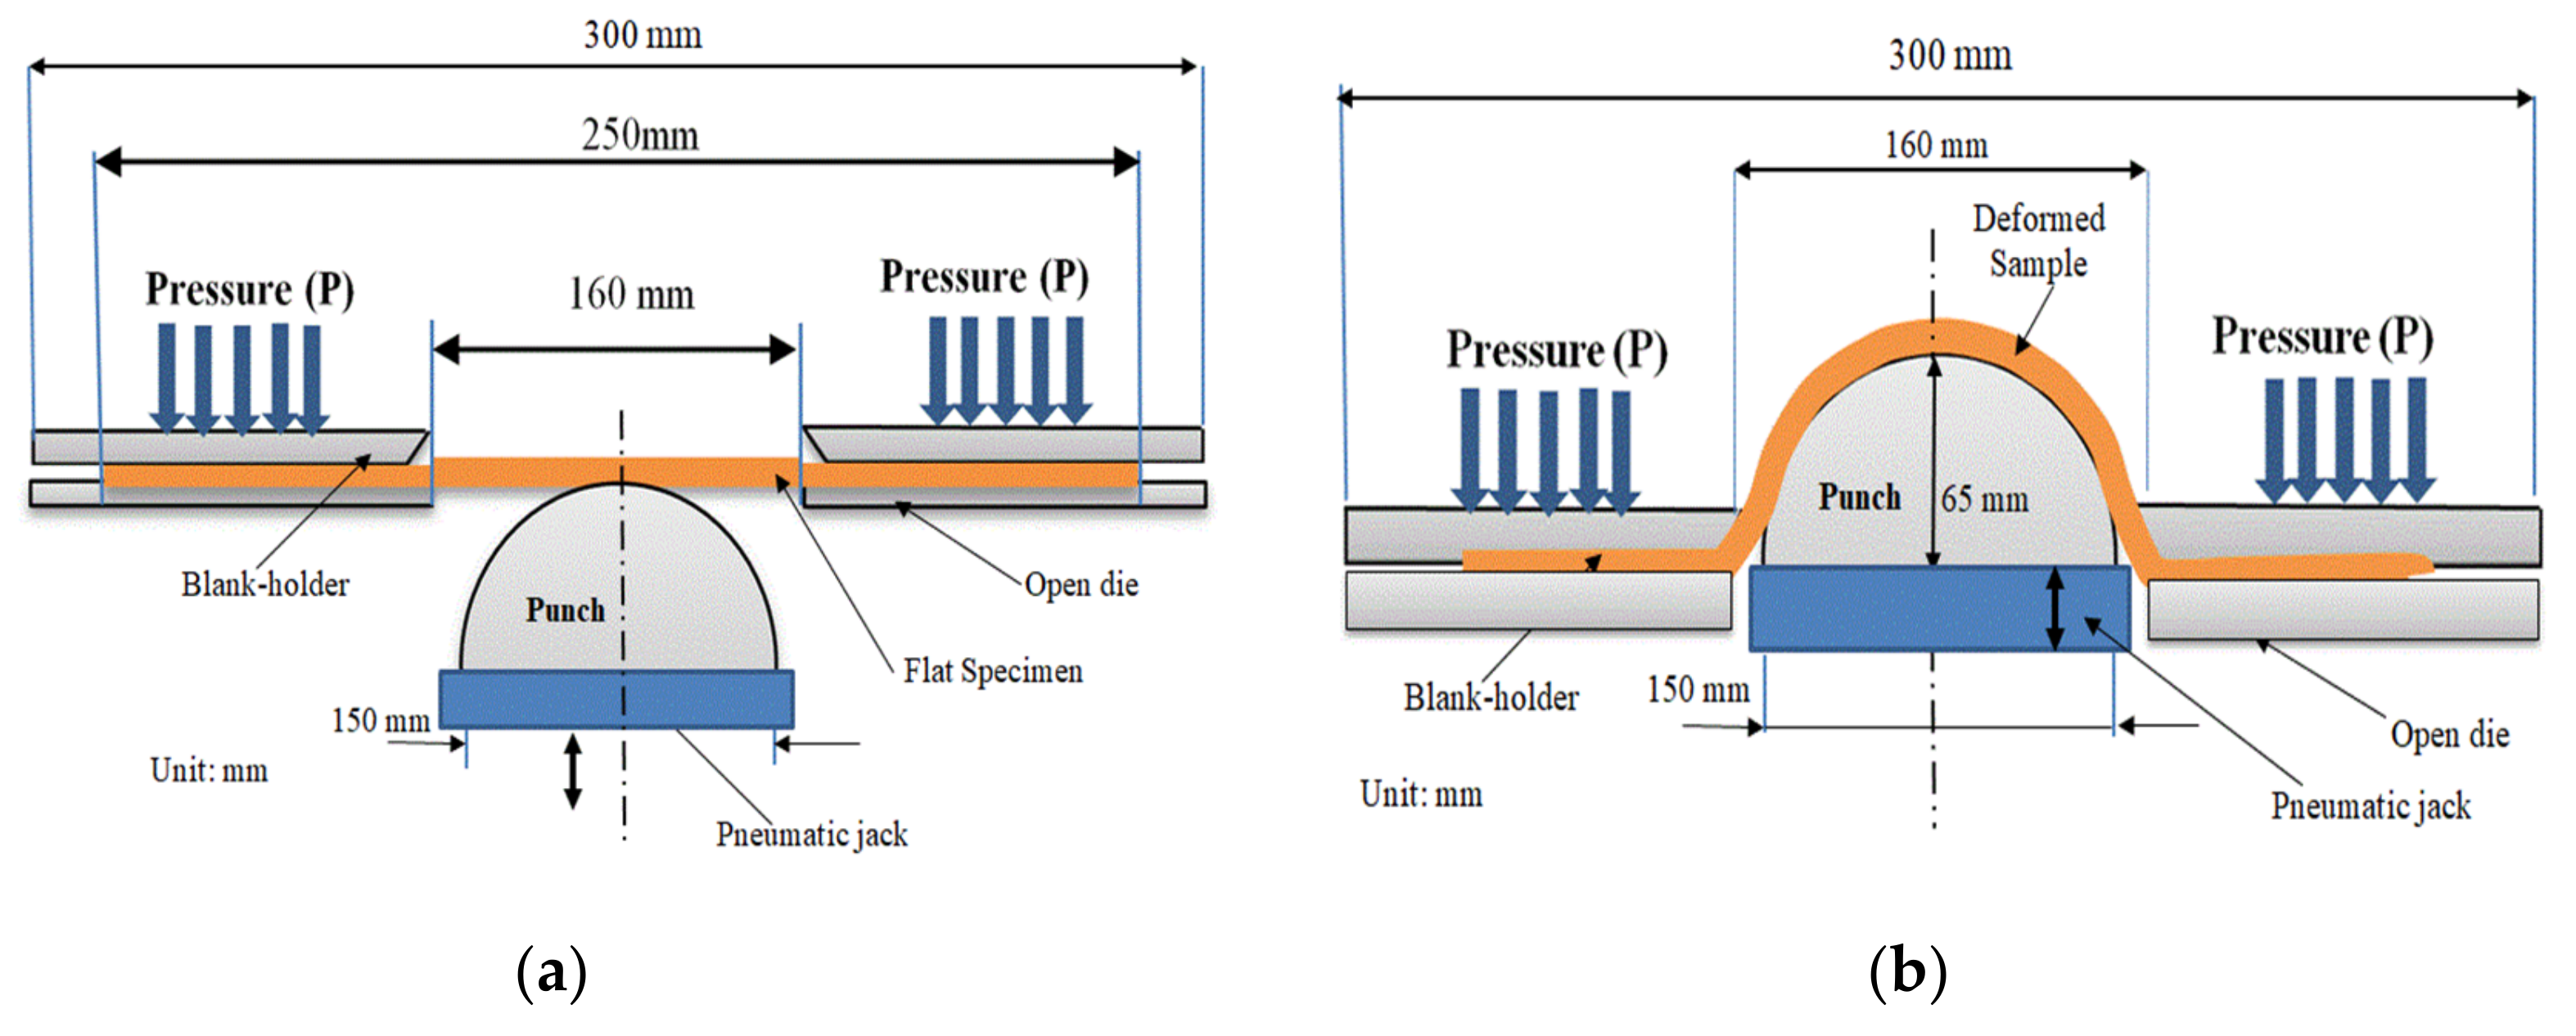
2.2. Formability Testing Device and the Experimental Methods

An adapted and specifically modified dry fabric forming machine [44,45] was performed at room temperature and moisture conditions (20 °C and 65%HR) for our study. The utilized dry fabric hemispherical forming test device with its different parts is shown in Figure 4. The vertical and controlled movements of the four pneumatic jacks at the bottom of the device help to provide the required speed for the non-heating punch to give the intended shape on the preforms.
The machine normally uses pneumatic mechanisms to control and operate the punching systems at the bottom of the preform material. Before the formability test, the different prepared 3D warp interlock preforms are carefully alighted and placed in the right positions through a laser light guide between the lower die and the upper blank-holder. The blank-holder helps to firmly hold the preforms by using the applied specific pressure. The pressure is mainly governed at the top of the open presser die which is connected to the movable four pneumatic jacks. This presser die presses the blank-holder at the four peripheral edges areas with appropriate pressure. The devices were normally designed to entertain the different single curvature punch shapes with the integrations of the open-die system. Among the different forming punch, hemispherical punch shapes were chosen to distribute the load more uniformly and observe the local and global deformations of the preformed sample by following the different paths of yarns in the structure both in the warp and weft directions [34,46]. Figure 5 shows the forming process at the initial and forming stages of the sample. Moreover, a digital camera was also installed at the top center of the device to record and capture the whole fabric forming process. The different forming parameters such as in-plane shear angle and material drawing-in with their recovery can be then executed and optically measured by extracting the relevant information from the recorded video using dedicated software called ImageJ with precisions of ±0.1°. The four electric jacks in the device were mainly used to control the punching speed and the force applied by the punch. The applied force and its variations on the preform by the punch are normally detected and measured by the load sensor (500 N ± 0.3%) which is attached to the jack. Moreover, the punch displacement mainly depends on punch shape but set to be constant throughout the movement for a better punching process (Table 2).
Such forming device is mainly designed to investigate the single-curved shape punch to analyze the formability of dry textile materials at various dependent parameters. Dependent parameters like blank-holder pressure, stamping velocity, punching force, shapes of punch, and punching depth should be properly considered and settled throughout the forming process for better forming results [47]. For example, the blank holder pressure shows a significant effect on the formability properties because of different force differences between the preforms and the holders [48]. Therefore, applying an appropriate blank-holder pressure would help the preforms to deform rather than slide or wrinkle. In this study, a hemispherical punch shape along with an appropriate blank holder and the open die was utilized to investigate the influences of the warp yarn interchange ratio on the forming behaviors of 3D warp interlock fabrics. The forming device also allows adjusting the pressure values on the blank holders based on the forming test conditions. The complete and different parameters considered while investigating three forming behaviors of the different preforms in this study are listed in Table 2.
Moreover, three specimens test were repeated following the same forming conditions for each 3D warp interlock preforms to extract better measurement data along with satisfactory reproducibility. However, to give good results and achieve better comparisons, all other internal and external parameters were kept constant throughout the molding process of the different preforms.

3. Results and Discussion

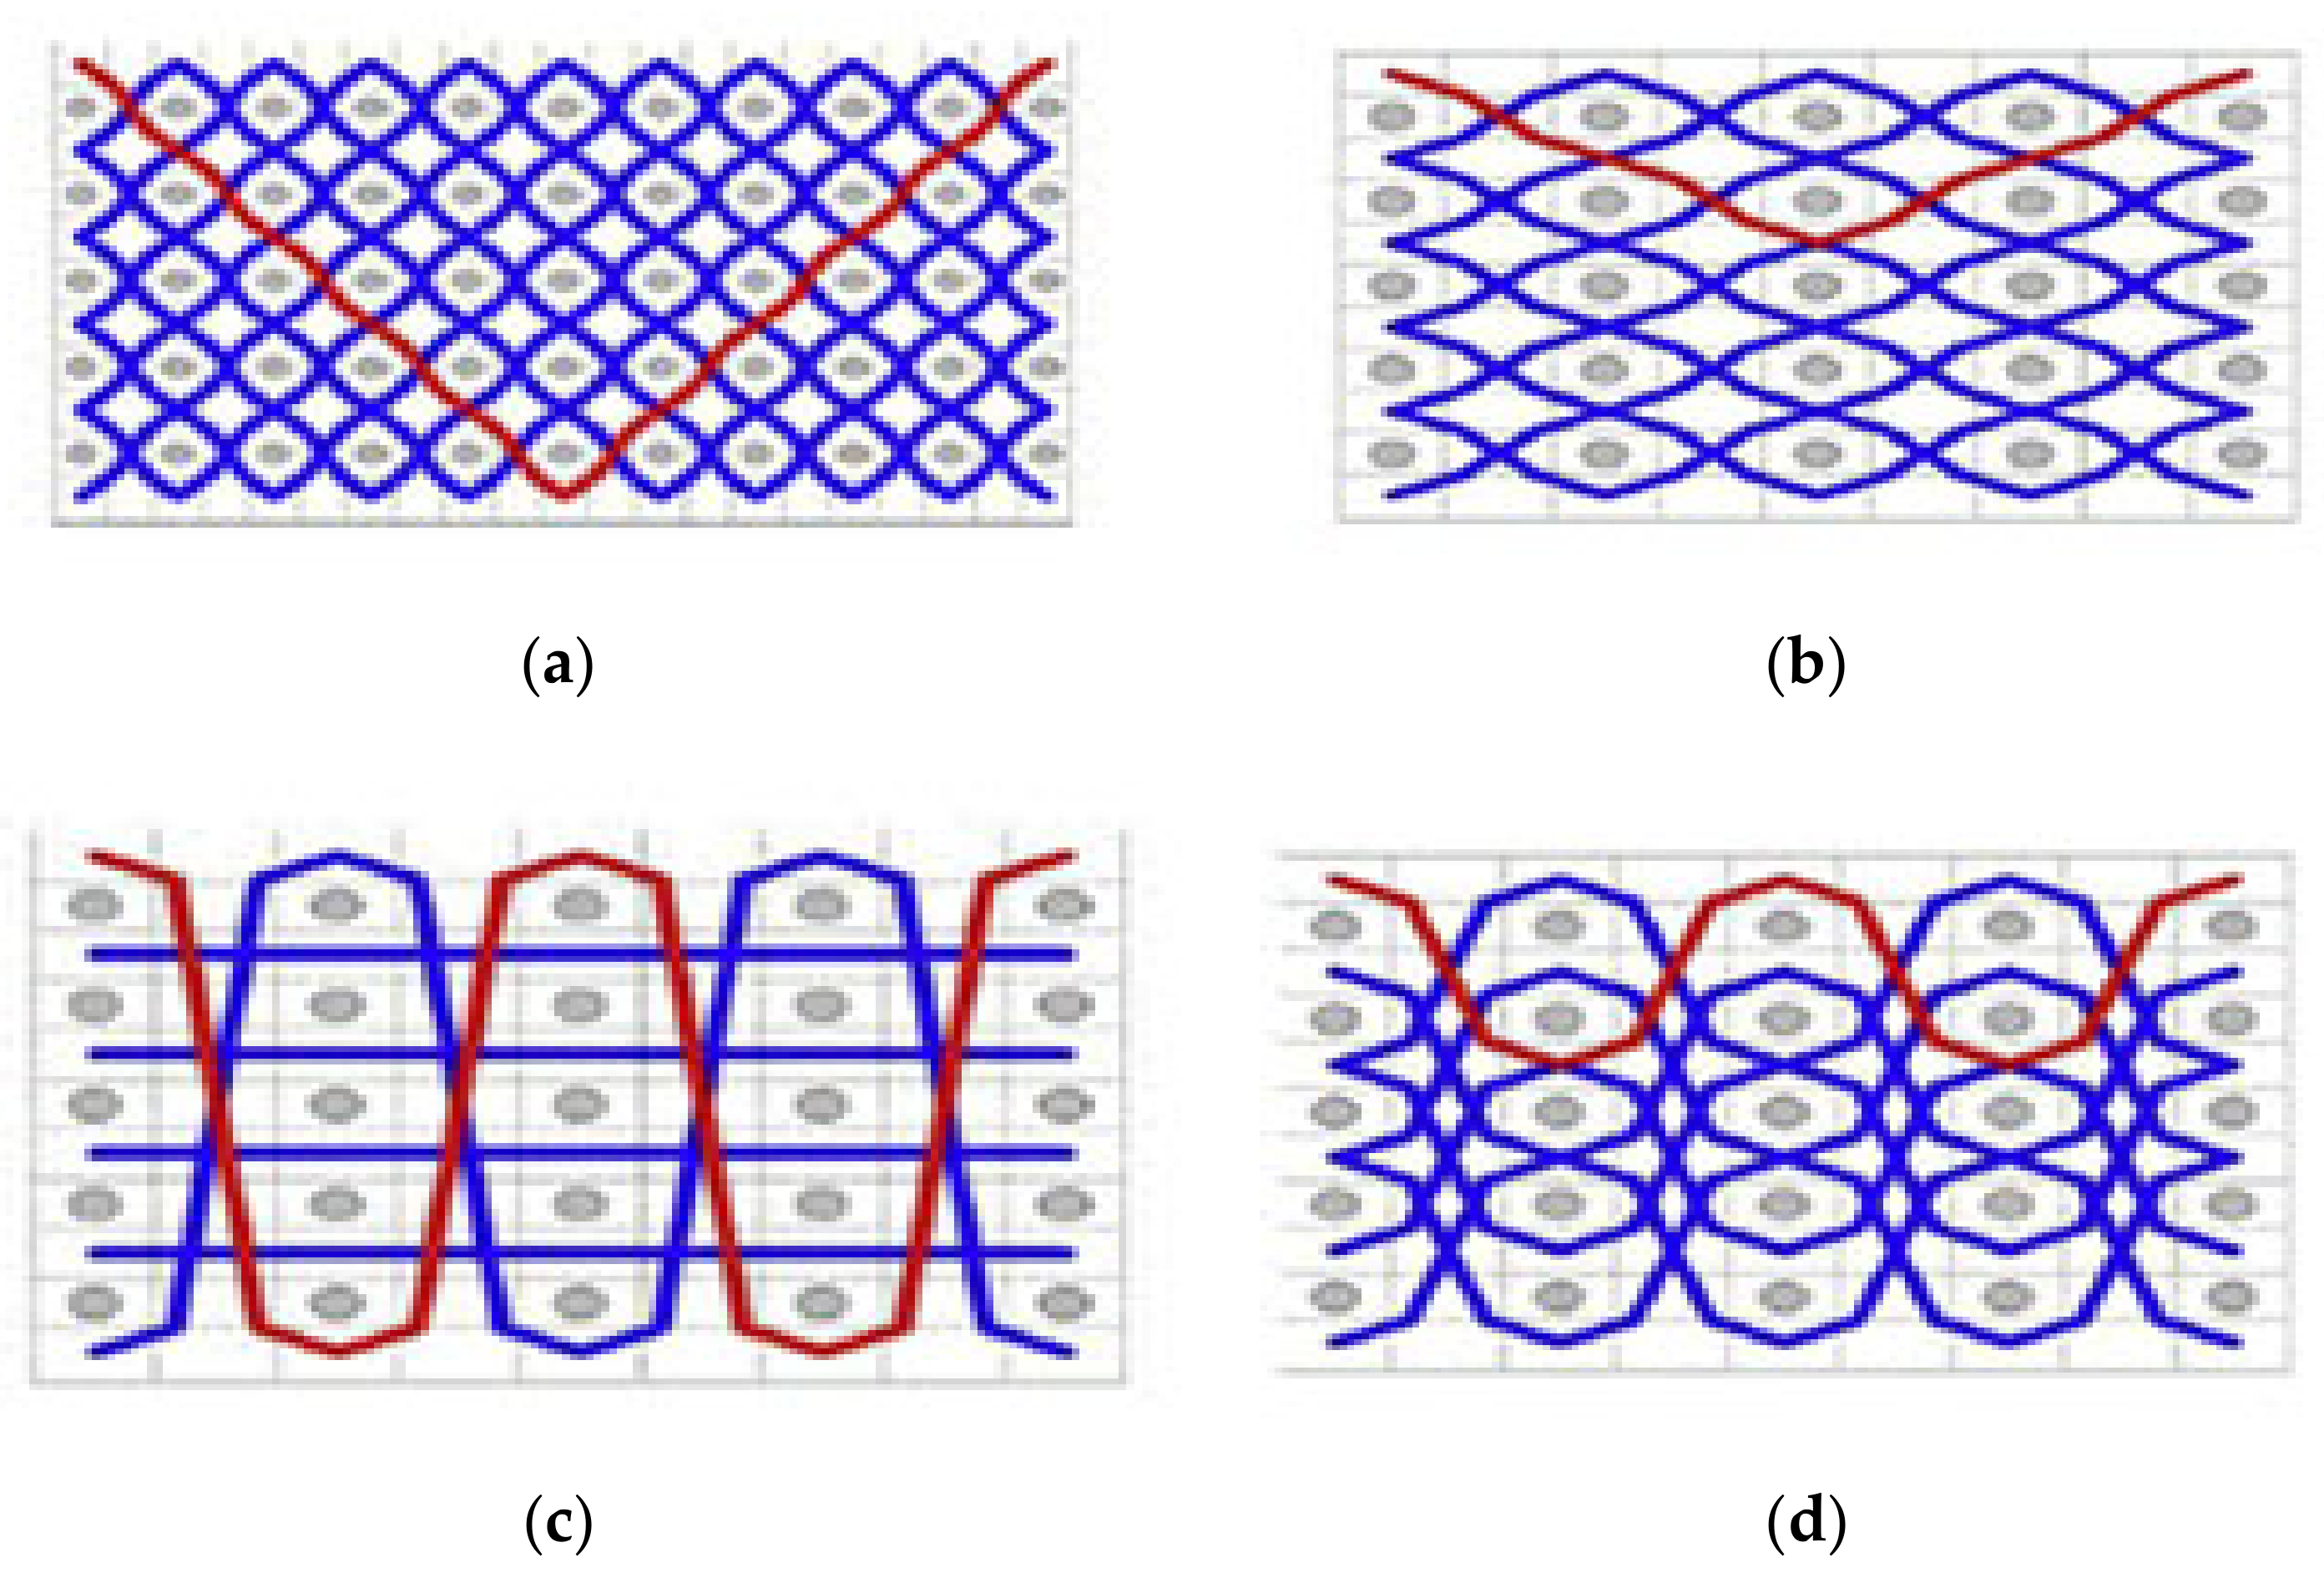
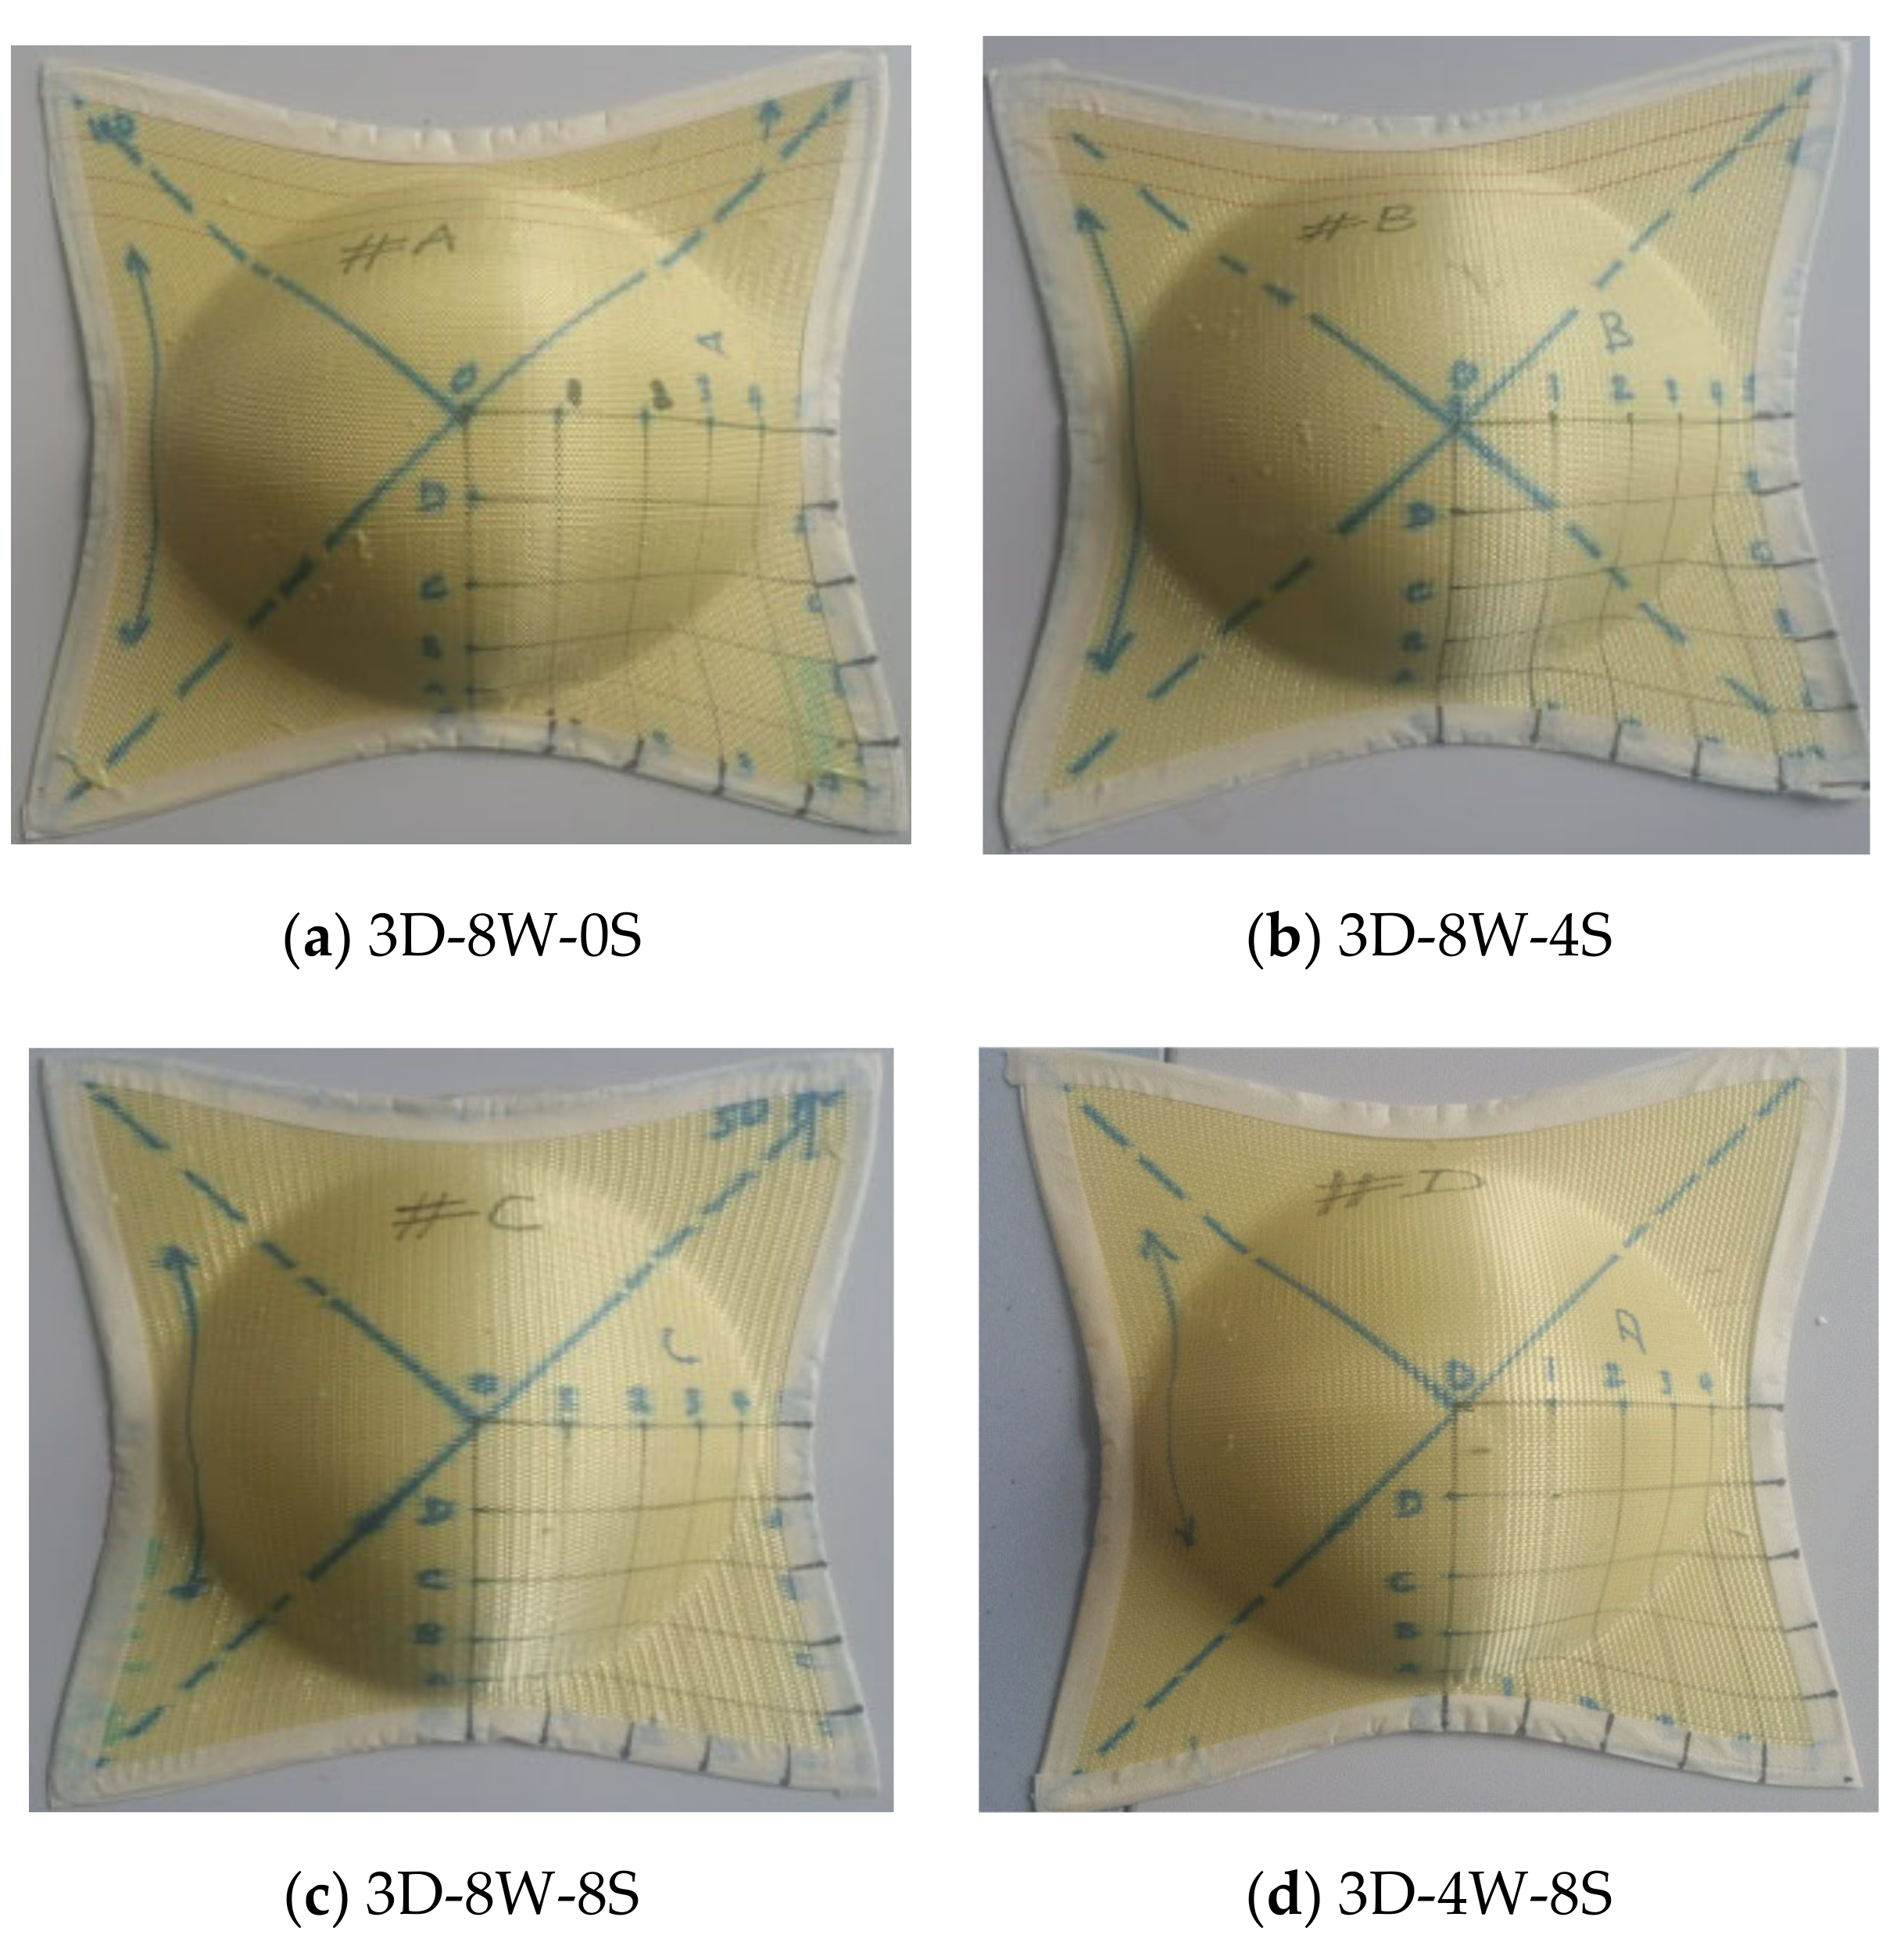
3.1. Formability Behaviors of 3D Warp Interlock Fabrics

During the forming process, the different yarn starts to move relatively and could bring lots of forming behaviors on the deformed fabrics [49]. The current study investigates the influences of the warp yarns interchange ratio on the forming characteristics of 3D warp interlock fabrics. Figure 6 shows the representative pictures of the different deformed preforms 3D warp interlock fabrics by the semi-hemispherical punch at the same testing conditions.
Normally, because of the hemispherical punch shape, all the preform exhibited symmetric and similar deformed shapes. However, the 3D warp interlock fabrics might reveal different important forming and recovery behaviors due to warp yarns interchange ratio differences. This sub-section discusses those important forming characteristics, including drawing-in, in-plane shear angle, and inter-ply sliding of the different preforms for better understanding the 3D warp interlock fabrics and its influence caused by the warp yarns interchange ratio.

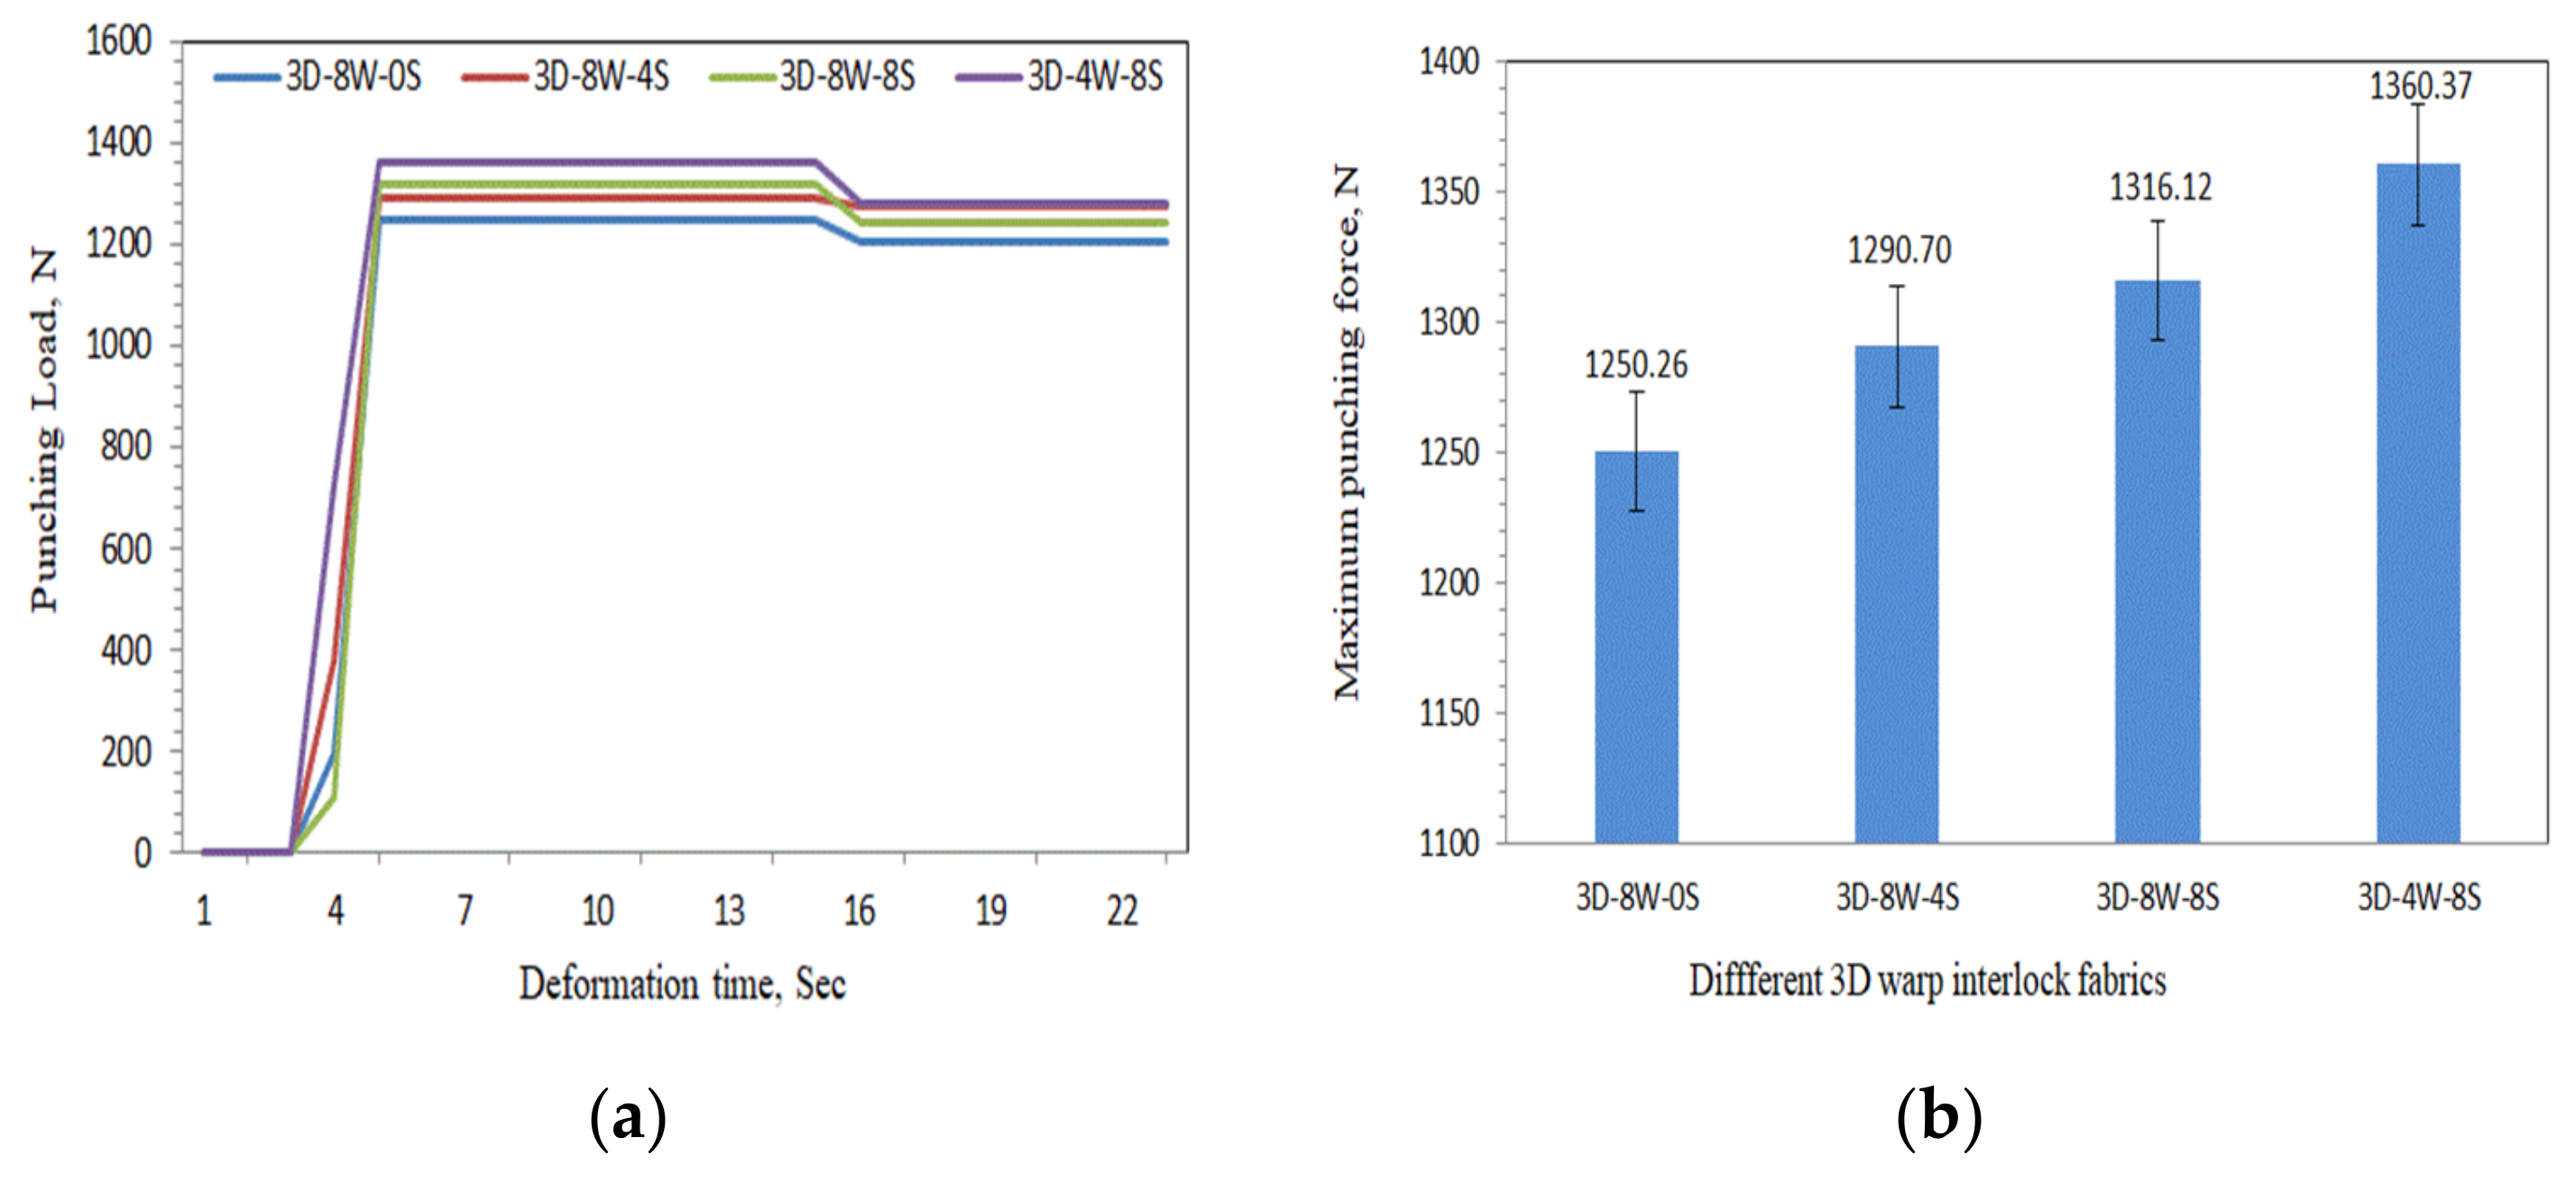
3.1.1. Influence of Warp Yarn System on the Punch Force of 3D Warp Interlock Fabric

To obtain the final deformed shape of the preform, a vertical force was constantly applied to move the punch from the bottom with the help of an electric jack along with sensors. The sensors under the electric jack were designed to measure the amount of the force applied. Regulating the amount of force applied to lift the punch from the bottom helps to properly stamp the clamped preforms by the hemispherical punch (Figure 5) for a better forming process and to avoid process defects. Owing to the sensor and its display, the different parameters including deformation time, displacement, and peak loads will be automatically recorded after the forming process. In this section, we tried to analyze the relations between the stamping forces and the deformation times for different preforms. Figure 7a shows the punching load vs. deformation time curves of the different preforms during the forming test. The results reveal similar trend evolutions of load versus deformation curves for all 3D warp interlock preforms. The load versus deformation time curve was started with insignificant loads for around three seconds until the punch tip-off the preforms. Then, the load drastically starts to increase through time while stamping the preform.
The load has continuously increased until the preform reached the maximum deformation displacement (65 mm). Finally, the force applied by the punch on the preform becomes constant through time after maximum deformational height has been reached. Moreover, the maximum punching load required for deforming and maintaining the final shape of the deformed preform of the different 3D warp interlock preform is illustrated in Figure 7b. Based on these investigations, the maximum punching loads were influenced by the binding and stuffer warp yarn interchange ratio inside 3D war interlock fabrics. The study noticeably showed that the stuffer yarns ratio shows an impact directly proportional to the punching force while forming on the different 3D warp interlock preforms. This is due to the fact that the samples with higher stuffer warp yarns ratio possess fewer yarn undulations in the warp direction which in turn needs a higher amount of punching loads to deform the preforms to the maximum deformational depth. Sample 3D-8W-0S and 3D-4W-8S revealed the minimum and maximum punching loads of 1250.26 and 1360.37 N respectively. Moreover, Sample 3D-8W-8S and 3D-8W-4S recorded 1290.7 and 1316.13 N respectively to deform the preform to maximum depth.

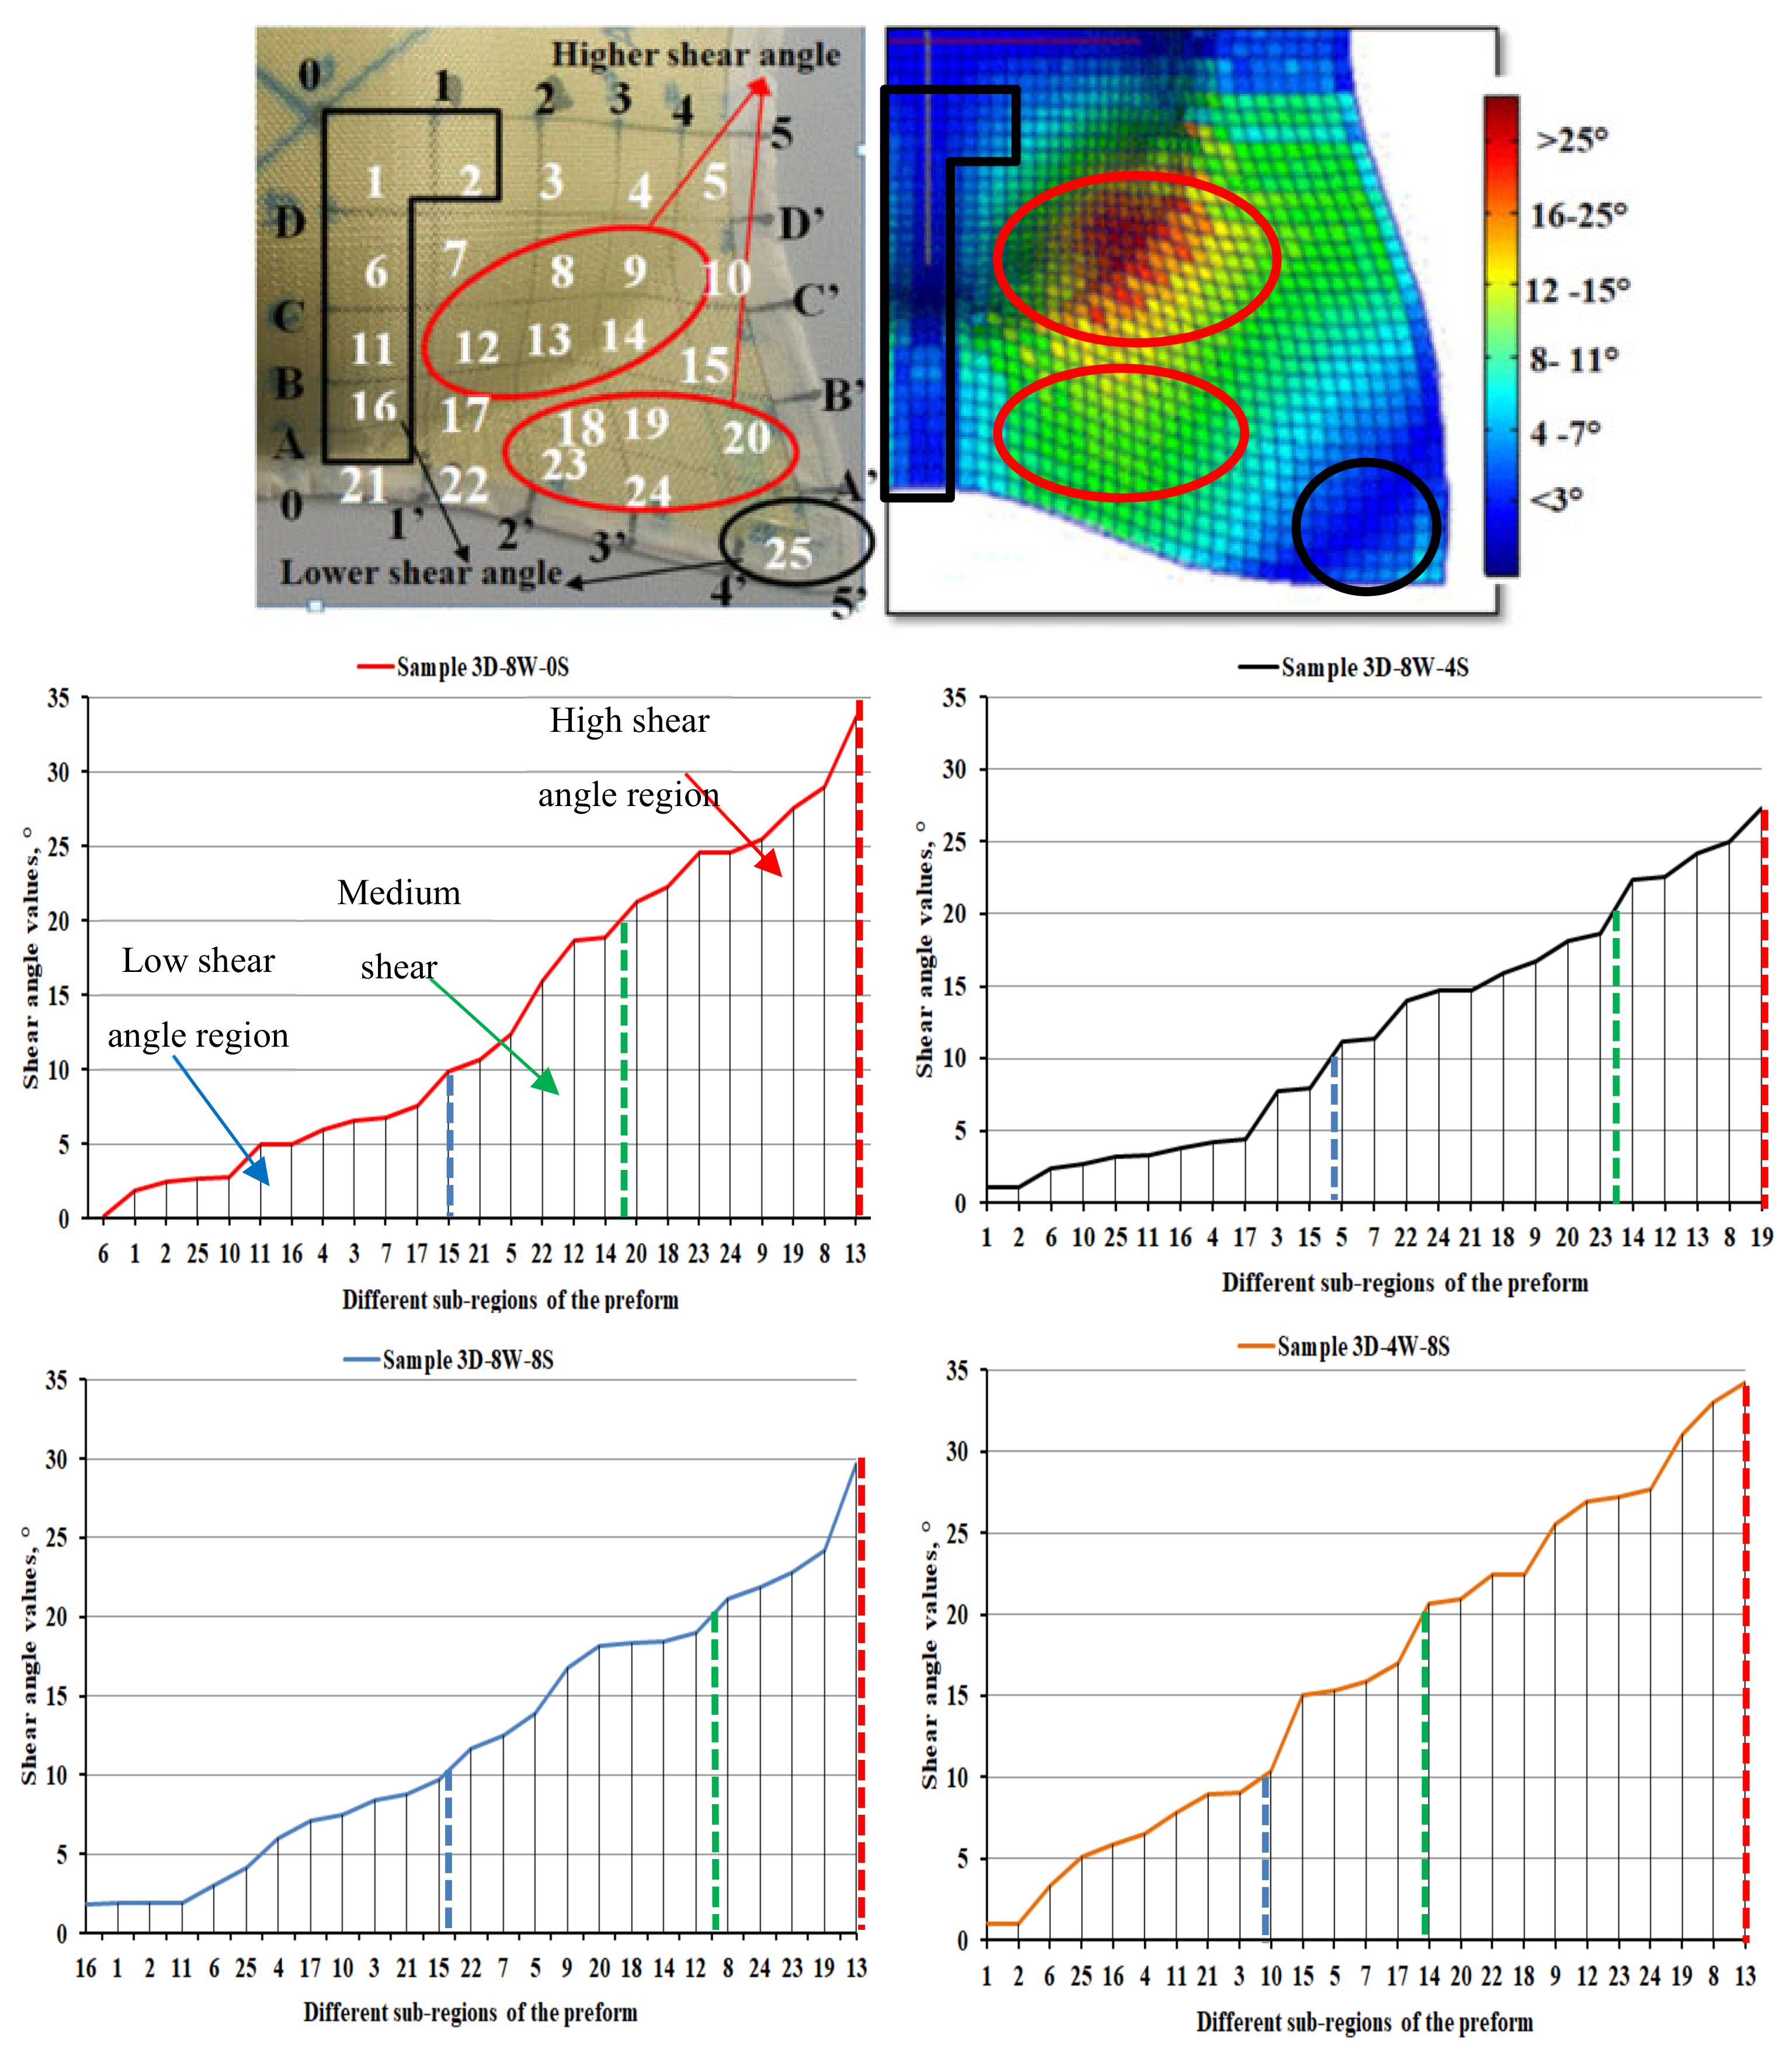
3.1.2. Influence of Warp Yarn System on the In-Plane Shear Angle

The inter-ply and intra-ply shearing are among the most common deformational modes of the textile preform that might exist during the formability process. The forming of multi-layer fabric preforms involves significant amounts of both intra-ply shearing and inter–ply sliding effect while the fabrics undergo the deformation process. However, unlike multi-layered fabric preforms, 3D woven fabric forming faces considerable amounts of intra-ply shearing than inter-ply sliding due to the better linking of the different weft layers throughout the thickness by the binder warp yarns. Moreover, in textile material deformation, the intra-ply shearing effect is mainly associated with the in-plane shear angle. The intra-ply shear angle is an angle mostly measured between the orthogonal complement of warp and weft yarn at the crossover which is used to measure the amount of fabric shear deformation. It is also analyzed based on the fiber orientation on the top surface of the preforms. However, to better analyze and compare the different preforms’ in-plane shear angles, it should be measured on the deformed preform surface where there are lower or insignificant amounts of wrinkles. This is because wrinkling is one of the forming defects which makes the shearing angle measurements difficult and might not give better result analysis of surface shear angle between the different deformed preforms [50,51]. Figure 8 indicated the pictorial and its schematic representations of in-plane shear and its recovery angles for the selected sub-regions of the preform. As shown in Figure 8, θ is the perpendicular angle between the warp and weft yarns at initial/positions before forming a test and measured mostly on the preform surface. The deformation by the de-crimping of the interlaced yarn to conform to the intended compound curvature creates the in-plane shear angle, δ, which was developed between the weft and warp yarns at the crossover. So, the shear angle between the yarns on the preform surface has been measured and computed as follows:
δ = θ µ  
where;
  • δ is the in-plane shear angle
  • θ is the initial angle measured between the yarns (mostly 90°), µ is the angle measured between the weft and warp yarns after immediate deformation.
Normally, the orientations of the fiber/yarn tend to return to the original position after releasing the punching load on the deformed preforms. However, depending on the positions of shear on the preform surface, the initial angle measurement values inside the sub-region could be higher when negatively deviate or lower (positive deviation) as compared to the recovery angle. For example, as it is observed in Figure 8b of sub-region 18, the measured angle at immediate deformation (µ) was negatively deviated and found to be higher than the measured angle after recovery (ρ) measurement, (µ > ρ). On the contrary, in Figure 8c of sub-region 16, the immediate angle measurement after deformation (µ) was positively deviated and recorded lower values as compared to the recovered angle (ρ) measurement, (µ < ρ). This is because through time the orientations of yarn tend to return to its original angle orientation (θ). As it is also discussed in the experimental section, like other forming characteristics, the different angles were efficiently captured by the inbuilt digital camera and extracted with the help of ImageJ software for better analysis. Figure 9 shows the experimental and numerical representations of the in-plane shear angle and its measurements of the different 3D warp interlock preforms in the selected one quadrant sub-regions.
For quick and better observation and comparisons, the different sub-regions of the preforms were further clustered into three regions namely: Low, Medium, and High in-plane shear angle regions. Based on the analysis, in general, all samples show a similar trend of in-plane shear angle values in different clustered regions. High in-plane shear angle values were observed and accumulated both around the neck and corner-end near the neck regions of the deformed preforms. For example, both the deformed preforms around the neck area of sub-region 8, 9, 12, 13, and 14, and the majority of the flat surfaces near the neck of sub-regions 19, 20 23, and 24 were laid on the high in-plane shear angle clustered regions as compared to the other sub-regions. On the contrary, the center top deformed preform of sub-region 1, 2, 3, 4, 6, 10, 11, 16, and 25, and the peripheral edges of the preforms sub-region 5, 15, 21, and 25 were located at low in-plane shear angle cluster region. However, according to the observation, all the preforms do not have similar sub-regions that could locate on the medium in-plane shear angle regions. Moreover, the in-plane shear angle values of the 3D warp interlock fabrics were also greatly affected by the interchange ratio of binding and stuffer yarns in the warp direction. According to these observations, as the compositions of the stuffer warp yarns inside the 3D warp interlock fabric structure increases, the in-plane shear angles were observed to be higher in a majority of the region. Samples 3D-4W-8S and 3D-8W-0S showed higher in-plane shear angles whereas samples 3D-8W-4S and 3D-8W-8S revealed relatively lower or nearly equivalent in-plane shear angle values in most of the sub-regions. This is due to the presence of an unbalanced warp yarns interchange ratio that could reduce the stability of the preforms and might increase the deformation shearing effect on the preforms. Therefore, yarns in such preform which is made of unbalanced warp yarns ratio would be then easily disturbed and create a higher shear while forming easily. The maximum and minimum shear angles of samples 3D-8W-0S and 3D-4W-8S recorded a shear angle of 34° and 28° and 1.042° and 0.142° respectively. Besides, a numerical model was developed to predict the deformational behavior of the multi-layer 3D warp interlock preforms. Explicit finite element simulations using the commercially available software (Abaqus FEA) have been performed for hemisphere geometry to understand the influence of the warp yarn composition as shown in Figure 9. According to the numerical simulations obtained by using the commercially available software (Abaqus FEA), it can be also seen that the predicted final shape and the different local shear angles of different sub-regions in one-quarter of the preformed dry fabric have shown a good agreement with the experimental result.

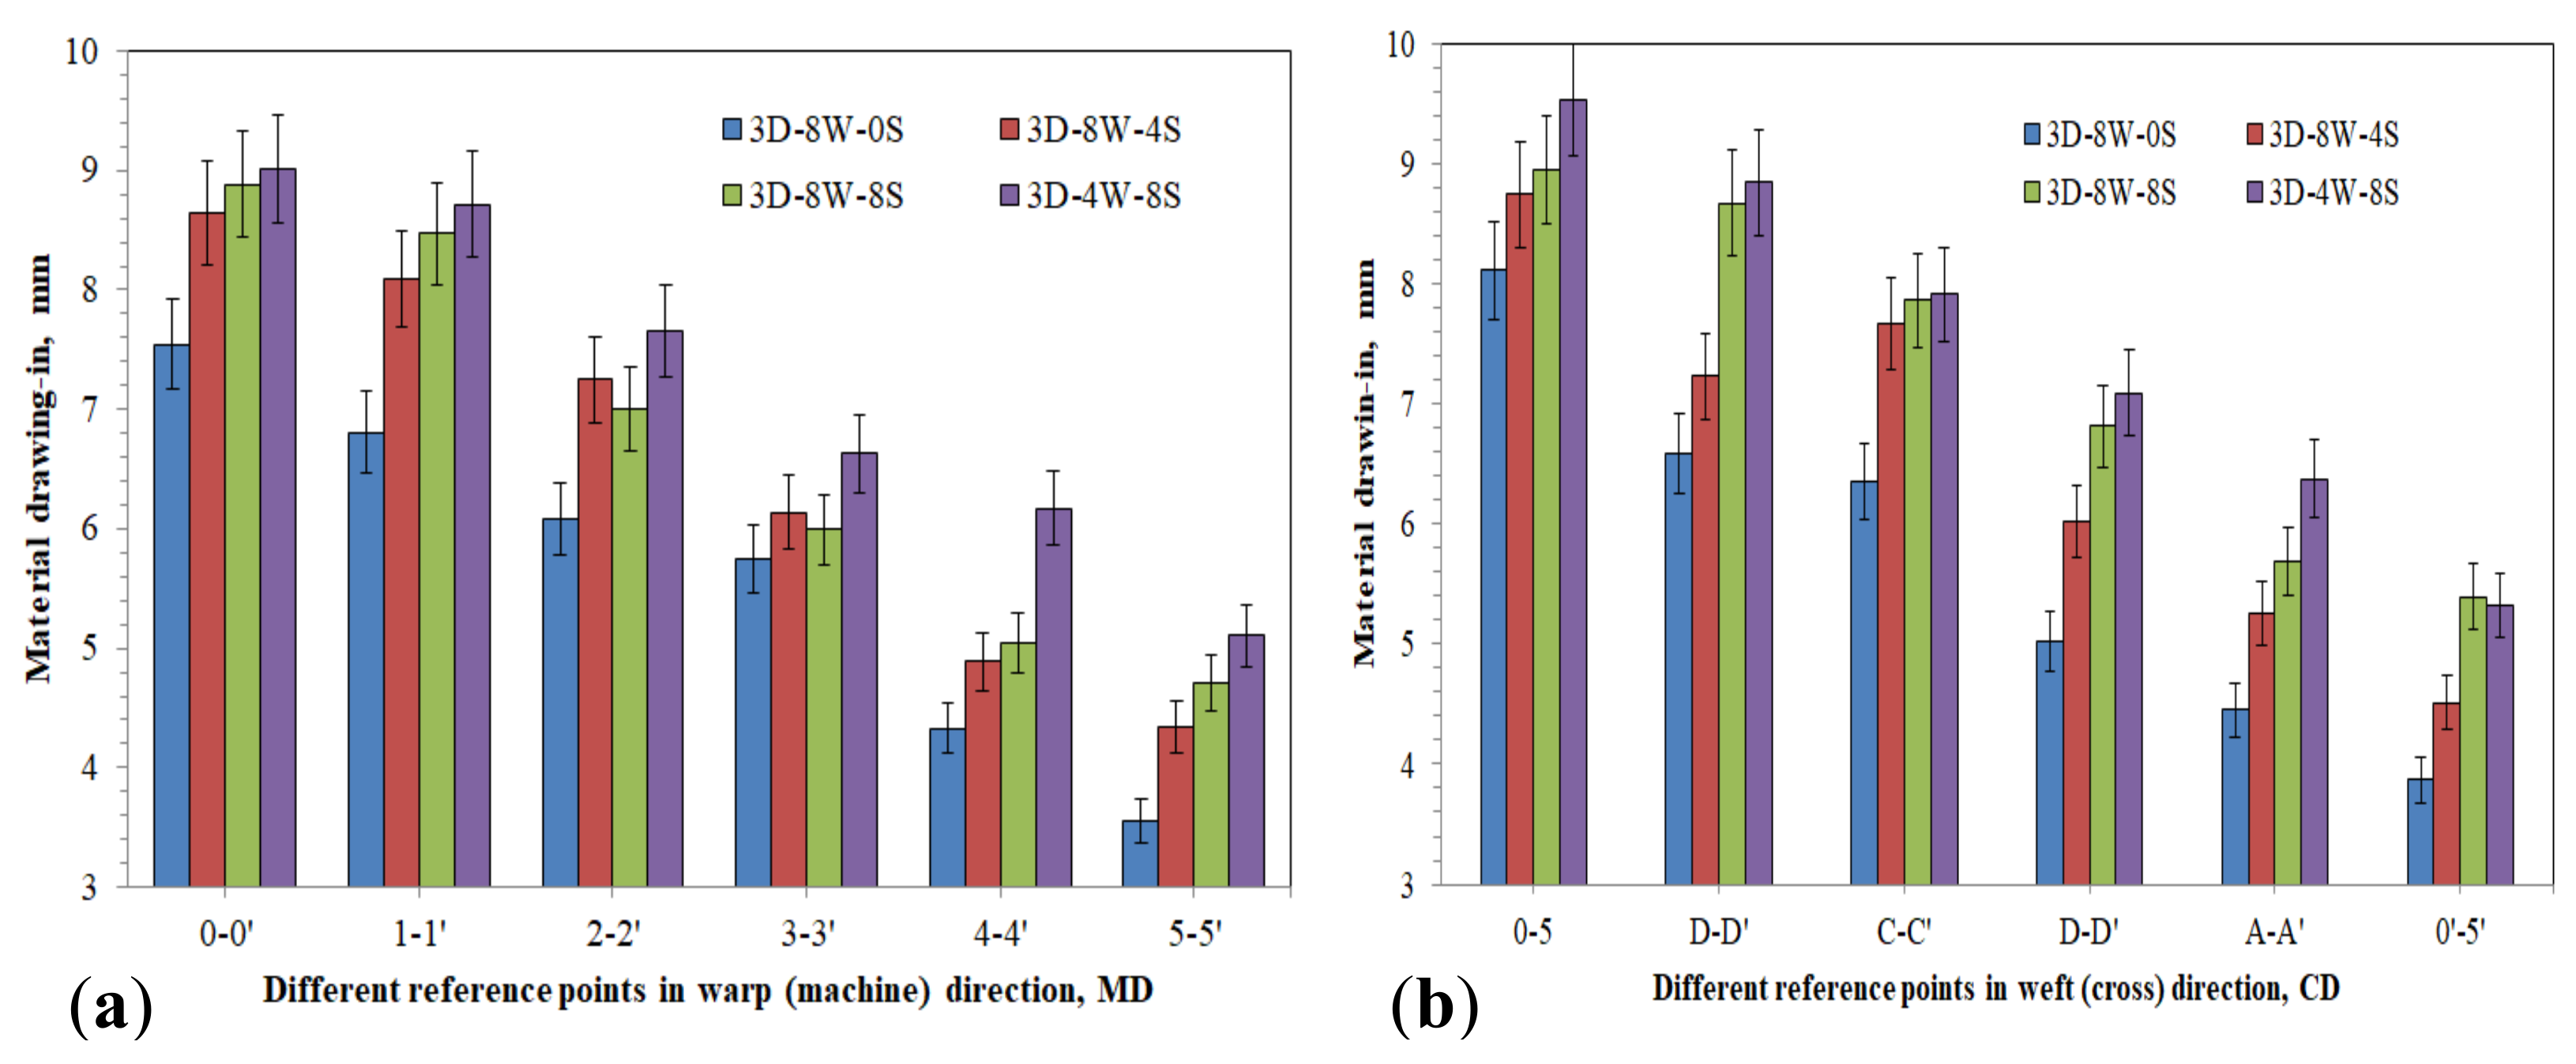
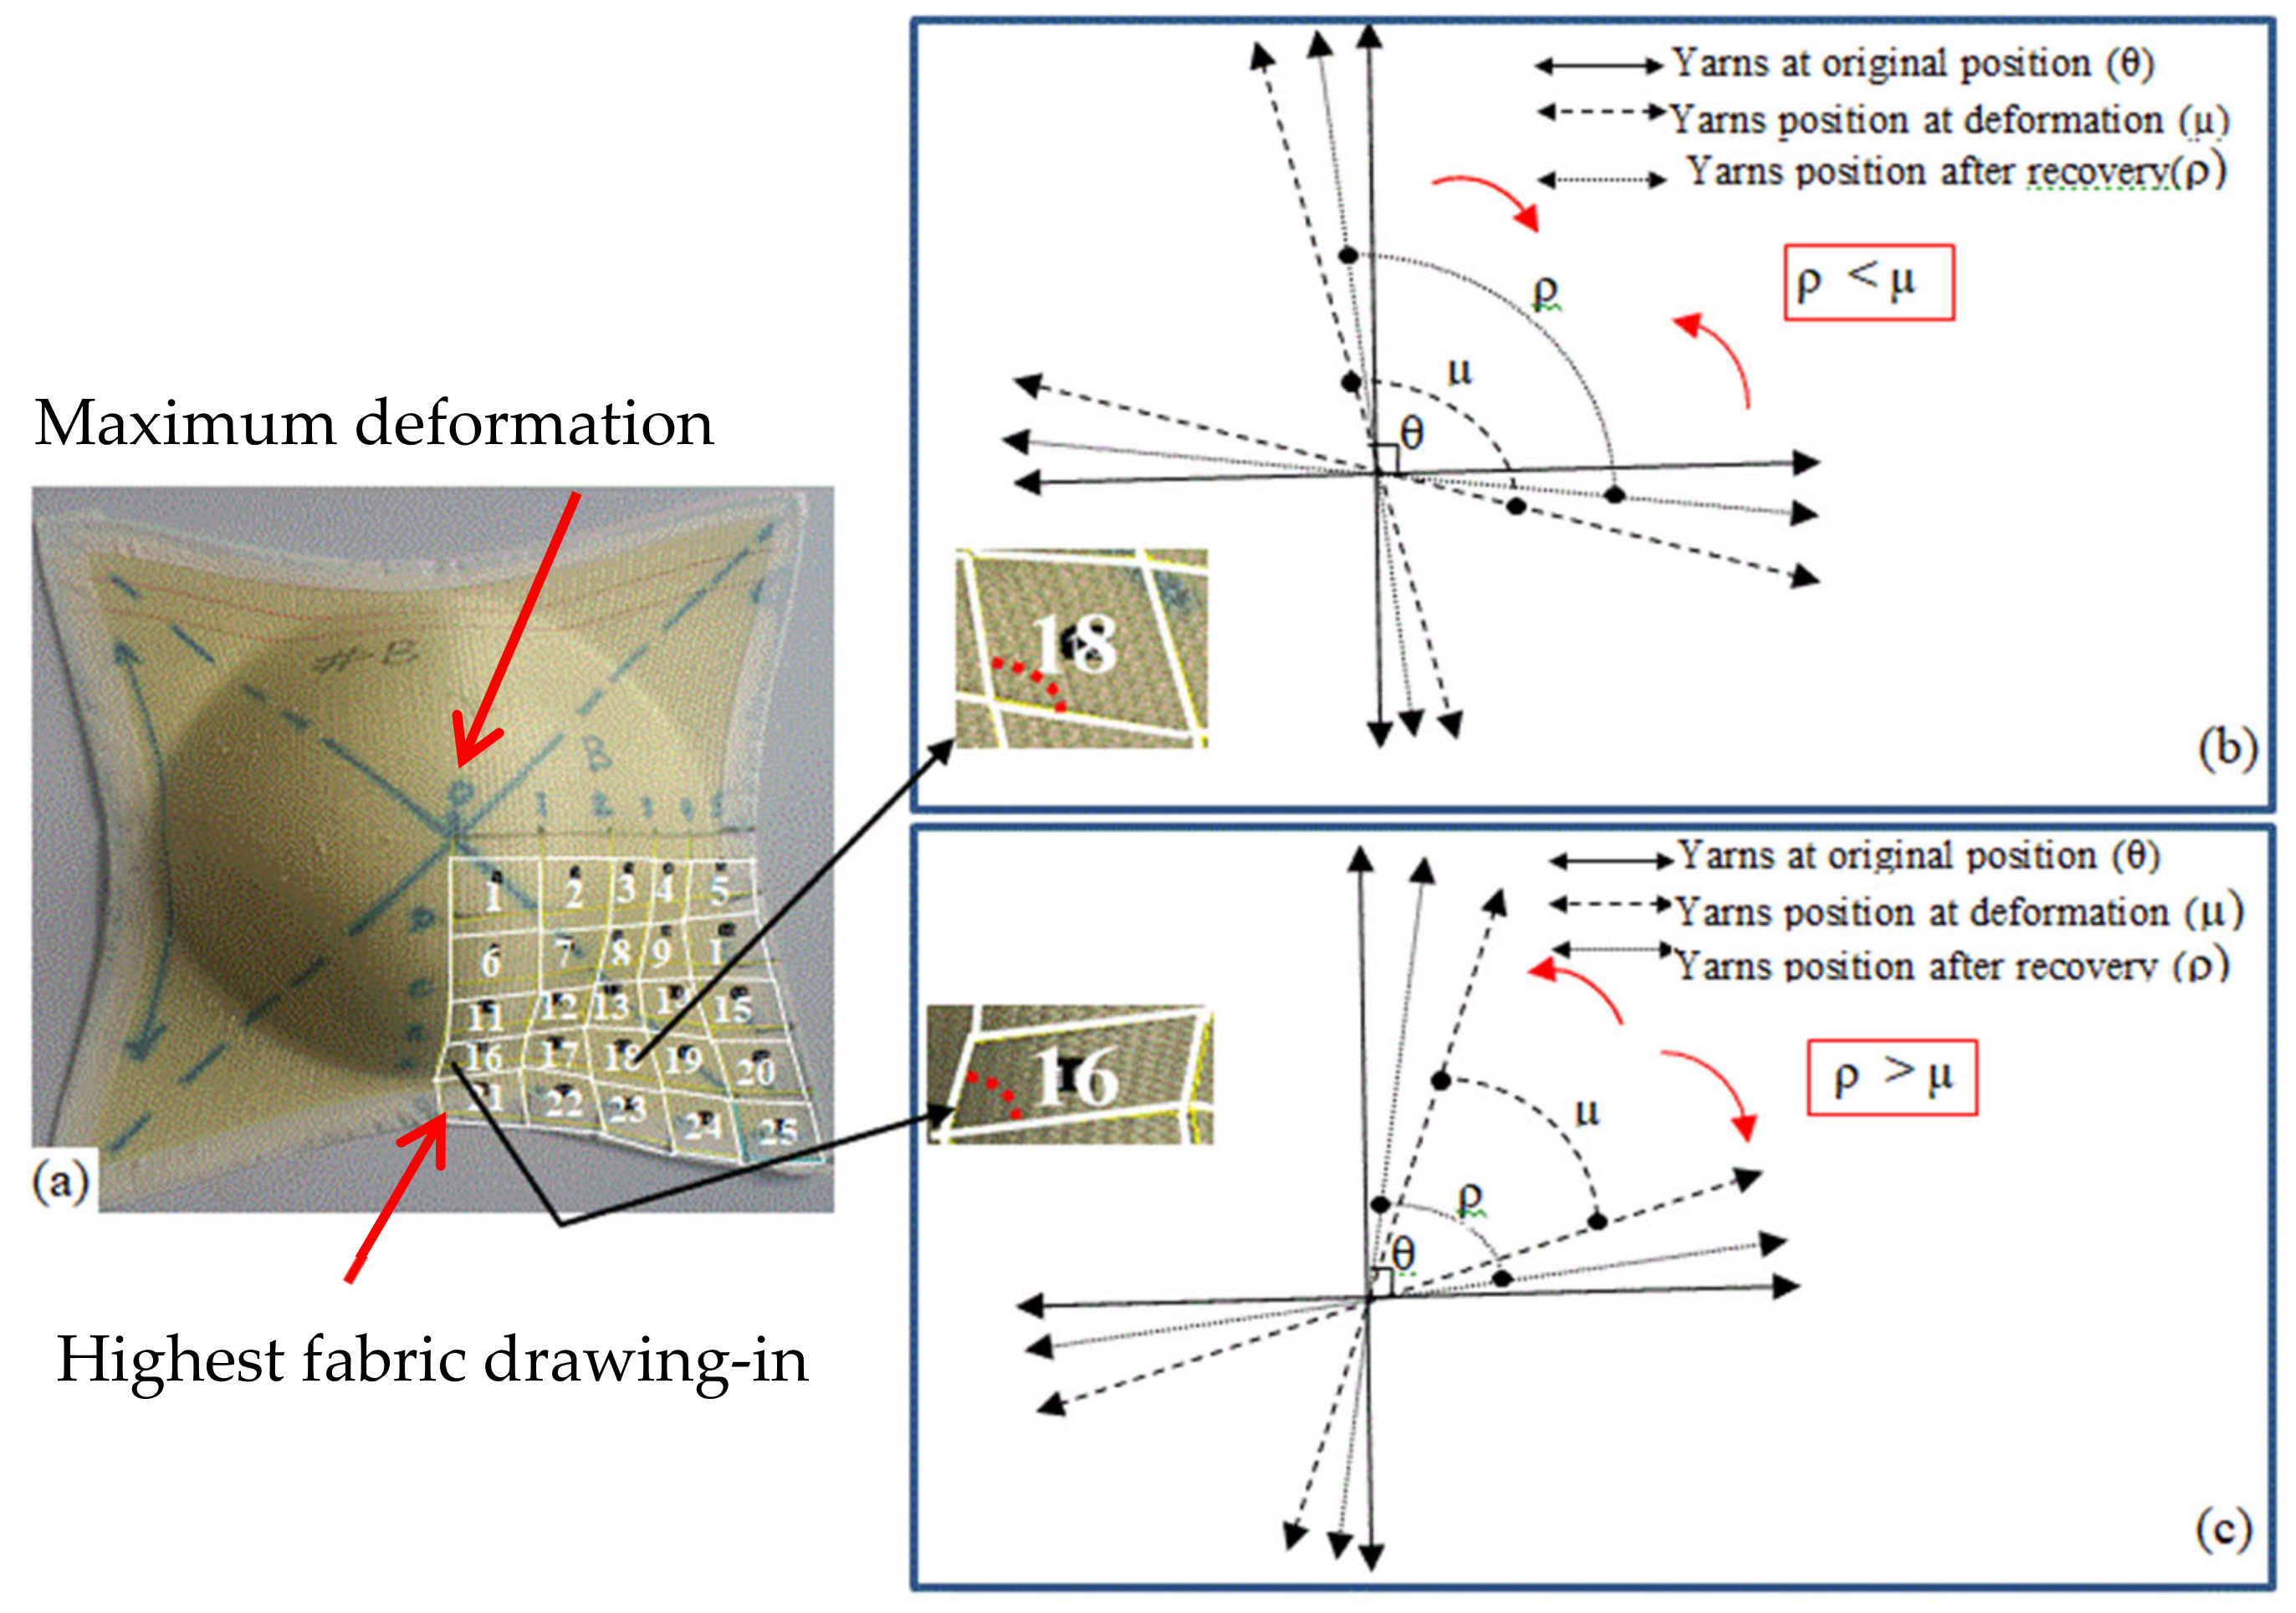
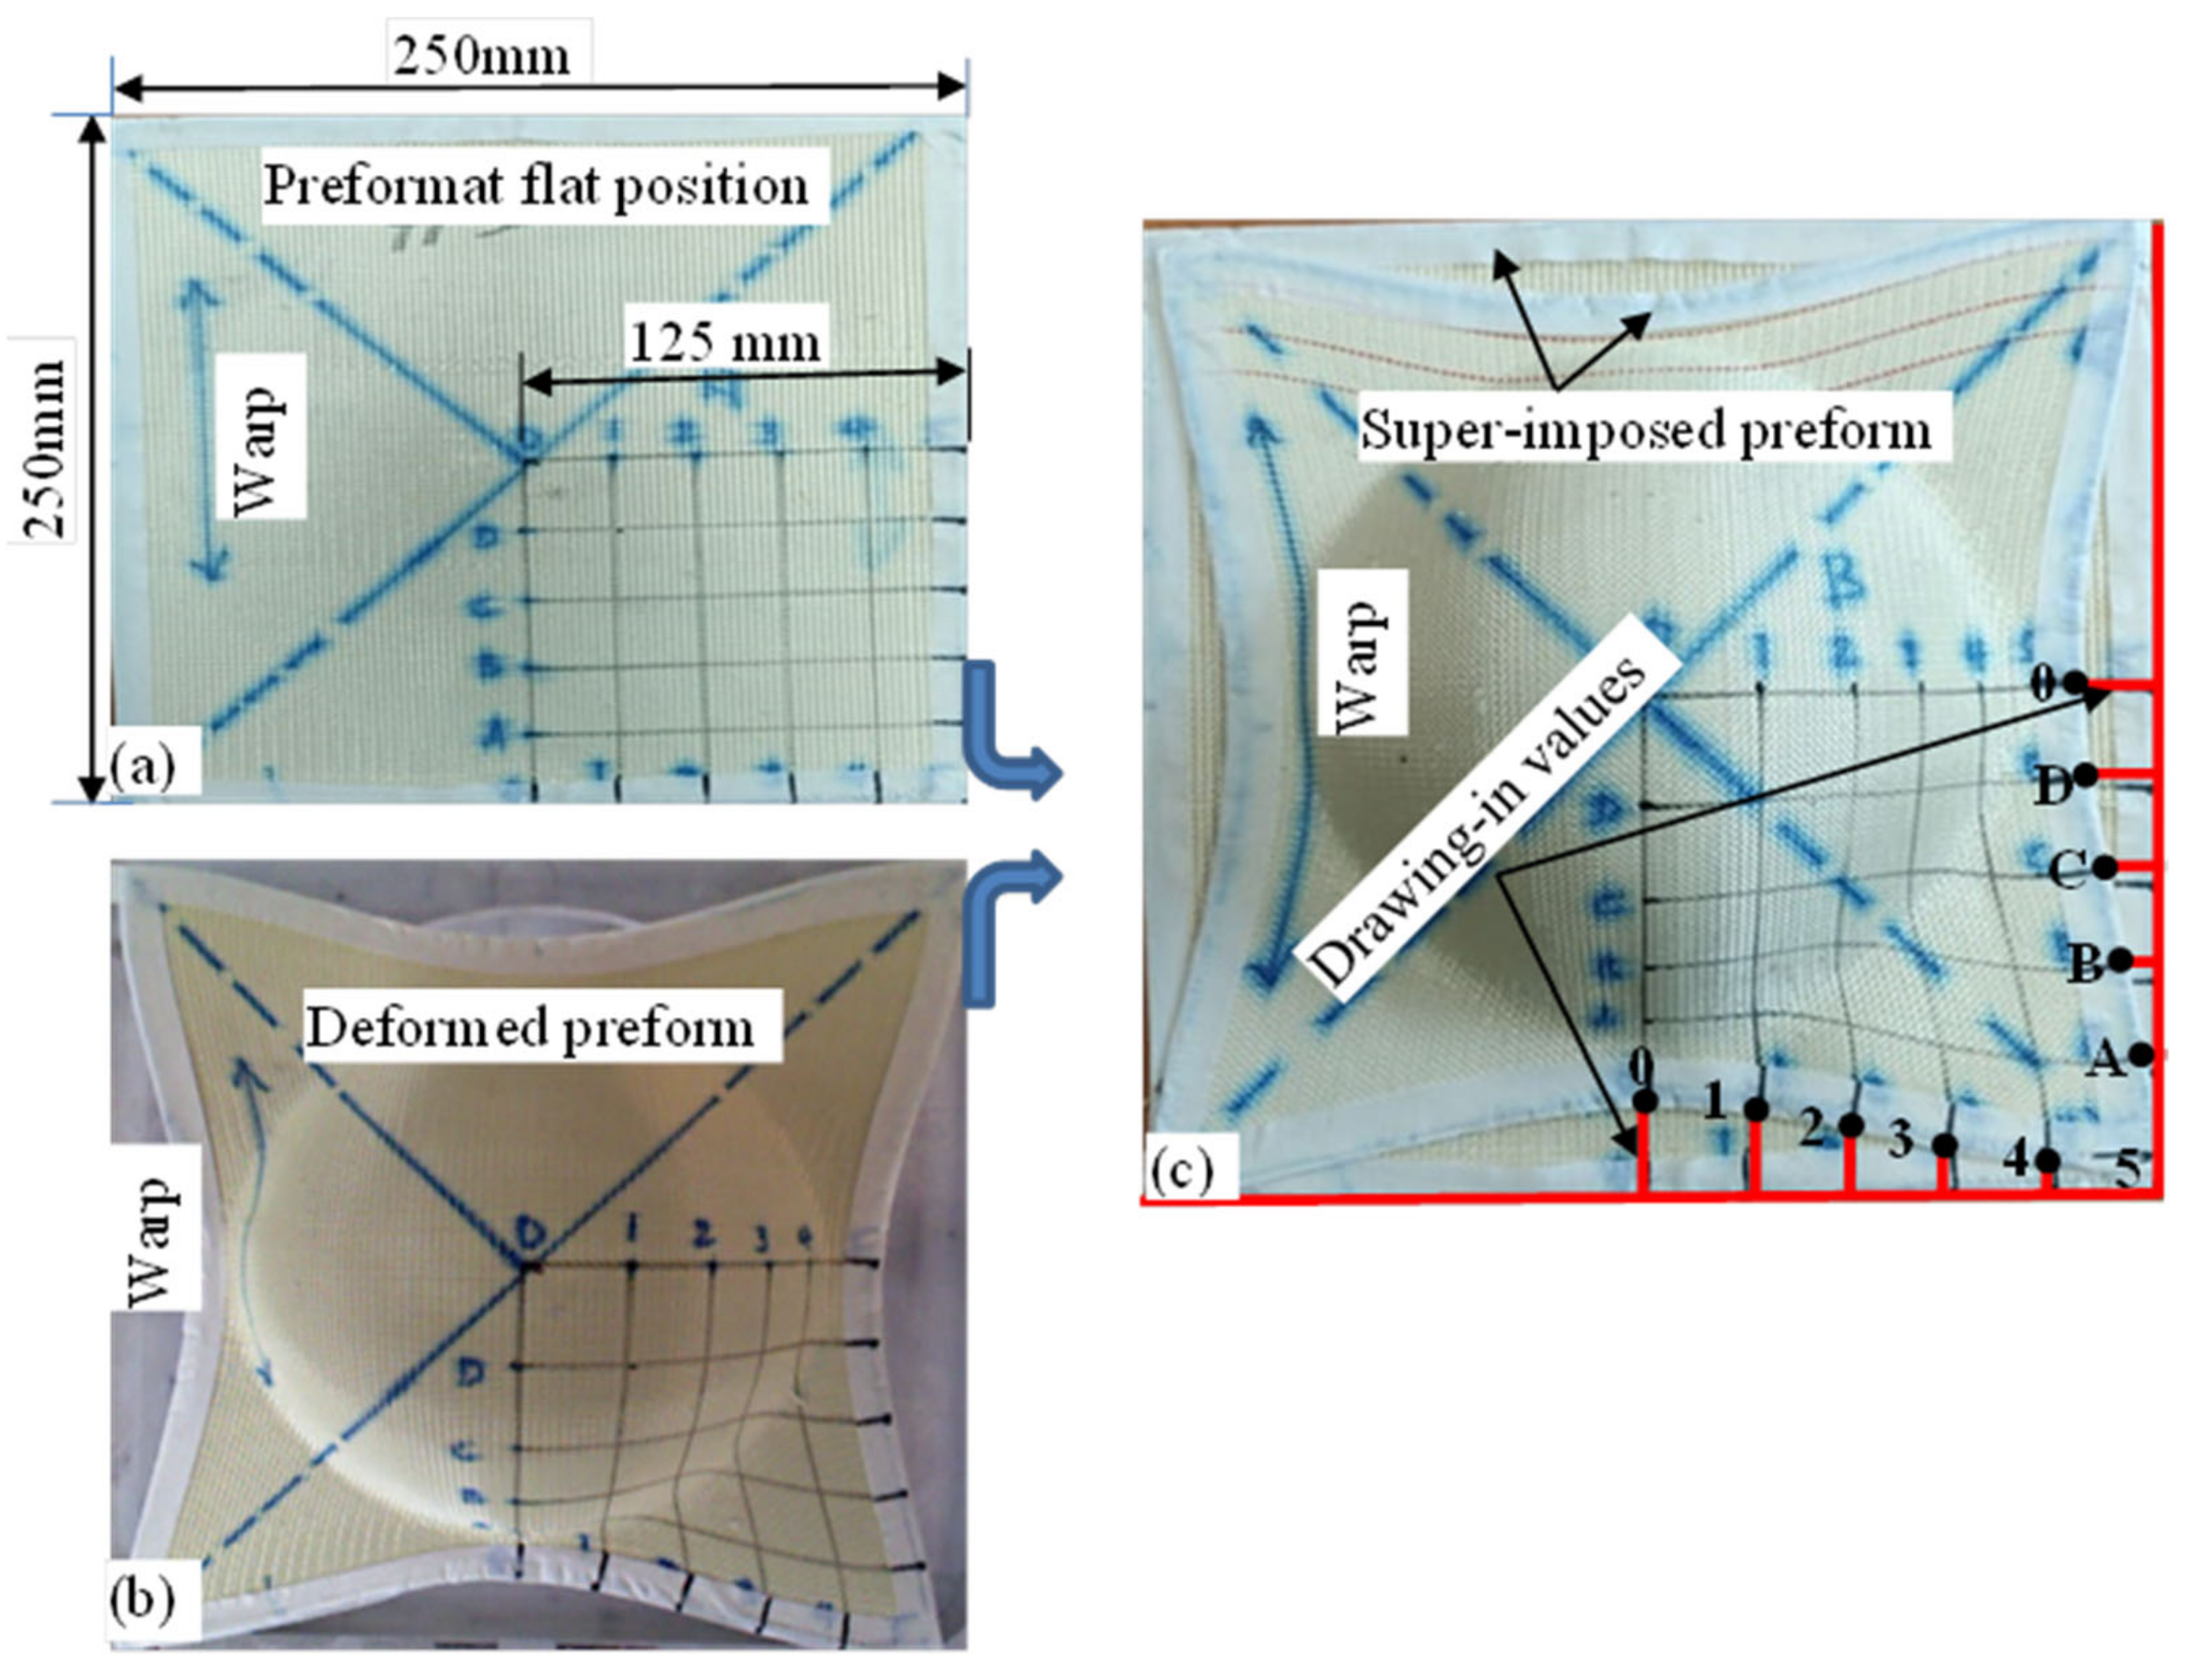
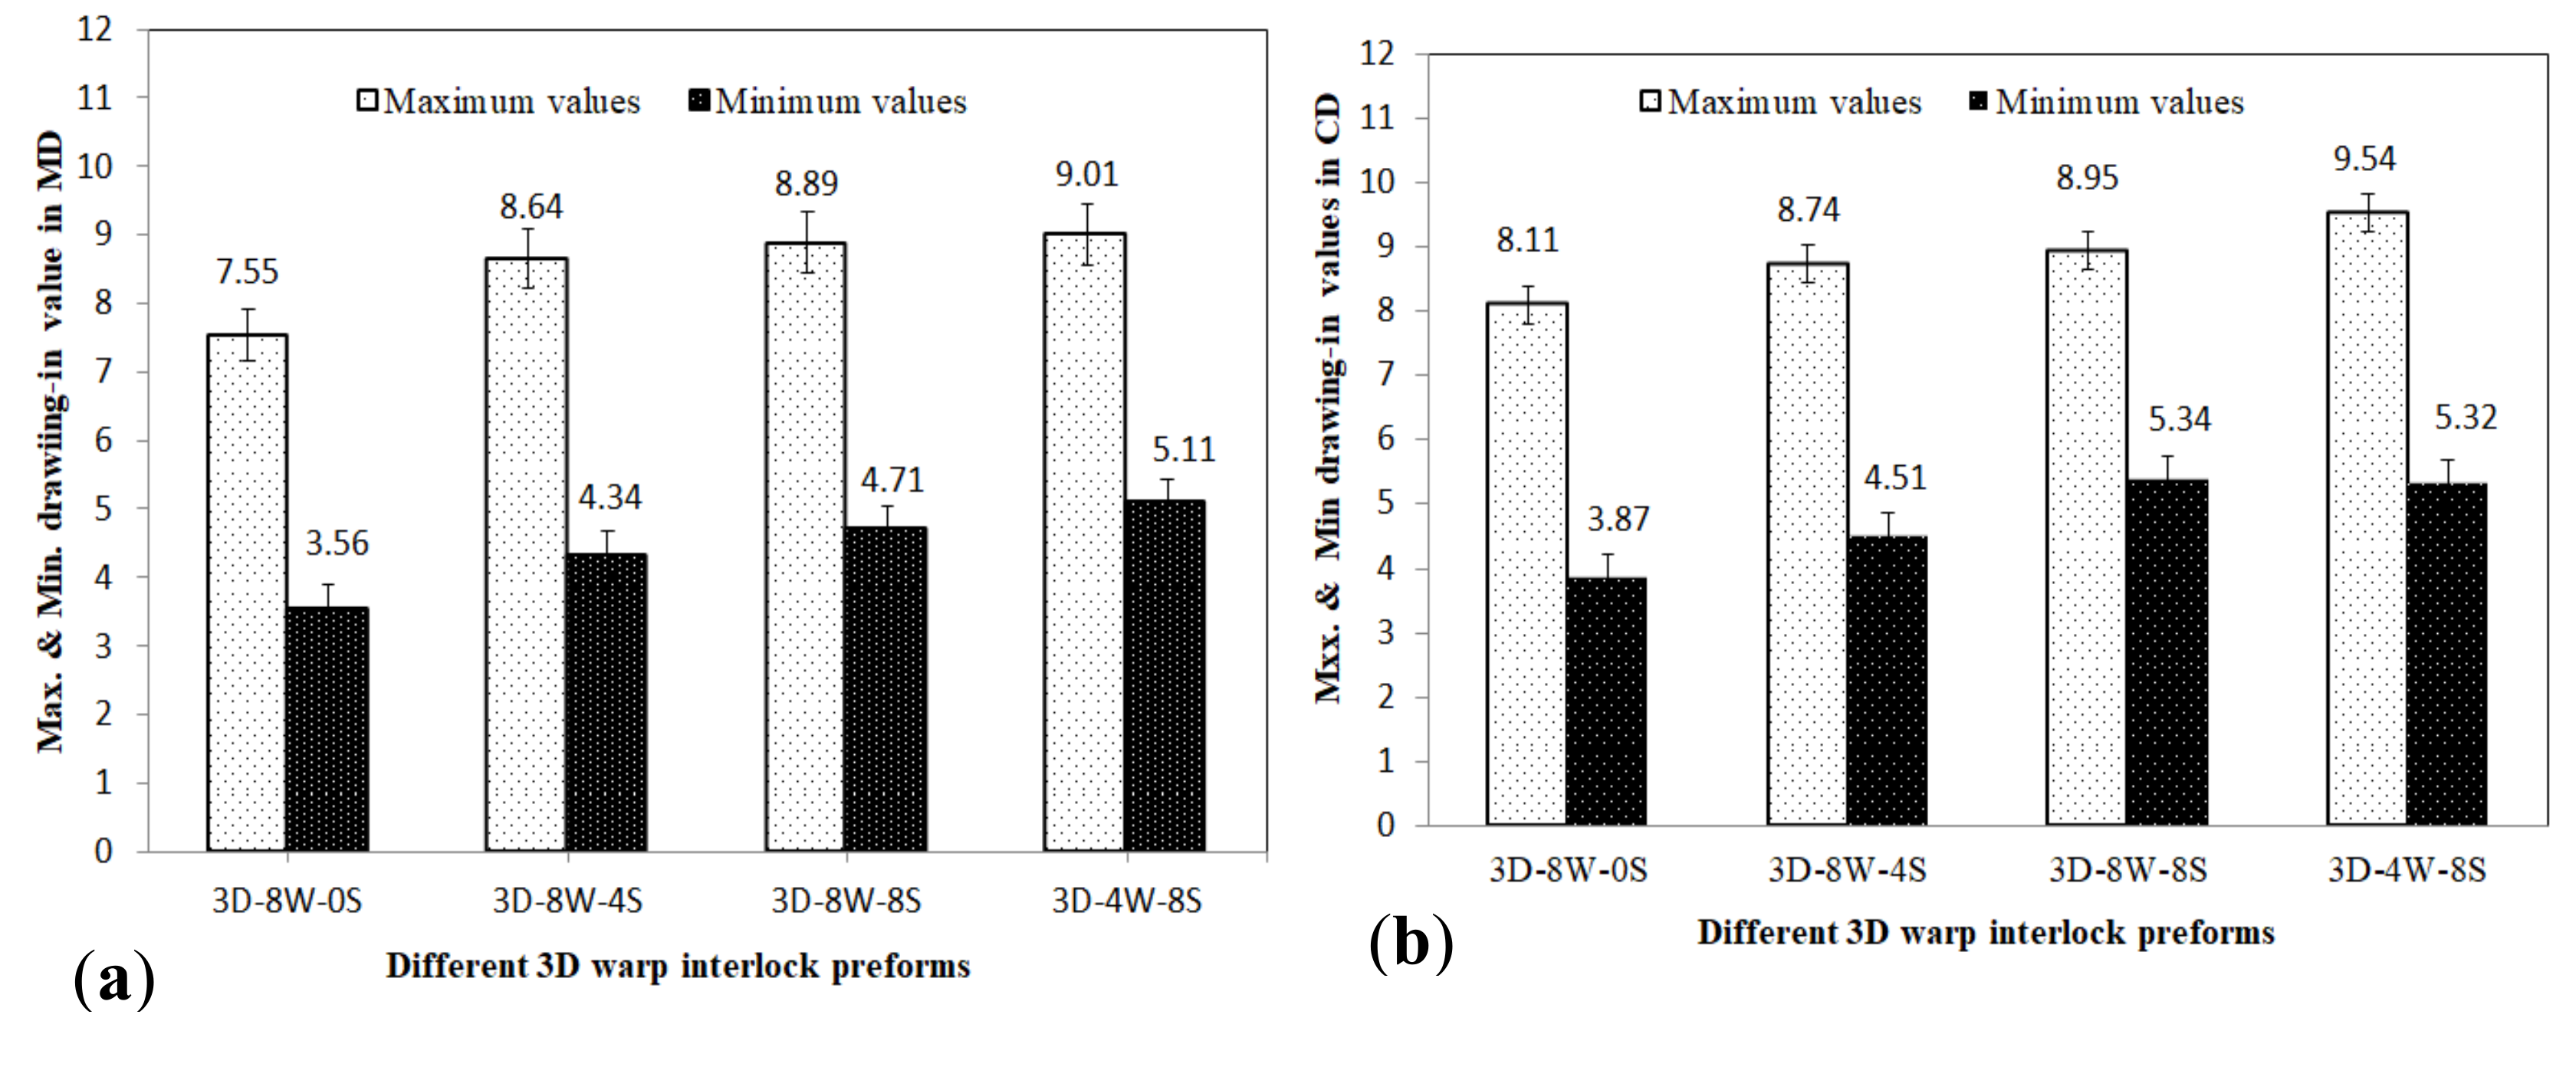
3.1.3. Influence of Warp Yarn in Material Drawing-In Values

In this section, the influences of binding and stuffer warp yarns interchange ratio on drawing-in values of 3D warp interlock preform are tested in hemispherical forming processes. Generally, when the dry fabric preform undergoes the forming process, some of the preform dimensions in warp and weft directions could be consumed because of deformations. The consumed length is the measurement that occurs when the preform surface draws toward the center or to the region where maximum deformation took place. Thus, it is very critical and interesting to understand the drawing-in values of different material preforms while deformation before applying specific applications. The consumptions of the preform length measurement could be different at various preform positions depending on the shape of the punch. For example, during formability using a single-curved hemispherical punch, the fabric sample region with maximum deformation depth tends to consume the maximum length (maximum drawing-in) toward the center as shown in Figure 8a. However, not only the punching shape (diameter and depth) but also various factors would also contribute to the drawing-in values. Based on researches, the preform binding pressure, stamping load, preform thickness, material types, and fabric architectures were also some of the factors which greatly affect the drawing-in values [51,52]. Like shear angle measurements, the video taken by the inbuilt camera on the top of the forming machine was extracted by the ImageJ software to compute the different drawing-in values at different positions. Figure 10a–c shows the flat, deformed, and flat-deformed super-imposed preform representations to compute the material drawing-in values at designated different positions.
As discussed in experimental methods (Figure 3), only 1/4th regions of the preforms were considered for analysis because of their quasi-symmetric forming properties. The average value of the three tested preforms with the same testing conditions is presented.
Figure 11a,b shows the representation of the drawing-in values at different positions both in the weft and warp directions respectively. As per the general observations, the involvements of different proportions of binding and stuffer warp yarns greatly influence the material drawing-in values of 3D warp interlock preforms at different positions both in machines (warp, MD) and cross (weft, CD) directions. The involvements of stuffer warp yarn directly proportional to the preforms’ drawing-in values. As shown in Figure 11a, as the stuffer warp yarn interchange ratio inside the fabric structure increases, the drawing-in values were found higher in all defined positions. Samples having a higher stuffer warp yarns ratio inside the structure, for example, sample 3D-4W-8S, revealed higher drawing-in values. On the contrary, preform with no stuffer yarn, sample 3D-4W-8S, exhibited the minimum drawing-in values among all the preforms at all reference positions. Moreover, preform 3D-8W-8S revealed higher drawing-in values in the majority of the measured positions as compared to its counterpart sample, sample 3D-8W-4S. The main reason for this would be the involvement of binding warp yarn inside the fabric increases, due to its higher yarn undulations/waviness property, the preforms will not be quickly drawing-in toward the center of the punching region until all the undulated yarns are fully straightened [53]. Figure 12 represents the waviness structure of both the stuffer and binding yarns which are taken from the preform 3D-8W-8S. As the punching process proceeds, the preform will start to drawing-in only after the straightening of the yarn is completed. This delay of drawing-in due to the straightening of the waviness of the yarn inside the fabrics has shown a negative effect on the final drawing-in values of the preform.
On the contrary, fabric with more stuffer warp yarn, for example, 3D-4W-8S, will start drawing-in toward the center of the punch due to very low undulations of the yarn in the fabric as the punching load starts to apply. This means that as the punching load is applied, the fabric directly starts to draw-in toward the center without the straightening process of the yarn inside the fabrics. As shown in Figure 12b, the interchange ratio of the warp yarn in the machine direction was also affected by the drawing-in values of the preform in the cross-direction. Considering all the parameters in the cross (weft) direction are similar, as the interchange ratio of binding warp yarns in the machine direction increase, the drawing-values in the cross direction were also recorded lower and vice-versa. This is because the presence of different warp yarns system in the fabrics will also impose different compression loads on the weft yarns. However, the result still revealed a lowered drawing-in values in the cross (weft) direction as compared to its corresponding machine (warp) direction at similar reference measured positions. This is because of the involvement of higher yarn waviness in machine directions to absorb some of the punching load before the drawing-in phenomenon takes place. Moreover, the maximum and minimum drawing-in values of different 3D warp interlock preform deformation both in machine and cross direction at various reference positions are presented in Figure 12a,b. In general, the maximum and minimum drawing-in values were achieved at the top center (MD (0-0′) and CD (0-5)) and far corner peripheral edges (MD (5-5′) and CD (0-5′)) of the preform respectively for all fabric types.
3D-4S-8W and 3D-8WS-0S preforms possess the highest and lowest drawing-in values both in the machine and cross direction among other preforms as shown in Figure 13a,b. 3D-4S-8W achieved a 1.46 mm (16.2%) and 1.43 mm (14.99%) higher drawing-in values than sample 3D-8W-0S in the machine (0-0′) and cross (0-5) directions of maximum drawing-in positions respectively. Similarly, 1.55 mm (30%) and 1.45 mm (27.25%) increments were observed at the minimum machine (5-5′) and cross (0-5′) reference position of 3D-4S-8W than sample 3D-8W-0S. Besides, both samples 3D-8W-8S and 3D-8W-4S have also exhibited higher and lower drawing-in values than 3D-8W-0S and 3D-4W-8S respectively both in machine and cross directions. For example, sample 3D-8W-4S noted lower drawing-values by 0.8 mm (8.3%) in the cross (weft) and 0.37 mm (4%) in the machine (warp) maximum positions. Similarly, sample 3D-8W-8S also revealed lower drawing values by 0.59 mm (6%) in the cross (weft) and 0.12 (1.3%) in the machine (warp) maximum positions. Furthermore, for all the preforms, the maximum and minimum drawing-in values were recorded slightly higher values in cross direction as compared to the machine direction. For instance, sample 3D-4W-8S shows a 0.53 mm (5%) and 0.21 mm (3%) increment at maximum and minimum draw-in positions respectively in the cross direction than machine direction. In the same way, 3D-8W-8S also revealed an increment of 0.06 mm (0.06%) at maximum and 0.63 (1.1%) in minimum draw-in positions of values in cross direction than machine direction. From this, it can be also concluded that within the same preforms the interchange warp ratio in warp direction has played a great role in lowering the material draw-in in the machine direction.

3.2. Material Forming Recovery Characteristics

After releasing the specific punching loads which are used for deformation, the different forming behaviors of the textile material start to recover from its deformational state (formed initial dimension) through time to the original position mainly in three dimensions (height, length, and thickness). Because of the complexity of textile mechanics, even though it is very difficult to fully understand the recovery behavior of the material, still it is also possible to use some quantitative analysis to compute its recovery behavior. Understanding of such behaviors would help to define the suitability of an engineered material for particular applications. While using forming as manufacturing techniques, besides determining how much the textile material resists the forming loads and sustain its maximum loads, it is also very important to understand how the material behaves in the recovery of the deformed positions while removing the forming load [49]. The recovery properties of the textile material after forming might be either important (where an anesthetic requirement is predominant, such as most apparel or furnishing uses) or insignificant in some industrial applications (soft body armor, composite parts, flat-spotting of tires, etc.). Normally, such recovery performance of the textile material is mainly dependent on the different parameters which are involved during the forming process. In this section, we tried to discuss the influences of the warp yarn interchange ratio on the different 3D warp interlock preform recovery behaviors after releasing the deformational loads by hemispherical punches. This includes the drawing-in recovery, maximum deformed depth recovery, and in-plane shear angle recovery of 3D warp interlocks fabrics. The deformed preforms were kept in the standard atmospheric conditions (20 °C at 65% RH) for 48 h before recovery measurements.

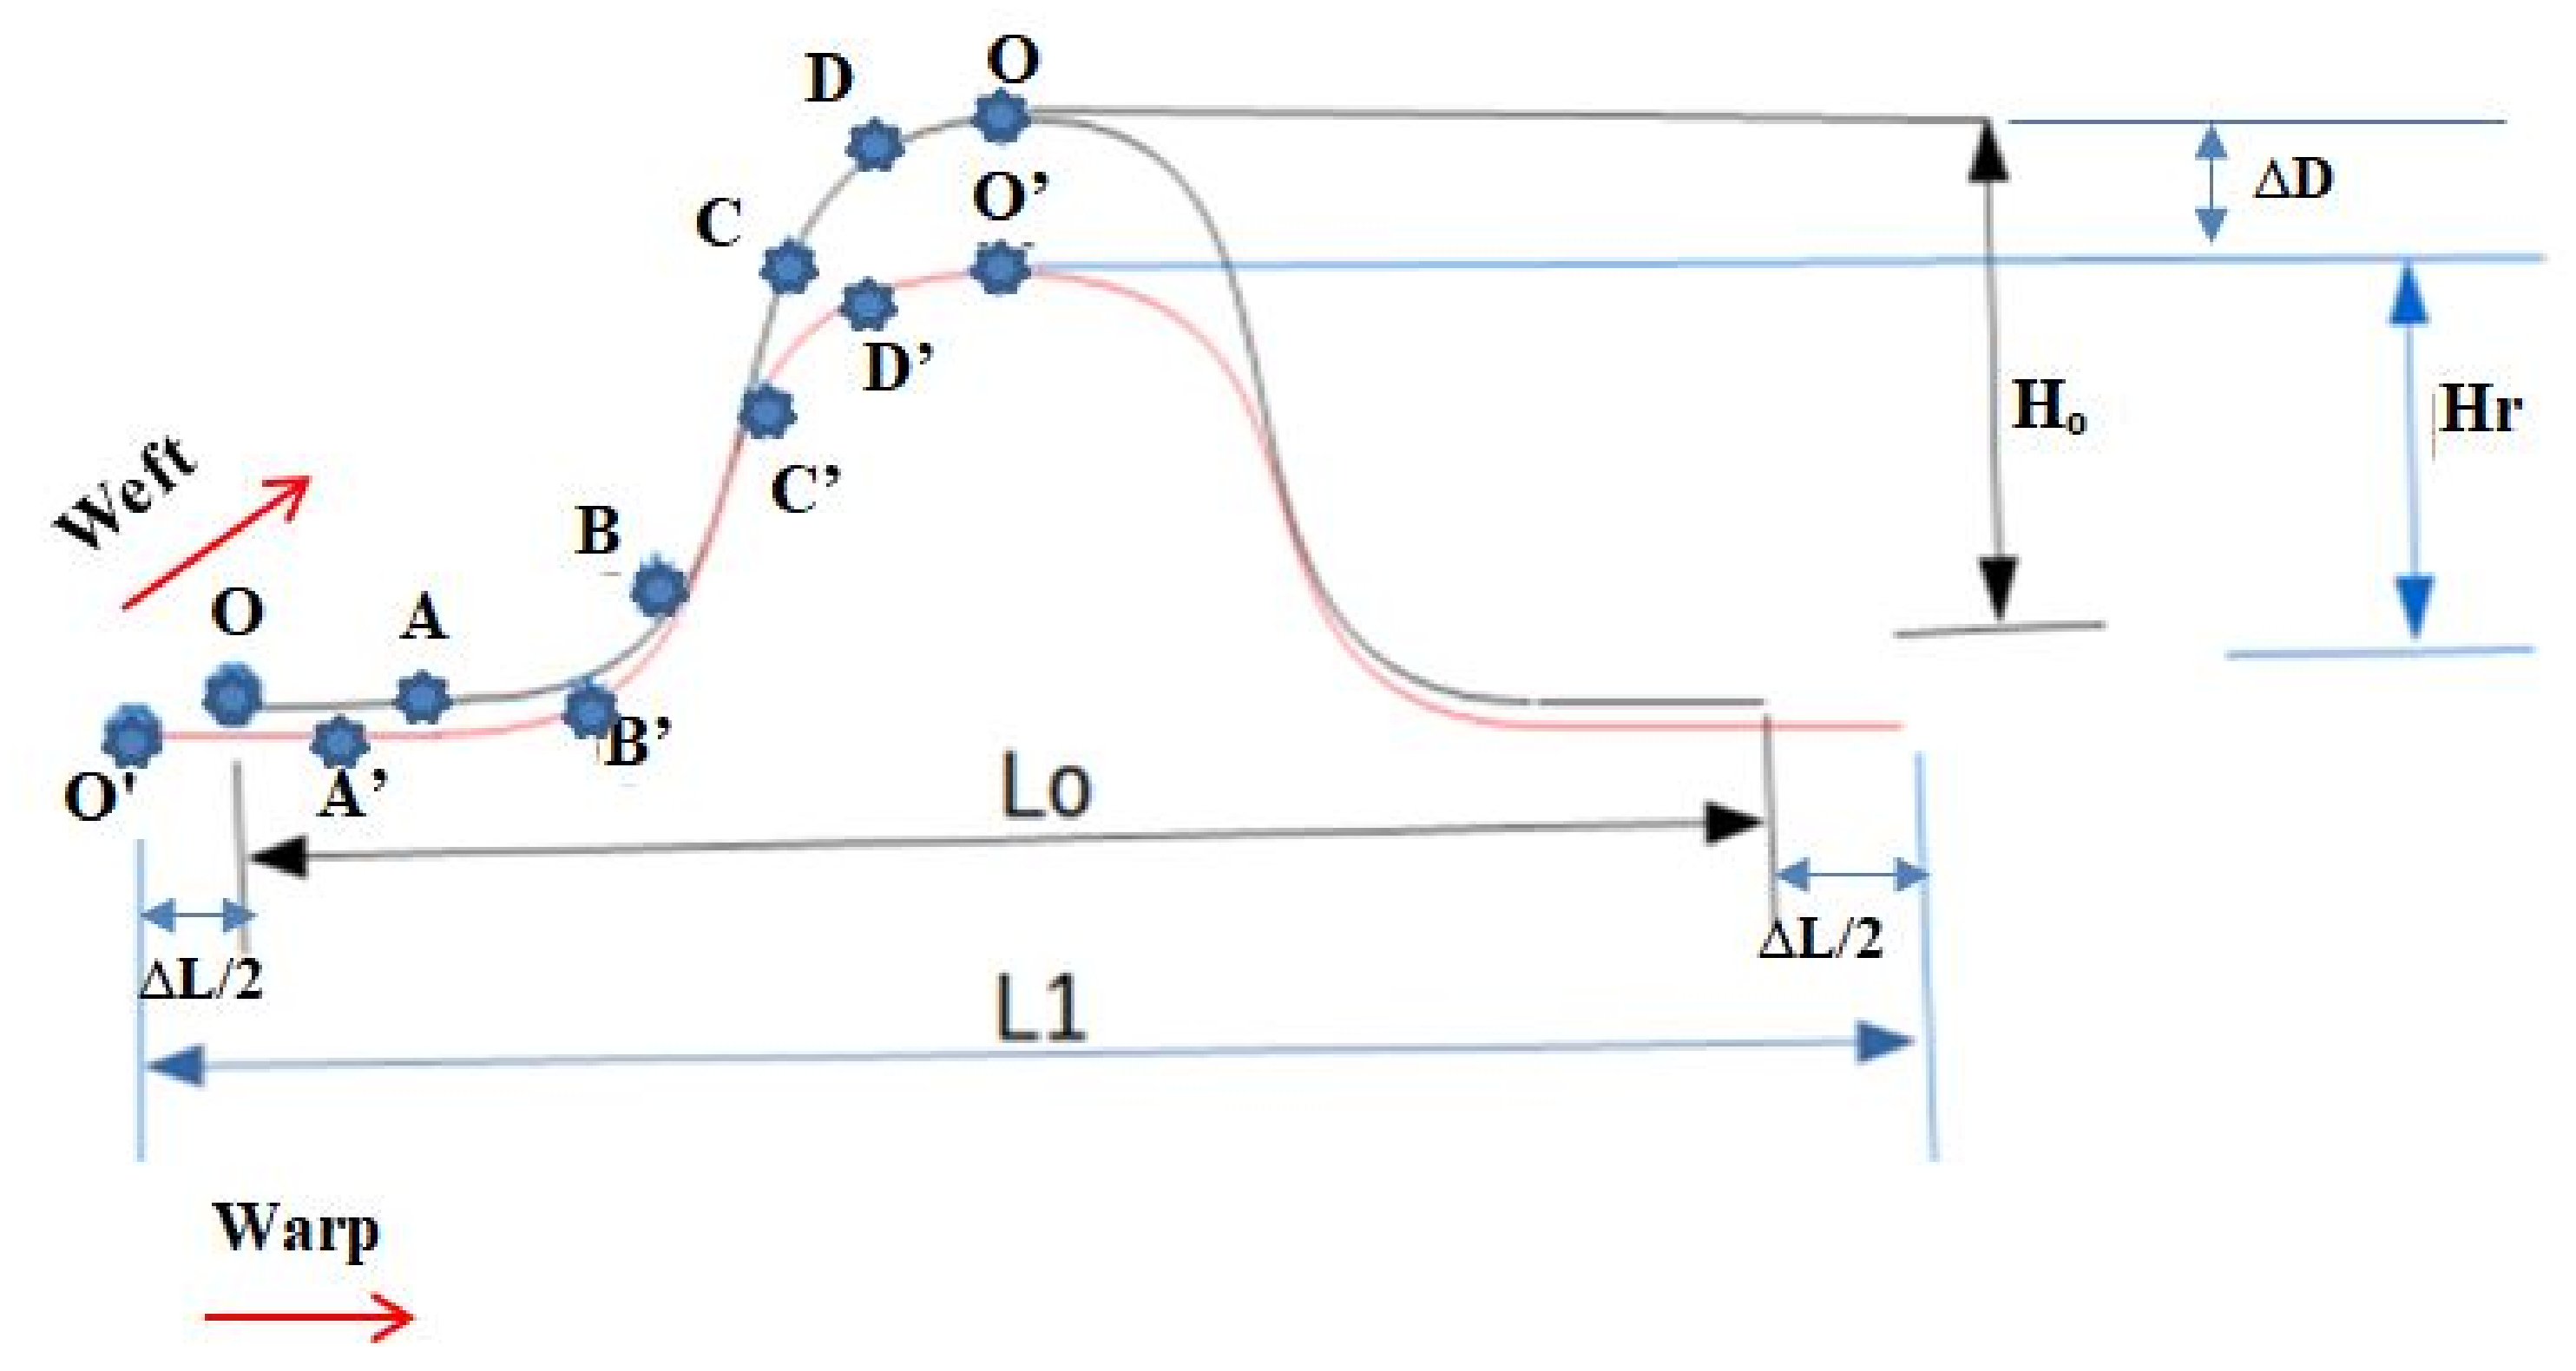
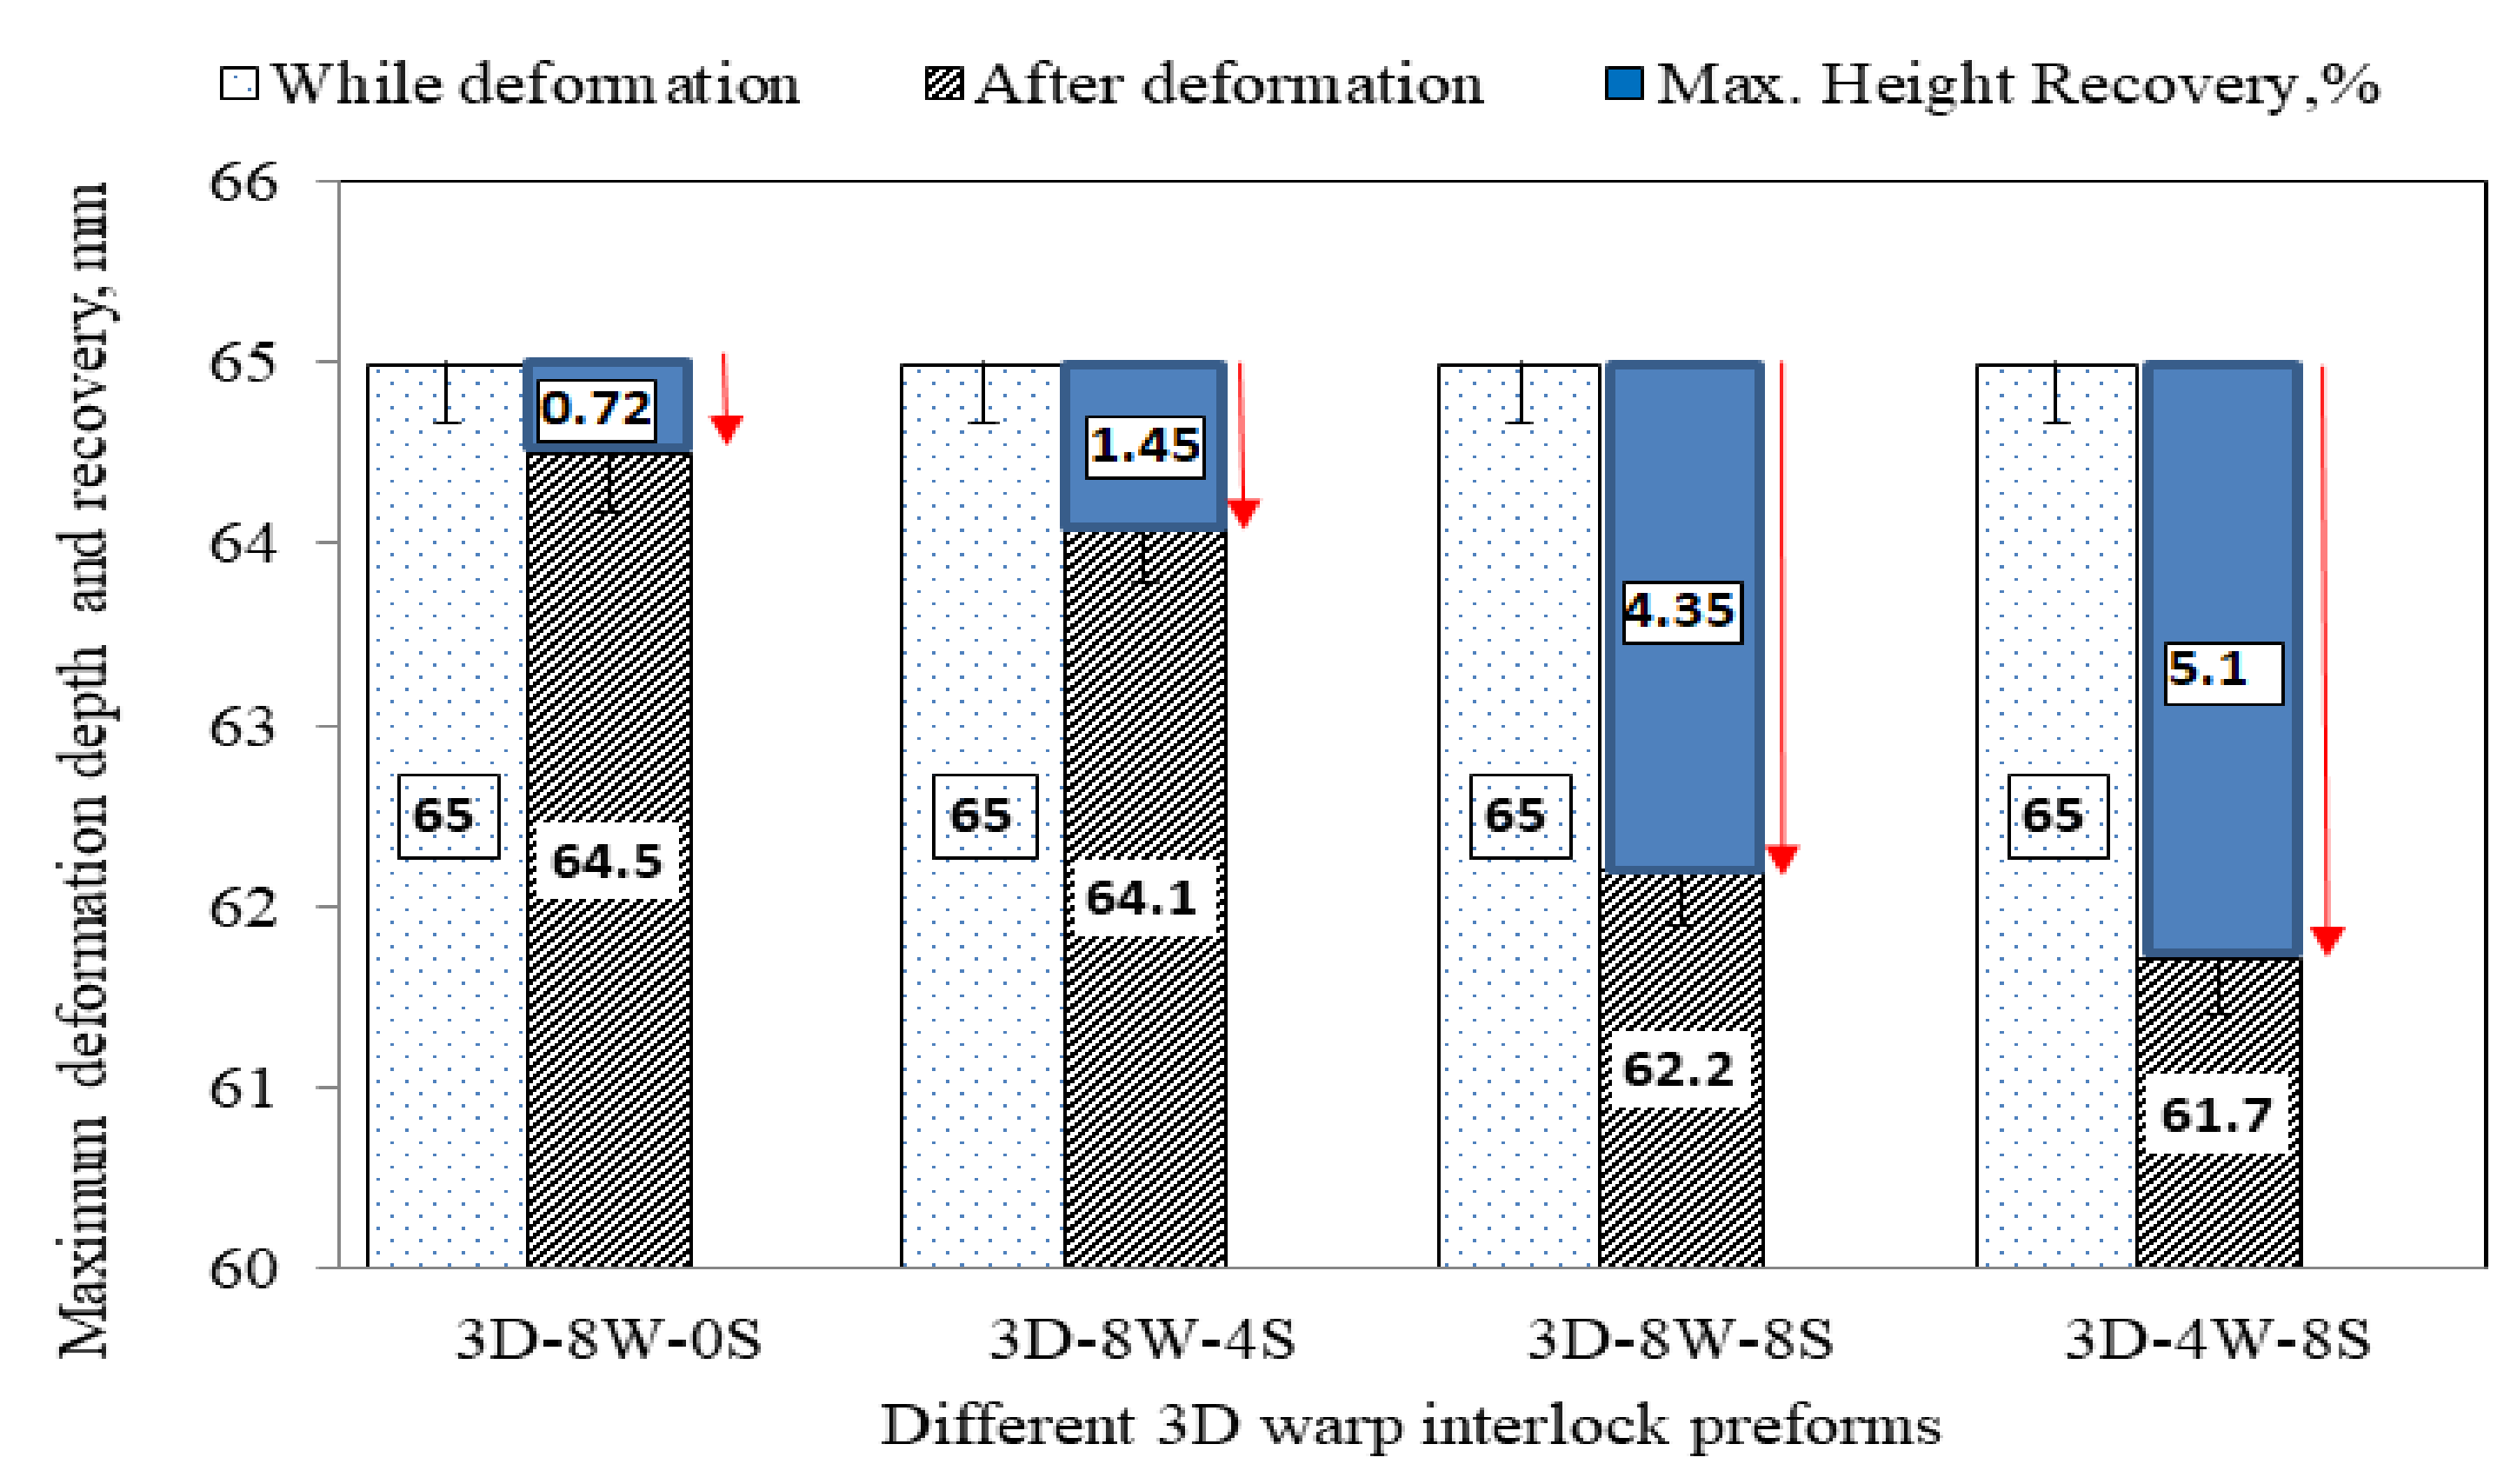
3.2.1. Influence of Warp Yarn System on Maximum Deformed Height Recovery

Deformational recovery at maximum depths of the preform in the punching directions is also one of the forming characteristics that have to be considered while molding. This would help to consider the recovery parameters while applying for the specific technical application including soft body armor design and deformable composite parts. In this section, the effects of warp interchange ratios on the maximum height deformational recovery of dry 3D warp interlock preforms in the forming process have been investigated. Figure 14 shows the schematic diagrams at side views of preform while deformation and after recovery at the maximum depth positions.
The deformational depth (Ho) is the measured highest deformation value while forming in the stamping direction. This measured deformation height value is the first deformational height which is constant throughout the preforms (65 mm). Whereas, deformational depth (Hr) is the deformational depth of the preform measured after the recovery. Both the deformational depth while and after forming was measured using a height measuring scale having 0.01 mm precision. The deformational recovery percentage (∆D) at the highest deformational displacement is given as:
Δ D = H o H r H o * 100
where:
  • ΔD is the deformational recovery in percentage at maximum central depth toward the punching load;
  • H0—Deformational recovery at maximum central depth while forming;
  • Hr—Deformational recovery at maximum central depth after recovery.
Figure 15 illustrates the deformational recovery results at maximum depths for 3D warp interlock fabrics preform made with different warp yarn interchange ratio. This investigation helps to reveal the influence of the warp yarns inter-change ratio on the deformational depth recovery of 3D warp interlock fabric during forming. In general, the involvement of higher stuffer warp yarns inter-change ratio inside the 3D warp interlock structure involves form of a higher depth deformational recovery percentage at maximum (tip) position as compared to the fabric with lower stuffer warp yarns interchange ratio. Preform 3D-8W-0S (100% binder yarn) and 3D-4W-8S (33.3% binding and 66.7% stuffer warp yarns) revealed a lower and higher deformational height recovery percentage respectively compared to all other preforms.
Sample 3D-4W-8S exhibited the maximum deformational height recovery percentage, whereas 3D-8W-0S recorded only 0.72%. Moreover, samples 3D-8W-4S and 3D-8W-8S revealed 1.45% and 4.35% recovery percentages toward the deformational height at maximum position. Such performances are not only due to the involvement of higher yarn waviness, but 3D warp interlock fabrics with more binding warp yarns also give a tendency of good linking of the different layers of yarn throughout the weft layers. Performing such good interlacing of yarns could produce a higher binding force within the yarns inside the fabric and finally helps to enhance the stability of the preforms and resist the recovery after deformations. In general, the investigation revealed that the warp yarns interchange ratio affects the deformational recovery of dry 3D warp interlock fabric preforms at maximum positions.

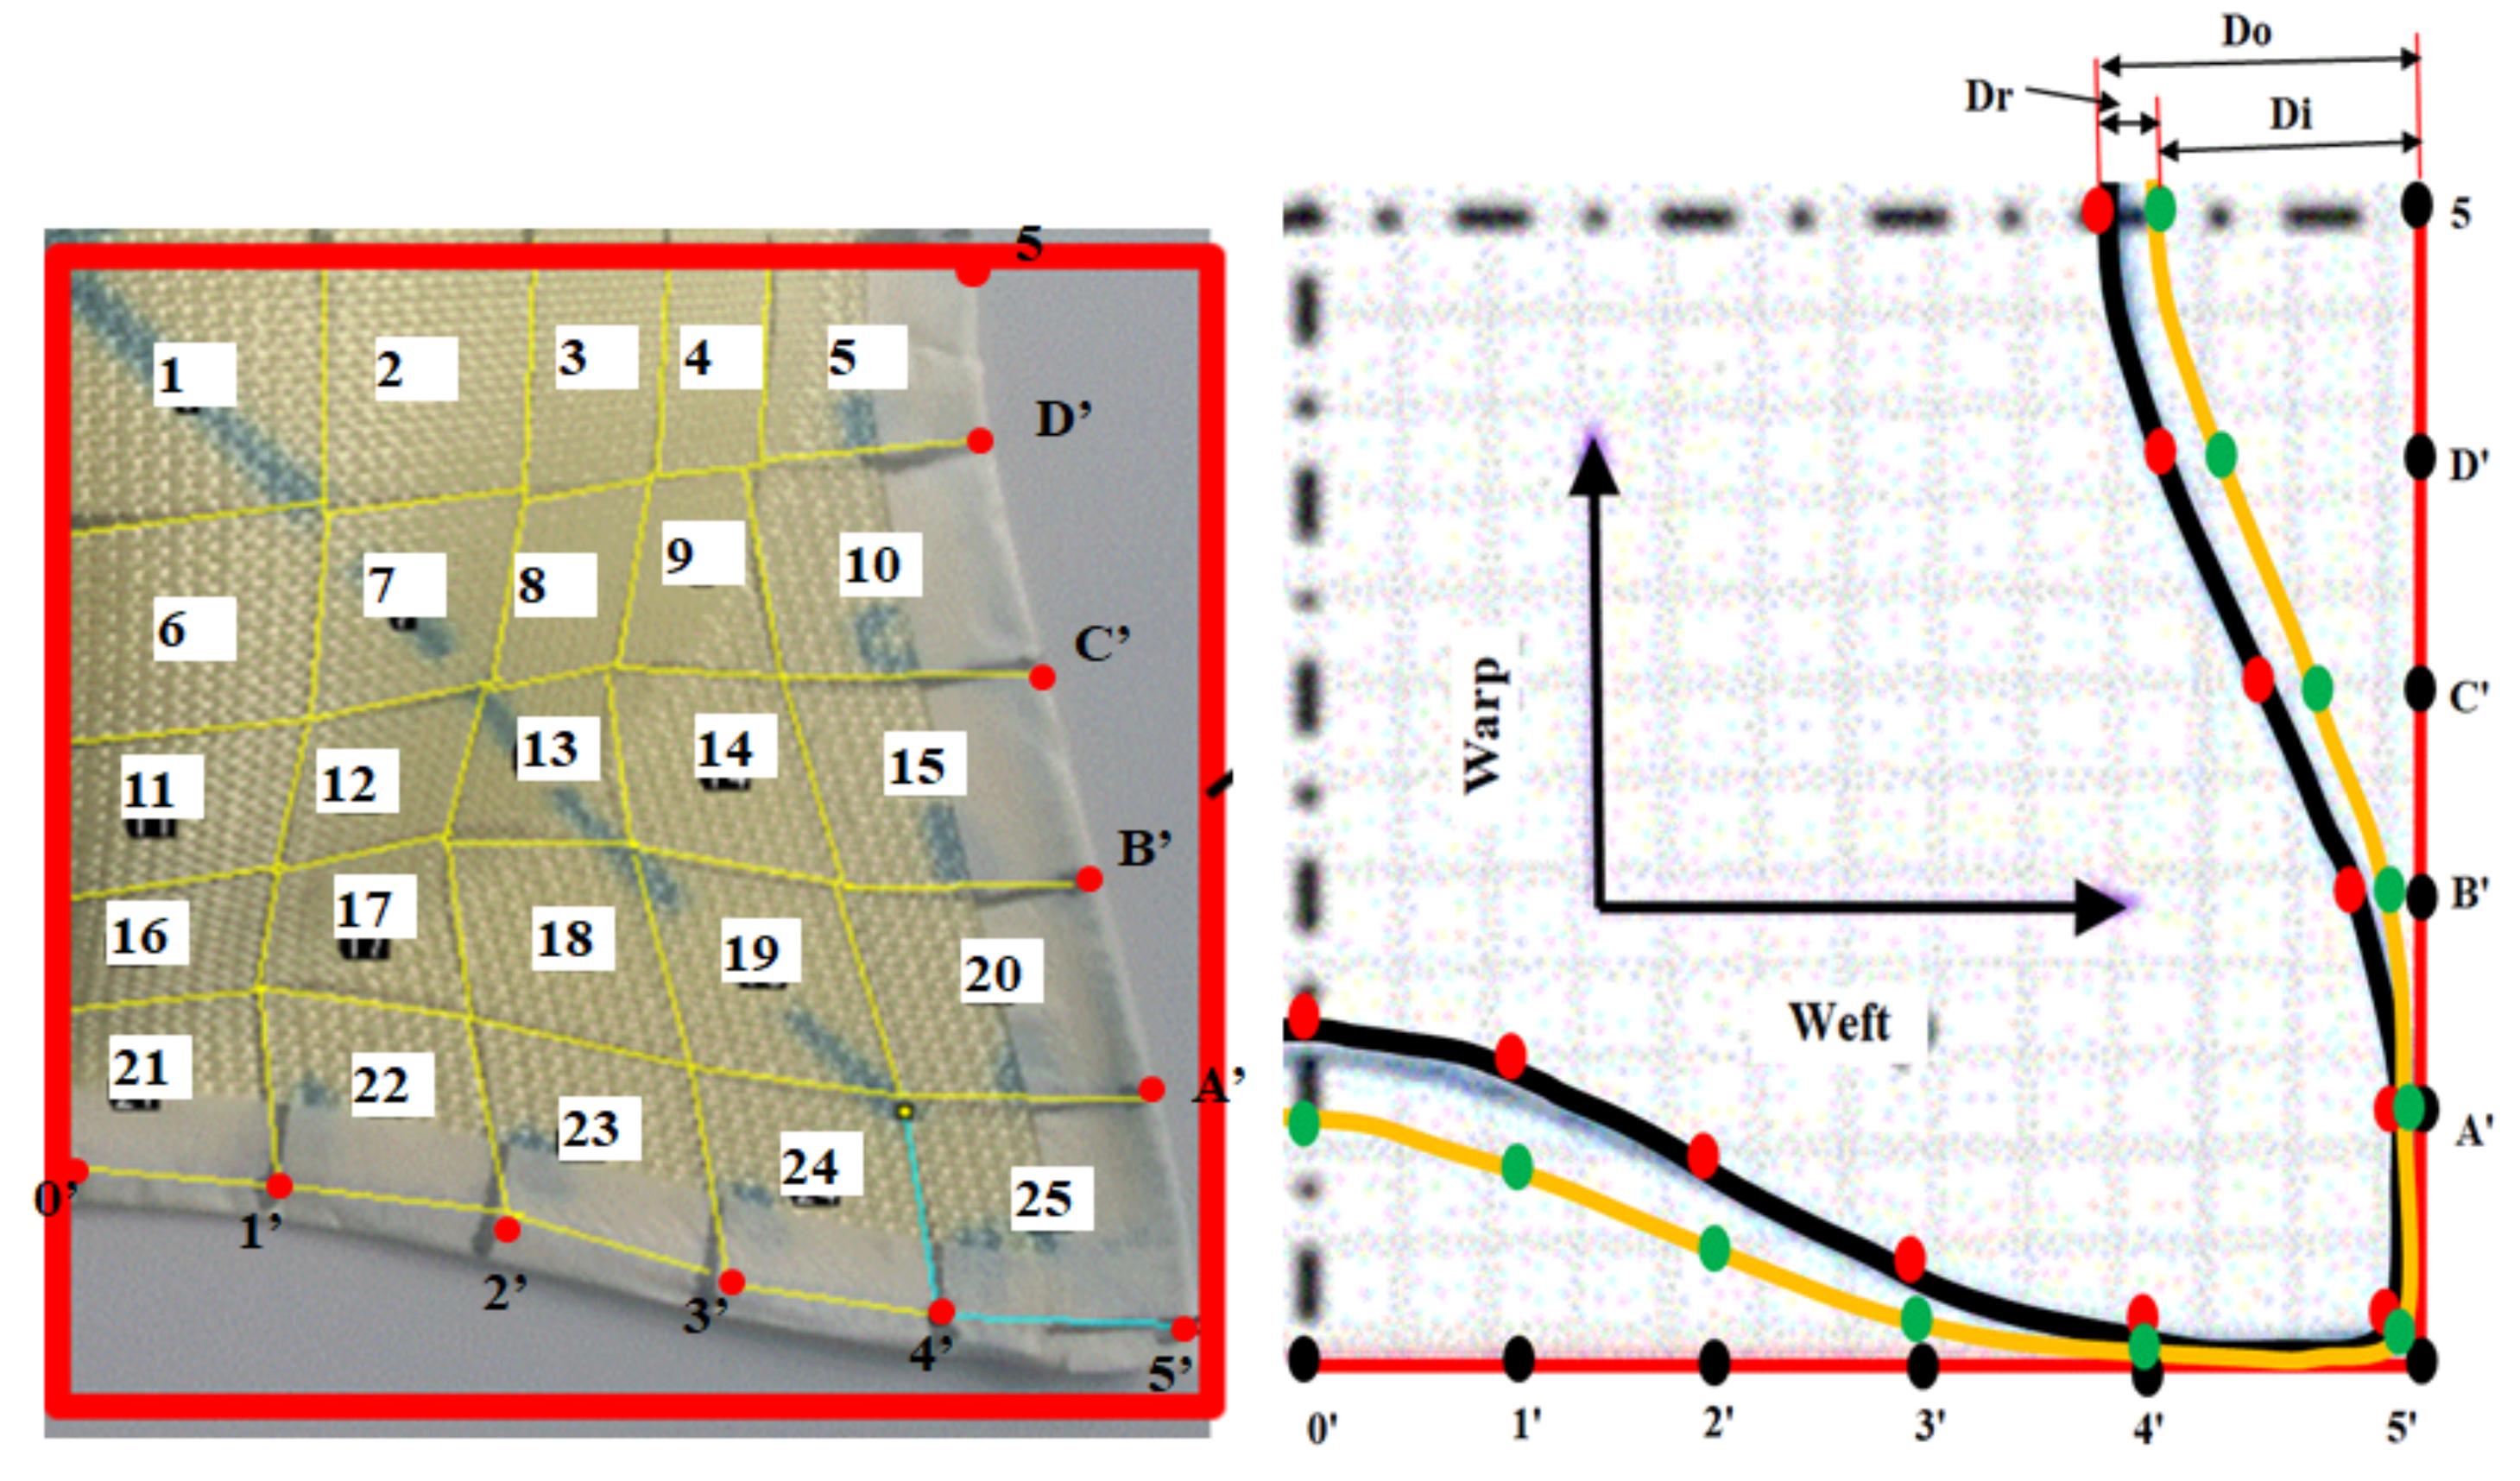
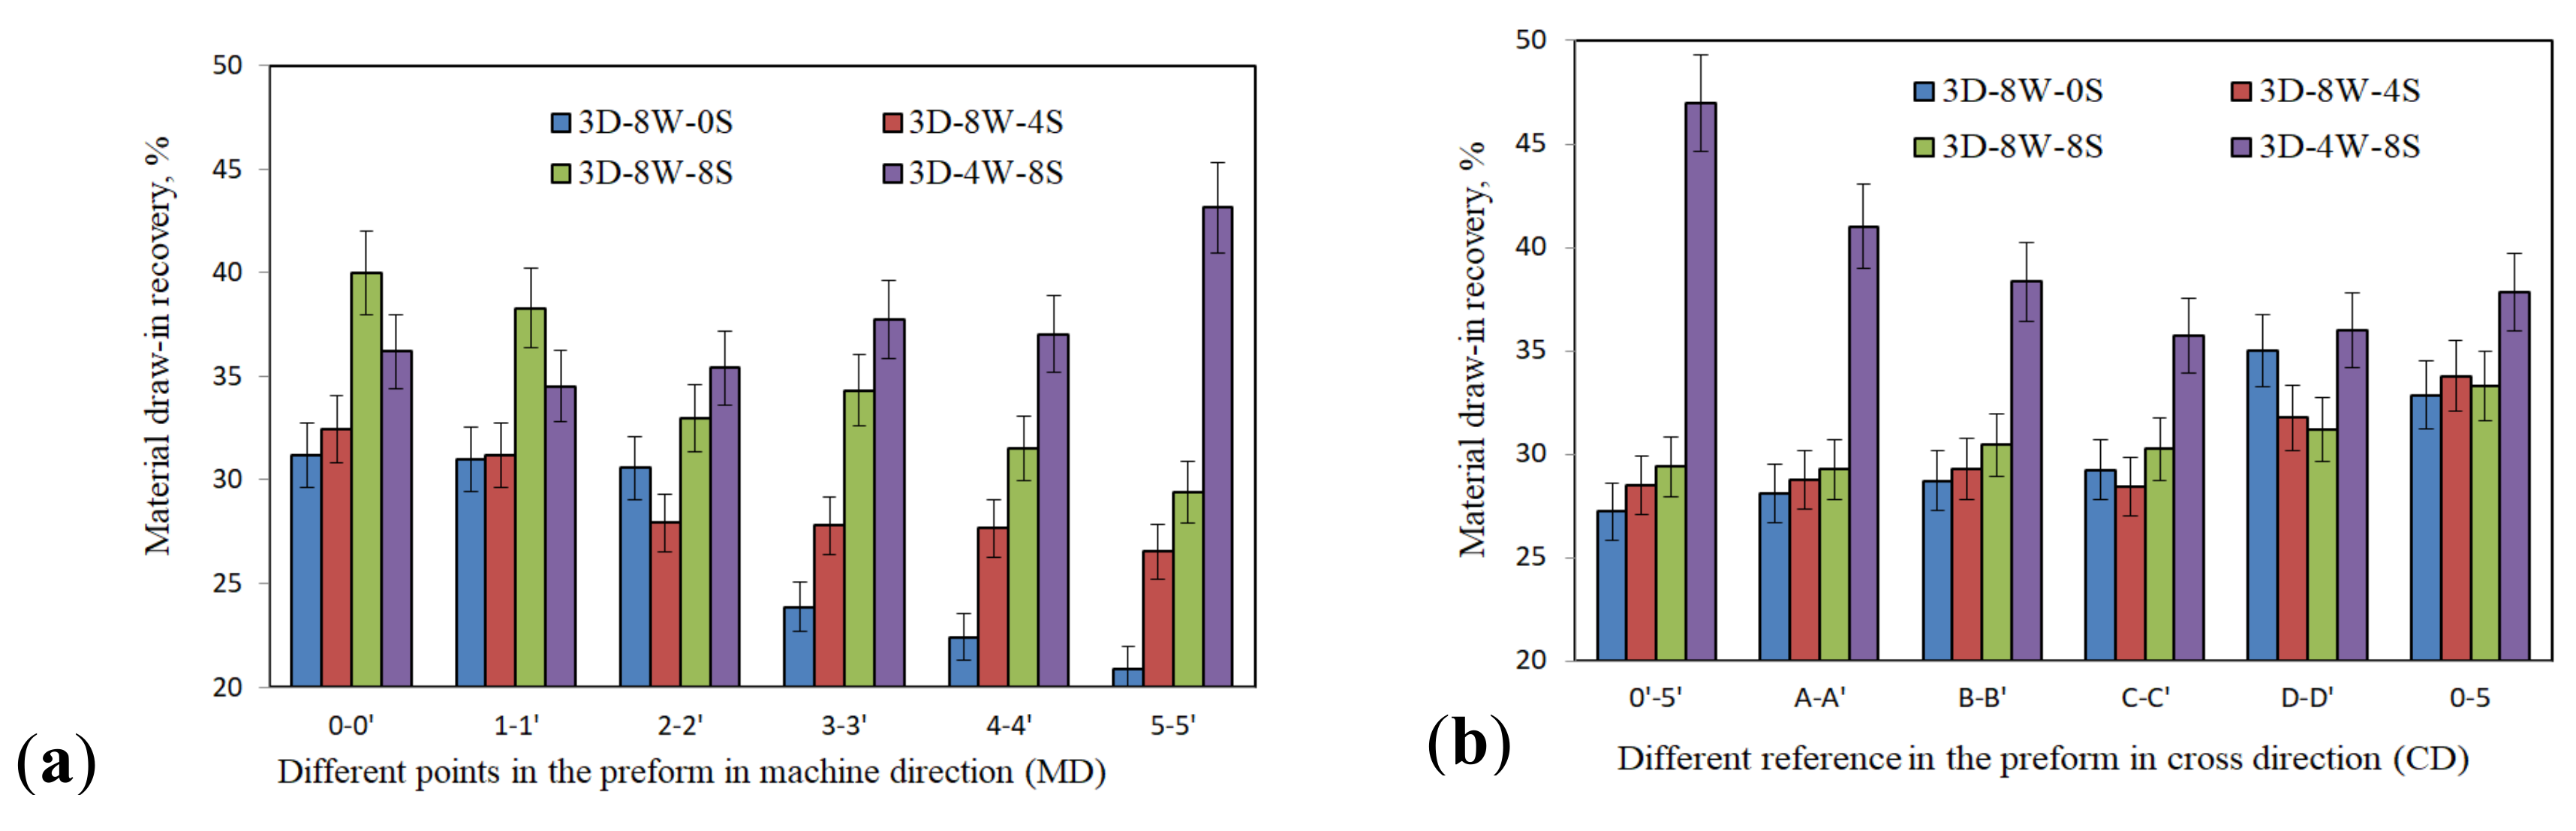
3.2.2. Influence of Warp Yarn System on Drawing-In Recovery

As mentioned previously, the textile material undergoes recovery from deformation after removing the punching force. The regaining of the material plane dimension both in warp and warp directions is important among the different recovered parameters. Such regaining of textile materials is referred to as drawing-in recovery values. For the sake of better measurement and comparisons, the recovery measurements followed the reference points for all the preforms. Figure 16 shows the representations of drawing-in values at initial and after material recovery from forming. The recovery of the dimensions was computed in both directions of the 1/4th sub-regions by measuring the drawing-in values during forming and after keeping the deformed preform for 48 h in atmospheric conditions. ImageJ software was utilized to measure both the drawing-in values during and after the deformations.
The drawing-in recovery of each preform was computed as follows:
Dr = Do Di
where:
  • Do—drawing-in values at the initial;
  • Di—drawing-in values after recovery;
  • Dr—the recovered drawing-in values after removing the load and waiting 48 h.
The recovery percentage after molding could be calculated by the following formula;
% Δ D   =   Δ D /   D 0   ×   100 %
where, %∆D = recovery percentage.
To better understand the recovery performance and effects of the warp yarn system on the different 3D warp interlock preforms, the recovery percentage of the preform for the selected reference positions were computed. Figure 17a,b shows the material drawing-in recovery percentages values of the different 3D warp interlock preforms with different warp yarn system in the machine and cross direction respectively. Based on these results, the involvements of the warp yarns interchange ratio on the drawing-in recovery played a great role both in the machine and cross directions. In general, the drawing-in recovery percentages of the preforms were found higher at the top center of the preforms and decrease as it goes toward the peripheral edges of the preform. However, sample 3D-4W-8S revealed higher drawing-in recovery percentages values around the far peripheral edges of the preform.
The 3D warp interlock preform with a higher interchange ratio of stuffer warp yarns revealed higher drawing-in recovery percentage both in the warp and weft directions. However, 3D warp interlock fabrics with higher binding warp yarn interchange ratio face lower drawing-in recovery percentage to retain its original material position. For instance, 3D-4W-8S preform with higher stuffer warp yarns interchange ratio, and 3D-8W-0S preform with lower stuffer warp yarns interchange ratio, recorded higher and lower material drawing-in recovery percentage respectively in the majority of sub-region both in machine and cross directions compared to other preforms. Moreover, samples 3D-8W-8S and 3D-8W-4S both show a higher drawing-in recovery percentage than samples 3D-4W-8S. The yarns inside the 3D warp interlock fabrics made with higher binding warp yarn interchange ratios were not highly stressed during the forming process. This is due to the presence of extra yarn length/waviness during fabric production. This extra length of yarn/waviness then helps to relieve higher stress during forming by the punching loads which in turn gives lower yarn recovery. Moreover, the recovery percentage of the different preforms was also found higher in the machine (warp) than cross (weft) direction at the same reference positions. This is because the weft yarn faces higher stress by the punching load due to its interlacing structure than the warp yarn. Figure 18a,b also shows the maximum and minimum drawing-in recovery percentage values of different 3D warp interlock preforms in the machine and cross directions respectively. Sample 3D-4W-8S revealed the maximum drawing-in recovery percentage values of 43.13% and 46.98% in the machine and cross direction respectively around the preform peripheral edges.
On the contrary, samples with higher binding warp yarns as sample 3D-8W-0S show the maximum drawing-in recovery percentages values of 31.21% and 34.99% in machine and cross direction respectively. Sample 3D-8W-8S retains its maximum drawing-in recovery percentage in machine directions more compared to 3D-8W-4S than in cross directions.

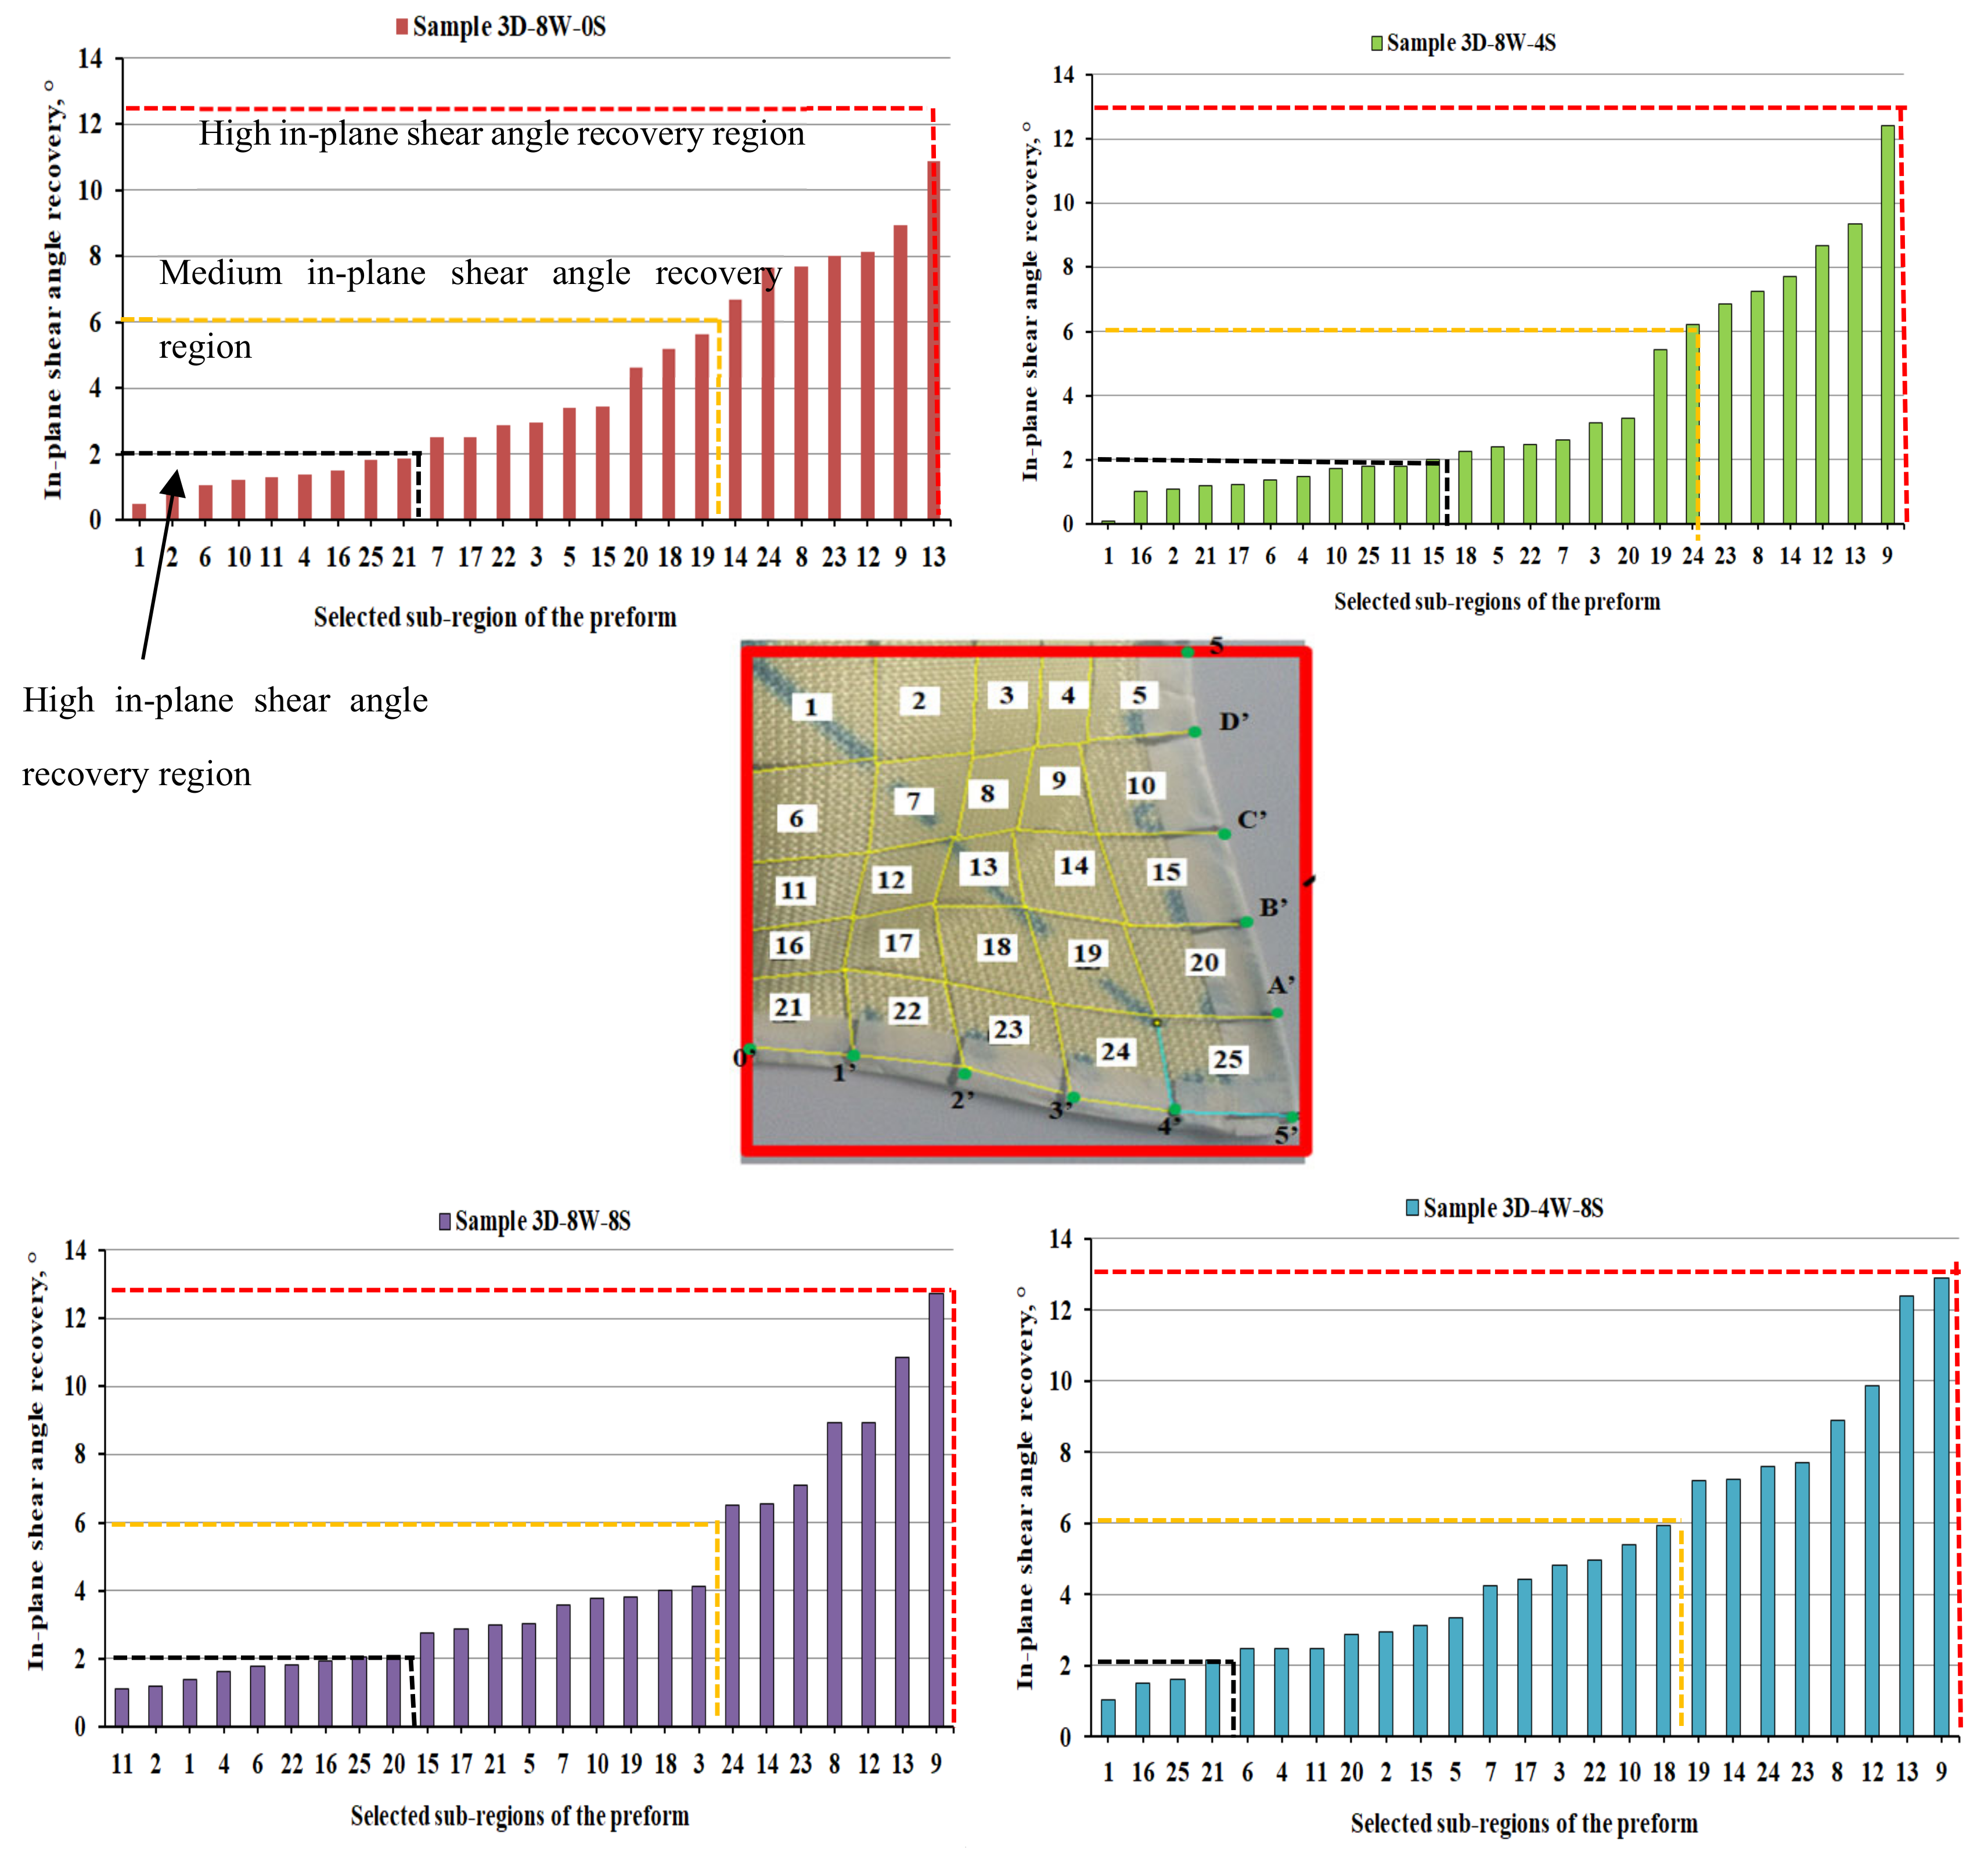
3.2.3. Influence of Warp Yarn System on In-Plane Shear Angle Recovery

Like the drawing-in values, the in-plane shear angles of textile materials also tend to recover to its original positions after releasing the punching loads during the forming process. The recovery angles of the deformed preform (|ρ − µ|) could be determined by measuring the different angles between the warp and weft yarns as shown in Figure 8. The angle at initial deformation (ρ) was measured while deformation whereas, the final angle µ is measured after releasing the punching loads and keeping the preforms for another 48 h at atmospheric conditions. Figure 19 shows the in-plane shear angle recovery values of the different 3D warp interlock preforms for the selected sub-regions. Like the in-plane shear angle, the recovery also was clustered into three main regions, high, medium, and low in-plain shear angle recovery regions for brief and better understanding. Based on the result analysis, regardless of the inter-change ratios of the warp yarn insides the fabric structure, nearly all the deformed preforms possess a higher amount of shear angle recovery around the neck of sub-region 8, 9, 12, 13, 14, 19, 23, and 24. This is due to mainly the involvement of higher status of deformation in the specified regions. Whereas, the lower shear angle recovery was observed on the top and peripheral edges of deformed preform sub-regions 1, 2, 4, 6 11, 16, and 25. On the contrary, sub-region 3, 15, 17, 20, 22, 19, 18 shows medium values of in-plane shear angle recovery for all the preforms. Besides, as shown in Figure 19, 3D warp interlock preforms having more stuffer warp yarns interchange ratio inside the structure revealed higher shear angle recovery in the majority of the sub-regions as compared to preforms with lower stuffer warp yarns.
Preforms 3D-4W-8S and 3D-8W-0S revealed higher and lower in-plane shear angle recovery, respectively in the majority sub-regions as compared to other types of the preform. The maximum in-plane shear angle recovery for 3D-4W-8S was 12% higher than preform 3D-4W-8S in the same positions. Whereas, preform 3D-8W-4S and 3D-8W-8S preforms show comparable in-plane shear angle recovery in most of the measured preform sub-REGION POSITIONS. FINALLY, the higher in-plane shear angle recovery for all 3D warp interlock fabrics was observed for the preforms that have higher shear angle values during deformations.

4. Conclusions

The current experimental investigation aims to study the influences of the warp yarn interchange ratio on the formability behaviors of dry 3D warp interlock p-aramid fabrics. Four different 3D warp interlock fabrics were constructed based on the binding and stuffer warp yarns interchange ratio inside the structure. The same hemispherical punch forming process was executed for all samples to analyze the different important formability and recovery behavior of the different preforms. Based on the result the following conclusions were drawn:
  • In general, the different forming characteristics of 3D warp interlock fabrics were greatly influenced by the warp yarn interchange ratio. For example, the increments of the stuffer warp yarns interchange ratio exhibit an impact, and directly proportional to the stamping force while forming. Sample with higher stuffer warp yarns ratio possesses less yarn undulation in the warp direction which in turn needs a higher amount of punching loads to deform the preforms to its maximum deformational depth.
  • The in-plane shear angles were also observed higher in the majority of the region for preform with lower binding warp yarns in the 3D warp interlock fabric.
  • The preforms having higher stuffer yarn ratio revealed higher drawing-in values than preforms with no or less stuffer warp yarns.
  • The warp yarns interchange ratio also revealed a great influence on the forming recovery properties of 3D warp interlock fabric. The involvement of a higher stuffer warp yarns interchange ratio possesses a higher deformational recovery percentage at maximum depth as compared to the fabric with a lower stuffer warp yarn interchange ratio. For example, preform 3D-8W-0S exhibited a maximum deformational height recovery percentage of 5.1%, whereas 3D-4W-8S recorded only 0.72%. Moreover, preform 3D-8W-4S and 3D-8W-8S revealed 1.45% and 4.35% recovery percentages toward the deformational height at maximum position.
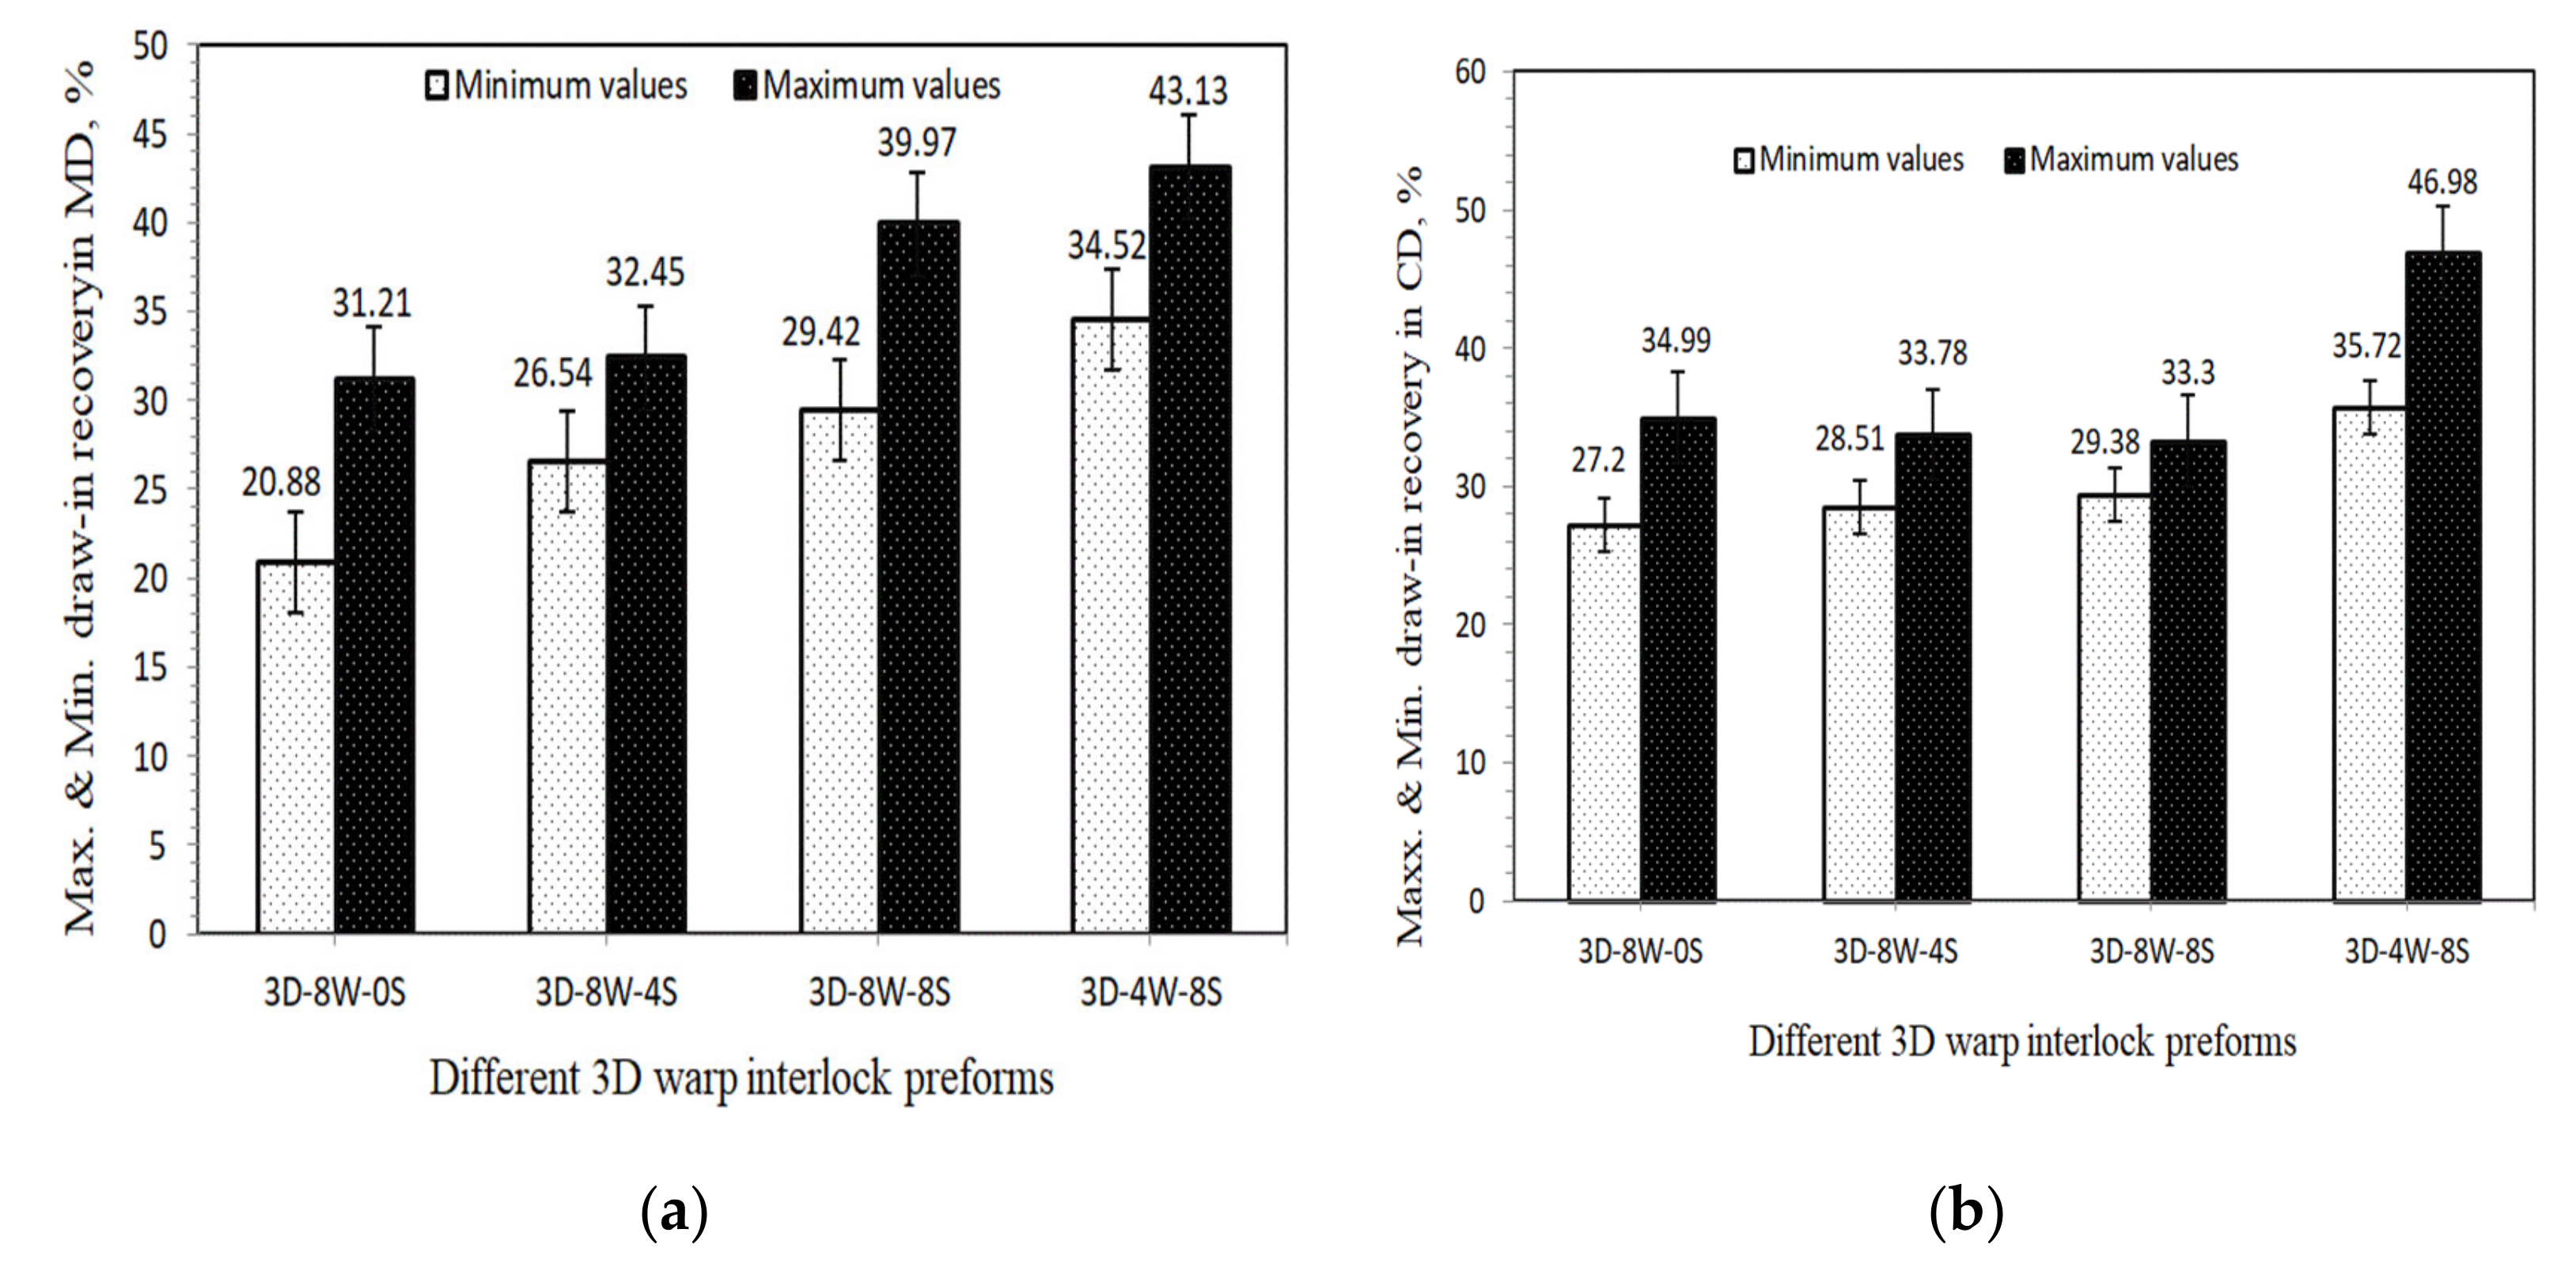
  • The drawing-in recovery percentages of the preforms were found higher at the top center of the preforms and decrease as it goes toward the peripheral edges of the preform. Specifically, Sample 3D-4S-8W revealed the maximum drawing-in recovery percentage of 43.13% and 46.98% in the machine and cross direction respectively around the preform peripheral edges. On the contrary, samples with higher binding warp yarns as 3D-8W-0S show the maximum drawing-in recovery percentages values of 31.21% and 34.99% in the machine and cross directions respectively.

Author Contributions

Conceptualization, M.A.A.; methodology, M.A.A. and F.B.; software, M.A.A., I.C. and F.B.; validation, M.A.A., F.B., P.B., I.C. and C.L.; formal analysis, M.A.A.; investigation, M.A.A.; resources, F.B., P.B. and C.L.; data curation, M.A.A. and F.B.; writing—Original draft preparation, M.A.A.; writing—Review and editing, M.A.A., F.B., P.B., C.L., and I.C.; visualization, M.A.A., F.B., I.C.; supervision, F.B., P.B., I.C., and C.L.; project administration, P.B., and C.L.; funding acquisition, F.B., P.B. and C.L. All authors have read and agreed to the published version of the manuscript.

Funding

This work has been done as part of the Erasmus Mundus Joint Doctorate Programme SMDTex-sustainable Management and Design for Textile project, which is financially supported by the European Erasmus Mundus Program. Project; grant number SMDTex-2016-60.

Acknowledgments

The authors would like to thank M Lucas Putigny, Nicola Dumont, and Fredrick Veyet from ENSAIT-GEMTEX Lab. for their technical help during the manufacturing of the fabric structure.

Conflicts of Interest

The authors declare no conflict of interest. The funders had no role in the design of the study; in the collection, analyses, or interpretation of data; in the writing of the manuscript, or in the decision to publish the results.

References

  1. Yang, Y.; Chen, X. Investigation on energy absorption efficiency of each layer in ballistic armour panel for applications in hybrid design. Compos. Struct. 2017, 164, 1–9. [Google Scholar] [CrossRef] [Green Version]
  2. Abtew, M.A.; Boussu, F.; Bruniaux, P.; Loghin, C.; Cristian, I. Engineering of 3D warp interlock p-aramid fabric structure and its energy absorption capabilities against ballistic impact for body armour applications. Compos. Struct. 2019, 225, 111179. [Google Scholar] [CrossRef]
  3. Abtew, M.A.; Boussu, F.; Bruniaux, P.; Loghin, C.; Cristian, I.; Chen, Y.; Wang, L. Ballistic impact performance and surface failure mechanisms of two-dimensional and three-dimensional woven p-aramid multi-layer fabrics for lightweight women ballistic vest applications. J. Ind. Text. 2019, 1–33. [Google Scholar] [CrossRef]
  4. Bekampienė, P.; Domskienė, J. Influence of Stitching Pattern on Deformation Behaviour of Woven Fabric during Forming. Mater. Sci. 2010, 16, 1392–1420. [Google Scholar]
  5. Nawab, Y.; Legrand, X.; Koncar, V. Study of changes in 3D-woven multilayer interlock fabric preforms while forming. J. Text. Inst. 2012, 103, 1273–1279. [Google Scholar] [CrossRef]
  6. Shanwan, A.; Allaoui, S. Different experimental ways to minimize the preforming defects of multi-layered interlock dry fabric. Int. J. Mater. Form. 2018, 12, 69–78. [Google Scholar] [CrossRef] [Green Version]
  7. Chen, X.; Yang, D. Use of 3D Angle-Interlock Woven Fabric for Seamless Female Body Armour: Part 1: Ballistic Evaluation. Text. Res. J. 2010, 80, 1581–1588. [Google Scholar] [CrossRef]
  8. Min, S.; Chen, X.; Chai, Y.; Lowe, T. Effect of reinforcement continuity on the ballistic performance of composites reinforced with multiply plain weave fabric. Compos. Part B Eng. 2016, 90, 30–36. [Google Scholar] [CrossRef]
  9. Abtew, M.A.; Boussu, F.; Bruniaux, P.; Loghin, C.; Cristian, I.; Chen, Y.; Wang, L. Forming characteristics and surface damages of stitched multi-layered para-aramid fabrics with various stitching parameters for soft body armour design. Compos. Part A Appl. Sci. Manuf. 2018, 109, 517–537. [Google Scholar] [CrossRef]
  10. Roedel, C.; Chen, X. Innovation and Analysis of Police Riot Helmets with Continuous Textile Reinforcement for Improved Protection. J. Inf. Comput. Sci. 2007, 2, 127–136. [Google Scholar]
  11. Zahid, B.; Chen, X. Manufacturing of single-piece textile reinforced riot helmet shell from vacuum bagging. J. Compos. Mater. 2012, 47, 2343–2351. [Google Scholar] [CrossRef]
  12. Chen, X.; Yang, D. Use of Three-dimensional Angle-interlock Woven Fabric for Seamless Female Body Armor: Part II: Mathematical Modeling. Text. Res. J. 2010, 80, 1589–1601. [Google Scholar] [CrossRef]
  13. Abtew, M.A.; Bruniaux, P.; Boussu, F.; Loghin, C.; Cristian, I.; Chen, Y. Development of comfortable and well-fitted bra pattern for customized female soft body armor through 3D design process of adaptive bust on virtual mannequin. Comput. Ind. 2018, 100, 7–20. [Google Scholar] [CrossRef]
  14. Abtew, M.A.; Bruniaux, P.; Boussu, F.; Loghin, C.; Cristian, I.; Chen, Y.; Wang, L. A systematic pattern generation system for manufacturing customized seamless multi-layer female soft body armour through dome-formation (moulding) techniques using 3D warp interlock fabrics. J. Manuf. Syst. 2018, 49, 61–74. [Google Scholar] [CrossRef]
  15. Abtew, M.A.; Bruniaux, P.; Boussu, F.; Loghin, C.; Cristian, I.; Chen, Y.; Wang, L. Female seamless soft body armor pattern design system with innovative reverse engineering approaches. Int. J. Adv. Manuf. Technol. 2018, 98, 2271–2285. [Google Scholar] [CrossRef]
  16. Saboktakin, A. 3D textile preforms and composites for aircraft strcutures: A review. Int. J. Aviat. Aeronaut. Aerosp. 2019, 6, 2. [Google Scholar] [CrossRef] [Green Version]
  17. Siddika, A.; Al Mamun, M.A.; Ferdous, W.; Alyousef, R. Performances, challenges and opportunities in strengthening reinforced concrete structures by using FRPs—A state-of-the-art review. Eng. Fail. Anal. 2020, 111, 104480. [Google Scholar] [CrossRef]
  18. Khatkar, V.; Behera, B.K.; Manjunath, R.N. Textile structural composites for automotive leaf spring application. Compos. Part B Eng. 2020, 182, 107662. [Google Scholar] [CrossRef]
  19. Morris, R.H.; Geraldi, N.R.; Stafford, J.L.; Spicer, A.; Hall, J.; Bradley, C.; Newton, M.I. Woven Natural Fibre Reinforced Composite Materials for Medical Imaging. Materials 2020, 13, 1684. [Google Scholar] [CrossRef] [Green Version]
  20. Mouritz, A.; Bannister, M.; Falzon, P.; Leong, K. Review of applications for advanced three-dimensional fibre textile composites. Compos. Part A Appl. Sci. Manuf. 1999, 30, 1445–1461. [Google Scholar] [CrossRef]
  21. Boussu, F.; Provost, B.; Lefebvre, M.; Coutellier, D. New Textile Composite Solutions for Armouring of Vehicles. Adv. Mater. Sci. Eng. 2019, 2019, 1–14. [Google Scholar] [CrossRef] [Green Version]
  22. Zunic, B.; Peter, S. Textile Reinforced Structural Composites for Advanced Applications. In Textiles for Advanced Applications; IntechOpen: London, UK, 2017; pp. 88–133. [Google Scholar]
  23. de Luycker, E.; Morestin, F.; Boisse, P.; Marsal, D. Simulation of 3D interlock composite preforming. Compos. Struct. 2009, 88, 615–623. [Google Scholar] [CrossRef] [Green Version]
  24. Khokar, N. 3D-Weaving: Theory and Practice. J. Text. Inst. 2001, 92, 193–207. [Google Scholar] [CrossRef]
  25. Gokarneshan, N.; Alagirusamy, R. Weaving of 3D fabrics: A critical appreciation of the developments. Text. Prog. 2009, 41, 1–58. [Google Scholar] [CrossRef]
  26. Boussu, F.; Cristian, I.; Nauman, S. General definition of 3D warp interlock fabric architecture. Compos. Part B Eng. 2015, 81, 171–188. [Google Scholar] [CrossRef]
  27. Bilisik, K. Two-dimensional (2D) fabrics and three-dimensional (3D) preforms for ballistic and stabbing protection: A review. Text. Res. J. 2016, 87, 2275–2304. [Google Scholar] [CrossRef]
  28. Yang, D.; Chen, X. Multi-layer pattern creation for seamless front female body armor panel using angle-interlock woven fabrics. Text. Res. J. 2017, 87, 1–6. [Google Scholar] [CrossRef]
  29. Ha-Minh, C.; Boussu, F.; Kanit, T.; Crépin, D.; Imad, A. Effect of frictions on the ballistic performance of a 3D warp interlock fabric: Numerical analysis. Appl. Compos. Mater. 2012, 19, 333–347. [Google Scholar] [CrossRef]
  30. Chen, X.; Lo, W.-Y.; Tayyar, A.E. Mouldability of Angle-Interlock Woven Fabrics for Technical Applications. Text. Res. J. 2002, 72, 195–200. [Google Scholar] [CrossRef]
  31. Zahid, B.; Chen, X. Impact performance of single-piece continuously textile reinforced riot helmet shells. J. Compos. Mater. 2014, 48, 761–766. [Google Scholar] [CrossRef]
  32. Zahid, B.; Chen, X. Development of a Helmet Test Rig for Continuously Textile Reinforced Riot Helmets. Int. J. Text. Sci. 2013, 2, 12–20. [Google Scholar]
  33. Min, S.; Roedel, C.; Zahid, B.; Chen, X. Moulding of single-piece woven fabrics for protective helmets—A review and future work. In Moulding of Single-Piece Woven Fabrics for Protective Helmets—A Review and Future Work; TexEng/RWTH Aachen: Aachen, Germany, 2012. [Google Scholar]
  34. Dufour, C.; Wang, P.; Boussu, F.; Soulat, D. Experimental Investigation About Stamping Behaviour of 3D Warp Interlock Composite Preforms. Appl. Compos. Mater. 2014, 21, 725–738. [Google Scholar] [CrossRef]
  35. Dufour, C.; Boussu, F.; Wang, P.; Soulat, D. Local strain measurements of yarns inside of 3D warp interlock fabric during forming process. Int. J. Mater. Form. 2017, 11, 775–788. [Google Scholar] [CrossRef]
  36. Abtew, M.A.; Boussu, F.; Bruniaux, P.; Loghin, C.; Cristian, I.; Chen, Y.; Wang, L. Influences of fabric density on mechanical and moulding behaviours of 3D warp interlock para-aramid fabrics for soft body armour application. Compos. Struct. 2018, 204, 402–418. [Google Scholar] [CrossRef]
  37. Sheng, S.Z.; van Hoa, S. Composite Materials Modeling of 3D Angle Interlock Woven Fabric Composites. J. Thermoplast. Compos. Mater. 2003, 16, 45–58. [Google Scholar] [CrossRef]
  38. Ansar, M.; Xinwei, W.; Chouwei, Z. Modeling strategies of 3D woven composites: A review. Compos. Struct. 2011, 93, 1947–1963. [Google Scholar] [CrossRef]
  39. Kuo, W.S.; Fang, J.; Lin, H.W. Failure behavior of 3D woven composites under transverse shear. Compos. Part A Appl. Sci. Manuf. 2003, 34, 561–575. [Google Scholar] [CrossRef]
  40. Sun, D.; Chen, X. Three-dimensional textiles for protective clothing. In Advances in 3D Textiles; Woodhead Publishing: Cambridge, UK, 2015; pp. 341–360. [Google Scholar]
  41. Chen, X.; Sun, D.; Wang, Y.; Zhou, Y. 2D/3D Woven Fabrics for Ballistic Protection. In Proceedings of the 4th World Conference on 3D Fabrics and Their Applications, Aachen, Germany, 10–11 September 2012; TexEng/RWTH Aachen: Manchester, UK, 2012; pp. 1–12.
  42. Lefebvre, M.; Boussu, F. High energy absorption of warp interlock fabrics: Application to high speed impact of fragments. In DYMAT International Conferences; EDP Sciences: Les Ulis, France, 2009; pp. 429–435. [Google Scholar]
  43. Najjar, W.; Xavier, L.; Santo, P.D.; Soulat, D.; Boude, S. Analysis of the blank holder force effect on the preforming process using a simple discrete approach. Key Eng. Mater. 2013, 554, 441–446. [Google Scholar] [CrossRef] [Green Version]
  44. Najjar, W.; Legrand, X.; Pupin, C.; Santo, P.D.; Boude, S. A simple discrete method for the simulation of the preforming of woven fabric reinforcement. Key Eng. Mater. 2012, 504, 213–218. [Google Scholar] [CrossRef]
  45. Zangana, S.; Epaarachchi, J.; Ferdous, W.; Leng, J. A novel hybridised composite sandwich core with Glass, Kevlar and Zylon fibres—Investigation under low-velocity impact. Int. J. Impact Eng. 2020, 137, 103430. [Google Scholar] [CrossRef]
  46. Dufour, C.; Boussu, F.; Wang, P.; Soulat, D. Experimental Forming Studies on 3D Warp Interlock Fabrics. In Proceedings of the ECCM16—16th European Conference on Composite Materials, Seville, Spain, 22–26 June 2014. [Google Scholar]
  47. Abtew, M.A.; Loghin, C.; Cristian, I.; Boussu, F.; Bruniaux, P.; Chen, Y.; Wang, L. Mouldability and its recovery properties of 2D plain woven para-aramid fabric for soft body armour applications. Fibres Text. East. Eur. 2019, 27, 54–62. [Google Scholar]
  48. Skelton, J. Textile materials: Recovery from imposed deformation. Science 1972, 177, 657–663. [Google Scholar] [PubMed]
  49. Shen, H.; Wang, P.; Legrand, X.; Liu, L. Characterisation and optimisation of wrinkling during the forming of tufted three-dimensional composite preforms. Compos. Part A Appl. Sci. Manuf. 2019, 127, 105651. [Google Scholar]
  50. Boisse, P.; Guzman-Maldonado, E.; Wang, P.; Hamila, N.; Colmars, J. Wrinkling and bending during forming of multi-layered textile composite. In AIP Conference Proceedings; AIP Publishing: Melville, NY, USA, 2019; Volume 2113. [Google Scholar] [CrossRef]
  51. Abtew, M.A.; Loghin, C.; Cristian, I.; Boussu, F.; Bruniaux, P.; Chen, Y.; Wang, L. Two Dimensional (2D) P-Aramid Dry Multi-Layered Woven Fabrics Deformational Behaviour for Technical Applications. IOP Conf. Ser. Mater. Sci. Eng. 2018, 374, 1–12. [Google Scholar]
  52. Abtew, M.A.; Boussu, F.; Bruniaux, P.; Loghin, C.; Cristian, I.; Chen, Y.; Wang, L. Experimental investigation of effects of stitching orientation on forming behaviors of 2D P-aramid multilayer woven preform. In AIP Conference Proceedings; AIP Publishing: Melville, NY, USA, 2018; Volume 1960. [Google Scholar] [CrossRef]
  53. Legrand, X.; Boussu, F.; Nauman, S.; Cristian, I.; Lapeyronnie, P.; le Grognec, P.; Binétruy, C. Forming behaviour of warp interlock composite. Int. J. Mater. Form. 2009, 2, 177–180. [Google Scholar]
Figure 1. Representation of the four classes of 3D warp interlock fabrics types (a) interlock A-T, (b) interlock A-L, (c) interlock O-T, and (d) interlock O-L [26]. (Reproduced with permission from Elsevier with License Number 4911341267298)
Jcs 04 00145 g001
Figure 2. The graphical schemes of the developed 3D warp interlock fabrics with different binding and stuffer ratios (a) 3D-8W-0S (100–0%), (b) 3D-8W-4S (66–33%), (c) 3D-8W-8S (50–50%), and (d) 3D-4W-8S (33–66%).
Jcs 04 00145 g002
Figure 3. (a) Different 3D warp interlock fabrics for formability test (i) 3D-8W-0S (100–0%), (ii) 3D-8W-4S (66–33%), (iii) 3D-8W-8S (50–50%), and (iv) 3D-4W-8S (33–66%), and (b) pictorial examples of positions of reference point and line on the top surfaces of preform.
Jcs 04 00145 g003
Figure 4. Formability testing machine with its hemispherical punch.
Jcs 04 00145 g004
Figure 5. Formability process of the sample by the hemispherical punch (a) before forming and (b) while forming.
Jcs 04 00145 g005
Figure 6. 3D warp interlock preforms after deformation.
Jcs 04 00145 g006
Figure 7. (a) The punching forces versus the deformation time curves and (b) their maximum mean values of punching forces for the different 3D warp interlock preforms.
Jcs 04 00145 g007
Figure 8. (a) The deformed preform and its different measurement angles on the surfaces of the deformed preform to determine for in-plan shear angle values and its recovery (b,c).
Jcs 04 00145 g008
Figure 9. General in-plane shear angle diagram representations for the selected sub-regions and its measurement values for the different 3D warp interlock preforms.
Jcs 04 00145 g009
Figure 10. (a) Flat, (b) deformed, and (c) flat and deformed preform super-imposing to compute the drawing-in values of 3D warp interlock preforms at different positions.
Jcs 04 00145 g010
Figure 11. Influences of warp yarn system on the drawing-in values of 3D warp interlock preform at different points in the machine (a) and cross (b) direction.
Jcs 04 00145 g011
Figure 12. (a) Microscopic and (b) models of fabric cross-sectional view respectively, and (c) binder and (d) stuffer warp yarn waviness inside the 3D warp interlock fabric structure.
Jcs 04 00145 g012
Figure 13. The maximum and minimum drawing-in values of 3D warp interlock preforms in machine (MD) (a) and cross (CD) (b) direction.
Jcs 04 00145 g013
Figure 14. Schematic diagrams of preform in front view at maximum deformation (Ho) and after recovery (Hr).
Jcs 04 00145 g014
Figure 15. Molding recovery at maximum depths of the different preform.
Jcs 04 00145 g015
Figure 16. Pictorial and schematic representations of deformed preforms of the quadrant sub-region for drawing-in recovery representation.
Jcs 04 00145 g016
Figure 17. Influences of warp yarn inter-change ratio on the drawing-in recovery percentages of 3D warp interlock preforms at different points, (a) machine direction (MD) and (b) Cross direction (CD).
Jcs 04 00145 g017
Figure 18. The maximum and minimum drawing-in recovery values of 3D warp interlock preforms after forming in (a) machine and (b) cross direction.
Jcs 04 00145 g018
Figure 19. In-plane shear angle recoveries for the selected sub-regions of the different 3D warp interlock preforms in ascending order.
Jcs 04 00145 g019
Table 1. Main properties of the yarn and the produced 3D warp interlock fabrics.
Fabric DesignationsFiber Linear Density (dtex)Fiber Strength at Break [N/mm2]Warp Yarn (Binder: Stuffer) Interchange RatioActual Fabric Density (g/m2)Fabric Density (Warp/Weft) [yarn/cm]Average Fabric Thickness [mm]
3D-8W-0S9302258:090048/501.42
3D-8W-4S9302258:492048/501.44
3D-8W-8S9302258:895248/501.52
3D-4W-8S9302254:894448/501.63
Table 2. The different forming parameter used during formability testing.
Forming ParametersParameter Values
Punch shapeHemispherical
Punch diameter150 mm
Stamping velocity45 mm/s
Blank-holder pressure0.4MPa
Max. Punching depth65 mm

