Article

Strain Rate Sensitivity of Epoxy Composites Reinforced with Varied Sizes of Bagasse Particles

1
Department of mechanical engineering, Faculty of engineering and science, Curtin University, Sarawak 98009, Malaysia
2
Adelaide Microscopy, The University of Adelaide, Adelaide, SA 5005, Australia
3
School of Civil and Mechanical Engineering, Curtin University, Bentley, WA 6102, Australia
*
Author to whom correspondence should be addressed.
J. Compos. Sci. 2020, 4(3), 110; https://doi.org/10.3390/jcs4030110
Submission received: 3 July 2020 / Revised: 24 July 2020 / Accepted: 3 August 2020 / Published: 7 August 2020
(This article belongs to the Special Issue Progress in Polymer Composites)

Abstract

:
Viscoelastic materials, such as natural fibre-reinforced polymer composites, are strain rate sensitive. In the present investigation, the low strain rate sensitivity (0.00028 s−1, 0.00085 s−1 and 0.0017 s−1) of different sized bagasse particle-reinforced (212 µm and 300 µm) epoxy composites was examined using the Weibull analysis method. The filler loading content was optimized at 2 wt.% to achieve better mechanical properties. Based on the experimental results, it was observed that composites with 212 µm filler particles had higher characteristic strengths, more consistent failure strengths and higher energy absorption properties with higher loading speeds, compared to that of 300 µm filler particles. Based on the mathematical models for particle–matrix interactions, improvements in mechanical properties are attributed to proper filler dispersion and a better fibre–matrix interfacial strength.

1. Introduction

Natural filler-reinforced polymer matrix composites have been widely used in lightweight applications such as aerospace, automobile, and defence applications, etc. [1]. These kind of polymer composites bring the materials’ strength to weight ratios to a completely new level, as they are stronger and lighter than common engineering materials. As reported in the literature [2,3], the different dimensions and weight fractions of fillers in composites exhibit different mechanical properties as well as affect the different loading rates. Moreover, past research [4] mostly focused on the elastic- and rate-dependent behaviour of synthetic filler-reinforced polymer composites rather than natural filler polymer composites. For viscoelastic polymeric composites, their mechanical properties are strain rate sensitive to different loading conditions [5]. A high strain rate is an event that occurs over only a short period and tends to favour the elastic properties of a composite. Low strain rates focus on energy damping aspects of composites, which may also be referred to as toughness or impact resistance. Towards this, the Weibull distribution is a well-known method that provides strength to such materials. It can be used to predict the behaviour of materials using probability plots even when the data size is small [6]. However, employing such a statistical analysis is quite a new area to study the failure and dispersion of strength (strain rate sensitivity), especially the effect of different forms of natural filler in reinforced polymer composites.
A bagasse is a residue formed after the extraction of juice from sugarcanes and is pulpy in nature. Typically, bagasse is dumped in Lindfield or used as an alternative to wood as fuel. Recently, research have been conducted on bagasse-based composites for lightweight fuel efficiency applications in automotive industries and thus, adds vales to waste materials. It is also found to have potential applications in construction like blocks, boards and flooring tiles, etc. [7]. A lot of research has been conducted on bagasse composites. For instance, the effect of bagasse sizes, bagasse contents, nano-particle enhancements of bagasse-based polyethylene composites, the deformation and failure of bagasse-reinforced polypropylene, mechanical characterizations of several natural fibre-reinforced epoxies including bagasse [2,8,9]. Recently, there have also been investigations on hybrid reinforcement. For example, reinforcement using both powder and fibre filler on epoxy, and hybrid natural fibre reinforcement using aramid and bagasse on epoxy [10,11]. However, most of the reported research on these mechanical characterizations, especially the tensile properties of bagasse-reinforced polymer composites, are under constant loading speeds which rarely happens in real applications. The strain rate sensitivity and failure behaviour of bagasse-reinforced polymer composites can be very different under various loading rates due to their viscoelastic nature. Thus, they are extremely important to investigate in order to produce mechanically competent natural fibre composites under various strain rate conditions.
Based on the abovementioned facts, this research focuses on the analysis of the tensile strain rate sensitivity in terms of the failure strength and the fracture toughness of different particle size bagasse-reinforced epoxies under various strain rate conditions. Bagasse–epoxy composites were fabricated using a hand lay-up technique. The strain rate sensitivity of composites with different sizes of bagasse filler was investigated with the help of Weibull probability analysis together with the fractography of the fracture test coupons. The research result is expected to extend the knowledge on what sizes of natural fibre-reinforced polymer composites can give better mechanical properties and failure strength dispersions under various strain rates.

2. Experiments

2.1. Materials

Sugarcane bagasses were procured from a local market stall after their juices were extracted. Epoxy polymers were used as the matrix and NaOH was used to treat the surface of the bagasse and was commercially acquired (Multifillar (M) Sdn. Bhd, Selangor, Malaysia). Carnauba wax was used for ease of demolding.

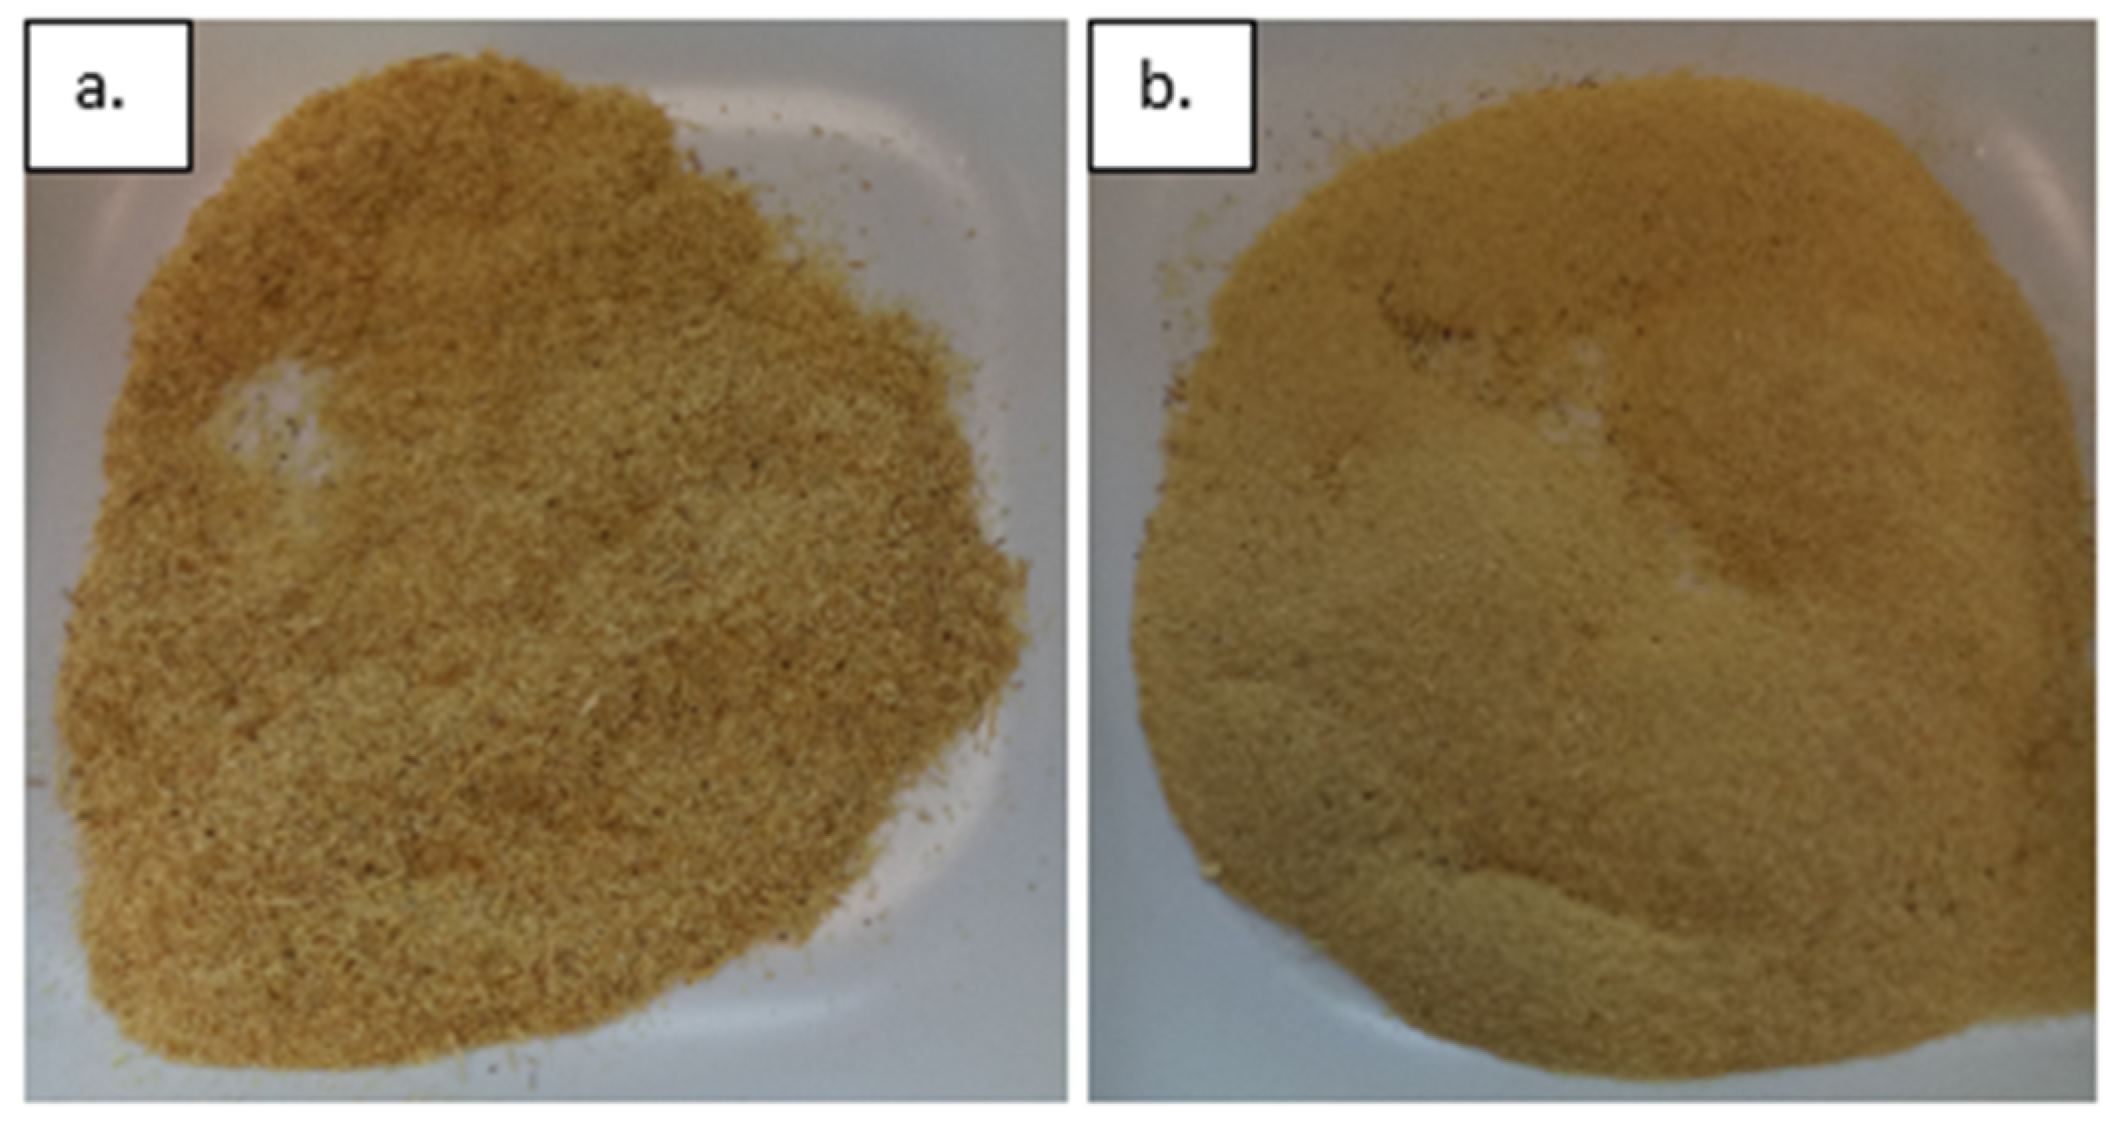
2.2. Bagasse Preparation

Past research found that selecting a proper chemical surface treatment will have significant effects on curing the reaction rate of the matrix and provide improvements in the mechanical properties of the composites [12]. Alkali treatment (1% NaOH treatment) is one of the commonly used method that leads to a better filler–matrix adhesion, with maximum quality mechanical performances [13]. Thus, in this research, bagasse which were manually extracted from crushed sugarcane stalk were treated with a 1% concentrated NaOH solution (15:1) by immersing the bagasse fibres into the solution for 1 h at room temperature. After that, the bagasse was washed using tap water followed by drying in an oven at 90 °C for 24 h. Recovered bagasse were grinded into particle form by using a disk mill, and they were then sieved into size ranges of ≤300 µm and ≤212 µm, as shown in Figure 1.

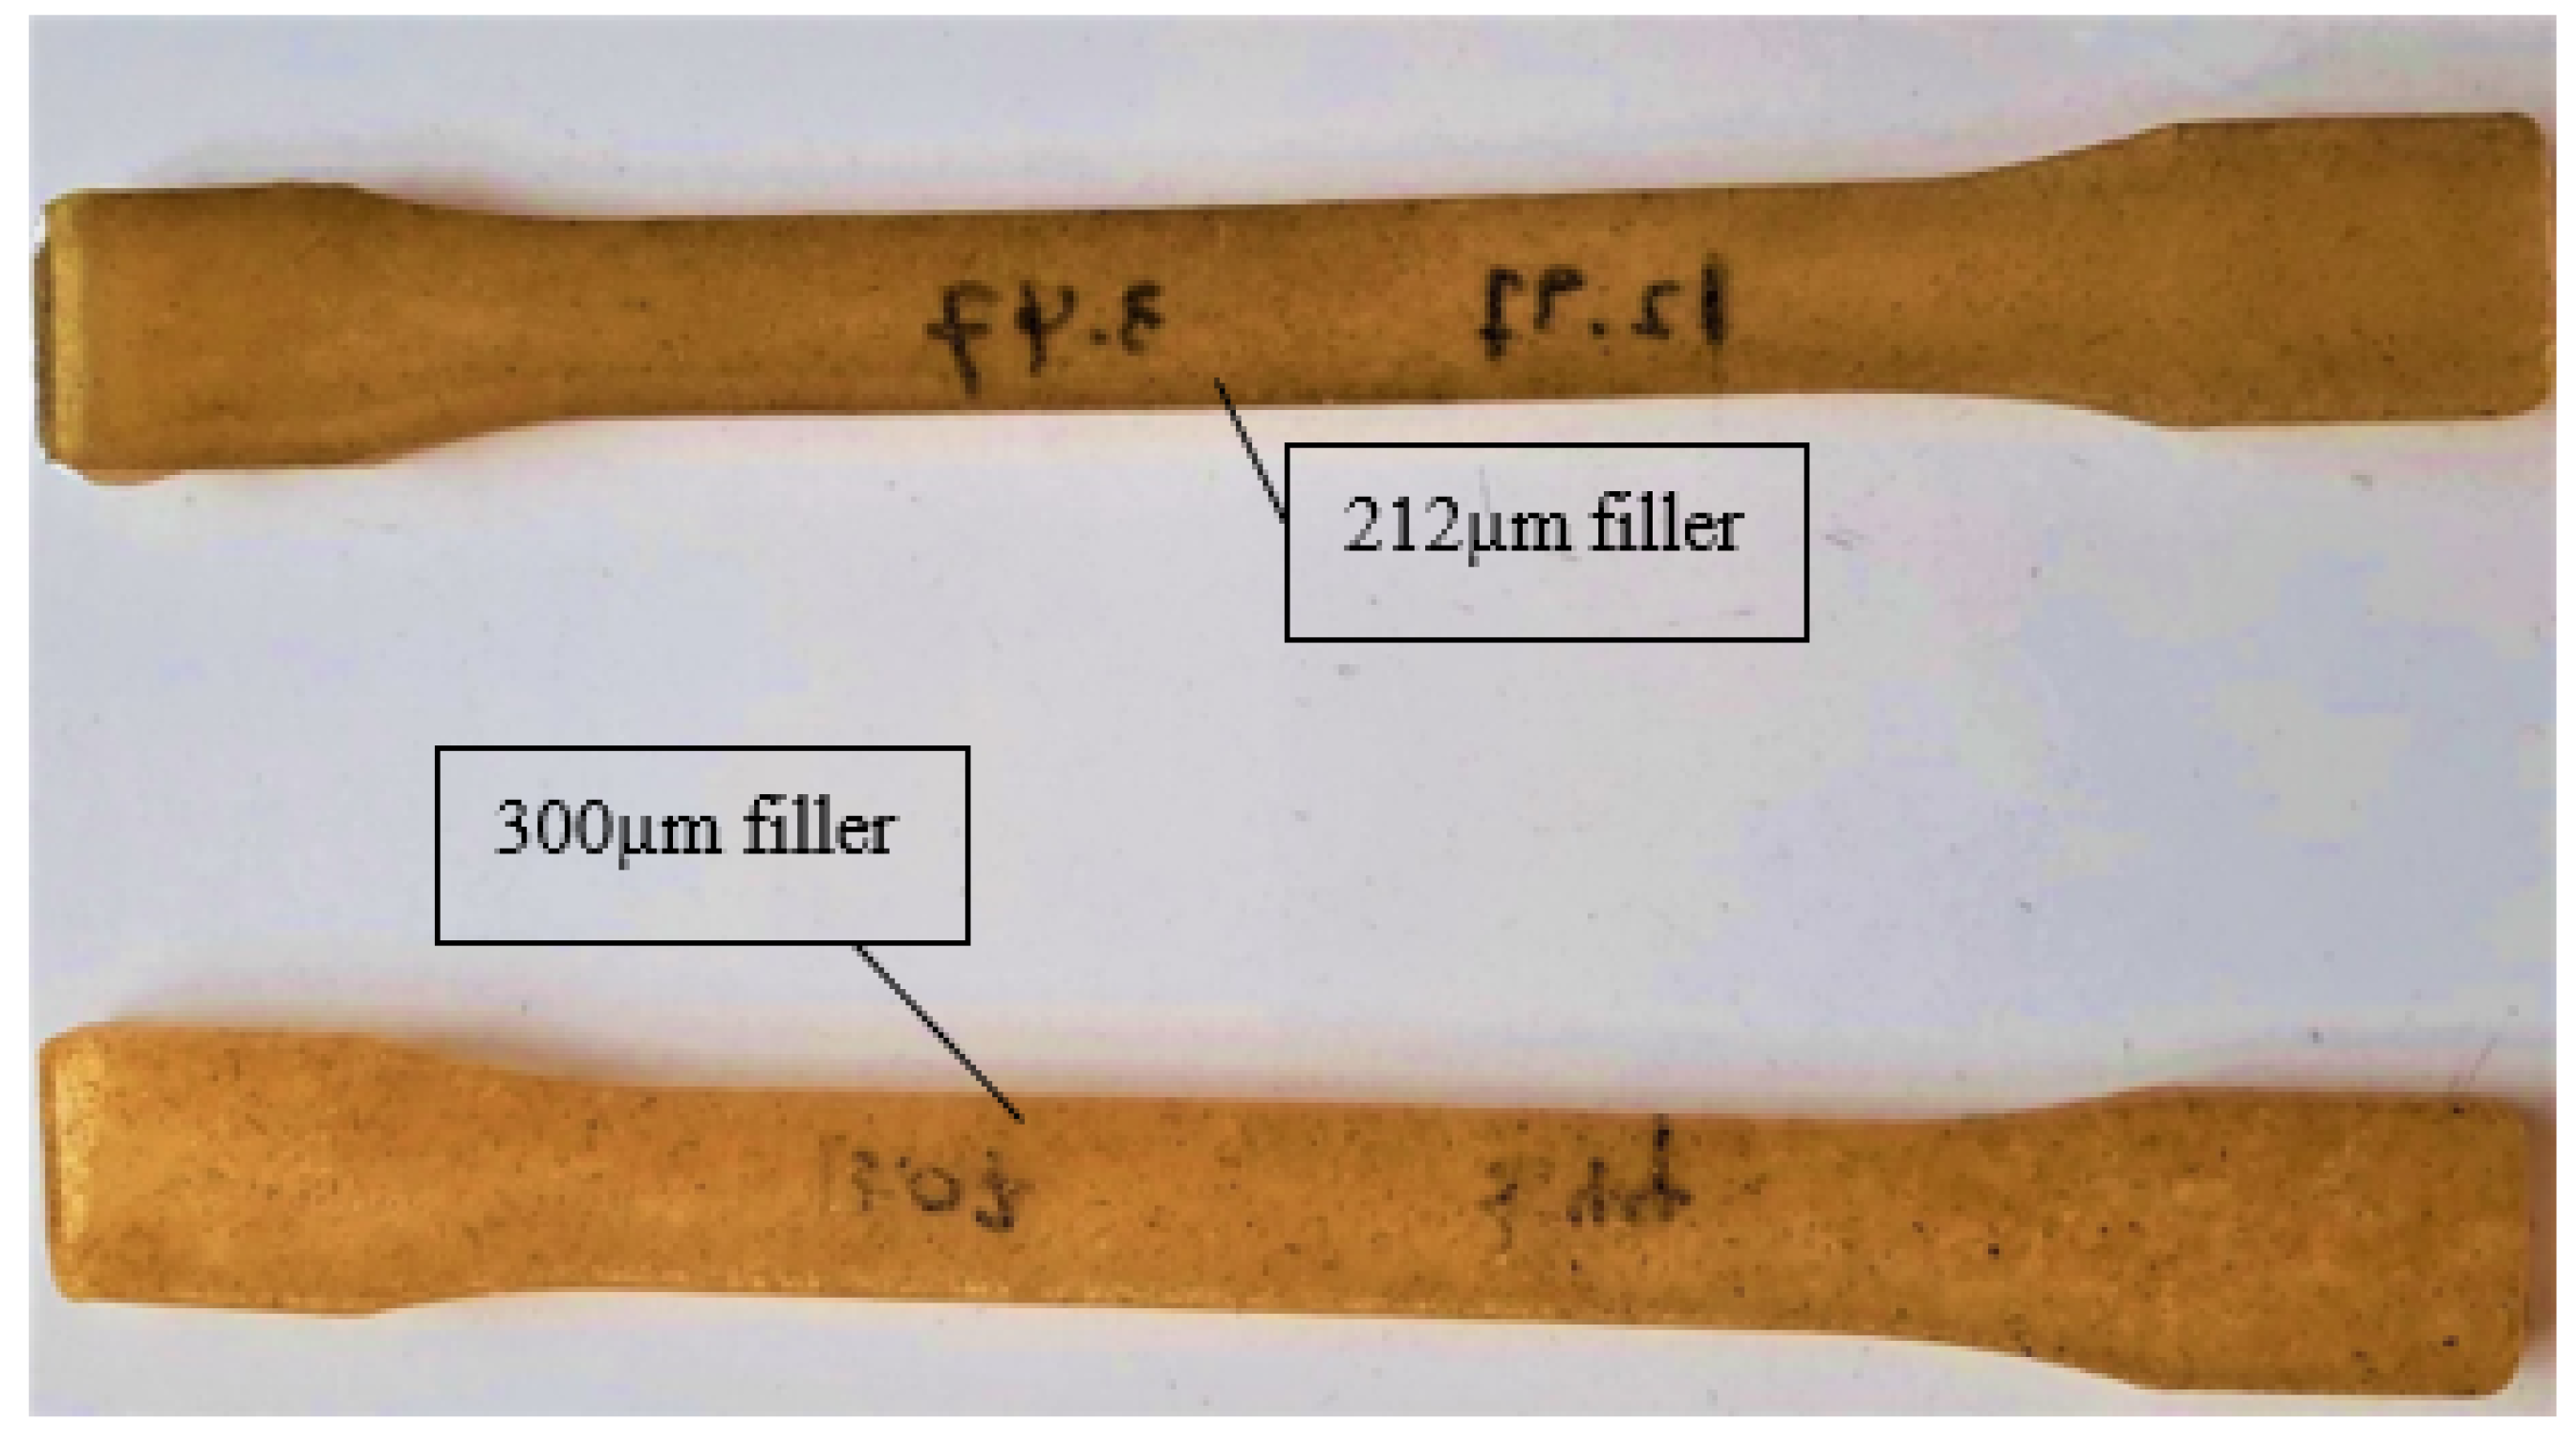
2.3. Bagasse–Epoxy Composite Fabrication

The hand lay-up method was used to fabricate the composites. Careful stirring and scraping techniques were used to mix the epoxy, hardener and bagasse for about 3 min. The mixture was then immersed in warm water at 60 °C for degassing for a further 3 min. After that, the mixture was poured into waxed tensile moulds and allowed 24 h for curing at room temperature, followed by 2 h in the oven at 90 °C. After that, the specimens were taken out from the mould, as shown in Figure 2.

2.4. Composite Testing

Each size of the bagasse-epoxy composites was tested at 0.00028 s−1, 0.00085 s−1 and 0.0017 s−1 of strain rates at room temperature (24 °C) using a Lloyd LR10K (West Sussex, UK) universal tensile tester. The strain rates were converted from 2 mm/min (based on ASTM D3039), 6 mm/min and 12 mm/min by dividing the sample’s original gauge length. The rates chosen are wide enough to show significant differences in mechanical properties.

3. Results and Discussion
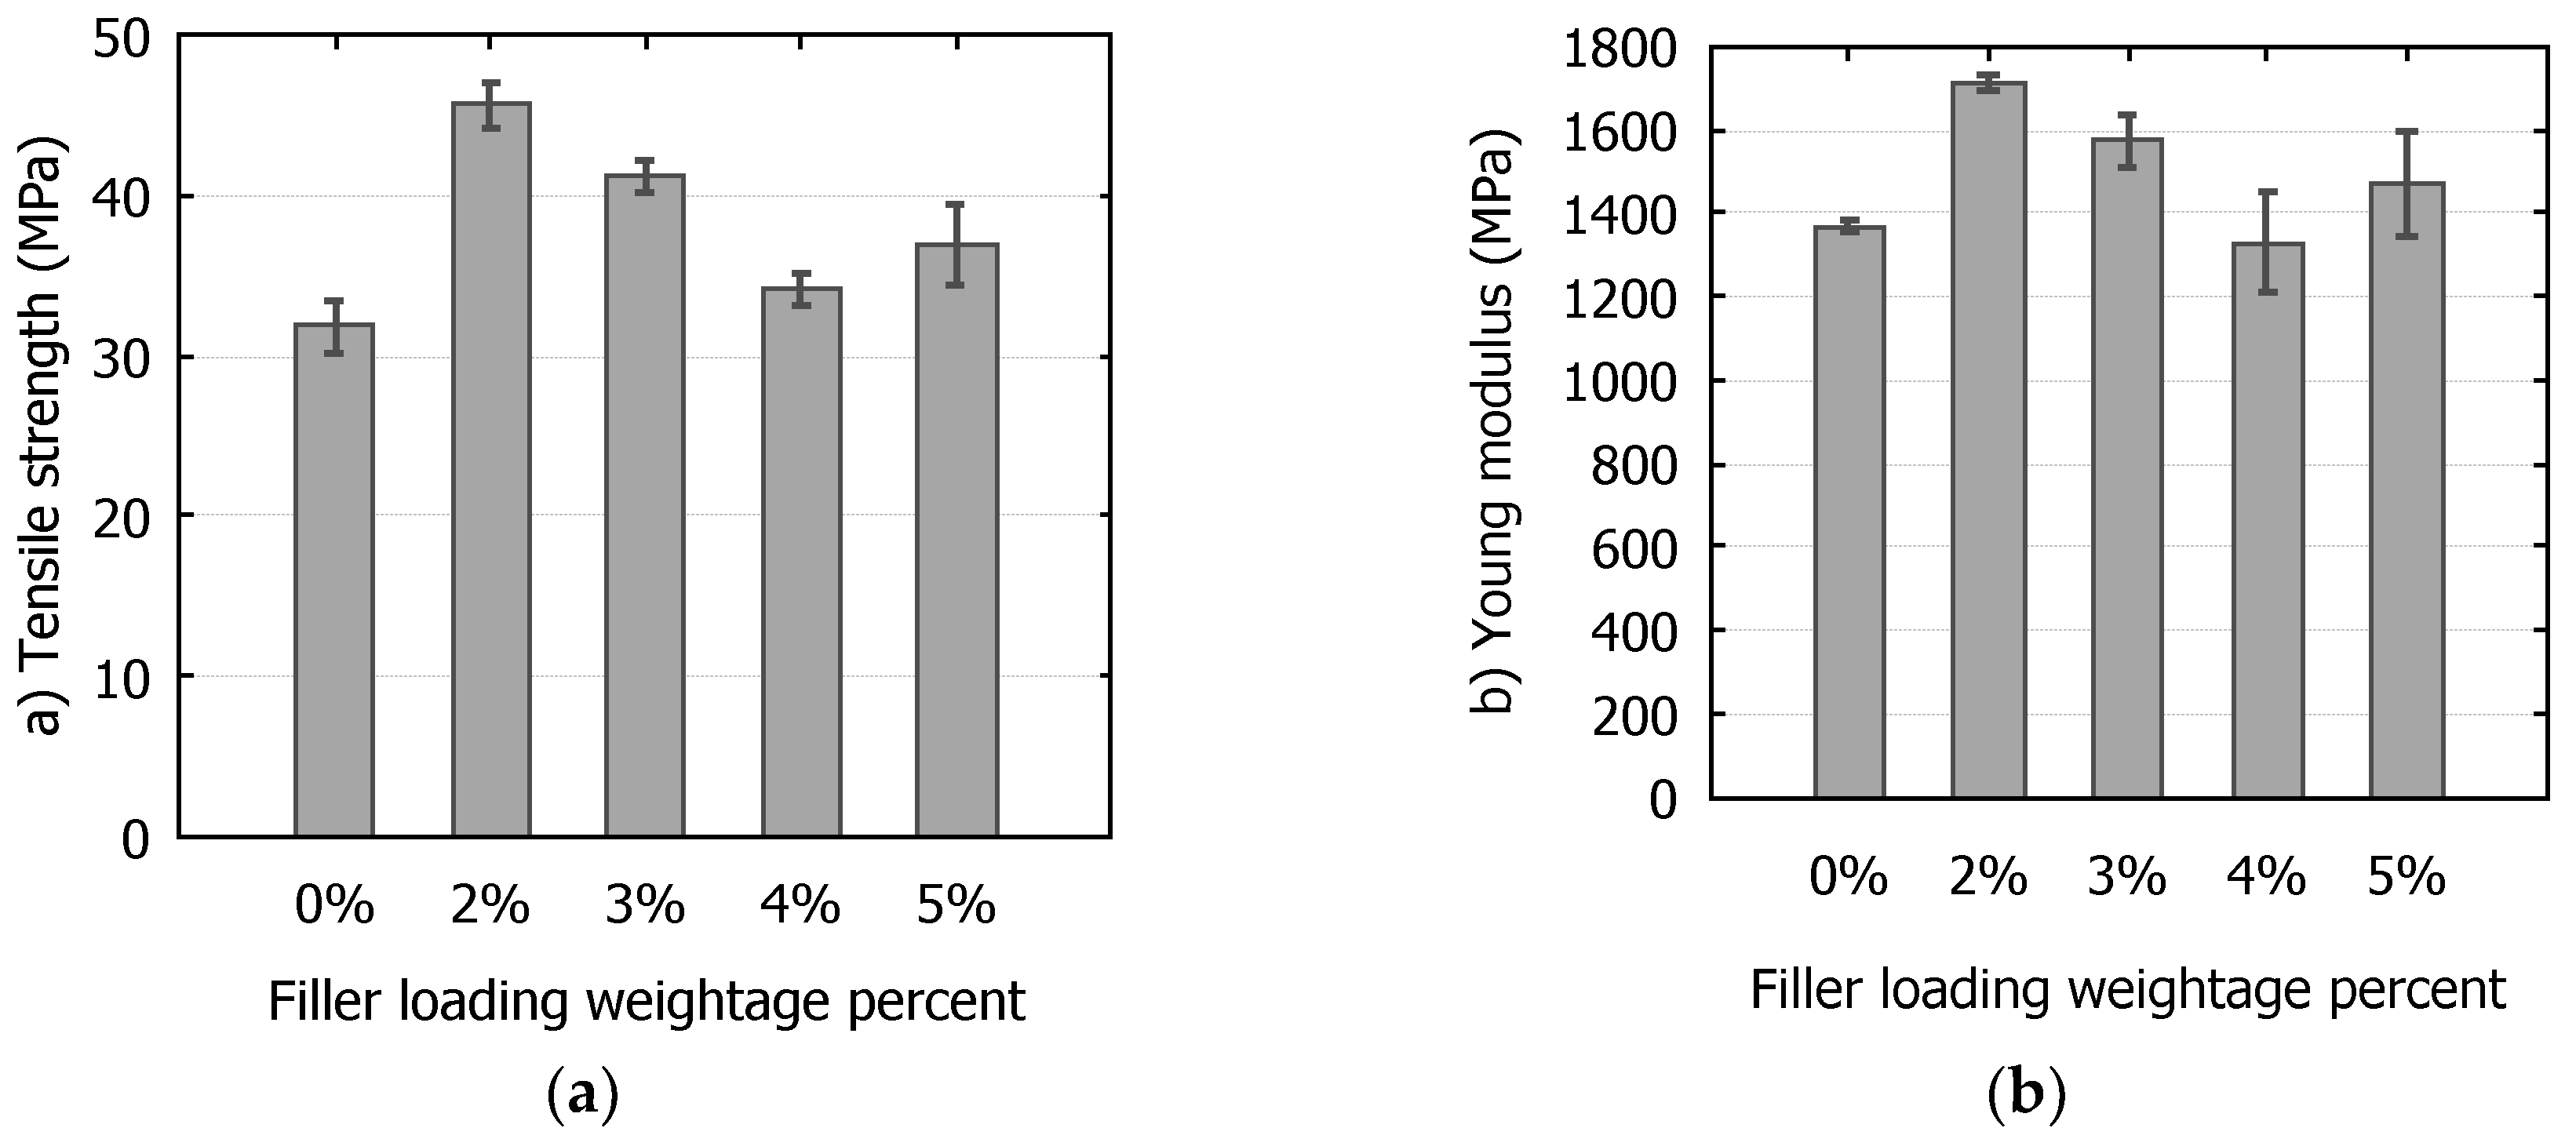
3.1. Filler Loading

A total of 300 μm sized bagasse–epoxy composites were fabricated by a hand-mixing technique with different weightage loadings of 0%, 2%, 3%, 4% and 5%. Then the composites were subjected to tensile testing and the results are reported in Figure 3 as the tensile strength and Young’s modulus. As shown in Figure 2, the composite with 2% filler has the highest tensile strength (45.61 MPa) and Young’s modulus (1714.96 MPa). Compared to neat epoxy, the increase in tensile strength was about 43.52%, 27.6%, 5% and 10.9% for filler weightages of 2%, 3%, 4% and 5%, respectively.
Theoretically, composite samples should have gained higher strengths by incorporating a higher amount of filler. However, up to a certain composition of filler loading, mechanical properties tends to decrease due to lack of effective adhesion between the filler and epoxy [14,15]. With the increase in filler loading, particle began to agglomerate and thus limited the effective stress transfer between the filler and matrix and detoriate-associated mechanical properties.
The filler dispersion on a fractured surface was qualitatively analysed by using a stereomicroscope as shown in Figure 4. With the increase in filler loading, the composite structure suffers from imperfections such as porosities and voids together with particles agglomerating, as clearly visible in Figure 4a in 5 wt.% baggage particle-loaded composites. The failure of composites during tensile testing might be caused by the crack initiation from voids or poor interfacial bonding between agglomerated particles and the polymer matrix [16,17].

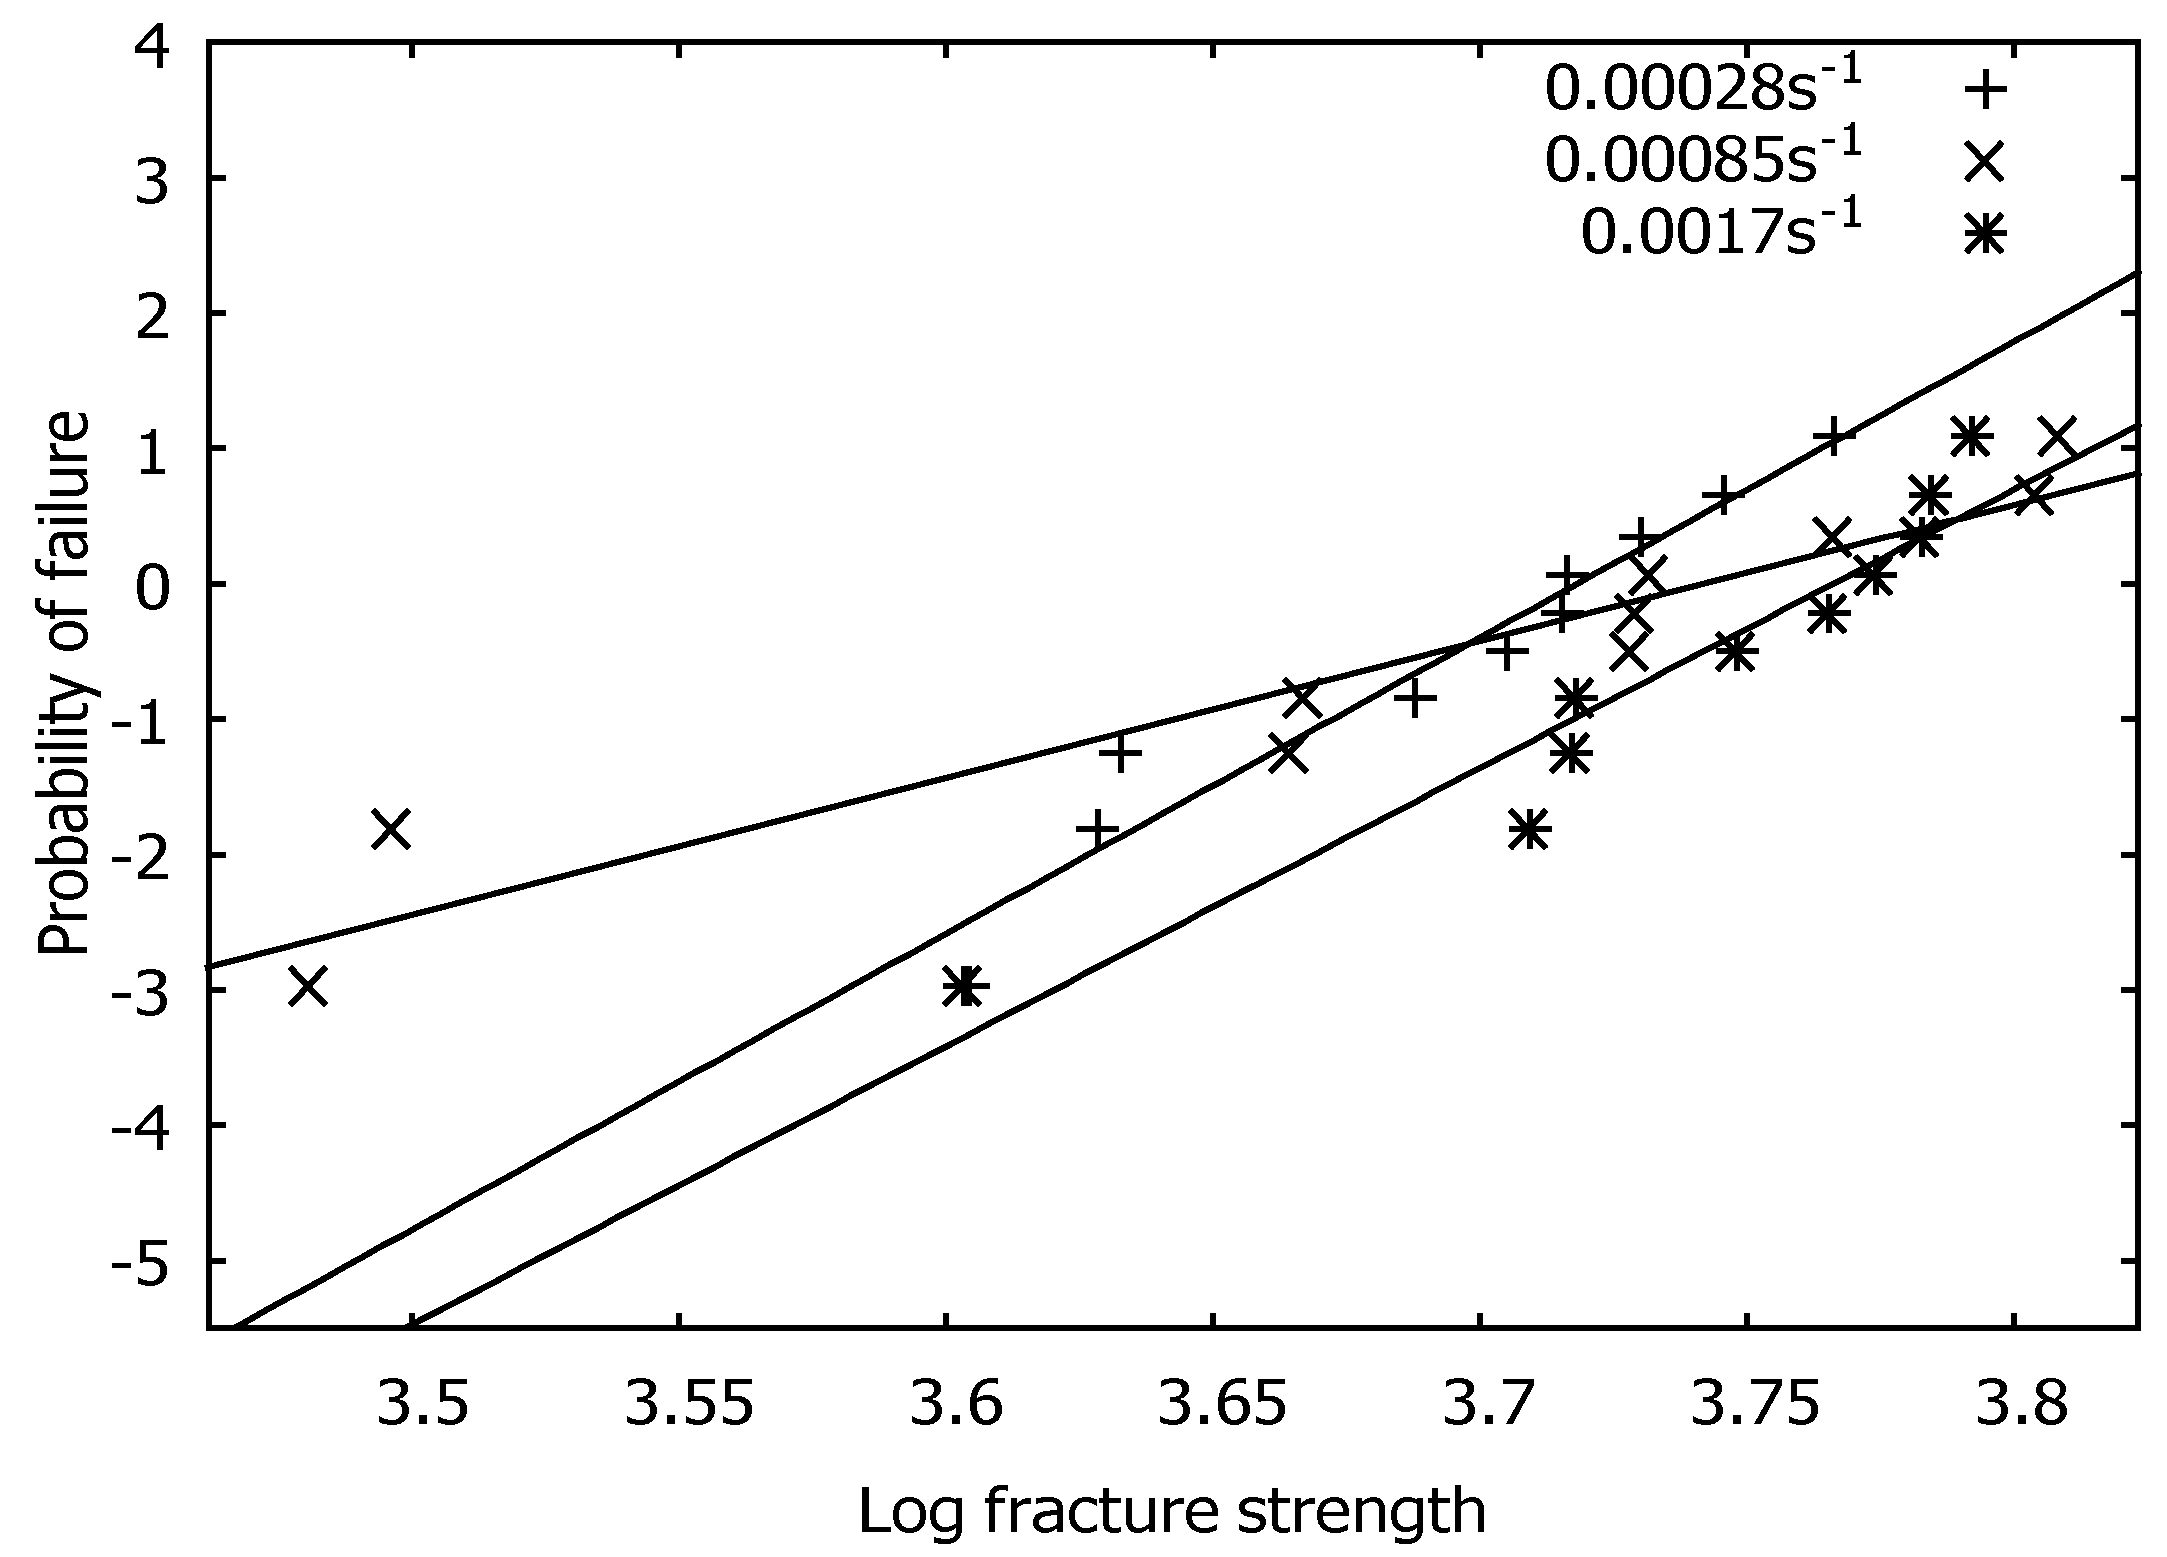
3.2. Weibull Analysis

Weibull shape and scale parameters are well known in the determination of the statistics and probability of random variables describing composite properties [18]. Besides, a linear regression is a simple method to determine these parameters. Weibull parameters were used to analyse the strain rate sensitivity in terms of the fracture probability distribution and the tensile strength of bagasse–epoxy composites. The probability of failure is a function of stress, σ as,
P ( σ ) = 1 e ( σ σ o ) m
where m is the Weibull modulus shape parameter as a measure of the dispersion of data and σ o is the scale parameter indicating the overall tensile strength. For converting strength, a common probability estimator is applied using data order ith. Equation (2) shows the estimator where n is the number of data obtained. It gives the least bias strength data among other estimators [18].
P i = ( i 0.5 ) / n

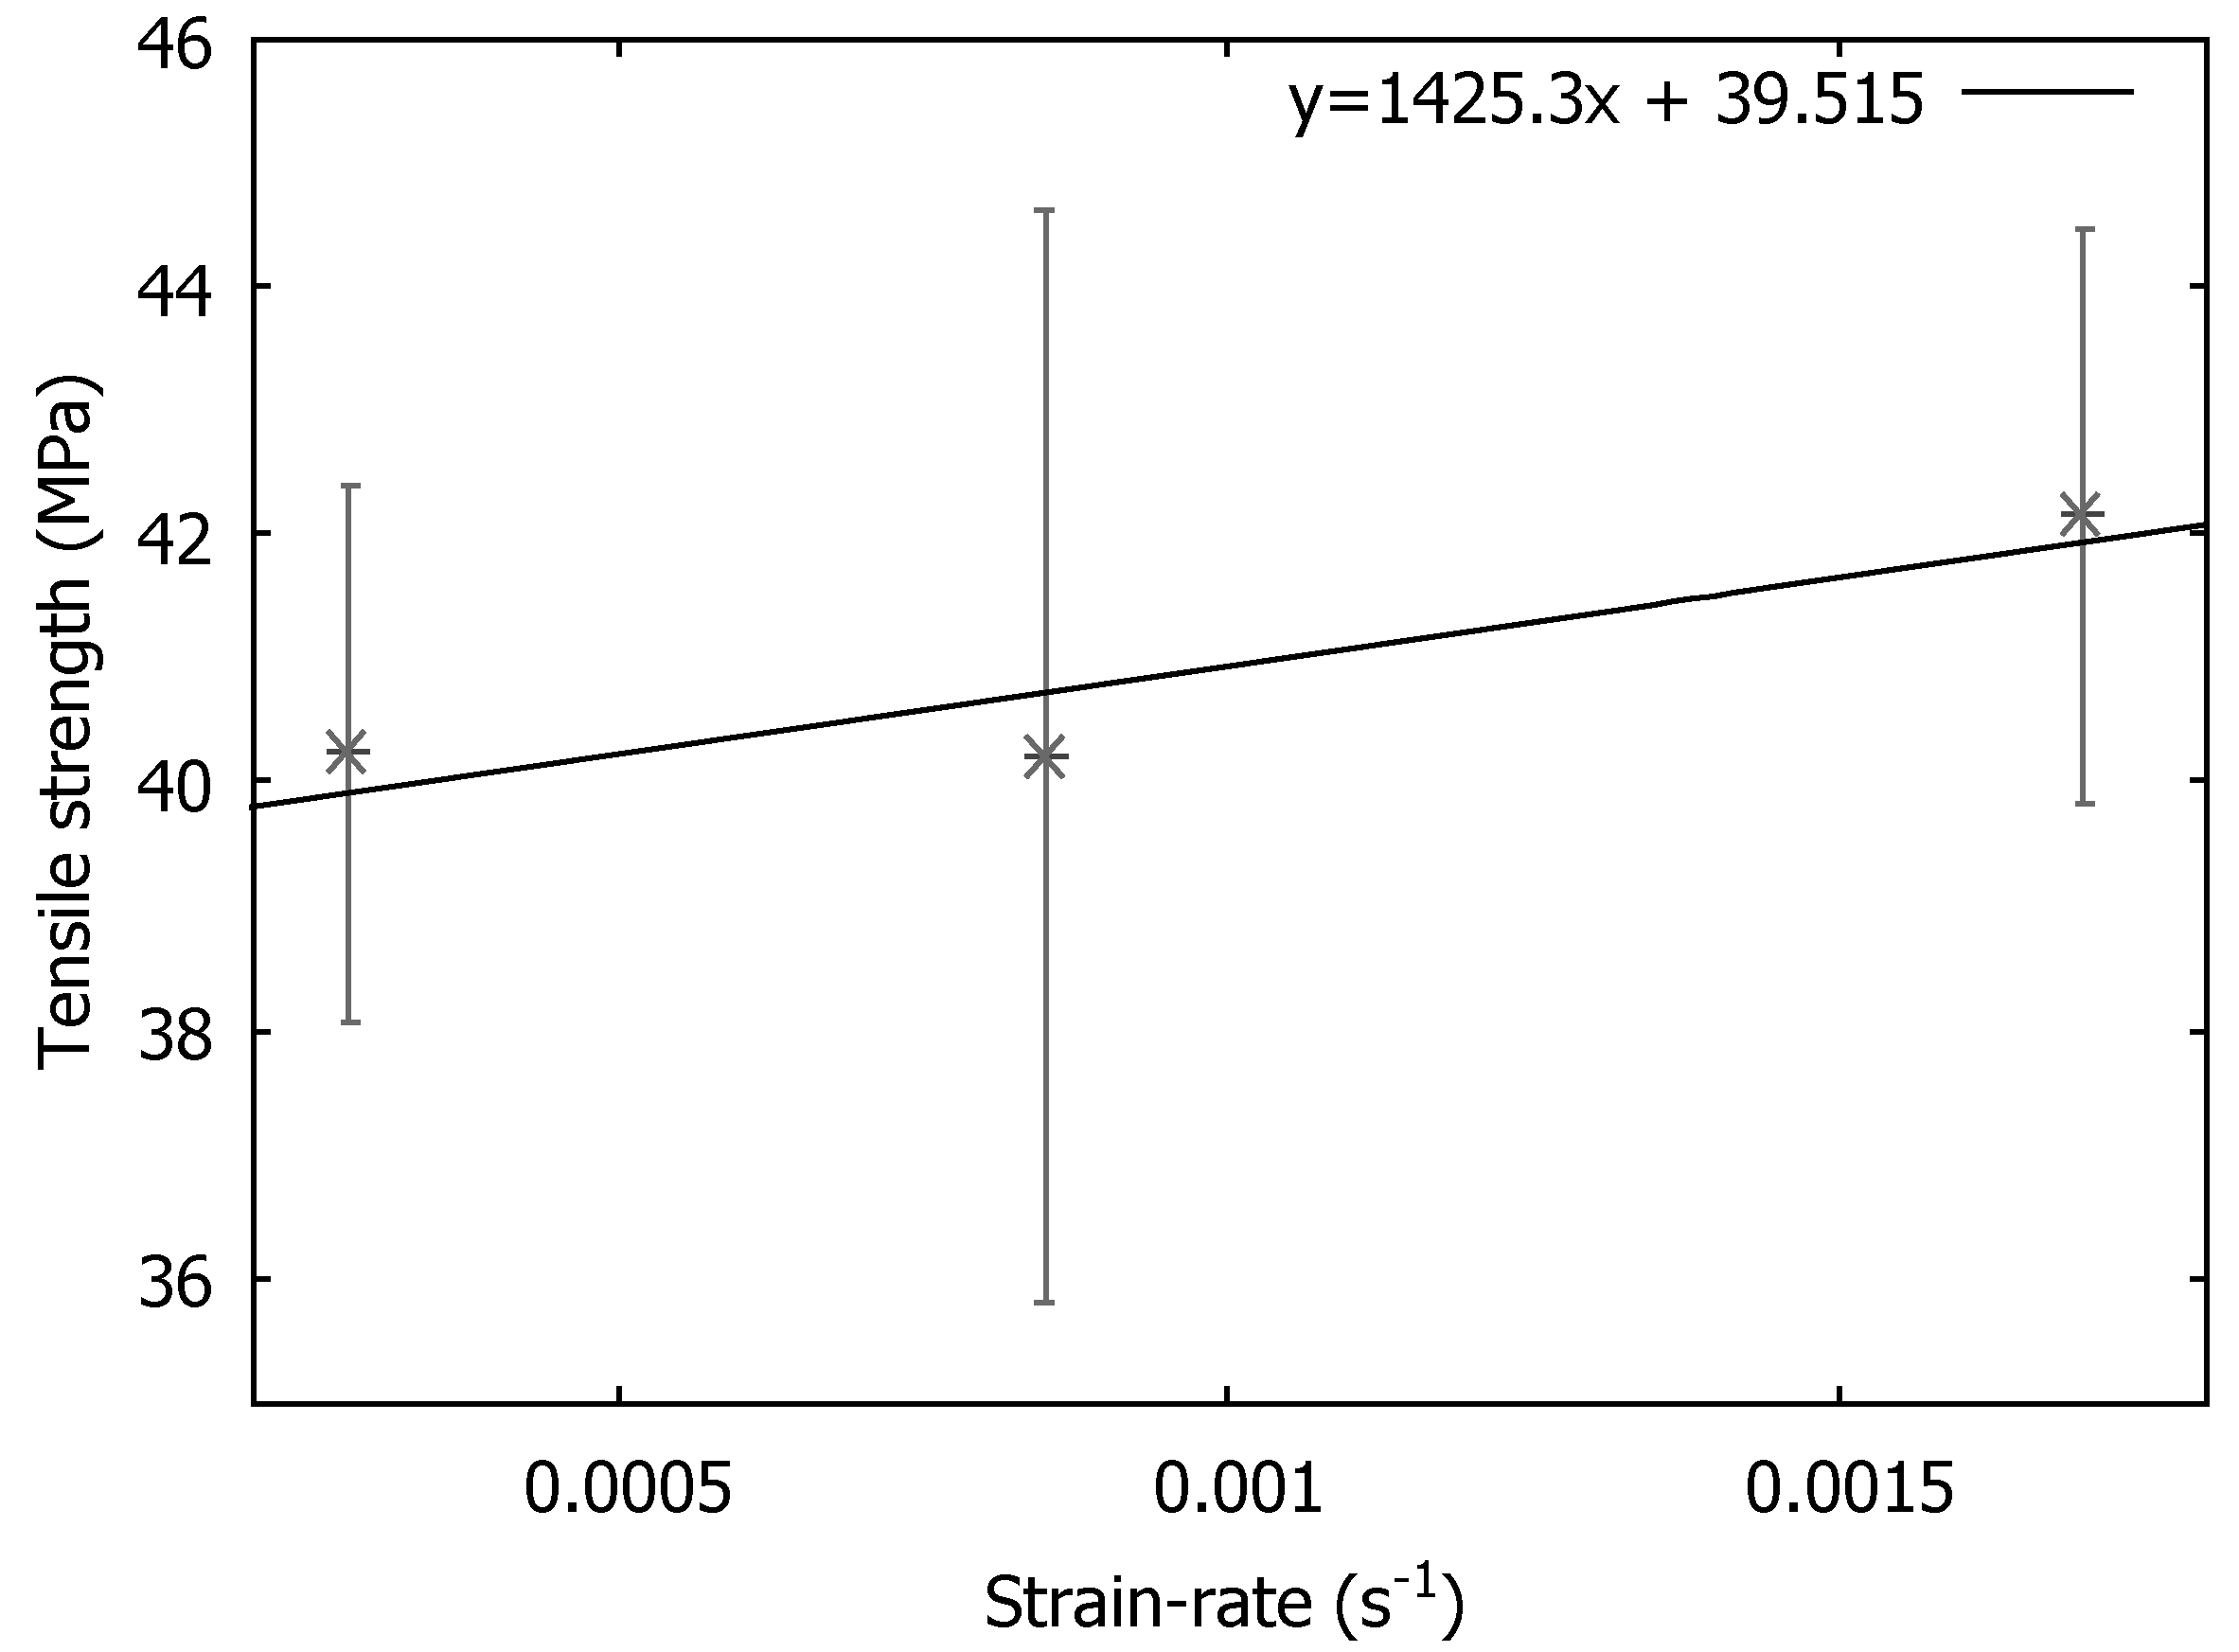
3.3. Linear Regression Method

The Weibull plot is then linearized to a certain coefficient of determination (R2). R2 represents the variability of data points to the regression line. By taking the logarithm twice, Equation (1) becomes:
ln [ ln ( 1 1 p i ) ] = m ln   σ m ln σ o
The gradient of the regression line is the Weibull modulus (m), while the plot-interception point is used to determine the scale parameters [18]. The σ o (scale parameter) or overall strength can be obtained using line equation plots as:
m ln σ o = y   I n t e r c e p t
σ o = e ( y   I n t e r c e p t m )
It defines when the strength of the material, σ , is at its characteristic strength, σ o . Further interpretations will have a probability of failure at 0.63. Thus, regardless of how the distribution of failure strength occurs, the characteristic strength will always be obtained from the probability of failure (0.63).

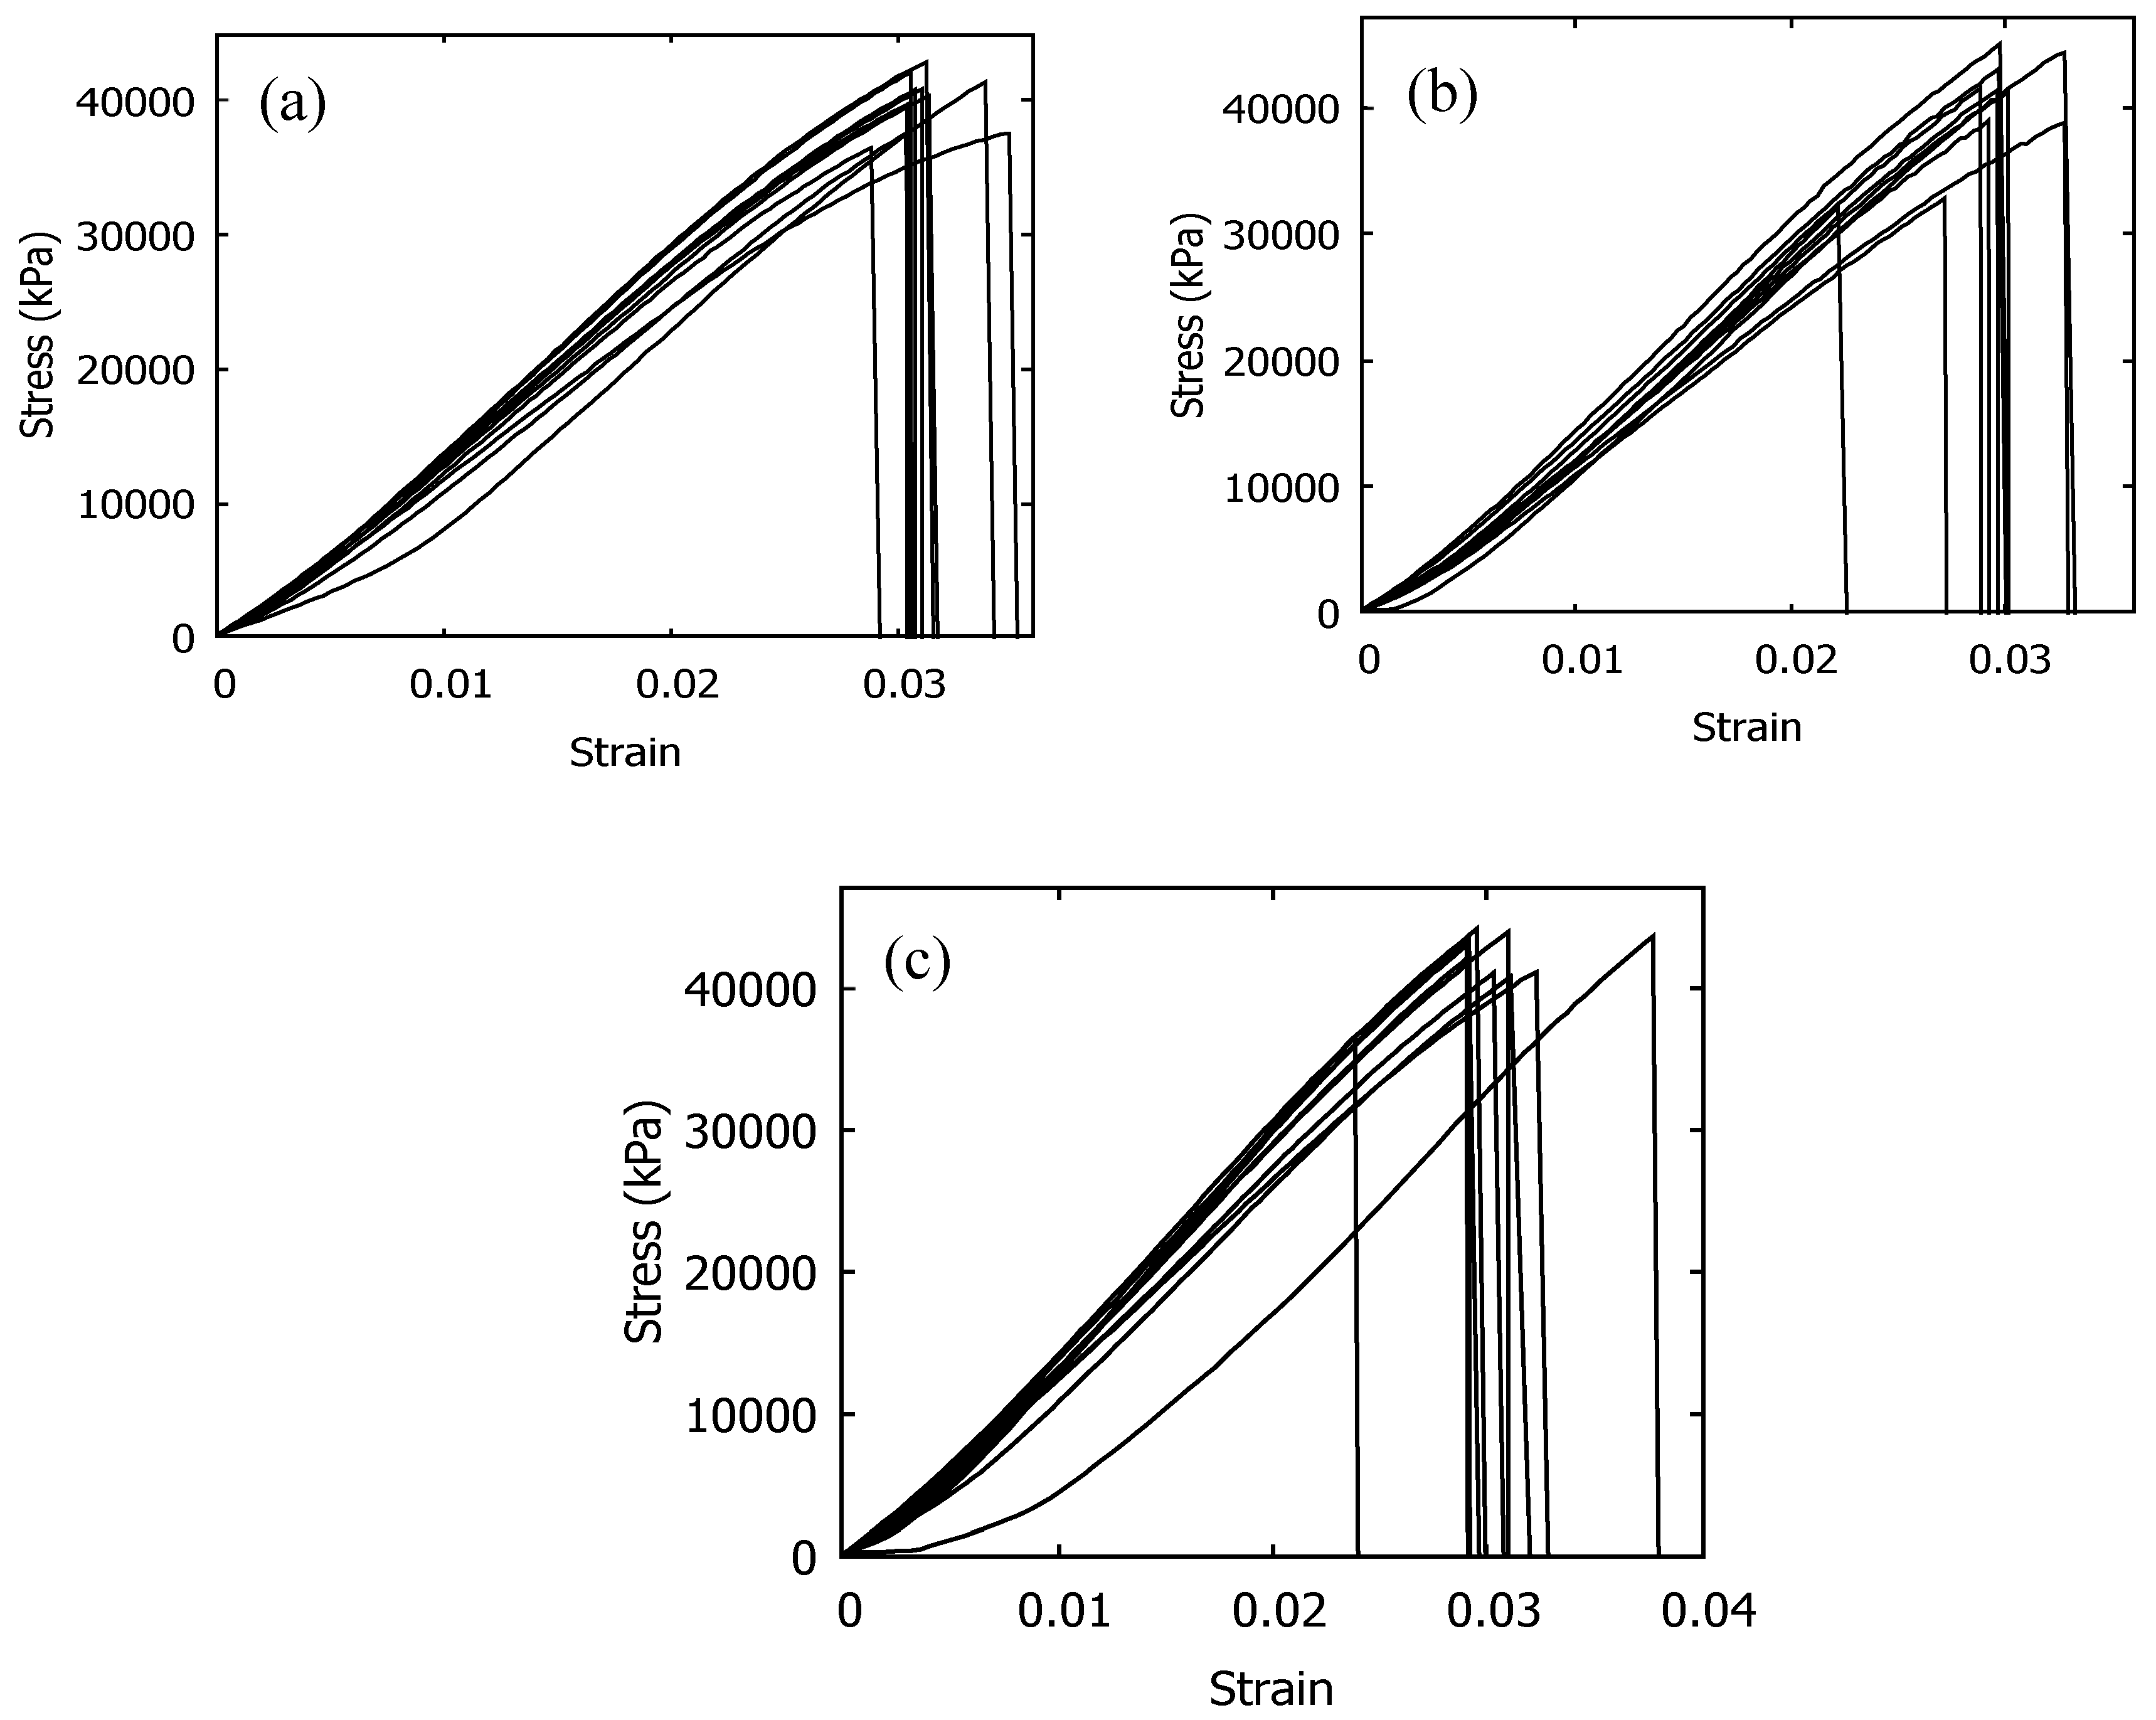
3.4. Strain Rate Sensitivity of 300 µm Bagasse Particle-Reinforced Composites

The epoxy was reinforced using bagasse particles with a size of 300 µm (2 wt.%). Tensile tests were conducted at 2 mm/min, 6 mm/min and 12 mm/min speeds. The test samples had an average gauge length of 118 mm of, and so the corresponding strain rates become 0.00028 s−1 (quasi-static), 0.00085 s−1 and 0.0017 s−1. The obtained strength data were first arranged in ascending order as shown in Table 1. Using the probability factor from Equation (2), Pi was obtained. A Weibull linear regression graph is then plotted by taking the double natural logarithm on both sides of Equation (1). From the plot (Figure 5), the linearized line equation is y = 21.842 x 81.221 ,   y = 10.081 x 37.73 ,   y = 20.542 x 77.372 , respectively, for strain rates of 0.00085 s−1 and 0.0017 s−1. The coefficient of determination (R2) for each equation is 0.94, 0.91 and 0.92. It shows, there is only a small variability of the data points to the regression line and thus, the data are acceptable to the model.
The Weibull modulus was obtained from the gradient of the line from Figure 6 and it is noted that the quasi-static strain rate has the highest Weibull modulus, with a value of 21.842, with strain rates of 0.0017 s−1 with 20.542 and 0.00085 s−1, with 10.081 indicating the quasi-static test result in a more consistent and narrower fracture strength distribution. However, when the strain rate increased to 0.00085 s−1, the tensile strength spread further away which makes the result unpredictable. For a strain rate of 0.0017 s−1, instead of a wider tensile strength distribution, it shifts the entire line to the right. This indicates the viscoelastic nature of polymers that could lead to an increase in strength at higher rates of loading due to more applied energy dissipated as heat. It is also worthwhile to note that the resin itself can carry a portion of load at higher strain rates [3].
These results can be further analysed by obtaining the characteristic strength, σ o (Weibull scale parameter). These strengths represent the overall strength values of a set of samples with a 63.2% probability of failure [19]. The y-intercept is equal to m ln σ o which can be obtained from Figure 5. Thus, the characteristic strengths σ o were found to be 41.2 MPa, 42.2 MPa, and 43.23 MPa, respectively, for strain rates of 0.00085 s−1 and 0.0017 s−1. The highest growth, a 5% increase in the characteristic strength, was achieved by increasing the rate to 0.0017 s−1. By further looking into the relationship between the tensile strength and strain rate, as shown in Figure 7, it shows that the tensile strength slightly increased with an increasing strain rate, which supports the results from the Weibull probability plot.
Stress–strain curves are provided for various strain rates of 300 µm bagasse filler-reinforced composites in Figure 6. The toughness, or the ability to absorb energy, can be obtained from the area under the load deformation curves (Wang et al. 2018). Thus, from integration, the average units of toughness are 498.27 kJ/m3, 418.45 kJ/m3 and 432.3 kJ/m3 for 0.00028 s−1, 0.00085 s−1 and 0.0017 s−1 strain rates, respectively. When comparing higher strain rates to the quasi-static tests, the toughness decreased by up to 16%. This happens as the strain rate increases; the material becomes stiffer and more brittle due to a decrease in the molecular mobility of the polymer chain [20]. Thereby, increasing stress by increasing the strain rate does not necessarily mean a higher energy absorption, especially in a low strain rate range.
Figure 8 shows images from the stereomicroscope under 35 times of magnification on fractured surfaces. The highest strength specimen from each strain rate, with the same size of bagasse reinforcement, was chosen to inspect under the stereomicroscope. As noted from Figure 7, 300 µm bagasse filled epoxy has a relatively smooth fracture surface, especially during a quasi-static strain rate test. However, the roughness does not change much during higher strain rate tests. The smooth fracture surfaces can be attributed to brittle fractures as the crack propagates through the composite by a cleavage process.

3.5. Strain Rates Sensitivity of 212 µm Bagasse Particle-Reinforced Composites

Figure 9 shows the results of 212 µm bagasse filler-reinforced composites under different strain rates. The linearized plot line equations for the respective increasing strain rates are y = 7.516 x 28.755 , y = 14.532 x 56.839 and y = 21.478 x 83.877 , with R2 values of 0.958, 0.917 and 0.945. The coefficient of determination is above 0.9 for all samples; thus, the data are fit to the Weibull probability plot model. By the Weibull moduli of 7.516 MPa, 14.532 MPa and 21.478 MPa, it shows the increasing consistency of the fracture strength with increasing strain rates. Thus, it is more reliable when subjected to a higher loading speed, compared to 300 µm filler-reinforced composites. This can be attributed to a good dispersion of relatively small fillers. It leads to a better fibre–matrix stress transfer which is in good agreement with a lot of previous studies [2,21,22]. The characteristic strengths σ o were calculated as 45.86 MPa, 49.96 MPa and 49.66 MPa, respectively, for 0.00028 s−1, 0.00085 s−1 and 0.0017 s−1 strain rates. A nearly 9% increase (maximum) in characteristic strengths was achieved compared to 300 µm filler-reinforced composites (5%) and thus, the smaller filler-reinforced composites’ strength are more rate-dependent.
Figure 10 shows the average strength of 212 µm filler-reinforced composite against the strain rate. The gradient of the line is about 3737.7 which is greater than the 300 µm filler-reinforced composites (1425.3). Thus, it shows a significant increase in the tensile strength with higher strain rates. According to a previous study from [23], the dramatic increase in the strength with increasing strain rates (by decreasing filler sizes) is attributed to the increase in effective pinning joints that resist polymeric chains’ movement. An effective pinning joint can be achieved by increasing the number of fillers that reduce the number of links between two pinning joints for a constant volume or mass, which allows a greater number of fillers to be used if the filler size is small. Hence, a reduced filler size can increase the number of effective pinning joints and lead to a dramatic increase in strength.
The areas under the stress–strain curves, as shown in Figure 11, show the energy absorptions (toughness) of the samples which are around 611.88 kJ/m3, 853.04 kJ/m3 and 835.5 kJ/m3 for 0.00028 s−1, 0.00085 s−1 and 0.0017 s−1 strain rates, respectively. Thus, compared to 300 µm fillers, these composites do not exhibit brittle fractures at high strain rates, instead showing a more significant energy absorption or higher fracture toughness. This high toughness strongly depends on a toughening mechanism that increases the resistance of crack propagation. According to past research, smaller particle fillers have more surface contact area which results in a higher surface energy of the filler–matrix interface and leads to a higher fracture toughness [24]. This fact was further supported by the work of past study, which was based on mathematical modelling and found that an increase in the volume specific debonding energy could increase the crack resistance with smaller particle sizes [25].
Figure 12 shows the fracture surfaces, under various strain rates, of 212 µm bagasse-reinforced composites. As the particles’ sizes became smaller, it required more particles to maintain a constant mass, thus it become denser and appeared darker when compared to the 300 µm filler-reinforced composites. The darkening effect became more significant under a stereomicroscope. As the strain rate of the composite increased, the fracture surface roughness slightly increased (qualitatively). In addition, it showed significantly rougher surfaces when compared to the case of 300 µm’s filler-reinforced composites. According to [26], fracture toughness and surface roughness have been found in good agreement with each other; a rougher fracture surface actually indicates a higher fracture toughness of the composite. From the information mentioned above, the average toughness increased with increasing strain rates. This was especially prominent in the case of the 212 µm filler-reinforced composite, which had a significant increase from a quasi-static strain rate of 0.00028 s−1 to 0.00085 s−1, but not so much change from 0.00085 s−1 to 0.017 s−1, which is very similar to the surface roughness (qualitative) as shown in Figure 11.

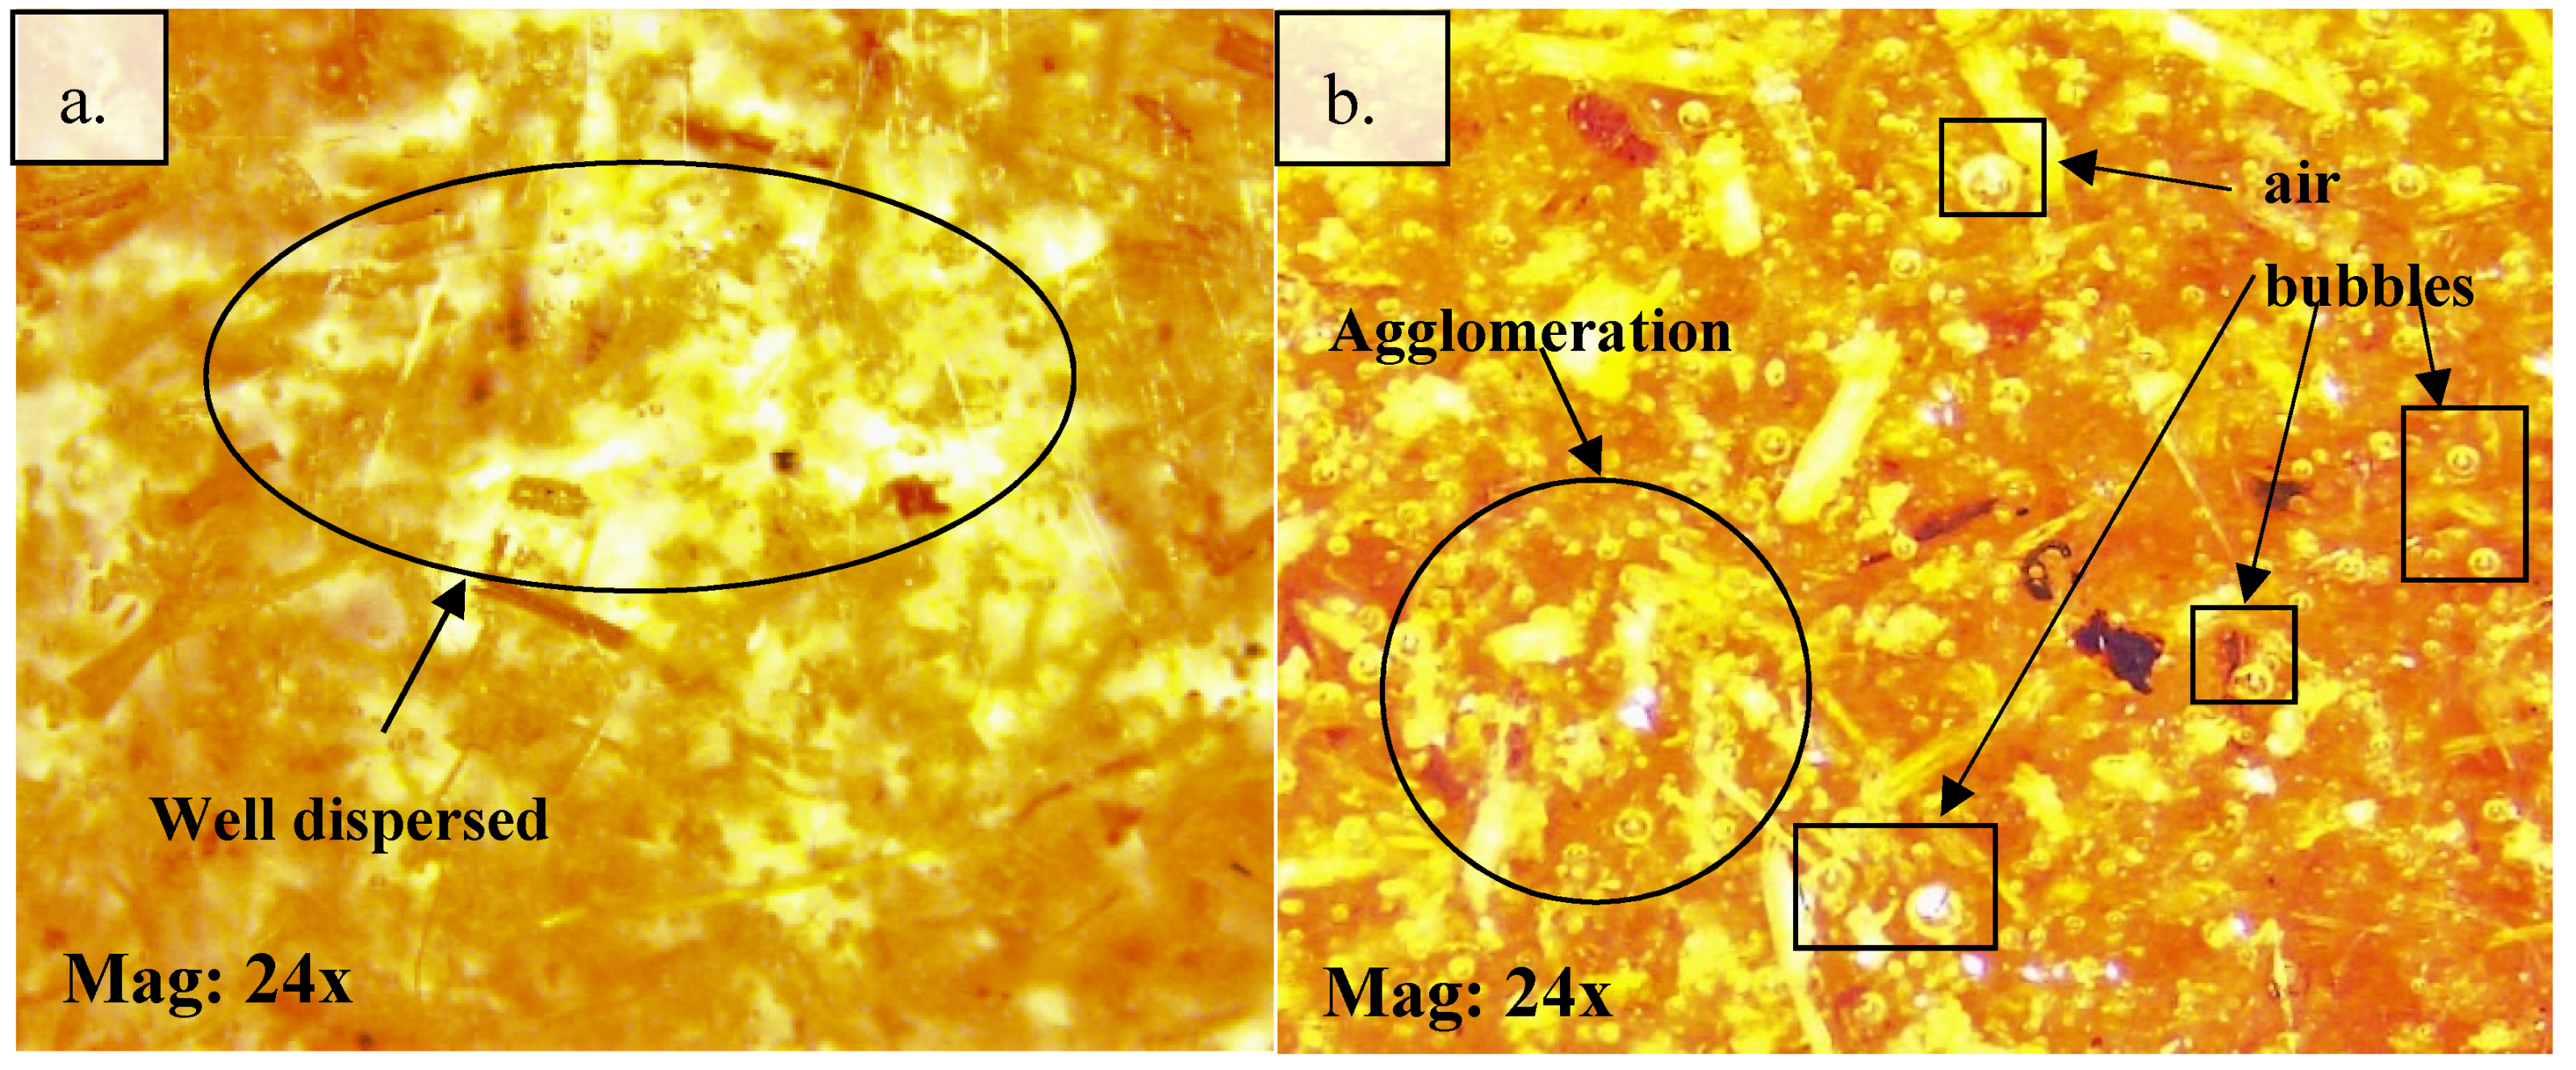
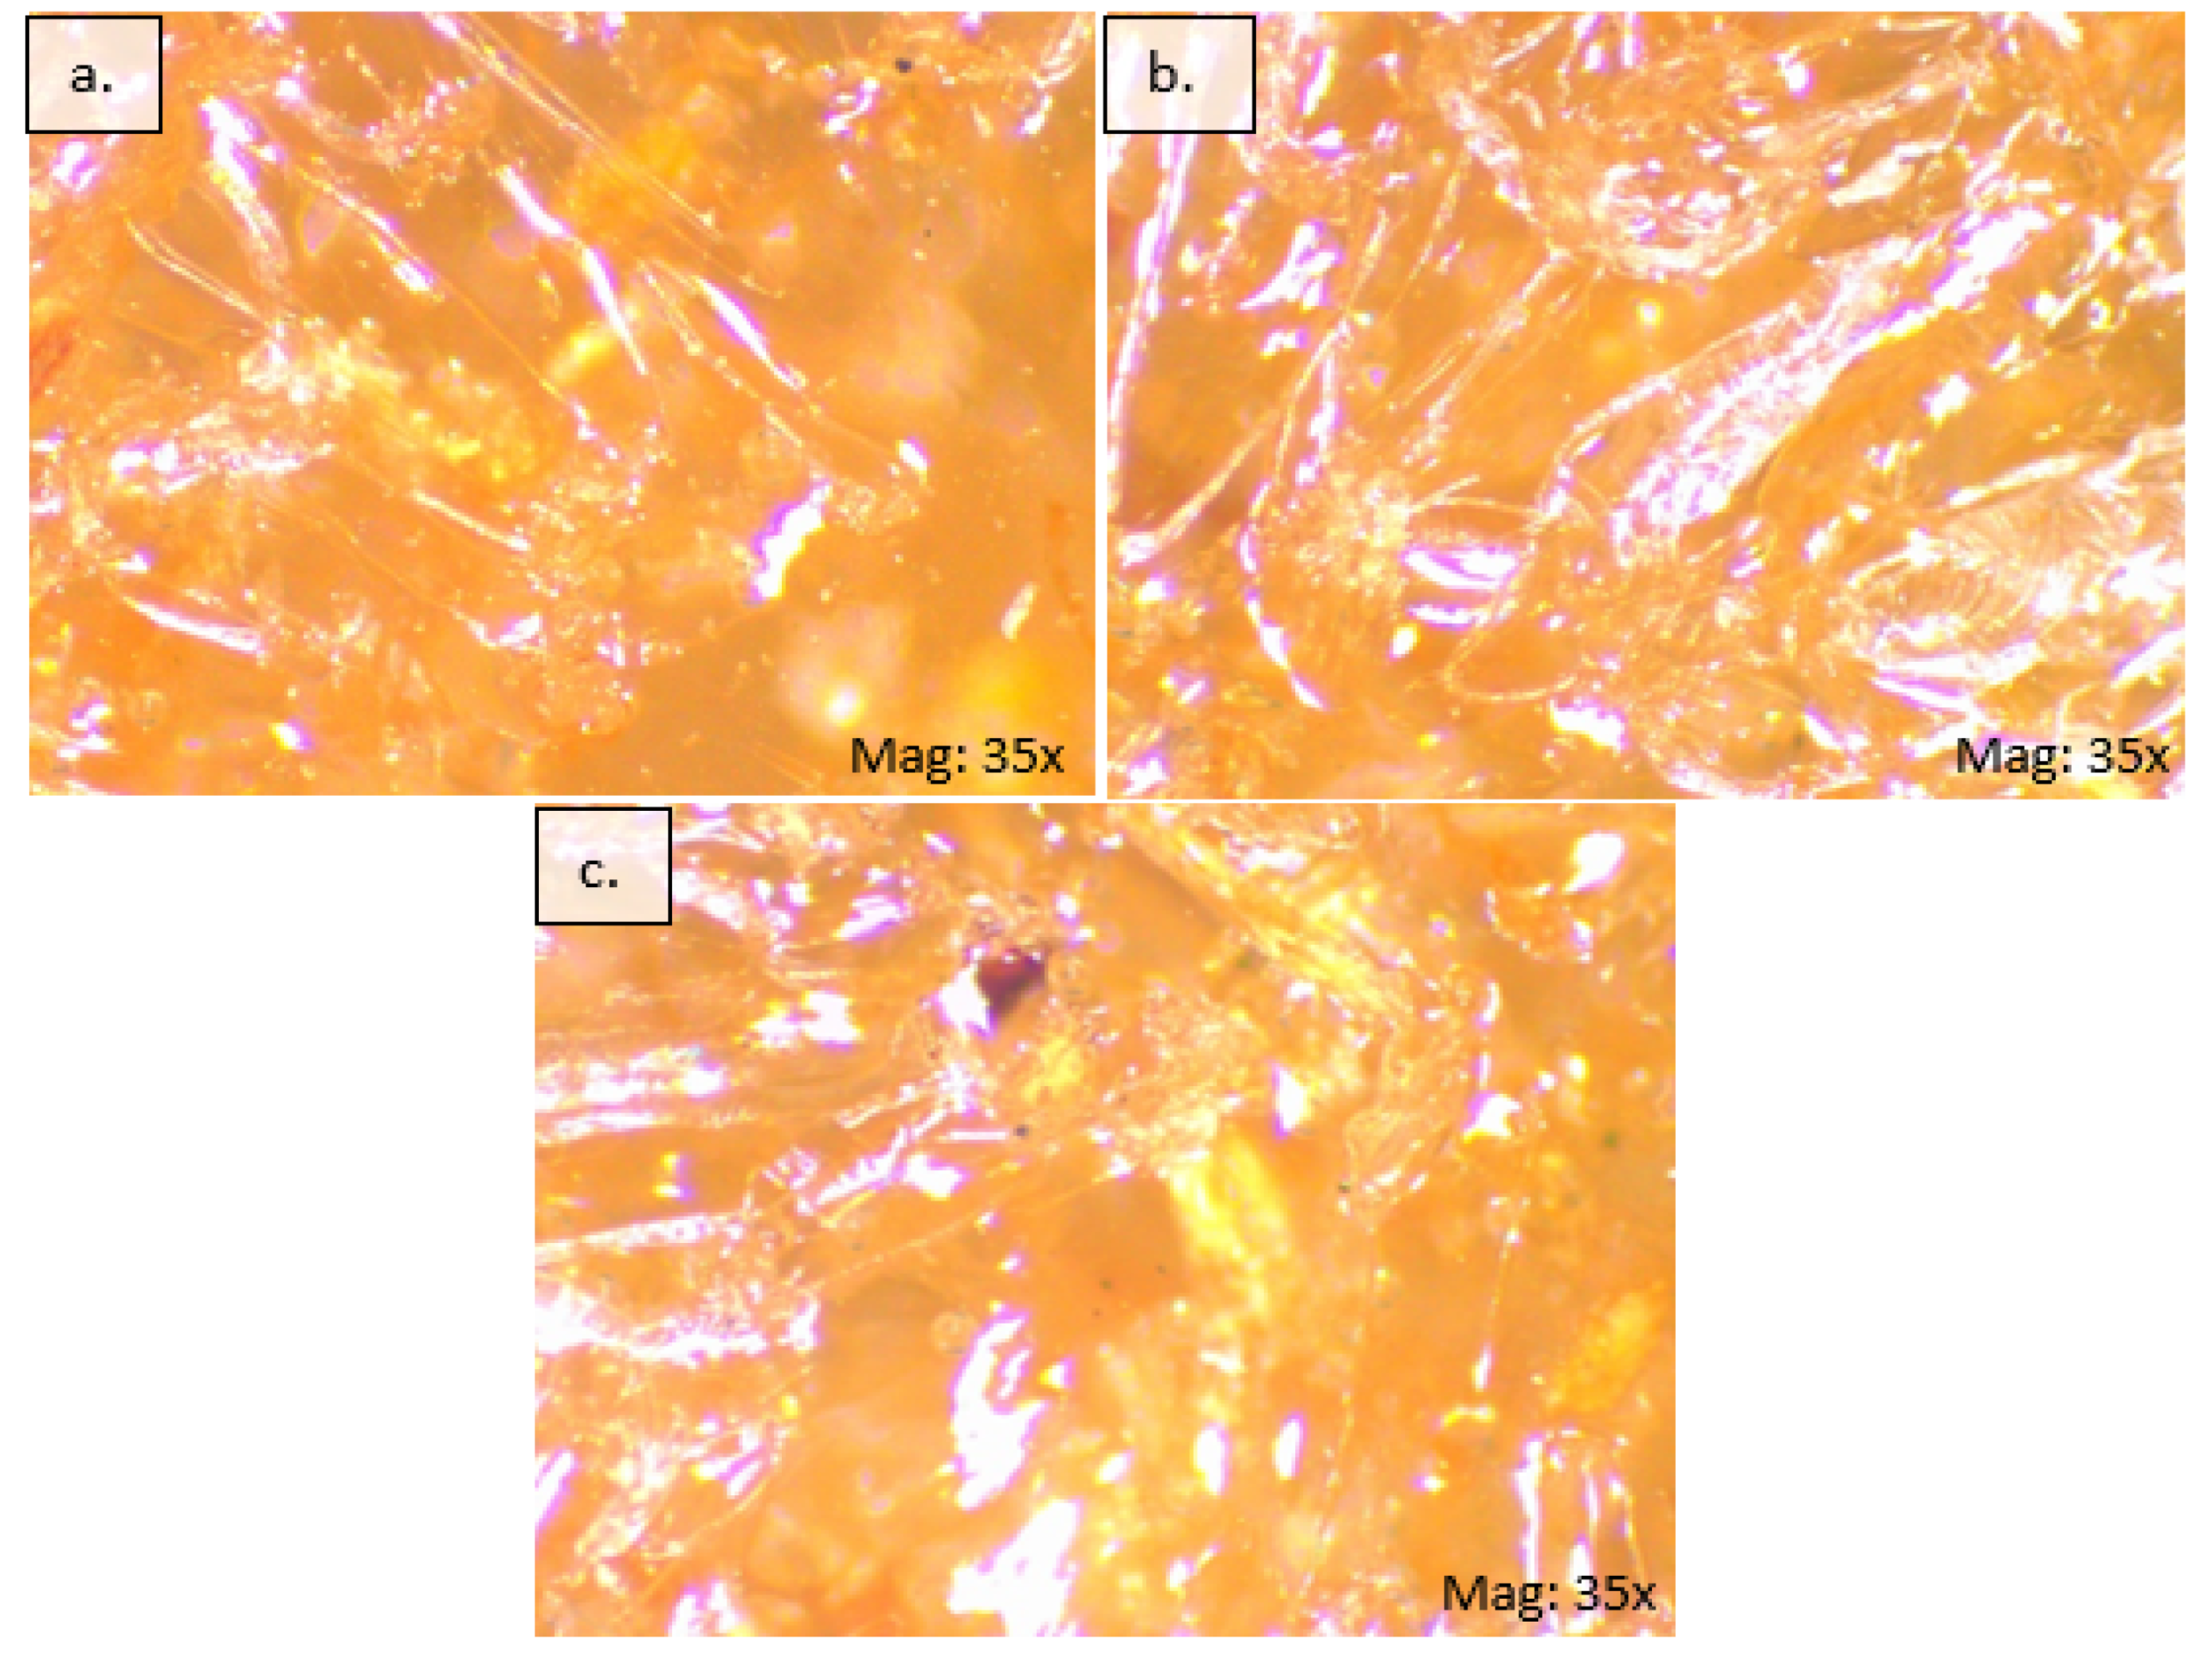
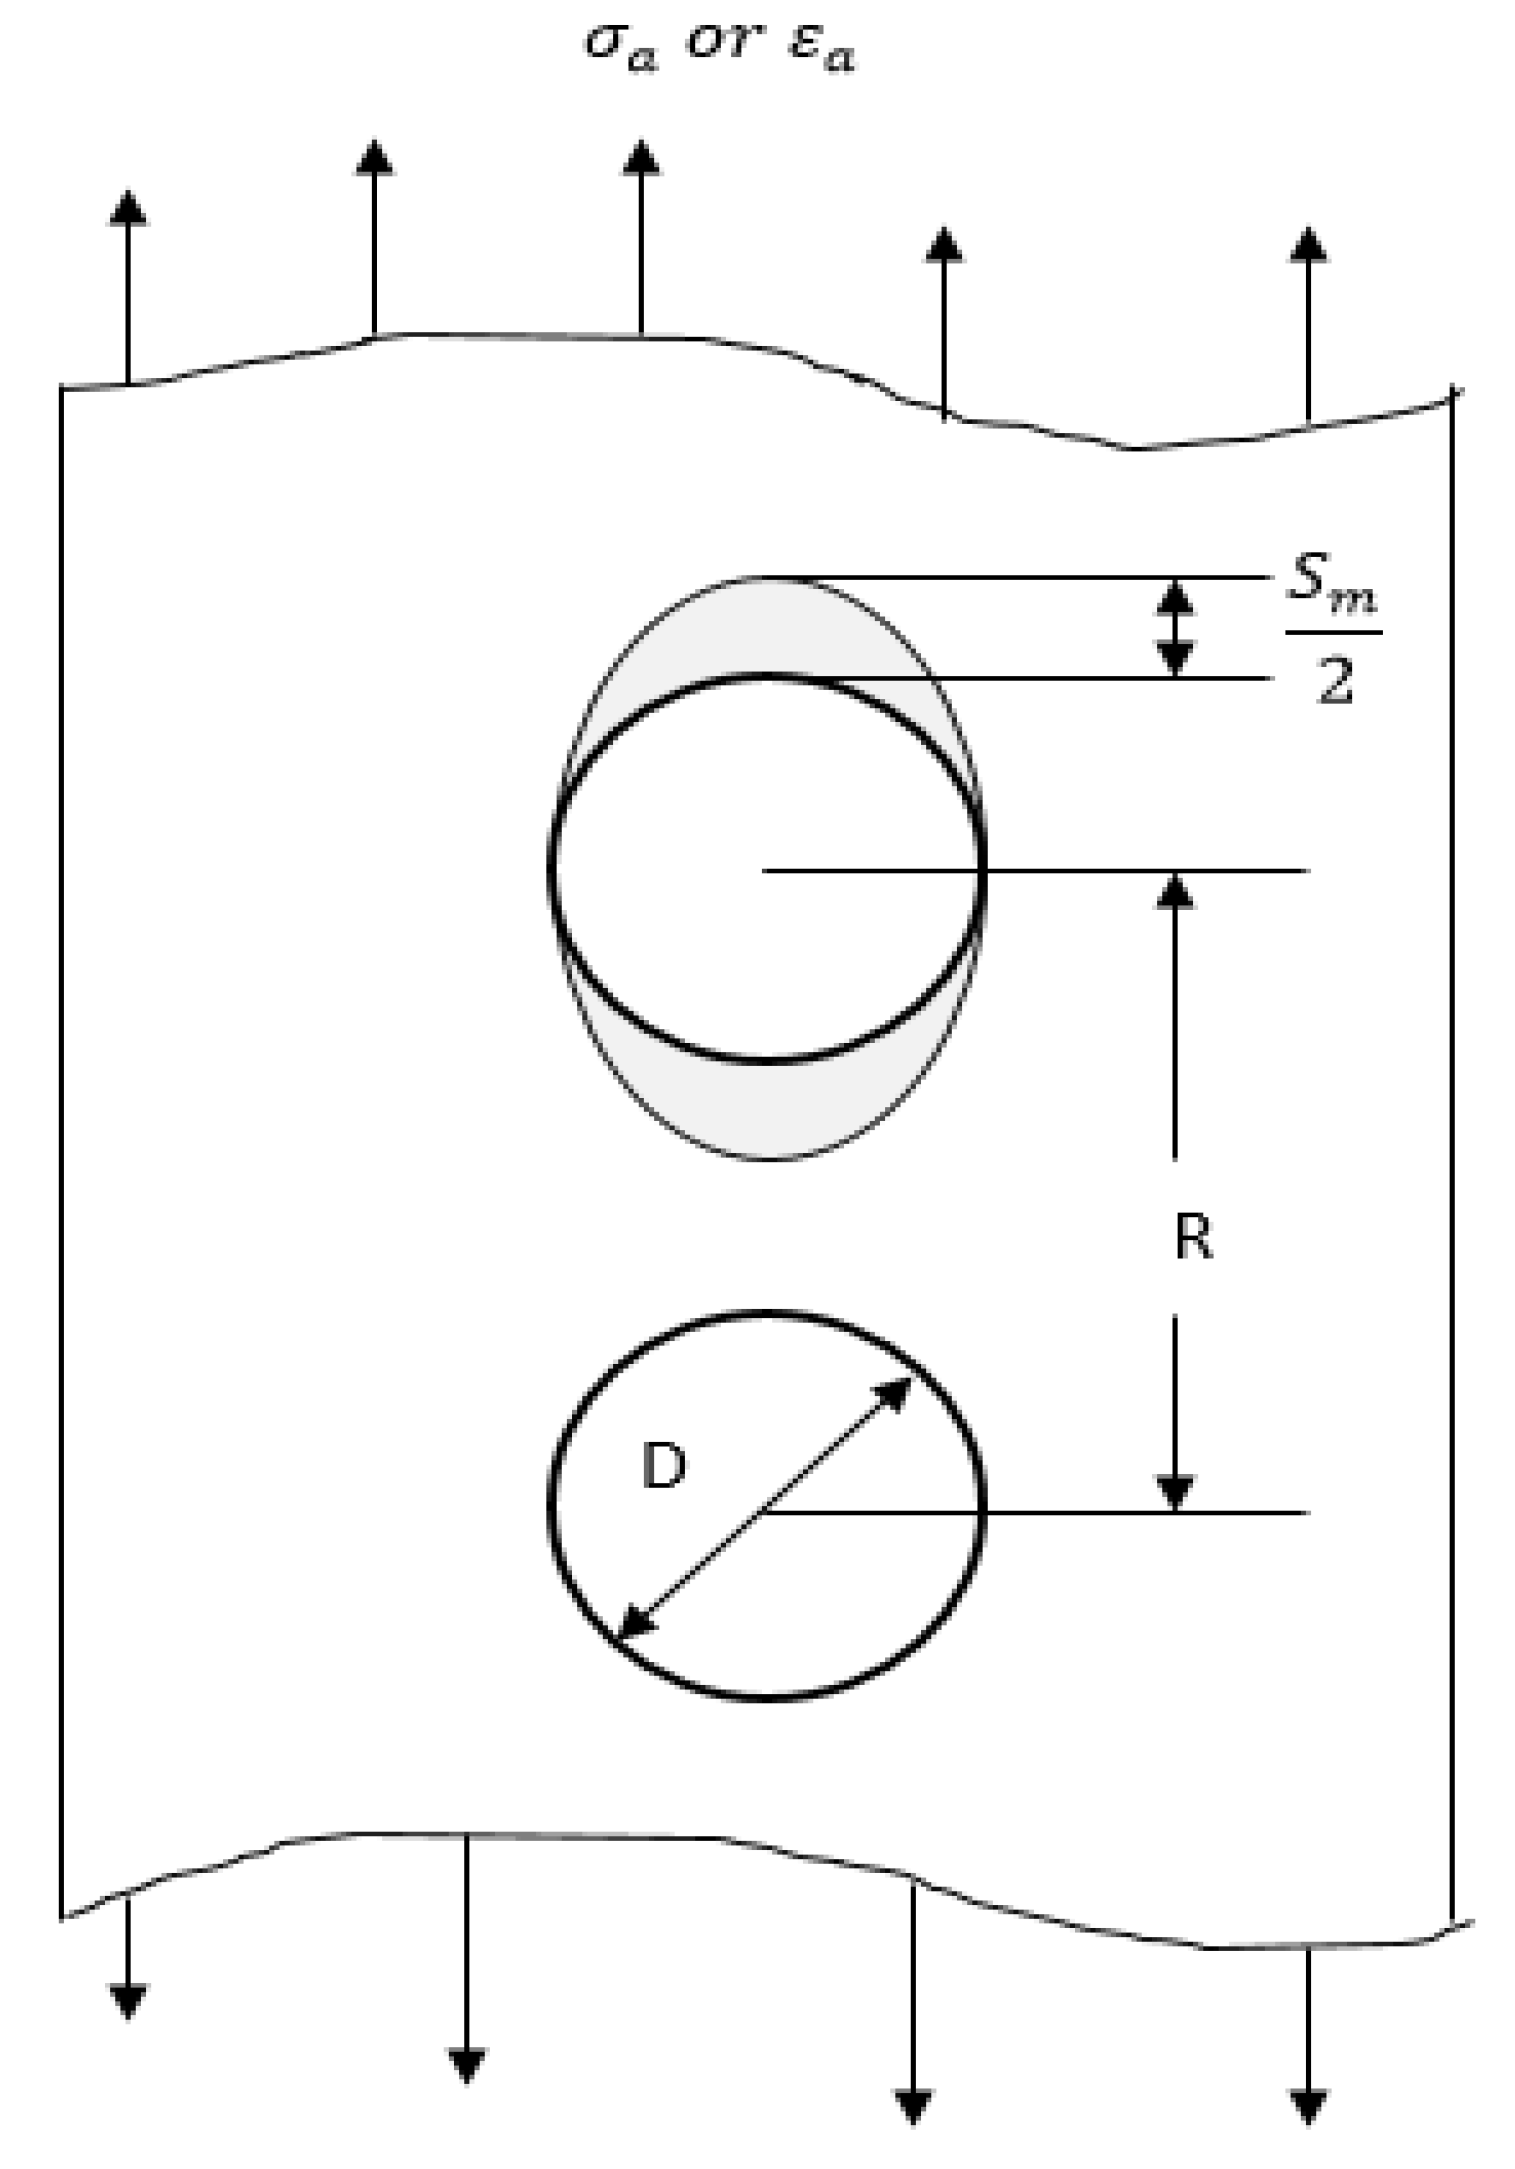
3.6. Mathematical Models for Particle–Matrix Interactions

A number of micromechanical models have been developed to further support the relationship between the particle’s size and the dispersion effect on composites. Studies have been conducted on stress distribution using finite element analysis [27,28] and analytical models [25]. According to past research, a simple micromechanical model can be used to describe smaller particles with good filler dispersions to simulate the required load for filler–matrix debonding to initiate [25].
Figure 13 shows a model that shows that the debonding process started at one of the particles. The crack extends around the particle at an applied load. Assuming the filler particles diameters are the same and much more rigid than matrix, the displacement of particles (Sp) is much smaller than the displacement of matrix (Sm).
The deformation models after [25] are as follows:
ε a = S p + S m R ε a = S m R
S m = ε m ( R D )
Combining Equations (5) and (6):
ε m = R R D ε a
Using the definition of Young’s modulus, Equation (7) can be expressed as:
ε m = σ m E m     R R D ε a = R R D σ a E a
By letting r = R/D and r r 1 be the strain concentration factor, k :
k ε a = k E a σ a
From Equation (9), the strain concentration factor, k   increases when the distance between particles decreases. The smallest distance is when R is nearly equal to D, which indicates particles sticking together (agglomeration), and will lead to a huge concentration factor. Additionally, as the particle diameter becomes smaller, it allows a smaller distance R to reach the critical debonding stress or strain. Hence, it further supports that smaller bagasse (212 µm) particle-loaded composites have a better tensile strength, fracture toughness and consistent fracture distribution than 300 µm bagasse particle-reinforced composites.

4. Conclusions

Different sized baggage particle-reinforced epoxy composites were fabricated, and tensile tests were carried out in different strain rate conditions. The fractured surfaces were examined by a stereomicroscope along with mathematical models on particle–matrix interfaces. Based on the experimental results and associated discussions, the following conclusions can be drawn from the present study:
The 2 wt.% bagasse filler reinforcements in epoxy resin exhibit an optimized filler content, and composites are strain rate sensitive, even in a low range.
The 300 µm bagasse particle-reinforced composites are more sensitive under different strain rates in terms of their unstable failure strength dispersion compared to the 212 µm ones; 212 µm bagasse particle-reinforced composites are more sensitive under different strain rates in terms of their characteristic strengths compared to the 300 µm ones.
Filler sizes of 300 µm lead to brittle fractures while filler sizes of 212 µm allow more energy absorption (toughness) during higher strain rate loading due to better filler dispersion and a higher resistance for filler–matrix debonding to initiate, which was verified by the micromechanical modelling of particle–matrix interfaces.
Hence, smaller bagasse particle-reinforced polymer composites exhibit better tensile performances in terms of consistency and have a higher failure strength under various strain rate conditions. It also shows the potential to achieve lightweight and high-performance composites. As bagasse are a fast growing and abundant agriculture residue in tropical countries, importing non-domestic synthetic fibres at high prices could be avoided. Thus, further utilizing it could help to reduce the negative impact of agricultural waste on the environment and save costs at the same time.

Author Contributions

Conceptualization, Investigation, and Methodology, S.D. and T.K.K.; Formal Analysis, S.D., T.K.K. and M.A.; Writing-Original Draft Preparation, S.D., T.K.K.; Writing-Review & Editing, A.P., A.K.B.; Supervision, S.D. All authors have read and agreed to the published version of the manuscript

Funding

This research received no external funding.

Conflicts of Interest

The authors declare no conflict of interest.

References

  1. Sanjay, M.; Madhu, P.; Jawaid, M.; Senthamaraikannan, P.; Senthil, S.; Pradeep, S. Characterization and properties of natural fiber polymer composites: A comprehensive review. J. Clean. Prod. 2018, 172, 566–581. [Google Scholar] [CrossRef]
  2. Hemmasi, A.H.; Ghasemi, I.; Bazyar, B.; Samariha, A. Studying the Effect of Size of Bagasse and Nanoclay Particles on Mechanical Properties and Morphology of Bagasse Flour/Recycled Polyethylene Composites. BioResources 2013, 8, 3791–3801. [Google Scholar] [CrossRef] [Green Version]
  3. Wang, W.; Zhang, X.; Chouw, N.; Li, Z.; Shi, Y. Strain rate effect on the dynamic tensile behaviour of flax fibre reinforced polymer. Compos. Struct. 2018, 200, 135–143. [Google Scholar] [CrossRef]
  4. Zhang, S.; Caprani, C.; Heidarpour, A. Strain rate studies of pultruded glass fibre reinforced polymer material properties: A literature review. Constr. Build. Mater. 2018, 171, 984–1004. [Google Scholar] [CrossRef]
  5. Shokrieh, M.M.; Omidi, M.J. Investigation of strain rate effects on in-plane shear properties of glass/epoxy composites. Compos. Struct. 2009, 91, 95–102. [Google Scholar] [CrossRef]
  6. Lai, C.; Murthy, D.N.P.; Xie, M. Weibull Distributions and Their Applications. In Springer Handbook of Engineering Statistics; Springer: Berlin/Heidelberg, Germany, 2006; pp. 63–78, Chapter 3. [Google Scholar] [CrossRef]
  7. Verma, D.; Gope, P.C.; Maheshwari, M.K.; Sharma, R.K. Bagasse Fiber Composites—A Review. J. Mater. Environ. Sci. 2012, 3, 1079–1092. [Google Scholar]
  8. Anggono, J.; Farkas, Á.E.; Bartos, A.; Móczó, J.; Purwaningsih, H.; Pukánszky, B. Deformation and failure of sugarcane bagasse reinforced PP. Eur. Polym. J. 2019, 112, 153–160. [Google Scholar] [CrossRef] [Green Version]
  9. Islam, W.; Tahsim, R.; Islam, S.M.; Bakhtierkhalzi, M.; Suzauddin, M. Fabrication and mechanical characterization of bagasse, rice husk, saw dust reinforced epoxy composites. AIP Conf. Proc. 2019, 2121, 140006. [Google Scholar] [CrossRef]
  10. Anidha, S.; Latha, N.; Muthukkumar, M. Reinforcement of Aramid fiber with bagasse epoxy bio-degradable composite: Investigations on mechanical properties and surface morphology. J. Mater. Res. Technol. 2019, 8, 3198–3212. [Google Scholar] [CrossRef]
  11. Matykiewicz, D. Hybrid Epoxy Composites with Both Powder and Fiber Filler: A Review of Mechanical and Thermomechanical Properties. Materials 2020, 13, 1802. [Google Scholar] [CrossRef] [Green Version]
  12. Nabinejad, O.; Sujan, D.; Rahman, M.E.; Davies, I. Effect of filler load on the curing behavior and mechanical and thermal performance of wood flour filled thermoset composites. J. Clean. Prod. 2017, 164, 1145–1156. [Google Scholar] [CrossRef]
  13. Cao, Y.; Shibata, S.; Fukumoto, I. Mechanical properties of biodegradable composites reinforced with bagasse fibre before and after alkali treatments. Compos. Part A Appl. Sci. Manuf. 2006, 37, 423–429. [Google Scholar] [CrossRef]
  14. Zafar, M.F.; Siddiqui, M. Raw natural fiber reinforced polystyrene composites: Effect of fiber size and loading. Mater. Today Proc. 2018, 5, 5908–5917. [Google Scholar] [CrossRef]
  15. Naguib, H.M.; Kandil, U.K.; Hashem, A.I.; Boghdadi, Y.M. Effect of fiber loading on the mechanical and physical properties of “green" bagasse-polyester composite. J. Radiat. Res. Appl. Sc. 2015, 8, 544–548. [Google Scholar] [CrossRef] [Green Version]
  16. Gurusideswar, S.; Velmurugan, R. Strain rate sensitivity of glass/epoxy composites with nanofillers. Mater. Des. 2014, 60, 468–478. [Google Scholar] [CrossRef]
  17. Qi, B.; Zhang, Q.X.; Bannister, M.; Mai, Y.-W. Investigation of the mechanical properties of DGEBA-based epoxy resin with nanoclay additives. Comp. Struct. 2006, 75, 514–519. [Google Scholar] [CrossRef]
  18. Saghafi, A.; Mirhabibi, A.; Yari, G. Improved linear regression method for estimating Weibull parameters. Theor. Appl. Fract. Mech. 2009, 52, 180–182. [Google Scholar] [CrossRef]
  19. Mehrvar, C.; Curran, D.J.; Alhalawani, A.; Boyd, D.; Towler, M. Comparative study of Weibull characteristic strength and mean strength of GPCs to confirm the minimum number of samples needed for confident strength reporting. J. Mech. Behav. Biomed. Mater. 2015, 43, 53–58. [Google Scholar] [CrossRef]
  20. Guo, Y.; Li, Y. Quasi-static/dynamic response of SiO2–epoxy nanocomposites. Mater. Sci. Eng. A 2007, 458, 330–335. [Google Scholar] [CrossRef]
  21. Ratanawilai, T.; Nakawirot, K.; Deachsrijan, A.; Homkhiew, C. Influence of wood species and particle size on mechanical and thermal properties of wood polypropylene composites. Fibers Polym. 2014, 15, 2160–2168. [Google Scholar] [CrossRef]
  22. Jasmi, N.F.; Kasim, J.; Ansar, M.S.; Maidin, I.I. The Role of Oil Palm (Elaeis guineensis) Frond as Filler in Polypropylene Matrix with Relation of Filler Loading and Particle Size Effects. In Regional Conference on Science, Technology and Social Sciences; Springer Nature: London, UK, 2016; pp. 393–403. [Google Scholar] [CrossRef]
  23. Oberoi, S.; Sonawane, D.; Kumar, P. Effect of strain rate and filler size on mechanical behavior of a Cu filled elastomer based composite. Compos. Sci. Technol. 2016, 127, 185–192. [Google Scholar] [CrossRef]
  24. Kundie, F.; Azhari, C.H.; Muchtar, A.; Ahmad, Z.A. Effects of Filler Size on the Mechanical Properties of Polymer-filled Dental Composites: A Review of Recent Developments. J. Phys. Sci. 2018, 29, 141–165. [Google Scholar] [CrossRef] [Green Version]
  25. Lauke, B. On the effect of particle size on fracture toughness of polymer composites. Compos. Sci. Technol. 2008, 68, 3365–3372. [Google Scholar] [CrossRef] [Green Version]
  26. Shtein, M.; Nadiv, R.; Lachman, N.; Wagner, H.D.; Regev, O. Fracture behavior of nanotube–polymer composites: Insights on surface roughness and failure mechanism. Compos. Sci. Technol. 2013, 87, 157–163. [Google Scholar] [CrossRef]
  27. Han, W.; Eckschlager, A.; Böhm, H.J. The effects of three-dimensional multi-particle arrangements on the mechanical behavior and damage initiation of particle-reinforced MMCs. Compos. Sci. Technol. 2001, 61, 1581–1590. [Google Scholar] [CrossRef]
  28. Böhm, H.J.; Eckschlager, A.; Han, W. Multi-inclusion unit cell models for metal matrix composites with randomly oriented discontinuous reinforcements. Comput. Mater. Sci. 2002, 25, 42–53. [Google Scholar] [CrossRef]
Figure 1. Sieved bagasse particles: (a) ≤300 μm and (b) ≤212 μm.
Jcs 04 00110 g001
Figure 2. Tensile specimens of the baggage particle-reinforced composite: ≤212 µm and ≤300 µm filler.
Jcs 04 00110 g002
Figure 3. Effect of baggage filler loading on the mechanical properties of composites: (a) tensile strength and (b) Young’s modulus.
Jcs 04 00110 g003
Figure 4. Filler dispersion on fractured test coupons under a stereomicroscope with different filler loadings: (a) 2% wt. and (b) 5% wt.
Jcs 04 00110 g004
Figure 5. Weibull probability plot of 300 µm bagasse particle-reinforced composites at different strain rates.
Jcs 04 00110 g005
Figure 6. Relation between the average tensile strength against strain rates for 300 μm baggage particle-reinforced polymer composites.
Jcs 04 00110 g006
Figure 7. Stress–strain curves for 10 samples at different strain rates: (a) 0.00028 s−1, (b) 0.00085 s−1, and (c) 0.0017 s−1 for 300 µm filler-reinforced composites.
Jcs 04 00110 g007
Figure 8. Fracture surfaces of 300 µm filler-reinforced composites under different strain rates: (a) 0.00028 s−1, (b) 0.00085 s−1, and (c) 0.0017 s−1.
Jcs 04 00110 g008
Figure 9. Weibull probability plot of 212 µm bagasse-reinforced composites at different strain rates.
Jcs 04 00110 g009
Figure 10. Relation between the average tensile strength against the strain rates for 212 μm baggage filler-reinforced composites.
Jcs 04 00110 g010
Figure 11. Stress–strain curves for 10 samples at different strain rates for 212 µm filler-reinforced composites: (a) 0.00028 s−1, (b) 0.00085 s−1, and (c) 0.0017 s−1.
Jcs 04 00110 g011
Figure 12. Fracture surfaces of 212 µm filler-reinforced composites under different strain rates: (a) 0.00028 s−1, (b) 0.00085 s−1, and (c) 0.0017 s−1.
Jcs 04 00110 g012
Figure 13. Two neighbouring particles debonding model, σ a ,   ε a , for the applied stress and strain, R, for the centre-to-centre distance; Sp, Sm for the particle and matrix displacement, respectively.
Jcs 04 00110 g013
Table 1. Sample mechanical data for 300 µm baggage particle-reinforced composites under a quasi-static strain rate.
RankFracture (MPa)Pi (Rank-0.5/n) ln   [ ln ( 1 1 P i ) ] ln   σ
136.7545590.05−2.97023.604262
237.65637030.15−1.816963.628502
337.81500260.25−1.24593.632706
439.96197680.35−0.842153.687928
540.66885050.45−0.514443.705462
641.07404450.55−0.225013.715376
741.10874840.650.0486213.716221
841.68417270.750.3266343.730122
942.35575670.850.6403373.746104
1043.22158010.951.0971893.76634

