Article

Synthesis, Characterization and Photocatalytic Activity of N-doped Cu2O/ZnO Nanocomposite on Degradation of Methyl Red

by
Yohannes Teklemariam Gaim
*,
Gebrekidan Mebrahtu Tesfamariam
,
Gebretinsae Yeabyo Nigussie
and
Mengstu Etay Ashebir
Department of Chemistry, College of Natural and Computational Sciences, Mekelle University, Mekelle P.O.Box: 231, Ethiopia
*
Author to whom correspondence should be addressed.
J. Compos. Sci. 2019, 3(4), 93; https://doi.org/10.3390/jcs3040093
Submission received: 19 September 2019 / Revised: 11 October 2019 / Accepted: 14 October 2019 / Published: 16 October 2019
(This article belongs to the Special Issue Multifunctional Composites)

Abstract

:
In this study, a N-doped Cu2O/ZnO nanocomposite was prepared by a co-precipitation and thermal decomposition technique from CuCl2, 2H2O, ZnSO4, 7H2O and CO(NH2)2 as precursors. The as-synthesized nanocomposites were characterized using X-ray diffraction (XRD), scanning electron microscopy (SEM), Fourier transform infrared analysis (FT–IR) and an ultraviolet–visible (UV–Vis) reflectance spectrometer. From the XRD diffractogram of N-doped Cu2O/ZnO nanocomposite, cubic and hexagonal wurtzite crystal structures of Cu2O, and ZnO, respectively were identified. The UV-vis reflectance spectra illustrated that the absorption edge of N-doped Cu2O/ZnO nanocomposite is more extended to the longer wavelength than ZnO, Cu2O and Cu2O/ZnO nanomaterials. FT–IR bands confirmed the presence of ZnO, Cu2O, and nitrogen in the N-doped Cu2O/ZnO nanocomposite. Photocatalytic activity of the as-synthesized nanocomposite was tested for methyl red degradation using sunlight as an energy source by optimizing the concentration of the dye and amount of the catalyst loaded. The degradation efficiency was greater in N-doped Cu2O/ZnO nanocomposite as compared to ZnO, Cu2O and Cu2O/ZnO nanomaterials. This is due to the coupling of the semiconductors which increases the absorption and exploitation capability of solar light and increases the charge separation as well. Besides that, nitrogen doping can extend absorption of light to the visible region by decreasing the energy gap. Therefore, N-doped Cu2O/ZnO nanocomposite is a solar light-active photocatalyst which can be used in the degradation of organic pollutants.

1. Introduction

Population growth and rapid urbanization/industrialization are among the greatest causes of environmental pollution and consumption of a large amount of energy [1]. Synthetic organic dyes that are used in various industries such as pharmaceuticals, textiles, cosmetics, paper, and plastic factories have led to severe environmental pollution as a result of their discharging contaminated and colored wastewater into the water stream [2]. They adversely affect the quality of water, prevent light penetration and diminish photosynthetic reactions. Moreover, some dyes are both poisonous and cancer-causing [3]. To address the above issues, several treatment methods have been commonly used. The treatment techniques including adsorption, chemical precipitation and coagulation show reduced efficiency and generate other pollutants like toxic gases and slurry that require additional purification [4,5]. Therefore, advanced technology-based treatments have been suggested for the removal of these pollutants.
Advanced oxidation processes (AOPs) have attracted much attention as a substitute for traditional treatment routes for the removal of toxic organic pollutants into harmless products. AOPs have benefits such as degradation of organic pollutants to green products and capability of operating at normal temperature and pressure [6]. Among AOPs, heterogeneous photocatalysis is an emerging technique, which is valuable for environmental and energy applications. It is a photochemical reaction which takes place on the surface of the solid catalyst and encompasses oxidation from photogenerated holes and reduction from photogenerated electrons at the same time [7]. TiO2, ZnO, CdS, ZnS and Fe2O3 are some of the outstanding semiconductors used as photocatalysts [8]. Among these, TiO2 and ZnO are the top applicable as photocatalysts [9,10]. The energy levels of these semiconductors are nearly comparable. However, ZnO is easily obtainable; it absorbs a large portion of solar light and has great photocatalytic performance than TiO2 [11,12].
Zinc oxide-based materials are used in the area of multifunctional electrode for both energy conversion and storage applications, like lithium-ion batteries and Dye-sensitized Solar Cells [13], gas sensors, monitoring air quality and optical devices due to its exceptional properties, for example, being inexpensive, photoconductive response, pyroelectricity and surface functionalization [14], high binding energy and electron mobility [15]. This metal oxide based semiconductor also has great application in the field of optoelectronic devices such as light-emitting diodes, flat panel displays, transparent semiconductors and conductive oxides, due to its good optical properties [16]. Different research investigated sensing and photovoltaic applications of ZnO-based materials such as ammonia gas sensing using Ag/ZnO flower and Cu-doped ZnO nanostructures [15,17], tin-doped ZnO thin films as a NO2 gas sensor [18], ZnO@In2O3 coreshell nanofibers for ethanol vapor sensing [19], ZnO-based quaternary transparent conductive oxide materials for solar cells [16], and CdO-ZnO nanocones for efficient electrode materials [18]. The application of lithium ion batteries has been a major success in small electronic devices. However, the shortage of lithium resources challenges its application in large-scale electrical energy storage systems [20]. The Layered Sodium Transition-Metal Oxides are promising materials that can minimize the challenges of lithium batteries due to excellent cyclic stability and rate performance which significantly contribute to the development of large-scale electrical energy storage systems [21].
However, ZnO absorbs only in the ultraviolet section of electromagnetic radiation for the reason that its bandgap energy is large. As a result, its photocatalytic activity is low under solar radiation as the ultraviolet (UV) constituent of solar energy that touches the Earth is only 3–5% [22,23]. Nowadays, the existing photocatalysts such as ZnO are modified by doping or co-doping with metals and non-metals to enrich their photocatalytic activity [24,25]. Moreover, compositing of dissimilar nanostructured semiconductors develops their photocatalytic performance by sharing of their charge carriers to each other [26].
Cuprous oxide (Cu2O) is a narrow bandgap semiconductor which has been thought of as a possible visible light photocatalyst. Electrons of Cu2O can undergo a transition from the valence band to the conduction band using visible light as a source of energy. However, the photo-induced electrons and holes recombine within microseconds after their generation, which can influence its photocatalytic action negatively. Up to the present time, graphene and selected metals were coupled with Cu2O to delay the recombination of the photoinduced electrons and holes. Cu2O joined with large bandgap metal oxides such as ZnO is expected as an operational means to control the problem of recombining the charge carriers [27]. In this work, we synthesized a N-doped Cu2O/ZnO nanocomposite via co-precipitation and thermal decomposition methods and tested its photocatalytic activity in the degradation of methyl red (Scheme 1), which is considered as model dye pollutant.

2. Experimental

2.1. Chemicals

The chemicals used were: cupric chloride dihydrate, zinc sulfate heptahydrate, sodium hydroxide, ascorbic acid, urea, C2H6O, methyl red, and distilled water. The chemicals were analytical grade and used throughout without further purification. Distilled water was used in all the experiments.

2.2. Synthesis of Photocatalysts

The undoped Cu2O nanoparticles were prepared from CuCl2·2H2O as a precursor via precipitation and reduction techniques. 0.01 moles of CuCl2·2H2O was dissolved in 100 mL deionized water. The solution was adjusted in its pH level by adding 30 mL of 2 M NaOH drop by drop with continuous stirring until 12.2. During the addition of the NaOH aqueous solution, a deep blue precipitate was formed quickly. After being stirred for 30 min, 2.2 g of C6H8O6 was added into the above solution to reduce Cu2+ into Cu+ and stirred for an extra 30 min. The color of the precipitate then changed to brick red indicating the formation of Cu2O. The brick-red precipitate was filtered and washed four times using deionized water and dried at 100 °C in an oven [27]. To show high crystallinity and remove organic impurities, the powders were calcined at 500 °C in a furnace for 2 h.
ZnO nanoparticles were prepared using ZnSO4·7H2O as a precursor through a precipitation method [27]. To prepare ZnO nanoparticles, 0.01 moles of ZnSO4·7H2O dissolved in 100 mL deionized water. While stirring, 30 mL of 2 M NaOH was dropped carefully into the aqueous solution of zinc sulfate until the pH of the solution reached 12.4. Upon addition of NaOH aqueous solution, a white precipitate was formed and stirred for 30 min. The white product was separated by filtration and washed using deionized water repeatedly to remove impurities and dried at 100 °C in an oven. Finally, the powders were calcined at 500 °C in a furnace for 2 h.
The Cu2O/ZnO nanocomposite was synthesized from CuCl2·2H2O and ZnSO4·7H2O via the co-precipitation method followed by reduction using ascorbic acid; 0.01 moles of CuCl2·2H2O and 0.01 moles of ZnSO4·7H2O were dissolved in 100 mL deionized water and stirred using a magnetic stirrer; 30 mL of 2 M NaOH dropped slowly into the mixture of cupric chloride and zinc sulfate aqueous solutions with continuous stirring and the pH of the solution became 11.8. A light blue precipitate was formed and stirred for 30 min. Once the solution has been stirred for half an hour, the copper reduced from +2 to +1 oxidation states after 2.2 g of C6H8O6 added while stirring for an additional 30 min. The color of the precipitate changed from light blue into yellow as soon as the ascorbic acid was added as a reducing agent. Lastly, the yellow precipitate was filtered, washed, repeatedly, using deionized water and ethanol, and dried at 100 °C in the oven [27]. The nanocomposite was then calcined at 500 °C in a furnace for 2 h.
To prepare the N-Cu2O/ZnO nanocomposite, 2.681 g of CO (NH2)2 dissolved in ethanol and 25 g of uncalcined Cu2O/ZnO nanocomposites was added to the solution. The mixture was stirred up to mix well and then dried. Finally, the powder was calcined at 500 °C for 2 h and the nitrogen-doped Cu2O/ZnO nanocomposite was obtained [25].

2.3. Characterization Techniques

The following were used as characterization techniques: X-ray diffraction (XRD) analysis was conducted using X-ray diffractometer (Shimadzu XRD-7000, Shimadzu Corp., Kyoto, Japan) with a Cu-Kα radiation (λ = 0.15406 nm), step scan mode with step time and degree (2θ) of 0.4 s and 0.02°, respectively, for the range of 10° to 80°), to know crystal structures and average crystallite size of the samples. The surface morphology of the materials was examined using a scanning electron microscope (SEM), a JEOL JSM-5610 (JEOL, Ltd., Akishima, Tokyo) equipped with an Everhart-Thornley detector. The chemical compositions of the prepared samples were characterized using Spectrum 65 Fourier transform infrared (FT–IR) (PerkinElmer, Waltham, MA, USA) in the range 4000–400 cm−1 using KBr pellets. The optical property of the nanocomposites was recorded using a PerkinElmer Lamda 35 spectrometer which is operated at a wavelength range of 200–800 nm and the absorption spectra have been obtained from reflectance data using the Kubelka–Munk algorithm [28].

2.4. Photocatalytic Activities

The photocatalytic activities of the as-synthesized nanomaterials were tested on the degradation of methyl red dye (Scheme 1) as a model pollutant under sunlight as an energy source at ambient temperature. The degradation experiments were performed as follows: 500 L glass vessels containing 60 mg/L solution of methyl red and appropriate amount of nanomaterials (18 mg/L) were stirred under a dark for 1 h to attain absorption–desorption equilibrium before irradiating. All experiments were carried out under direct solar irradiation explicitly sunny days in between 10 AM and 2 PM when the solar intensity variations were insignificant [29]. Thereafter, the mixed solution was exposed to sunlight and 8 mL of the heterogeneous mixture was withdrawn within 20 min intervals of irradiating to sunlight, centrifuged at 3000 rpm for 6 min and filtered using filter paper to separate the catalyst before conducting the absorption measurement. The pure supernatant liquid was evaluated for methyl red dye concentration after measuring the absorbance at 410 nm using an ultraviolet–visible (UV–Vis) spectrophotometer and the percentage degradation of methyl red solution was calculated according to the following equation:
%   degradation   =   A 0 A t A 0 × 100 %
where A0 is initial absorbance of methyl red dye and At is absorbance of methyl red at each time interval “t”.

3. Results and Discussion

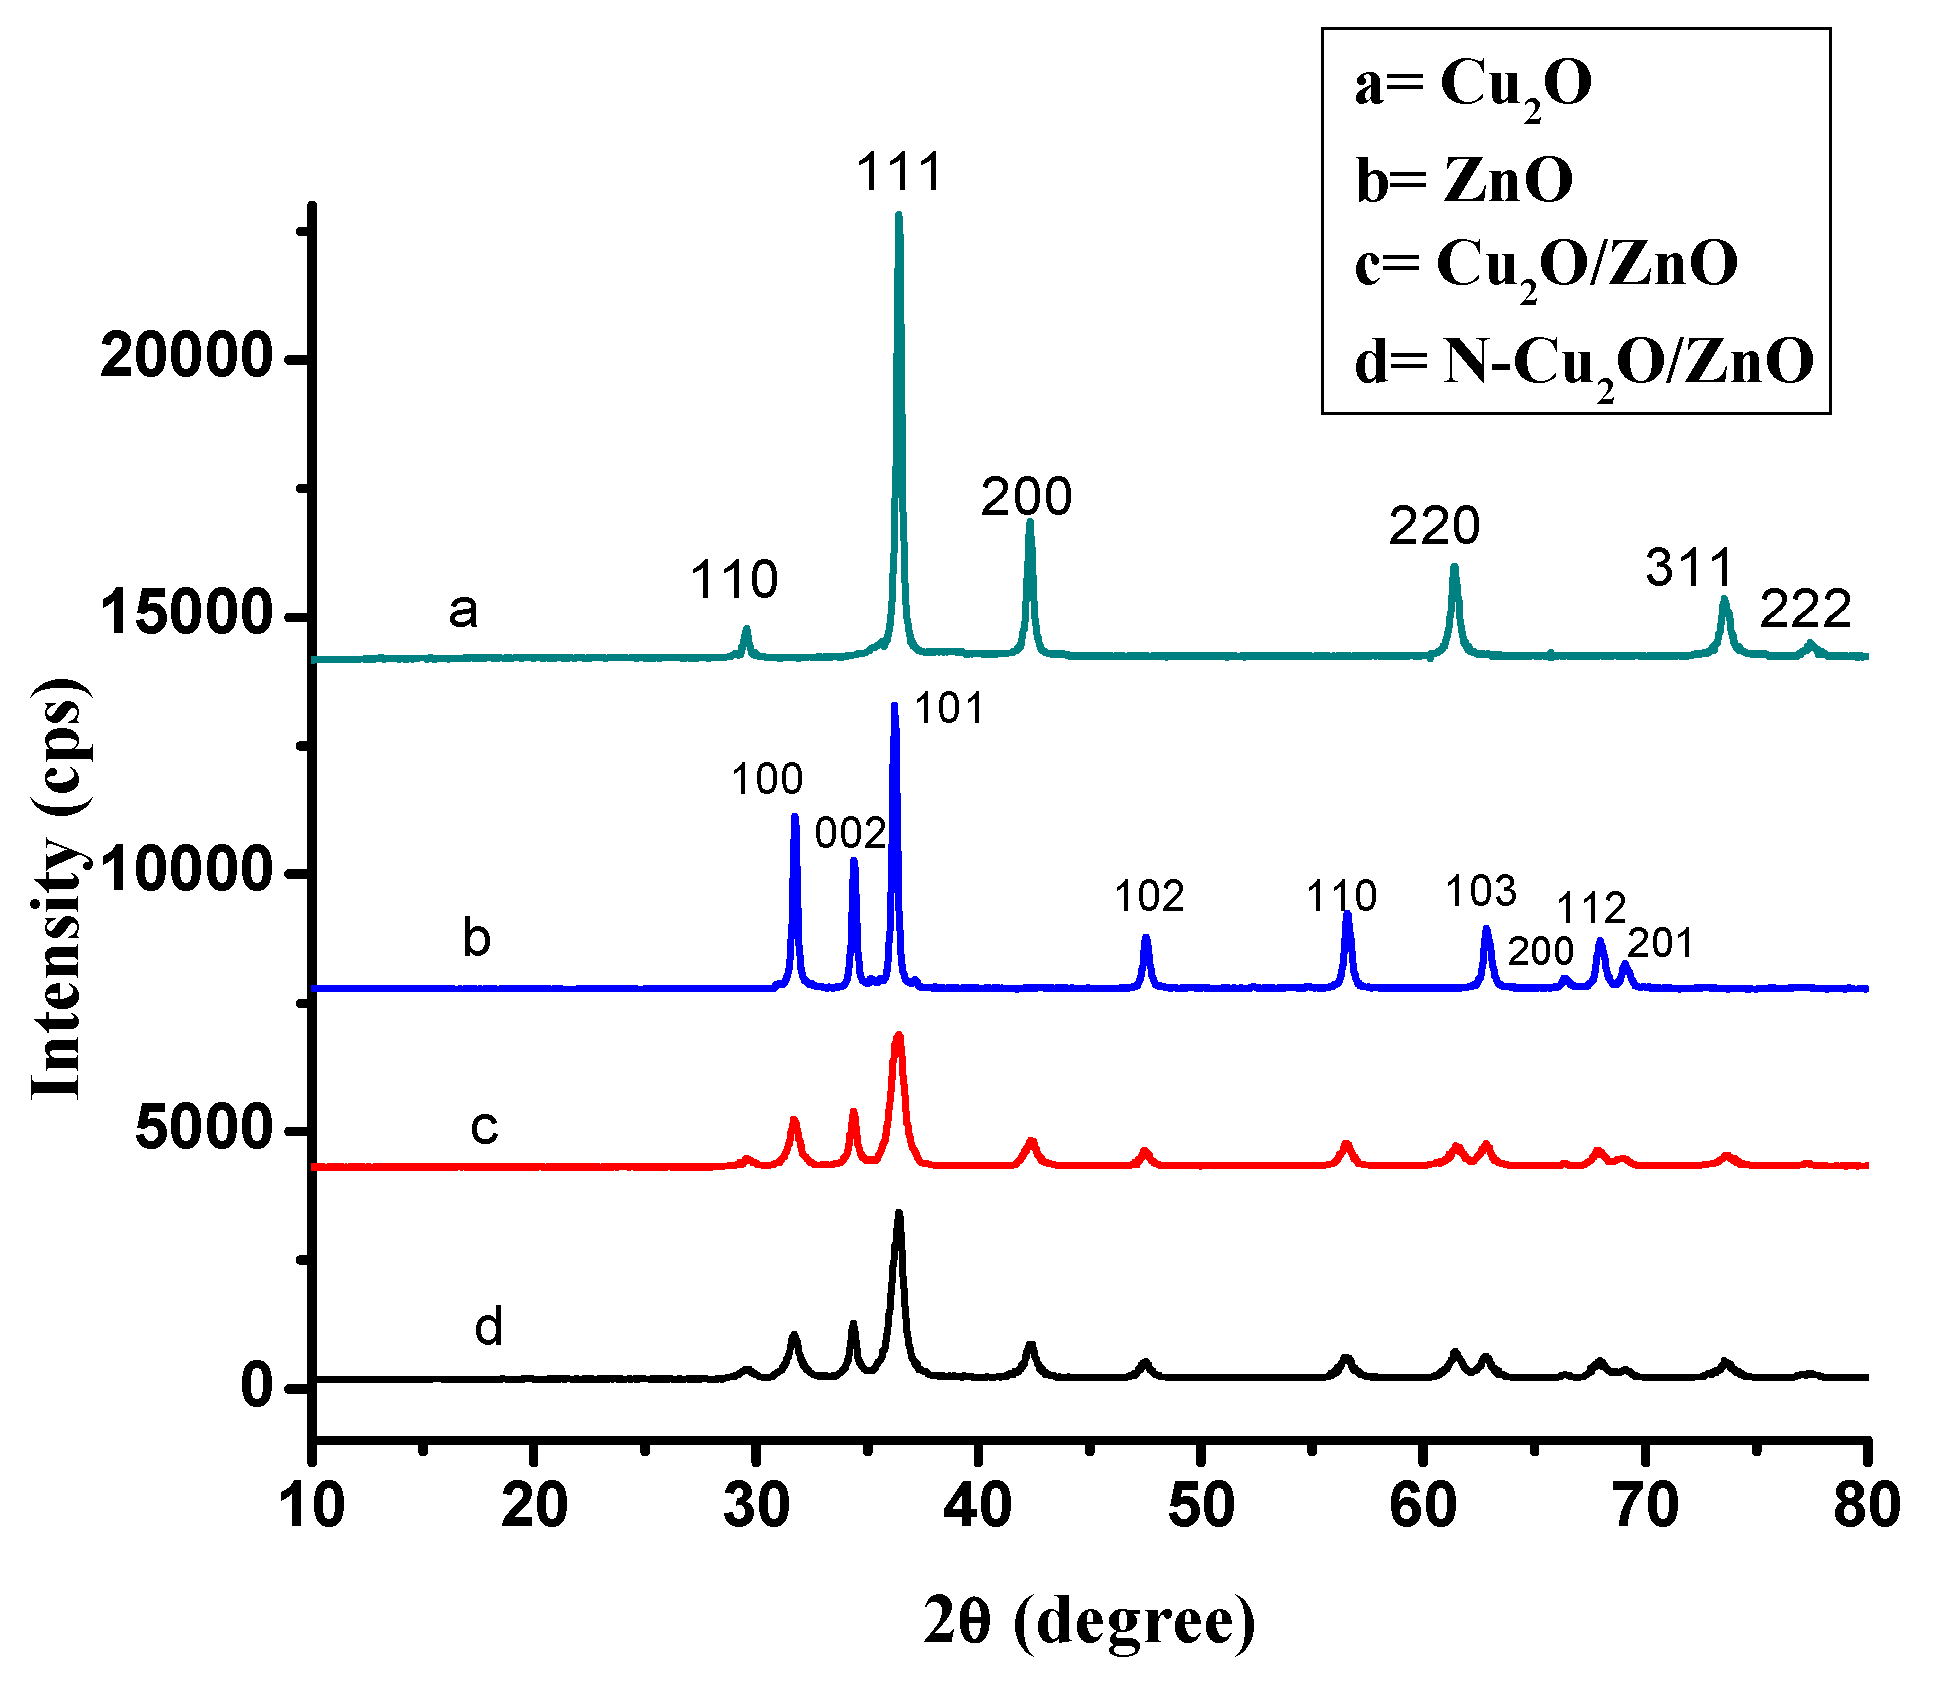
3.1. X-ray Diffraction (XRD) Patterns of the Nanomaterials

The diffraction patterns of Cu2O, ZnO, Cu2O/ZnO, and N-doped Cu2O/ZnO nanoparticles are shown in Figure 1. In the XRD patterns of ZnO, Cu2O/ZnO and N-Cu2O/ZnO nanomaterials, diffraction peaks appeared at 2θ = 31.76°, 34.40°, 36.24°, 47.53°, 56.59°, 62.85°, 66.37°, 67.90°, 69.07° which correspond to (100), (002), (101), (102), (110), (103), (200), (112), and (201) planes of the hexagonal wurtzite structure of zinc oxide. Similar results were reported in [30]. The diffraction peaks in the XRD patterns of Cu2O, Cu2O/ZnO and N-Cu2O/ZnO at 2θ value of 29.57°, 36.40°, 42.32°, 61.43°, 73.55° and 77.40° correspond to the reflection from (110), (111), (200), (220), (311) and (222) crystal planes of the cubic structure of cuprous oxide which is in agreement with [31]. There is no other diffraction peak displayed from impurities such as CuO, Cu(OH)2 and Zn(OH)2, indicating the purity of the nanostructured materials. As shown in Figure 1d, no additional peak was displayed due to nitrogen doping which might be nitrogen introduced into the ZnO [32] and Cu2O lattices without changing their crystal structures. The insignificant shift in the diffraction peaks of N-Cu2O/ZnO nanocomposite corresponds to the possibility of substituting oxygen by nitrogen. This can be mainly attributed to the highest resemblance among nitrogen and oxygen atoms in terms of electronegativity and atomic radius.
The average crystallite sizes of the nanomaterials were calculated from the intensive peak using the Scherer equation:
D   =   0.9 λ β   cos θ
where D is the crystallite size, λ is the wavelength, θ is the Bragg angle and β is the full width at half maximum in radian. The average crystallite sizes of ZnO, Cu2O, Cu2O/ZnO and N-Cu2O/ZnO were found at 33.72 nm, 32.33 nm, 14.15 nm, and 13.57 nm, respectively. Based on these results, the size of the crystallites is decreased in N-doped Cu2O/ZnO nanocomposite compared to the Cu2O and ZnO. The effect of decreasing the crystallite size may be ascribed to the insertion of nitrogen (incorporation of dopant) in Cu2O and ZnO lattices [32,33] and this was also confirmed in the photocatalytic degradation experiment. This insertion of nitrogen into the Cu2O and ZnO lattices can disturb the growth process of the particles, which might be the reason for the reduction of crystallite size in N-Cu2O/ZnO nanocomposite compared to Cu2O and ZnO nano-level particles.

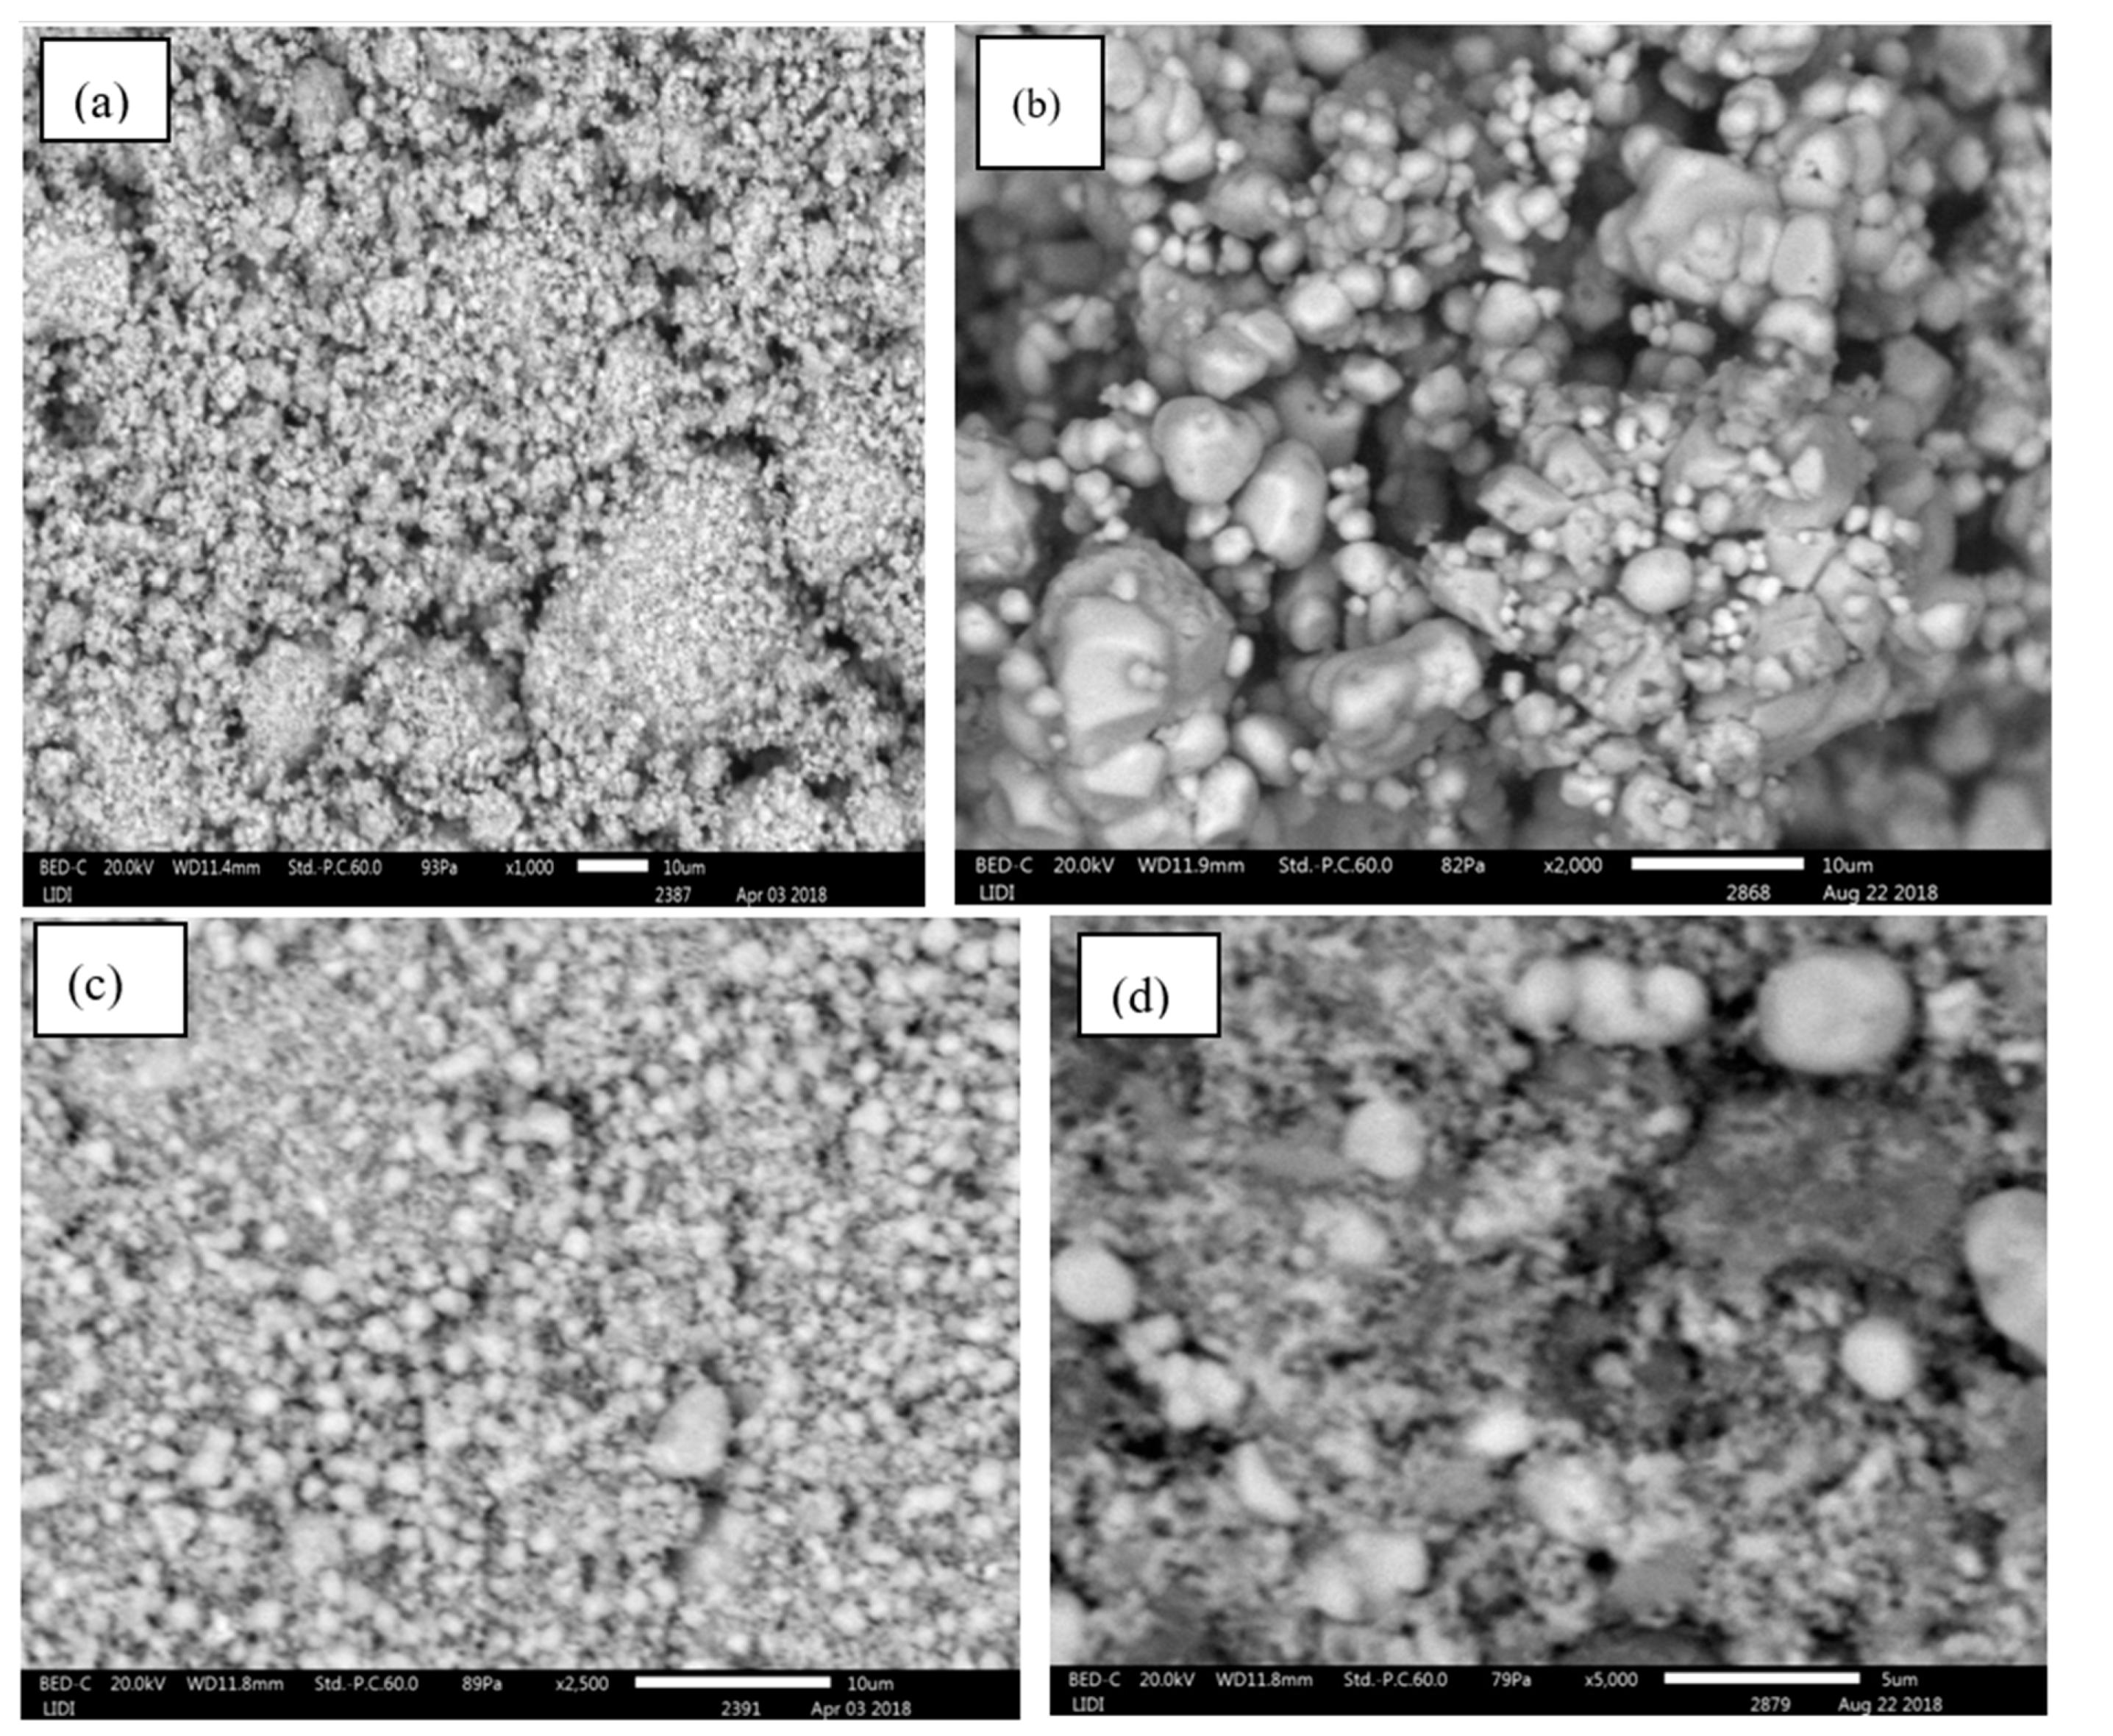
3.2. Scanning Electron Microscopy (SEM) Analysis

Surface morphology of ZnO, Cu2O, Cu2O/ZnO and N-Cu2O/ZnO nanomaterials was determined by SEM as shown in Figure 2a–d, respectively. From SEM micrographs, it was evident that the morphology of ZnO showed some agglomerated nanoparticles with irregular morphology, which is in line with [30]. However, SEM micrographs of Cu2O, Cu2O/ZnO and N-Cu2O/ZnO samples were relatively ordered and showed that the agglomerations of particles were much less (Figure 2b,d) than in ZnO NPs with the nanocrystals, which had a truncated octahedron shape; this might be due to the presence of Cu2O [34,35].

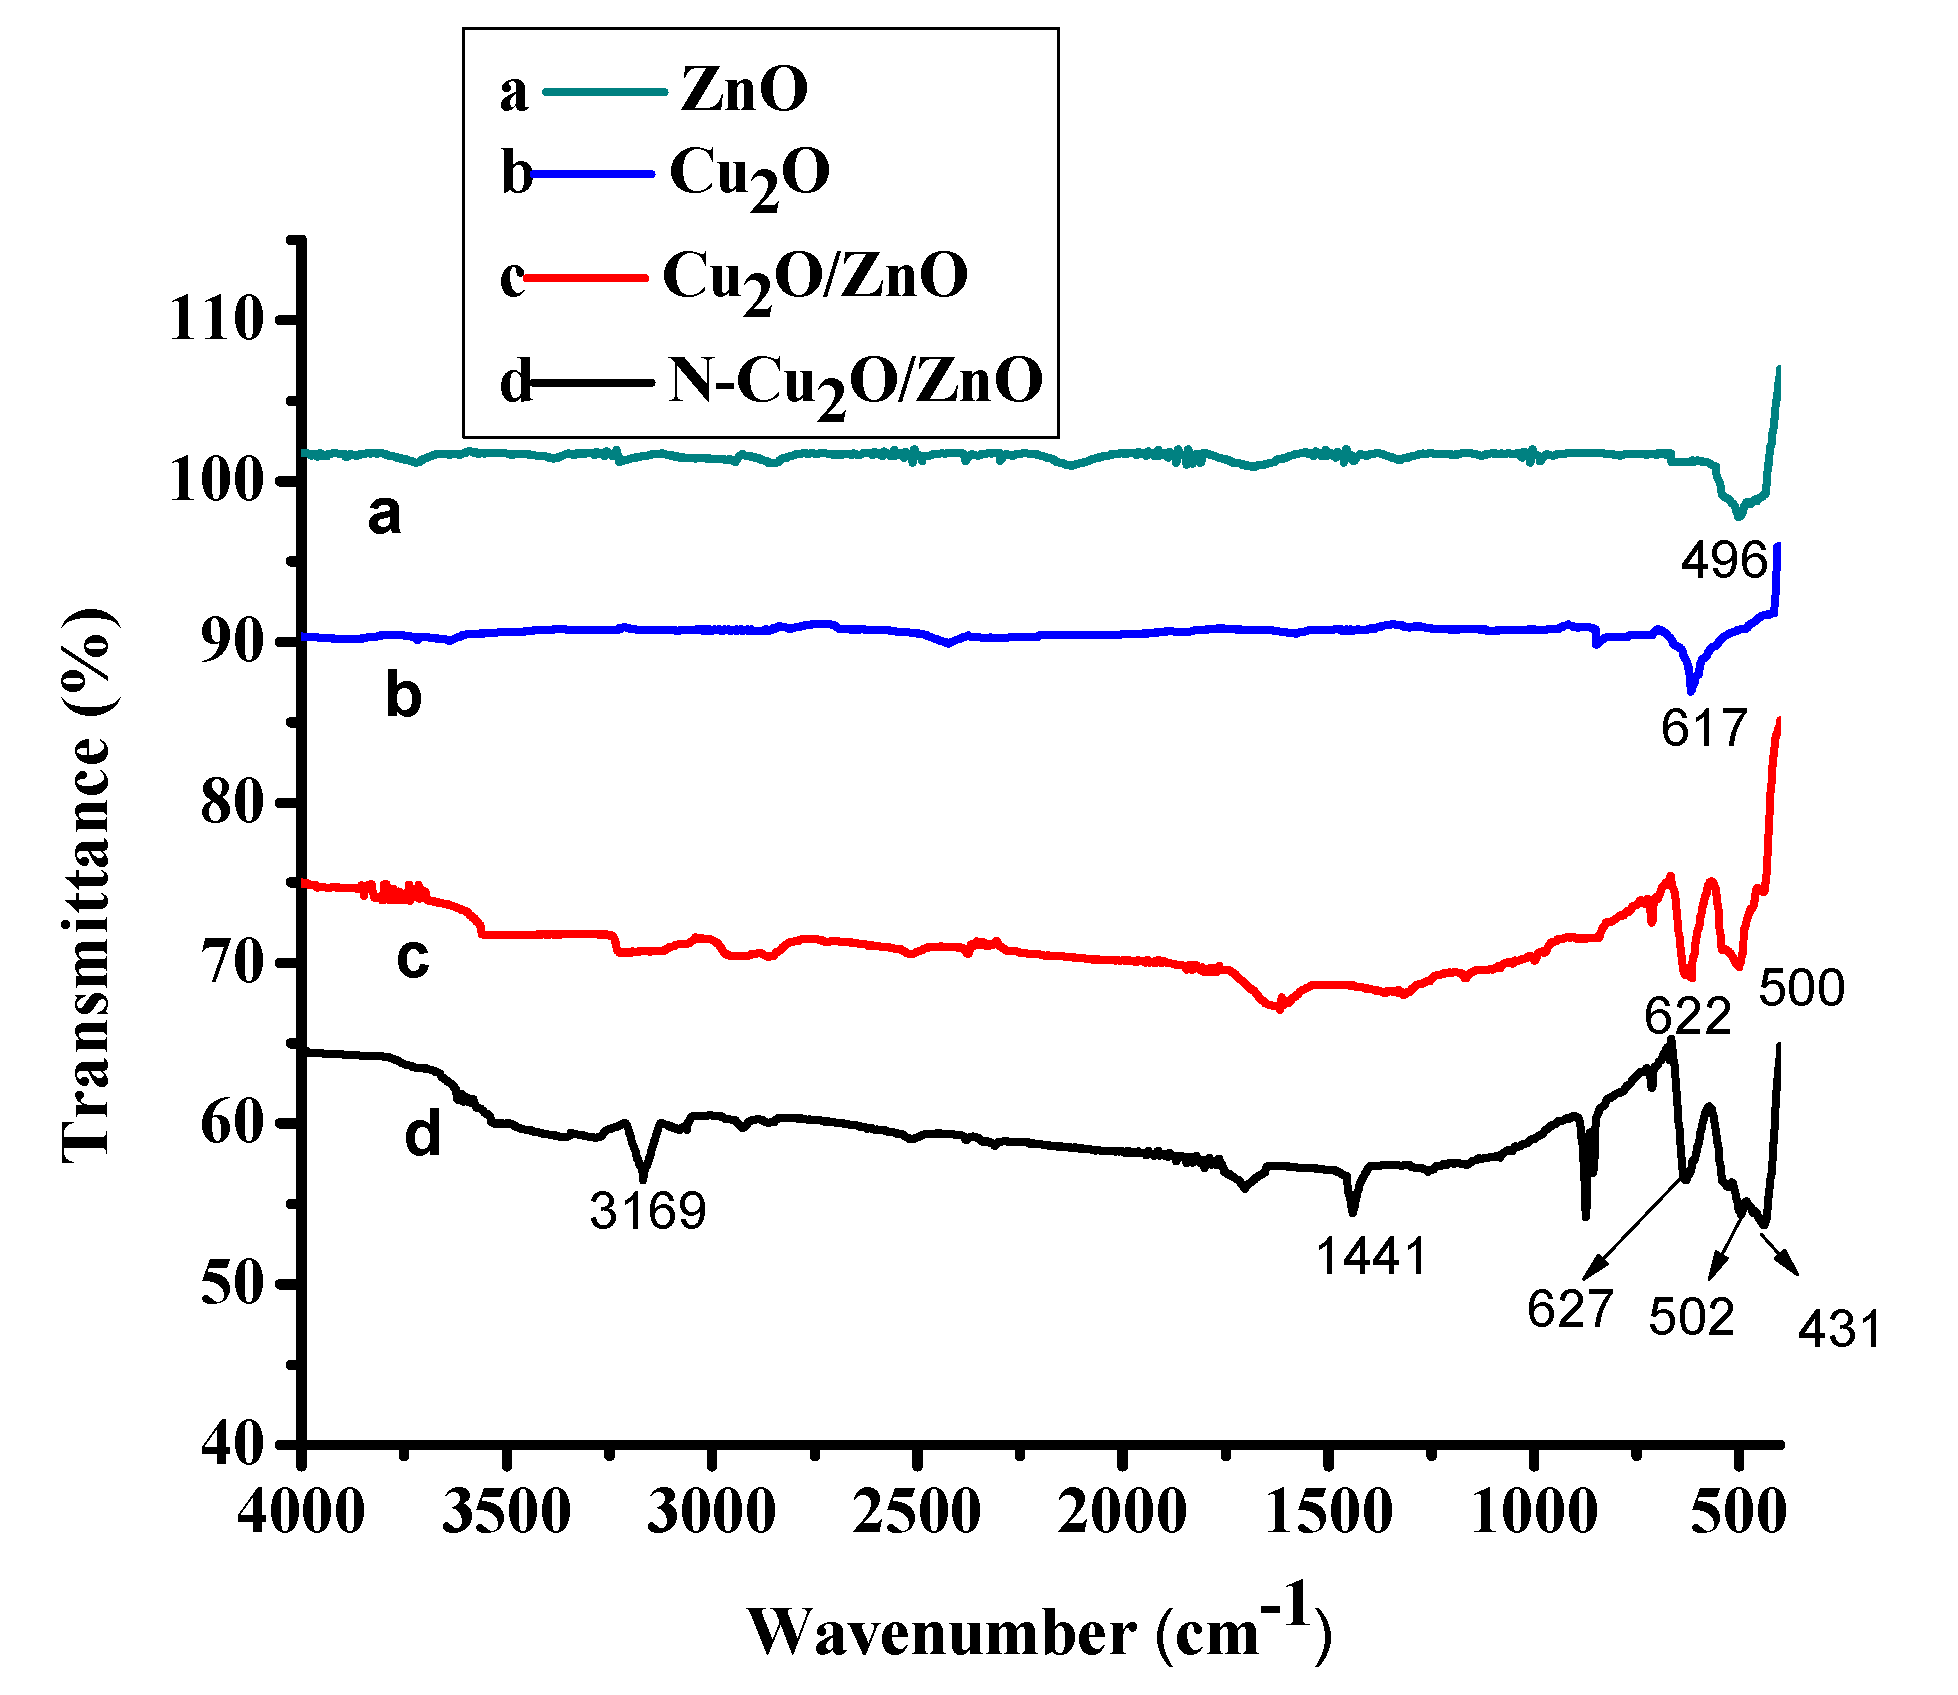
3.3. Fourier Transform Infrared (FT–IR) Analysis

The FT–IR bands of ZnO, Cu2O, Cu2O/ZnO and N-doped Cu2O/ZnO nanomaterials are given in Figure 3. The peaks appeared in the range of 490–505 cm−1 in all the samples except in Cu2O and correspond to the stretching vibration of ZnO, which agreed with the findings of previous studies [36,37]. In the FT–IR spectra of Cu2O, Cu2O/ZnO and N-doped Cu2O/ZnO nanoparticles, there were peaks in the range of 610–630 cm−1, which corresponds to the stretching vibration of Cu2O; a similar result was reported by [34]. The peak that appeared at 3169 cm−1 in the FT–IR spectrum of the N-doped Cu2O/ZnO nanocomposite might be due to N-H stretching vibration mode. The band located at 1441 cm−1 might be due to N-H bending vibration mode [38]. Besides the above absorption bands, there was an additional peak located at 431 cm−1 in the FT–IR spectrum of the N-doped Cu2O/ZnO nanocomposite, which might be attributed to the metal–nitrogen (M–N) stretching vibration similar results have been reported [32]. Therefore, the bands indicated the presence of ZnO, Cu2O and nitrogen in the N-doped Cu2O/ZnO nanocomposite.

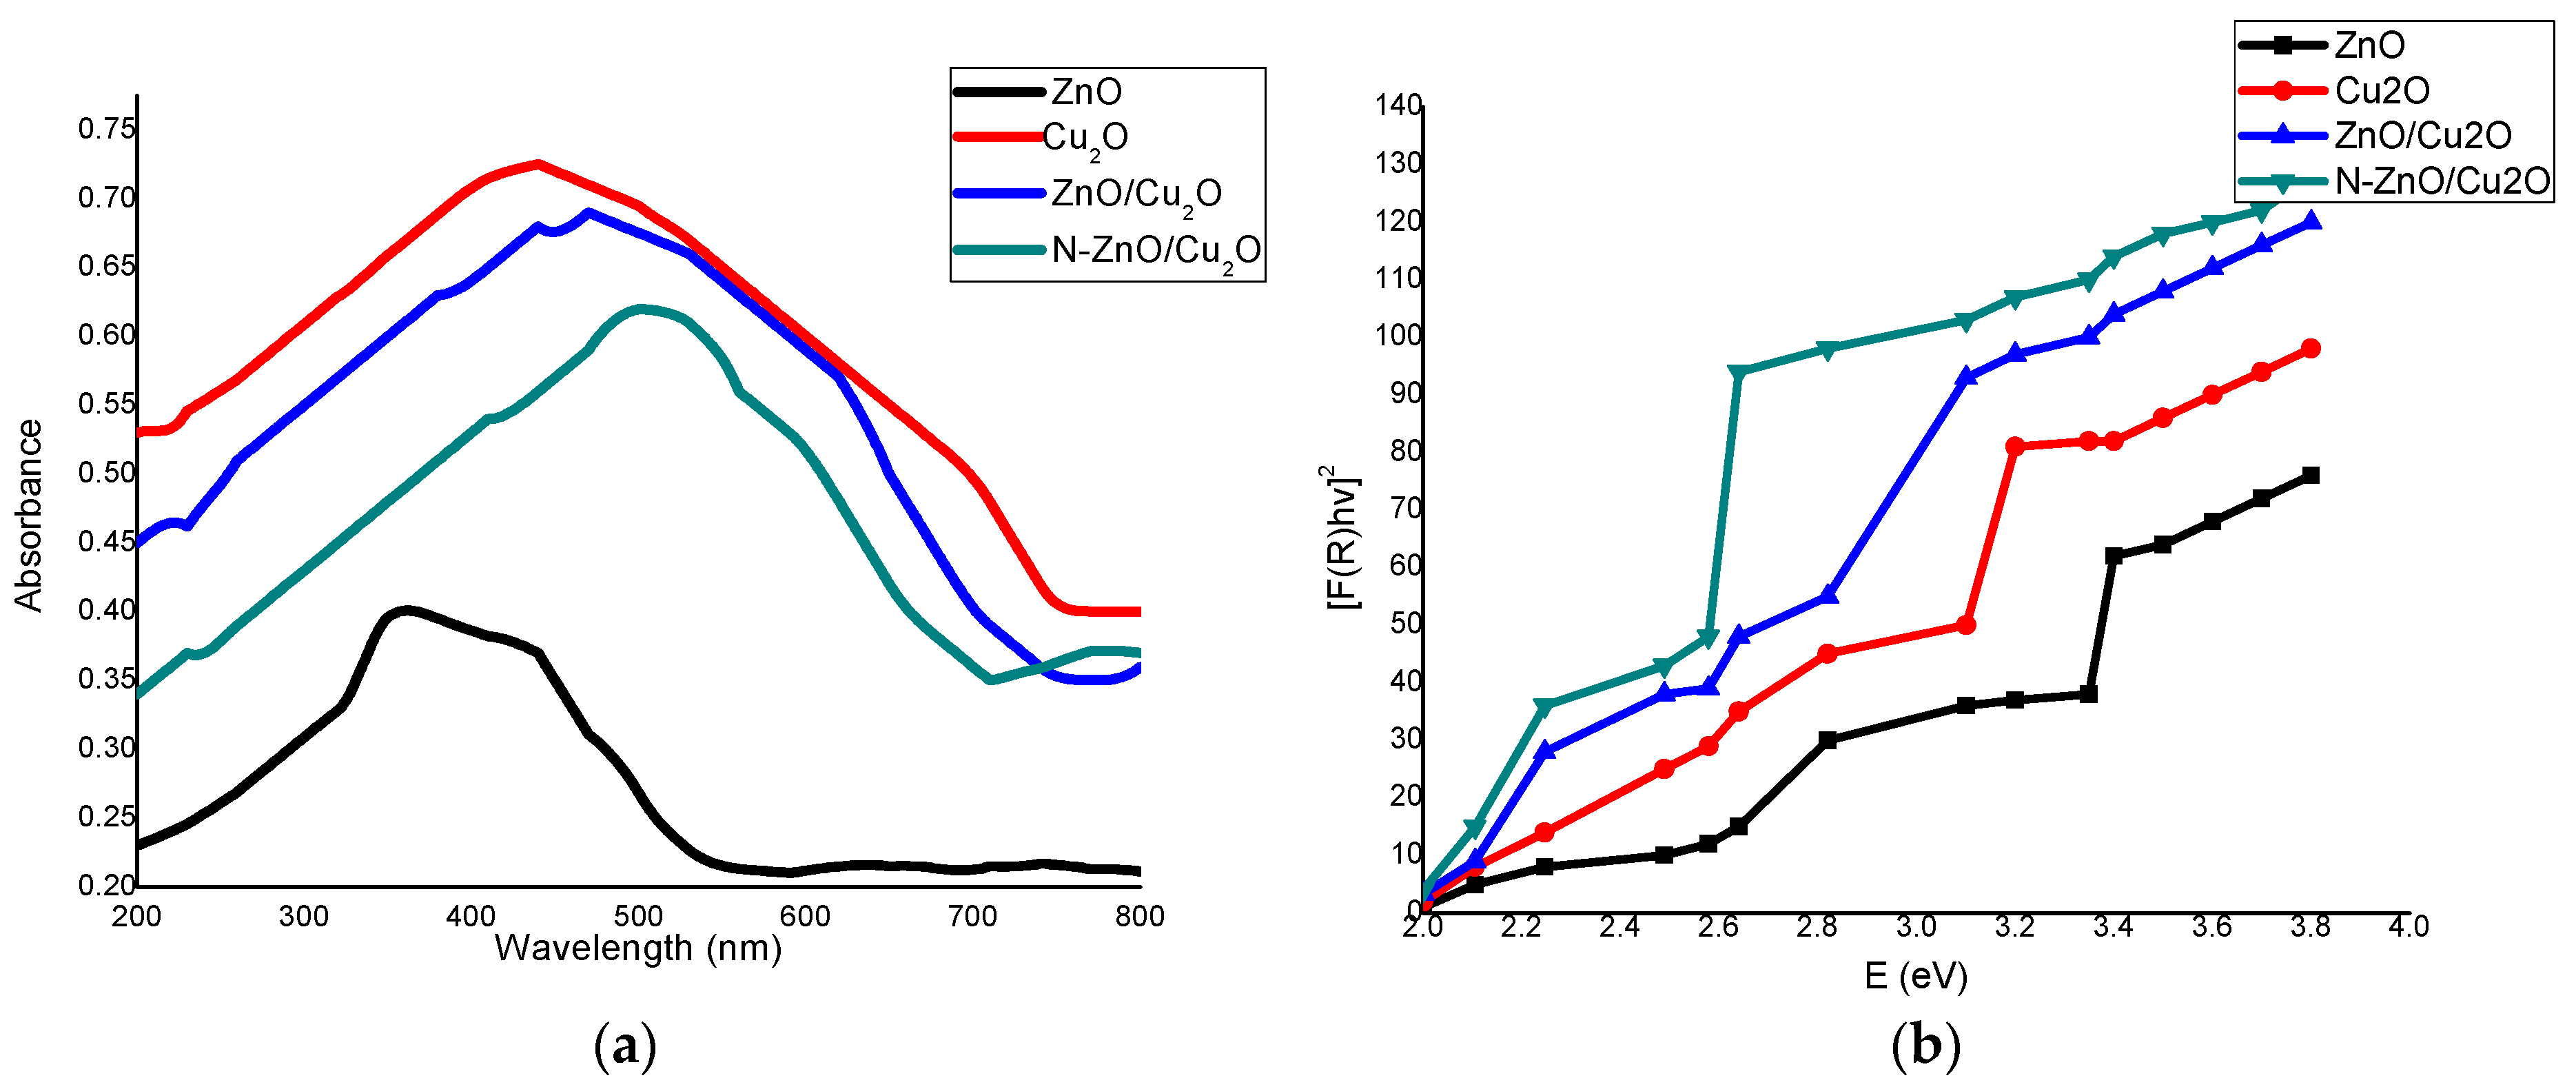
3.4. Optical Property Analysis

The region of absorption of electromagnetic radiation of the prepared nanomaterials was studied using UV–Vis diffuse reflectance spectroscopy. The spectra for the absorption of light by ZnO, Cu2O, Cu2O/ZnO and N-Cu2O/ZnO are given in Figure 4. ZnO, Cu2O, Cu2O/ZnO and N-Cu2O/ZnO absorbed at 360, 440, 470 and 500 nm, respectively. For ZnO, the absorption edge was in the ultraviolet region. The Cu2O/ZnO composite nanoparticles absorbed light in the visible region because of the presence of Cu2O [27]. The absorption edges were extended into 470 nm by coupling ZnO with Cu2O and then further to 500 nm by doping with nitrogen.
The bandgap energy of the nanocomposites can be inferred by extrapolation of the linear portion of the graph between the modified Kubelka–Munk function [F(R)hν]2 versus photon energy(hν) [39]; as shown in Figure 4b. The bandgap energy of ZnO and Cu2O is 3.4 eV and 2.81 eV, respectively; however, there is decrement for ZnO/Cu2O (2.64 eV) and N-ZnO/Cu2O (2.48 eV). The greatly extended absorption of light by N-Cu2O/ZnO to the visible region may be ascribed to the creation of a new energy level above the valence band of Cu2O and ZnO as a result of nitrogen doping, leading to narrowing of the bandgap to the visible region for harvesting more photons in the sunlight, which is in agreement with previous findings [40].

3.5. Photocatalytic Activity

3.5.1. Optimization of N-Cu2O/ZnO Loading

To know the optimal value of catalyst dosage, a series of photocatalytic degradation experiments were conducted by varying the amount of the N-Cu2O/ZnO nanocomposite from 120 to 240 mg/L as optimized by [27]. The photocatalytic degradation of methyl red under sunlight irradiation using a different amount of N-doped Cu2O/ZnO nanocomposite is shown in Figure 5. The figure shows that, as the amount of catalyst loading increases from 120 mg/L to 180 mg/L, the degradation efficiency also increased. The reason is that increasing the catalyst loading increases the surface area and quantity of reaction sites on the surface of the photocatalyst. Consequently, the amount of hydroxyl radical formation increases too, which enables the photocatalytic degradation of the dye. However, the degradation efficiency was decreased when the amount of the catalyst dosage was beyond 180 mg/L. This might be due to light-scattering and screening effects [41,42]. Besides, agglomeration also occurs when the concentration of catalyst is high; which results in the decreasing of catalyst surface area and causes diminishing of degradation efficiency [42,43]. Therefore, the degradation efficiency was greatest when the amount of the catalyst used was 180 mg/L and was the optimal value in the experiment.

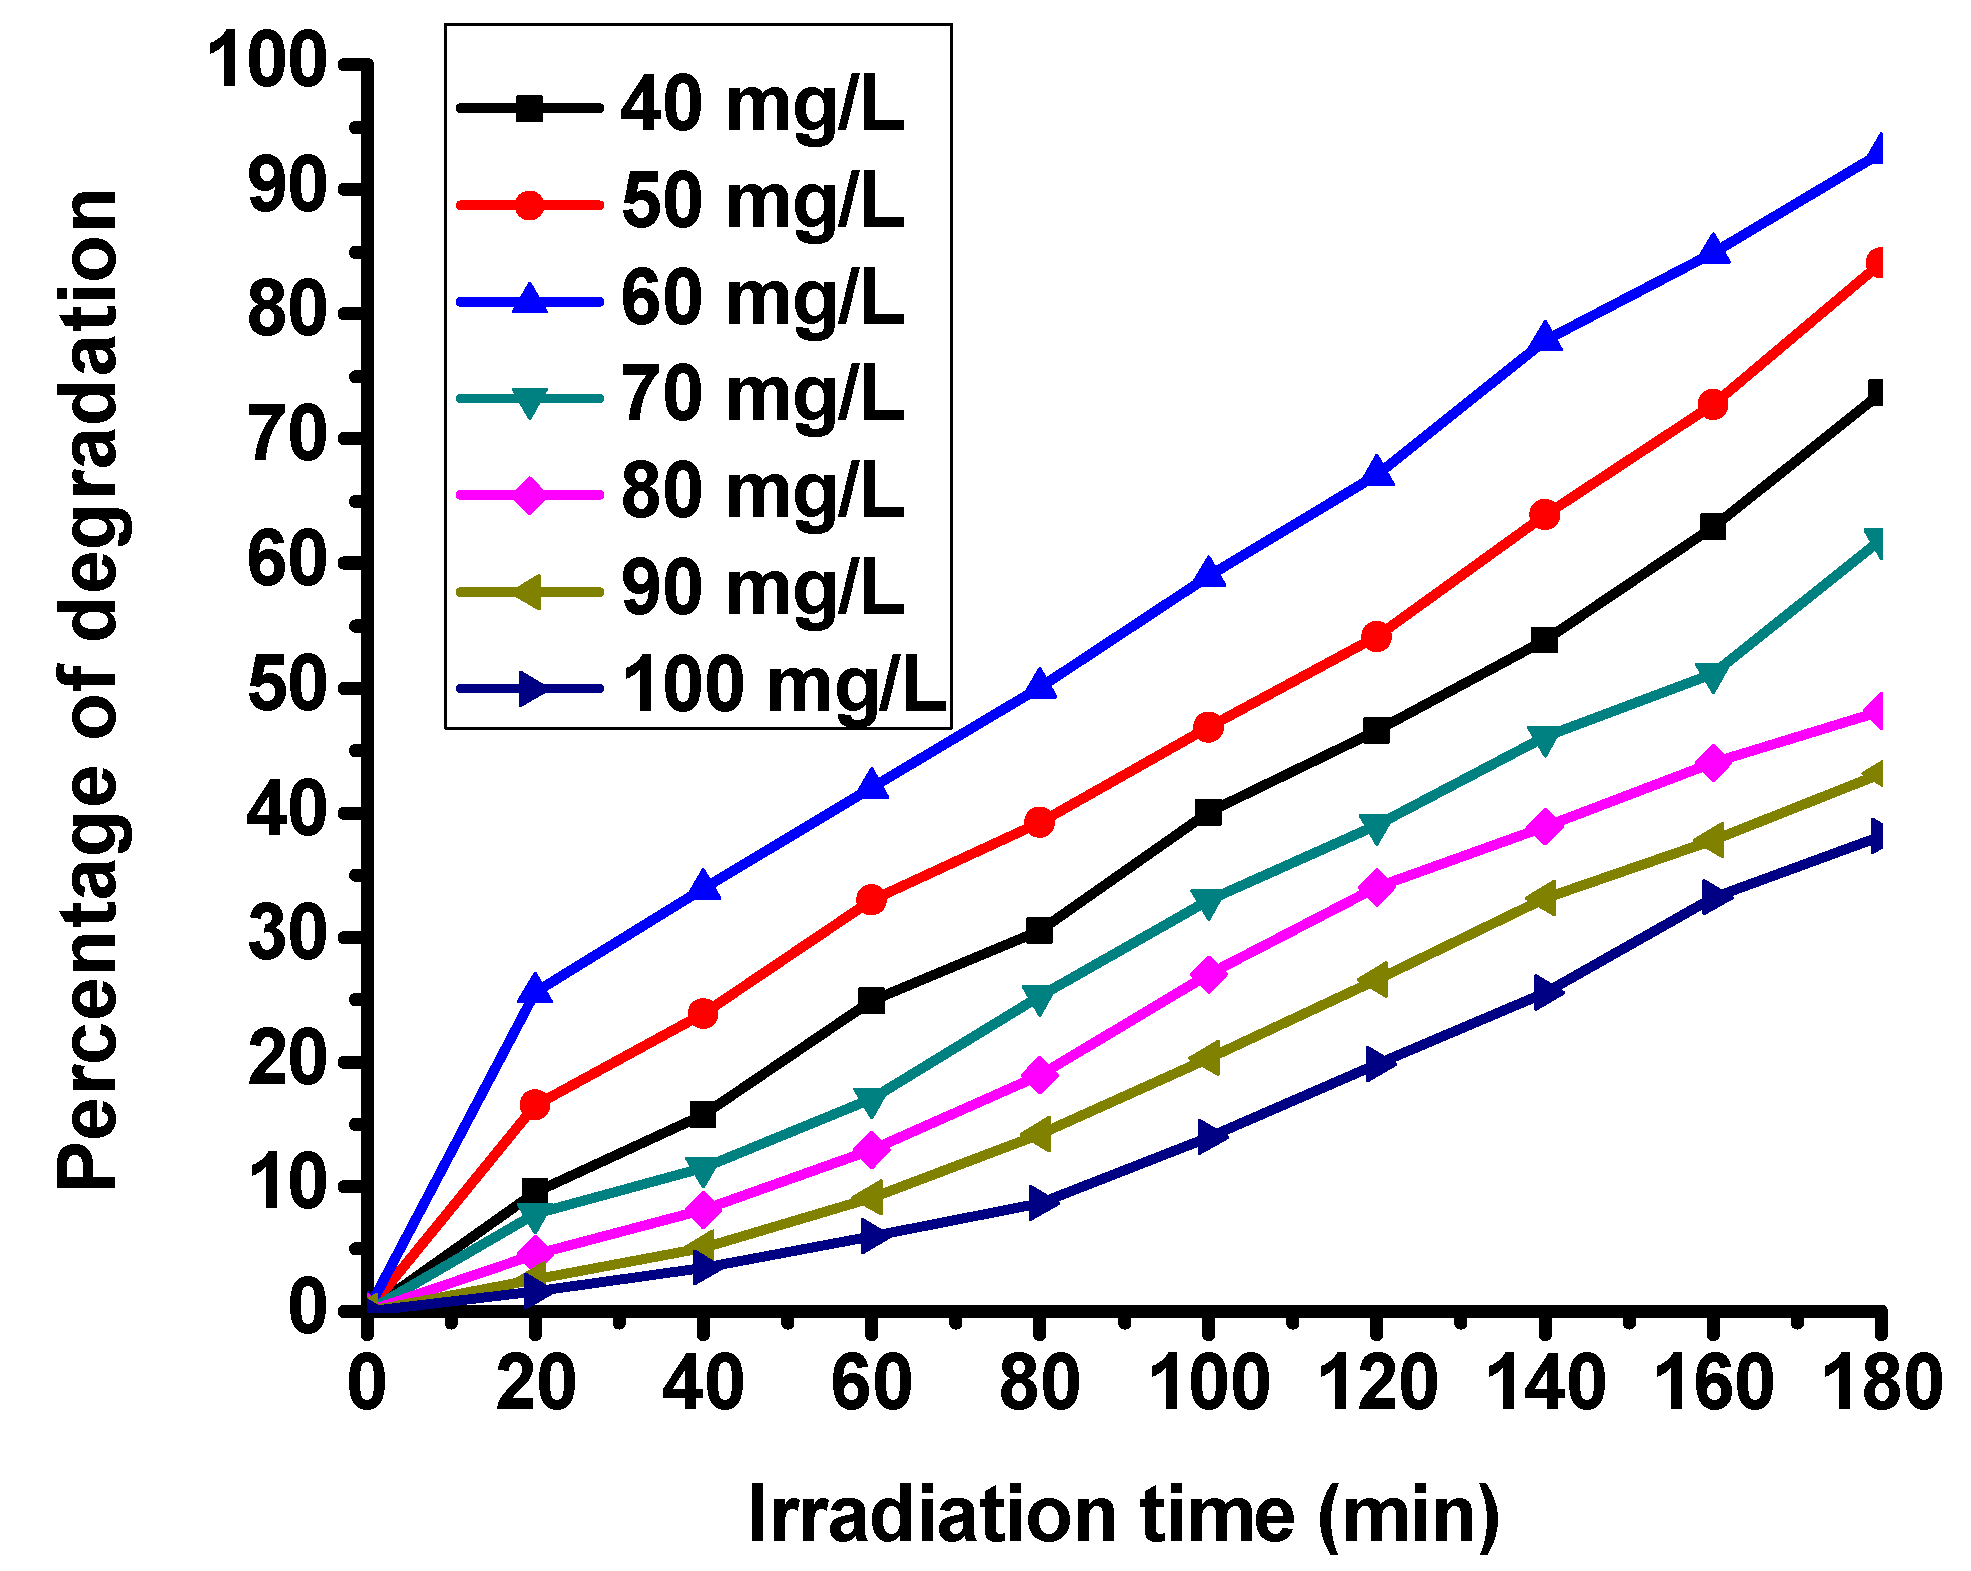
3.5.2. Optimization of Methyl Red Concentration

Once the amount of the catalyst was optimized at 180 mg/L, a series of photocatalytic degradation experiments were conducted by varying the concentration of methyl red from 40 to 100 mg/L as adjusted by [27] to know the proper amount of the dye. As shown in Figure 6, as the concentration of the dye was enlarged from 40 mg/L to 60 mg/L, the degradation efficiency was likewise enhanced. However, as the concentration of the dye goes above 60 mg/L, the degradation efficiency sharply decreased. The reason for the decreasing of photocatalytic degradation efficiency with increasing concentration of the dye is that the higher dye concentration could affect the transmission of light which leads to a decrease in hydroxyl radical formation. The total amount of active sites on the surface of the catalyst was limited by the amount of catalyst loaded. Therefore, in the solution having fixed catalyst dosage, an inadequate amount of hydroxyl radicals that can attack the methyl red can form, hence leading to the diminishing of degradation capability [43].

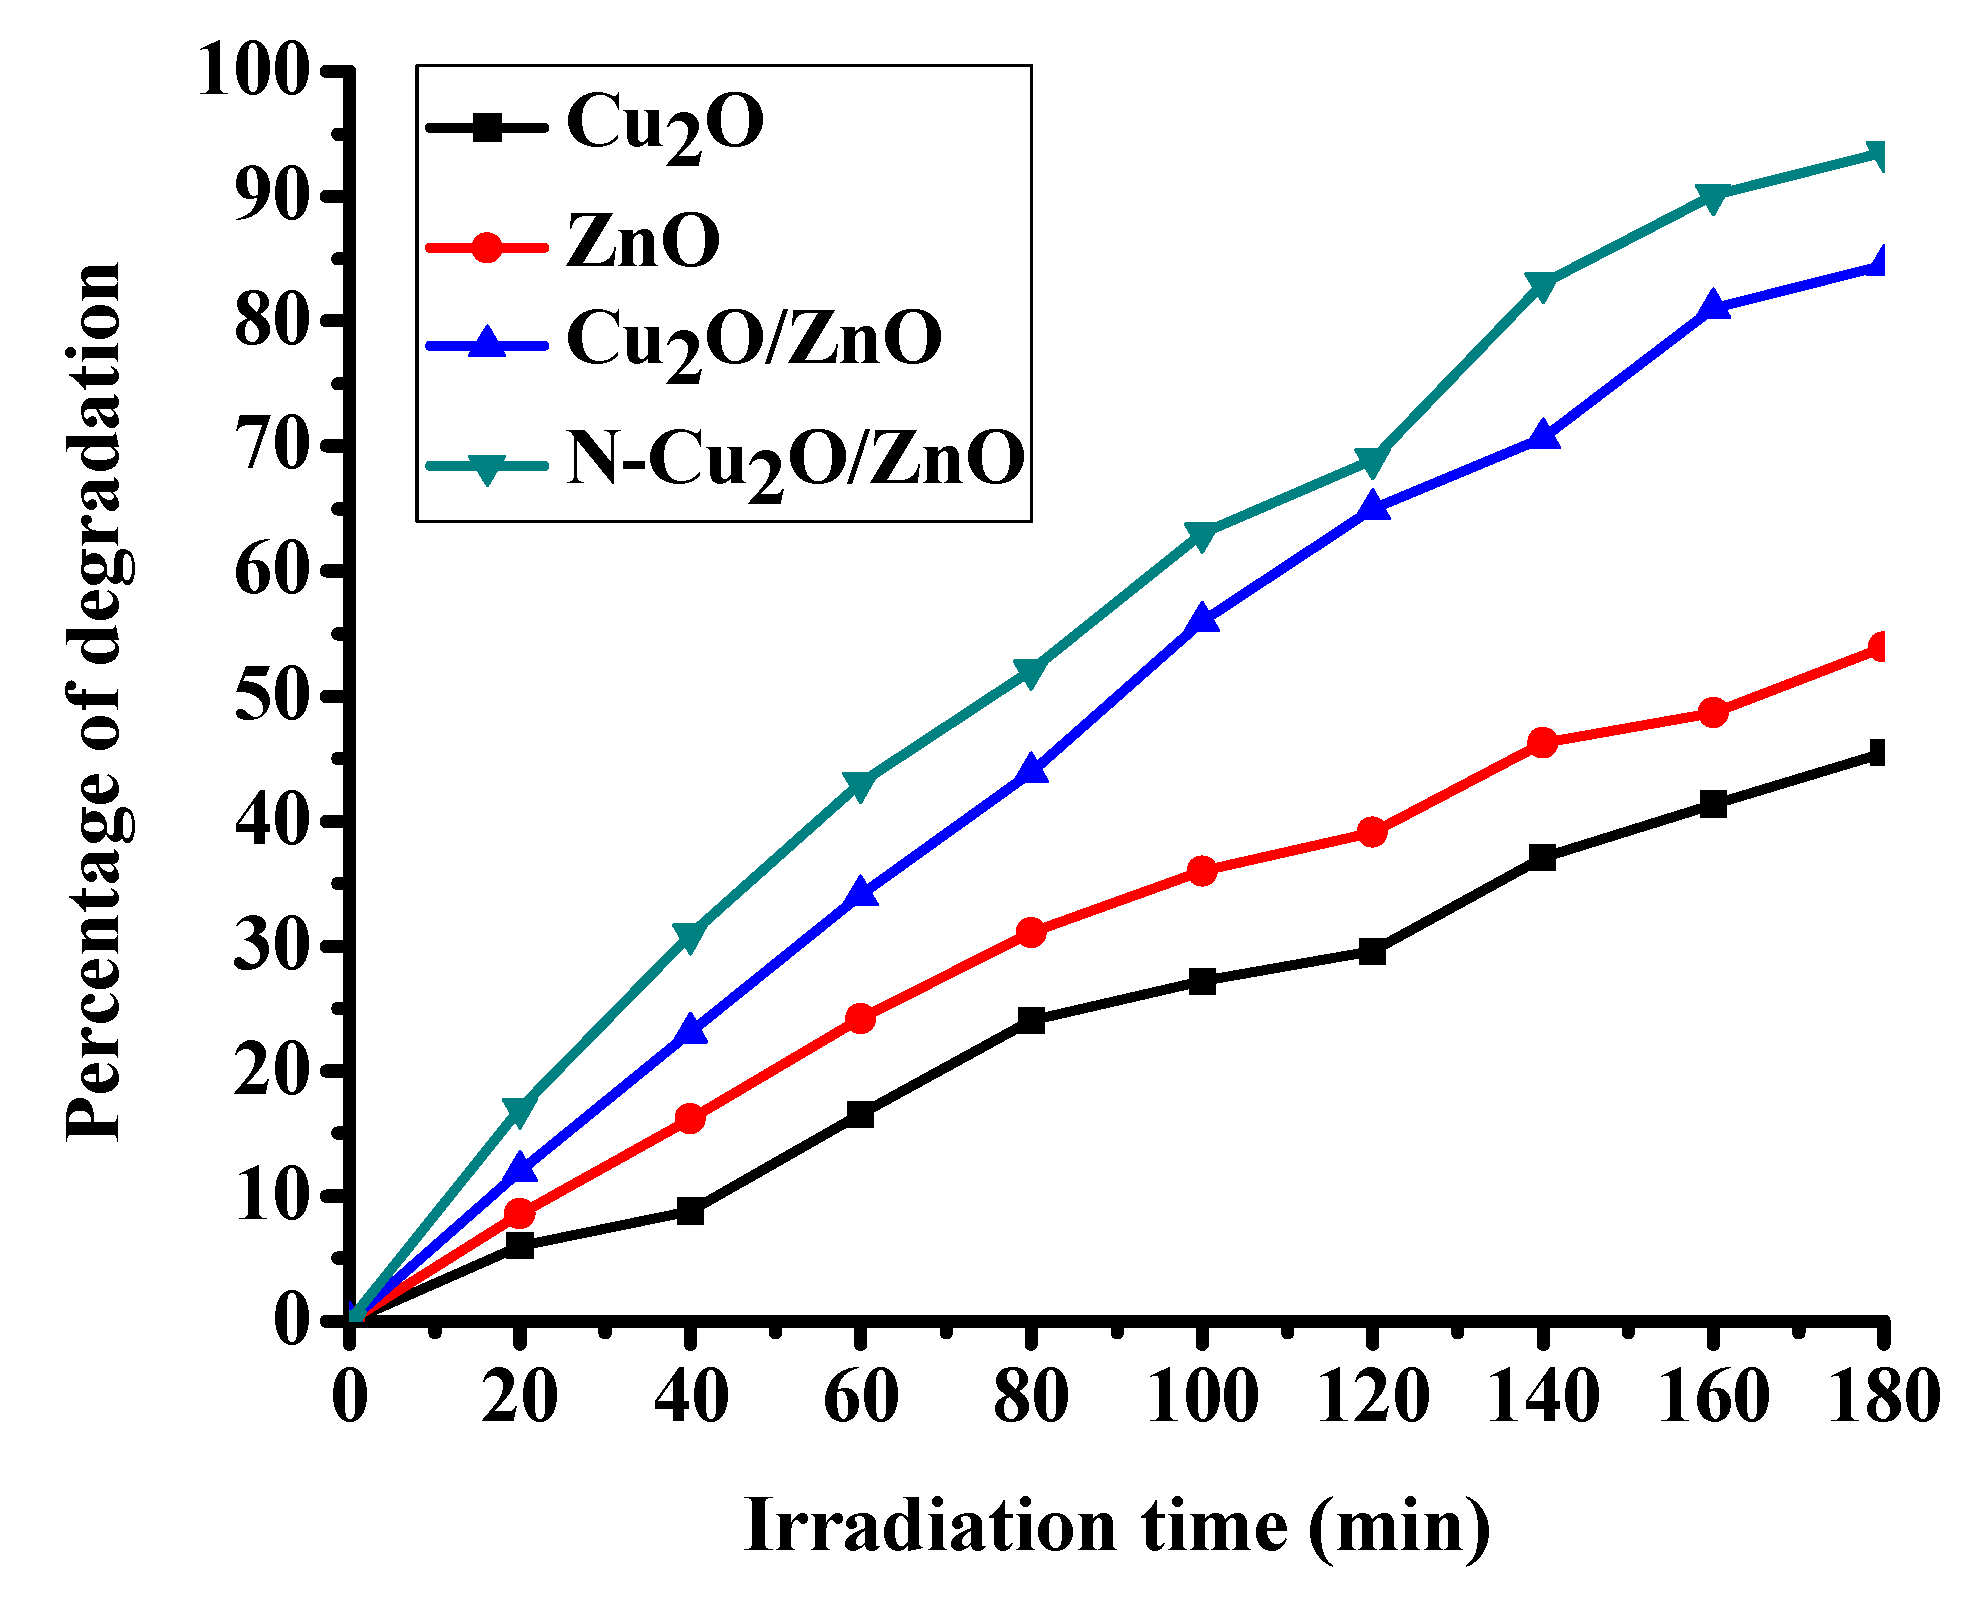
3.5.3. Evaluation of the Photocatalytic Activities of Cu2O, ZnO, Cu2O/ZnO and N-Cu2O/ZnO under the Optimized Catalyst Amount and Dye Concentration

The photocatalytic performance of Cu2O, ZnO, Cu2O/ZnO, and N-Cu2O/ZnO nanomaterials were evaluated in the degradation of methyl red dye, as shown in Figure 7. The photocatalytic degradation efficiency of methyl red reached 45.5%, 54%, 84.5% and 93.5% using Cu2O, ZnO, Cu2O/ZnO, and N-doped Cu2O/ZnO, respectively, within 180 min irradiation time. Among these nanomaterials, the N-doped Cu2O/ZnO nanocomposite displayed better photocatalytic activity than the others under the optimized conditions. The activity of N-doped Cu2O/ZnO nanocomposite is enhanced because of the formation of a heterojunction [35]. The p-Cu2O/n-ZnO heterojunction might significantly increase the absorption and exploitation capability of solar light; the electrons transfer from the one semiconductor to the other encourages the charge separation and construct significant synergistic effect in the degradation of the dye [35]. In addition to the effect of the coupling of the two semiconductors, the improved photocatalytic efficiency of N-Cu2O/ZnO nanocomposite is due to doping with nitrogen. Incorporating non-metals, for example nitrogen, can diminish the energy gap and extend absorption of light to the visible region of electromagnetic radiation [44]. In other words, nitrogen can modify the energy levels of both Cu2O and ZnO nanoparticles. Besides the above reasons, the enhanced photocatalytic activity of N-doped Cu2O/ZnO composite nanoparticles may be due to the reduction in particle size and creation of defect sites.

3.5.4. Proposed Mechanism

Scheme 2 demonstrates the photocatalytic degradation mechanism of methyl red by N-doped Cu2O/ZnO composite nanoparticles under sunlight irradiation. When the semiconductors are exposed to sunlight, a transition of electrons from the valence band to the conduction band and formation of holes in the valence band (Equations (3) and (4)) can take place. The conduction band of cuprous oxide is at higher position compared to zinc oxide (Jiang et al., 2013), the photo-induced electrons in the Cu2O conduction band can simply transfer to the ZnO conduction band Equation (5), which can successfully prevent the recombination of charge carriers. The electrons at the conduction band of Cu2O and ZnO undergo a reaction with adsorbed oxygen to give a peroxide radical anion Equation (6). It is impossible to oxidize the OH by holes of Cu2O because the valence band edge of Cu2O is higher in a position [45]. However, the holes of ZnO oxidize the hydroxyl ion to yield a hydroxyl radical Equation (8), a strong oxidizing agent that can break down the organic dye. Besides, the peroxide radical anion undergoes a reaction with the hydrogen ion to produce HO2 and H2O2 Equation (9). The hydrogen peroxide is then reacted with the peroxide radical anion to create the powerful hydroxyl radicals Equation (11). Eventually, the hydroxyl radical oxidizes the dye into photocatalytic degradation products Equation (12) [35,43]. The reaction steps are described below.
Cu 2 O   +   h υ     Cu 2 O   ( h + )   +   Cu 2 O   ( e )
ZnO   +   h υ     ZnO   ( h + )   +   ZnO   ( e )
Cu 2 O   ( e )   +   ZnO     Cu 2 O   +   ZnO   ( e )
Cu 2 O   ( e ) / ZnO   ( e )   +   O 2−
H 2 O     H +   +   O H
ZnO   ( h + )   +   OH     OH
O 2−   +   H +   HO 2
HO 2   +   HO 2   O 2   +   H 2 O 2
H 2 O 2   +   O 2−     OH   +   OH   +   O 2
OH   +   Dye     H 2 o + CO 2
The schematic illustration for the photocatalytic degradation mechanism of methyl red under sunlight is summarized below.

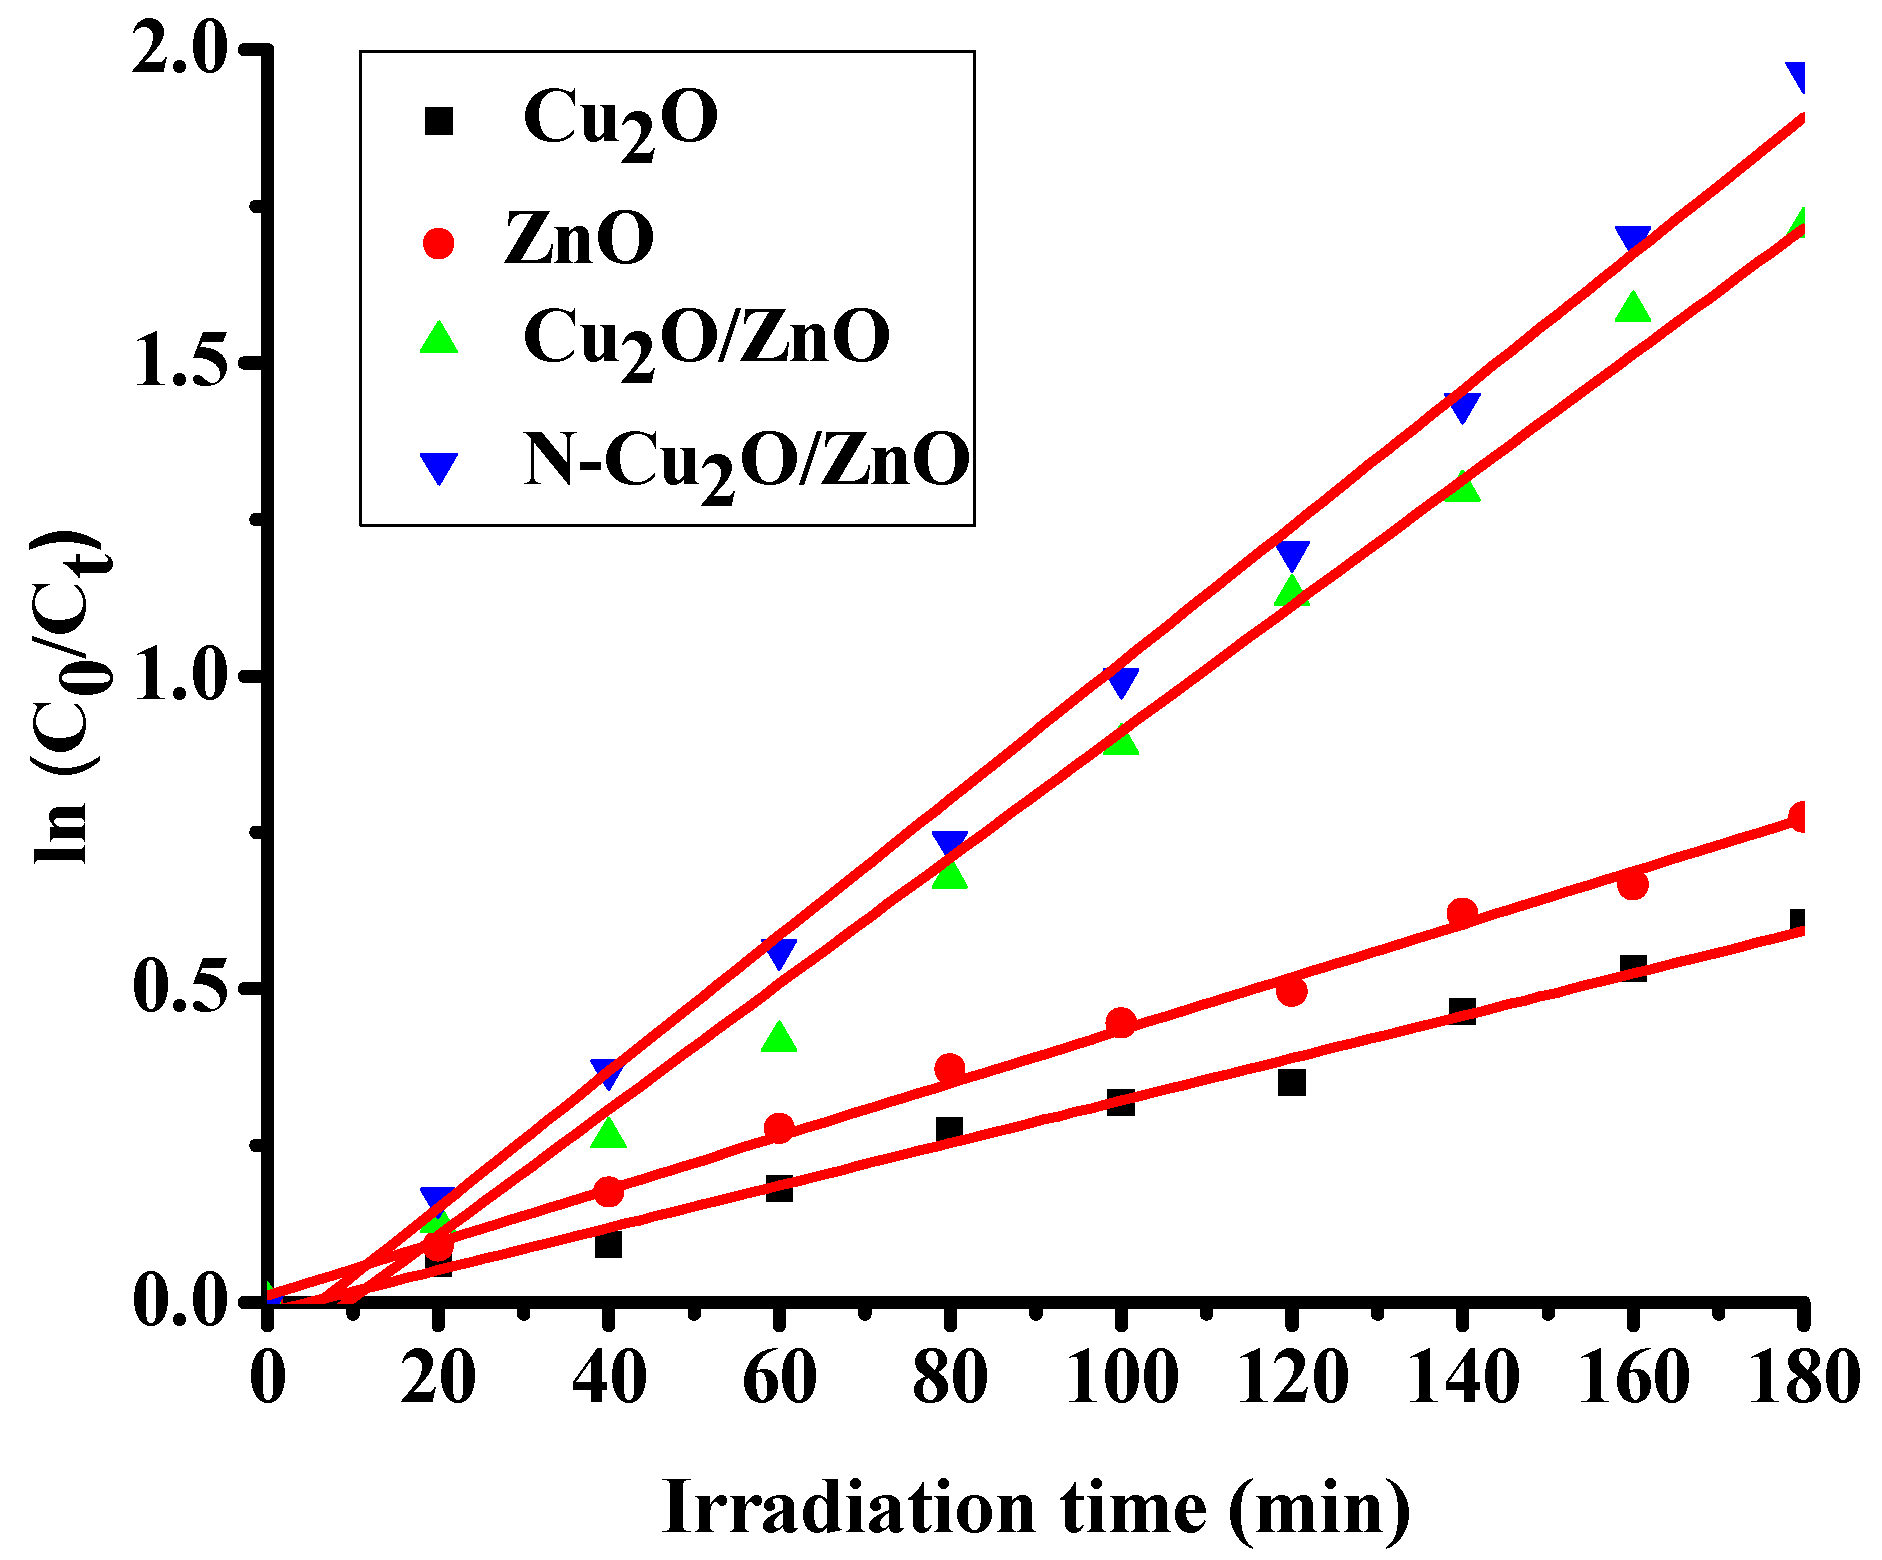
3.6. Kinetic Study of the Photocatalytic Decolorization

The kinetics of the photocatalytic degradation of methyl red over ZnO, Cu2O, Cu2O/ZnO and N-doped Cu2O/ZnO is shown in Figure 8. The plots of ln(C0/Ct) versus irradiation time indicated linear curves. The linearity of the kinetic curve shows that the photocatalytic degradation of methyl red follows pseudo-first-order kinetics. A fairly good correlation coefficient value to the pseudo-first-order kinetics of R2 > 0.96 was obtained, which is in agreement with other reports [46]. The rate constants (reaction rate) were predicted from the slope of the graph. The rate constants are found to be 0.00338, 0.00423, 0.01005 and 0.01088 min−1 for Cu2O, ZnO, Cu2O/ZnO, and N-Cu2O/ZnO nanomaterials, respectively. The rate constants of the photocatalytic degradation of methyl red using N-Cu2O/ZnO and Cu2O/ZnO nanocomposites are larger than pure Cu2O and ZnO nanoparticles. Therefore, the photocatalytic activities of N-Cu2O/ZnO and Cu2O/ZnO nanocomposites based on the rate constants are found to be greater than Cu2O and ZnO nanoparticles [5,47].

4. Conclusions

N-doped Cu2O/ZnO nanocomposite was synthesized by co-precipitation and thermal decomposition methods. The absorption edge of the nanocomposite was more extended to the visible region of electromagnetic radiation compared to ZnO, Cu2O and Cu2O/ZnO nanomaterials. The photocatalytic activity of N-doped Cu2O/ZnO nanocomposite has enhanced efficiency than ZnO, Cu2O and Cu2O/ZnO nanomaterials. The enhancement is due to the coupling of Cu2O and ZnO semiconductors, which can drop the recombination rate of the charge carriers, and improve the absorption and utilization ability to sunlight. In addition to that, doping the nanocomposite with nitrogen can outspread the photoabsorption to longer wavelengths. Based on the findings, N-doped Cu2O/ZnO nanocomposite is an effective solar light active photocatalyst that can be used for the removal of organic dyes from wastewater.

Author Contributions

All the authors participated in conceptualizing, executing, analyzing, editing, and reviewing this article.

Funding

This research received no external funding.

Conflicts of Interest

The authors declared no conflict interest.

References

  1. Lin, B.; Ouyang, X. Energy demand in China: Comparison of characteristics between the US and China in rapid urbanization stage. Energy Convers. Manag. 2014, 79, 128–139. [Google Scholar] [CrossRef]
  2. Pekakis, P.A.; Xekoukoulotakis, N.P.; Mantzavinos, D. Treatment of textile dyehouse wastewater by TiO2 photocatalysis. Water Res. 2006, 40, 1276–1286. [Google Scholar] [CrossRef] [PubMed]
  3. Wainwright, M. Dyes in the development of drugs and pharmaceuticals. Dye. Pigment. 2008, 76, 582–589. [Google Scholar] [CrossRef]
  4. Gupta, V.K.; Ali, I.; Saleh, T.A.; Nayak, A.; Agarwal, S. Chemical treatment technologies for waste-water recycling—an overview. Rsc Adv. 2012, 2, 6380–6388. [Google Scholar] [CrossRef]
  5. Balcha, A.; Yadav, O.P.; Dey, T. Photocatalytic degradation of methylene blue dye by zinc oxide nanoparticles obtained from precipitation and sol-gel methods. Environ. Sci. Pollut. Res. 2016, 23, 25485–25493. [Google Scholar] [CrossRef] [PubMed]
  6. Ong, C.B.; Ng, L.Y.; Mohammad, A.W. A review of ZnO nanoparticles as solar photocatalysts: Synthesis, mechanisms and applications. Renew. Sustain. Energy Rev. 2018, 81, 536–551. [Google Scholar] [CrossRef]
  7. Emeline, A.; Ryabchuk, V.; Serpone, N. Photoreactions Occurring on Metal-oxide Surfaces are not all Photocatalytic: Description of Criteria and Conditions for Processes to be Photocatalytic. Catal. Today 2007, 122, 91–100. [Google Scholar] [CrossRef]
  8. Benedix, R.; Dehn, F.; Quaas, J.; Orgass, M. Application of titanium dioxide photocatalysis to create self-cleaning building materials. Lacer 2000, 5, 157–168. [Google Scholar]
  9. Gupta, S.M.; Tripathi, M. An overview of commonly used semiconductor nanoparticles in photocatalysis. High Energy Chem. 2012, 46, 1–9. [Google Scholar] [CrossRef]
  10. Samadi, M.; Zirak, M.; Naseri, A.; Khorashadizade, E.; Moshfegh, A.Z. Recent progress on doped ZnO nanostructures for visible-light photocatalysis. Thin Solid Films 2016, 605, 2–19. [Google Scholar] [CrossRef] [Green Version]
  11. Sakthivel, S.; Neppolian, B.; Shankar, M.; Arabindoo, B.; Palanichamy, M.; Murugesan, V. Solar photocatalytic degradation of azo dye: Comparison of photocatalytic efficiency of ZnO and TiO2. Sol. Energy Mater. Sol. Cells 2003, 77, 65–82. [Google Scholar] [CrossRef]
  12. Behnajady, M.; Modirshahla, N.; Hamzavi, R. Kinetic study on photocatalytic degradation of CI Acid Yellow 23 by ZnO photocatalyst. J. Hazard. Mater. 2006, 133, 226–232. [Google Scholar] [CrossRef] [PubMed]
  13. Cauda, V.; Pugliese, D.; Garino, N.; Sacco, A.; Bianco, S.; Bella, F.; Lamberti, A.; Gerbaldi, C. Multi-functional energy conversion and storage electrodes using flower-like Zinc oxide nanostructures. Energy 2014, 65, 639–646. [Google Scholar] [CrossRef]
  14. Miccoli, B.; Cauda, V.; Bonanno, A.; Sanginario, A.; Bejtka, K.; Bella, F.; Fontana, M.; Demarchi, D. One-dimensional ZnO/gold junction for simultaneous and versatile multisensing measurements. Sci. Rep. 2016, 6, 29763. [Google Scholar] [CrossRef] [PubMed]
  15. Navaneethan, M.; Patil, V.; Ponnusamy, S.; Muthamizhchelvan, C.; Kawasaki, S.; Patil, P.; Hayakawa, Y. Sensitivity enhancement of ammonia gas sensor based on Ag/ZnO flower and nanoellipsoids at low temperature. Sens. Actuators B Chem. 2018, 255, 672–683. [Google Scholar]
  16. Jang, J.S.; Kim, J.; Ghorpade, U.; Shin, H.H.; Gang, M.G.; Park, S.D.; Kim, H.-J.; Lee, D.S.; Kim, J.H. Comparison study of ZnO-based quaternary TCO materials for photovoltaic application. J. Alloy. Compd. 2019, 793, 499–504. [Google Scholar] [CrossRef]
  17. Shishiyanu, S.T.; Shishiyanu, T.S.; Lupan, O.I. Sensing characteristics of tin-doped ZnO thin films as NO2 gas sensor. Sens. Actuators B Chem. 2005, 107, 379–386. [Google Scholar] [CrossRef]
  18. Umar, A.; Akhtar, M.; Al-Assiri, M.; Al-Salami, A.; Kim, S. Composite CdO-ZnO hexagonal nanocones: Efficient materials for photovoltaic and sensing applications. Ceram. Int. 2018, 44, 5017–5024. [Google Scholar] [CrossRef]
  19. Huang, B.; Zhang, Z.; Zhao, C.; Cairang, L.; Bai, J.; Zhang, Y.; Mu, X.; Du, J.; Wang, H.; Pan, X. Enhanced gas-sensing performance of ZnO@ In2O3 core@ shell nanofibers prepared by coaxial electrospinning. Sens. Actuators B Chem. 2018, 255, 2248–2257. [Google Scholar] [CrossRef]
  20. Li, Y.; Liang, Y.; Hernandez, F.C.R.; Yoo, H.D.; An, Q.; Yao, Y. Enhancing sodium-ion battery performance with interlayer-expanded MoS2–PEO nanocomposites. Nano Energy 2015, 15, 453–461. [Google Scholar] [CrossRef]
  21. Chen, T.; Liu, W.; Zhuo, Y.; Hu, H.; Zhu, M.; Cai, R.; Chen, X.; Yan, J.; Liu, K. Single-phase P2-type layered oxide with Cu-substitution for sodium ion batteries. J. Energy Chem. 2020, 43, 148–154. [Google Scholar] [CrossRef]
  22. Li, Y.; Xie, C.; Peng, S.; Lu, G.; Li, S. Eosin Y-sensitized nitrogen-doped TiO2 for efficient visible light photocatalytic hydrogen evolution. J. Mol. Catal. A Chem. 2008, 282, 117–123. [Google Scholar] [CrossRef]
  23. Bora, L.V.; Mewada, R.K. Visible/solar light active photocatalysts for organic effluent treatment: Fundamentals, mechanisms and parametric review. Renew. Sustain. Energy Rev. 2017, 76, 1393–1421. [Google Scholar] [CrossRef]
  24. Anandan, S.; Vinu, A.; Lovely, K.S.; Gokulakrishnan, N.; Srinivasu, P.; Mori, T.; Murugesan, V.; Sivamurugan, V.; Ariga, K. Photocatalytic activity of La-doped ZnO for the degradation of monocrotophos in aqueous suspension. J. Mol. Catal. A Chem. 2007, 266, 149–157. [Google Scholar] [CrossRef]
  25. Welderfael, T.; Yadav, O.; Taddesse, A.M.; Kaushal, J. Synthesis, characterization and photocatalytic activities of Ag-N-codoped ZnO nanoparticles for degradation of methyl red. Bull. Chem. Soc. Ethiop. 2013, 27, 221–232. [Google Scholar] [CrossRef]
  26. Wang, Y.; Tao, J.; Wang, X.; Wang, Z.; Zhang, M.; He, G.; Sun, Z. A unique Cu2O/TiO2 nanocomposite with enhanced photocatalytic performance under visible light irradiation. Ceram. Int. 2017, 43, 4866–4872. [Google Scholar] [CrossRef]
  27. Ma, J.; Wang, K.; Li, L.; Zhang, T.; Kong, Y.; Komarneni, S. Visible-light photocatalytic decolorization of Orange II on Cu2O/ZnO nanocomposites. Ceram. Int. 2015, 41, 2050–2056. [Google Scholar] [CrossRef]
  28. Ahmad, M.; Ahmed, E.; Hong, Z.; Khalid, N.; Ahmed, W.; Elhissi, A. Graphene–Ag/ZnO nanocomposites as high performance photocatalysts under visible light irradiation. J. Alloy. Compd. 2013, 577, 717–727. [Google Scholar] [CrossRef]
  29. Jiang, Y.; Sun, Y.; Liu, H.; Zhu, F.; Yin, H. Solar photocatalytic decolorization of CI Basic Blue 41 in an aqueous suspension of TiO2–ZnO. Dye. Pigment. 2008, 78, 77–83. [Google Scholar] [CrossRef]
  30. Essawy, A.A. Silver imprinted zinc oxide nanoparticles: Green synthetic approach, characterization and efficient sunlight-induced photocatalytic water detoxification. J. Clean. Prod. 2018, 183, 1011–1020. [Google Scholar] [CrossRef]
  31. Jiang, D.; Xing, C.; Liang, X.; Shao, L.; Chen, M. Synthesis of cuprous oxide with morphological evolution from truncated octahedral to spherical structures and their size and shape-dependent photocatalytic activities. J. Colloid Interface Sci. 2016, 461, 25–31. [Google Scholar] [CrossRef] [PubMed]
  32. Rajbongshi, B.M.; Ramchiary, A.; Samdarshi, S. Influence of N-doping on photocatalytic activity of ZnO nanoparticles under visible light irradiation. Mater. Lett. 2014, 134, 111–114. [Google Scholar] [CrossRef]
  33. Gionco, C.; Fabbri, D.; Calza, P.; Paganini, M.C. Synthesis, characterization, and photocatalytic tests of N-doped zinc oxide: A new interesting photocatalyst. J. Nanomater. 2016, 2016. [Google Scholar] [CrossRef]
  34. Kerour, A.; Boudjadar, S.; Bourzami, R.; Allouche, B. Eco-friendly synthesis of cuprous oxide (Cu2O) nanoparticles and improvement of their solar photocatalytic activities. J. Solid State Chem. 2018, 263, 79–83. [Google Scholar] [CrossRef]
  35. He, Z.; Xia, Y.; Tang, B.; Jiang, X.; Su, J. Fabrication and photocatalytic property of ZnO/Cu2O core-shell nanocomposites. Mater. Lett. 2016, 184, 148–151. [Google Scholar] [CrossRef]
  36. Abraham, N.; Rufus, A.; Unni, C.; Philip, D. Dye sensitized solar cells using catalytically active CuO-ZnO nanocomposite synthesized by single step method. Spectrochim. Acta Part A Mol. Biomol. Spectrosc. 2018, 200, 116–126. [Google Scholar] [CrossRef]
  37. Alizadeh, E.; Baseri, H. Catalytic degradation of Amlodipine Besylate using ZnO, Cu doped ZnO, and Fe doped ZnO nanoparticles from an aqueous solution: Investigating the effect of different parameters on degradation efficiency. Solid State Sci. 2018, 78, 86–94. [Google Scholar] [CrossRef]
  38. Sanchez-Martinez, A.; Ceballos-Sanchez, O.; Koop-Santa, C.; López-Mena, E.R.; Orozco-Guareño, E.; García-Guaderrama, M. N-doped TiO2 nanoparticles obtained by a facile coprecipitation method at low temperature. Ceram. Int. 2018, 44, 5273–5283. [Google Scholar] [CrossRef]
  39. Jeyasubramanian, K.; Hikku, G.; Sivashakthi, M. Synthesis, characterization and photo-catalytic studies of mixed metal oxides of nano ZnO and SnOx. Mater. Sci. Semicond. Process. 2016, 51, 25–32. [Google Scholar] [CrossRef]
  40. Yu, W.; Zhang, J.; Peng, T. New insight into the enhanced photocatalytic activity of N-, C-and S-doped ZnO photocatalysts. Appl. Catal. B Environ. 2016, 181, 220–227. [Google Scholar] [CrossRef]
  41. Elhalil, A.; Elmoubarki, R.; Farnane, M.; Machrouhi, A.; Mahjoubi, F.; Sadiq, M.; Qourzal, S.; Barka, N. Synthesis, characterization and efficient photocatalytic activity of novel Ca/ZnO-Al2O3 nanomaterial. Mater. Today Commun. 2018, 16, 194–203. [Google Scholar] [CrossRef]
  42. Ashebir, M.E.; Tesfamariam, G.M.; Nigussie, G.Y.; Gebreab, T.W. Structural, Optical, and Photocatalytic Activities of Ag-Doped and Mn-Doped ZnO Nanoparticles. J. Nanomater. 2018, 2018. [Google Scholar] [CrossRef]
  43. Lee, K.M.; Lai, C.W.; Ngai, K.S.; Juan, J.C. Recent developments of zinc oxide based photocatalyst in water treatment technology: A review. Water Res. 2016, 88, 428–448. [Google Scholar] [CrossRef] [PubMed]
  44. Yu, Z.; Yin, L.-C.; Xie, Y.; Liu, G.; Ma, X.; Cheng, H.-M. Crystallinity-dependent substitutional nitrogen doping in ZnO and its improved visible light photocatalytic activity. J. Colloid Interface Sci. 2013, 400, 18–23. [Google Scholar] [CrossRef]
  45. Shi, J.; Li, J.; Huang, X.; Tan, Y. Synthesis and enhanced photocatalytic activity of regularly shaped Cu 2 O nanowire polyhedra. Nano Res. 2011, 4, 448–459. [Google Scholar] [CrossRef]
  46. Patil, A.B.; Patil, K.R.; Pardeshi, S.K. Ecofriendly synthesis and solar photocatalytic activity of S-doped ZnO. J. Hazard. Mater. 2010, 183, 315–323. [Google Scholar] [CrossRef]
  47. Rajaboopathi, S.; Thambidurai, S. Enhanced photocatalytic activity of Ag-ZnO nanoparticles synthesized by using Padina gymnospora seaweed extract. J. Mol. Liq. 2018, 262, 148–160. [Google Scholar] [CrossRef]
Scheme 1. Structure of methyl red.
Jcs 03 00093 sch001
Figure 1. X-ray diffractogram of (a) Cu2O, (b) ZnO, (c) Cu2O/ZnO and (d) N-doped Cu2O/ZnO nanomaterials.
Jcs 03 00093 g001
Figure 2. Scanning electron microscopy (SEM) morphology of (a) ZnO, (b) Cu2O, (c) Cu2O/ZnO and (d) N-doped Cu2O/ZnO nanomaterials.
Jcs 03 00093 g002
Figure 3. Fourier transform infrared (FT–IR) spectrums of (a) ZnO, (b) Cu2O, (c) Cu2O/ZnO and (d) N-Cu2O/ZnO nanomaterials.
Jcs 03 00093 g003
Figure 4. (a) Spectra for the optical property of ZnO, Cu2O, Cu2O/ZnO and N-Cu2O/ZnO nanomaterials. (b) Kubelka–Munk function versus energy plots of ZnO, Cu2O, ZnO/Cu2O, and N-ZnO/Cu2O nanoparticles.
Jcs 03 00093 g004
Figure 5. Optimization of N-Cu2O/ZnO nanocomposite loading for the degradation of methyl red under sunlight.
Jcs 03 00093 g005
Figure 6. Optimization of the initial concentration of methyl red on the photocatalytic degradation using N-Cu2O/ZnO nanocomposite under sunlight.
Jcs 03 00093 g006
Figure 7. Evaluation of photocatalytic properties of ZnO, Cu2O, Cu2O/ZnO and N-doped Cu2O/ZnO on the degradation of methyl red under solar light.
Jcs 03 00093 g007
Scheme 2. Schematic illustration of the photocatalytic degradation of methyl red using N-Cu2O/ZnO nanocomposite under sunlight illumination.
Jcs 03 00093 sch002
Figure 8. Reaction kinetics curve.
Jcs 03 00093 g008

