Article

Screening of Different Carbon Nanotubes in Melt-Mixed Polymer Composites with Different Polymer Matrices for Their Thermoelectrical Properties

Leibniz-Institut für Polymerforschung Dresden e.V. (IPF), Hohe Str. 6, 01069 Dresden, Germany
*
Author to whom correspondence should be addressed.
J. Compos. Sci. 2019, 3(4), 106; https://doi.org/10.3390/jcs3040106
Submission received: 14 November 2019 / Revised: 29 November 2019 / Accepted: 5 December 2019 / Published: 7 December 2019
(This article belongs to the Special Issue Recent Advances in Carbon Nanotube Composites)

Abstract

:
The aim of this study is to reveal the influences of carbon nanotube (CNT) and polymer type as well as CNT content on electrical conductivity, Seebeck coefficient (S), and the resulting power factor (PF) and figure of merit (ZT). Different commercially available and laboratory made CNTs were used to prepare melt-mixed composites on a small scale. CNTs typically lead to p-type composites with positive S-values. This was found for the two types of multi-walled CNTs (MWCNT) whereby higher Seebeck coefficient in the corresponding buckypapers resulted in higher values also in the composites. Nitrogen doped MWCNTs resulted in negative S-values in the buckypapers as well as in the polymer composites. When using single-walled CNTs (SWCNTs) with a positive S-value in the buckypapers, positive (polypropylene (PP), polycarbonate (PC), poly (vinylidene fluoride) (PVDF), and poly(butylene terephthalate) (PBT)) or negative (polyamide 66 (PA66), polyamide 6 (PA6), partially aromatic polyamide (PARA), acrylonitrile butadiene styrene (ABS)) S-values were obtained depending on the matrix polymer and SWCNT type. The study shows that the direct production of n-type melt-mixed polymer composites from p-type commercial SWCNTs with relatively high Seebeck coefficients is possible. The highest Seebeck coefficients obtained in this study were 66.4 µV/K (PBT/7 wt % SWCNT Tuball) and −57.1 µV/K (ABS/0.5 wt % SWCNT Tuball) for p- and n-type composites, respectively. The highest power factor and ZT of 0.28 µW/m·K2 and 3.1 × 10⁻⁴, respectively, were achieved in PBT with 4 wt % SWCNT Tuball.

Graphical Abstract

1. Introduction

Electrically conductive polymer composites (CPCs) based on insulating thermoplastic polymer matrices filled with carbon based materials like carbon nanotubes (CNTs), graphite (G), expanded graphite (EG) or graphene nanoplatelets (GNP) can also be used as potential thermoelectric (TE) materials for converting waste heat into electrical energy [1,2]. The thermoelectric effect, also known as Seebeck effect after its discoverer Thomas Johann Seebeck, describes the direct conversion of temperature differences on an electrically conductive material into an electrical voltage, the thermovoltage ΔU. The advantages of polymer-based TE materials over typically used metal oxides such as bismuth tellurides are not only their better availability and cost efficiency, but also their ease of processing, mechanical flexibility, low density and low thermal conductivity.
Some studies on thermoelectric properties of thermoplastic polymer/CNT composites have already been published. Thereby the characteristic value of the Seebeck coefficient (S) representing the ratio between the generated thermovoltage and the temperature difference applied is used from which together with the electrical conductivity σ of the samples the power factor (PF) is calculated using the equation PF = S2·σ. When the thermal conductivity к of the materials in the direction of the thermovoltage generation is known, also the figure of merit (ZT) can be calculated using the relation ZT = PF·T/к (with T as absolute temperature). A negative Seebeck coefficient indicates an n-type (electron-donating) material and a positive Seebeck coefficient a p-type (electron-withdrawing) material. In order to achieve high TE performance, high Seebeck coefficient S, high electrical conductivity σ and low thermal conductivity к are desirable. However, these parameters are heavily interrelated and optimization is a challenge.
In one of the first studies on the TE performance of melt-processed polymer nanocomposites, Antar et al. [3] reported poly(lactic acid) (PLA)/multi-walled CNT (MWCNT)/expanded graphite (EG) materials, in which the highest Seebeck coefficient was 17 μV/K at 32 vol % EG and the highest power factor 9.6 × 10⁻² μW/(m·K2) at 18 vol % MWCNTs. Sun et al. [4] reported on poly (vinylidene fluoride) (PVDF) composites filled with MWCNTs or graphite nanoplatelets (GNPs) as solid sample as well as foam. The Seebeck coefficients for solids were found to be 10 µV/K (PVDF/2 or 5 wt % MWCNT) and around 25 µV/K (PVDF/5–15 wt % GNP). Hewitt et al. [5] found values of 10 µV/K for solution cast composites based on PVDF with 20 wt % MWCNTs. For solution cast single-walled CNT (SWCNT)/PVDF films, Hewitt et al. [6] reported Seebeck coefficients between 32 µV/K (5 wt % SWCNT, type HiPco™) and 16 µV/K (100 wt % SWCNT) at room temperature.
Melt-mixed composites of polycarbonate (PC)/MWCNT were studied by Liebscher et al. [7]. When comparing the effect of different surface functionalization of MWCNTs on the TE properties of PC composites, at a constant loading of 2.5 wt %, the highest Seebeck coefficient was found to be 11.3 ± 1.2 μV/K for PC/carboxyl-functionalized MWCNTs (MWCNT-COOH, Nanocyl NC3153), whereas PC with unfunctionalized MWCNT (Nanocyl NC3150) resulted in an S-value of 7.5 ± 0.9 µV/K. PF values varied in dependence on the MWCNT functionalization between 10−3–10−6 µW/m·K2. Furthermore, a cyclic butylene terephthalate (CBT) oligomer was added to successfully improve both the processing behavior and the thermoelectric properties of PC/MWCNTs [8]. An increase of ZT from 10−10 (PC/MWCNT-COOH) to 10−8 (PC/MWCNT-COOH/CBT) could be reached.
More detailed studies on TE properties of melt-mixed composites based on polypropylene (PP) with SWCNTs were presented by Luo et al. [9,10,11,12]. For PP composites with the SWCNT type Tuball (OCSiAl), Seebeck coefficients between 25 and 34 µV/K (0.8–6.0 wt % Tuball) were reported. The highest power factor was found at 0.066 µW/m·K2 (PP/4 wt % Tuball) [10]. A Seebeck coefficient of 36.8 µV/K and a power factor of 0.02 µW/m·K2 were described in [9] for PP composites with 2 wt % Tuball in which copper oxide was added as a second filler with a high S-value. The addition of 2 wt % ionic liquid (IL) to PP/2 wt % SWCNT composites leads to an increase of Seebeck coefficients from 43.2 ± 2.2 µV/K to 63.4 ± 2.8 µV/K and power factors of 0.12 µW/m·K2 (without IL) and 0.26 µW/m·K2 (with IL) [11]. Furthermore, Luo et al. reported ways to generate stable n-type PP composites by adding polyethylene glycol [9,12] or polyoxyethylene 20 cetyl ether [12]. Recently, Tzounis et al. [13] described Seebeck values between 16 µV/K and 55 µV/K for polyetherimide/SWCNT HiPco nanocomposites depending on the molecular structure of the polyetherimide.
No literature about thermoelectric investigation on melt-prepared polyamide (PA), poly (butylene terephthalate) (PBT) or acrylonitrile butadiene styrene (ABS) based composites filled with conductive fillers could found up to now.
Regarding the published results about thermoplastic polymer/CNT composites, it is noticeable that always positive Seebeck coefficients were determined. Furthermore, for pristine SWCNT films, positive S-values are reported, e.g., by Nonoguchi et al. [14] with 49 µV/K and Piao et al. [15] with 39 µV/K (SWCNT from Thomas Swan Co. LTD, Consett, UK). Only recently a study by Paleo et al. [16] reported a negative Seebeck coefficient for melt mixed composites based on PP in which the filler was an industrial high temperature treated carbon nanofiber (CNF) and no additives were added. Seebeck coefficients up to −8.5 μV/K (at 2.4 vol % loading) were reported.
It is a hypothesis that the incorporation of n-type CNTs in thermoplastic polymer matrix leads to n-type polymer composites. The thermoelectric properties of CNT filled composites are interplay of the properties of polymers and CNTs. The n-type doping of SWCNTs is a challenge in terms of doping stability. The literature [14,15,17,18,19,20,21,22] describes different ways of doping, such as polymer wrapping, charge transfer from polymer chains to CNTs, encapsulation of organometallic materials within the nanotubes, doping by salt anions with counter cations or nitrogen incorporation. The stability of the nanotube doping during further processing plays an important role. Especially, the replacement of C atoms in the hexagonal lattice of nanotube walls by, e.g., nitrogen is a suitable way to reach long-term stable doped nanotubes. Dörling et al. [22] reported that the addition of n-type nitrogen-doped CNTs in p-type poly(3-hexylthiophene) (P3HT) matrix leads to n-type composites. This behavior was explained by polymer wrapping along or around the CNTs due to van der Waals interactions, especially if the polymer contains aromatic groups. Depending on the polymer type, the formation of specific π–π interactions between aromatic groups of polymers and nanotubes is possible, leading to improved electronic transport properties in the composites [23]. From the doping point of view, PVDF, PC, poly(methyl methacrylate) (PMMA), poly(vinyl alcohol) (PVA) and polystyrene (PS) are formed from polymer chains that possess neither electron-withdrawing groups nor electron-donating groups. As reported in a study by Piao et al. [15], for SWCNT buckypapers having p-type character which were infiltrated with polymer solutions of the mentioned polymers, the Seebeck coefficient increased from 38 µV/K up to around 50 µV/K due to polymer penetration by sacrificing the electrical conductivity. In contrast, if the SWCNT buckypapers were infiltrated with solutions of poly(vinyl pyrrolidone) (PVP), poly(ethylene imine) (PEI), or N,N,N′,N′-tetramethyl-p-phenylenediamine (TMPD) the S-values switched to negative values up to −40 µV/K [15]. This behavior was explained by a shift of the Fermi level.
Based on our previous work on PC with MWCNTs and PP with SWCNTs, the aim of this study was to show the effects of CNT type, polymer type, and CNT content on electrical conductivity, Seebeck coefficient (S), and the resulting power factor and figure of merit ZT. Different commercially available CNTs as well as N-doped MWCNTs synthesized in different laboratories were used to produce melt-mixed composites with various thermoplastic polymers on a small scale. Both p-type CNTs (electron-withdrawing) and n-type CNTs (electron-donating) were used to produce composites with positive or negative Seebeck coefficient. Relationships between CNT content, electrical conductivity and the Seebeck coefficient were evaluated. The main question was whether there are design rules for producing not only p-type composites, which have been the major part of all the literature reports so far, but also tailor-made stable n-type composites without additives by simple variation of matrix and CNT type.

2. Materials and Methods

As polymer matrices eight different thermoplastic polymers were applied (Table 1). The polymer matrices differ in polarity, crystallinity, and molecular structure.
The carbon nanotubes selected for this study (Table 2) differ in their number of walls (SWCNT or MWCNT), structure (branched MWCNT or linear), and doping (nitrogen-doped or undoped) to identify influencing factors for thermoelectric applications. Their properties can be seen from the references given in Table 2 [24,25,26,27,28,29,30]. Among the SWCNT materials, according to the datasheets TuballTM SWCNTs have a mean diameter of 1.6 nm [24], whereas HiPco® SWCNTs of 0.8–1.2 nm [27]. Furthermore, the length is different, Tuball has a length >5 μm, while HiPco lengths are between 0.1 μm and 1 μm. This leads to a three times higher aspect ratio of Tuball compared to HiPco. The carbon content in Tuball is >85 wt %, that in HiPco >95 wt %.
Carbon nanotube buckypapers were produced by dispersing 125 mg CNTs in 100 mL chloroform for 10 min using ultrasonic treatment (UP400S, Hielscher Ultrasonics GmbH, Teltow, Germany; 60% amplitude, cycle 1, sonotrode H3). The dispersion was placed on a polytetrafluoroethylene (PTFE) filter and the solvent is sucked off. The buckypaper was then dried at 40 °C in an oven and lifted from the filter paper to obtain a free-standing film.
Melt mixing of composites was performed in a small-scale conical twin-screw micro compounder DSM15 (Xplore Instruments BV, Sittard, The Netherlands) having a volume of 15 ccm. The melt mixing conditions are summarized in Table 3.
The composites were compressing molded to plates having a diameter of 60 mm and a thickness of 0.3 mm using the hot press PW40EH (Paul-Otto Weber GmbH, Remshalden, Germany). The pressing conditions are summarized in Table 3. Strips cut from such plates were used for measurements of electrical resistivity as well as thermoelectric properties.
The Seebeck coefficient (S) and electrical volume resistivity were determined using the self-constructed equipment TEG at Leibniz-IPF [31]. The measurements were performed at 40 °C with temperature differences between the two copper electrodes up to 8 K. For the measurements on composites and buckypapers, the strips were painted with conductive silver at their ends. Since it was not possible to produce stable free-standing buckypapers for all CNT types, TE measurements were also carried out on CNT powders. For the measurement on powders, the CNTs were filled in a PVDF tube (inner diameter 3.8 mm, length 16 mm) which is closed with copper plugs (see Figure 1). The final CNT package has a length of 6 mm. The length of the entire double-T-test specimen is 30 mm. This double T-shaped specimen was clamped between the copper electrodes so that the copper plugs have direct planar contact with the copper electrodes of measurement device. Depending on the kind of CNTs and their bulk density, 0.01–0.04 g powder was used. The volume resistivity of all samples was measured using a 4-wires technique. The measurement of voltage and resistance was performed using the Keithley multimeter DMM2001 (Keithley Instruments, Cleveland, OH, USA). The values given represent mean values of three measurements. The figure of merit ZT was calculated using a value of thermal conductivity of the composites of 0.28 W/(m·K) which was obtained in many pre-investigations as a proper mean value of thermoplastic polymers filled with a low CNT content (between 0 and 5 wt %) [32,33].

3. Results and Discussion

3.1. Thermoelectrical Properties of Nanotube Buckypapers and Powder Packages

The first step was to characterize the thermoelectric properties of carbon nanotubes themselves (Table 4). It is assumed that the differences in the characteristics of the CNTs will certainly be reflected in the TE performance of the composites. It should be determined whether the CNTs are n- or p-type materials indicated by a negative or positive Seebeck value, respectively.
For buckypapers (BP) of NC7000, CNS-PEG, Tuball, and HiPco, a positive Seebeck coefficient could be measured and the values were between 8.0 and 37.4 µV/K. These values are slightly lower than those reported by Nonoguchi et al. [14] (49 µV/K) and Piao et al. [15] (39 µV/K) for thin SWCNT (Thomas Swan & Co. LTD, Crockhall, Consett, UK) films. The Seebeck coefficient of the HiPco buckypaper (28.6 µV/K) is higher than the value of ca. 16 µV/K reported by Hewitt et al. [6] for a buckypaper prepared from HiPco (raw material, purified by the authors). Measurements of the Seebeck coefficients on nanotube powders (P) resulted in slightly different values but of the same magnitude. This difference is assigned to a different CNT packing density of the nanotubes in the buckypaper or in the compressed nanotube packing.
As expected, after the incorporation of electron-donating nitrogen in the CNT structure [34], a negative Seebeck coefficient of buckypapers as well as powders was determined for the laboratory synthesized nitrogen-doped MWCNTs N-A1 and N-IFW. In order to verify these results, a buckypaper made of commercially available nitrogen-doped MWCNT N400 was measured, also resulting in a negative S coefficient. The measurements made on nanotube powders resulted in negative S-values, whereby the one on MWCNTs N-IFW led to the highest negative number amount of −12.9 μV/K.
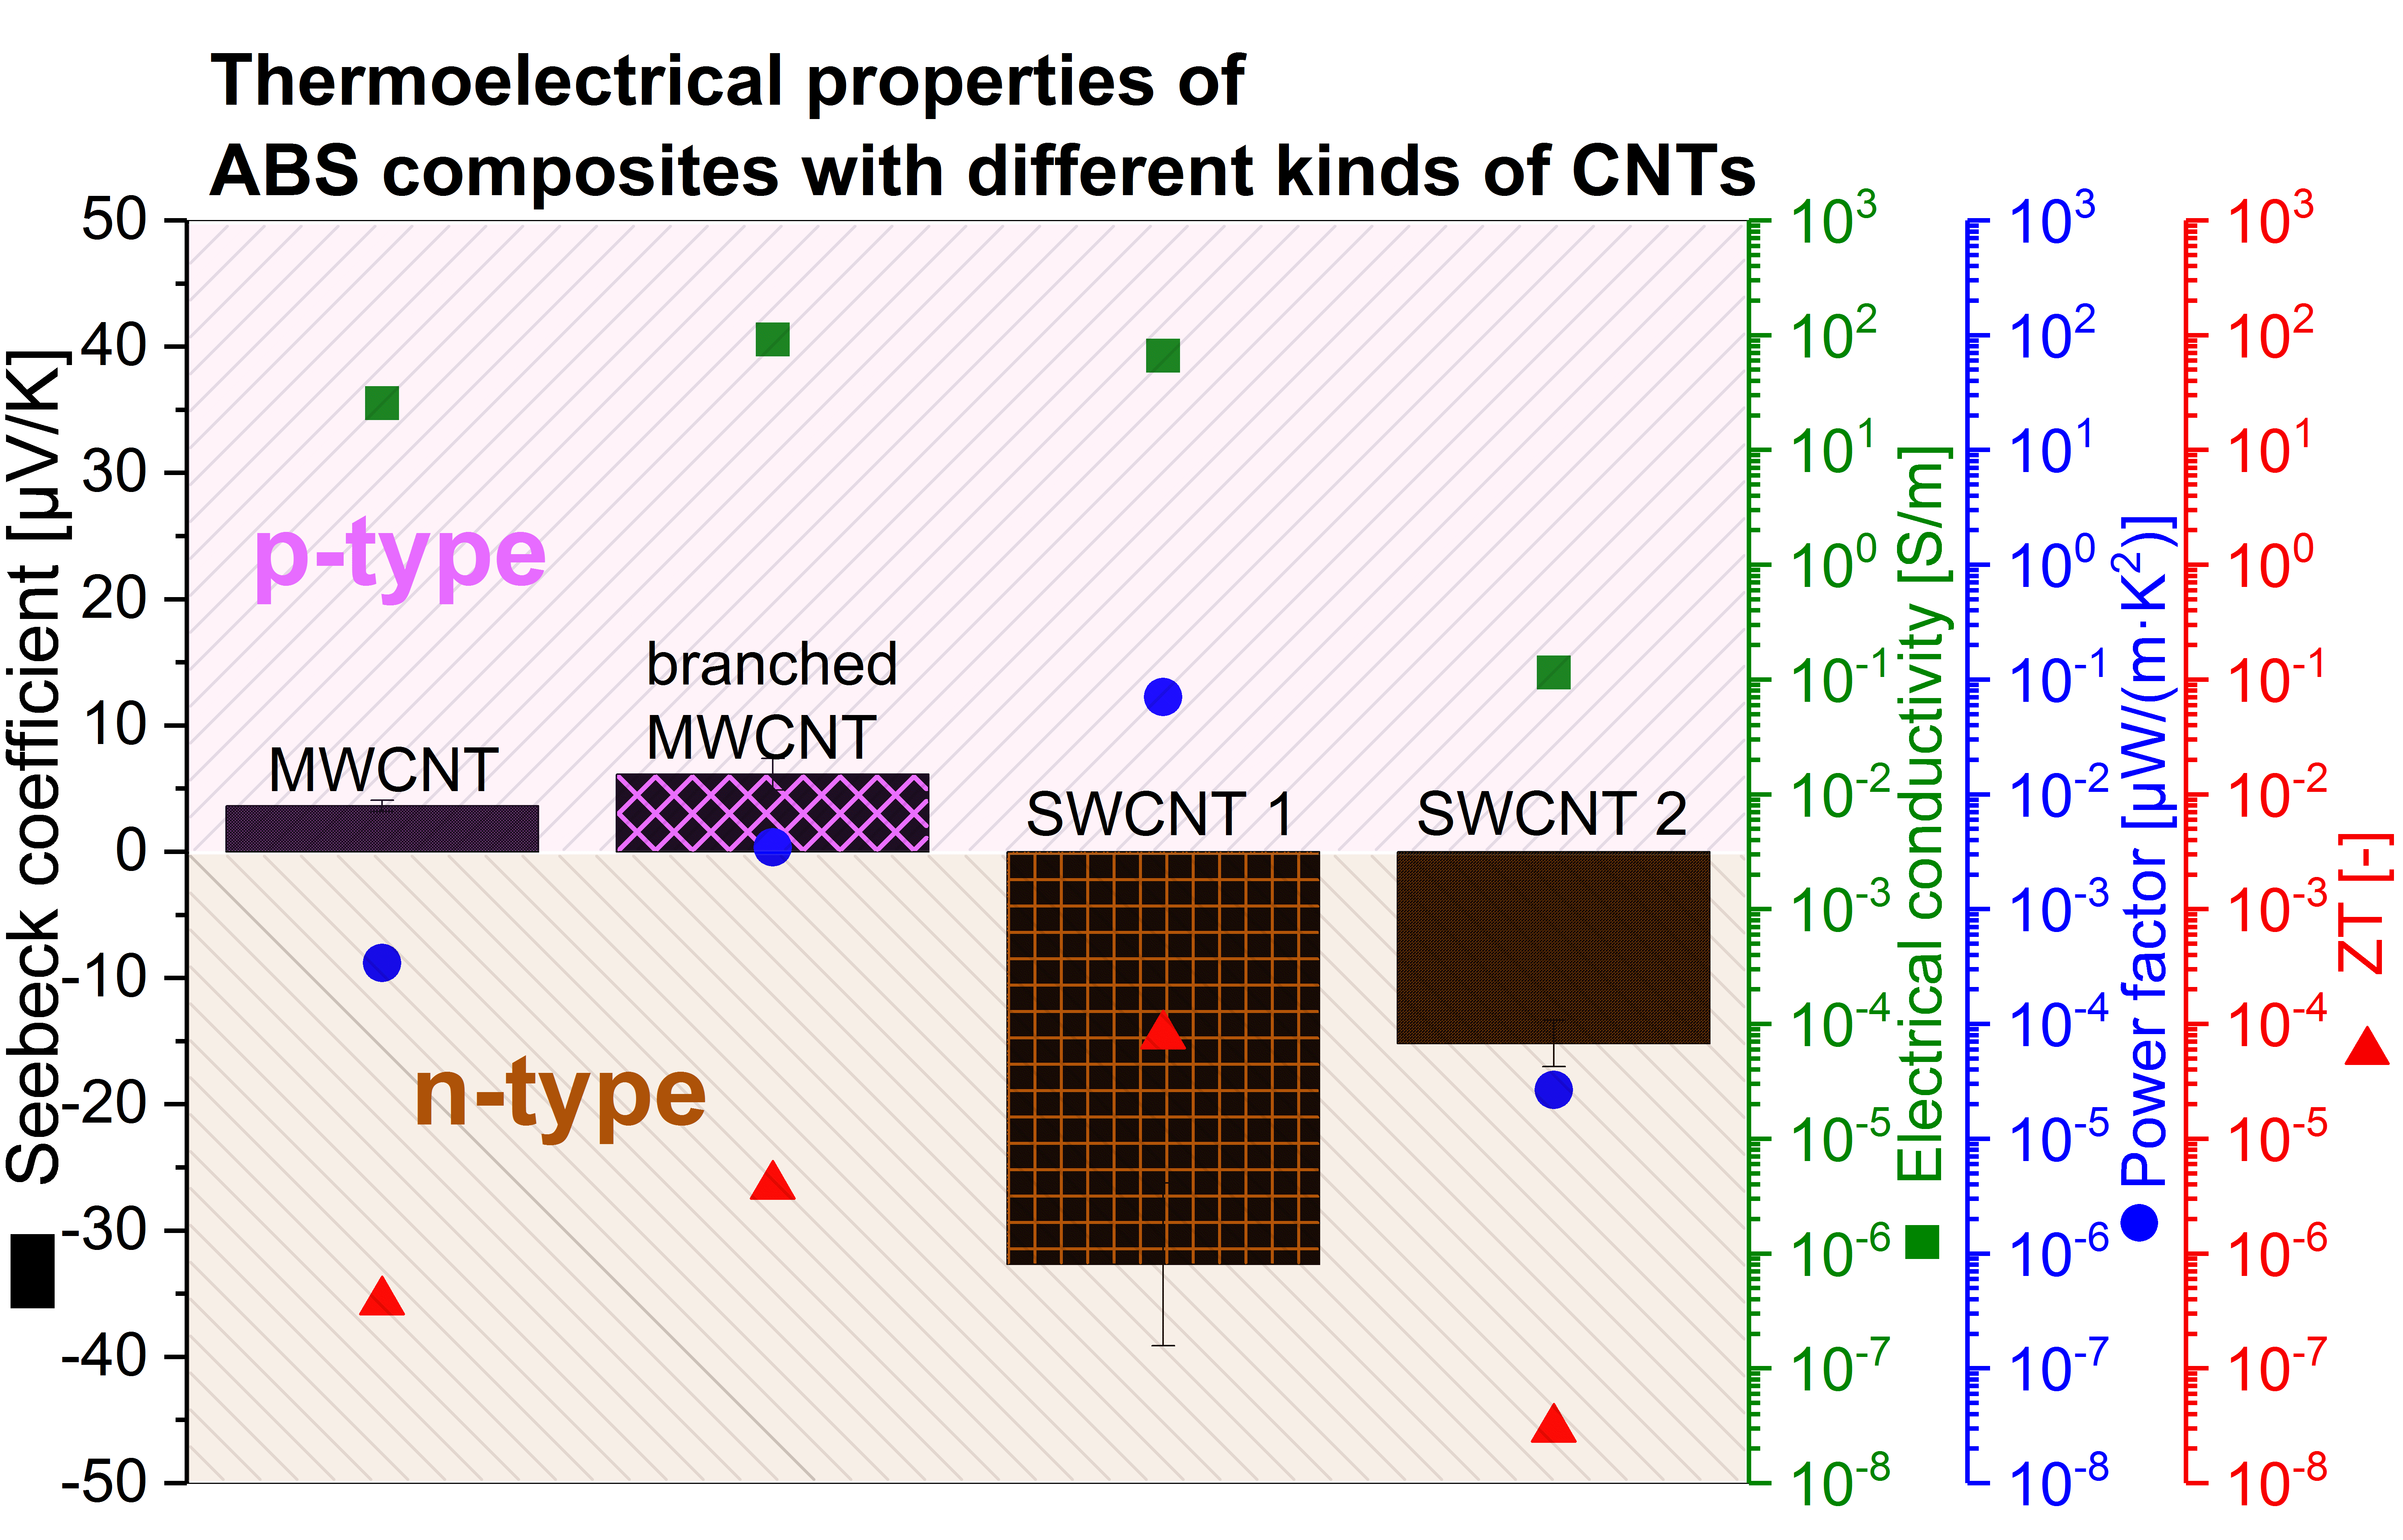
When comparing the values of the different buckypapers, SWCNTs show higher values of the Seebeck coefficients than MWCNTs. This is in accordance with the discussion in the literature and given by the semimetallic nature of MWCNTs versus the combination of chiralities in SWCNTs ranging from semiconducting to metallic [21]. Among the SWCNTs, the buckypaper consisting of SWCNT Tuball showed a higher Seebeck coefficient of 37.4 μV/K as well as power factor of 59.2 µW/m·K2. The difference is expected to result from the different structural characteristics of both SWCNTs. All thermoelectric values of SWCNT Tuball are much higher than the values of the other buckypapers. This order is also reflected when comparing the values measured on nanotube powders.
Next to the Seebeck coefficients, the electrical conductivity also behaves differently between the different CNT types. The buckypapers result in higher values than the CNT powder packages, SWCNTs show higher values than MWCNTs, and the highest value of more than 40,000 S/m was measured for the SWCNT Tuball buckypaper.

3.2. Thermoelectric Properties of Polymer Composites Filled with Different Kinds of Nanotubes

The thermoelectrical properties of CNT filled composites can be regarded as interplay of the thermoelectric properties and the CNT network formed in a given matrix and a possible charge transfer from the polymer matrix to the CNTs. Thus, it can be expected that the same nanotubes forming networks in different matrices can have different charge carrier behavior.
The results for composites based on different polymer matrices with 2 wt % of different CNTs are summarized in Figure 2, Figure 3, Figure 4 and Figure 5 and 
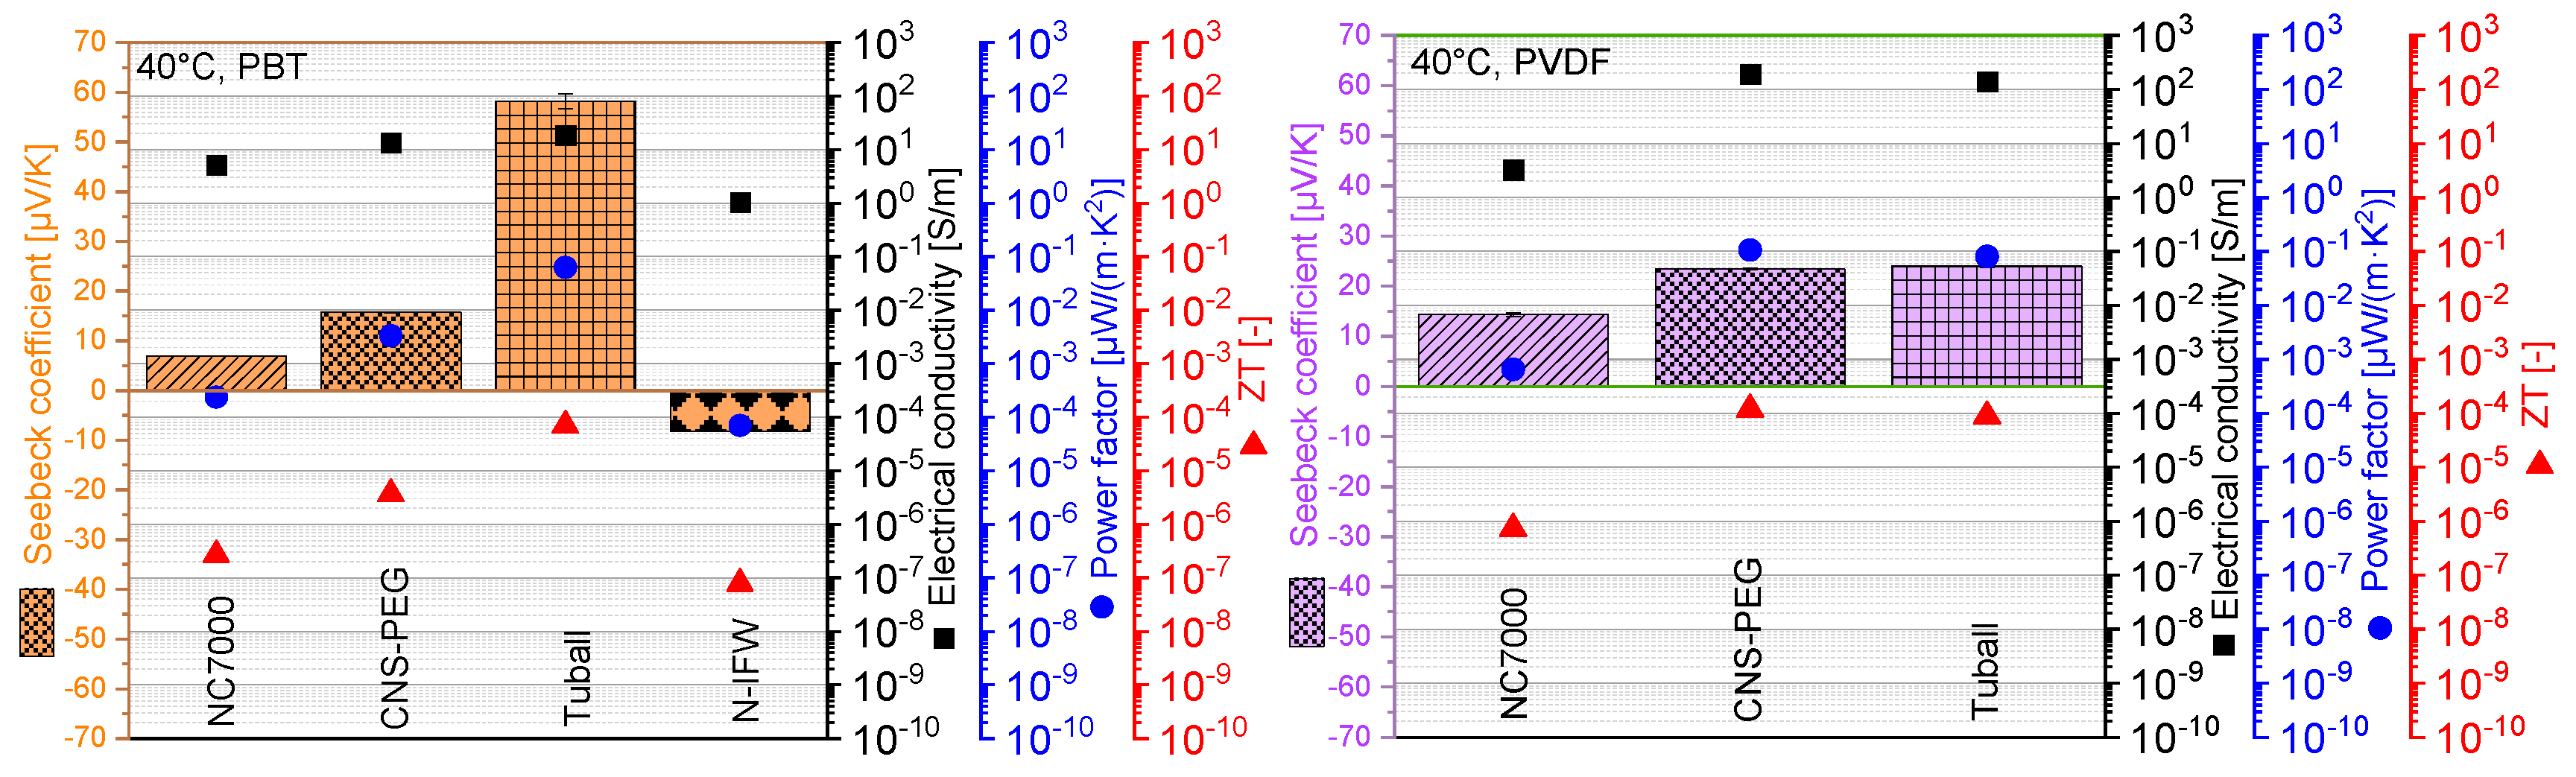
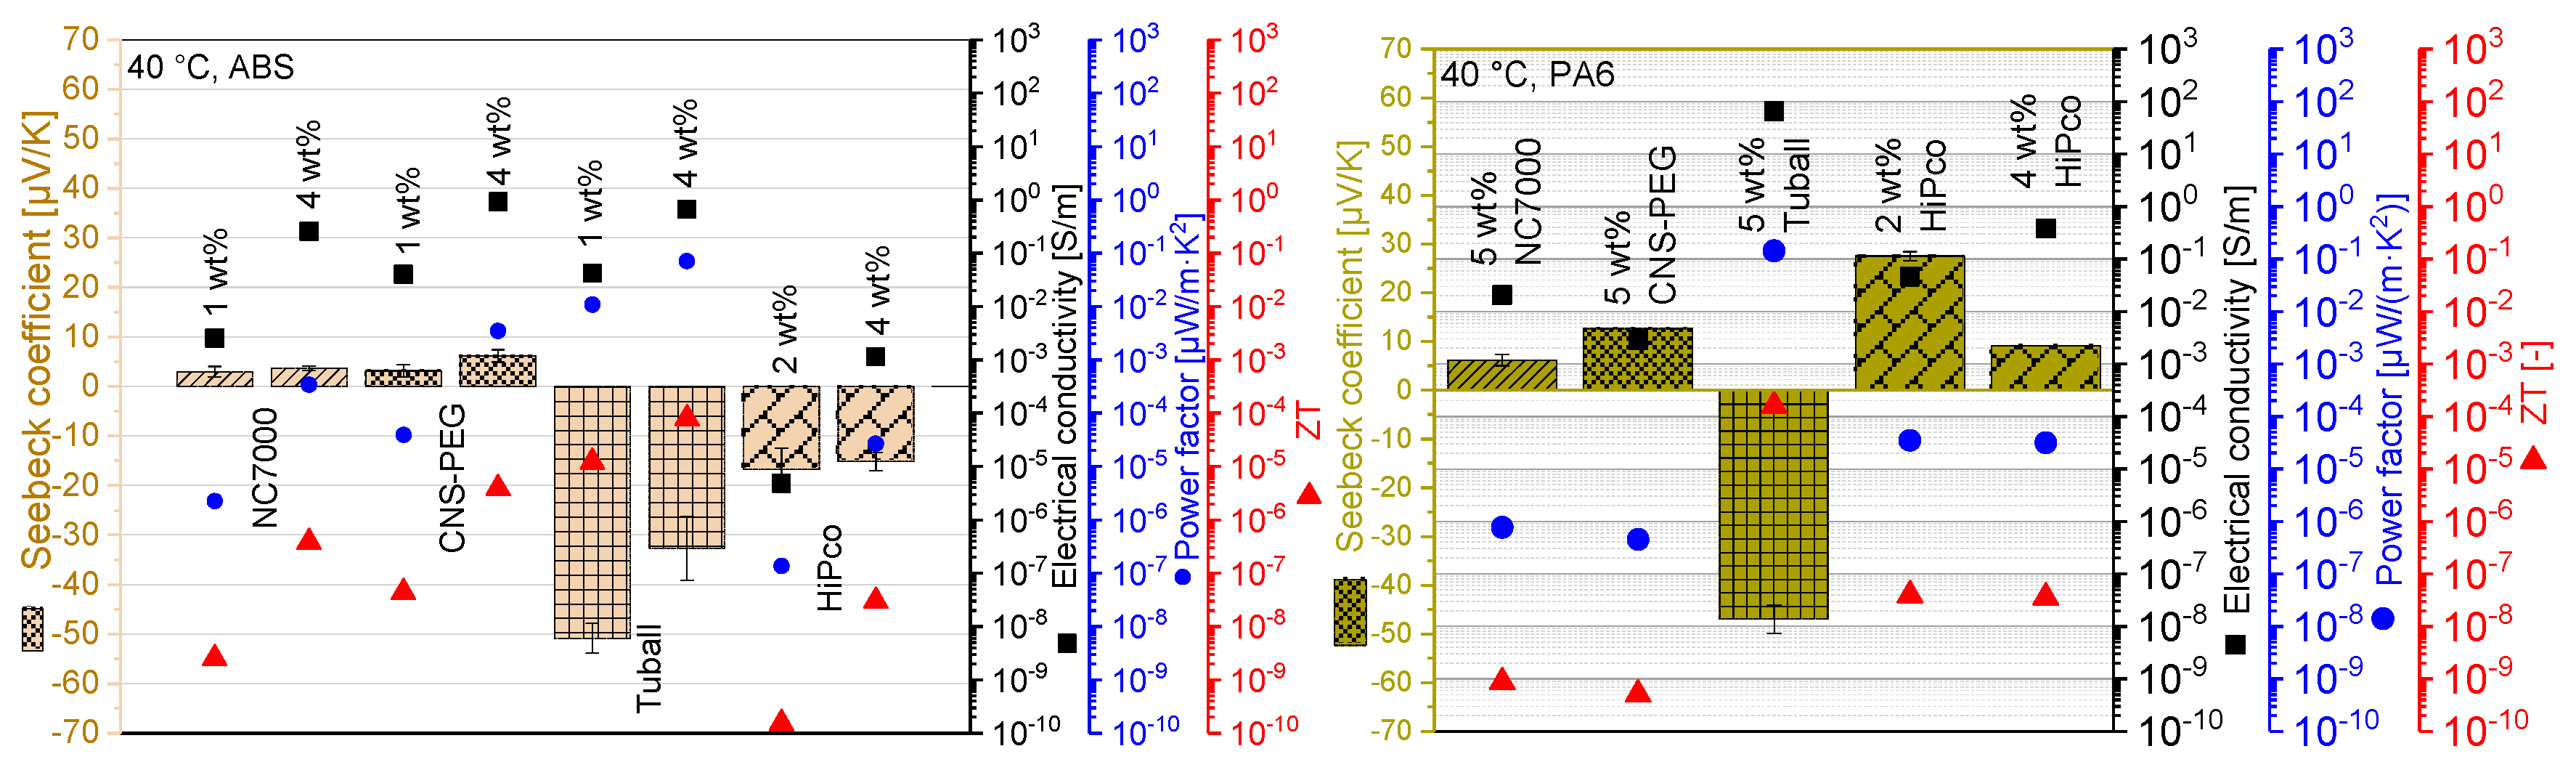
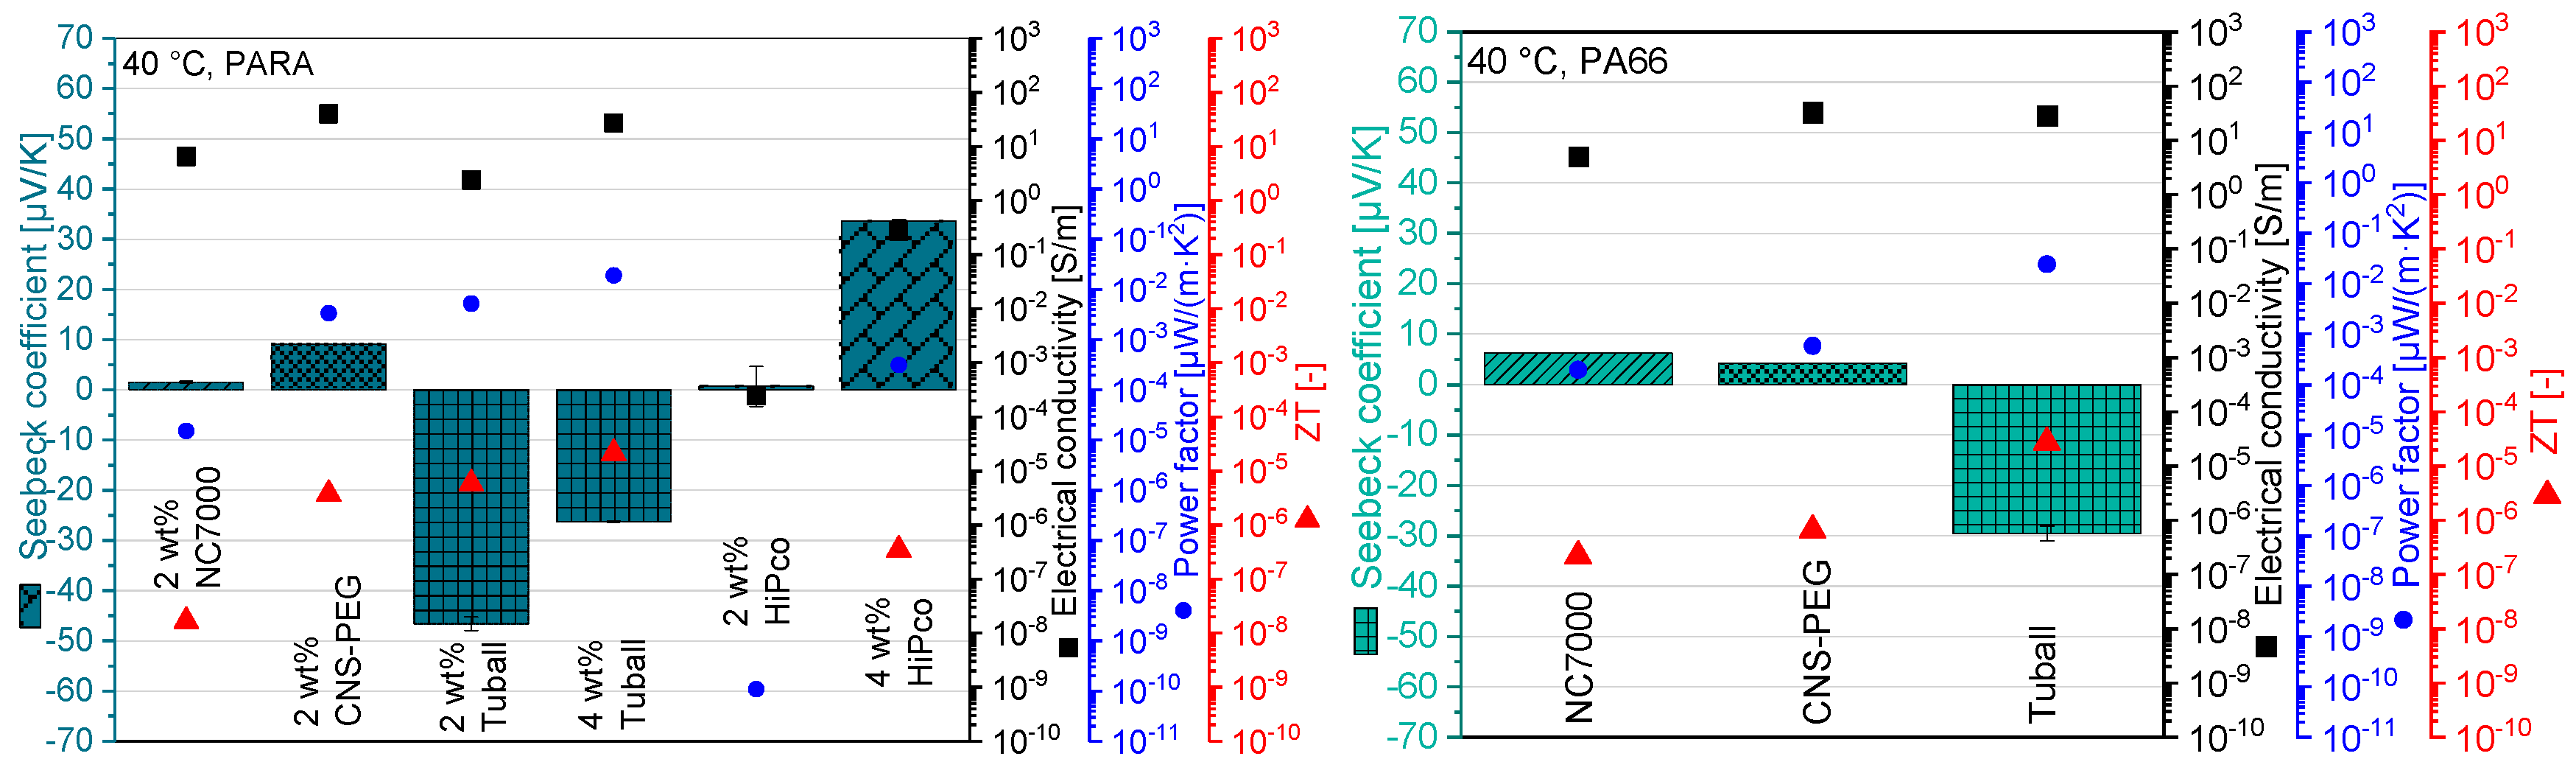
Table 5. For ABS and PA6, additional results are shown for different CNT contents. It was found that all composites containing MWCNTs NC7000 or CNS-PEG exhibit a positive Seebeck coefficient whereby the S-values for polymer/CNS-PEG composites are always higher than those for composites with NC7000. This result correlates with the higher S-value of buckypaper based on CNS-PEG than the one made of NC7000.
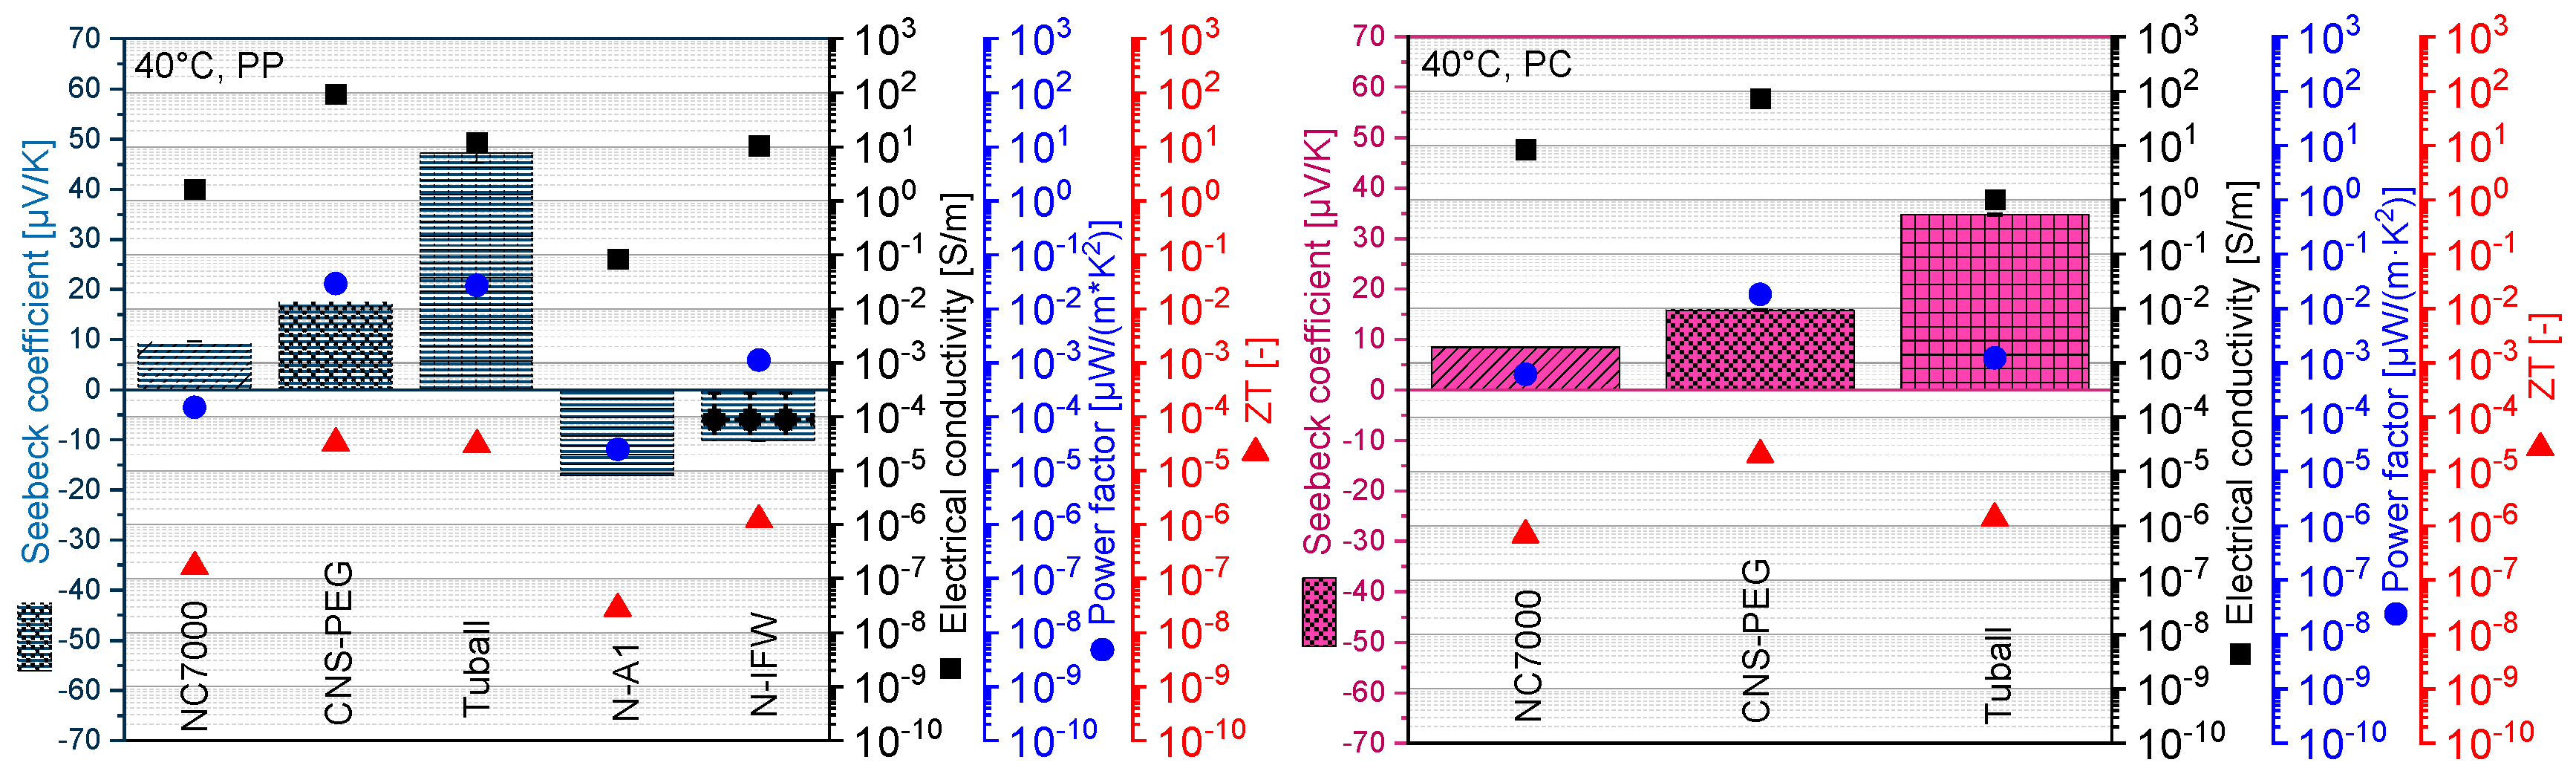
At the same CNT content of 2 wt % in the composites, the addition of SWCNT Tuball resulted in either positive or negative Seebeck coefficients, depending on the matrix polymer. In PBT, PVDF, PP and PC, positive Seebeck coefficient values were found which exceed the values for the corresponding composites with both MWCNTs (Figure 2 and Figure 3). The higher magnitude of the Seebeck coefficients in the SWCNT Tuball based composites is in accordance with its highest value among all buckypapers. In ABS, PA6, PARA and PA66, negative Seebeck coefficients of relatively high magnitude (−30 to −51 μV/K) were reached. Variation of the SWCNT Tuball content, as performed in ABS and PARA, resulted in higher (less negative) values with increasing Tuball loading. Based on the positive Seebeck coefficient of the Tuball buckypaper and the previously published values for composites containing SWCNTs (in matrices different than those used here), this behavior was unexpected and not yet been described in the literature. The Tuball material is characterized by the highest electrical conductivity and the highest Seebeck coefficient of the buckypaper (equivalent to 100% CNTs). Based on that, the power factor PF of the SWCNT Tuball buckypaper showed by far the highest value.
The addition of SWCNT HiPco, only studied in ABS, PA6 and PARA resulted in negative values in ABS, but positive values in PA6 and PARA. This was proven at two different SWCNT contents, namely 2 and 4 wt %. Thereby, higher SWCNT HiPco content decreased the (positive) Seebeck coefficient in PA6 but increased it in PARA. In ABS the (negative) Seebeck coefficient gets higher (less negative) when the SWCNT content is increased.
If n-type N-MWCNTs are included in the comparison, as studied for PBT and PP, according to the n-type of those buckypapers all composites show negative Seebeck coefficients. This indicates that the n-type character of the N-MWCNTs dominates the composite TE properties even though the three polymers were p-type materials. Thereby, the achieved values are in the range between −8.2 μV/K (PBT) and −17.3 μV/K (PP) (Table 5). A direct comparison was made between 2 wt % N-A1 and N-IFW in PP based composites whereby the tubes N-A1 resulted in more negative values (Figure 3 left, Table 5).
In addition, the electrical network structure of the CNTs in the composite is important for the TE properties. The comparison of the same CNT kind in different matrices shows that the TE properties are also significantly dependent on the polymer type. For example, the Seebeck for composites filled with 2 wt % NC7000 varied between 1.5 µV/K (PARA, 6.3 µV/K (PA66), 6.8 µV/K (PBT), 8.5 µV/K (PC), 9.5 µV/K (PP) up to 14.3 µV/K (PVDF) (see Table 5). It has to be considered that the different composites may have different states of the conductive network, as the processing conditions were different which are known to significantly influence the state of the CNT dispersion and network formation [35,36]. In addition, the interactions between the polymer types and the CNTs are different. This results in different nanotube dispersibility and dispersion. The relationship between the amount of non-dispersed CNTs (determined using transmission light microscopy at 1 vol % loading of MWCNTs Baytubes C150 HP, Bayer Material Science, Leverkusen, Germany) and the calculated interfacial energy between CNTs and some polymers is described by Kasaliwal et al. [36]. The comparison showed very low interfacial energy and good macrodispersion for PA66 and PC, but worse dispersion and higher interfacial energy for PP. One also may argue that the distance between the actual used CNT concentration of 2 wt % and the electrical percolation threshold concentration are different when using the various polymer matrices, so that the composites are compared at different network states.
The electrical percolation threshold reflects the state of the dispersion of conductive fillers and is generally lower with better dispersion. The electrical percolation thresholds of the studied composites with NC7000, CNS-PEG and SWCNT Tuball are summarized in Table 6.
The trend is that the electrical percolation thresholds for composites with NC7000 are typically higher than for the other two CNT types (CNS-PEG, Tuball). Even if the percolation thresholds between the different MWCNTs in the same polymer or the same CNTs in different polymers differ strongly, it can be seen that the TE investigations presented were carried out on composite materials whose CNT concentrations were clearly above the respective electrical percolation threshold. The influence of CNT content on TE properties is discussed for selected matrices (PBT and ABS) in more detail in Section 3.3.
Interestingly, for the composites filled with SWCNTs Tuball and HiPco, which showed positive Seebeck coefficients in the form of buckypaper, positive and negative Seebeck coefficients were measured in the composite materials depending on the polymer type. For Tuball, a positive S-value was determined if PBT, PVDF, PP or PC were the polymer matrix. For composites based on ABS, PA6, PARA or PA66 a negative value was detected. For HiPco negative values were only achieved in ABS, but positive in PA6 and PARA. It can be assumed that electron doping occurs in the interaction between SWCNTs and these polymers, but to a different extent when comparing both SWCNT types.
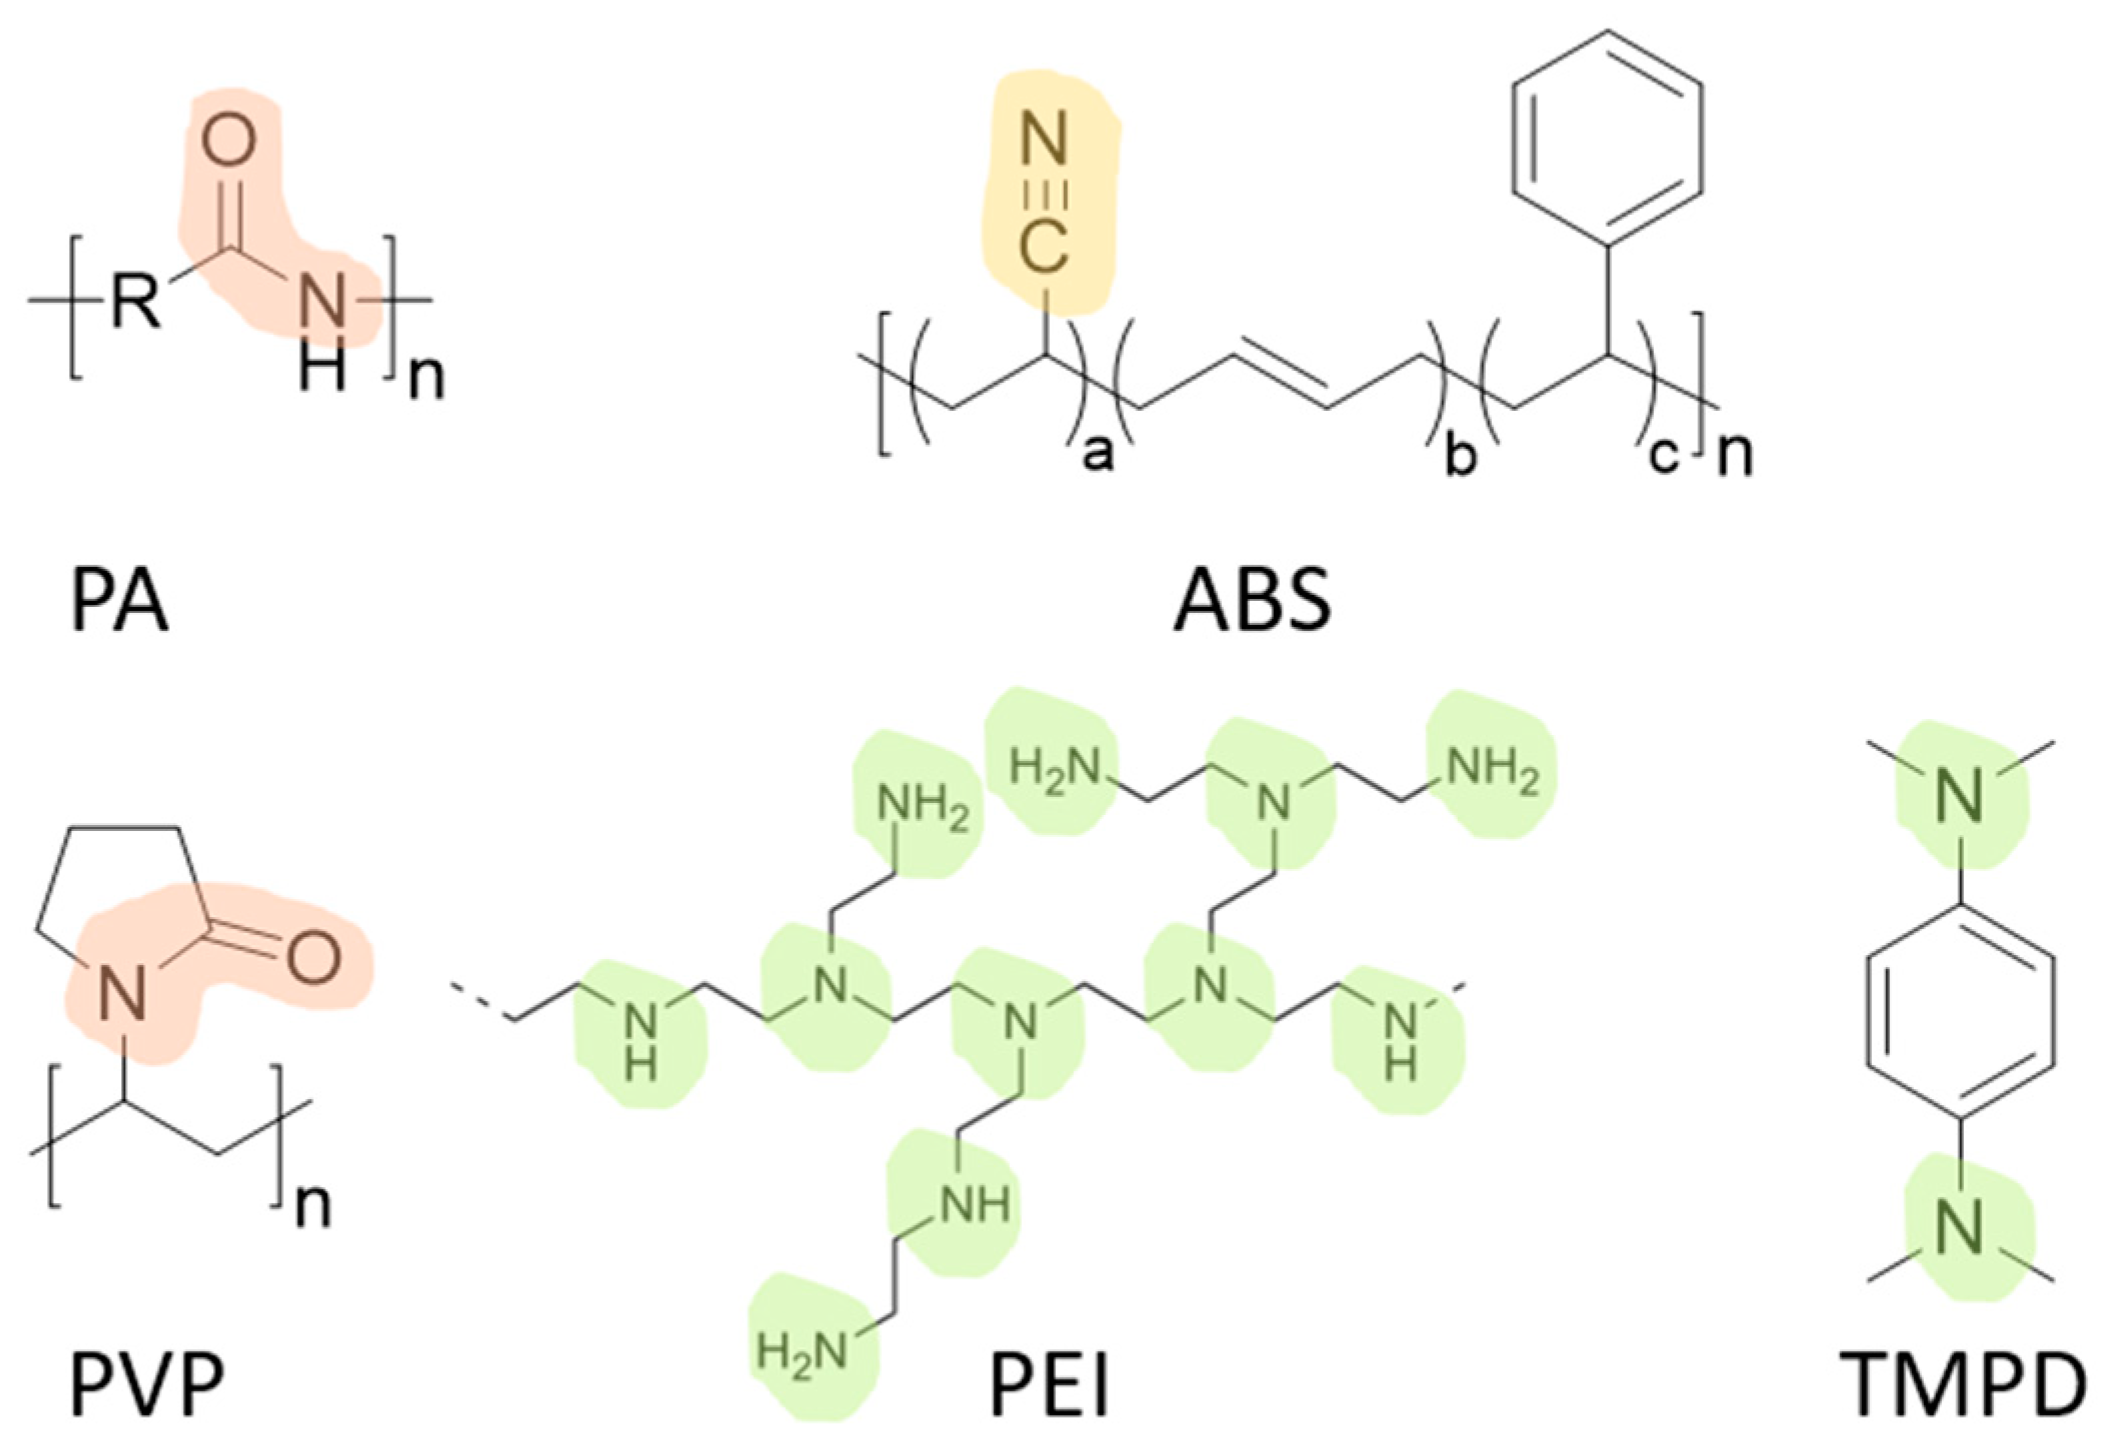
An explanation for this doping effect could lie in the molecular structure of the polymers that is shown for PA and ABS in Figure 6. For the different polyamide types, the amide group which has one free electron pair at nitrogen and two free electron pairs at oxygen is considered for electron donation. In ABS, the nitrile group consisting of carbon and triple-bound nitrogen could serve as an electron supplier. Both the amide group and the nitrile group have very electron-rich regions due to the multiple bonds between the atoms and the free electron pairs. The planar spatial arrangement of the groups can also contribute to the high electron density leading to doping of the CNTs. The assumption that the amide group can play a key role in the doping of CNTs by the polymer is also supported by results from Piao et al. [15]. The authors showed that the Seebeck coefficient of SWCNT (product of Thomas Swan Co. LTD, Consett, UK) films infiltrated with poly(vinyl pyrrolidone) (PVP) or poly(ethylene imine) (PEI) show negative Seebeck coefficients (around −40 µV/K) even though the pristine SWCNT buckypaper had a positive Seebeck coefficient (+39 µV/K). Both PVP and PEI contain molecular elements like amid groups, which also appear in PA in each repeat unit (Figure 6). The treatment of the SWCNT network with N,N,N′,N′-tetramethyl-p-phenylenediamine (TMPD) (structure see Figure 6) leads also to a negative S-value with a lower magnitude of −3 µV/K [15]. Thus, the switching from p-type buckypapers to n-type infiltrated buckypapers was achieved only with molecules containing amide or amine groups. This indicates that the SWCNT doping is connected with the electron-donating effect of these nitrogen containing groups. All other infiltrated buckypapers studied by Piao et al. [15] led to positive S-values, whereby the molecular structures of the used polymers did not contain nitrogen groups. From this, a clear correlation can be shown with the results of the present study. Positive S-values were obtained for all polymers which do not contain an amide group in their molecular structure, namely PBT, PP, PC and PVDF. Only for the polyamides (PA6, PA66, PARA) and ABS the switching from p-type to n-type was observed using SWCNT Tuball. The different kinds of PA contain amid groups. ABS contains a nitrile group instead of an amide group. Interestingly, for SWCNT HiPco such a switching only took place in ABS, which indicates a different degree of interaction with or electron donation through the PA matrices compared to SWCNT Tuball. More investigations are needed to study the influence of the structural parameters of SWCNTs on this behavior. To our knowledge, it has not yet been researched which parameters are decisive for thermoelectric properties in general and which for the doping efficiency of polymers.
Such doping behavior of nitrogen-containing polymer matrices on CNTs was only observed in the case of SWCNTs. It is assumed that the electron donating is only effective if only one wall is involved. For MWCNTs with typically eight to 12 walls, electron donation is much less efficient and there is no conversion to n-type composites.
In addition to the Seebeck coefficient S, the power factor PF and figure of merit ZT are important for the evaluation of the TE properties of composites. The highest power factors in this screening were found for PVDF/2 wt % CNS-PEG at 0.1063 µW/m·K2 and for PA6/5 wt % Tuball at 0.1425 µW/m·K2. Such high PF values for melt compounded CNT polymer composites were only published by Luo et al. for a PP/4 wt % SWCNT composite with 0.066 µW/m·K2 (PP/4 wt % SWCNT) [10] or 0.12 µW/m·K2 (PP/2 wt % SWCNT) [11]. ZT values of 1.2E-4 (PVDF/2 wt % CNS-PEG) and 1.6E-4 (PA6/5 wt % Tuball) can be calculated from these PF values.
For composites based on PP, PC, and PVDF, a comparison with TE properties reported in the literature is possible. Comparing the values of PP/2 wt % Tuball composites to the reported values, in our study a slightly higher Seebeck coefficient (47.2 µV/K vs. 43 µV/K [11]) and lower power factor (0.027 µW/m·K2 vs. 0.12 µW/m·K2 [11]) were found. In addition, Luo et al. [11] described the influence of the functionalization of Tuball on the TE properties of PP/2 wt % SWCNT composites by comparing batches of unfunctionalized Tuball materials (batches A and B) with a batch which was plasma oxidized (batch mA). The Seebeck coeffiecient varied between 23.2 μV/K (for CNTs batch A), 43 μV/K (for CNTs batch B) and 35.6 μV/K (for CNTs batch mA) and PF between 0.009 µW/m·K2 (batch A), 0.12 µW/m·K2 (batch B) and 0.01 µW/m·K2 (batch mA). These TE results show that both batch and functionalization have an impact on TE results.
For PC/2 wt % CNT composites, in our study Seebeck coefficients between 8.5 and 34.8 µV/K were determined (Figure 3 right, Table 5). Compared to PC/2.5 wt % unfunctionalized MWCNT composites as reported by Liebscher et al. [7] to have an S-value of 7.5 ± 0.9 µV/K, our results are higher. Furthermore, the PF values of our composites are higher compared to the reported one in reference [7]. Comparing the S-values of CNT buckypapers and PC/CNT composites, for all three CNT types the S-values were only slightly different indicating that each composite well reflects the value of the buckypaper. This finding correlates with the results of Piao et al. [15] on SWCNT buckypapers infiltrated with PC where the value of the buckypaper was hardly changed.
The TE results for PVDF/CNT composites can be compared with some values from the literature. Sun et al. [4] used the same type of PVDF and MWCNTs and the same preparation method for composites, namely melt compounding using a microcompounder DSM15 but with different melt mixing conditions than in our study. The measured S-values with 10 µV/K are slightly lower than in our investigation with 14.3 µV/K. It can be concluded that when using the same raw materials (PVDF, MWCNT), sample preparation plays also a role in the TE properties. It has been known for some time that both the melt mixing conditions and the compression molding conditions strongly influence the formation of the conductive network [35,41,42]. Hewitt et al. [5] described multilayered fabrics in which the p- and n-type layers were fabricated by solution mixing of CNTs with PVDF. The authors name a similar room temperature Seebeck coefficient of 10.05 µV/K for PVDF/95 wt % p-type CNTs and of about 30 µV/K for films with 20 wt % CNT loading. When using n-type CNTs, a room temperature value of −5.04 µV/K is reported for the n-type film. In [6], the same authors report for solution processed PVDF with SWCNT HiPco (raw material, purified by the authors), room temperature values of about 32 µV/K at 5 wt % loading and lower values at increasing SWCNT content. Comparing the S-values of the CNT buckypapers and PVDF/CNT composites, for both MWCNT types the S-value increases with incorporation in the PVDF matrix. This finding correlates with the results of polymer infiltrated SWCNT buckypaper as reported in [15]. However, for SWCNT Tuball, in our study, the PVDF/2 wt % composite shows with 24.0 µV/K a lower Seebeck coefficient than the buckypaper (37.4 µV/K) which does not follow this line.
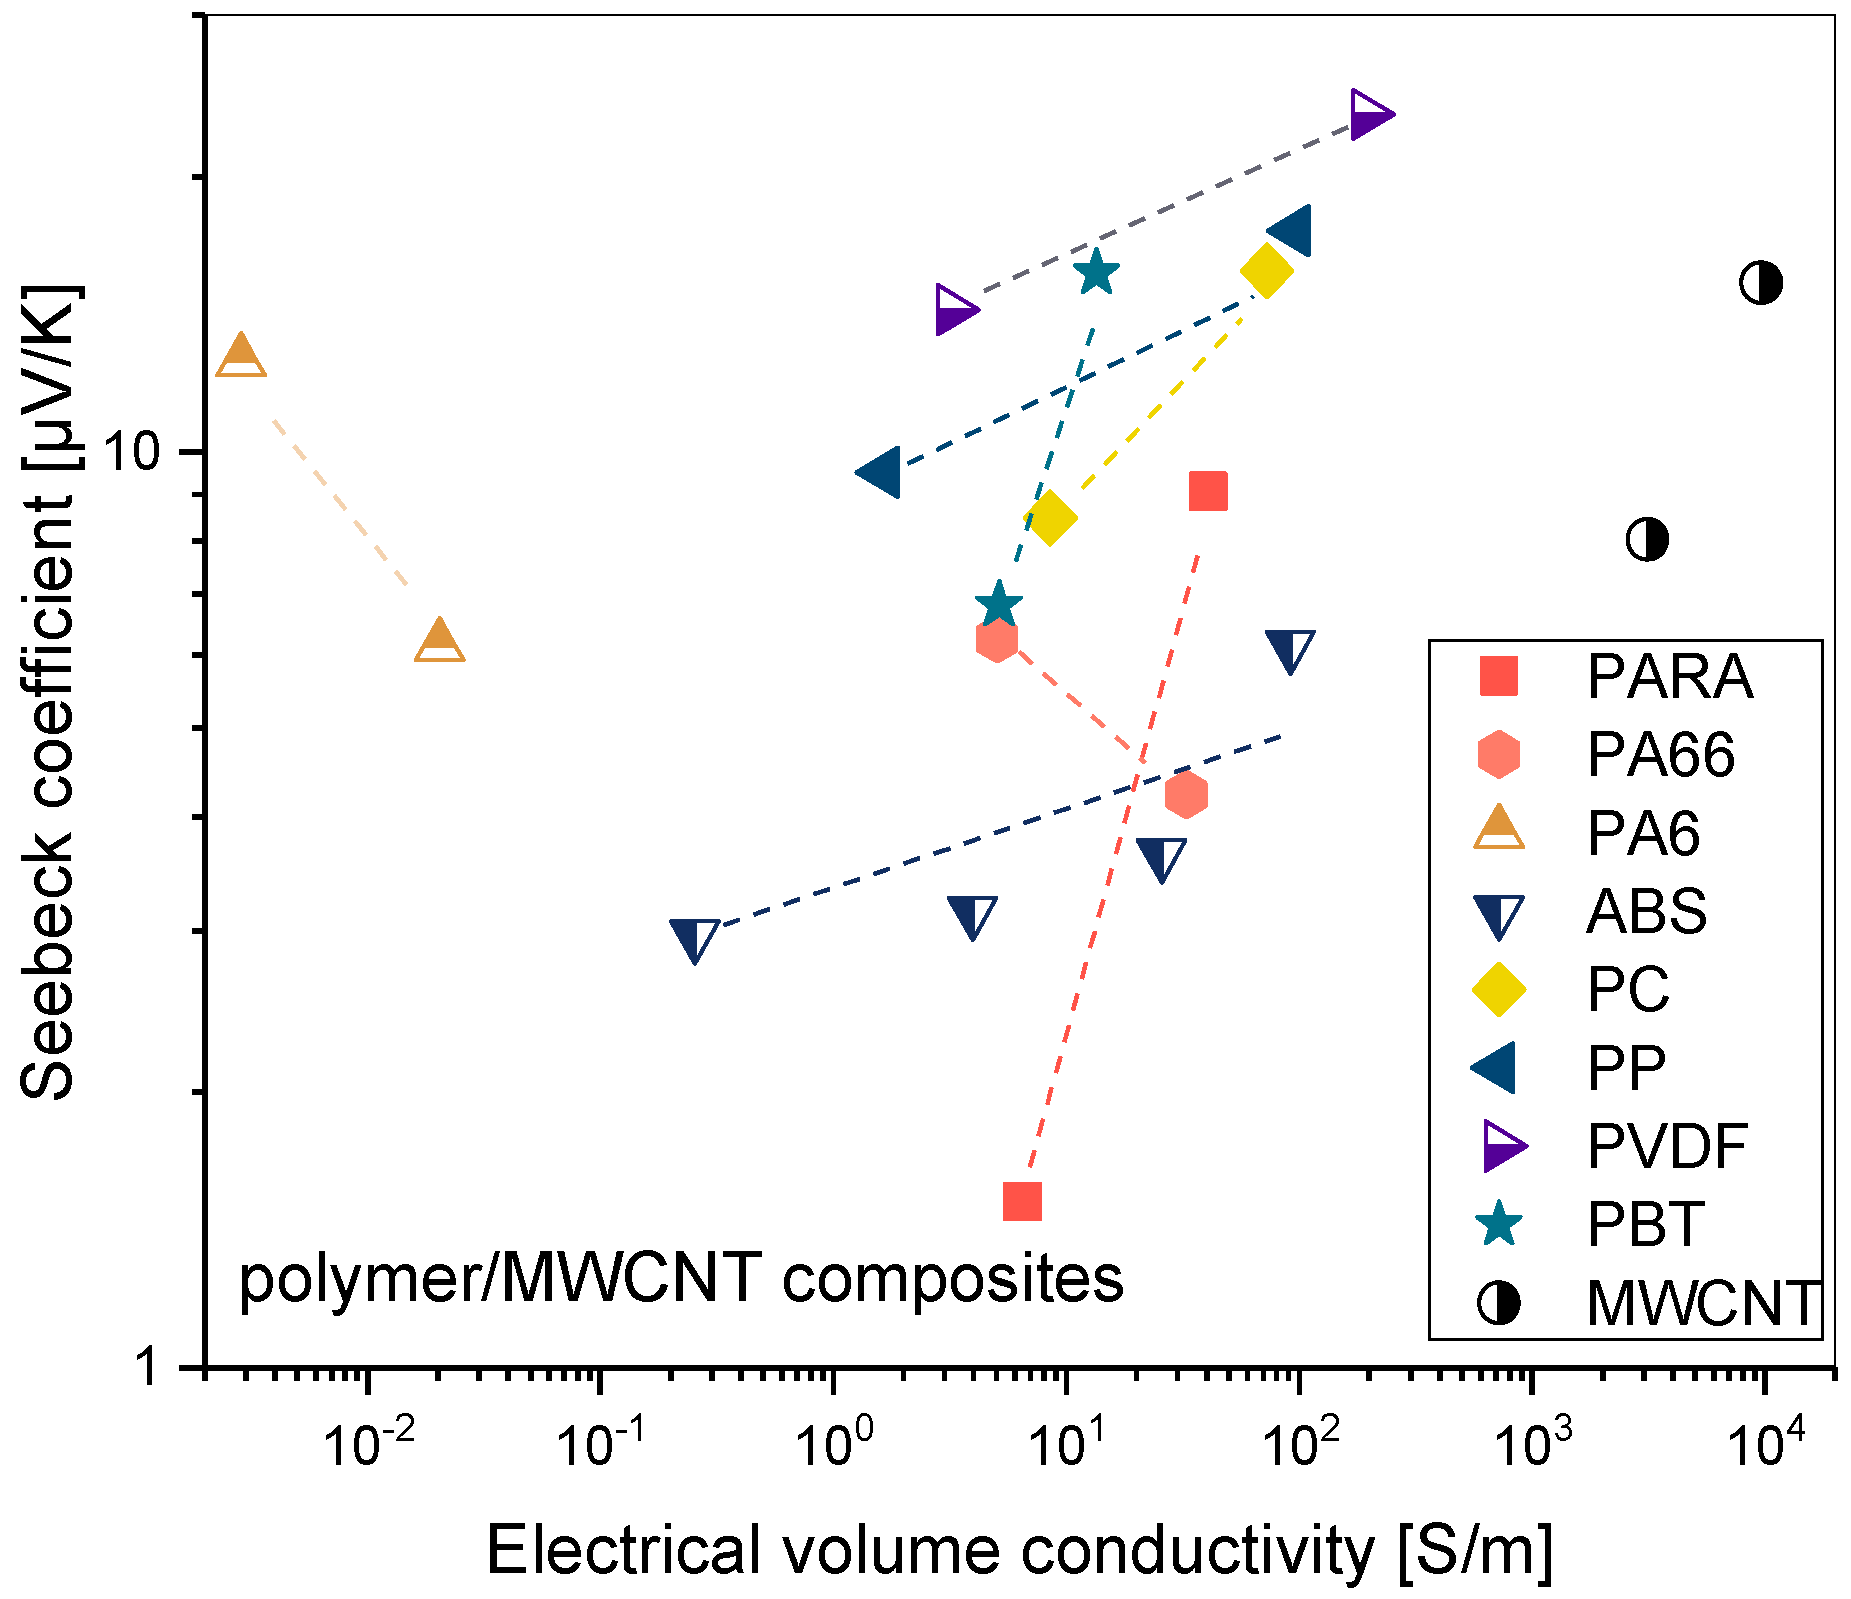
In order to see relations between the Seebeck coefficient and electrical conductivity, both depending on the CNT network structure, Figure 7 plots all values measured for polymer/MWCNT composites and their buckypapers. SWCNTs and N-MWCNTs are not included in this overview. It was found that over a wide range of conductivity values the Seebeck coefficient increase slightly with conductivity (including variation of MWCNT type and content (ABS)). However, this relationship does not apply to PA6 and PA66, for which decreasing Seebeck coefficients with increasing conductivity (only variation of MWCNT type) is seen. This may be related to the previously discussed effect of the amine group electron donation, which may also be present in MWCNTs, but to a lesser extent. It is obvious that the values of all MWCNT containing composites are lower or in the range of the corresponding buckypapers with only PVDF composites having slightly higher Seebeck values in the composites. This indicates that the conductivity of the MWCNTs themselves significantly influences the behavior of the composites. Conversely, this means that CNTs with significantly higher Seebeck coefficient are required to produce composites with higher S-values. This assumption is confirmed if the composite materials with SWCNTs, which lead to positive Seebeck coefficients, are taken into account. The S-values of SWCNT buckypapers and powder packages are significantly higher compared to those of MWCNTs. The values of Seebeck coefficients of SWCNT based composites are quite higher than those based on MWCNTs. In contrast to MWCNTs, the S-values of SWCNT-containing composite materials were sometimes higher than those of the corresponding buckypapers, with the effect being most pronounced with SWCNT Tuball.

3.3. Influence of Single-Walled Carbon Nanotube (SWCNT) content on Thermoelectric (TE) Properties

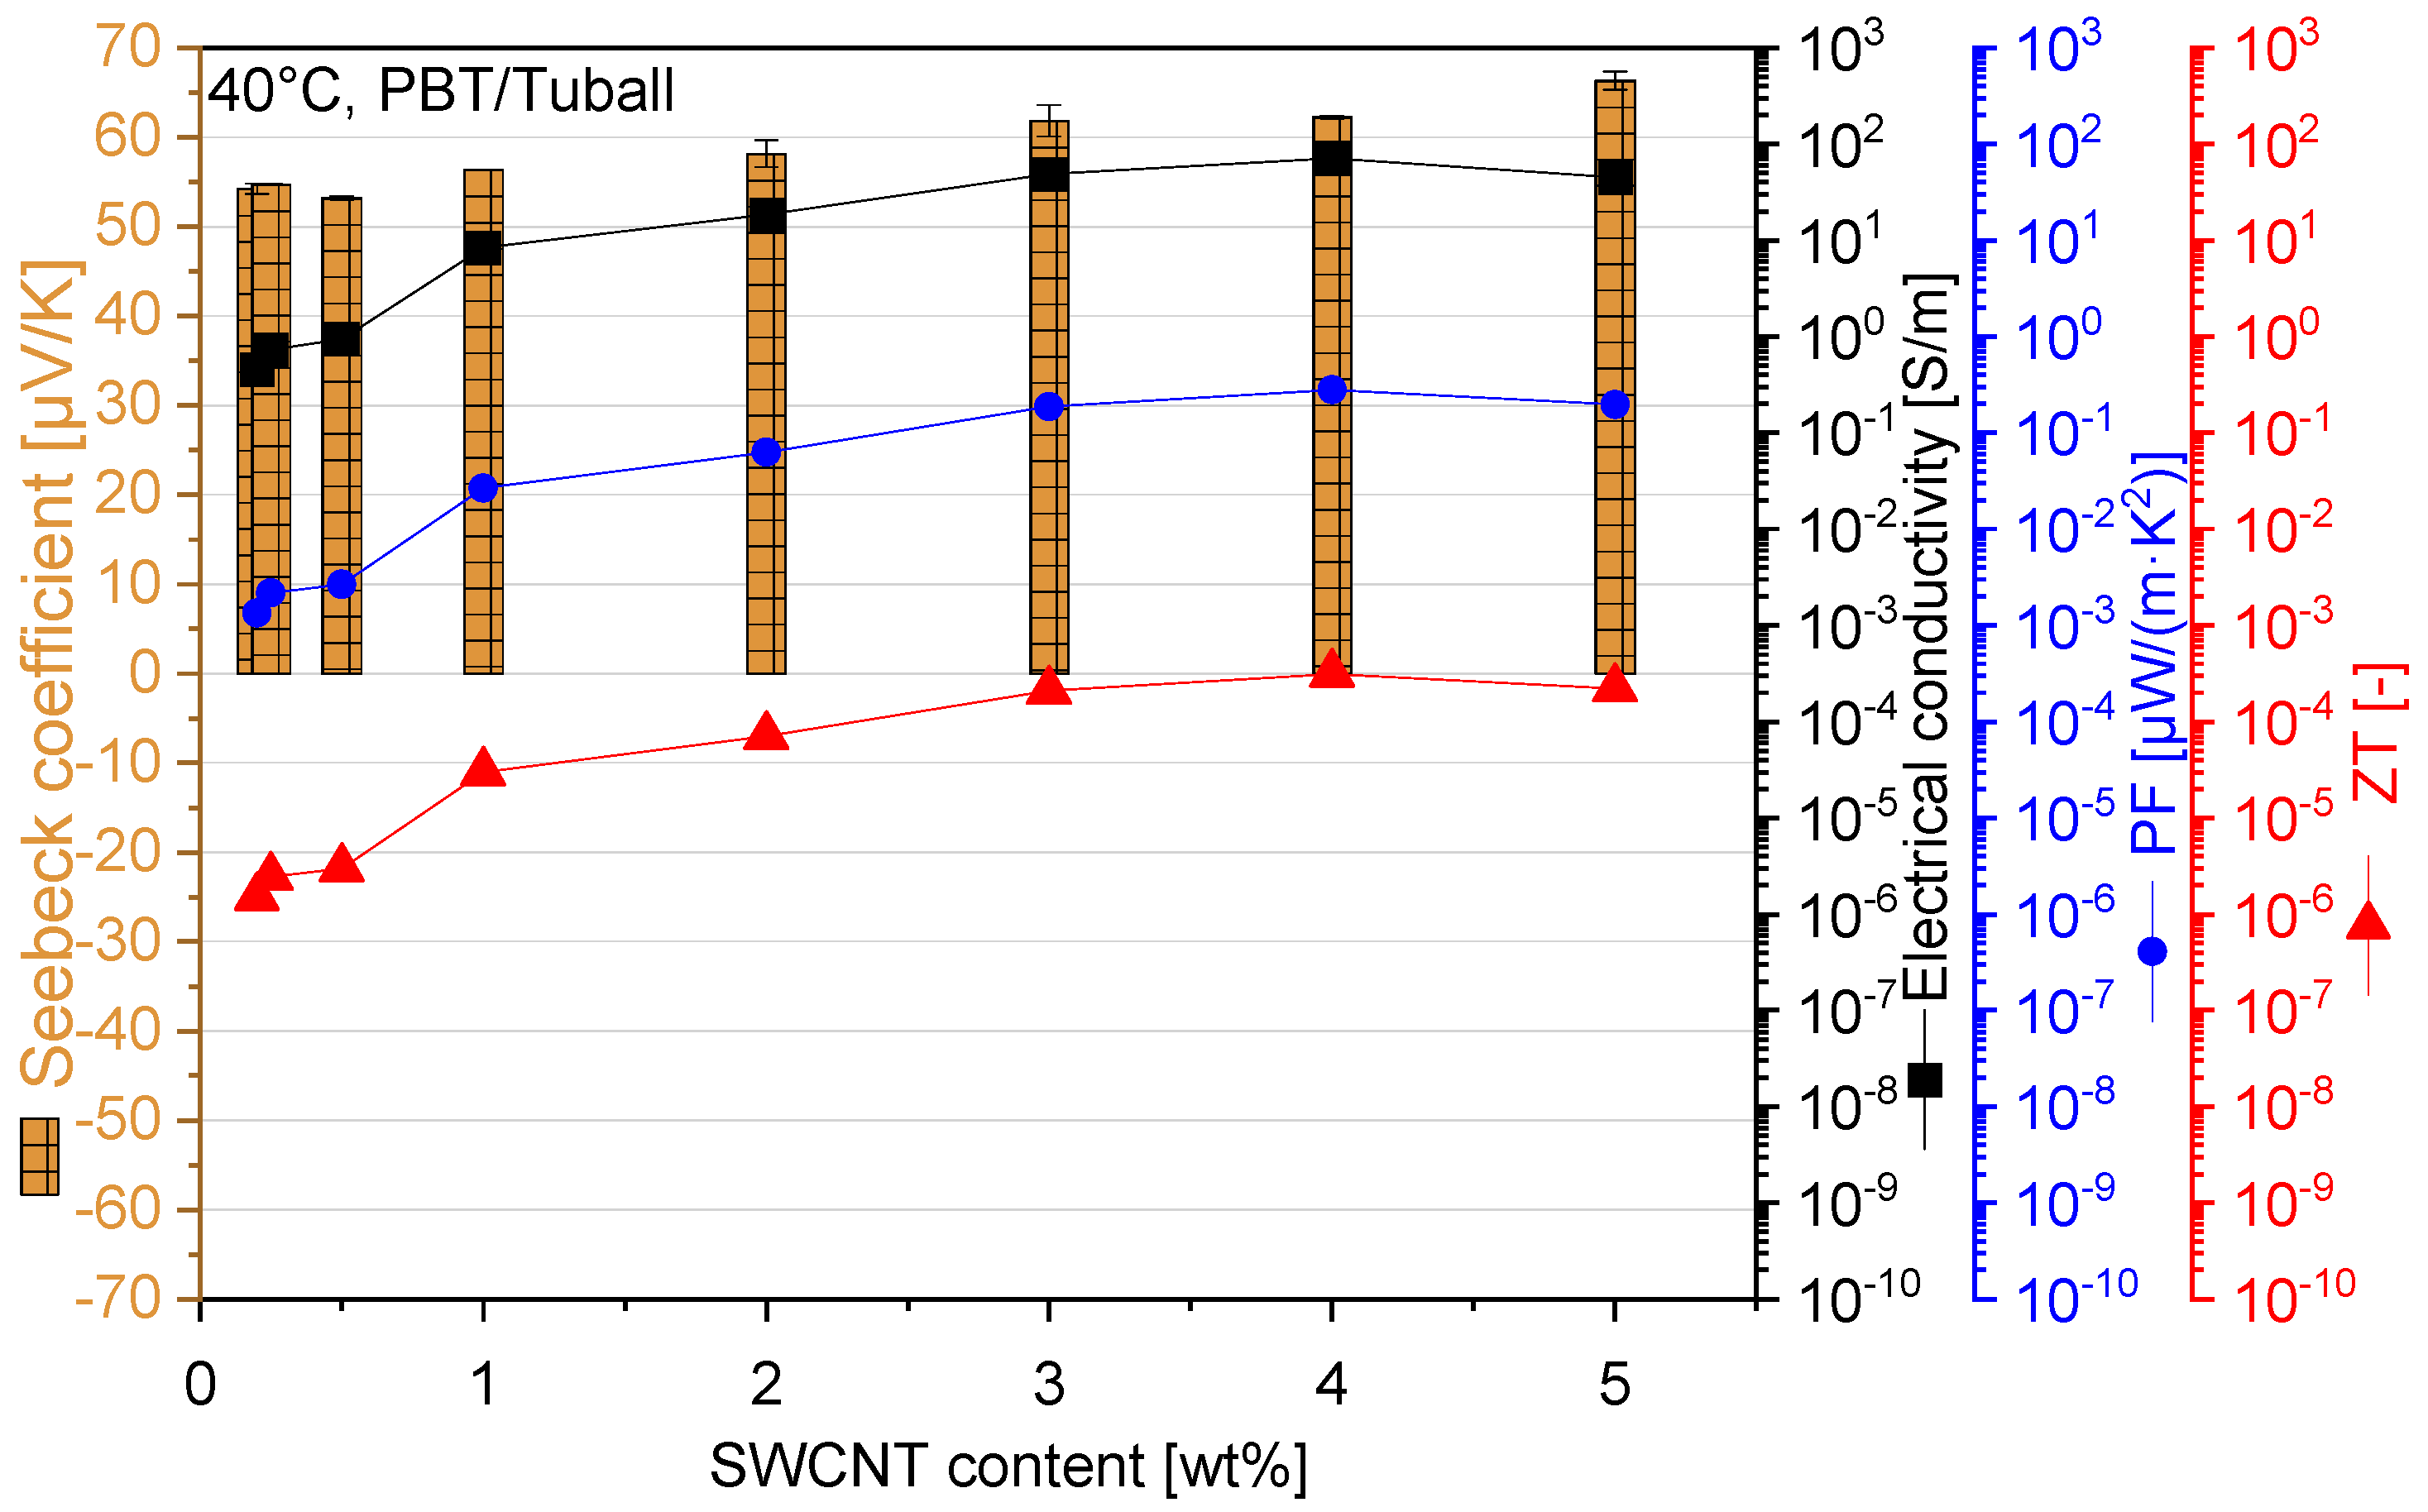
Exemplarily, for three polymer matrices the influence of SWCNT content on TE properties was studied. On the one hand, p-type PBT/SWCNT Tuball composites (Figure 8, Table 7) are considered as p-type composites, and on the other hand, ABS/SWCNT Tuball (Figure 9, Table 8) and PA6/SWCNT Tuball (Figure 10, Table 9) as n-type composites.
For the PBT/SWCNT system, it was found that the Seebeck coefficient, power factor and figure of merit increase with CNT content. The S-value increases slightly from 54.3 µV/K at 0.2 wt % Tuball up to 66.4 µV/K at 5 wt % Tuball. The increasing trend implies that no maximum of the Seebeck coefficient may be obtained up to 5 wt %. In accordance with the also increasing electrical conductivity (only very slightly lower values at 5 wt % compared to 4 wt %), PF and ZT increase up to values of 0.28 µW/m·K2 and 3.1 × 10⁻⁴, respectively. The values for both parameters are the highest values described so far for melt prepared polymer/CNT composites in the literature, when excluding reported values for composites containing other additives or prepared by solvent processes.
For the n-type ABS/Tuball composites, a maximum negative Seebeck coefficient of −57.1 µV/K was found at 0.5 wt % Tuball. Especially at higher CNT content, the S-value increases up to −29.7 µV/K at 7 wt % SWCNT. However, due to the increasing electrical conductivity, the power factor and ZT value increase with the CNT content to values up to 0.14 µW/m·K2 and 1.6 × 10⁻⁴, respectively. Thereby, mainly due to the significantly lower values of conductivity in ABS/SWCNT as compared to PBT/SWCNT, the PF and ZT values were lower compared to the values of PBT/SWCNT composites.
For PA6 composites filled with 0.3–5 wt % SWCNT Tuball, the thermoelectrical measurements shows n-type behavior. The highest Seebeck coefficient was found at −59.0 µV/K for PA6/0.5 wt % SWCNT. As with ABS/Tuball composites, the S-value increases with the SWCNT content to −46 µV/K to −47 µV/K (4–5 wt % SWCNT). It has been observed in both ABS and PA6 matrices that a lower amount of SWCNTs can obviously be doped more strongly by the surrounding polymer chains, leading to a higher absolute value of the S-value than at a higher SWCNT contents. In the p-type composites based on PBT no such doping occurs and the S-values are more dependent on the conductive network formation.
For the three SWCNT composites based on PBT, ABS or PA6, maximum values of the TE results (PF, ZT) are achieved in the CNT concentration range between 4 wt % and 5 wt %. A maximum of these values at similar SWCNT concentrations was also found in PP based composites, as reported by Luo et al. [10]. In this SWCNT concentration range, which is far above the percolation threshold concentration (compared to Table 6), a very dense carbon nanotube network can be assumed. Electrical conductivity can be used as a measure of the density and quality of the conductive network, which approaches a limit as the CNT content increases. If the maximum conductivity is reached, then further network paths do not lead to a further increase in conductivity. It is assumed that the charge transport, which cannot be further increased by the addition of CNT, is reflected in almost constant PF and ZT values.

4. Conclusions

The thermoelectrical performance of different kinds of polymer/CNT composites was studied. A variety of combinations of different polymers, such as PP, PC, PVDF, PBT, PA6, PA66, PARA and ABS with different CNT types, such as SWCNT and MWCNT in varied contents, were investigated. In addition, the Seebeck coefficients of buckypapers and powder packages of the CNT materials were measured. For MWCNTs, the order of the Seebeck coefficients of the composite materials followed the order of the corresponding buckypapers. CNS-PEG with higher Seebeck coefficients in buckypaper also resulted in higher composite values compared to NC7000. The highest Seebeck coefficient was achieved for polymer composites filled with SWCNT Tuball whereas both positive and negative S-values were obtained. While the incorporation of Tuball in PP, PC, PVDF and PBT leads to a positive Seebeck coefficient, the use in polyamides (PA6, PA66, PARA) and ABS resulted in negative S-values. This doping was assigned to the electron-donating effect of nitrogen containing amide or amine groups present in these polymers. In further investigations, the doping of CNTs by polymers must be investigated more closely.
Nitrogen doped MWCNTs with negative Seebeck value in the buckypapers resulted in negative values of the composites for all studied polymers. The magnitude of the Seebeck coefficient was lower as compared to the application of SWCNT Tuball in the polyamides and ABS.
Not only the type of carbon nanotubes influences the TE properties of polymer/CNT composites, but also the polymer type. At the same MWCNT content, the S-values of PVDF composites were higher than those of the other composites. For composite materials filled with 2 wt % SWCNT Tuball, the highest Seebeck coefficient of 58.2 µV/K was determined in the PBT matrix. The highest Seebeck coefficients obtained in this study were 66.4 µV/K (PBT/7 wt % SWCNT Tuball) and −59.0 µV/K (PA6/0.5 wt % SWCNT Tuball) for p- and n-type composites, respectively. The highest power factor and ZT of 0.28 µW/m·K2 and 3.1 × 10⁻⁴, respectively, were achieved in PBT with 4 wt % SWCNT Tuball.
In summary, this study presents for first time the Seebeck coefficients of melt-mixed CNT composites with polyamides, poly(butylene terephthalate) and poly(acrylonitrile butadiene styrene). The major novelty is the direct preparation of n-type melt-mixed polymer composites from p-type commercial SWCNTs with relatively high Seebeck coefficients up to −57 μV/K. Thereby, the selection of SWCNTs combined with matrix polymers containing nitrogen groups seems to be favorable to achieve n-type composites. Thus, with a purposeful selection of the CNTs and the polymer matrix, both n-type and p-type elements can be produced for the assembly of a TE generator.

Author Contributions

Conceptualization, B.K. and P.P.; methodology, B.K., P.P.; investigation, B.K., C.B., J.L., M.K.; data curation, B.K.; writing—original draft preparation, B.K.; writing—review and editing, P.P.; visualization, B.K.; supervision, P.P.; project administration, P.P.; funding acquisition, P.P.

Funding

This research received no external funding. Juhasz Levente and Carine Barbier were financially supported by the ERASMUS program of the German Academic Exchange Service (DAAD) during their traineeships at IPF.

Acknowledgments

The authors thank ANS (Applied NanoStructured Solutions LLC, Baltimore, MD, USA) for supplying the branched MWCNT CNS-PEG material. Thanks to Uttandaraman Sundararaj (University of Calgary, Canada) and Mohammad Arjmand (now University of British Columbia, Kelowna, Canada) for supplying the N-doped MWCNTs N-A1 and Robert Fuge and Silke Hampel (Leibniz Institute for Solid State and Materials Research Dresden, Germany) for production of N-doped MWCNTs N-IFW.

Conflicts of Interest

The authors declare no conflict of interest

References

  1. Rowe, D.M. CRC Handbook of Thermoelectrics; CRC Press: Boca Raton, FL, USA, 1995. [Google Scholar]
  2. Gayner, C.; Kar, K.K. Recent advances in thermoelectric materials. Prog. Mater. Sci. 2016, 83, 330–382. [Google Scholar] [CrossRef]
  3. Antar, Z.; Feller, J.F.; Noël, H.; Glouannec, P.; Elleuch, K. Thermoelectric behaviour of melt processed carbon nanotube/graphite/poly(lactic acid) conductive biopolymer nanocomposites (CPC). Mater. Lett. 2012, 67, 210–214. [Google Scholar] [CrossRef]
  4. Sun, Y.-C.; Terakita, D.; Tseng, A.C.; Naguib, H.E. Study on the thermoelectric properties of PVDF/MWCNT and PVDF/GNP composite foam. Smart Mater. Struct. 2015, 24, 085034. [Google Scholar] [CrossRef] [Green Version]
  5. Hewitt, C.A.; Kaiser, A.B.; Roth, S.; Craps, M.; Czerw, R.; Carroll, D.L. Multilayered carbon nanotube/polymer composite based thermoelectric fabrics. Nano Lett. 2012, 12, 1307–1310. [Google Scholar] [CrossRef]
  6. Hewitt, C.A.; Kaiser, A.B.; Roth, S.; Craps, M.; Czerw, R.; Carroll, D.L. Varying the concentration of single walled carbon nanotubes in thin film polymer composites, and its effect on thermoelectric power. Appl. Phys. Lett. 2011, 98, 183110. [Google Scholar] [CrossRef]
  7. Liebscher, M.; Gärtner, T.; Tzounis, L.; Mičušík, M.; Pötschke, P.; Stamm, M.; Heinrich, G.; Voit, B. Influence of the MWCNT surface functionalization on the thermoelectric properties of melt-mixed polycarbonate composites. Compos. Sci. Technol. 2014, 101, 133–138. [Google Scholar] [CrossRef]
  8. Tzounis, L.; Gartner, T.; Liebscher, M.; Pötschke, P.; Stamm, M.; Voit, B.; Heinrich, G. Influence of a cyclic butylene terephthalate oligomer on the processability and thermoelectric properties of polycarbonate/MWCNT nanocomposites. Polymer 2014, 55, 5381–5388. [Google Scholar] [CrossRef]
  9. Luo, J.; Cerretti, G.; Krause, B.; Zhang, L.; Otto, T.; Jenschke, W.; Ullrich, M.; Tremel, W.; Voit, B.; Pötschke, P. Polypropylene-based melt mixed composites with singlewalled carbon nanotubes for thermoelectric applications: Switching from p-type to n-type by the addition of polyethylene glycol. Polymer 2017, 108, 513–520. [Google Scholar] [CrossRef]
  10. Luo, J.; Krause, B.; Pötschke, P. Melt-mixed thermoplastic composites containing carbon nanotubes for thermoelectric applications. Aims Mater. Sci. 2016, 3, 1107–1116. [Google Scholar] [CrossRef]
  11. Luo, J.; Krause, B.; Pötschke, P. Polymer—Carbon nanotube composites for thermoelectric applications. Aip Conf. Proc. 2017, 1914, 030001. [Google Scholar]
  12. Pötschke, P.; Krause, B.; Luo, J. Melt mixed composites of polypropylene with singlewalled carbon nanotubes for thermoelectric applications: Switching from p- to n-type behavior by additive addition. Aip Conf. Proc. 2019, 2055, 090004. [Google Scholar]
  13. Tzounis, L.; Hegde, M.; Liebscher, M.; Dingemans, T.; Pötschke, P.; Paipetis, A.S.; Zafeiropoulos, N.E.; Stamm, M. All-aromatic SWCNT-polyetherimide nanocomposites for thermal energy harvesting applications. Compos. Sci. Technol. 2018, 156, 158–165. [Google Scholar] [CrossRef]
  14. Nonoguchi, Y.; Ohashi, K.; Kanazawa, R.; Ashiba, K.; Hata, K.; Nakagawa, T.; Adachi, C.; Tanase, T.; Kawai, T. Systematic conversion of single walled carbon nanotubes into n-type thermoelectric materials by molecular dopants. Sci. Rep. 2013, 3, 3344. [Google Scholar] [CrossRef]
  15. Piao, M.; Alam, M.R.; Kim, G.; Dettlaff-Weglikowska, U.; Roth, S. Effect of chemical treatment on the thermoelectric properties of single walled carbon nanotube networks. physica status solidi 2012, 249, 2353–2356. [Google Scholar] [CrossRef]
  16. Paleo, A.J.; Vieira, E.M.F.; Wan, K.; Bondarchuk, O.; Cerqueira, M.F.; Goncalves, L.M.; Bilotti, E.; Alpuim, P.; Rocha, A.M. Negative thermoelectric power of melt mixed vapor grown carbon nanofiber polypropylene composites. Carbon 2019, 150, 408–416. [Google Scholar]
  17. Brownlie, L.; Shapter, J. Advances in carbon nanotube n-type doping: Methods, analysis and applications. Carbon 2018, 126, 257–270. [Google Scholar] [CrossRef] [Green Version]
  18. Dörling, B.; Sandoval, S.; Kankla, P.; Fuertes, A.; Tobias, G.; Campoy-Quiles, M. Exploring different doping mechanisms in thermoelectric polymer/carbon nanotube composites. Synth. Met. 2017, 225, 70–75. [Google Scholar] [CrossRef] [Green Version]
  19. Ryu, Y.; Freeman, D.; Yu, C. High electrical conductivity and n-type thermopower from double-/single-wall carbon nanotubes by manipulatingcharge interactions between nanotubes and organic/inorganicnanomaterials. Carbon 2011, 49, 4745–4751. [Google Scholar] [CrossRef]
  20. Kim, S.L.; Choi, K.; Tazebay, A.; Yu, C. Flexible power fabrics made of carbon nanotubes for harvesting thermoelectricity. Acs Nano 2014, 8, 2377–2386. [Google Scholar] [CrossRef]
  21. Hewitt, C.A.; Montgomery, D.S.; Barbalace, R.L.; Carlson, R.D.; Carroll, D.L. Improved thermoelectric power output from multilayered polyethylenimine doped carbon nanotube based organic composites. J. Appl. Phys. 2014, 115, 184502. [Google Scholar] [CrossRef]
  22. Dörling, B.; Ryan, J.D.; Craddock, J.D.; Sorrentino, A.; El Basaty, A.; Gomez, A.; Garriga, M.; Pereiro, E.; Anthony, J.E.; Weisenberger, M.C.; et al. Photoinduced p- to n-type switching in thermoelectric polymer-carbon nanotube composites. Adv. Mater. 2016, 28, 2782–2789. [Google Scholar] [CrossRef] [Green Version]
  23. Nish, A.; Hwang, J.-Y.; Doig, J.; Nicholas, R.J. Highly selective dispersion of single-walled carbon nanotubes using aromatic polymers. Nat. Nanotechnol. 2007, 2, 640–646. [Google Scholar] [CrossRef] [PubMed]
  24. Krause, B.; Pötschke, P.; Ilin, E.; Predtechenskiy, M. Melt mixed SWCNT-polypropylene composites with very low electrical percolation. Polymer 2016, 98, 45–50. Available online: https://tuball.com/en/about-tuball (accessed on 16 September 2019). [CrossRef]
  25. Krause, B.; Boldt, R.; Pötschke, P. A method for determination of length distributions of multiwalled carbon nanotubes before and after melt processing. Carbon 2011, 49, 1243–1247. [Google Scholar] [CrossRef]
  26. Krause, B.; Barbier, C.; Kunz, K.; Pötschke, P. Comparative study of singlewalled, multiwalled, and branched carbon nanotubes melt mixed in different thermoplastic matrices. Polymer 2018, 159, 75–85. [Google Scholar] [CrossRef]
  27. Datasheet Unidym™ Carbon Nanotubes, HiPCo® Single-Wall Carbon Nanotubes, Version 13 June 2012. Assessed July 2012 www.unidym.com. Available online: http://nanointegris.com/our-products/small-diameter-swnts-hipco/ (accessed on 16 September 2019).
  28. Pawar, S.P.; Arjmand, M.; Pötschke, P.; Krause, B.; Fischer, D.; Bose, S.; Sundararaj, U. Tuneable dielectric properties derived from nitrogen-doped carbon nanotubes in PVDF-based nanocomposites. Acs Omega 2018, 3, 9966–9980. [Google Scholar] [CrossRef]
  29. Fuge, R.; Liebscher, M.; Schröfl, C.; Oswald, S.; Leonhardt, A.; Büchner, B.; Mechtcherine, V. Fragmentation characteristics of undoped and nitrogen-doped multiwalled carbon nanotubes in aqueous dispersion in dependence on the ultrasonication parameters. Diam. Relat. Mat. 2016, 66, 126–134. [Google Scholar] [CrossRef]
  30. Available online: https://www.Nanoamor.Com/inc/sdetail/42062 (accessed on 10 September 2019).
  31. Gnanaseelan, M.; Chen, Y.; Luo, J.; Krause, B.; Pionteck, J.; Pötschke, P.; Qi, H. Cellulose-carbon nanotube composite aerogels as novel thermoelectric materials. Compos. Sci. Technol. 2018, 163, 133–140. [Google Scholar] [CrossRef]
  32. Krause, B.; Rzeczkowski, P.; Pötschke, P. Thermal conductivity and electrical resistivity of melt-mixed polypropylene composites containing mixtures of carbon-based fillers. Polymers 2019, 11, 1073. [Google Scholar] [CrossRef] [Green Version]
  33. Krause, B.; Pötschke, P. Electrical and thermal conductivity of polypropylene filled with combinations of carbon fillers. Aip Conf. Proc. 2016, 1779, 040003. [Google Scholar]
  34. Tzounis, L.; Liebscher, M.; Fuge, R.; Leonhardt, A.; Mechtcherine, V. P- and n-type thermoelectric cement composites with CVD grown p- and n-doped carbon nanotubes: Demonstration of a structural thermoelectric generator. Energy Build. 2019, 191, 151–163. [Google Scholar] [CrossRef]
  35. Alig, I.; Pötschke, P.; Lellinger, D.; Skipa, T.; Pegel, S.; Kasaliwal, G.R.; Villmow, T. Establishment, morphology and properties of carbon nanotube networks in polymer melts. Polymer 2012, 53, 4–28. [Google Scholar] [CrossRef]
  36. Kasaliwal, G.R.; Villmow, T.; Pegel, S.; Pötschke, P. Influence of material and processing parameters on carbon nanotube dispersion in polymer melts. In Polymer-Carbon Nanotube Composites: Preparation, Porperties and Applications; McNally, T., Pötschke, P., Eds.; Woodhead Publishing: Philadelphia, PA, USA, 2011; pp. 92–132. [Google Scholar]
  37. Barbier, C. Preparation of Melt-Mixed Composites Filled with Carbon Nanotubes and Characterization of the Materials by Morphological, Mechanical and Electrical Testing; Internship Report; Leibniz-Institut für Polymerforschung Dresden e.V.: Dresden, Germany, 2016. [Google Scholar]
  38. Levente, J. Preparation and Study of Conducting Polymer Composites Filled with Carbon Nanotubes, Supported by the Erasmus Program of the German Academic Exchange Service (DAAD); Internship Report; Leibniz-Institut für Polymerforschung Dresden e.V.: Dresden, Germany, 2018. [Google Scholar]
  39. Kunz, K.; Krause, B.; Kretzschmar, B.; Juhasz, L.; Kobsch, O.; Jenschke, W.; Ullrich, M.; Pötschke, P. Direction dependent electrical conductivity of polymer/carbon filler composites. Polymers 2019, 11, 591. [Google Scholar] [CrossRef] [PubMed] [Green Version]
  40. Krause, B.; Petzold, G.; Pegel, S.; Pötschke, P. Correlation of carbon nanotube dispersability in aqueous surfactant solutions and polymers. Carbon 2009, 47, 602–612. [Google Scholar] [CrossRef]
  41. Krause, B.; Pötschke, P.; Häußler, L. Influence of small scale melt mixing conditions on electrical resistivity of carbon nanotube-polyamide composites. Compos. Sci. Technol. 2009, 69, 1505–1515. [Google Scholar] [CrossRef]
  42. Kasaliwal, G.; Göldel, A.; Pötschke, P. Influence of processing conditions in small-scale melt mixing and compression molding on the resistivity and morphology of polycarbonate–MWNT composites. J. Appl. Polym. Sci. 2009, 112, 3494–3509. [Google Scholar] [CrossRef]
Figure 1. Tube and plugs for thermoelectric measurements on powder samples (pencil for size comparison).
Jcs 03 00106 g001
Figure 2. Composites filled with 2 wt % different carbon nanotubes (CNTs): poly (butylene terephthalate) (PBT) (left), poly(vinylidene fluoride) (PVDF) (right).
Jcs 03 00106 g002
Figure 3. Composites filled with 2 wt % different CNTs: polypropylene (PP) (left), polycarbonate (PC) (right).
Jcs 03 00106 g003
Figure 4. Composites filled with different CNTs and CNT contents: acrylonitrile butadiene styrene (ABS) (left), polyamide 6 (PA6) (right).
Jcs 03 00106 g004
Figure 5. PARA composites filled with different CNTs and different CNT contents (left), polyamide 66 (PA66) composites filled with 2 wt % different CNTs (right).
Jcs 03 00106 g005
Figure 6. Molecular structure of polymers resulting in negative Seebeck coefficients: PA, ABS (as used in this study) and poly(vinyl pyrrolidone) (PVP), poly(ethylene imine) (PEI) and N,N,N′,N′-tetramethyl-p-phenylenediamine (TMPD) (as applied in [15]).
Jcs 03 00106 g006
Figure 7. Seebeck coefficient versus electrical volume conductivity for all polymer/multi-walled CNTs (MWCNT) composites of Table 5 and MWCNT buckypapers (dashed lines are guides for the eyes).
Jcs 03 00106 g007
Figure 8. Thermoelectric (TE) parameters of PBT/single-walled CNTs (SWCNT) Tuball composites, numeric values are given in Table 7.
Jcs 03 00106 g008
Figure 9. TE parameters of ABS/SWCNT Tuball composites, numeric values are given in Table 8.
Jcs 03 00106 g009
Figure 10. TE parameters of PA6/ SWCNT Tuball composites, numeric values are given in Table 9.
Jcs 03 00106 g010
Table 1. Polymer matrices used in this study.
Polymer MatrixTrade NameProducer
Polyamide 6 (PA6)Ultramid® B27EBASF, Ludwigshafen, Germany
Partially aromatic polyamide (PARA)IXET-BXT2000Solvay, Freiburg, Germany
Polyamide 66 (PA66)Noryl GTX 979Sabic, Riyadh, Kingdom of Saudi Arabia
Poly(butylene terephthalate) (PBT)Vestodur 1000Evonik Industries, Marl, Germany
Poly (vinylidene fluoride) (PVDF)Kynar® 720Arkema S.A., Colombes, France
Polypropylene (PP)Moplen HP400RBasell, Frankfurt, Germany
Polycarbonate (PC)Makrolon2600Bayer MaterialScience, Leverkusen, Germany
Acrylonitrile butadiene
styrene (ABS)
CycolacTM S570Sabic, Riyadh, Kingdom of Saudi Arabia
Table 2. Carbon nanotubes used in this study.
Nanotube KindTrade NameCompanyReference
Multi-walled carbon nanotube (MWCNT)NC7000Nanocyl, S.A., Sambreville, Belgium[25,26]
Branched MWCNTCNS-PEGApplied NanoStructured Solutions LLC, Baltimore, MD, USA[26]
Single-walled CNT (SWCNT)TuballTMOCSiAl S.a.r.l., Luxembourg, Luxembourg[24,26]
SWCNTHiPco®, super pureUnidym Inc., Sunnyvale, CA, USA[27]
Nitrogen-doped MWCNTN-A11Self-synthesized in a Chemical Vapor Deposition System[28]
Nitrogen-doped MWCNTN-IFW2Self-synthesized in an Aerosol Assisted Chemical Vapor Deposition System[29]
Nitrogen-doped MWCNTN400Nanostructured & Amorphous Materials, Inc., Katy, TX, USA[30]
1 Synthesized with iron as catalyst, a gas ratio of 50/50/50 and synthesis time of 2 h [28] at the University of Calgary, Canada. 2 Synthesized at the Leibniz Institute for Solid State and Material Research (IFW), Dresden, Germany.
Table 3. Melt mixing and compression molding conditions for composite preparation.
Polymer MatrixMixing Temperature (°C)Mixing Time (min)Rotation Speed (rpm)Pressing Temperature (°C)Pressing Time (min)
PA626052502601.5
PARA270101002701.5
PA662805503202
PBT26552002651
PVDF210102002002.5
PP21052502102
PC28052502802.5
ABS26052502602
Table 4. Thermoelectrical properties of carbon nanotube buckypapers (BP) and powders (P).
Type of NanotubeTrade NameVolume Conductivity (S/m)Seebeck Coefficient (µV/K)Power Factor (µW/m·K2)
MWCNTNC7000 (BP)31258.0 ± 0.00.2015
NC7000 (P)4176.3 ± 0.00.0165
Branched MWCNTCNS-PEG (BP)962215.3 ± 0.02.2569
CNS-PEG (P)93310.1 ± 0.00.0949
SWCNTTuball (BP)42,22737.4 ± 0.959.1933
Tuball (P)179039.6 ± 0.22.8094
SWCNTHiPco (BP)10,20828.6 ± 1.48.3590
HiPco (P)75335.7 ± 0.10.9597
N-doped MWCNTN400 (BP)157−7.3 ± 0.00.0084
N-doped MWCNTN-A1 (P)86−11.6 ± 0.10.0117
N-doped MWCNTN-IFW (BP)2196−10.3 ± 0.00.2348
N-IFW (P)506−12.7 ± 0.10.0812
Table 5. Thermoelectrical parameters of the composites shown in Figure 2, Figure 3, Figure 4 and Figure 5.
CompositeVolume Conductivity (S/m)Seebeck Coefficient (µV/K)Power Factor (µW/m·K2)Figure of Merit ZT
PBT + 2 wt % NC70005.16.8 ± 0.00.00022.7 × 10−7
PBT + 2 wt % CNS-PEG13.515.7 ± 0.10.00333.7 × 10−6
PBT + 2 wt % Tuball18.658.2 ± 0.20.06307.0 × 10−5
PBT + 2 wt % N-MWCNT IFW1.0−8.2 ± 0.17.0 × 10−57.8 × 10⁻⁸
PVDF + 2 wt % NC70003.214.3 ± 0.30.00077.4 × 10−7
PVDF + 2 wt % CNS-PEG194.523.4 ± 0.20.10631.2 × 10−4
PVDF + 2 wt % Tuball139.324.0 ± 0.30.08039.0 × 10−5
PP + 2 wt % NC70001.69.5 ± 0.10.00011.7 × 10−7
PP + 2 wt % CNS-PEG95.617.5 ± 0.00.02913.3 × 10−5
PP + 2 wt % Tuball12.147.2 ± 1.90.02703.0 × 10−5
PP + 2 wt % N-MWCNT A10.1−17.3 ± 0.02.5 × 10−52.8 × 10⁻⁸
PP + 2 wt % N-MWCNT IFW10.5−10.3 ± 0.10.00111.2 × 10−6
PC + 2 wt % NC70008.58.5 ± 0.00.00066.8 × 10−7
PC + 2 wt % CNS-PEG72.815.8 ± 0.20.01812.0 × 10−5
PC + 2 wt % Tuball1.034.8 ± 0.30.00121.4 × 10−6
ABS + 1 wt % NC70000.33.0 ± 1.02.2 × 10−62.9 × 10⁻⁹
ABS + 4 wt % NC700025.73.6 ± 0.40.00033.8 × 10−7
ABS + 1 wt % CNS-PEG4.03.1 ± 1.23.9 × 10−54.4 × 10⁻⁸
ABS + 4 wt % CNS-PEG91.76.1 ± 1.20.00353.9 × 10−6
ABS + 1 wt % Tuball4.2−50.9 ± 3.00.01091.2 × 10−5
ABS + 4 wt % Tuball66.2−32.7 ± 6.40.07067.9 × 10−5
ABS + 2 wt % HiPco4.8 × 10−4−16.8 ± 4.21.4 × 10−71.5 × 10⁻¹⁰
ABS + 4 wt % HiPco0.1−15.2 ± 1.82.7 × 10−53.0 × 10⁻⁸
PA6 + 5 wt % NC70002.0 × 10−26.1 ± 1.27.7 × 10−78.6 × 10⁻¹⁰
PA6 + 5 wt % CNS-PEG2.9 × 10−312.6 ± 0.04.5 × 10−75.1 × 10⁻¹⁰
PA6 + 5 wt % Tuball64.6−47.0 ± 2.90.14251.6 × 10−4
PA6 + 2 wt % HiPco4.6 × 10−227.5 ± 1.03.5 × 10−53.9 × 10⁻⁸
PA6 + 4 wt % HiPco0.49.1 ± 0.03.2 × 10−53.5 × 10⁻⁸
PARA + 2 wt % NC70006.51.5 ± 0.21.5 × 10−51.7 × 10⁻⁸
PARA + 2 wt % CNS-PEG40.69.1 ± 0.00.00333.7 × 10−6
PARA + 2 wt % Tuball2.4−46.6 ± 1.30.00525.8 × 10−6
PARA + 4 wt % Tuball27.3−26.2 ± 0.10.01882.1 × 10−5
PARA + 2 wt % HiPco2.4 × 10−40.7 ± 4.01.1 × 10−101.2 × 10⁻¹³
PARA + 4 wt % HiPco0.333.6 ± 0.40.00033.5 × 10−7
PA66 + 2 wt % NC70005.06.3 ± 0.00.00022.2 × 10−7
PA66 + 2 wt % CNS-PEG32.74.2 ± 0.00.00066.5 × 10−7
PA66 + 2 wt % Tuball28.2−29.5 ± 1.40.02462.7 × 10−5
Table 6. Electrical percolation threshold of polymer/CNT composites.
Polymer+NC7000+CNS-PEG+Tuball
PBT0.1–0.2 wt % [37]<0.25 wt %0.1–0.2 wt % [37]
PVDF1 wt % [26]0.1–0.2 wt % [26]0.1–0.2 wt % [26]
PP0.5–0.75 wt % [26]<0.1 wt % [26]0.075–0.1 wt % [24]
PC0.25–0.5 wt % [26]0.05–0.075 wt % [26]0.1–0.2 wt % [26]
ABS0.25–0.5 wt % [38]<0.25 wt % [38]<0.25 wt % [39]
PA62 wt %1 wt %<0.1 wt % [39]
PARA<2 wt % 1<2 wt % 1<2 wt % 1
PA660.1–0.25 wt % [40]<2 wt % 1<2 wt % 1
1 Composites with CNT concentrations < 2 wt % were not prepared.
Table 7. Thermoelectrical parameters of PBT/single-walled CNT (SWCNT) Tuball composites shown in Figure 8.
CompositeVolume Conductivity (S/m)Seebeck Coefficient (µV/K)Power Factor (µW/m·K2)Figure of Merit ZT
PBT + 0.2 wt % Tuball0.554.3 ± 0.60.00131.5 × 10−6
PBT + 0.25 wt % Tuball0.754.7 ± 0.10.00222.4 × 10−6
PBT + 0.5 wt % Tuball0.953.2 ± 0.20.00273.0 × 10−6
PBT + 1.0 wt % Tuball8.456.4 ± 0.10.02683.0 × 10−5
PBT + 2.0 wt % Tuball18.658.2 ± 1.50.06307.0 × 10−5
PBT + 3.0 wt % Tuball49.161.8 ± 1.70.18772.1 × 10−4
PBT + 4.0 wt % Tuball72.162.3 ± 0.20.27973.1 × 10−4
PBT + 5.0 wt % Tuball45.066.4 ± 1.00.19832.2 × 10−4
Table 8. Thermoelectrical parameters of ABS/SWCNT Tuball composites shown in Figure 9.
CompositeVolume Conductivity (S/m)Seebeck Coefficient (µV/K)Power Factor (µW/m·K2)Figure of Merit ZT
ABS + 0.3 wt % Tuball0.1−51.0 ± 3.80.00011.5 × 10−7
ABS + 0.4 wt % Tuball0.1−51.5 ± 0.30.00044.0 × 10−7
ABS + 0.5 wt % Tuball0.2−57.1 ± 4.10.00055.6 × 10−7
ABS + 0.75 wt % Tuball1.1−41.6 ± 0.40.00192.2 × 10−6
ABS + 1.0 wt % Tuball4.2−50.9 ± 3.00.01091.2 × 10−5
ABS + 2.0 wt % Tuball14.8−34.2 ± 0.70.01731.9 × 10−5
ABS + 4.0 wt % Tuball66.2−32.7 ± 6.40.07067.9 × 10−5
ABS + 5.0 wt % Tuball137.6−32.0 ± 0.40.14091.6 × 10−4
ABS + 6.0 wt % Tuball130.1−30.5 ± 0.50.12071.3 × 10−4
ABS + 7.0 wt % Tuball111.2−29.7 ± 0.50.09801.1 × 10−4
Table 9. Thermoelectrical parameter of PA6/SWCNT Tuball composites shown in Figure 10.
CompositeVolume Conductivity (S/m)Seebeck Coeff. (µV/K)Power Factor (µW/m·K2)Figure of Merit ZT
PA6 + 0.3 wt % Tuball0.1−51.9 ± 5.70.00011.4 × 10−7
PA6 + 0.4 wt % Tuball0.5−50.3 ± 2.50.00111.3 × 10−6
PA6 + 0.5 wt % Tuball0.6−59.0 ± 4.60.00212.4 × 10−6
PA6 + 0.75 wt % Tuball0.3−58.0 ± 5.30.00091.0 × 10−6
PA6 + 1.0 wt % Tuball0.4−59.8 ± 3.50.00151.6 × 10−6
PA6 + 2.0 wt % Tuball3.8−56.3 ± 2.90.01221.4 × 10−6
PA6 + 4.0 wt % Tuball32.3−46.2 ± 0.50.06897.7 × 10−6
PA6 + 5.0 wt % Tuball64.6−47.0 ± 2.90.14251.6 × 10−4

