1. Introduction
Highly transparent polymers have a very broad application spectrum. Polycarbonate (PC) and polymethyl methacrylate (PMMA) are common examples for applications that require high stiffness like displays, windows or transparent electronic packaging [
1]. Low-density polyethylene (LDPE) and polyethylene terephthalate (PET) is used in applications which require high flexibility like packaging and foils for food and beverages, as well as medical applications like tubing, pipes, and bottles [
2]. Lesser known are Polyvinyl Butyral (PVB) and Ethylene Vinyl Acetate (EVA), which are utilized in laminated panes and windows as interlayer materials [
3]. However, typical polymer properties like high thermal expansion, low stiffness, low thermal conductivity, and low wear and scratch resistance have led to different approaches to using fillers to create a transparent composite with enhanced properties [
4,
5,
6,
7,
8].
Employing glass particles as filler material for transparent polymers with similar refractive indices (RIs) shows promising properties for the application in transparent components [
9]. Glass beads in a polymer matrix lead to increased stiffness [
10,
11] and reduced thermal expansion [
12,
13]. In theory, perfectly matched RIs between matrix polymer and glass filler should result in an unobstructed transparency [
14]. However, in reality, RI matching is far from simple, as impurities and cooling rates at production have a significant impact on the RIs. Also, the RIs of glass and polymers depend on temperature (thermo-optic coefficient) and measured wavelength (dispersion), which can be used for optical temperature sensors [
15,
16]. The RI of typical glasses increases with increasing temperature with a thermo-optic coefficient ∆
nrel/∆
T between −6.7 and 24.1 × 10
−6/K
4 [
17]. However, the RI of the most common transparent polymers decreases with increasing temperature with thermo-optic coefficients which are nearly two orders of magnitude higher (−0.9 to −3.1 × 10
−6/K
4) [
18].
Extensive research has been conducted on optical and mechanical properties of glass-reinforced polymers with similar RI using PMMA and glass fibers [
19] or epoxy filled with irregular-shaped glass particles [
20]. The influence of different particle sizes, filler contents and influence of RI mismatch was studied. All studies show that transmission decreases with increasing filler content, even with identical RI. This was traced back to the wetting behavior of the filler, particularly when using molding processes or inhomogeneity in the RI within the particles or matrix. However, using refractive index oils in cuvettes as a model matrix with perfect wetting behavior, it could be shown that high transparency can also be achieved with high filler contents [
21].
The aim of this study is to create a new type of transparent composite using Micro Glass Flakes (MGF)—a platelet-like glass particle with a high aspect ratio. Micro glass particles such as MGF are a very recent innovation in glass production. Despite that, they have already gained a broad application spectrum due to their chemically inert properties combined with platelet-like morphology [
22,
23]. They are most commonly used as reflective and effect pigments in cosmetic applications [
24] and as filler material to increase the barrier properties of protective coatings [
25].
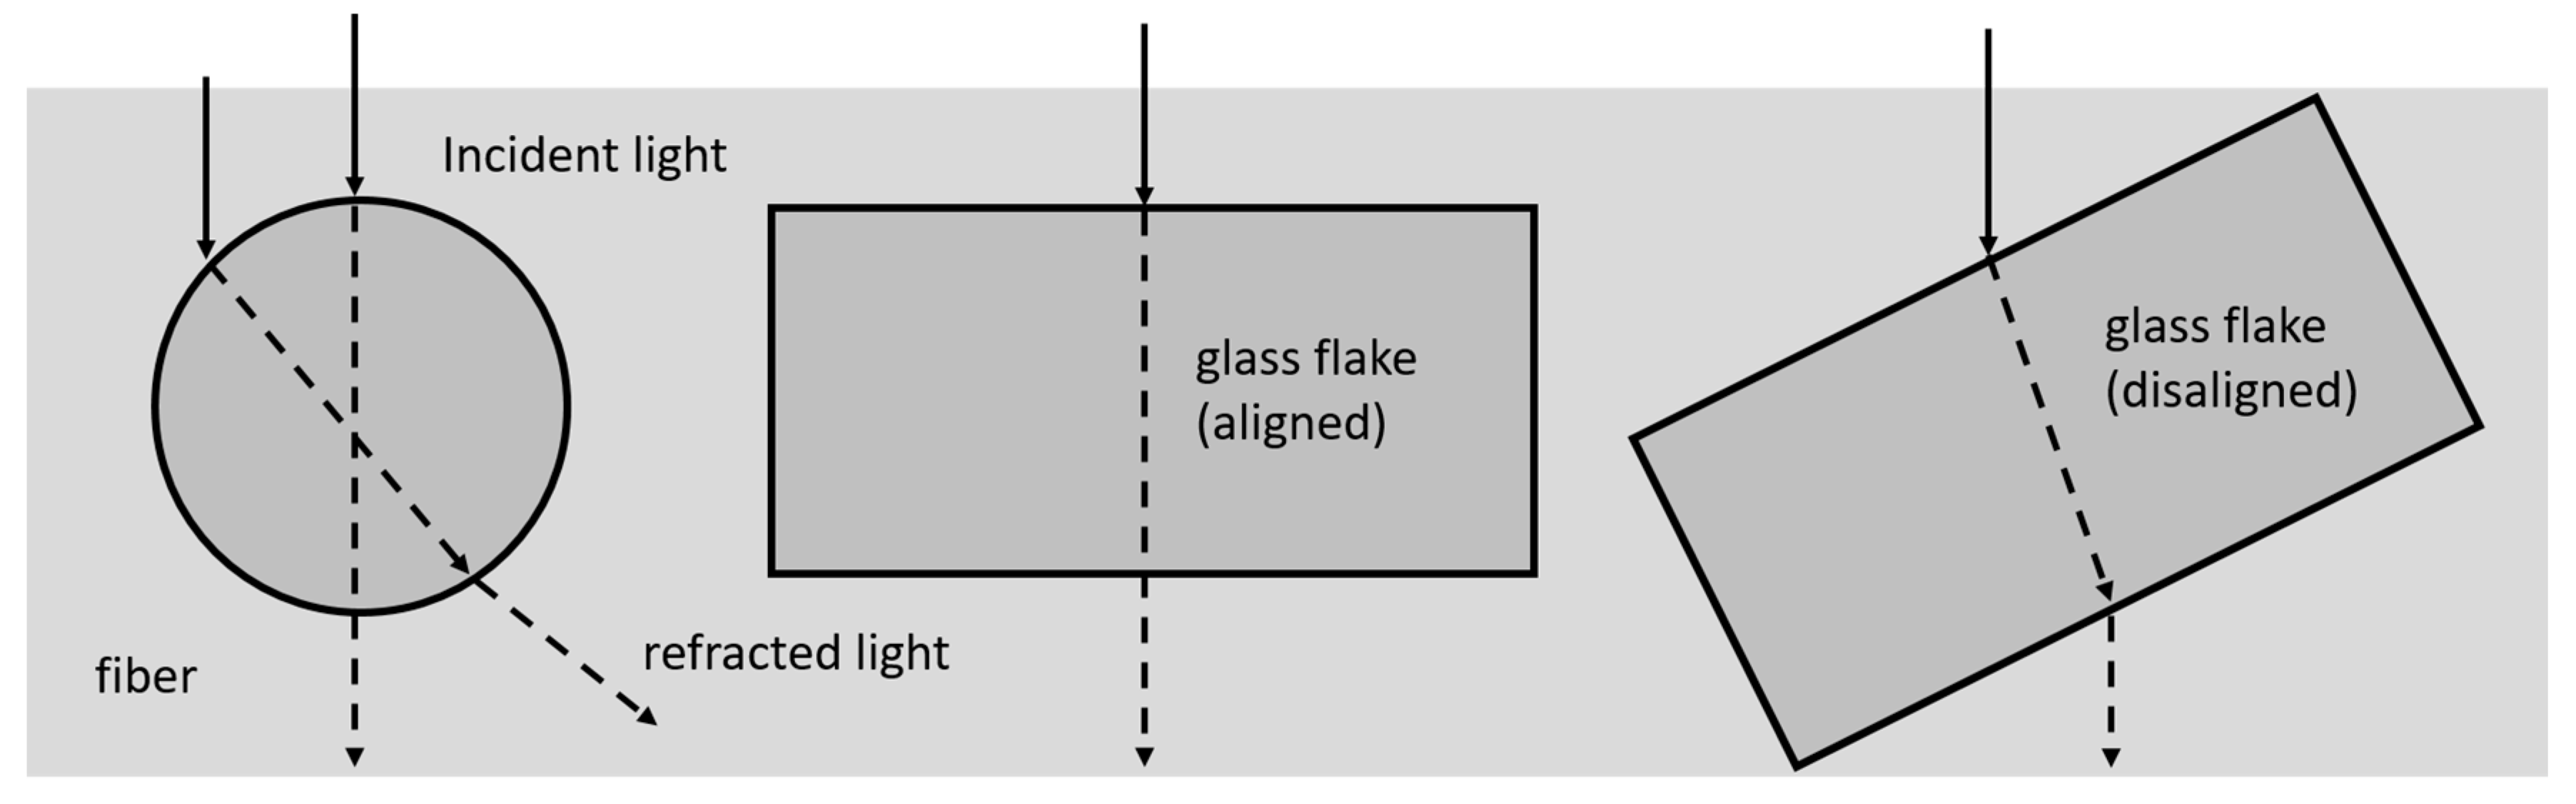
A method was developed to incorporate these glass flakes in a model polymer via a slurry-based lab-scale casting process in order to increase the ordering of these flakes. With this combined approach, using platelets in a highly ordered assembly, the influence of residual RI mismatch between particle and matrix on the transparency and haziness of such a structure could be minimized, as displayed in
Figure 1. At the same time, glass flakes with a high aspect ratio could greatly improve the mechanical properties of the composite in all in-plane directions simultaneously.
2. Experimental
2.1. Materials
2.1.1. Micro Glass Flakes
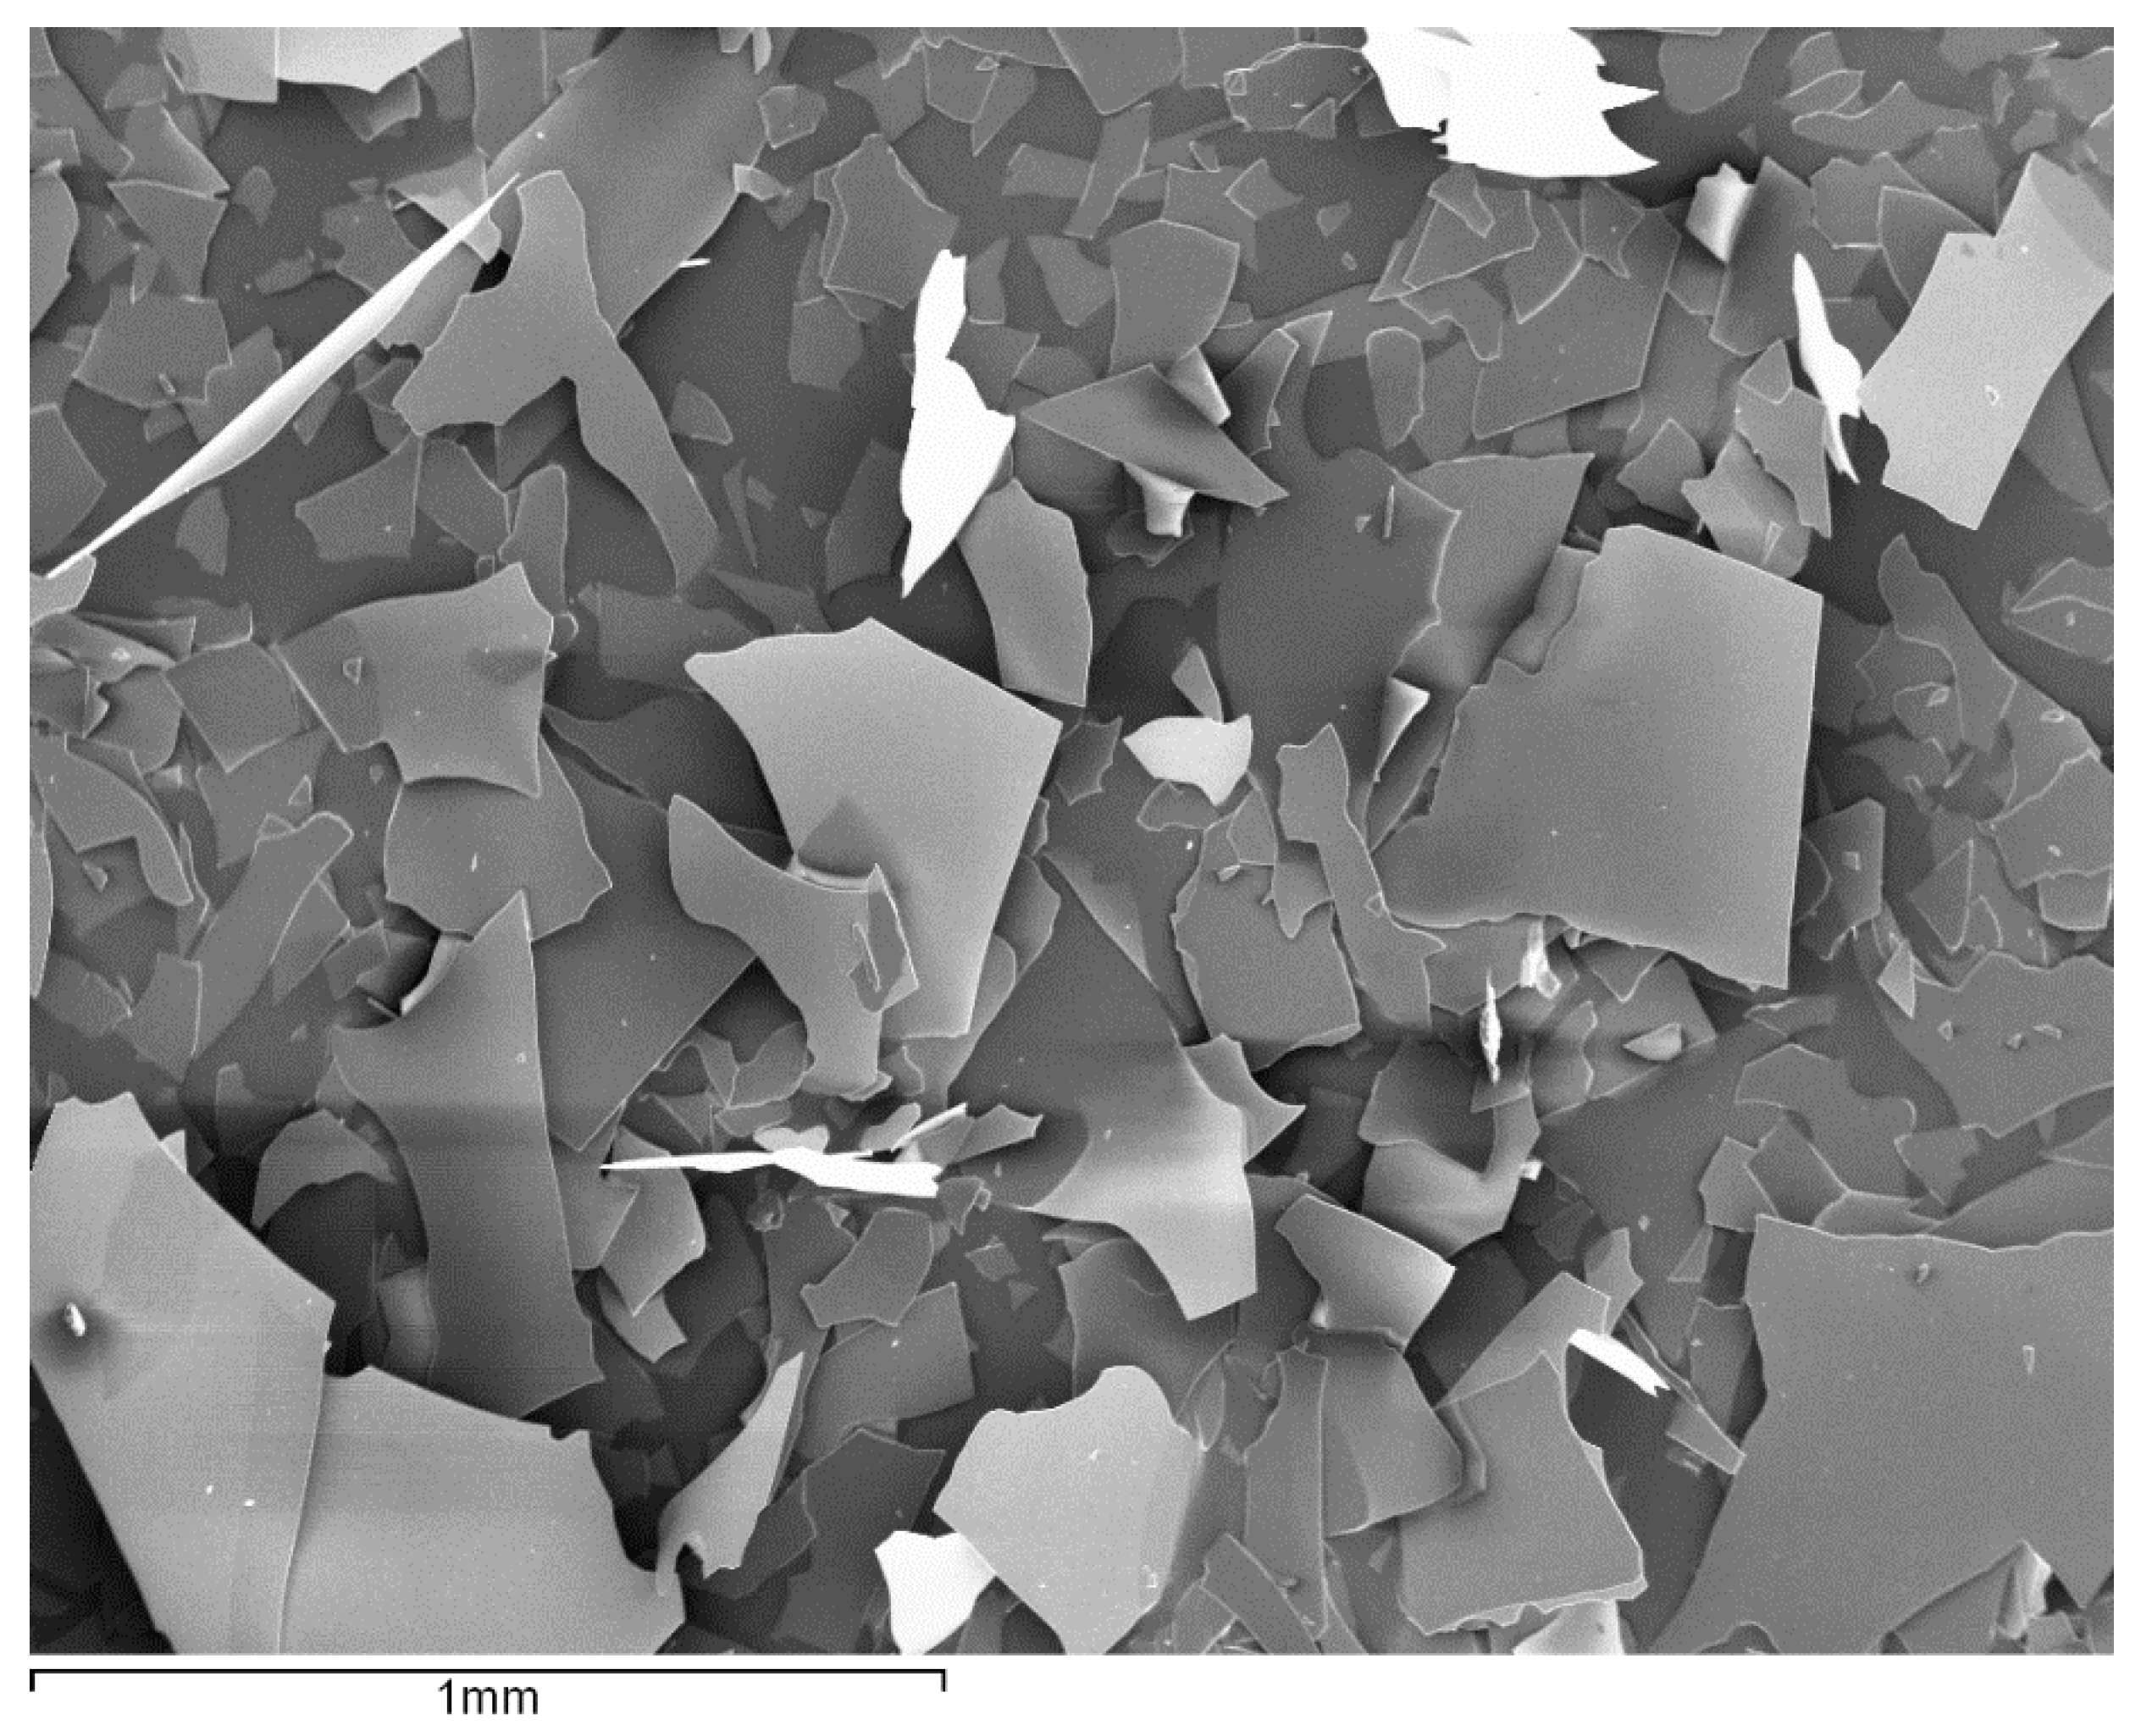
Three different types of Micro Glass Flakes (MGF) were used in this study. Two of them are commercially available from Glassflake Ltd
® (GF100, GF001, Leeds, UK) [
26] and one type was derived by a laboratory flaker setup (GF-V8) with a boron-rich silicate glass composition (
Figure 2). They differ in mean diameter, thickness and thus, in the aspect ratio, as well as the RI due to a different glass composition between the commercial MGF and from the laboratory flaker setup (
Table 1).
2.1.2. Polyvinyl Butyral (PVB)
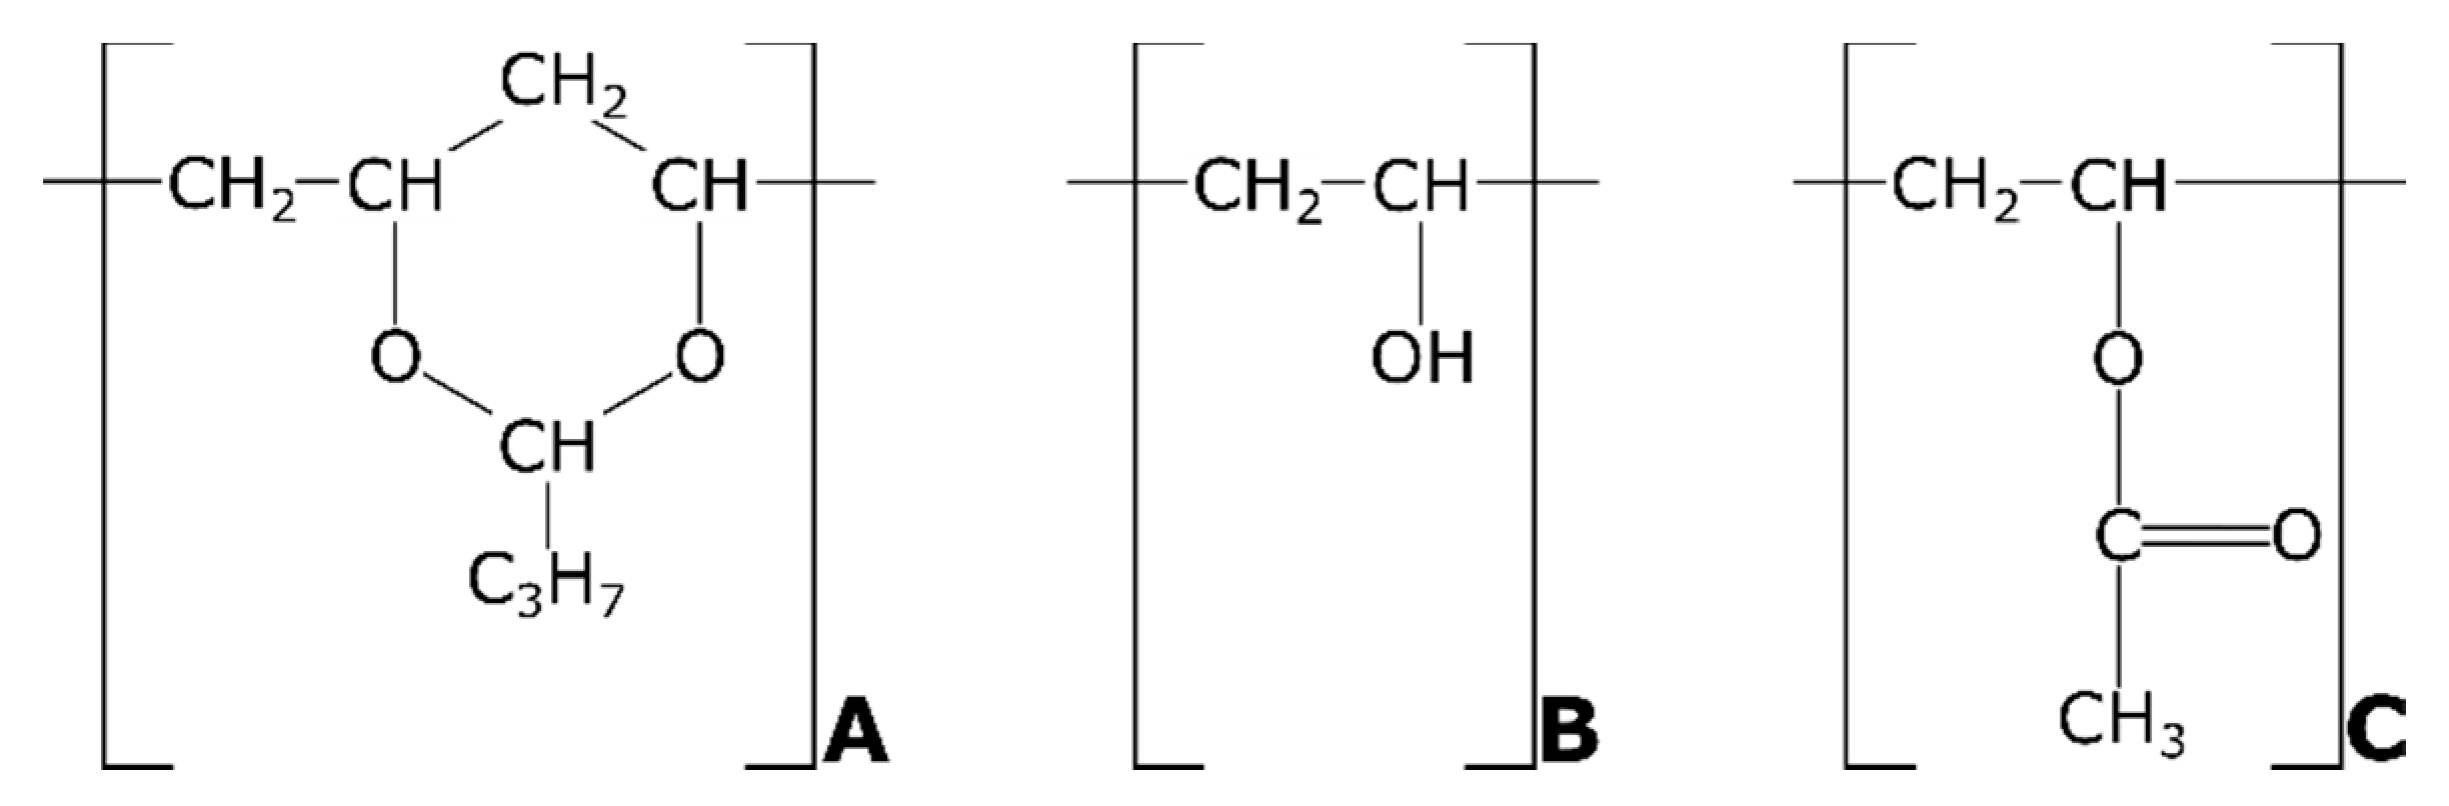
Polyvinyl butyral (PVB) is considered to be an acetal and is formed from the reaction of an aldehyde and alcohol. The general structure of PVB is shown in
Figure 3, whereby the shares of PVB, polyvinyl alcohol (PVOH), and polyvinyl acetate segments are variable. Depending on the supposed application of the PVB, the relative amounts of these segments are controlled but they are generally randomly distributed through the molecular chain.
For this study, commercially available PVB powder (Mowital
® from kuraray
® Europe GmbH, Hattersheim am Main, Germany) was used. Mowital
® is offered in a range of various grades, which are mainly determined by their molecular weights and their degree of acetalization [
28]. For this study, B 30 H was used as a base material for all composites with an average molecular weight and degree of acetalisation (
Table 2).
2.1.3. Softener 3G8
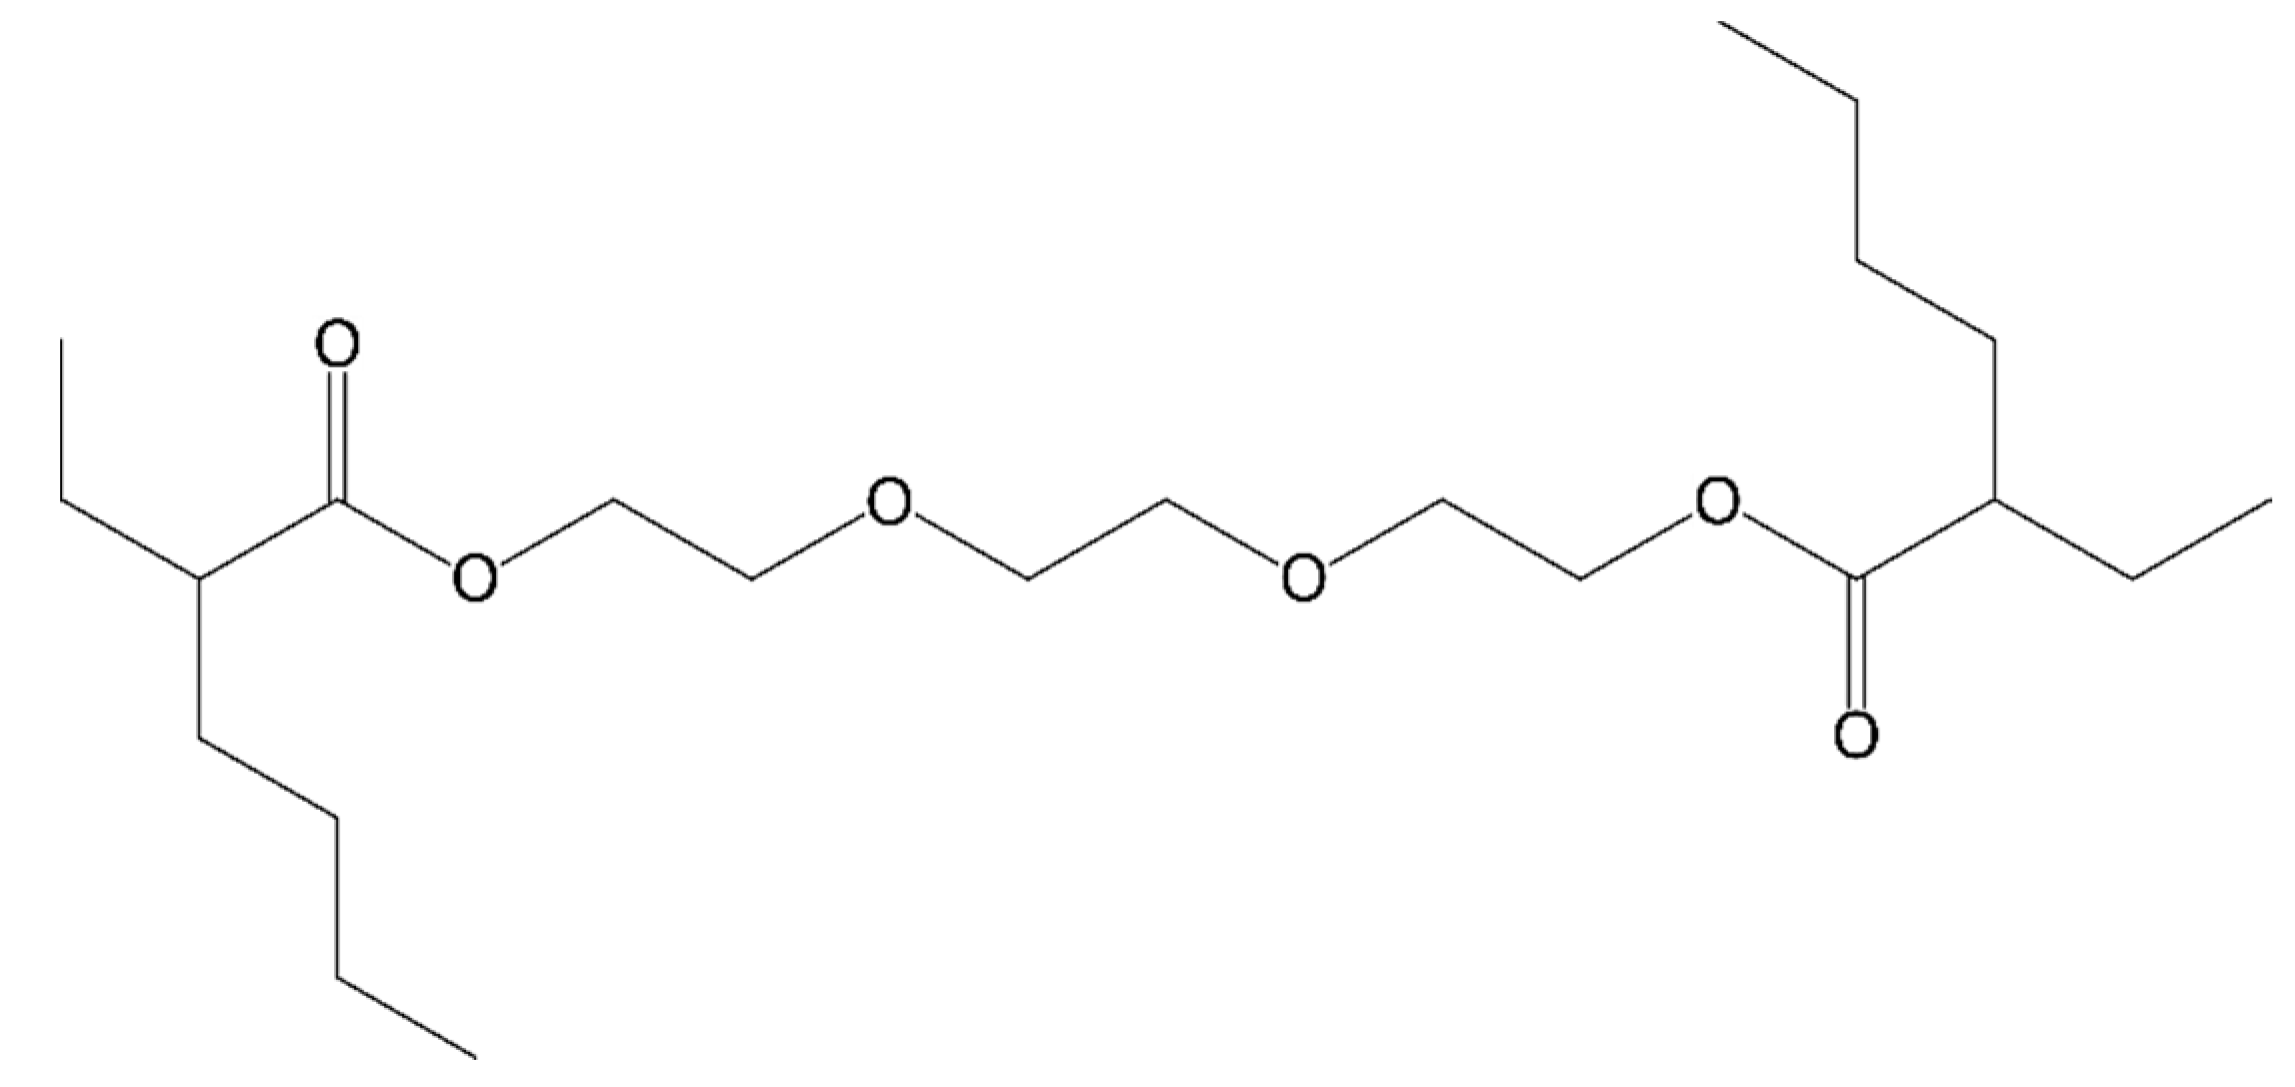
Softeners are a standard ingredient in commercially available polymer products. They are added to increase the flexibility and workability of the polymers. In PVB applications like interlayer sheets for safety glass, Triethylenglycol-di-(2-ethyl hexanoate) or 3G8 is commonly used, with a density of 0.97 g/cm
3 and a molecular weight of 402.57 g/mol with contents ranging from 20–27 wt %. [
29] The molecular structure is shown in
Figure 4.
In this study, softener was added mainly to decrease the RI of PVB to further improve index matching with the MGF.
2.2. Preparation of Composite Sheets
2.2.1. Slurry Preparation
The PVB–MGF composites were derived via a slurry-based preparation method. This process was chosen as it allows to carefully control and adjust the composition and homogeneity of the composites as well as the orientation and distribution of the glass flakes.
In the first step, Mowital® B 30 H powder was mixed with ethanol until a clear solution with honey-like viscosity was achieved. For this, B 30 H powder was added in small portions to ethanol in a rotary flask over a 48 h period. PVB powder is hygroscopic, with water not only influencing the mechanical but also, the optical properties. Therefore, the flask was continuously purged with dry nitrogen gas during the mixing period. The final solution was then kept in an air-tight glass drum to prevent the evaporation of ethanol and contamination through humidity. The final composition of the solution was 30 wt % B 30 H to 70 wt % ethanol.
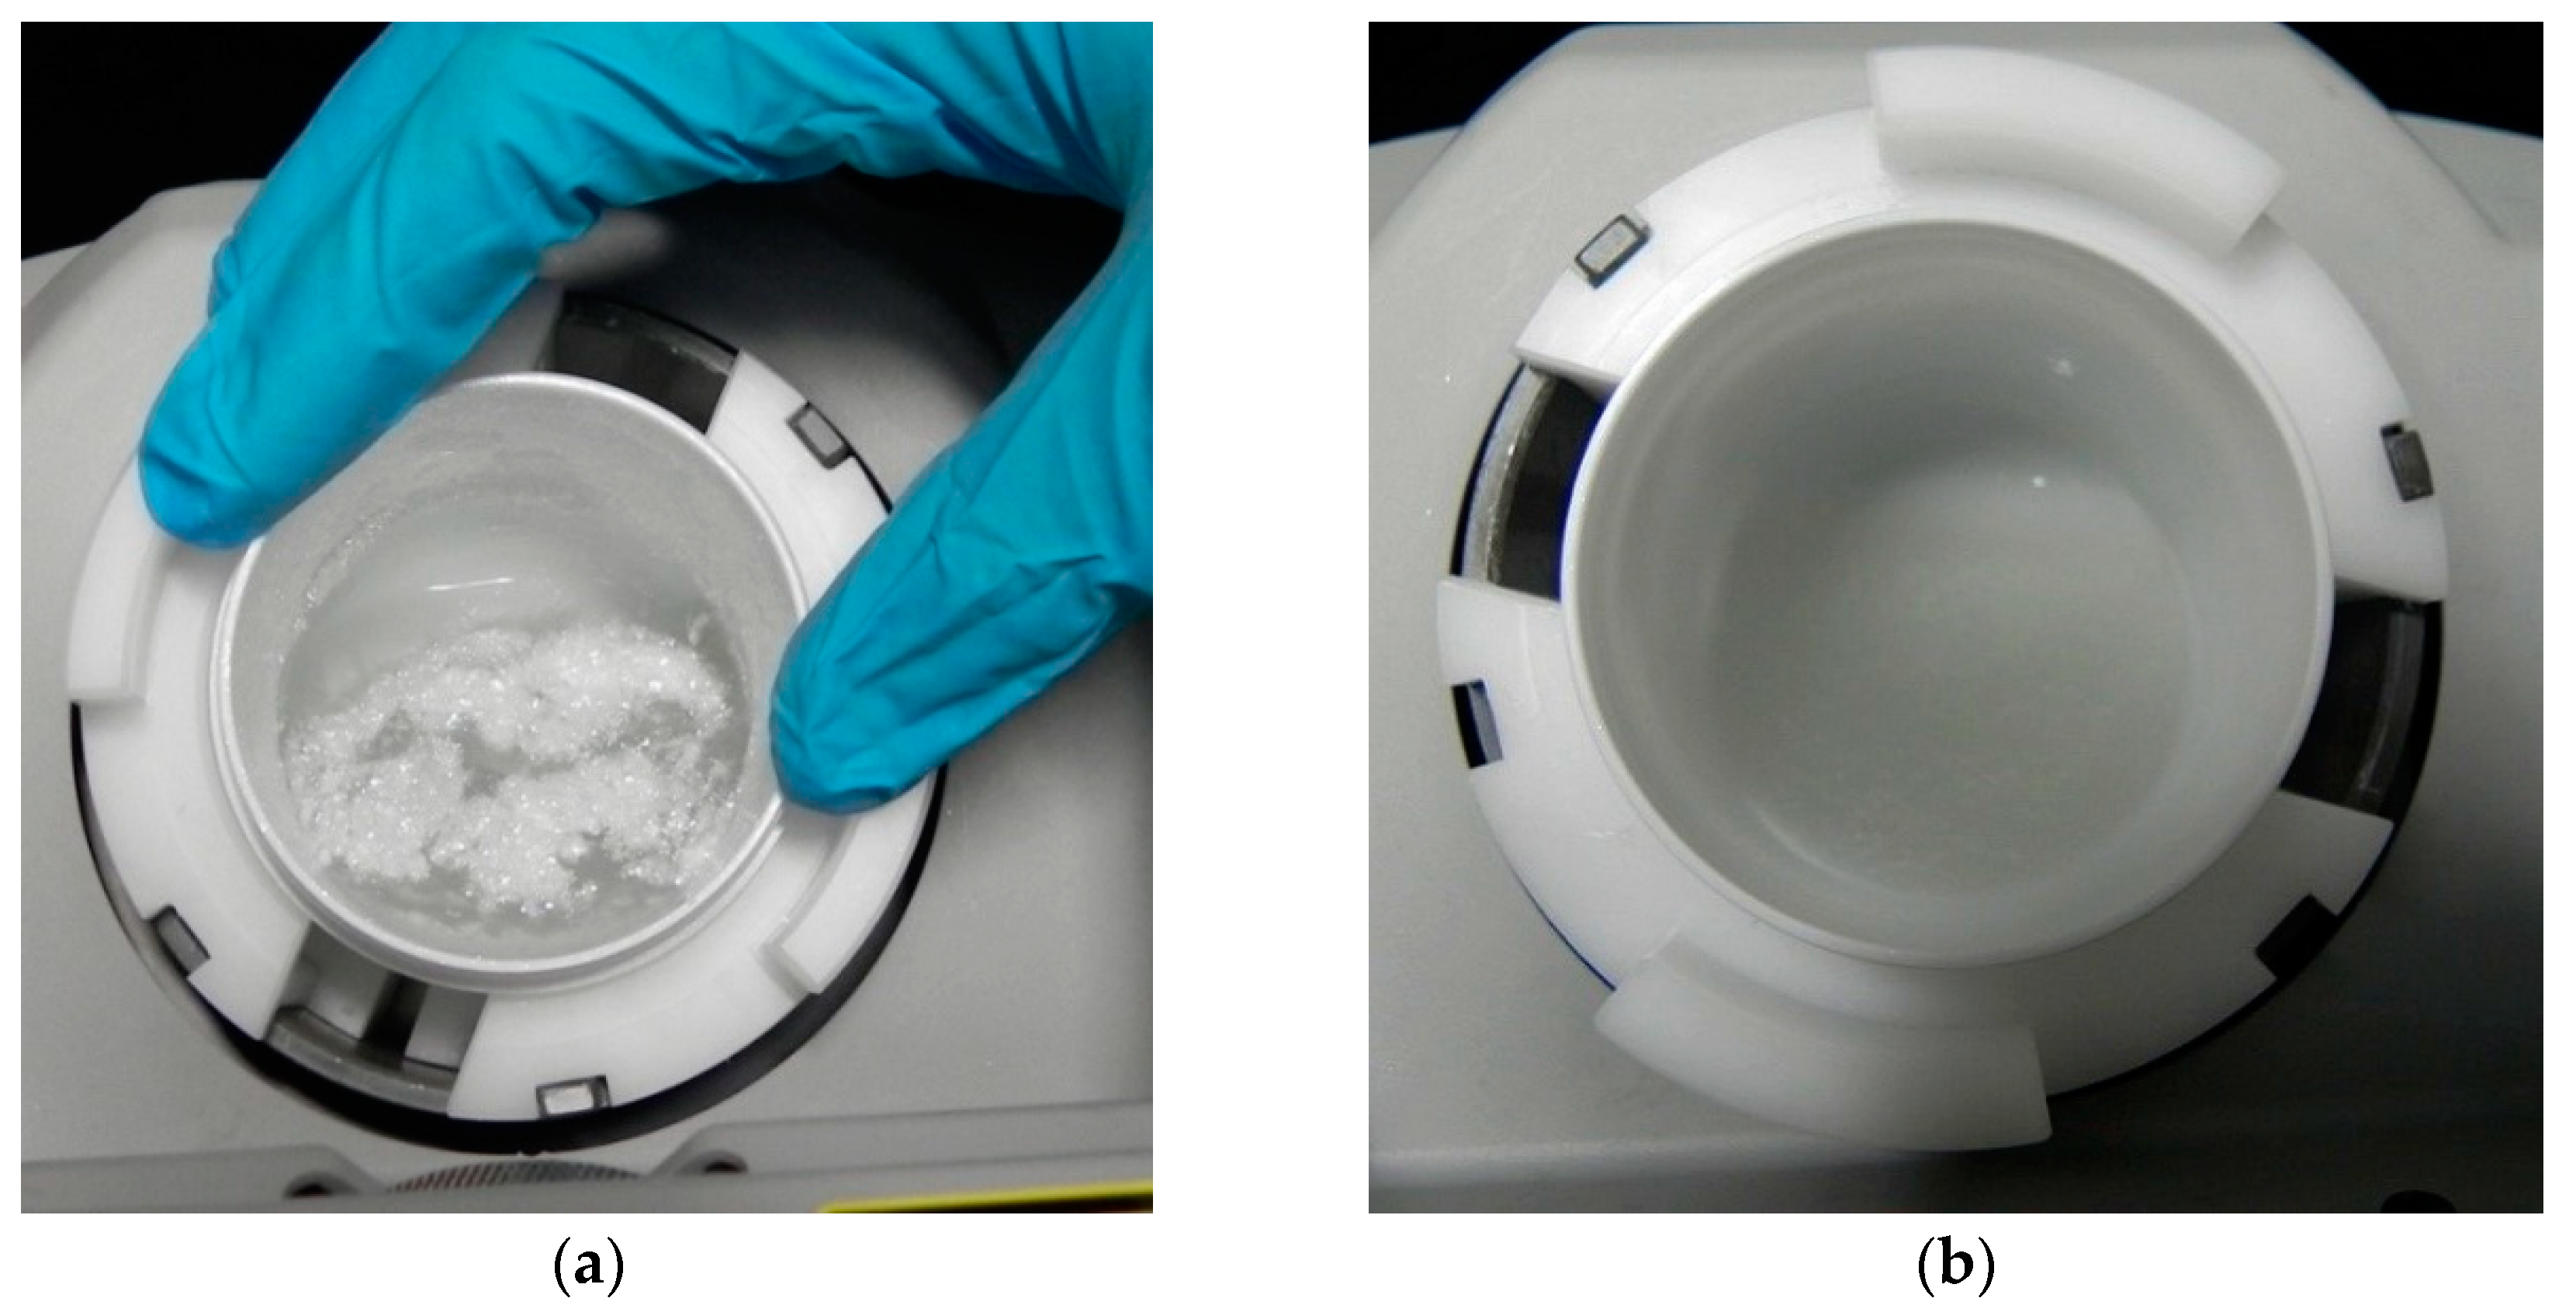
In the second step, defined amounts of MGF were added to the solution and mixed using an AR-100 Thinky Mixer (Thinky
® U.S.A. INC., Laguna Hills, CA, USA). To ensure a homogeneous distribution of MGF in the slurry, a total of 6 min of mixing time at 2000 rpm was selected. To further prevent any kind of gas or bubble formation, an additional degassing step of 6 min was added after the initial mixing. The resulting slurry was a clear, homogeneous and bubble-free paste (
Figure 5a,b).
In this study, the fraction of MGF and softener in the final composite are given as volume percentage (MGF) and weight percentage (3G8) relative to the PVB. To calculate the necessary weight of the raw components to achieve the desired composition, the following calculations were used:
Using Equations (1), (2) and (3) with
as mass of PVB powder,
as mass of the PVB ethanol solution,
as the weight fraction of PVB in the solution,
as volume of PVB,
as volume of the MGF,
and
as the specific density of PVB and MGF, respectively, and
as the volume fraction of MGF in the final composite, the mass of MGF can be calculated with Equation (6).
When softener is added, the relative increased volume of the PVB
can be calculated using Equations (7) and (8) with
as required mass of softener,
as weight fraction of the softener and
as the specific density of the softener.
The weight content of MGF in the final composite can, therefore, be calculated using Equation (9).
2.2.2. Forming and Drying
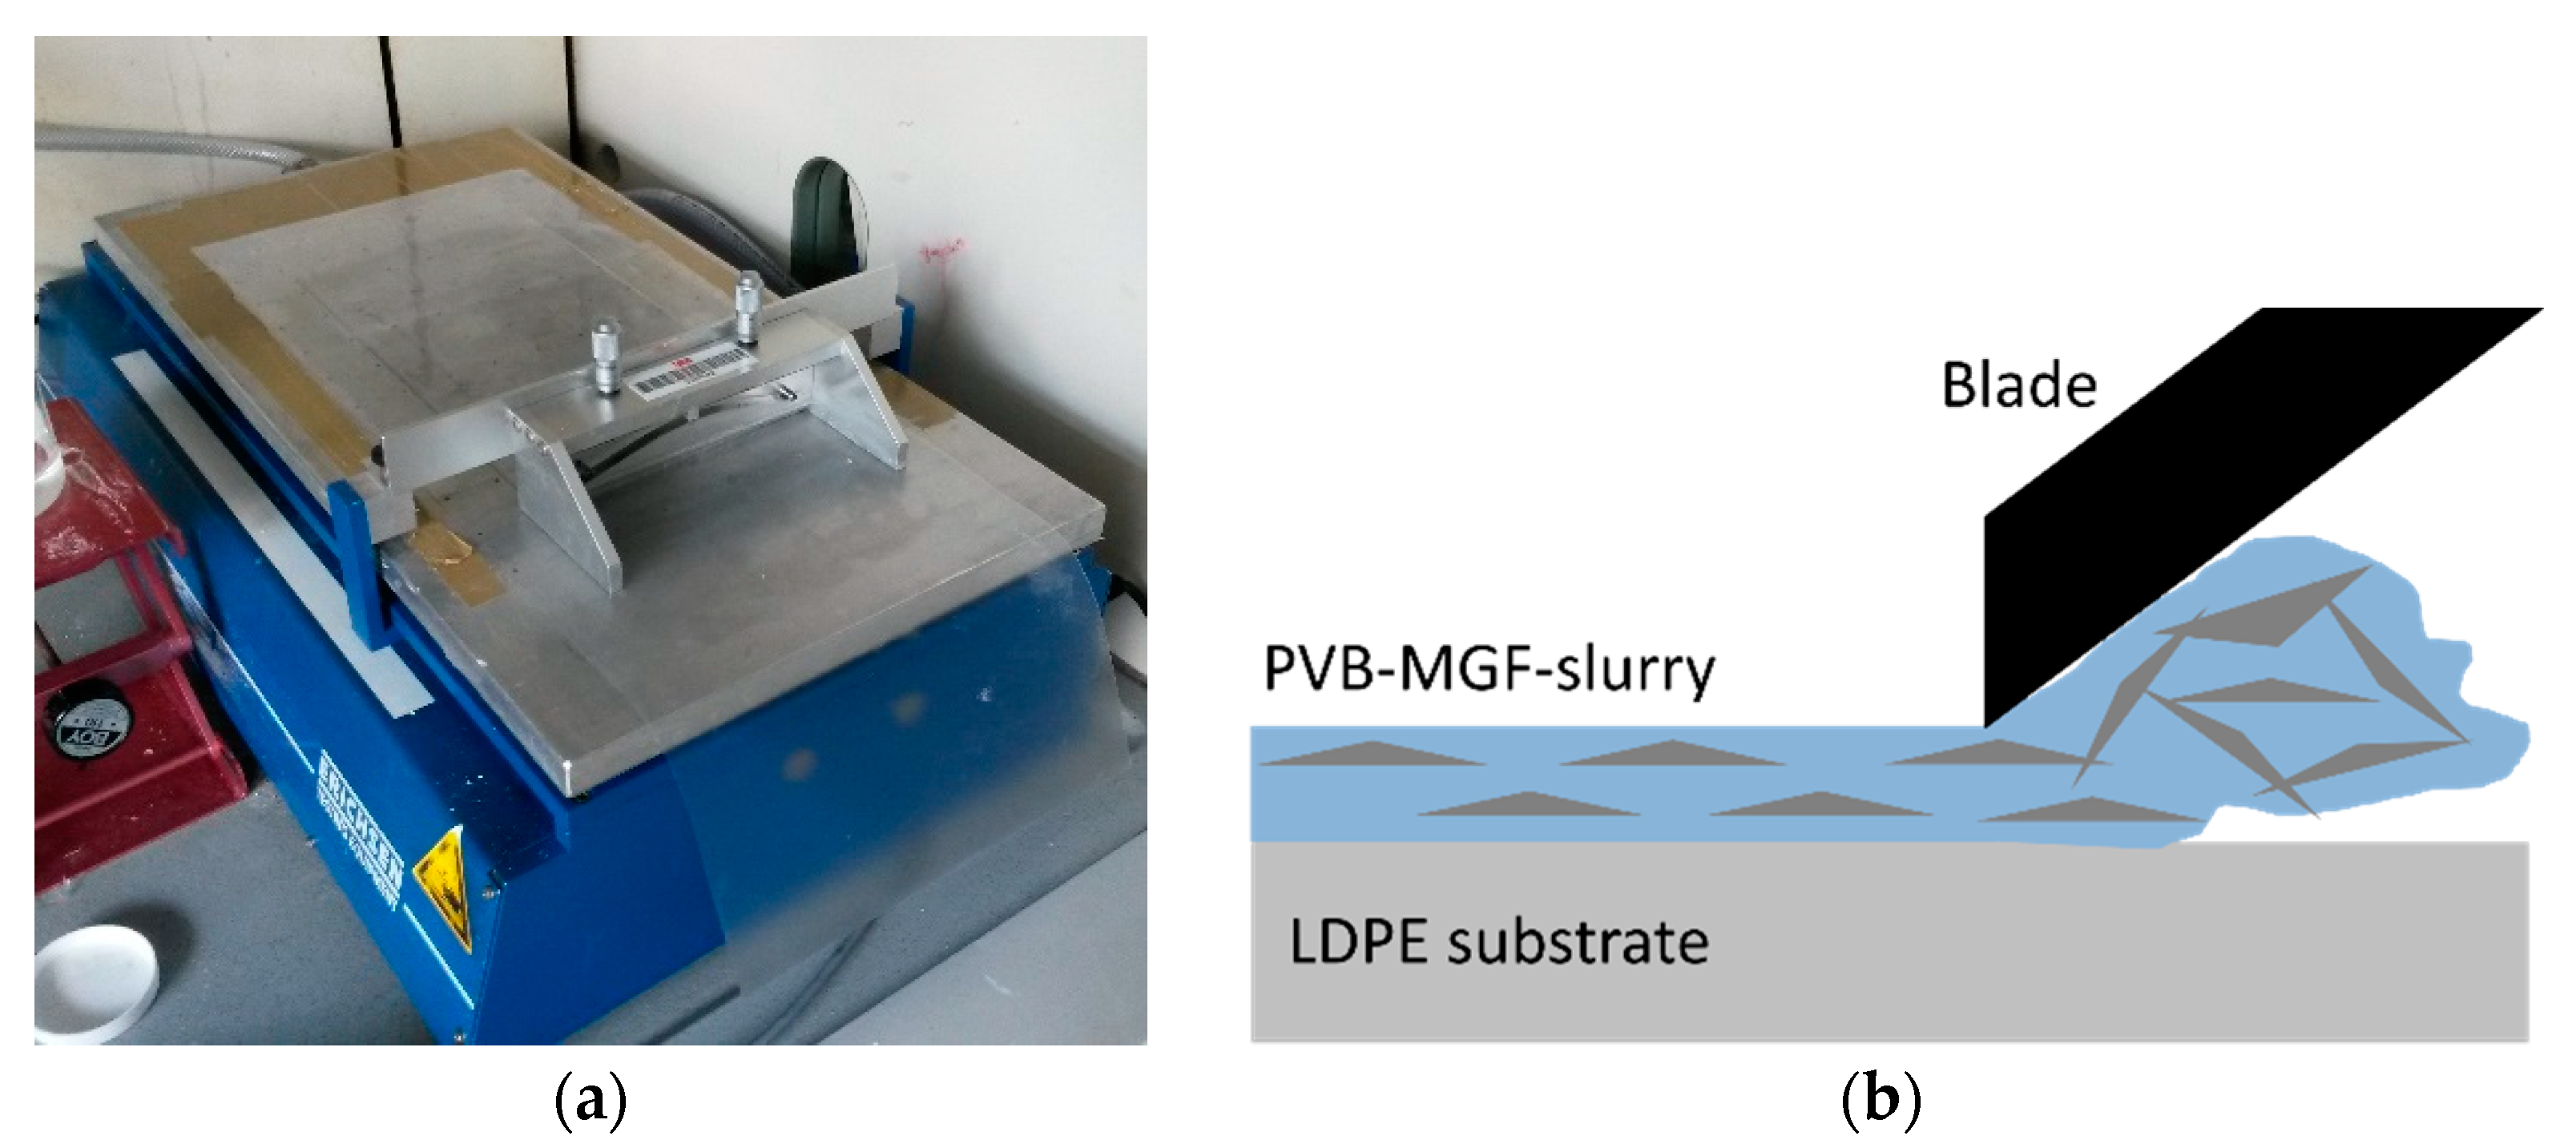
To produce a composite with homogenous thickness and distribution of MGF, a blade casting setup, also known as doctor blade or knife coater, was used. As a substrate for the slurry, a standard 0.1 mm LDPE-foil was used. Due to the long carbon chain of the LDPE with no hydrogen groups for bonding, no to very little adhesion and sticking behavior to the PVB was observed. The substrate foil was thoroughly cleaned with ethanol before casting and was held in place by an array of holes combined with an applied vacuum.
The sheets were cast using a blade with a width of 250 mm (
Figure 6a). The gap between the blade and the substrate foil was set to precisely 0.5 mm, which was found to be the smallest gap to still yield foils with an even thickness distribution, while at the same time, providing a geometric constraint which is necessary to align the MGF (
Figure 6b). The sheets were drawn with a speed of 2.5 mm/s.
After the casting step, the sheets were quickly transferred into a drying cabinet where they were kept for 5 to 7 days at room temperature and a relative humidity of below 5%. To ensure that no ethanol or other form of moisture remains in the final composite, the sheets where then further dried in a vacuum oven at up to 140 °C for 6 h.
2.2.3. Lamination
After drying, the sheets have a mean thickness of 120 µm (PVB without MGF) to 300 µm (PVB with 26 vol % MGF). However, due to the inhomogeneous drying, small gas bubbles, as well as a rough surface, particularly at a high volume content of MGF, cannot be prevented. Therefore, an additional lamination step is necessary. For this, the sheets were cut into 60 mm round blanks. Three blanks were stacked and placed into a stainless steel forming mold with mirror-finished surfaces. The forming mold was then placed into a sealed vacuum bag with a vacuum pump attached. The setup was then placed into a hot press. With the vacuum pump active, the press was heated to 100 °C and a pressure of 2 kN was applied for a duration of 20 min. The setup was cooled and the composite was taken from the mold.
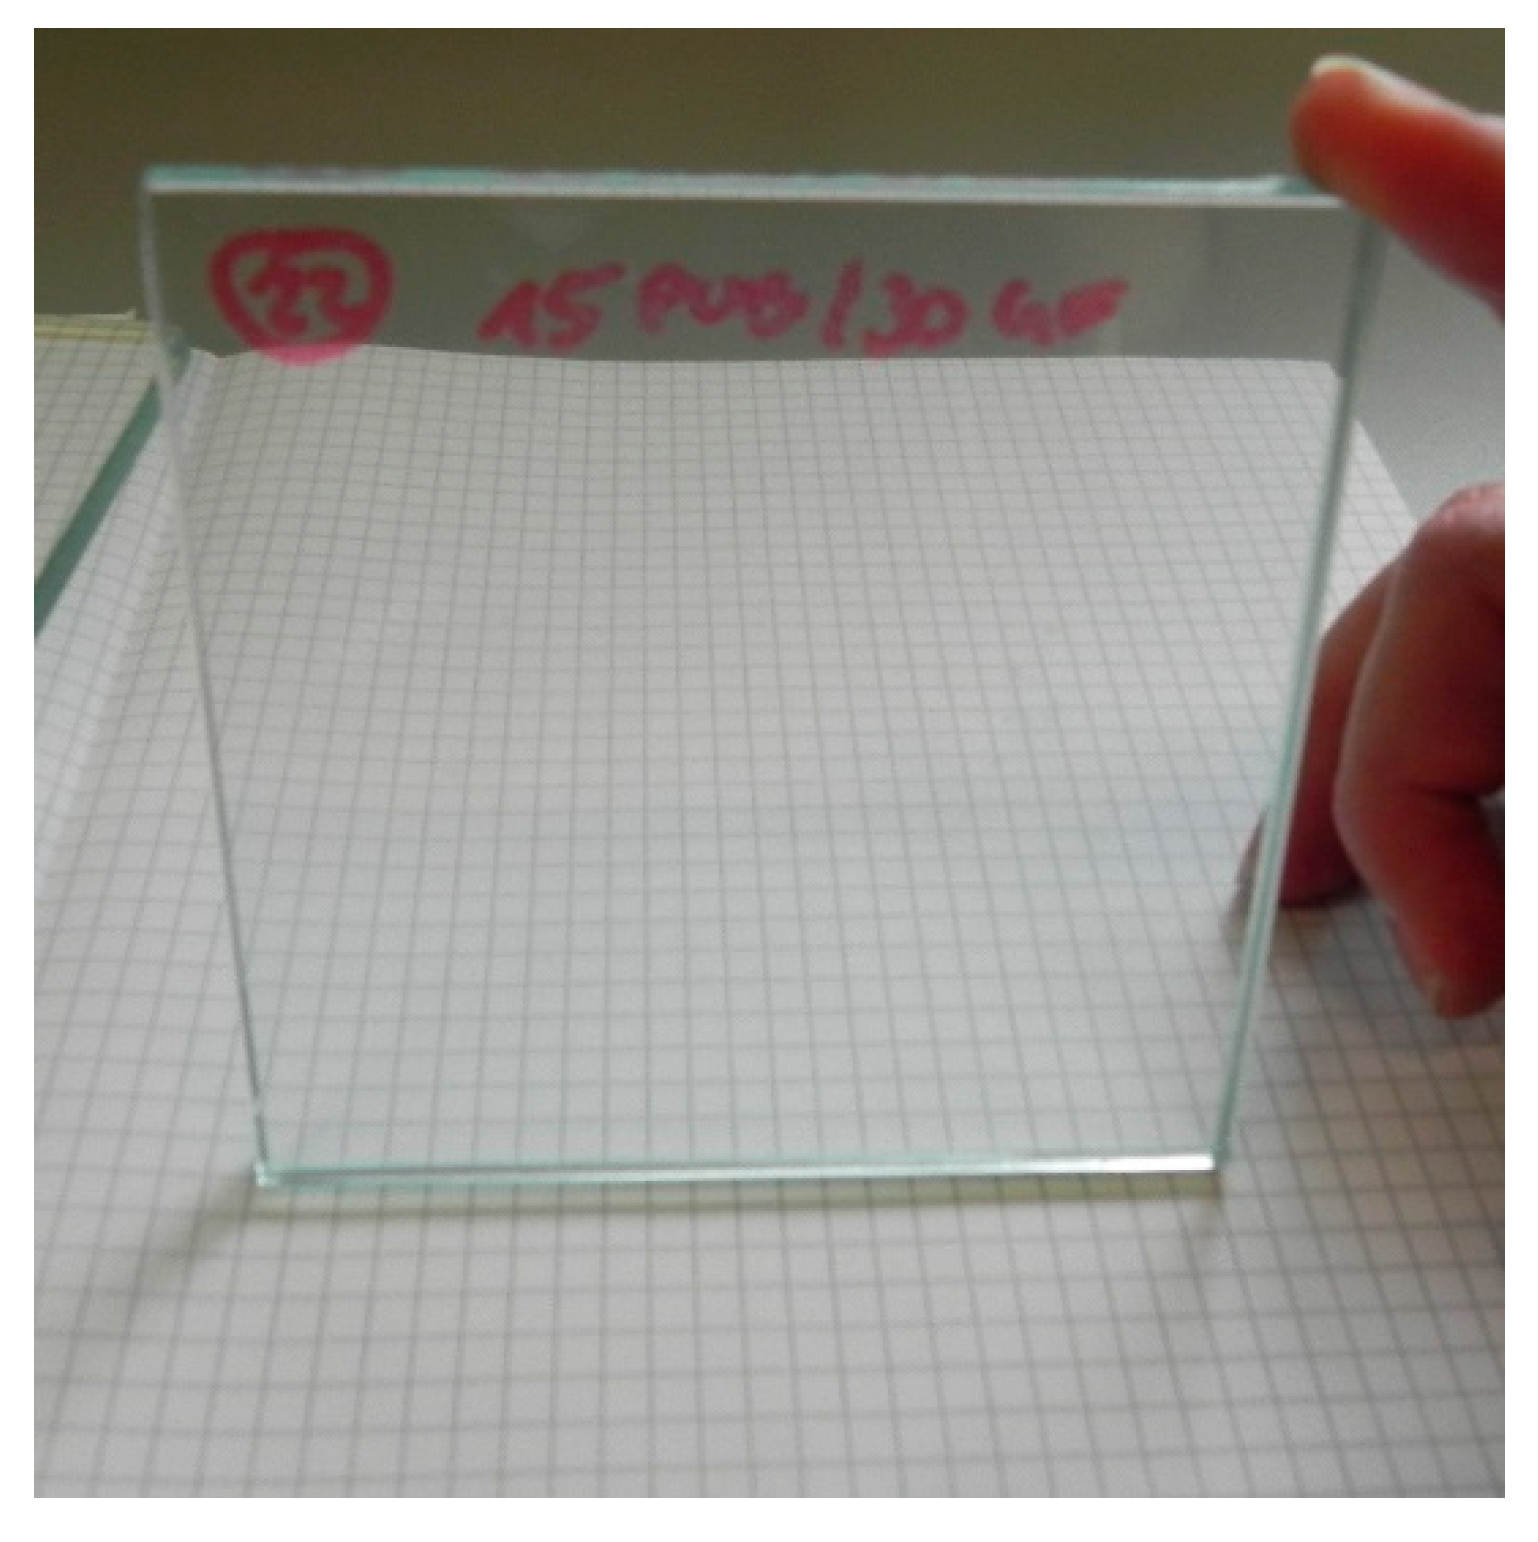
It was found in mechanical characterization that the roughness and homogeneity of the samples were sufficient. However, in optical measurements, the samples were found to be too rough. Roughness greatly influences the optical properties, especially the haziness of a sample due to the scattering of light on an uneven surface. Therefore, all samples were laminated between two glass sheets for optical characterization. As glass panes, Optiwhite™ glass sheets from Pilkington
® (St Helens, UK) with a thickness of 2 mm were used. The additional haziness and loss of transmission due to the addition of two glass panes on both sides can be neglected (
Figure 7).
2.3. Experimental Characterization Methods
2.3.1. Transparency and Haze Measurement
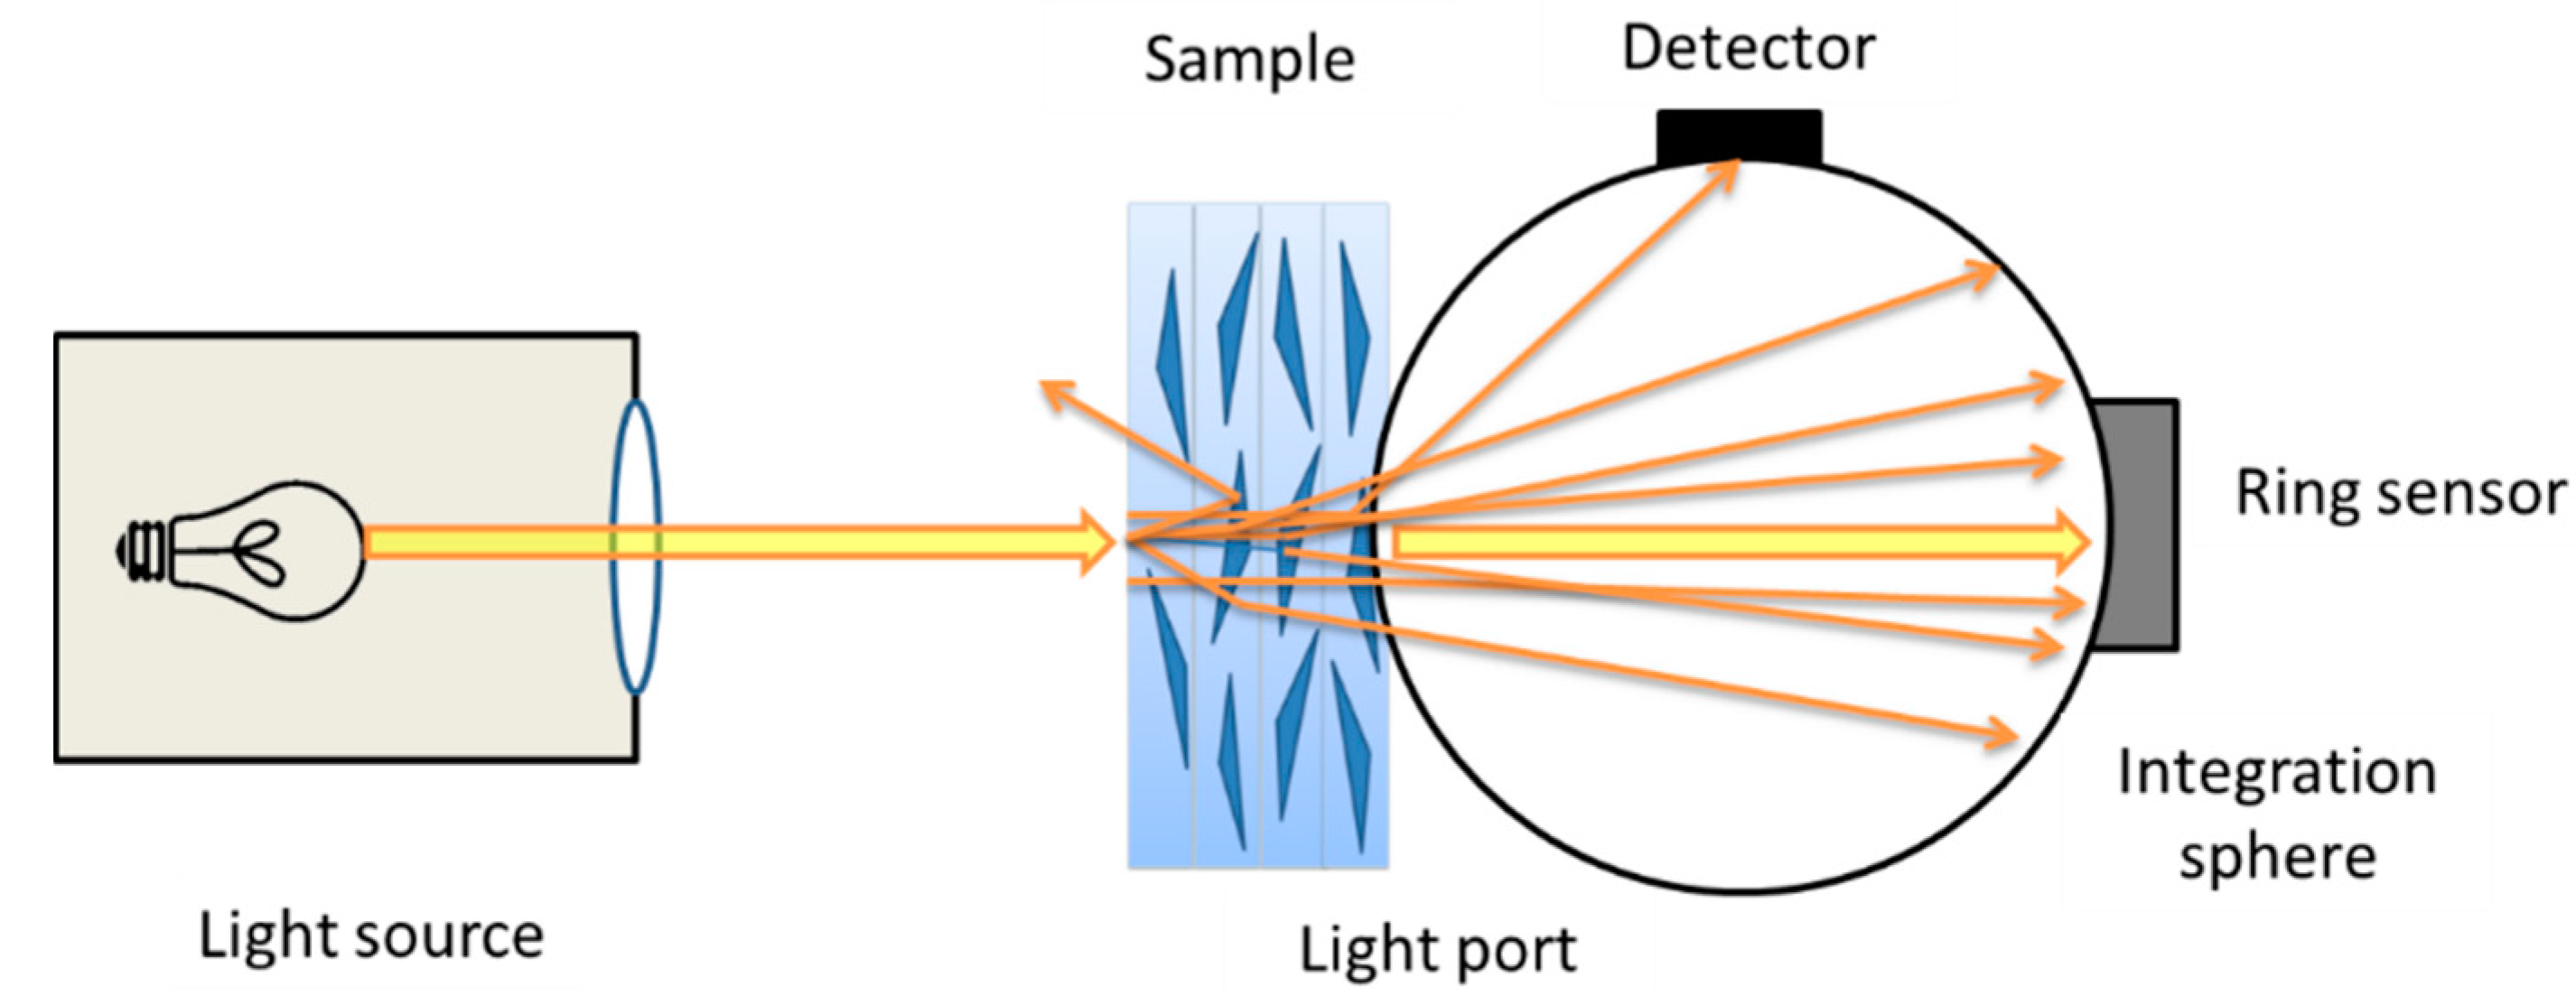
The transparency and haze of the composite were measured according to standards ISO 13,468 and 14,782 [
30,
31] using a HAZE-GARD plus
® haze meter from BYK-Gardener
® (Geretsried, Germany). The total transmission of a sample is measured using an integrating sphere. However, depending on the scattering behavior of the sample, transmitted photons either pass the sample without disturbance (clarity) or get scattered away from the direct path and, therefore, lead to a phenomenon described as haziness. Haze is measured as relative transmission with an angle above 2.5° from the direct optical path. Clarity is defined as relative transmission within 2.5° of the direct optical path. The difference can be measured using a ring detector inside the integrating sphere (
Figure 8).
2.3.2. Measuring of RI
The RI of the PVB sheets and the MGF was determined using an Abbemat MW
® (Anton Paar
®, Graz, Austria) using a standard wavelength of 589.3 nm (Na-D) at a fixed temperature of 20.0 °C. The difference of RI between matrix and particle is commonly described by the ratio
m, which can be calculated with Equation (10).
2.3.3. Morphology Characterization
The morphology of the composite sheets was determined using light microscopy, as well as SEM imaging (Zeiss Leo 1530, Carl Zeiss Microscopy GmbH, Jena, Germany). To prepare the samples, they were cooled down in liquid nitrogen and then broken to receive a fresh area of fracture and cross-section of the samples without any preparation artifacts.
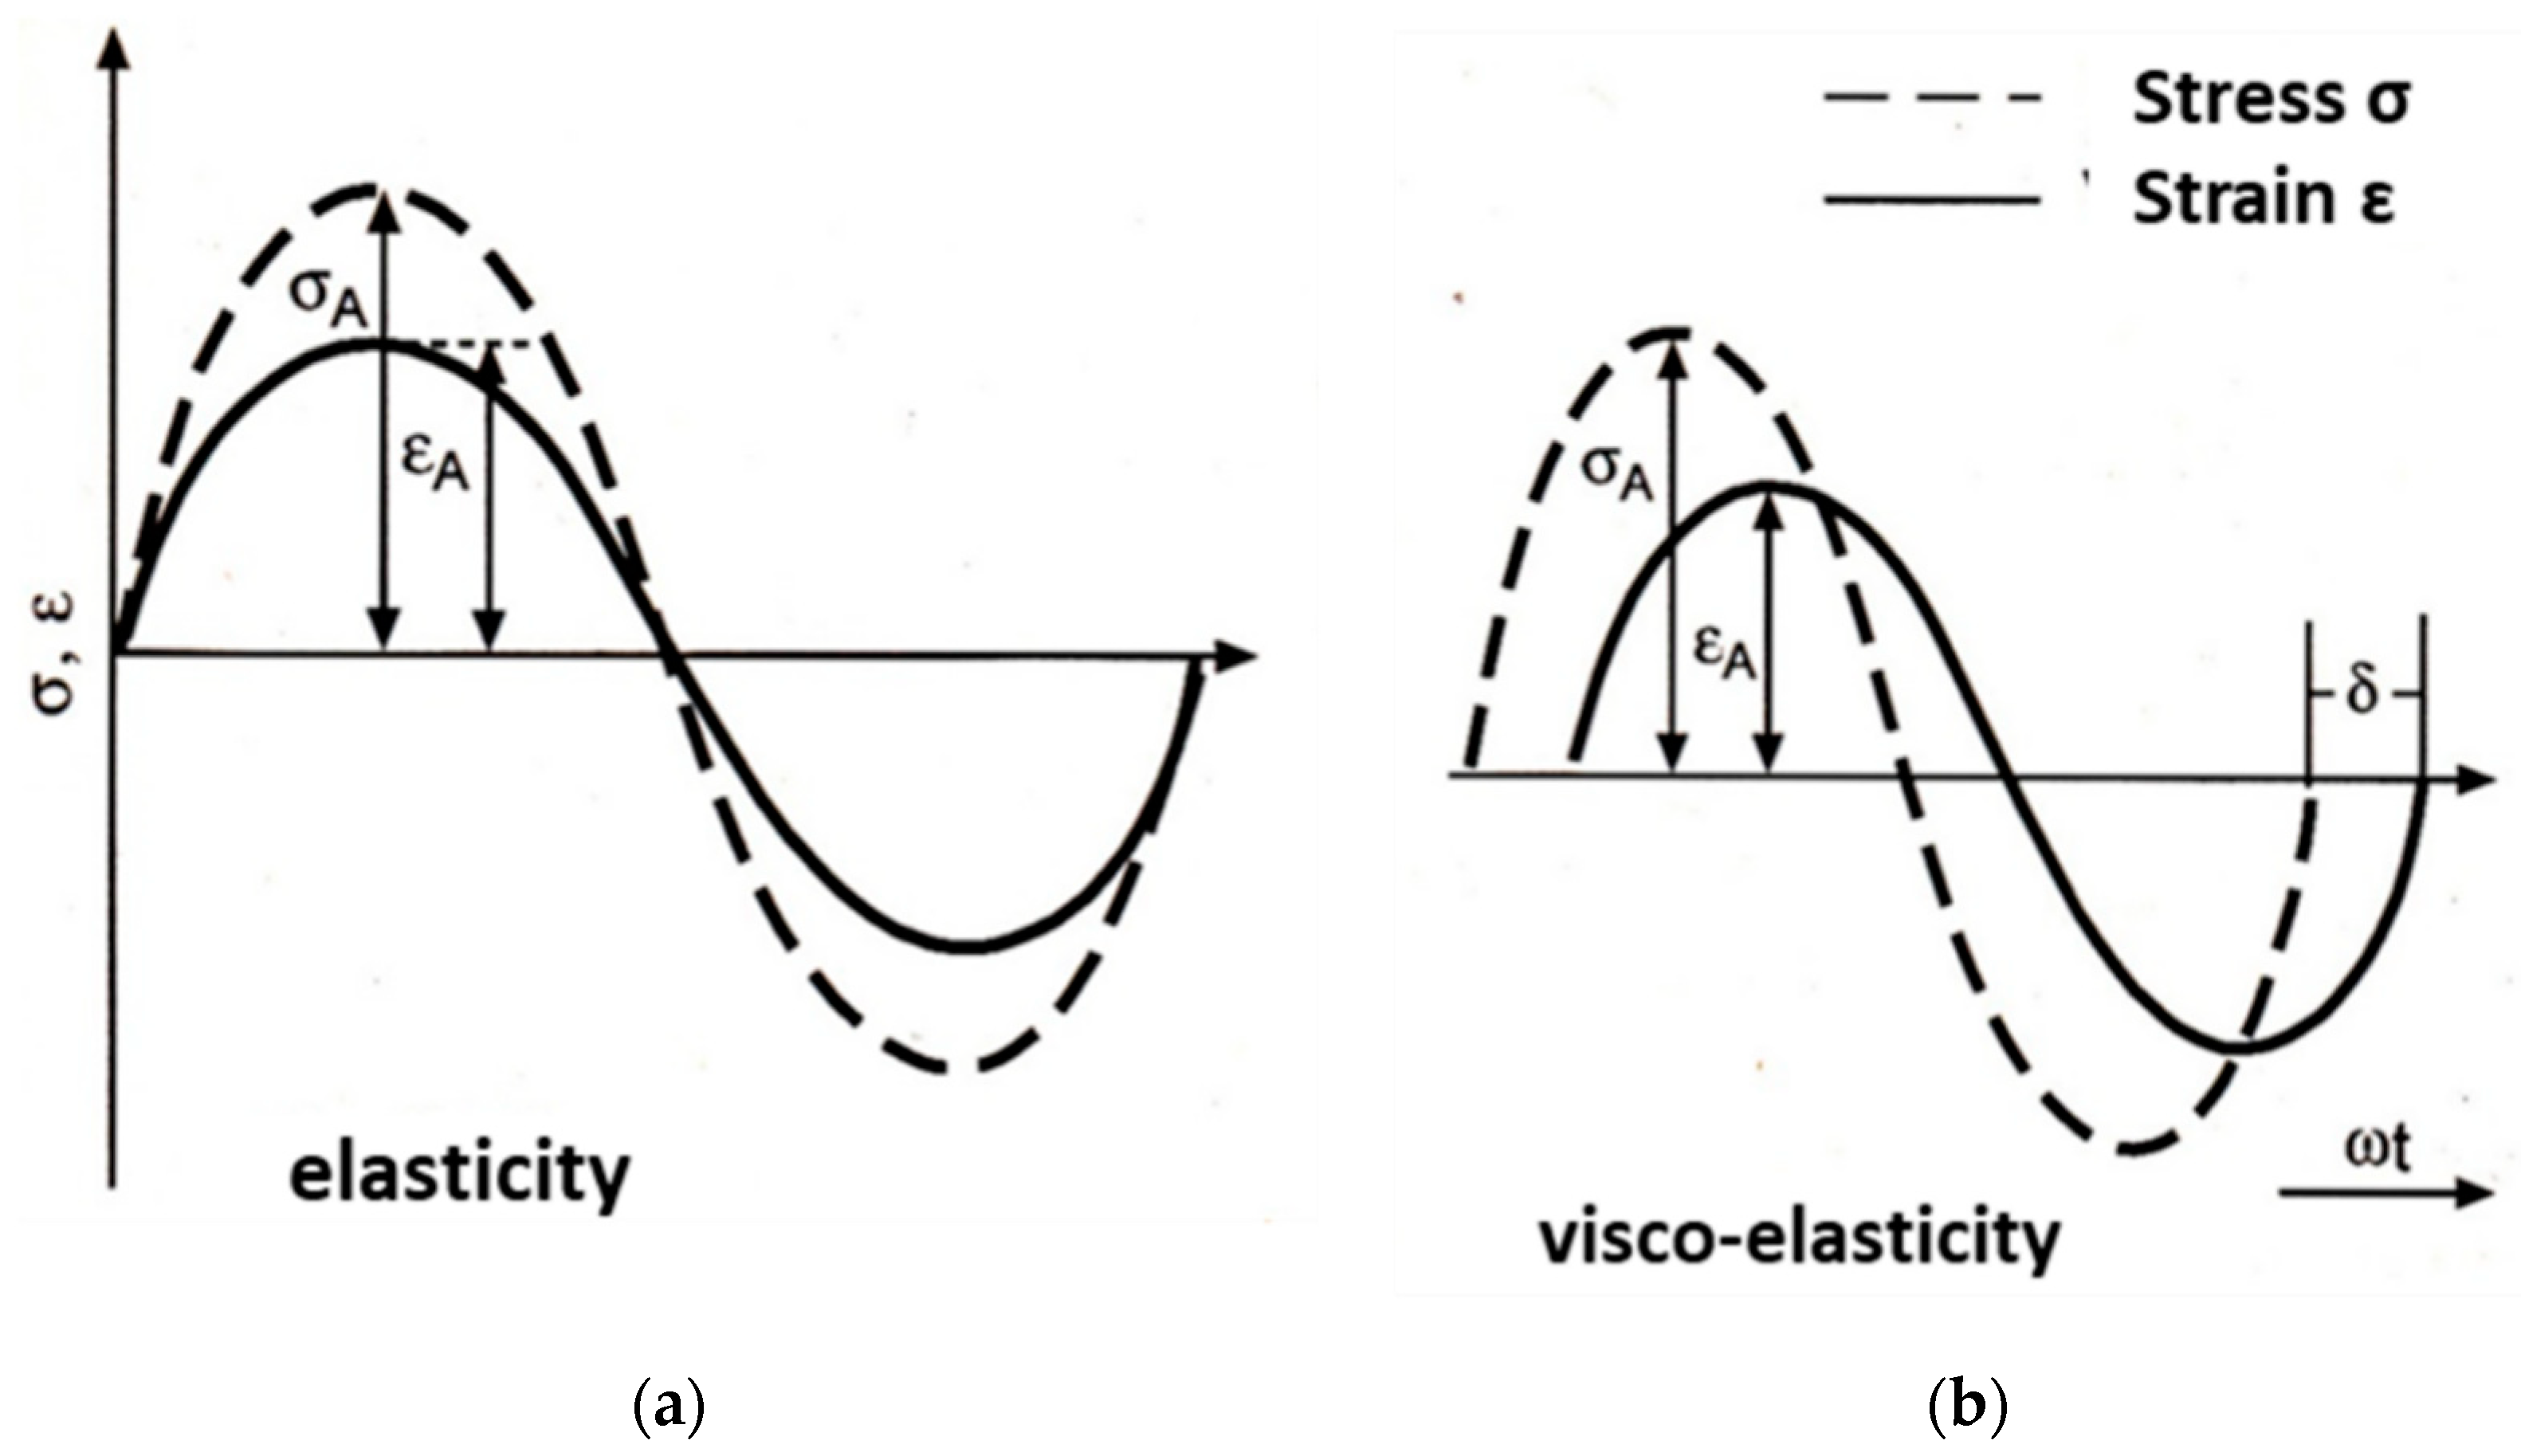
2.3.4. Dynamic Mechanic Analysis (DMA)
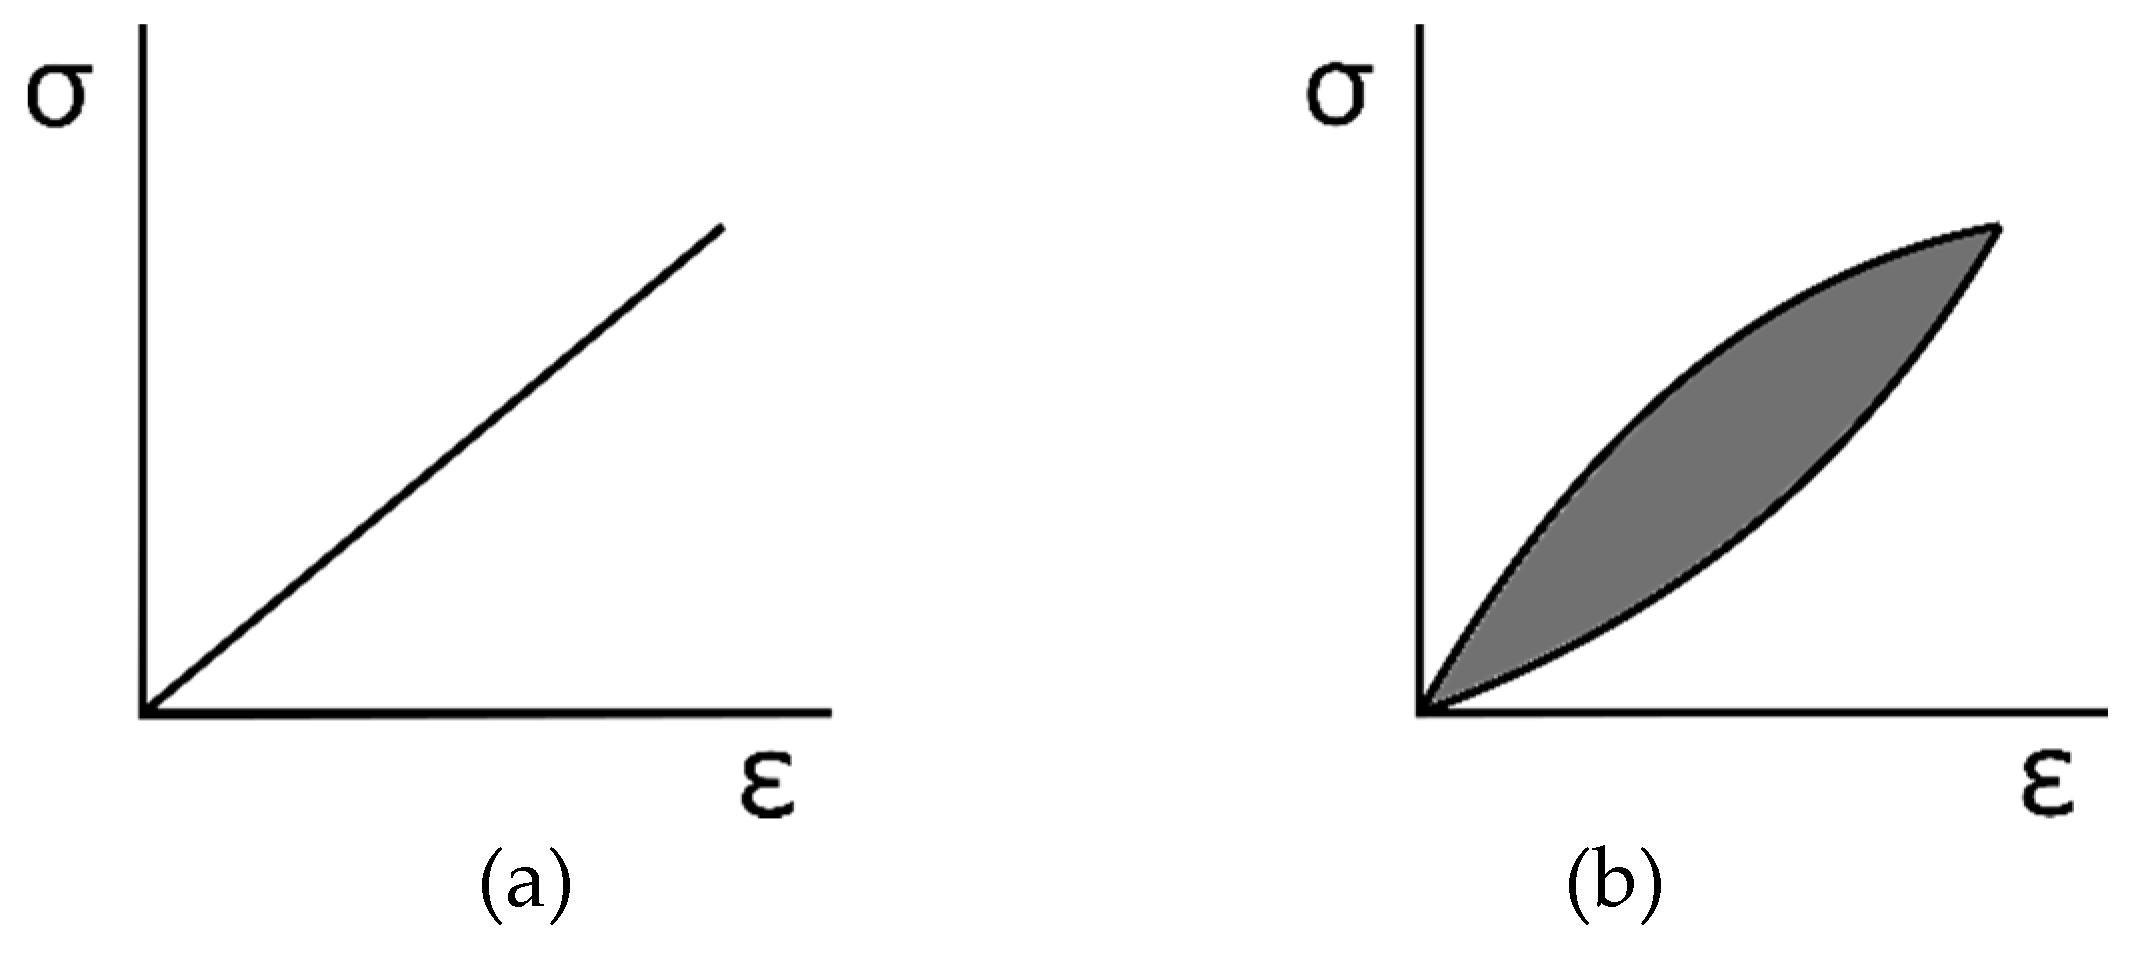
Polymers deform either elastic, viscous or, when only a small deformation is applied, visco-elastic as a mixture of both. Elasticity is defined as a deformation that is completely reversible with the Elastic Modulus (Young’s Modulus) as a fixed ratio of applied strain and stress (Hook’s law). During viscous deformation, the polymer behaves more like a liquid with the stress depending not only on the applied strain but also on the speed of the applied strain (strain rate). Visco-elastic behavior, therefore, describes reversible deformation that is strain-rate- and thus time-dependent [
32]. The stress–strain curves of such a material usually show a hysteresis loop (
Figure 9).
The dynamic mechanical properties of the composite were determined with a Texas Instrument DMA 2980 (Dallas, TX, USA) Dynamic Mechanic Analyzer setup. Using this, a slight deformation is applied to the sample and the corresponding force is measured (
Figure 10).
The rate of the applied deformation can be adjusted as deformations per second or frequency. Using the sample geometry, frequency-dependent stress–strain behavior can be measured with the following equations [
33].
is the complex modulus,
the storage modulus and
is the loss modulus.
Using the complex modulus and the phase shift δ, the storage modulus (Equation (13)) and the loss modulus (Equation (14)) can be calculated. The ratio of loss to storage modulus is, therefore, described by tan δ.
For this study, the focus was on elastic properties at room temperature, as well as on
Tg of the composite. The experimental parameters are shown in
Table 3.
3. Results and Discussion
3.1. Morphology of Composite Samples
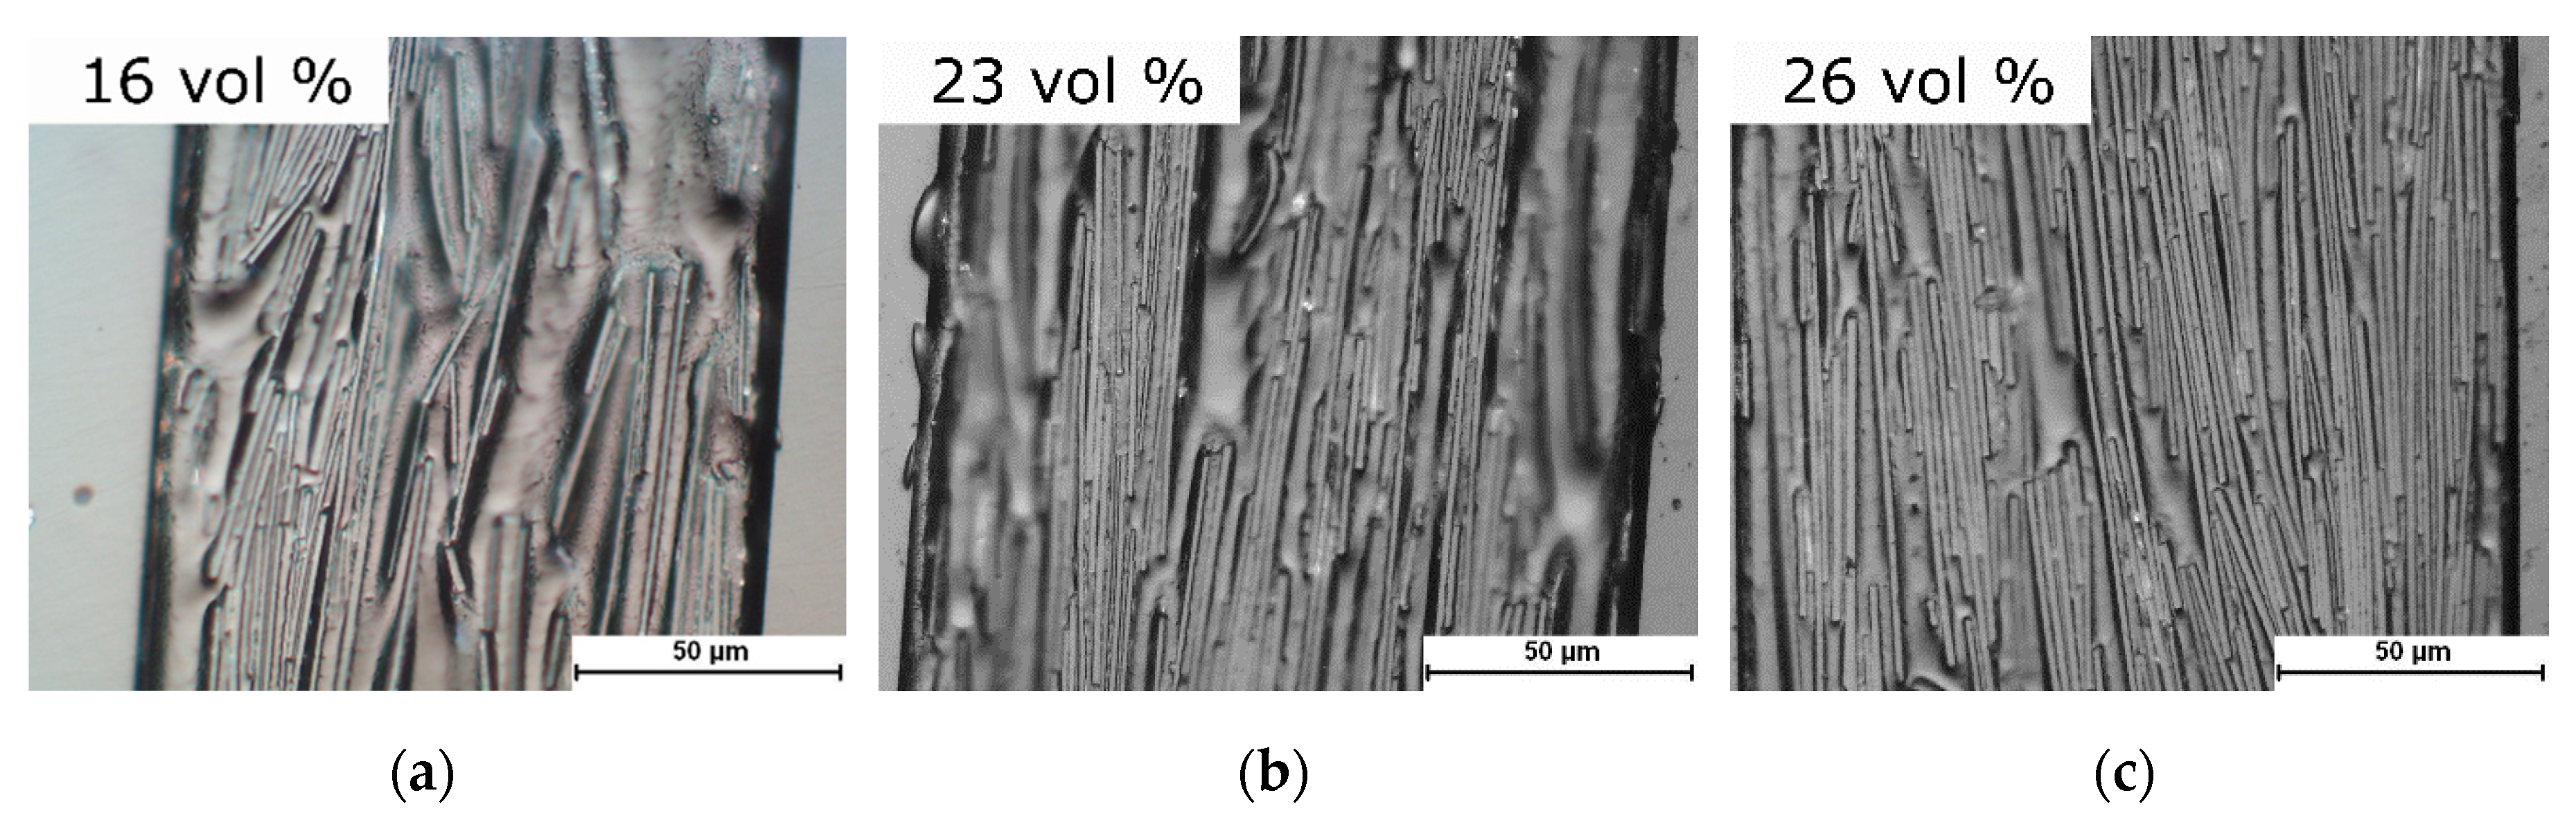
To determine the morphology and orientation of the MGF within the PVB matrix, samples with 9 vol %, 13 vol %, 16 vol %, 20 vol %, 23 vol % and 26 vol % of GF100 (
d50 = 160 µm) and GF001 (
d50 = 30 µm) were produced. Their cross-sections were investigated with a light microscope (
Figure 11).
As it can be clearly seen, the alignment of the glass flakes parallel to the surface is increased with increasing content of glass flakes. At the same time, this high degree of ordering does not lead to any significant breakage or any kind of failure of the interface between the matrix and glass surface with increasing volume content.
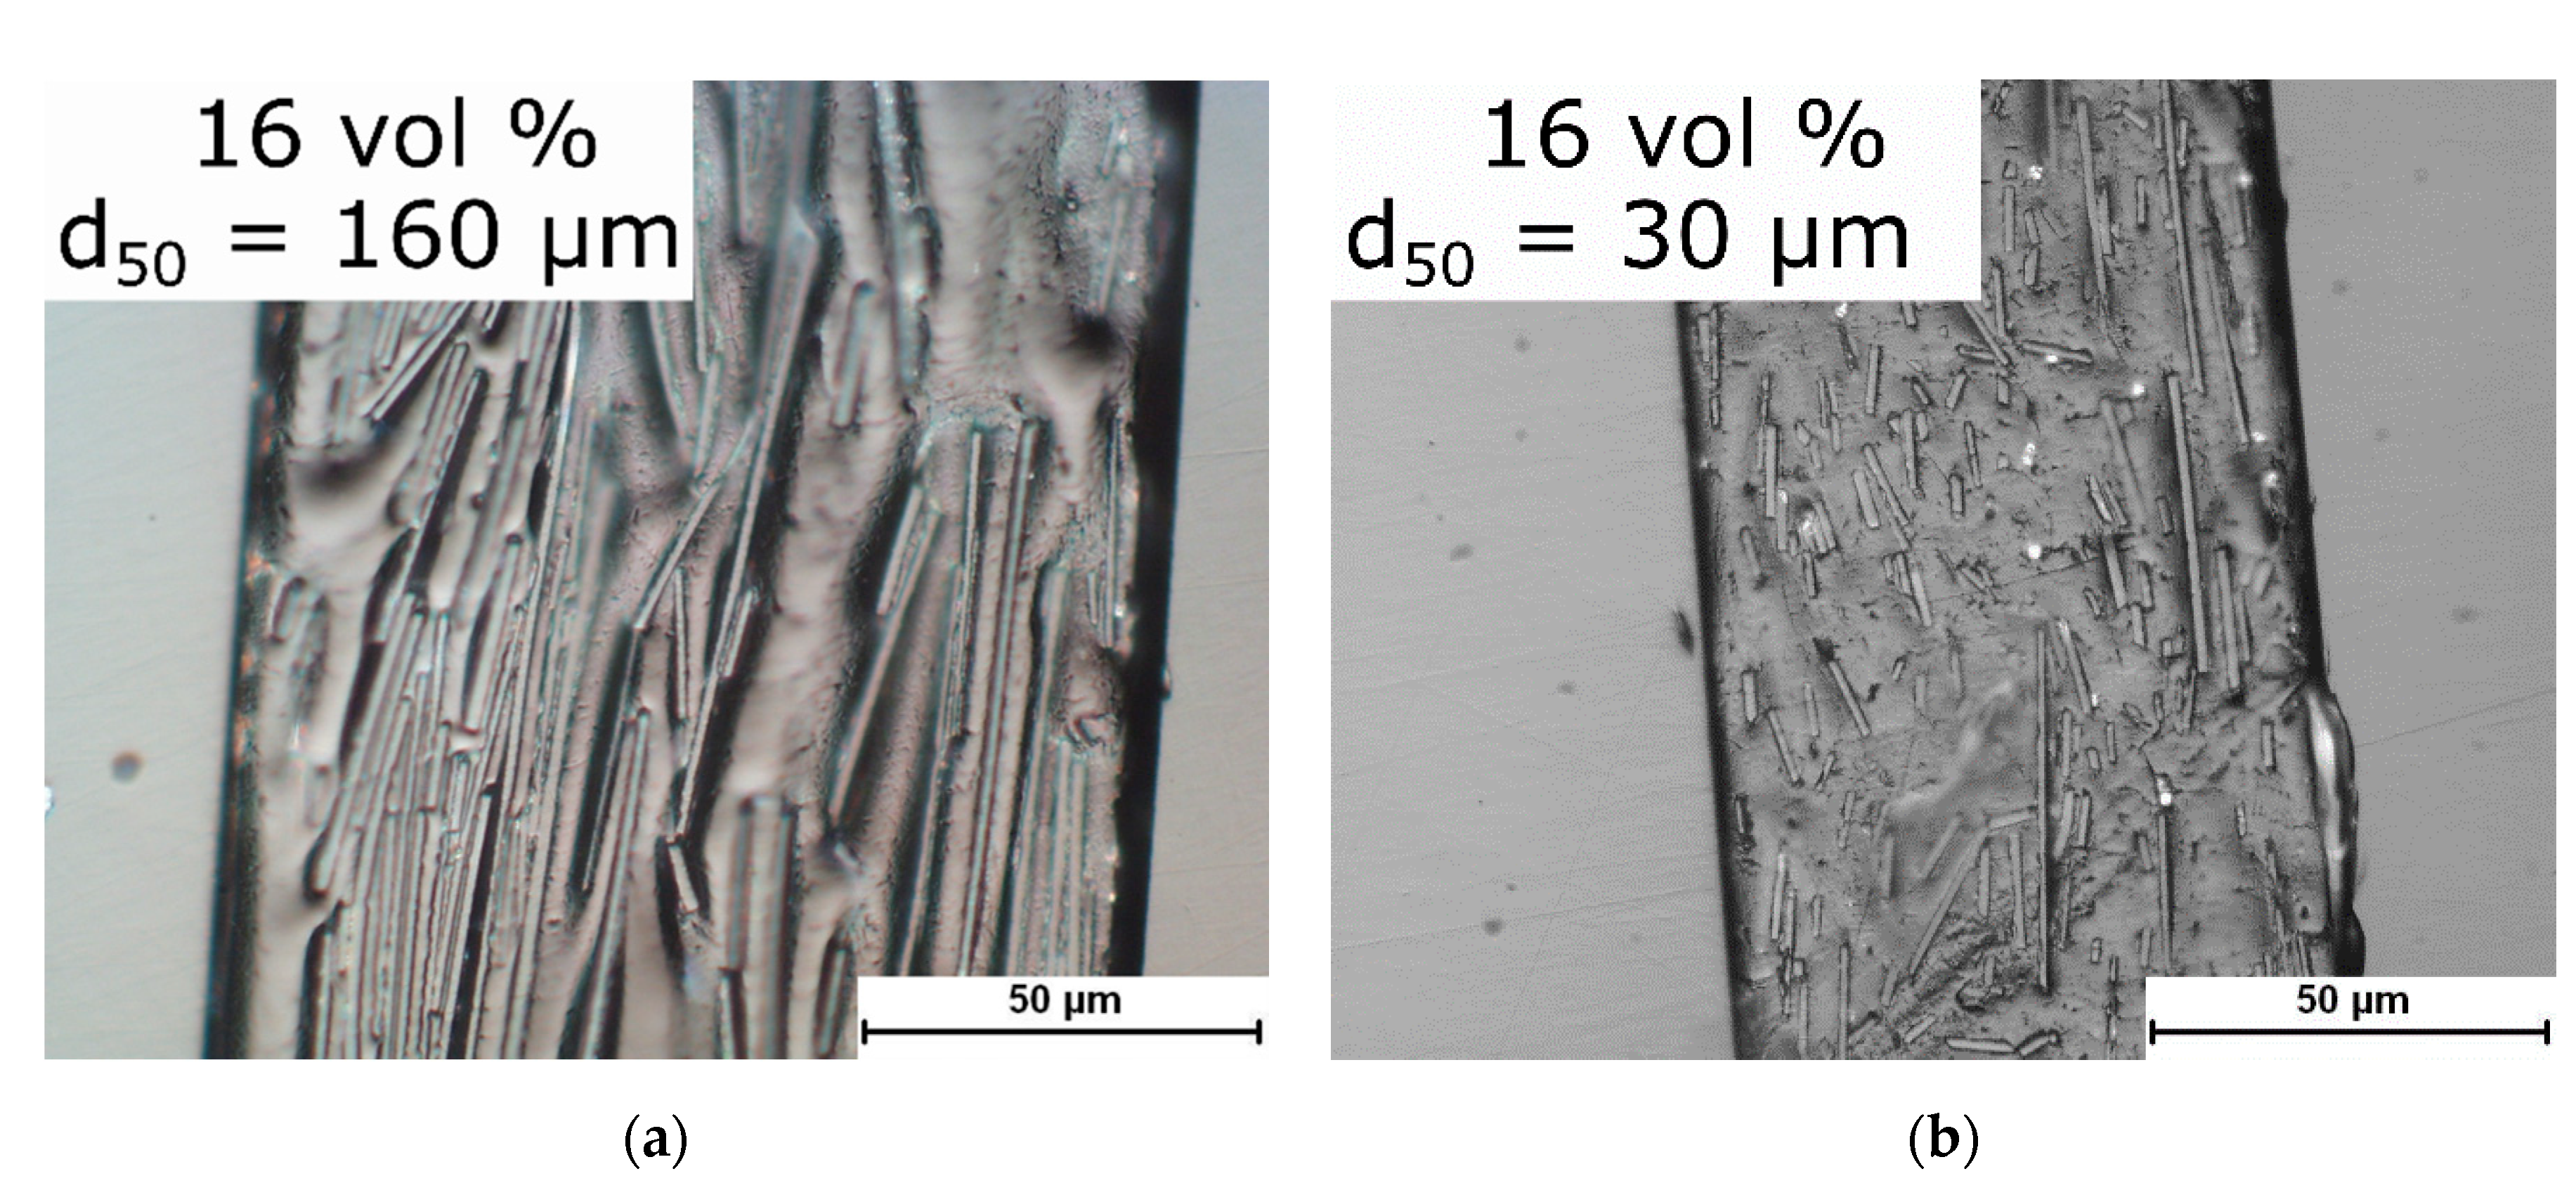
Figure 12 shows a comparison of samples with the same volume content (16 vol %) but using glass flakes with different mean diameters of 160 µm and 30 µm. A clear difference in the degree of ordering can be seen. On average, the glass flakes with the bigger diameter show a stronger alignment parallel to the surface, while the smaller glass flakes do not show a clear alignment or ordering.
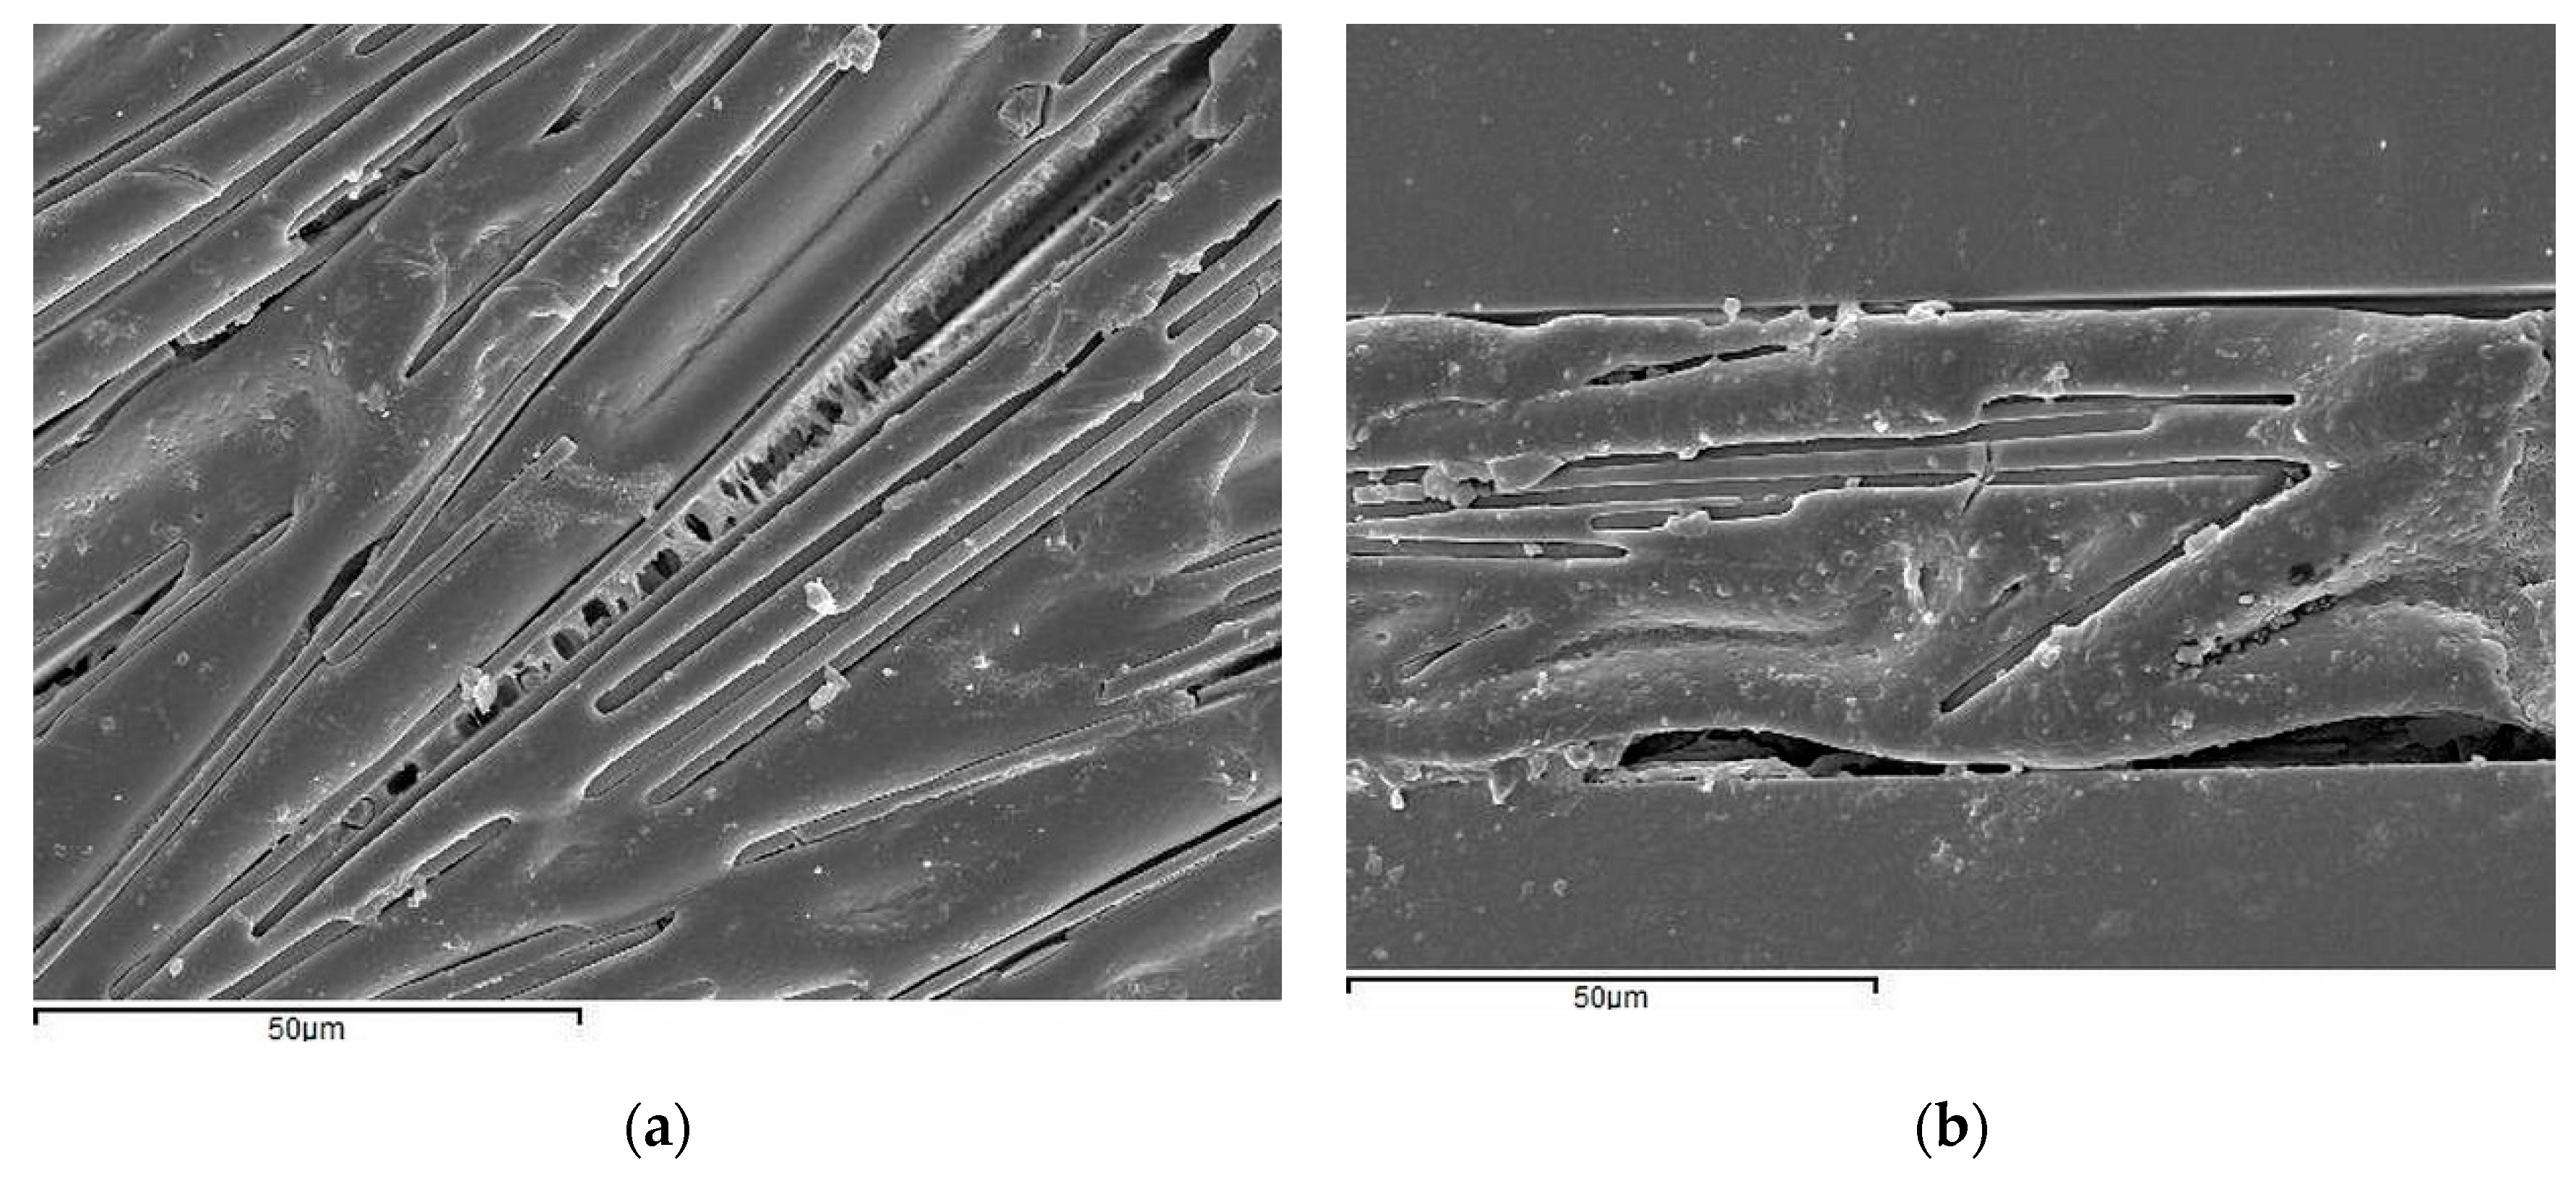
Using SEM imaging, the interface of glass and polymer was investigated. Although the preparation was carefully carried out using cryo-fracture of the sample, delamination artifacts could not be prevented, as displayed in
Figure 13. However, it can be seen that the glass flakes are completely covered and surrounded by the polymer matrix. It can be assumed that the flakes were well dispersed and homogeneously distributed in the slurry with a good wetting behavior.
3.2. Optical Properties
3.2.1. Influence of Volume Content of MGF
To determine the optical properties, three samples of each composition were produced and laminated and each sample was measured five times at slightly different positions on the surface.
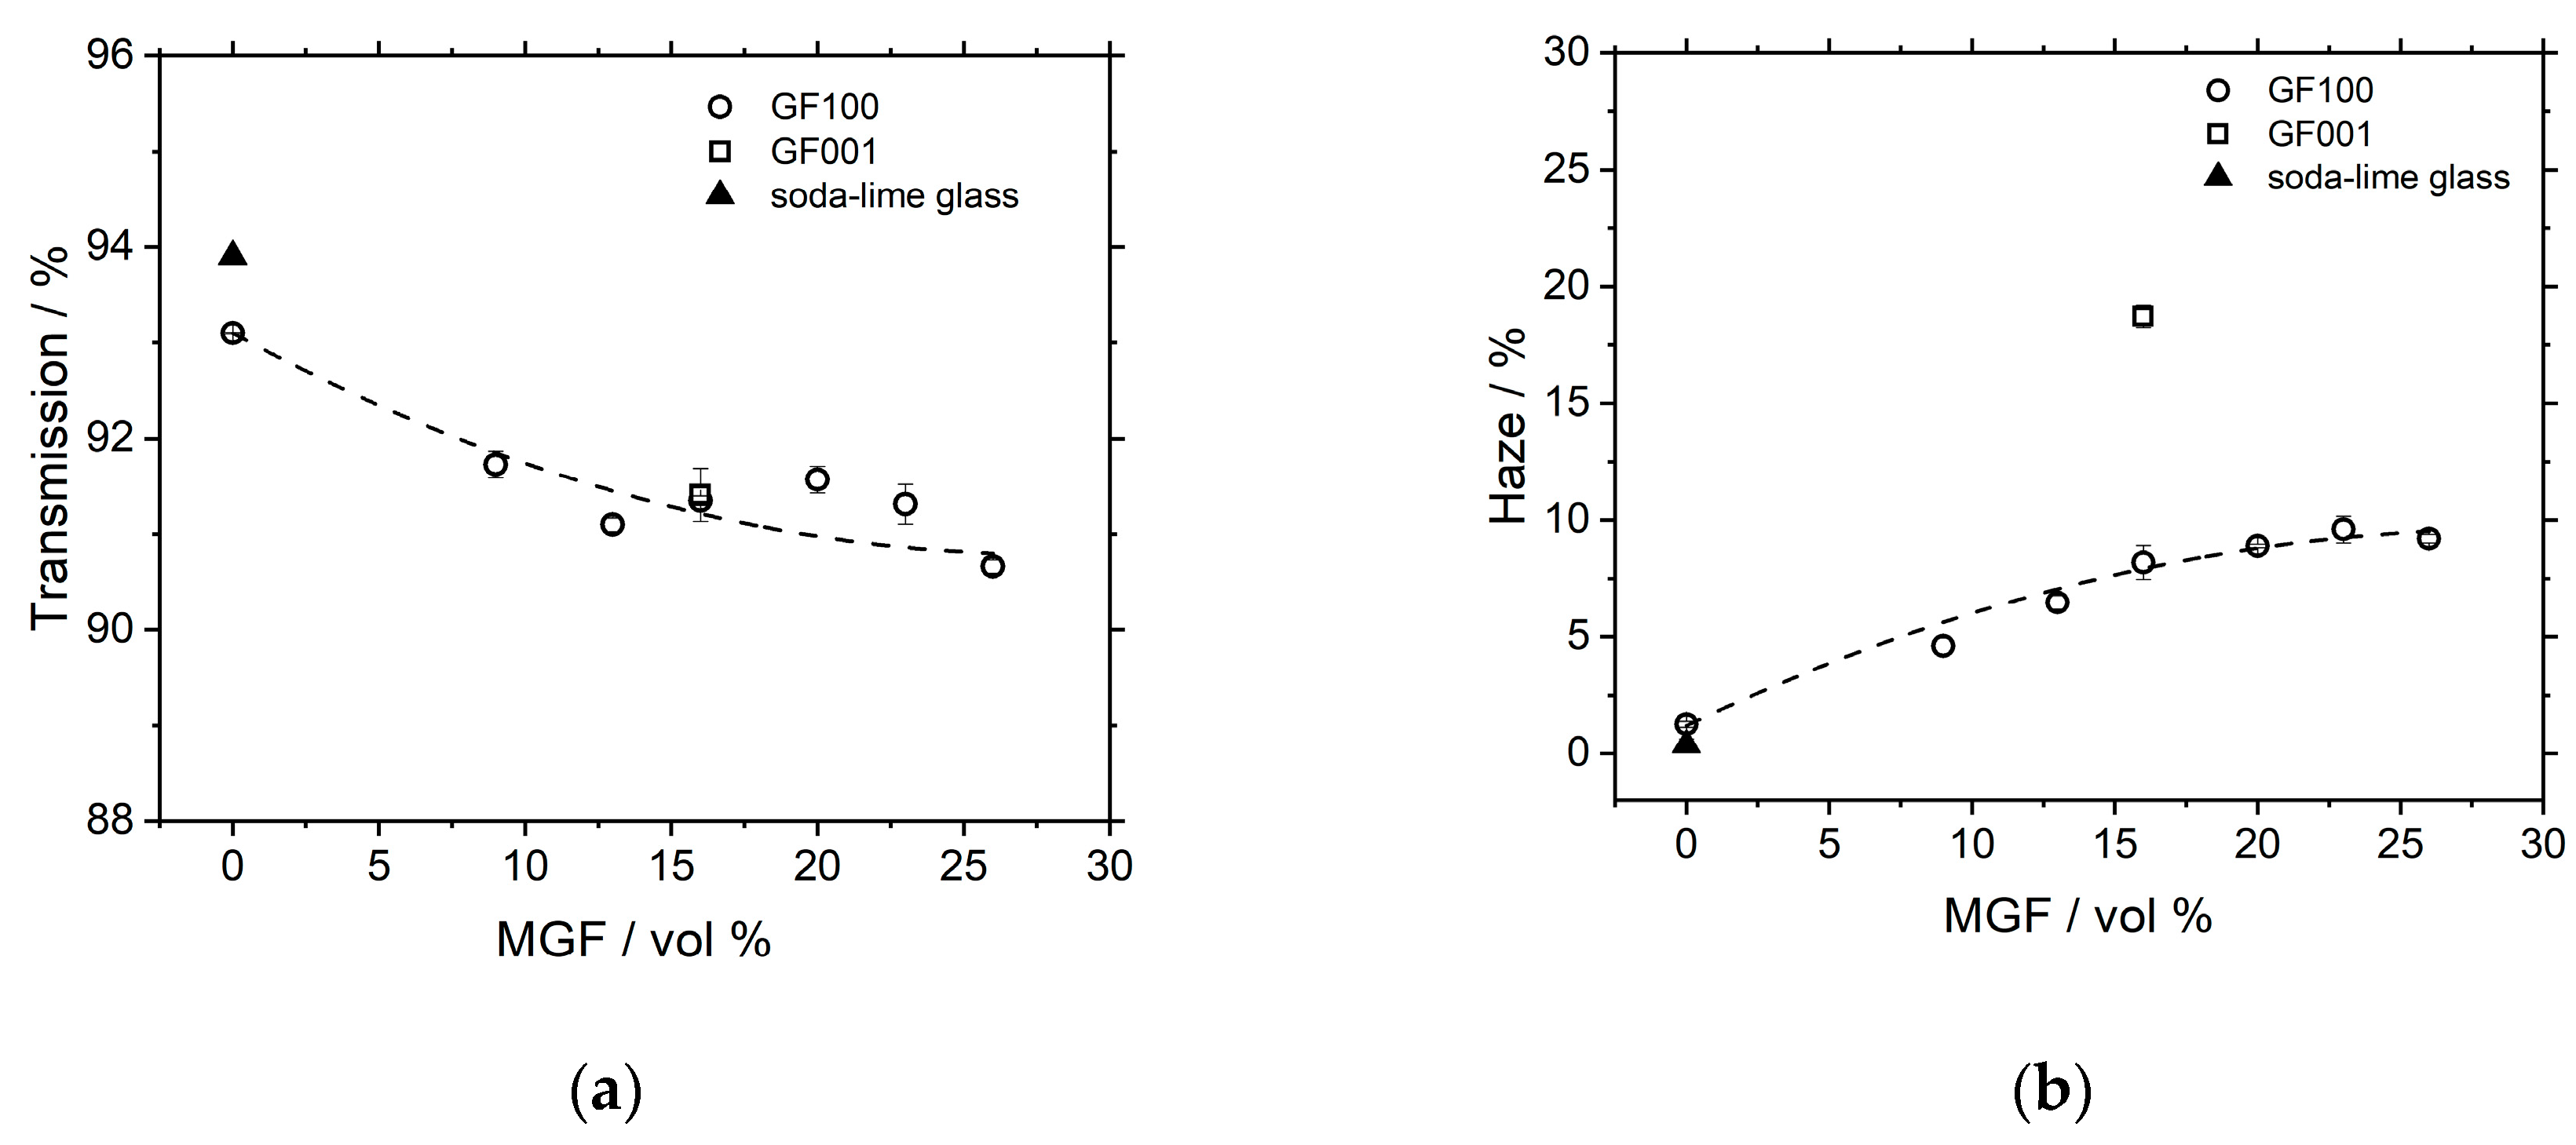
Figure 14 shows the results of glass laminates with a PVB–MGF interlayer containing different volume fractions of MGF as measured with the haze meter. The transmission of the Optiwhite™ soda-lime glass was measured at 93.5% which lies well within the typical range of flat glass of 92–94%. The loss of transmission can be accounted for by reflection on the surfaces of the glass pane and can be calculated with a simplified Fresnel equation (Equation (16)). For glass (
n = 1.5) and air (
n = 1), this equals approximately 96% transmission for one surface and 92% for two surfaces (front and back).
All other losses in transmission can be attributed to absorption, scattering or reflection of the particles in the interlayer. The transmission is reduced with increasing volume content of MGF. However, the slope of the reduction is not linear, as the drop from 0 vol % to 9 vol % is roughly 1% in transmission, while it further only changes by another 0.5% at 26 vol %. A similar behavior can be seen with the results of the haze measurement (
Figure 14b). There is a steep increase of 4% of haze between pure PVB and 9 vol %, while it does not exceed 9% total at 26 vol % of MGF.
This non-linear behavior of the transmission and haze of these PVB–MGF composites with respect to the volume content contradicts the findings of most other studies that investigate glass fibers or glass particles as fillers and find the increase in haze and reduction transmission to be linear with increasing volume content. It is, therefore, assumed that the difference in behavior can be explained by the high aspect ratio of the MGF and, therefore, high ordering of the flakes parallel to the surface, which reduces the effect of haze caused by an RI mismatch.
3.2.2. Influence of Glass Flakes’ Size and Ordering
To further evaluate the effect of ordering of the MGF in the PVB matrix, measurements of a sample with 16 vol % of GF001 (
d50 = 30 µm) were included in the comparison (
Figure 14). While the transmission does not seem to be influenced by the change of mean diameter of the MGF, the haze doubles from 8.1% using GF100 to 18.7% with GF001 at 16 vol %.
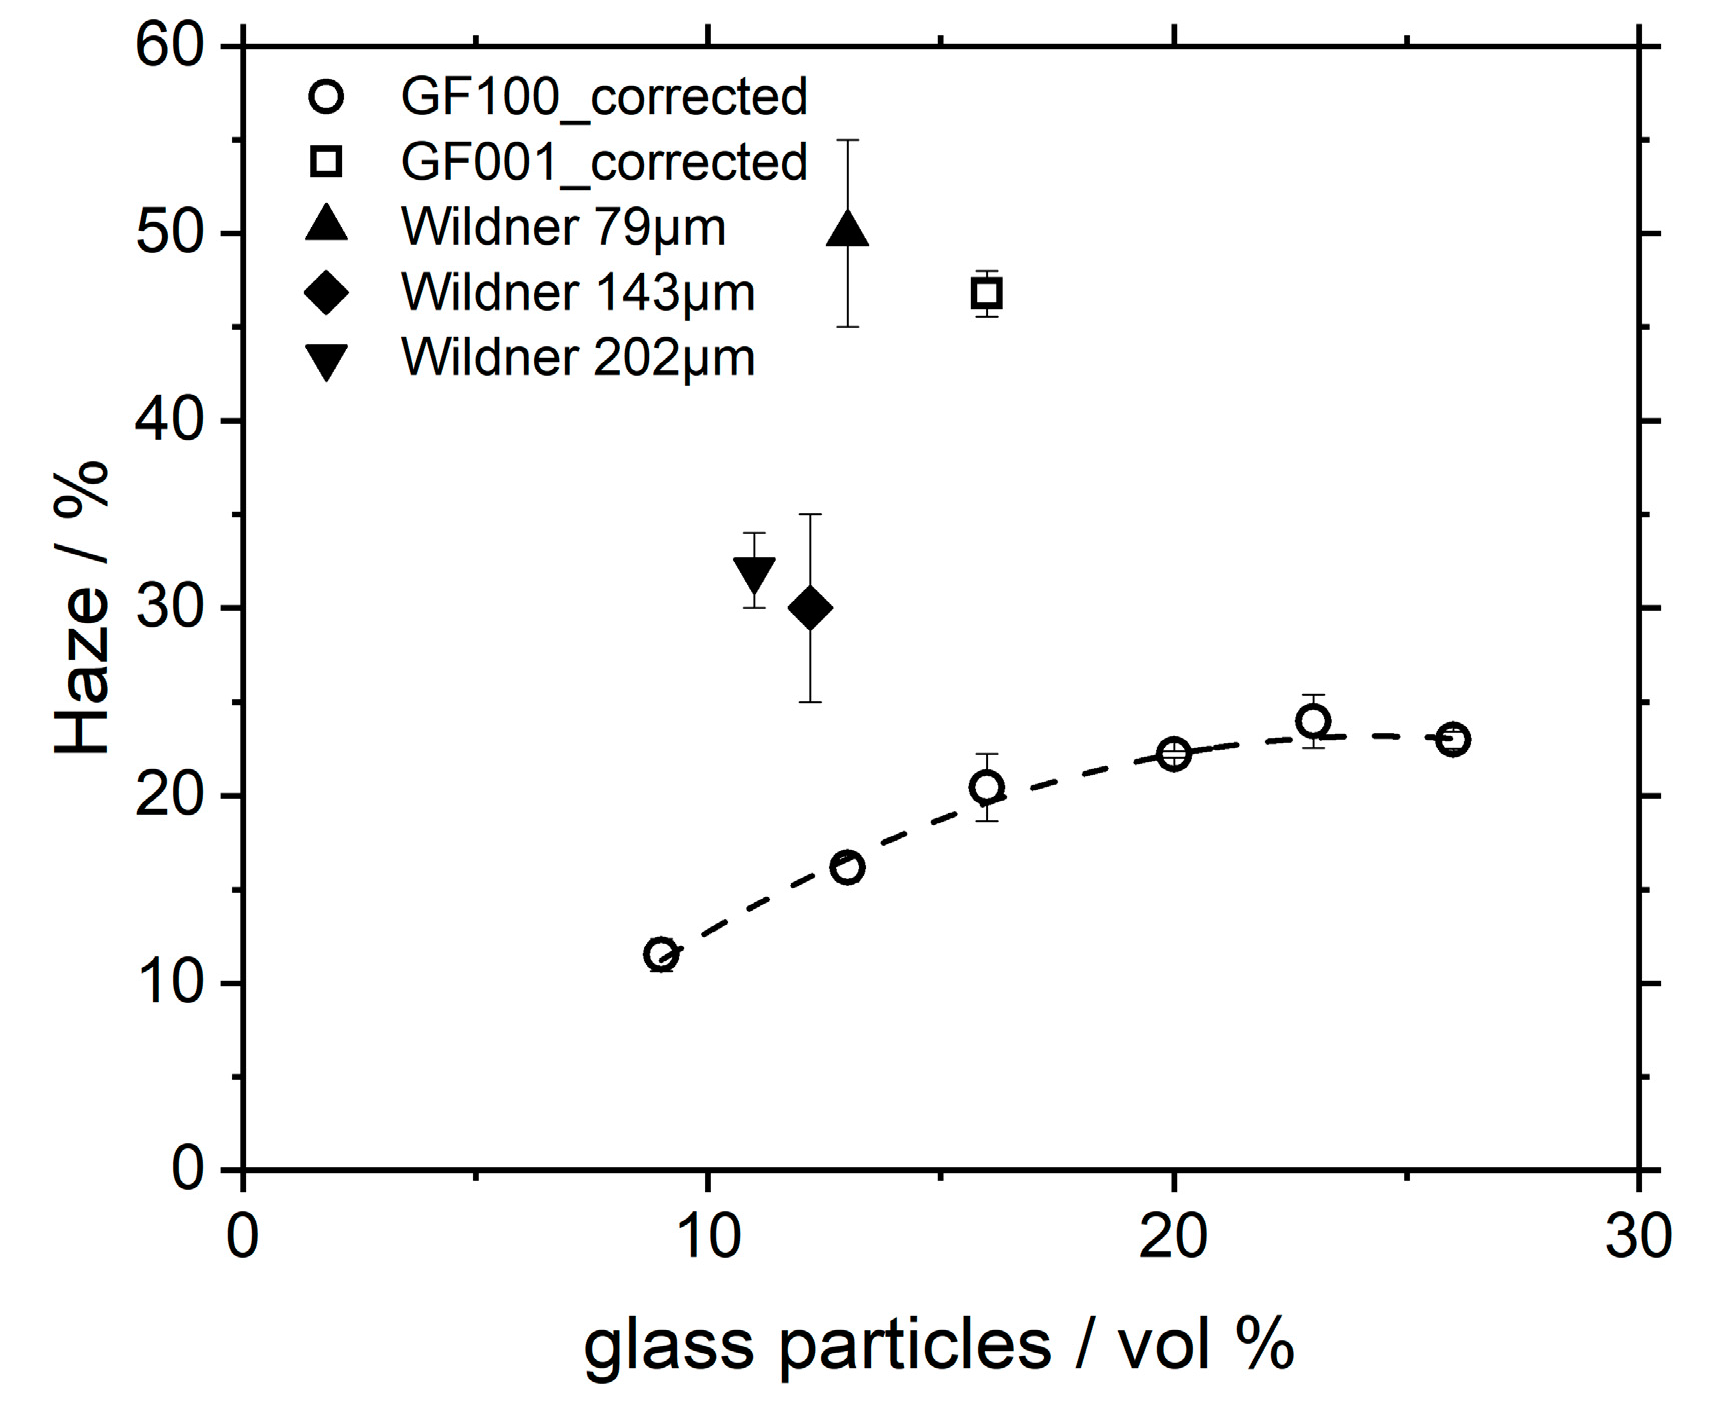
These findings were compared to a study by Wildner et al. They investigated the optical properties of irregularly shaped glass particles with a mean size of 79 µm, 143 µm and 202 µm in a PMMA matrix using injection molding [
9]. The difference of RI of the glass particles to PMMA was measured as ∆
n = 0.0047.
Figure 15 shows the absolute haze values of these measurements when corrected for sample thickness (in this case, 500 µm). The measured haze values of the glass particles were found to be between 30% to 50% at a volume fraction of 11 to 13 vol %. There is no clear dependence on particle size. When compared to GF001 flakes with a low aspect ratio, the haze is comparable (45%). However, when compared to GF100 with a high aspect ratio, the measured haze is two- to three-times higher at similar volume fractions.
3.2.3. Influence of RI Mismatch of MGF and PVB Matrix
Mismatch of the RI of filler to a matrix is the main contributor to haze as the degree of scattering increases with increasing difference of the RI at an interface (Snells’ Law, Equation (17)) between material 1 with an incident angle
and material 2 with a refractive angle
Measurements show that pure B 30 H sheets have a lower RI than the commercial MGF GF100 and GF001 (
Table 4). The difference in RI (
Figure 14a) was
m = 1.005 with ∆
n = 0.007.
As the RI of a polymer cannot be easily increased, we, therefore, chose to change the RI of the MGF by changing the glass composition to match that of pure PVB or, if not possible, to achieve a RI slightly below that of pure PVB. While increasing the RI of PVB is not easily possible, it can be lowered by at least ∆n = 0.010 by adding Softener. The Softener itself has an even lower RI and by mixing, the RI of the residual PVB–softener is therefore determined by a simple rule of mixture.
MGF with different compositions were produced with the Sample “GF-V8” showing the most promising properties with a RI of 1.485 (+/−0.003), which was slightly below that of pure PVB. The flakes were milled and sieved below 250 µm with a mean diameter of 120 µm. The thickness of these flakes was measured to be between 2 and 5 µm. It should be noted that these laboratory-produced flakes scatter more in terms of thickness and RI when compared to commercially produced flakes like GF100 or GF001. However, the aspect ratio is comparable to that of commercial flakes (~100–300).
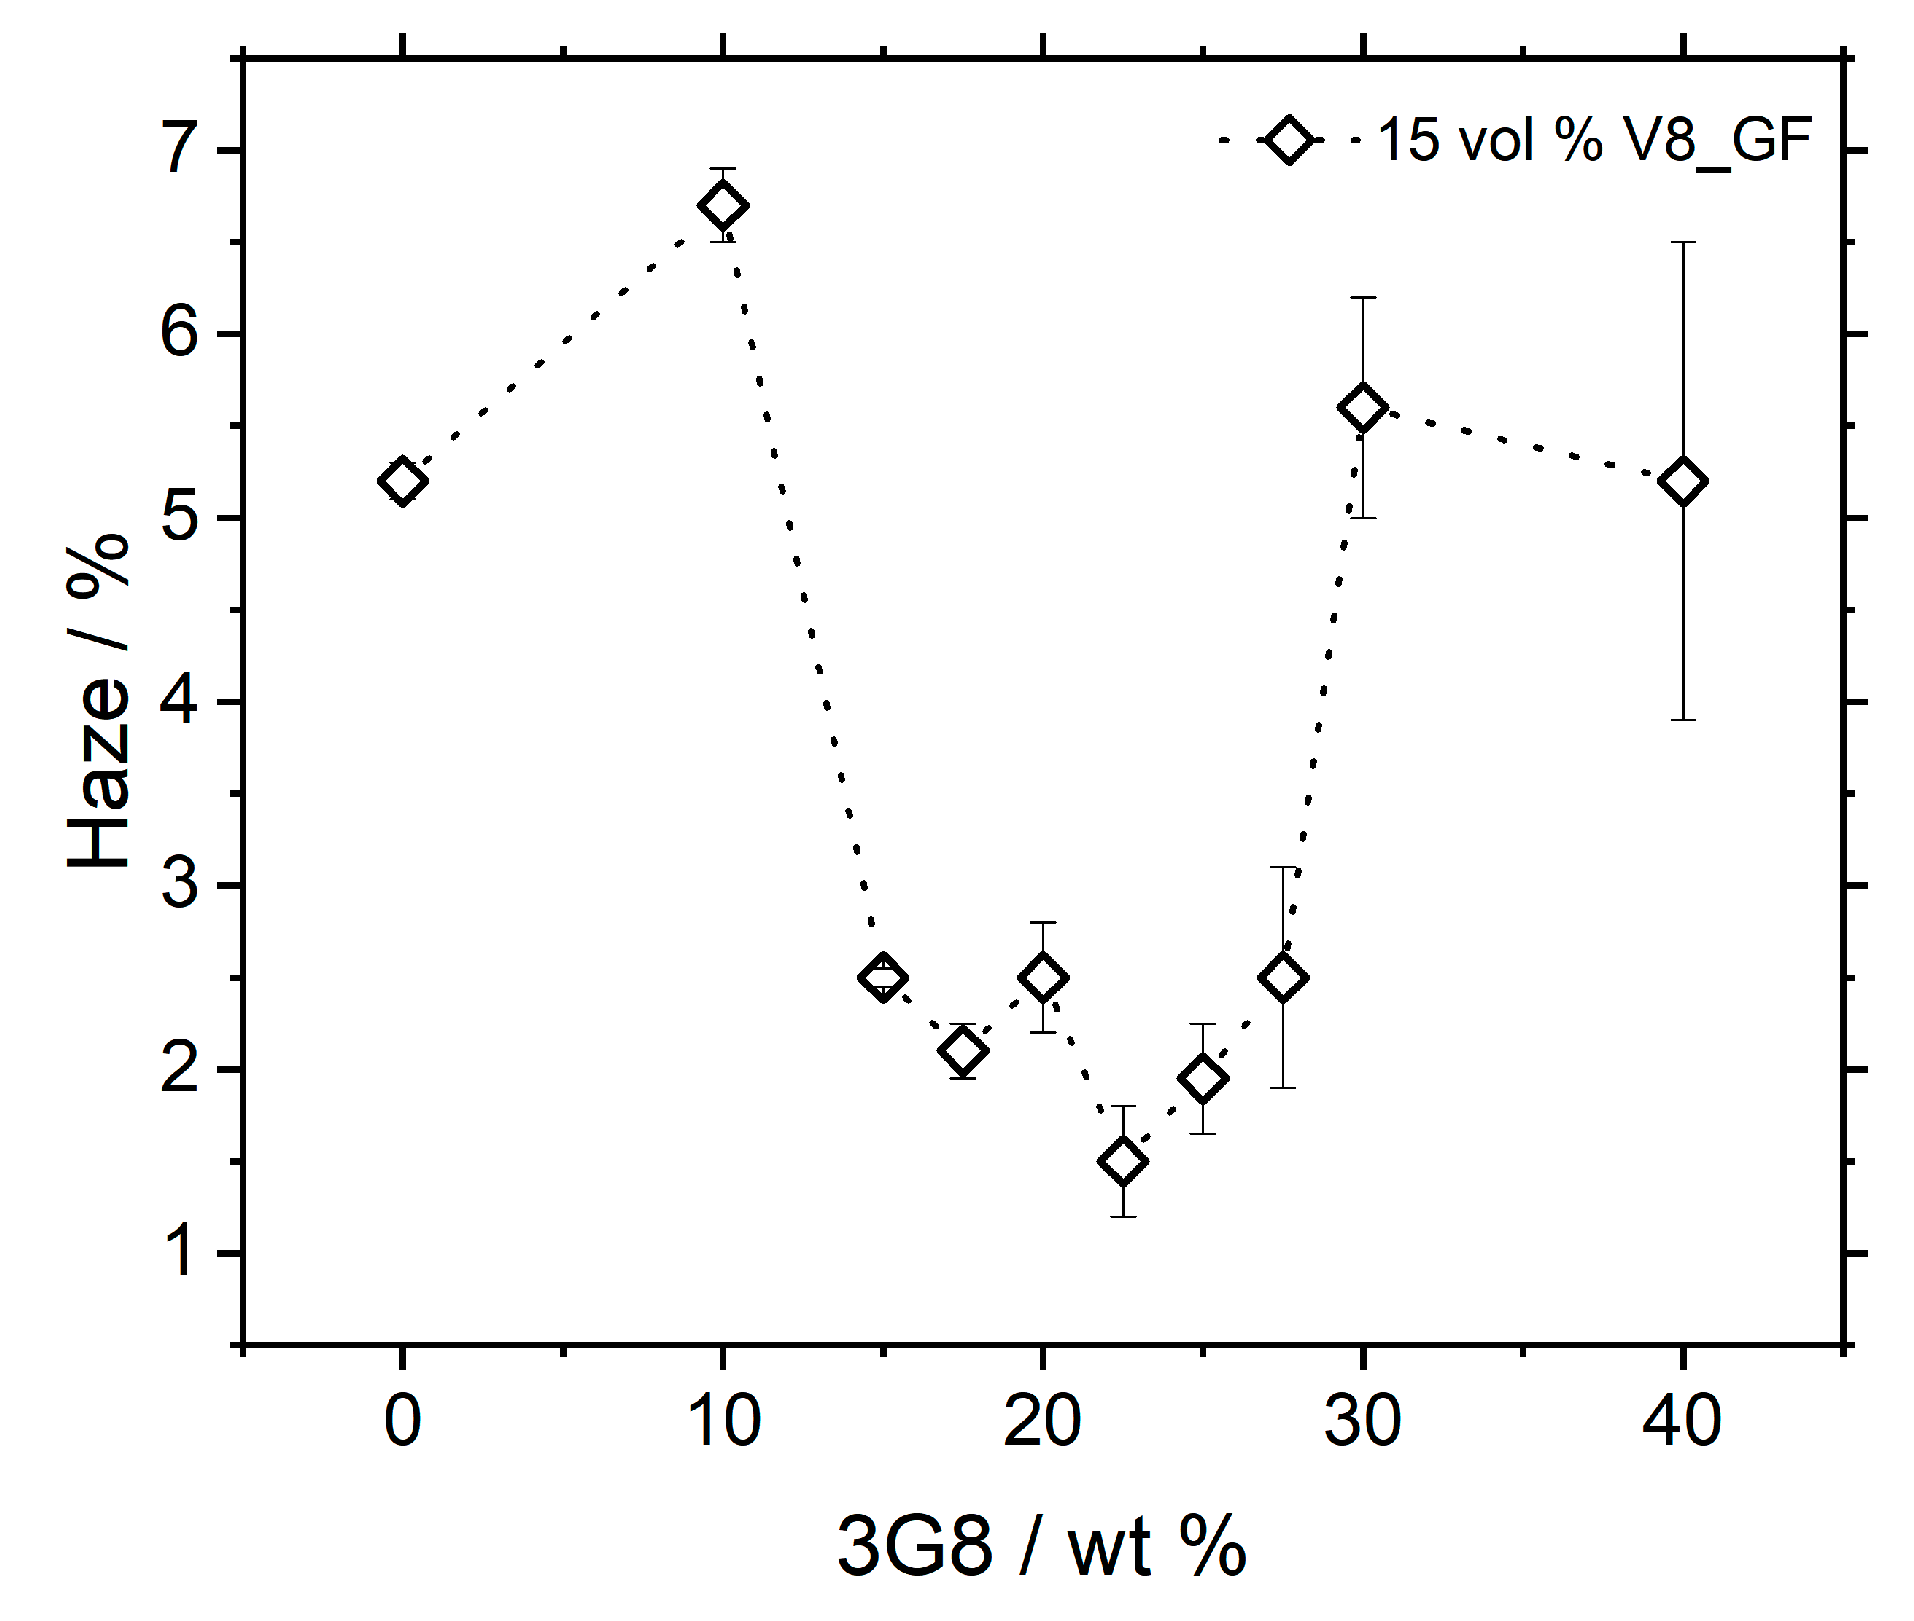
Using these GF-V8 MGF, samples with 15 vol % MGF and 0 wt %, 10 wt %, 20 wt %, 30 wt % and 40 wt % of softeners were produced and the haze was measured. In this set, the lowest haze was found with a composition of 20 wt %. To further determine the optimal softener content for index matching of the glass flakes, another set of samples with 15 to 27.5 wt % (in 2.5 wt % steps) was produced and measured. All results were normalized using a linear regression to 200 µm sheet thickness.
Figure 16 shows the result of the haze measurements. The lowest haze of 1.5% was found at 22.5 wt % 3G8. This is only marginally above the haze produced by pure PVB (
Figure 14b) and can be considered as completely transparent.
As stated, these low haze values cannot simply be contbuted to the RI matching itself, as slight variations in the RI of the flakes (+/−0.003) are still present. However, the combination of the platelet-like structure, high degree of ordering and low RI mismatch result in these highly transparent composites.
3.3. Dynamic Mechanical Analysis (DMA)
3.3.1. Influence of Volume Content on MODULUS
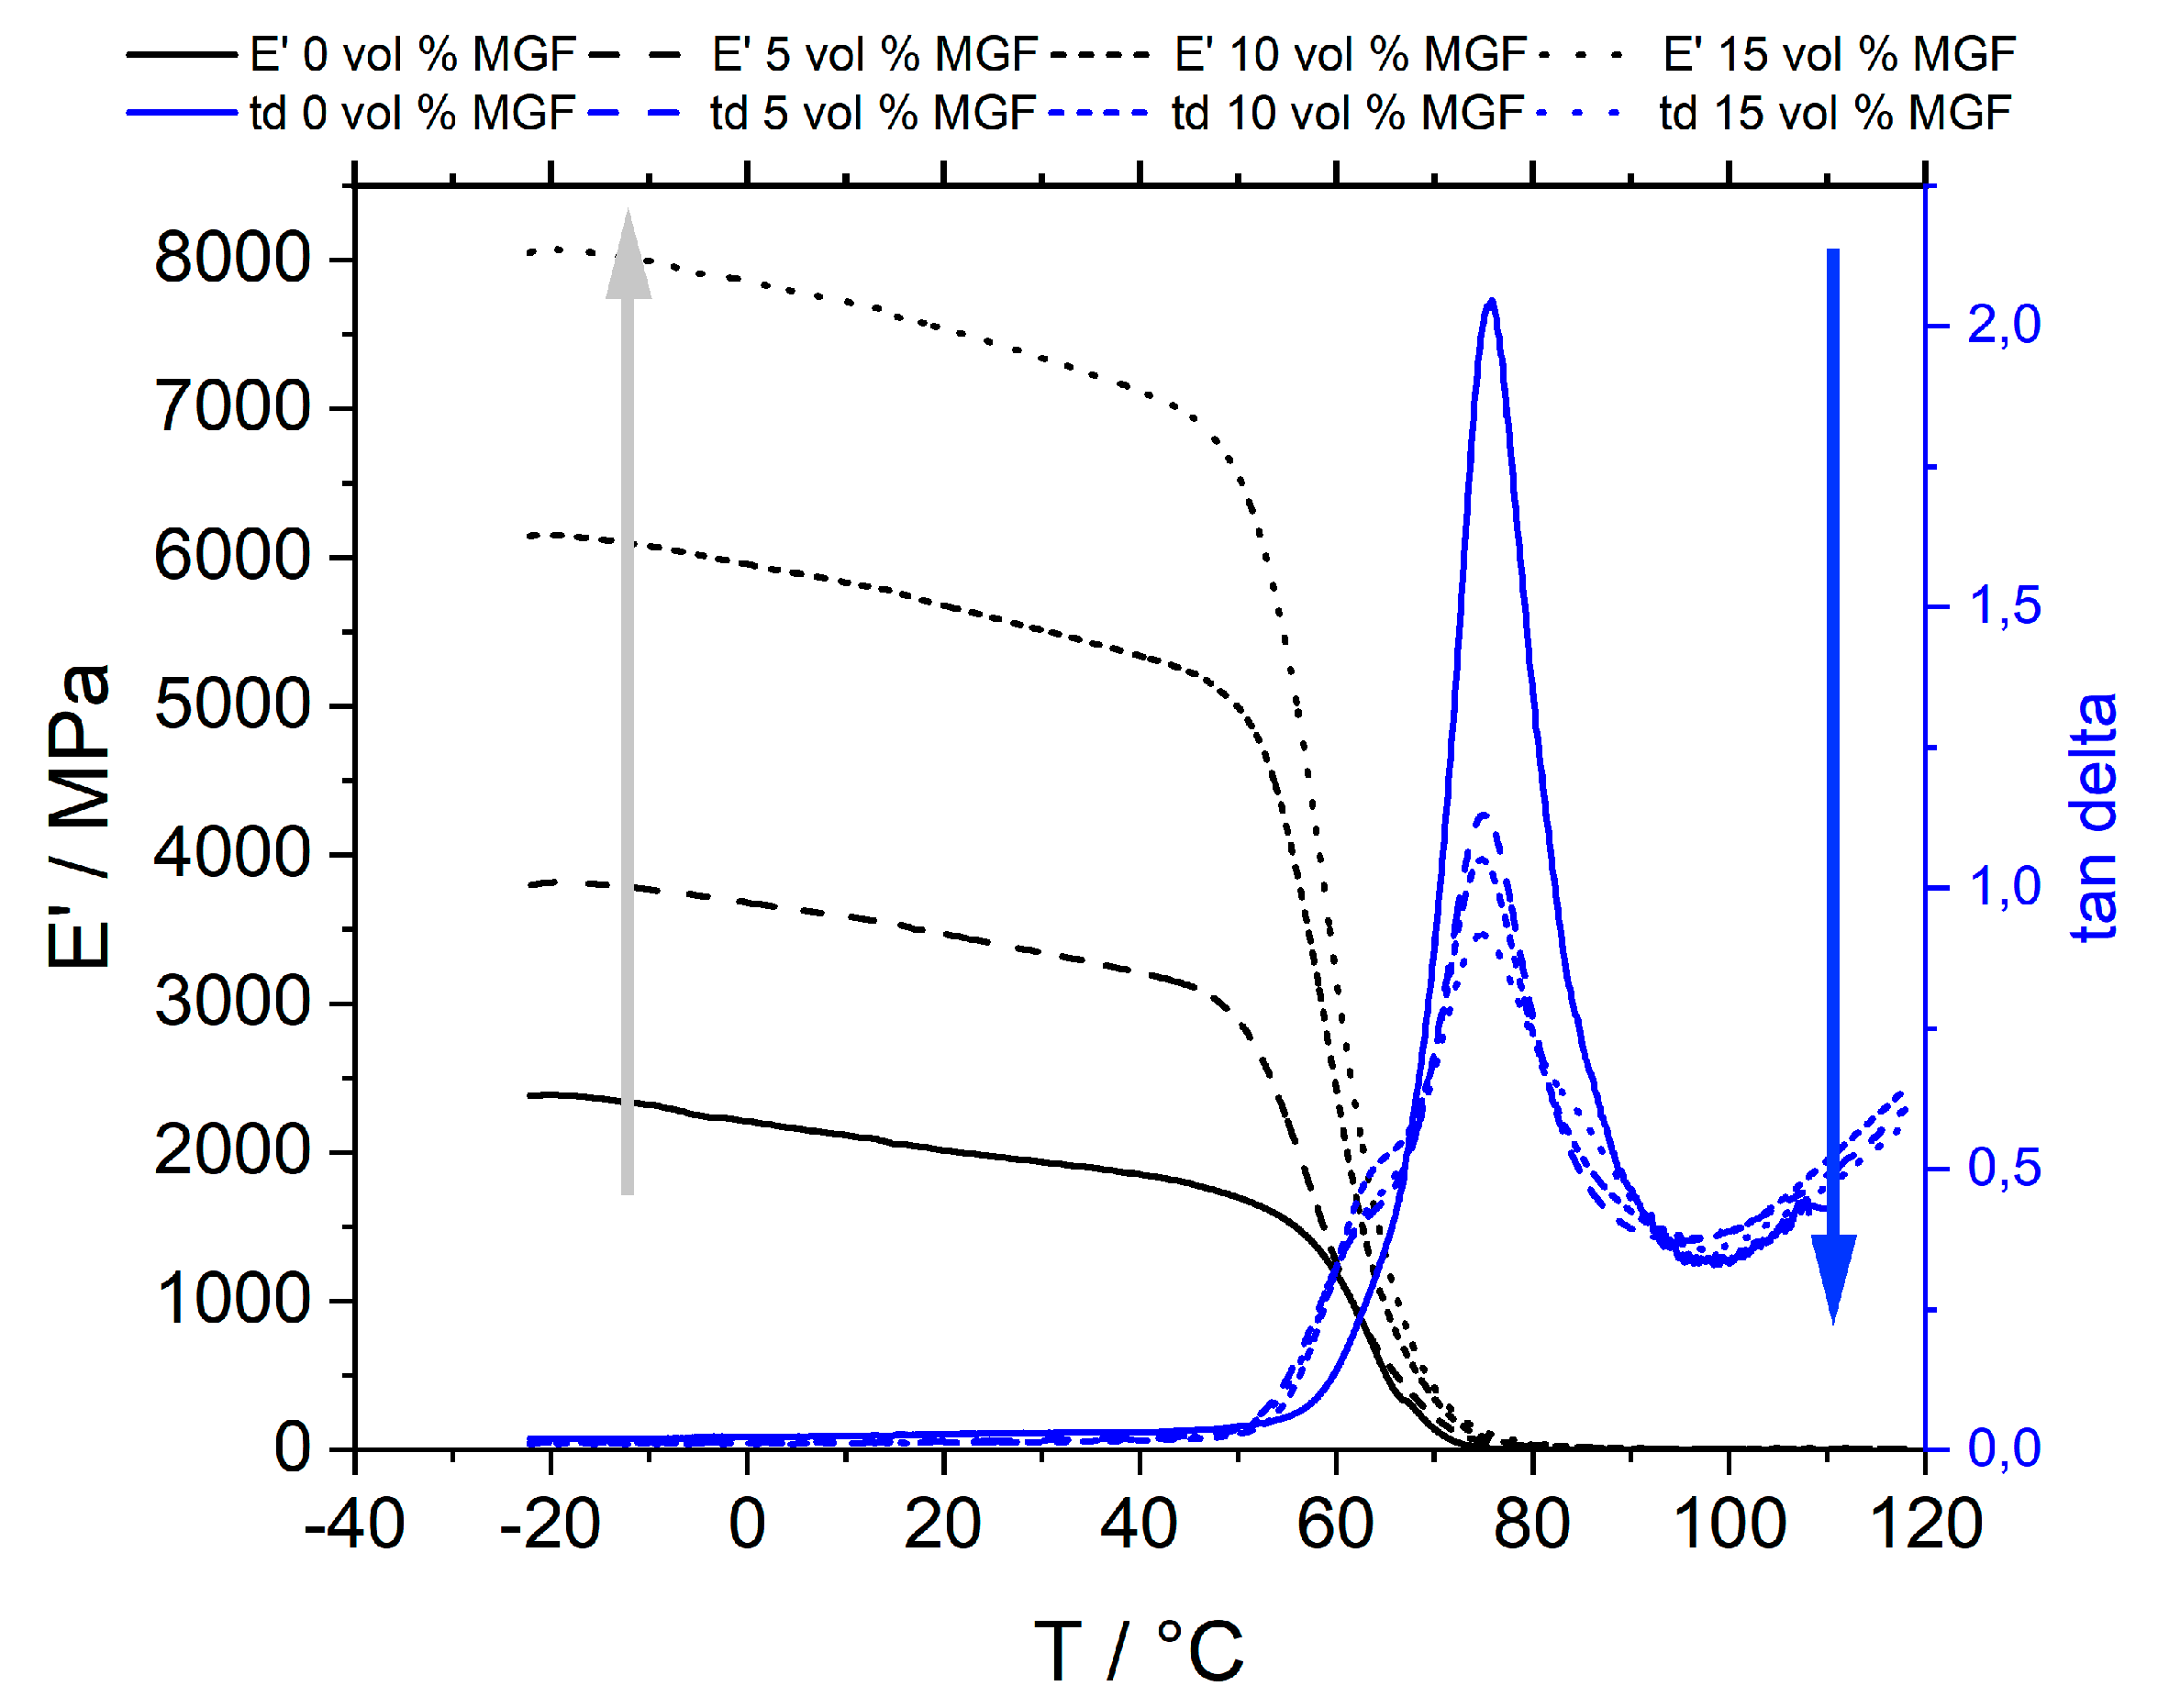
Figure 17 shows the DMA results of PVB B 30 H with 0, 5, 10 and 15 vol % of GF100 flakes. Pure PVB shows a storage modulus of about 2 GPa at room temperature when measured with 1 Hz, which increases to 3.5 GPa at 5 vol %, 5.5 GPa at 10 vol % and 7.5 GPa at 15 vol %. The storage modulus decreases with increasing temperature, with a drop at around 60 °C. At the same time, tan δ increases with increasing temperatures—starting at 60 °C with a maximum at 76 °C. This marks the point of the transition between elastic and viscoelastic behavior, which usually happens at temperatures around the glass transformation point (
Tg). In the case of B 30 H, the glass transformation point at 68 °C is 8 K below the point of the maximum of tan
δ. For simplification, the point of tan δ maximum is, therefore, considered as
Tg. Therefore, with increasing an volume content of GF100,
Tg does not change. However, the maximum of tan δ changes from 2.0 at 0 vol % to 0.8 at 15 vol %. This can be explained by a higher stiffness and, therefore, brittleness of the composite with increasing filler content.
3.3.2. Influence of Glass Flake Size on Modulus
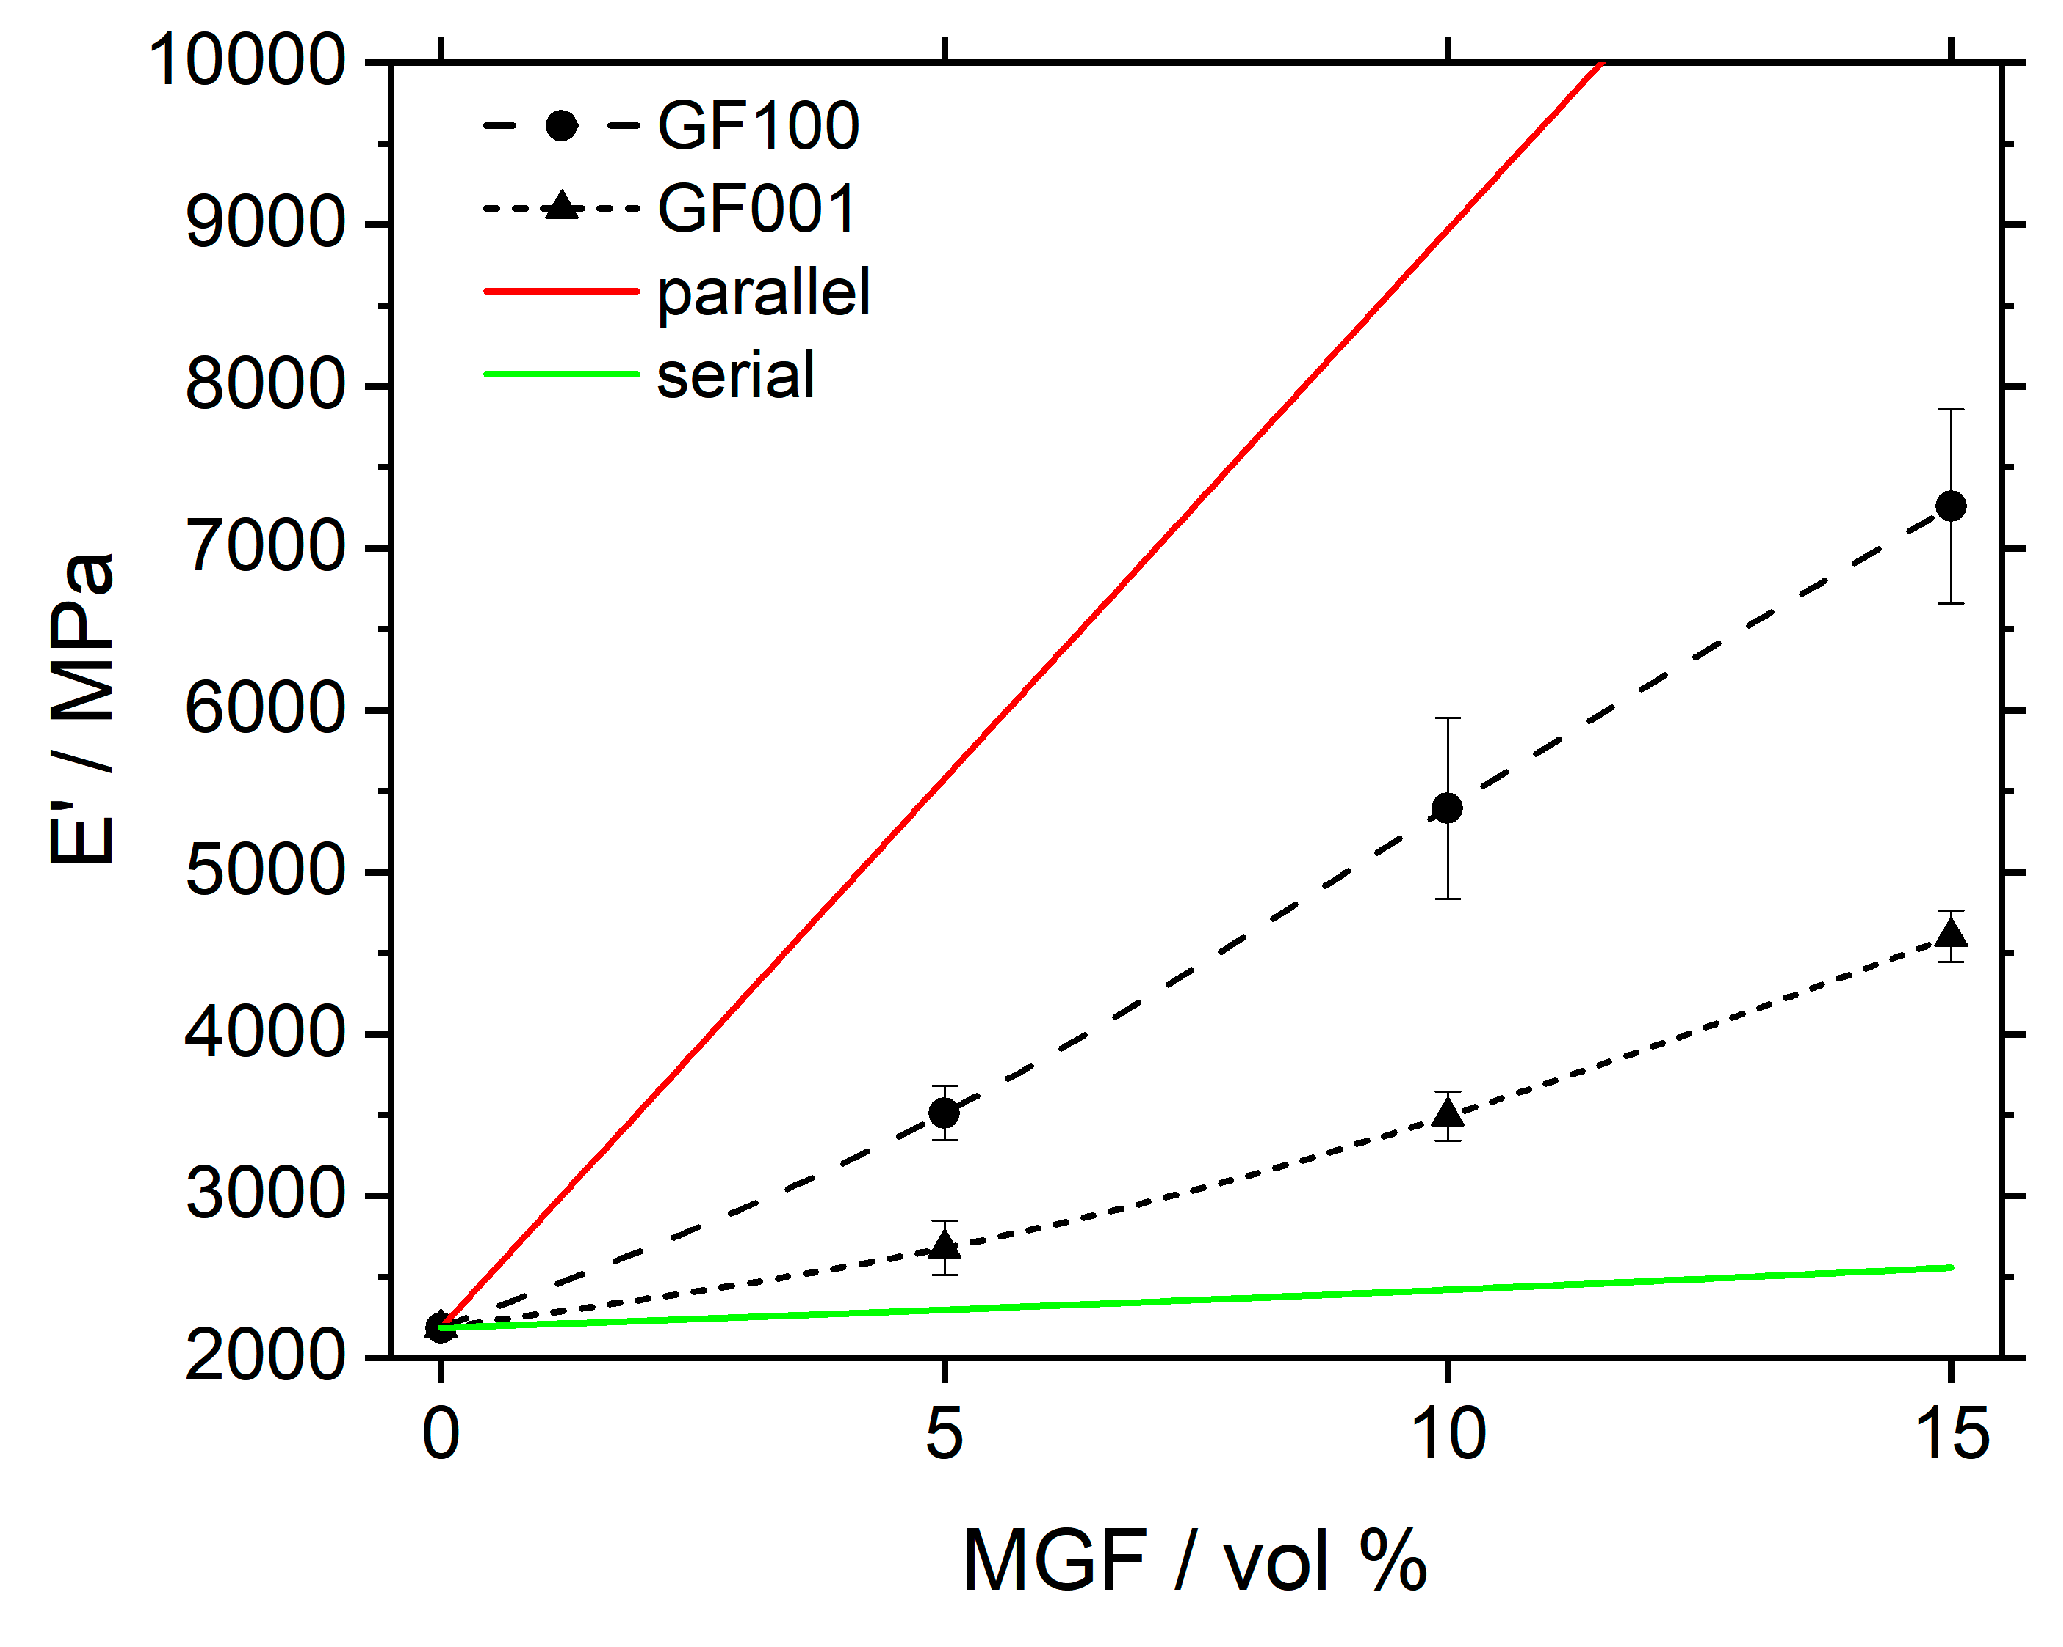
Figure 18 shows the storage modulus E’ with different volume fractions of MGF of types GF100 and GF001at 25 °C. With increasing volume content of the MGF, the storage modulus increases as well. However, the increase in stiffness using high-aspect GF100 is about two-times higher than that of lower-aspect and smaller MGF of type GF001.
This can be explained using a model of ideal serial and parallel connections of materials stiffnesses using Equations (18) and (19) [
34,
35,
36] with
and
as the Young’s Modulus of the matrix material and the MGF, respectively, and
as the volume fraction of MGF in the matrix.
Both ideal cases were included in
Figure 18. As MGF have a finite size, they can be represented by a mixture of both serial and parallel connection in respect of the direction of the tensile force (in-plane). Using this model, it can be explained why shorter flakes with lower aspect ratio show a behavior that is more similar to ideal serial connection, while longer flakes with higher aspect ratio show a behavior more towards ideal parallel connection. The effect of ordering thus cannot be easily observed. However, when again comparing to results from the literature, GF100 flakes show a nearly two-fold higher stiffness with volume content when compared to glass particles with similar mean diameter [
9].
3.3.3. Influence of Softener on Modulus and Glass Transition of PVB (Tg)
As stated above, softener was used in this study mainly to adjust the RI of the polymer to match the RI of the MGF. The main application of softener is usually the decrease of stiffness and the “softening” of the polymer.
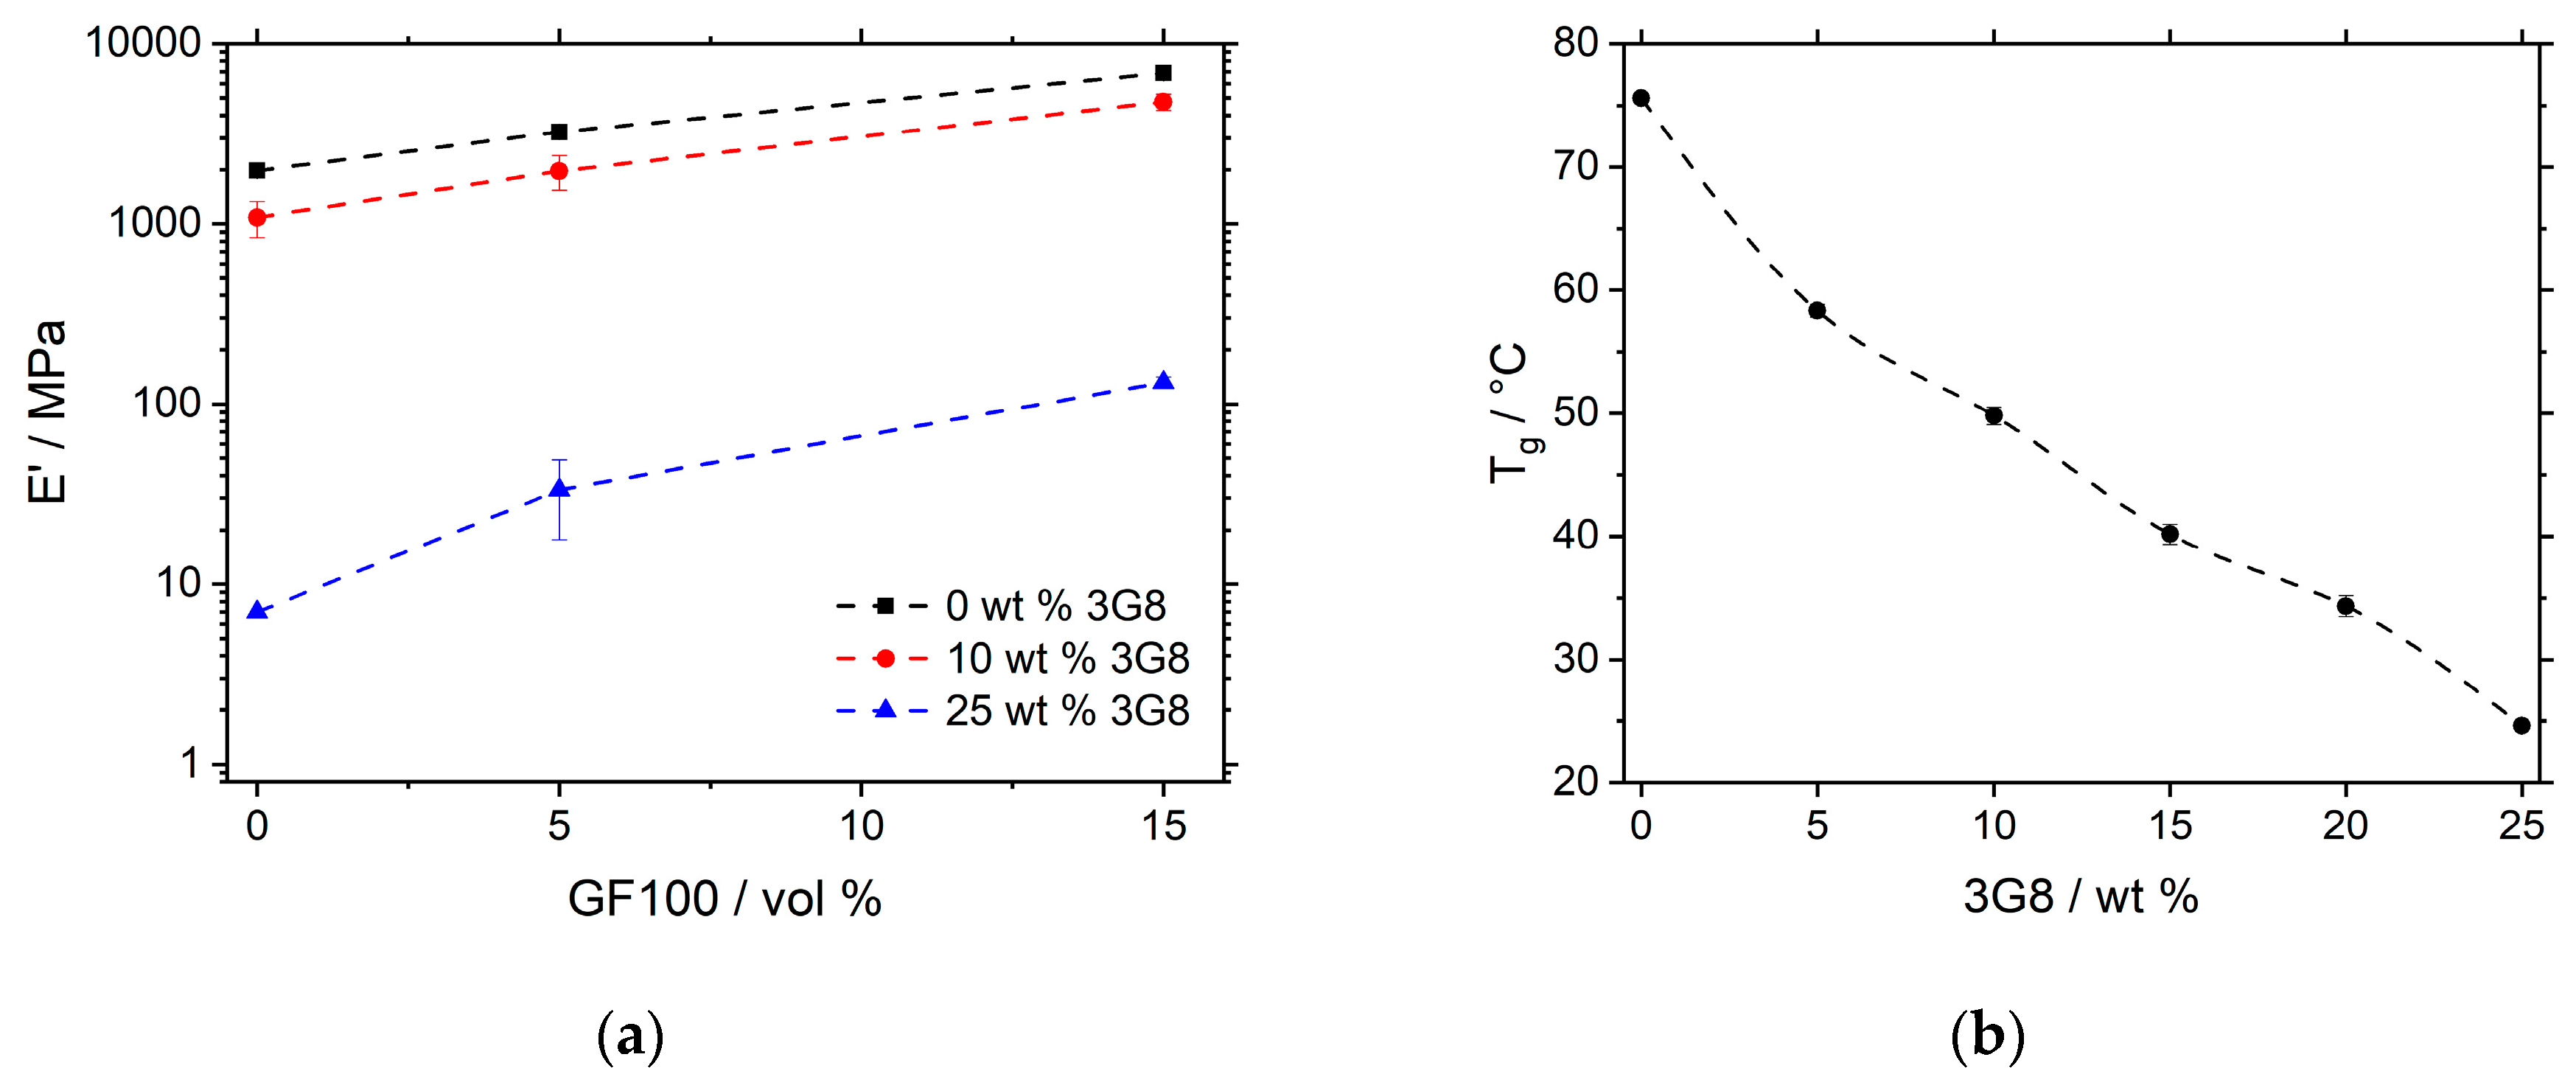
Figure 19a shows the storage modulus at 25 °C as a function of the softener and volume content of GF100 MGF. It can be seen that by adding 25 wt % of softener, the storage modulus is decreased by two-orders of magnitude.
At the same time, the stiffening effect of MGF is comparable in terms of relative values. As such E’ at 0 vol % GF100 and 25 wt % 3G8 is around 8 MPa, while it is increased to about 40 MPa at 15 vol % GF100 and 25 wt % 3G8. Within the margin of error, this five-fold increase is comparable to the four-fold increase when no softener is added. That means that using MGF in combination with softener, the storage modulus of the resulting composite can be adjusted between 8 MPa and 8 GPa.
Adding softener to a polymer also changes the glass transition temperature, as shown in
Figure 19b.
Tg is moved from 76 °C to room temperature (25 °C) when softener is added from 0 to 25 wt %. This is especially important when visco-elastic behavior is preferable to the application.
4. Summary
The results show that it was possible to produce a transparent composite of PVB with different volume contents of MGF and softener using a slurry process combined with blade casting. The storage modulus of such composites increases with the volume content of MGF and decreases with the addition of softener. MGF with higher mean diameter and, therefore, higher aspect ratio at a fixed thickness show a stronger stiffening behavior when compared to MGF with smaller diameter and, therefore, smaller aspect ratio.
The composites show increasing haze with the addition of MGF. The increase was found to be non-linear when adding MGF with a high aspect ratio. In comparison to irregular glass particles and MGF with small aspect ratio, the haze was found to be significantly lower. With the addition of softener, the RIs of such composites can be matched, resulting in a residual haze below 2%, which is considered as highly transparent.
It should be noted that using the above-stated approach, the mechanical properties due to the addition of softener cannot be independently changed without also influencing the RI mismatch and thus haze and vice versa. By further fine-tuning the glass composition to match the RI closer to 1.493, it is possible to achieve high stiffness and at the same time, high transparency, as explained above.
Considering the possible industrial application of this method, the limiting factors are the size of the blade-casting setup and drying oven. However, combining smaller patches, laminated glass composites of up to 0.5 m2 have already been produced. Instead of blade casting, printing the slurry on a substrate could, in theory, greatly increase the individual size of composite sheets and speed of production. A disadvantage of the current process for scaling is the roughness and waviness of the composite sheets after drying, which require an additional hot pressing step with a smooth surface or lamination, as shown in this study, to achieve high transmission and low haze as the surface properties greatly influence the optical properties.
Author Contributions
B.S. performed the experiments and wrote the paper. T.G., S.L. and D.B. provided guidance and helped in manuscript preparation.
Funding
Financial support by the European Union project HarWin (FP7-CP-FP, Grant number: 314653) is gratefully acknowledged.
Acknowledgments
The presented work is dedicated to Monika Willert-Porada, who passed away on 11 December 2016. She initiated the above-mentioned project. In addition, the authors would like to thank Angelika Kreis and Ingrid Otto for laboratory support; Catrin Chow, Mario Mösch, Tobias Schindhelm, Matthias Wurm, Jens Böckler, Nicole Bayer and Christoph Seifert for their support preparing the samples as well as Manfred Arnold for his expert input on the lamination process. This publication was funded by the German Research Foundation (DFG) and the University of Bayreuth in the funding program Open Access Publishing.
Conflicts of Interest
The authors declare no conflicts of interest.
References
- Bäumer, S. Handbook of Plastic Optics, 2nd ed.; Wiley-VCH Verlag GmbH & Co. KGaA: Weinheim, Germany, 2010; ISBN 978-352-740-940-2. [Google Scholar]
- Sastri, V.R. Plastics in Medical Devices: Properties, Requirements and Applications, 2nd ed.; William Andrew: New York, NY, USA, 2014; pp. 73–120. ISBN 978-145-573-201-2. [Google Scholar]
- Willert-Porada, M. Harvesting Solar Energy with Multifunctional Glass-Polymer Windows. Available online: https://cordis.europa.eu/project/rcn/104545/reporting/en (accessed on 18 November 2019).
- Iba, H.; Chang, T.; Kagawa, Y. Optically Transparent Continuous Glass Fibre-Reinforced Epoxy Matrix Composite: Fabrication, Optical and Mechanical Properties. Compos. Sci. Technol. 2002, 62, 2043–2052. [Google Scholar] [CrossRef]
- Olson, J.R.; Day, D.E.; Stoffer, J.O. Fabrication and Mechanical Properties of an Optically Transparent Glass Fiber/Polymer Matrix Composite. J. Compos. Mater. 1992, 26, 1181–1192. [Google Scholar] [CrossRef]
- Khanna, S.K.; Ellingsen, M.D.; Winter, R.M. Investigation of Fracture in Transparent Glass Fiber Reinforced Polymer Composites Using Photoelasticity. ASME J. Eng. Mater. Technol. 2004, 126, 1–7. [Google Scholar] [CrossRef]
- Moriwaki, T. Mechanical Property Enhancement of Glass Fibre-Reinforced Polyamide Composite Made by Direct Injection Moulding Process. Compos. Part A 1996, 27, 379–384. [Google Scholar] [CrossRef]
- Zhu, H.; Khanna, S.K. A Novel Transparent Glass Fiber-Reinforced Polymer Composite Interlayer for Blast-Resistant Windows. J. Eng. Mater. Technol. 2016, 138. [Google Scholar] [CrossRef]
- Wildner, W.; Drummer, D. The Mechanical and Optical Properties of Injection-moulded PMMA, Filled with Glass Particles of a Matching Refractive Index. Polym. Polym. Compos. 2017, 25, 453–462. [Google Scholar] [CrossRef]
- Hashemi, S.; Din, K.J.; Low, P. Fracture behavior of glass bead-filled poly(oxymethylene) injection moldings. Polym. Eng. Sci. 1996, 36, 1807–1820. [Google Scholar] [CrossRef]
- Lee, J.; Yee, A.F. Fracture of glass bead/epoxy composites: On micro-mechanical deformations. Polymer 2000, 41, 8363–8373. [Google Scholar] [CrossRef]
- Naganuma, T.; Iba, H.; Kagawa, Y. Optothermal properties of glass particle-dispersed epoxy matrix composite. J. Mater. Sci. Lett. 1999, 18, 1587–1589. [Google Scholar] [CrossRef]
- Kagawa, Y.; Iba, H.; Tanaka, M. Fabrication and optical/thermal properties of glass particle-epoxy optically transparent composites. Acta Mater. 1998, 46, 265–271. [Google Scholar] [CrossRef]
- Ajayan, P.M.; Schadler, L.S.; Braun, P.V. Nanocomposite Science and Technology; Wiley-VCH: Weinheim, Germany, 2003; ISBN 978-352-730-359-5. [Google Scholar]
- Wildner, W.; Drummer, D. A fiber optic temperature sensor based on the combination of epoxy and glass particles with different thermo-optic coefficients. Photonic Sens. 2016, 6, 295–302. [Google Scholar] [CrossRef]
- Wildner, W.; Drummer, D. A fiber optic temperature sensor based on the combination of two materials with different thermo-optic coefficients. IEEE Sens. J. 2015, 16, 688–692. [Google Scholar] [CrossRef]
- Bach, H.; Neuroth, N. The Properties of Optical Glass; Springer: Berlin/Heidelberg, Germany, 1998; ISBN 978-364-257-769-7. [Google Scholar]
- Zhang, Z.; Zhao, P.; Lin, P.; Sun, F. Thermo-optic coefficients of polymers for optical waveguide applications. Polymer 2006, 47, 4893–4896. [Google Scholar] [CrossRef]
- Breuer, H.; Grzesitza, J. Trübungserscheinungen in zweiphasigen Polymersystemen (glasfaserverstärkte Polymere). Die Angew. Makromol. Chem. 1975, 45, 1–19. [Google Scholar] [CrossRef]
- Naganuma, T.; Kagawa, Y. Effect of particle size on light transmittance of glass particle dispersed epoxy matrix optical composites. Acta Mater. 1999, 47, 4321–4327. [Google Scholar] [CrossRef]
- Wildner, W.; Drummer, D. Light scattering of glass-particle filled matrices with similar refractive index. J. Compos. Mater. 2018, 52, 4231–4246. [Google Scholar] [CrossRef]
- Kyrgyzbaev, K.; Rosin, A.; Willert-Porada, M. Influence of temperature on the thickness of ultrathin particulate glass platelets. Eur. J. Glass Sci. Technol. Part A 2016, 57, 95–100. [Google Scholar] [CrossRef]
- Kyrgyzbaev, K. Simulationsbasierte Prozessentwicklung zur Herstellung von Submikrometer-Glaspartikeln. Ph.D. Thesis, University of Bayreuth, Bayreuth, Germany, 25 November 2017. [Google Scholar]
- ECKART EFFECT Pigments. Available online: https://www.eckart.net/markets/cosmetics/products.html (accessed on 30 June 2019).
- González-Guzmán, J.; Santana, J.J.; González, S.; Souto, R.M. Resistance of metallic substrates protected by an organic coating containing glass flakes. Prog. Org. Coat. 2010, 68, 240–243. [Google Scholar] [CrossRef]
- ECR Glassflakes Product Page. Available online: https://www.glassflake.com/products/ecr-glass-flake/ (accessed on 30 June 2019).
- McKeen, L.W. Permeability Properties of Plastics and Elastomers, 4th ed.; William Andrew: New York, NY, USA, 2017; ISBN 978-032-350-859-9. [Google Scholar]
- Mowital® Technical Data Sheet. Available online: https://www.mowital.com/fileadmin/user_upload/MOWITAL/downloads/technical_data_sheets/190410_TDS_Mowital_B_DE.pdf (accessed on 16 May 2019).
- Chembook Triethylene Glycol Bis(2-Ethylhexanoate). Available online: https://www.chemicalbook.com/CASEN_94-28-0.htm (accessed on 15 January 2019).
- International Organization for Standardization. Plastics—Determination of the Total Luminous Transmittance of Transparent Materials—Part 1: Single-Beam Instrument; ISO 13468-1:2019; International Organization for Standardization: Genf, Switzerland, 2019. [Google Scholar]
- International Organization for Standardization. Plastics—Determination of Haze for Transparent Materials; ISO 14782:1999; International Organization for Standardization: Genf, Switzerland, 1999. [Google Scholar]
- Ehrenstein, G.W. Polymer-Werkstoffe, 2nd ed.; Carl Hanser Verlag: München, Germany, 1999; ISBN 978-344-621-162-1. [Google Scholar]
- Ehrenstein, G.W.; Riedel, G.; Trawiel, P. Praxis Der Thermischen Analyse Von Kunststoffen, 2nd ed.; Carl Hanser Verlag: München, Germany, 2003; ISBN 978-344-622-340-0. [Google Scholar]
- Thomason, J.L.; Vlug, M.A. The influence of fibre length and concentration on the properties of glass fibre reinforced polypropylene: 1. Tensile and flexural modulus. Compos. Part A 1996, 27, 477–484. [Google Scholar] [CrossRef]
- Thomason, J.L.; Groenewoud, W.M. The influence of fibre length and concentration on the properties of glass fibre reinforced polypropylene: 2. Thermal properties. Compos. Part A 1996, 27, 555–565. [Google Scholar] [CrossRef]
- Thomason, J.L. The Influence of fibre length and concentration on the properties of glass fibre reinforced polypropylene: 5. Injection moulded long and short fibre PP. Compos. Part A 2002, 33, 1641–1652. [Google Scholar] [CrossRef]
Figure 1.
Schematics of the influence of glass fibers and glass flakes on transmitted light in a matrix with a mismatch of refractive indices.
Figure 1.
Schematics of the influence of glass fibers and glass flakes on transmitted light in a matrix with a mismatch of refractive indices.
Figure 2.
Scanning electron microscopy (SEM) image of commercial Micro Glass Flakes (MGF).
Figure 2.
Scanning electron microscopy (SEM) image of commercial Micro Glass Flakes (MGF).
Figure 3.
Butyral (
A), Alcohol (
B) and Acetate (
C) groups of commercial PVB compositions. The relative amount of A:B:C varies with the targeted application and properties [
27].
Figure 3.
Butyral (
A), Alcohol (
B) and Acetate (
C) groups of commercial PVB compositions. The relative amount of A:B:C varies with the targeted application and properties [
27].
Figure 4.
Molecular structure of softener 3G8 [
29].
Figure 4.
Molecular structure of softener 3G8 [
29].
Figure 5.
Polyvinyl Butyral (PVB)–MGF slurry before (a) and after (b) mixing in the planetary mixer.
Figure 5.
Polyvinyl Butyral (PVB)–MGF slurry before (a) and after (b) mixing in the planetary mixer.
Figure 6.
Blade casting setup (a) and schematics of the blade casting process with MGF (b).
Figure 6.
Blade casting setup (a) and schematics of the blade casting process with MGF (b).
Figure 7.
Sample after lamination with two additional glass panes for optical characterization.
Figure 7.
Sample after lamination with two additional glass panes for optical characterization.
Figure 8.
Measurement principle of a haze meter.
Figure 8.
Measurement principle of a haze meter.
Figure 9.
Stress–strain curves of a total elastic (a) and visco-elastic (b) material with hysteresis and time-dependent behavior.
Figure 9.
Stress–strain curves of a total elastic (a) and visco-elastic (b) material with hysteresis and time-dependent behavior.
Figure 10.
Stress–strain behavior of elastic (
a) and visco-elastic (
b) materials with an applied sinus deformation and a given frequency. The delay in the measured stress is determined by the phase shift δ [
32].
Figure 10.
Stress–strain behavior of elastic (
a) and visco-elastic (
b) materials with an applied sinus deformation and a given frequency. The delay in the measured stress is determined by the phase shift δ [
32].
Figure 11.
Cross-section of PVB–MGF composites with (a) 16, (b) 23 and (c) 26 vol % of GF100 glass flakes and an average thickness of y ~120–150 µm. The alignment of the flakes parallel to the sample surface is increased with volume content.
Figure 11.
Cross-section of PVB–MGF composites with (a) 16, (b) 23 and (c) 26 vol % of GF100 glass flakes and an average thickness of y ~120–150 µm. The alignment of the flakes parallel to the sample surface is increased with volume content.
Figure 12.
Cross-section of PVB–MGF composites with 16 vol % of GF100 (d50 = 160 µm) (a) and 16 vol % of GF001 (d50 = 30 µm) (b) glass flakes.
Figure 12.
Cross-section of PVB–MGF composites with 16 vol % of GF100 (d50 = 160 µm) (a) and 16 vol % of GF001 (d50 = 30 µm) (b) glass flakes.
Figure 13.
SEM (SEI) image using of PVB–MGF composites with 23 vol % (a) and 16 vol % (b) of GF100 (d50 = 160 µm) with slight delamination and preparation artefacts.
Figure 13.
SEM (SEI) image using of PVB–MGF composites with 23 vol % (a) and 16 vol % (b) of GF100 (d50 = 160 µm) with slight delamination and preparation artefacts.
Figure 14.
Transmission (a) and haze (b) in relation to volume content and size of MGF with GF100 (d50 = 160 µm) and GF001 (d50 = 30 µm). Thickness of composite was normalized to 200 µm.
Figure 14.
Transmission (a) and haze (b) in relation to volume content and size of MGF with GF100 (d50 = 160 µm) and GF001 (d50 = 30 µm). Thickness of composite was normalized to 200 µm.
Figure 15.
Haze of MGF in PVB compared to results from the literature of irregularly shaped glass particles in polymethyl methacrylate (PMMA) [
9] with respect to volume content. Values were normalized to 500 µm sheet thickness.
Figure 15.
Haze of MGF in PVB compared to results from the literature of irregularly shaped glass particles in polymethyl methacrylate (PMMA) [
9] with respect to volume content. Values were normalized to 500 µm sheet thickness.
Figure 16.
Haze values of composites with 15 vol % of GF-V8 MGF with respect to different contents of softener (3G8). All results were normalized to 200 µm sheet thickness.
Figure 16.
Haze values of composites with 15 vol % of GF-V8 MGF with respect to different contents of softener (3G8). All results were normalized to 200 µm sheet thickness.
Figure 17.
Temperature-dependent storage modulus E’ of PVB filled with MGF of type GF100.
Figure 17.
Temperature-dependent storage modulus E’ of PVB filled with MGF of type GF100.
Figure 18.
Storage modulus E’ at 25 °C with different volume fractions of GF100 (d50 = 160 µm) and GF001 (d50 = 30 µm).
Figure 18.
Storage modulus E’ at 25 °C with different volume fractions of GF100 (d50 = 160 µm) and GF001 (d50 = 30 µm).
Figure 19.
Storage modulus E’ in respect to content of GF100 and softener 3G8 (a) and glass transition Tg of PVB in respect to softener (b).
Figure 19.
Storage modulus E’ in respect to content of GF100 and softener 3G8 (a) and glass transition Tg of PVB in respect to softener (b).
Table 1.
Properties of Micro Glass Flakes used in this study.
Table 1.
Properties of Micro Glass Flakes used in this study.
| Type | Mean Diameter (D50) | Thickness | Specific Density |
|---|
| GF100 | 160 µm | 1.0–1.3 µm | 2.3 g/cm3 |
| GF001 | 30 µm | 0.9–1.3 µm | 2.3 g/cm3 |
| GF-V8 | 120 µm | 2.0–5.0 µm | 2.3 g/cm3 |
Table 2.
Properties of common types of Mowital
® powder [
28].
Table 2.
Properties of common types of Mowital
® powder [
28].
| Properties | B 14 S | B 30 H | B 60 HH | B 75 H |
|---|
| Glass transition temperature (°C) | 60 | 68 | 65 | 73 |
| Content of polyvinyl alcohol (%) | 14–18 | 18–21 | 12–16 | 18–21 |
| Content of polyvinyl acetate (%) | 5–8 | 1–4 | 1–4 | 0–4 |
| Dynamic viscosity 10% in EtOH (mPa·s) | 9–13 | 35–60 | 120–280 | 60–100 |
| Bulk density (g/cm3) | 0.34 | 0.32 | 0.21 | 0.20 |
| Specific density (g/cm3) | 1.1 | 1.1 | 1.1 | 1.1 |
Table 3.
Measurement parameters for Dynamic Mechanical Analysis (DMA).
Table 3.
Measurement parameters for Dynamic Mechanical Analysis (DMA).
| Measurement Parameter | Symbol | Settings |
|---|
| Sample length | | 25 mm |
| Sample length (clamping) | | 17.5 mm |
| Sample width | | 5 mm |
| Sample thickness | | 0.5–0.7 mm |
| Strain | | 0.00085 |
| Amplitude | | 15 µm |
| Frequency | | 1 Hz |
| Temperature range | °C | −50–100 °C |
| Heating/cooling rate | | 1 K/min |
Table 4.
Refractive index n at 589.3 nm (nD) as measured with Abbemat MW.
Table 4.
Refractive index n at 589.3 nm (nD) as measured with Abbemat MW.
| Component | nD @ 20 °C |
|---|
| GF100/GF001 | 1.500 |
| GF-V8 | 1.485 |
| Sheet B 30 H | 1.493 |
| Sheet B 30 H + 25 wt % 3G8 | 1.483 |
| Softener 3G8 | 1.444 * |
© 2019 by the authors. Licensee MDPI, Basel, Switzerland. This article is an open access article distributed under the terms and conditions of the Creative Commons Attribution (CC BY) license (http://creativecommons.org/licenses/by/4.0/).


