Article

Defining Key Factors in Carbon Black-Filled NR/BR Compounds for Balancing Aircraft Tire Tread Properties

1
Center for Material Technology, Agency for the Assessment and Application of Technology (BPPT), Building 224, Kawasan Puspiptek Serpong, Tangerang Selatan, Banten 15314, Indonesia
2
Elastomer Technology and Engineering, Faculty of Engineering, University of Twente, Drienerlolaan 5, 7522NB Enschede, The Netherlands
*
Authors to whom correspondence should be addressed.
J. Compos. Sci. 2019, 3(2), 47; https://doi.org/10.3390/jcs3020047
Submission received: 11 March 2019 / Revised: 5 April 2019 / Accepted: 26 April 2019 / Published: 5 May 2019
(This article belongs to the Special Issue Sustainable Rubber Composites)

Abstract

:
Carbon black (CB) is the most common reinforcing filler used in aircraft tire tread formulations. For CB-reinforced natural rubber/butadiene rubber (NR/BR) compounds, material and processing parameters are important factors that need to be controlled, as they can influence both, processing as well as the vulcanizate properties. It is essential to investigate and optimize the key elements, in order to achieve the target properties, while maintaining an acceptable trade-off for other characteristics. In the present study, the type of BR, mixer temperature, rotor speed, and filler mixing time were selected as input factors. A complete design of experiments (DOE) process was performed that comprised the following—two-level full factorial setup for initial screening, response surface method (RSM) for optimization, and confirmation runs for validation. This evaluation procedure was used to study the impact of factors and their interactions on the properties of CB-filled NR/BR compounds. From the DOE optimization which was later confirmed by the DOE validation, high rotor speed and long filler mixing time were the most significant factors in improving the Mooney viscosity, modulus at 300% elongation, hysteresis (tan delta), as well as in reducing the filler–filler interaction (Payne effect). In the case of tensile strength (TS) and abrasion resistance index (ARI), high rotor speed and long filler mixing time had an adverse effect, thus, causing a deterioration of these properties. Therefore, it is recommended to decrease the filler mixing time when combining it with high rotor speed.

1. Introduction

Aircraft (AC) tire treads experience severe operating conditions in which the tire treads must be able to endure high forces, upon landing of the aircraft—the tire touches the ground with zero rotational speed which creates a high friction under substantial load, thus causing high temperatures within the AC tire tread. During takeoff, aircrafts also experience significant forces, which require a rapid acceleration to relatively high speeds under load [1]. Due to these extreme working conditions, AC tire treads need to be resistant against heat generation and wear. Based on the simulation done by Alroqi et al., at zero rotational speed during landing, the temperature of the tire tread in the main area of contact was around 300 °C, while the majority of the tread temperature was less than 165 °C [2].
The selection of compound ingredients plays a vital role in the performance of AC tire treads. The main requirements for AC tire treads are low hysteresis, superior tensile and tear strength, good retreadability, good adhesion to the underlayer, and high wear resistance [1]. Therefore, the treads of AC tires generally contain natural rubber (NR). This polymer is essential in AC tire tread compounds, due to several advantages such as superior tensile and tear properties, low tire temperature (hysteresis) under loaded dynamic service conditions, good component-to-component adhesion, and green strength for tire retreadability [3]. Another essential requirement is high wear resistance; therefore, a blend of NR and butadiene rubber (BR) is typically used for AC tire treads. BR gives a better low temperature flexibility, higher resilience, and superior abrasion resistance than most tire rubbers [4]. Reinforcing fillers, such as high surface area Carbon black (CB), in particular high abrasion furnace (HAF), intermediate superabrasion furnace (ISAF), and super abrasion furnace (SAF) types, can also be added to enhance the abrasion resistance [5].
Besides the ingredients, processing of rubber is also a crucial aspect in material preparation. The major variables in mixing rubber are ram pressure, the sequence of material addition, rotor speed, batch size, mixing time and temperature [6], fill factor, and rotor type. A proper selection of these variables can further optimize the properties of rubber compounds.
It is essential to investigate and optimize the compounding and processing key elements, in order to achieve the target properties, while maintaining an acceptable trade-off for other characteristics. Design of Experiments (DOE) is used for this purpose instead of a conventional experimental method, which is done by varying all relevant factors simultaneously. Moreover, an approach such as one factor at a time (OFAT) does not lead to a real optimum for the investigated system, and fails when choosing the optimum setting conditions. Although OFAT can directly reveal how certain factors affect the product performance, it covers the whole parameter space very poorly and does not disclose whether there are interactions between specific factors. In contrast, by a DOE approach, the entire factor space can be explored by using as many variables as necessary at the same time. Thus, a more substantial space volume response is covered, and factor interactions are also revealed [7].
In this study, four factors, namely, the type of BR, mixer temperature, rotor speed, and filler mixing time, were selected as the key parameters and investigated in CB-filled NR/BR compounds. Aiming to identify the most significant factor for balancing the properties of aircraft tread compounds, a complete design of the experiments (DOE) process comprises a two-level full factorial setup for screening. The properties of AC tire treads, such as the Mooney viscosity (MV), filler–filler interaction (Payne effect), hysteresis (tan delta at 100 °C), stress–strain properties, and abrasion resistance index (ARI) were chosen as the responses. Finally, after the screening process, the two most notable factors were optimized and confirmation runs for validation were performed.

2. Materials and Methods

2.1. Materials

The rubber types used were Natural Rubber (Ribbed Smoked Sheet (RSS-1)), obtained from Weber and Schaer GmbH and Co. KG, Hamburg, Germany, and highly linear (HL) BR (CB22), as well as long-chain branched (LCB) BR (Nd22EZ) from Arlanxeo, Dormagen, Germany. Other compounding ingredients were high structure carbon black N234 from Cabot, Alpharetta, Georgia, USA, treated distillate aromatic extract oil (TDAE oil) from Hansen and Rosenthal, Hamburg, Germany. N-cyclohexyl-2-benzothiazole sulfenamide (CBS), 2,2,4-trimethyl-1,2-dihydroquinoline (TMQ), N-phenyl-para-phenylenediamine (6PPD), zinc oxide (ZnO), stearic acid, and sulfur were of technical quality.
For the DOE screening purpose, two types of BR were used (as given in Table 1) to study the effect of the type of BR on the properties. The compound formulation used for this study is depicted in Table 2, adopted from a patent for AC tire tread formulations [8].
For the DOE screening, mixing was performed in an internal mixer (Brabender Plasticorder 350 s), with an initial mixer temperature setting, rotor speed, and filler mixing time varying on the basis of the defined experimental design (see the DOE screening method). The mixer was operated at a fill factor of 70%.
Two-stage of mixing was performed as shown in Table 3. NR was initially masticated prior to the addition of BR to have a Mooney viscosity close to the one of BR. The masticated NR and BR were blended for 1 min. Then, half of CB and TDAE oil were added and mixed for half the set filler mixing time. After that specific time, the other half of CB and TDAE oil were added and mixed for the remaining time, according to Table 4. Finally, other ingredients—ZnO, stearic acid, 6PPD, and TMQ were added and mixed for 2.5 min. The compounds were then dumped, sheeted out on a two-roll mill and kept overnight before incorporation of sulfur and CBS in an internal mixer at a temperature of 70 °C and an initial rotor speed of 50 rpm. For this, the masterbatch was mixed for 1 min, the rotor speed was decreased to 30 revolutions per minutes (rpm) before curatives were added and the compound was mixed for another 2 min.

2.2. Method

Scheme S1 of the supplementary materials depicts the flow chart of the DOE process in this research. The method comprises DOE screening, DOE optimization, and a confirmation run to check the validity of the model with the result from the actual experiment.

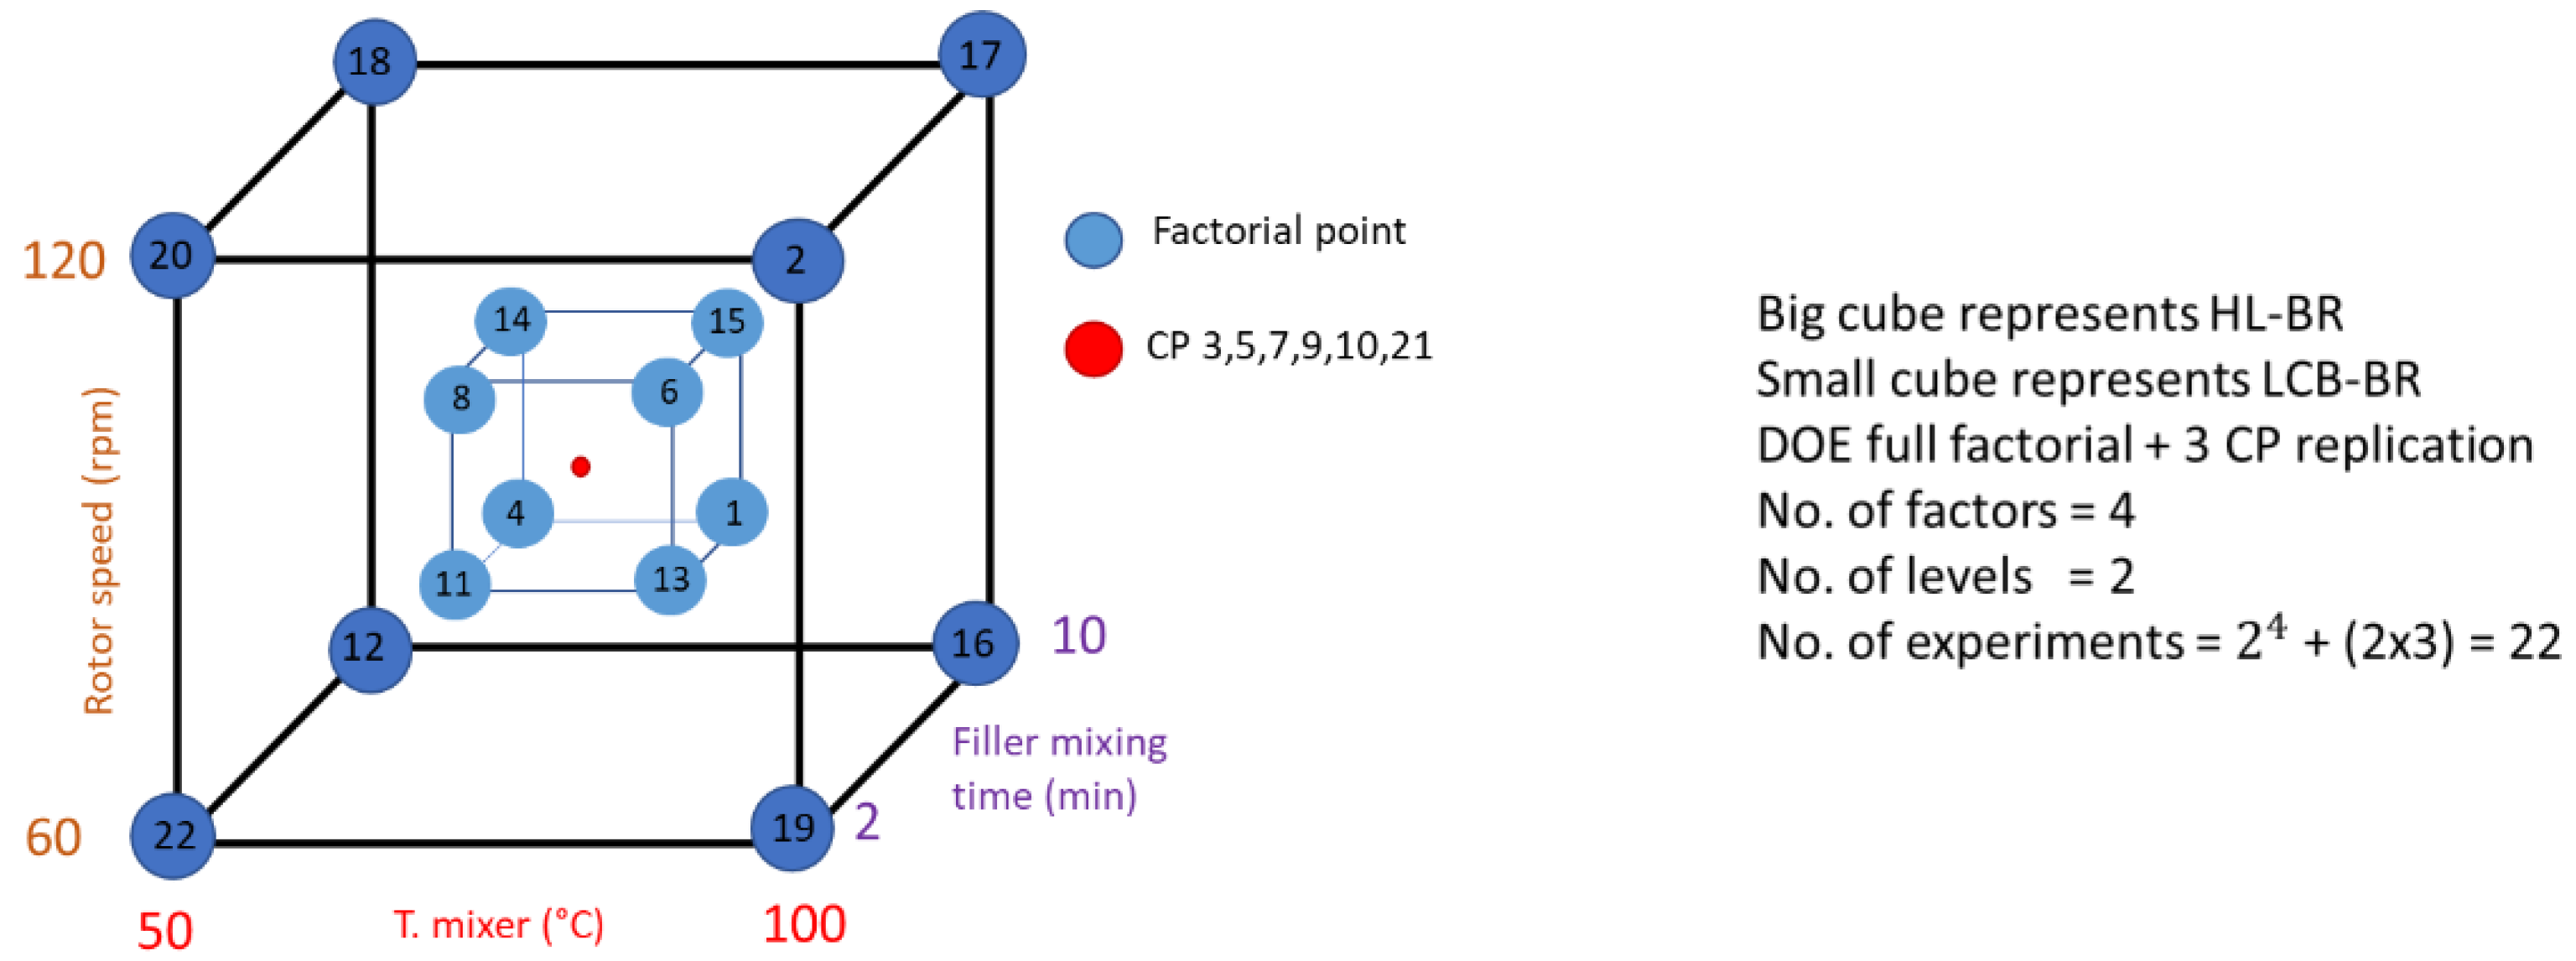
2.2.1. DOE Screening

A DOE screening was used at the beginning of the experiment. The objective at this stage was to explore if the factors influence the selected responses and to identify the appropriate ranges. A two-level full factorial approach comprising four factors is shown in Table 4. Each factor had two levels—a low level (−1) and a high level (+1) with an additional center point (CP, 0) chosen for replication, except for the BR type.
The two-level full factorial design with four factors, denoted 24, is geometrically represented in a cube, as shown in Figure 1. The cube is representative of two different types of BR. The three axes are dedicated to temperature, rotor speed, and filler mixing time. The total number of experiments for this stage was 22 runs as shown in Table S1 of the supplementary materials.

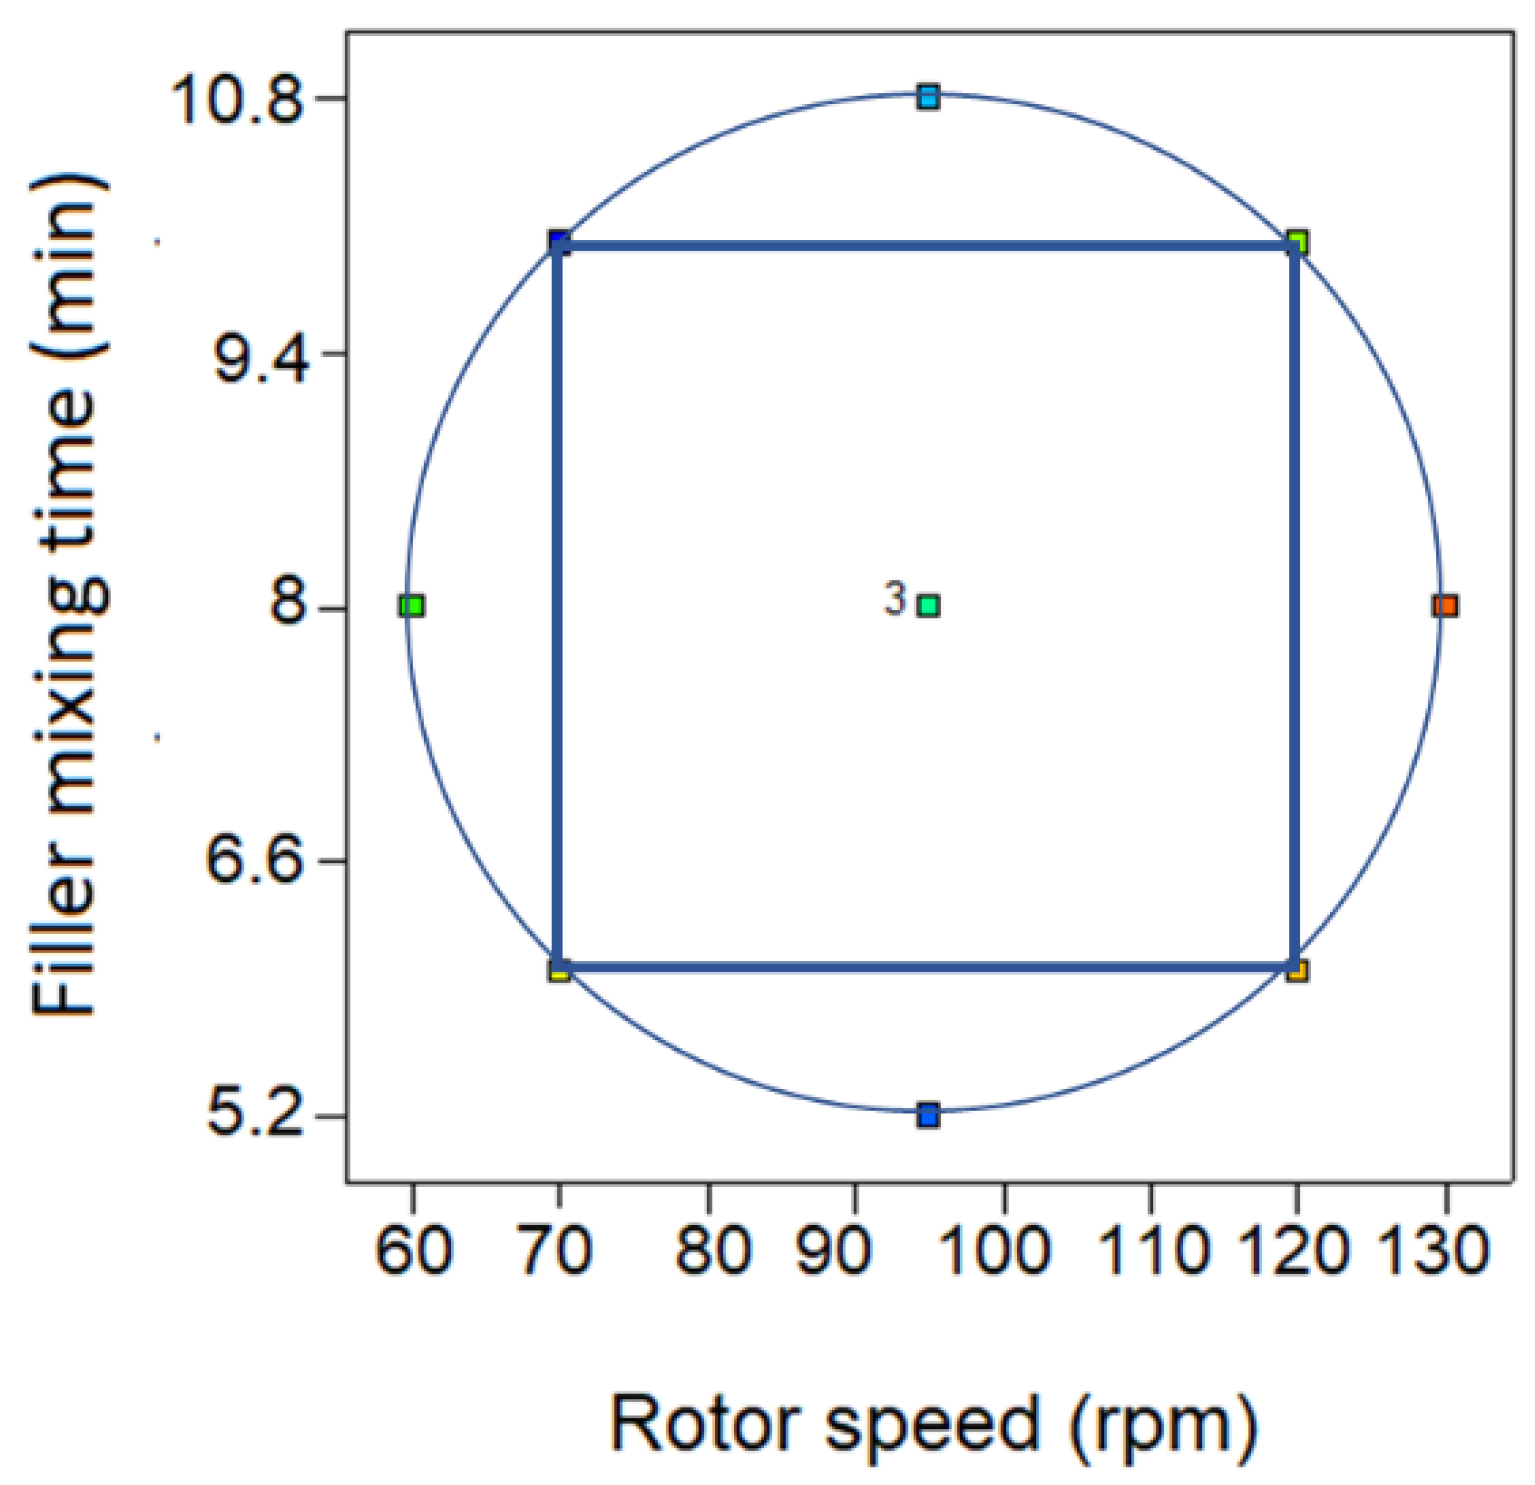
2.2.2. DOE Optimization

The two most significant factors on the defined-responses from the DOE screening were further optimized using the response surface method (RSM)—rotor speed and filler mixing time. A central composite circumscribed (CCC) design was selected for the DOE optimization, with the level settings as shown in Figure 2. A total of 11 runs were performed to elucidate, in more detail, the effect of the rotor speed, filler mixing time, and their interactions with the compound properties.
The assessment of the significance of the effects and their interaction in both DOE screening and DOE optimization was done by analysis of variance (ANOVA) (see Tables S2 and S3 of the supplementary materials). The DOE also provided several graphical outputs, such as:
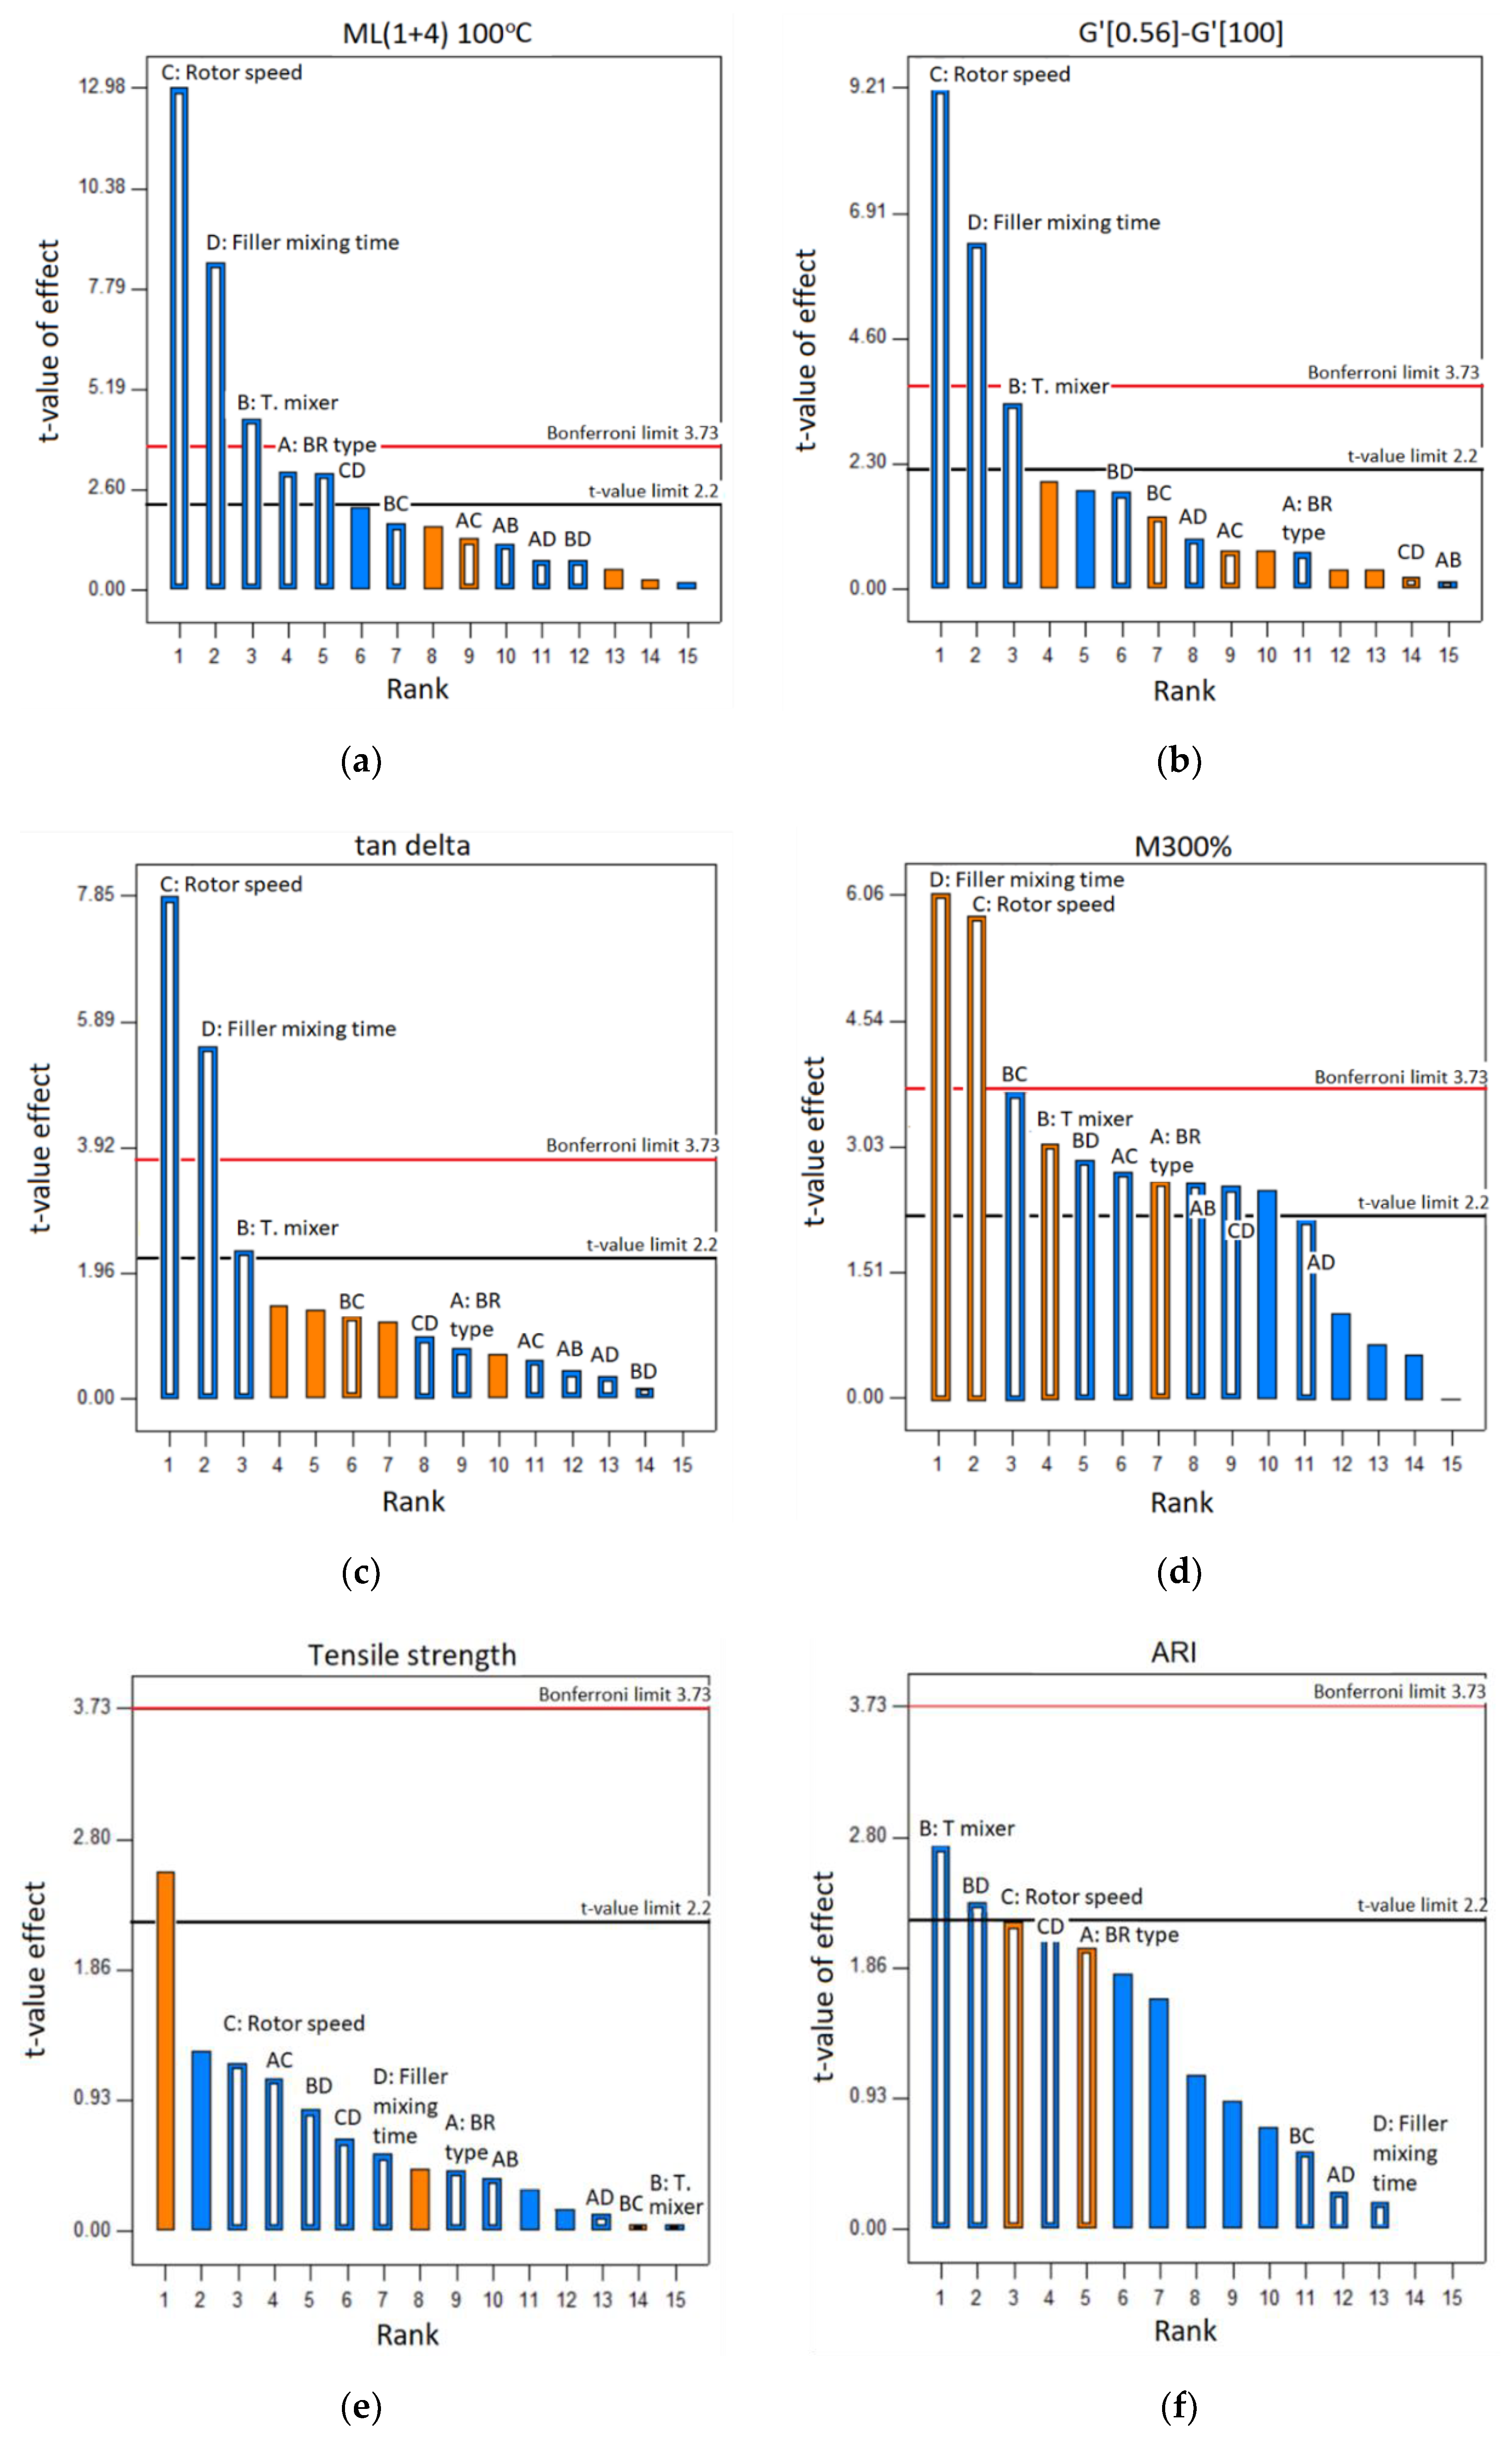
  • Pareto chart to show factors and interactions that are statistically significant on the observed response.
  • Contour plot to describe the effect of factors on the response.
  • Interaction plot to describe the interaction of main factors.
Design-Expert® Software Version 10 (Stat-Ease, Minneapolis, MN, USA) was used for analysis in DOE screening and DOE optimization.

3. Results and Discussion

3.1. DOE Screening

The results of the DOE screening for all responses are shown in Figures S1–S6 of the supplementary materials. Figure 3 shows the Pareto charts of the factors for several responses from the screening process. A t-test compared the observed t-value to a critical value on the t-distribution with (n) degrees of freedom (t-value limit), in order to determine whether the difference between the estimated and hypothesized values of the population parameter was statistically significant. The t-value limit was calculated with an alpha value (the probability of making the wrong decision when the null hypothesis is true) of 5%, while the Bonferroni limit was calculated with an alpha value of 1%.
The graphs showed that the rotor speed and filler mixing time were the most significant factors influencing MV (ML (1 + 4) 100 °C), the Payne effect (G’ (0.56)–G’ (100)), tan delta (measured at 100 °C, 20 Hz, 10% strain), and the modulus 300% (M300%). The mixer temperature had an influence on MV and M300%, but had less of an impact on the Payne effect and tan delta. The type of BR only had an effect on MV, M300%, and was insignificant for the remaining properties. For the tensile strength and abrasion resistance index (ARI), the effect of these factors on both properties was not conclusive as seen from their t-values being below the limit.
Contour plots were used to more clearly see the effect of the factors on the responses and interactions. The factor ‘interaction between rotor speed and filler mixing time’ on MV is depicted in Figure 4, for the two types of BR at 100 °C of the mixer temperature. A synergistic effect of the rotor speed and the filler mixing time was found at the high-level settings in which the combination of high rotor speed and long filler mixing time decreased the MV of the compounds considerably, as can be seen more clearly in Figure 5, where the distance between the lines was not the same at low and high level settings of rotor speed and filler mixing time. A high rotor speed provided higher shear stresses and resulted in higher stock temperatures, both lowering the MV.
At the same rotor speed and filler mixing time, the MV of the rubber compounds containing HL-BR was higher than the one of the compounds containing LCB-BR. The high MV values were due to the relatively high molecular weight of HL-BR, thus, had a higher viscosity compared to LCB-BR which had a lower molecular weight and more elastic properties.
The effect of the two most significant factors on the Payne effect is shown in Figure 6. The higher the rotor speed and the longer the filler mixing time, the lower the Payne effect. High rotor speed provided high shear rates, which were necessary for dispersive mixing and for allowing the fragmentation of CB agglomerates down to CB aggregates. Longer mixing times increased the inter-aggregate distance of CB, which led to a reduced formation of filler networks. The combination of both factors resulted in an even lower Payne effect, compared to when using only one single factor (rotor speed or filler mixing time) at high-level settings, as defined in Table 4. The effect of BR type on the Payne effect was insignificant.
Tan delta was measured at 100 °C, 20 Hz, and 10% strain and was used as an indication of hysteresis, for which a lower value indicated a lower hysteresis or lower heat generation. A temperature of 100 °C or above, and a frequency of 20 Hz represented the operating conditions of a typical AC tire tread, during landing. The temperature of the AC tire reached a maximum at the initial touchdown, when the slip ratio was 1 (wheel at zero rotational speed). Assuming that, for a typical Boeing 737–800, the speed of landing is 70 m/s (sec) [9], with the effective radius of a tire being 0.55 m [10], the frequency of the tire at first touchdown can be calculated:
f r e q u e n c y =   v 2   ×   π   ×   r e =   70 2   ×   3.14   ×   0.55   =   20   Hz
Figure 7 shows the effect of rotor speed and filler mixing time for two types of BR at various temperatures. A synergistic effect for a decreasing tan delta was detected when using high rotor speed and long filler mixing time, as depicted in the interaction plot of Figure 8. Compounds containing LCB-BR have slightly lower delta values, compared to compounds containing HL-BR. The tan delta values correlate well with Payne effect values, as low tan delta values correspond to low filler–filler interaction.
High M300% values were observed in the compounds which were mixed at a high rotor speed and long filler mixing time (see Figure 9). However, high mixer temperatures had a negative impact on M300%, as they lead to polymer degradation of NR, thus, decreasing the M300% (see Figure 10).
Although the effect of rotor speed and filler mixing time on tensile strength and ARI as depicted in the Pareto chart are not conclusive (see Figure 3e,f), there is an indication in the contour plot in Figure 11 that a decrease in rotor speed and mixer temperature, at long filler mixing times, are preferable for increasing the tensile strength. The decrease of tensile strength is attributed to thermal polymer degradation, in particular, for NR at high temperatures, and shearing forces.
Figure 12 shows that there is an indication that a high temperature of the mixer decreases ARI, while the rotor speed has a minor effect on ARI. From the screening process, it can be concluded that a high rotor speed and a long filler mixing time lower the MV, Payne effect, and tan delta, and increase the M300, while for the tensile strength, a high mixer temperature, in combination with high rotor speed and long mixing time, decreased this property. ARI is highly dependent on the mixer temperature and is relatively independent of rotor speed.

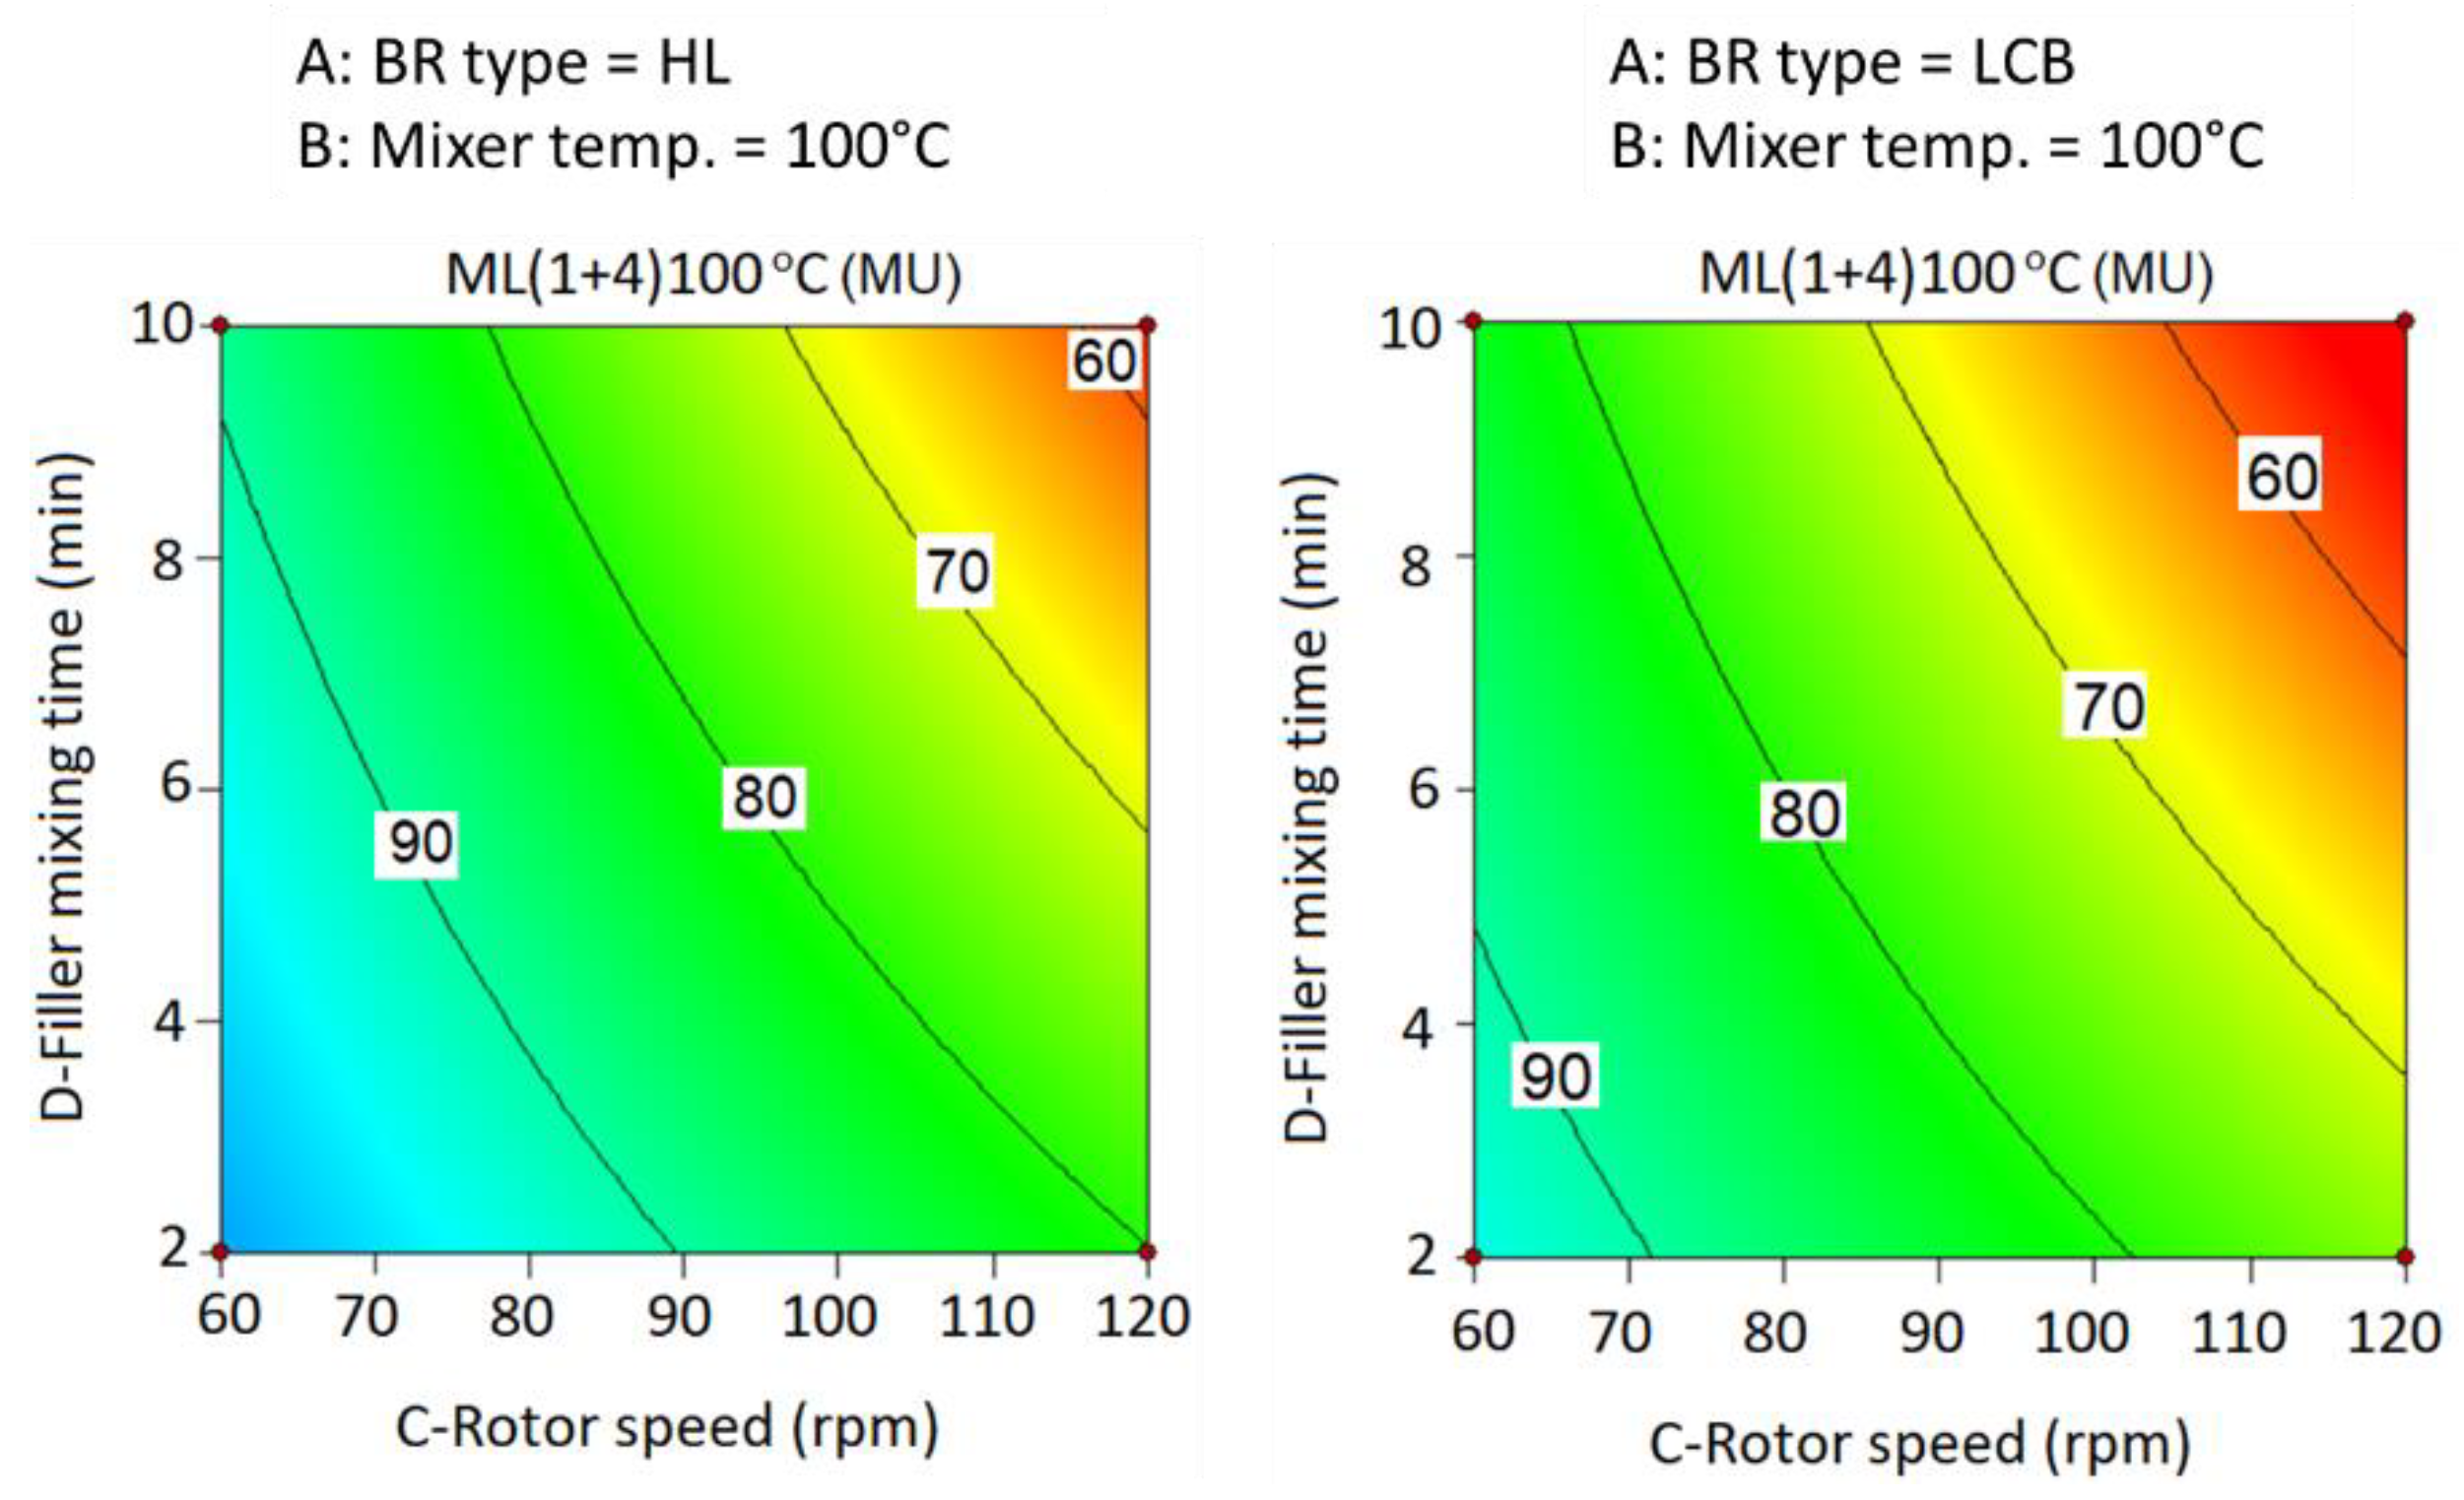
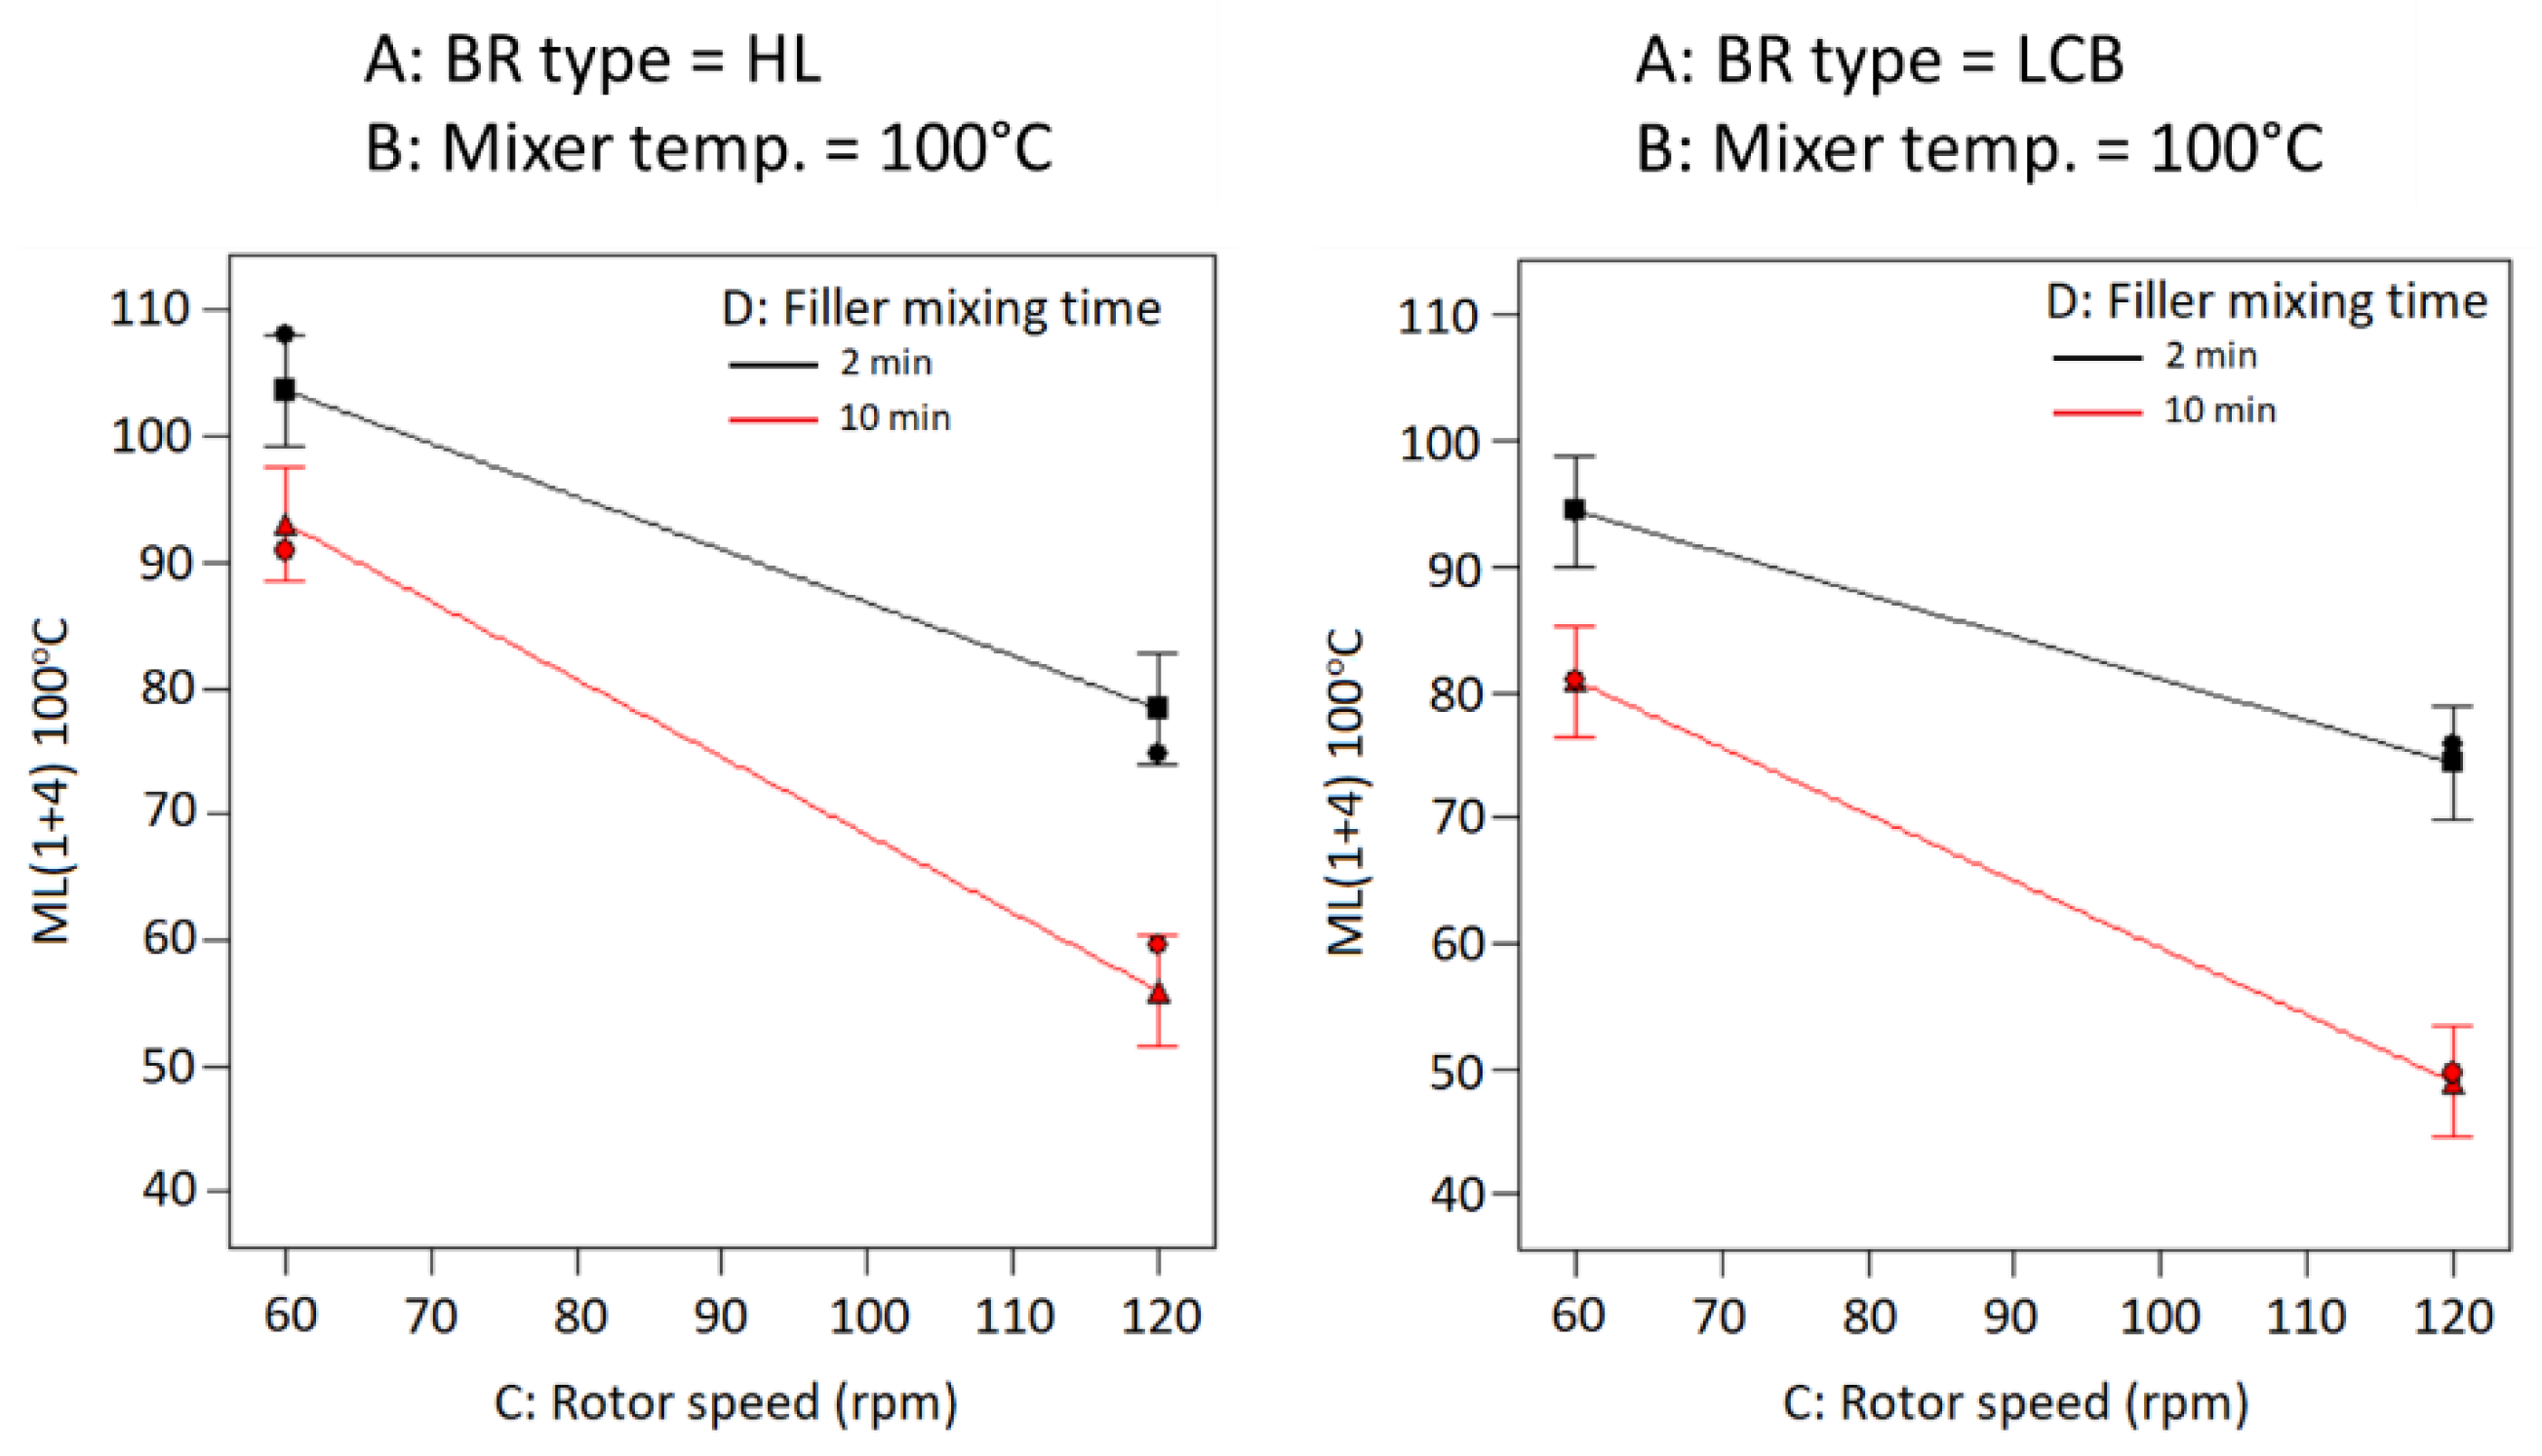
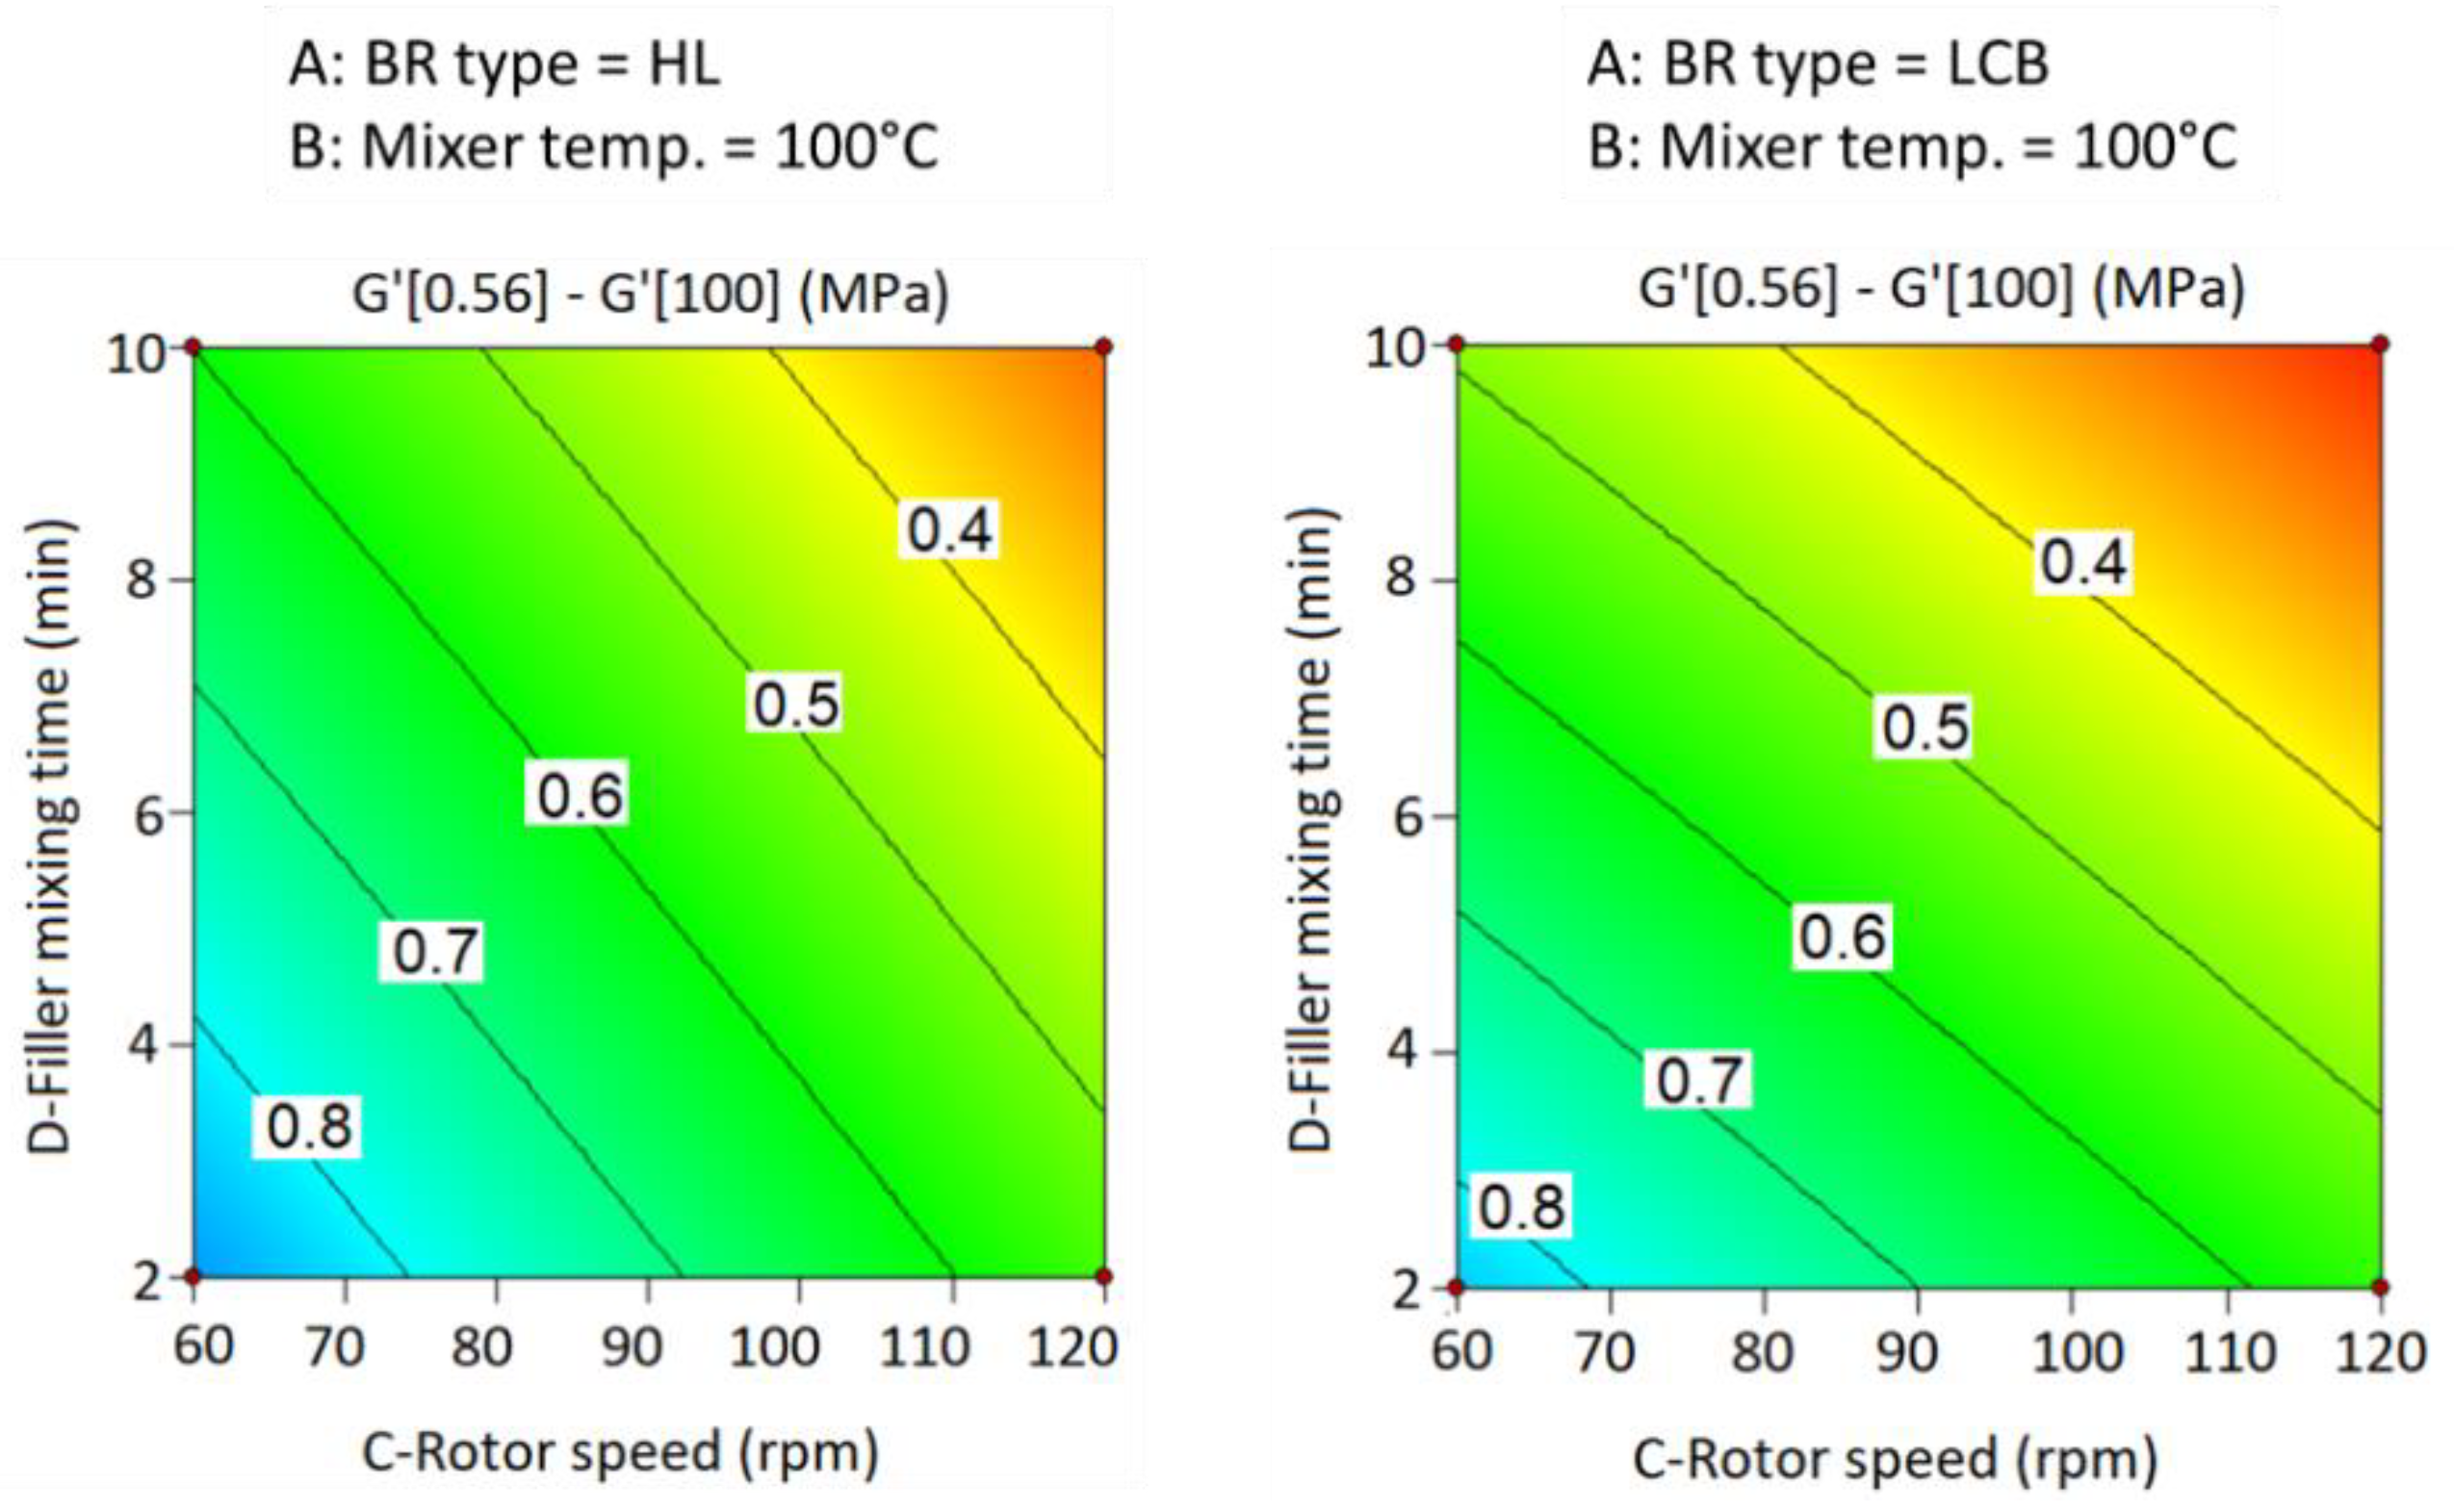
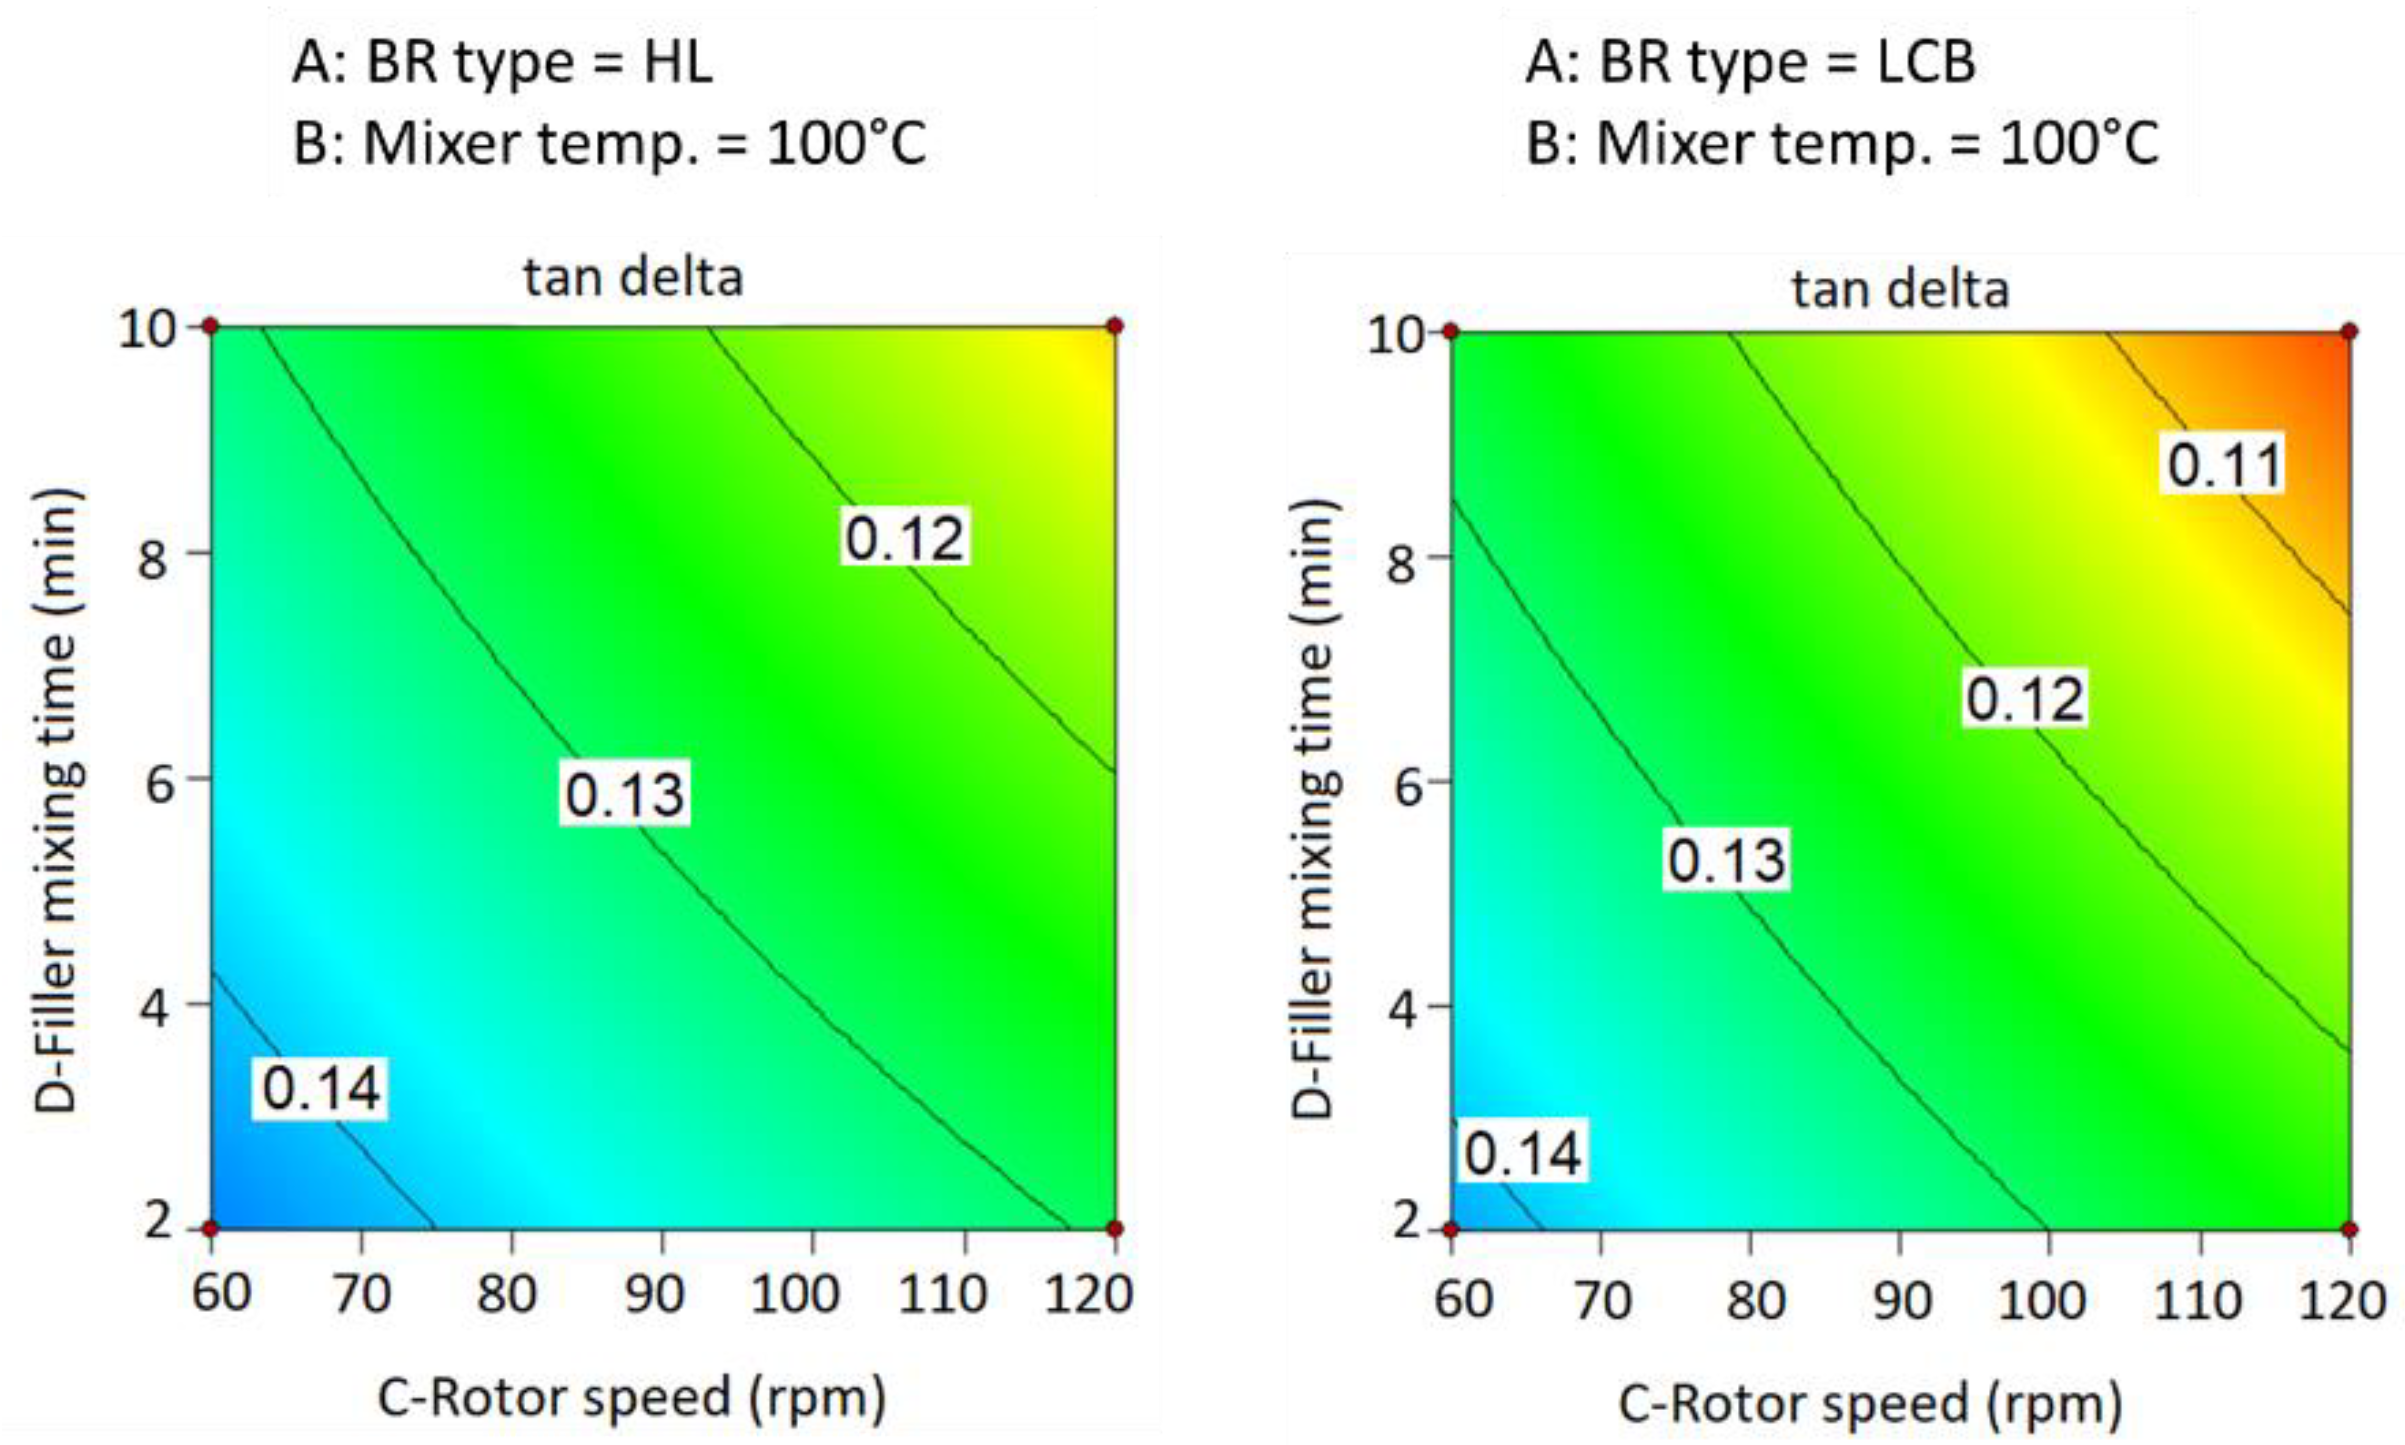
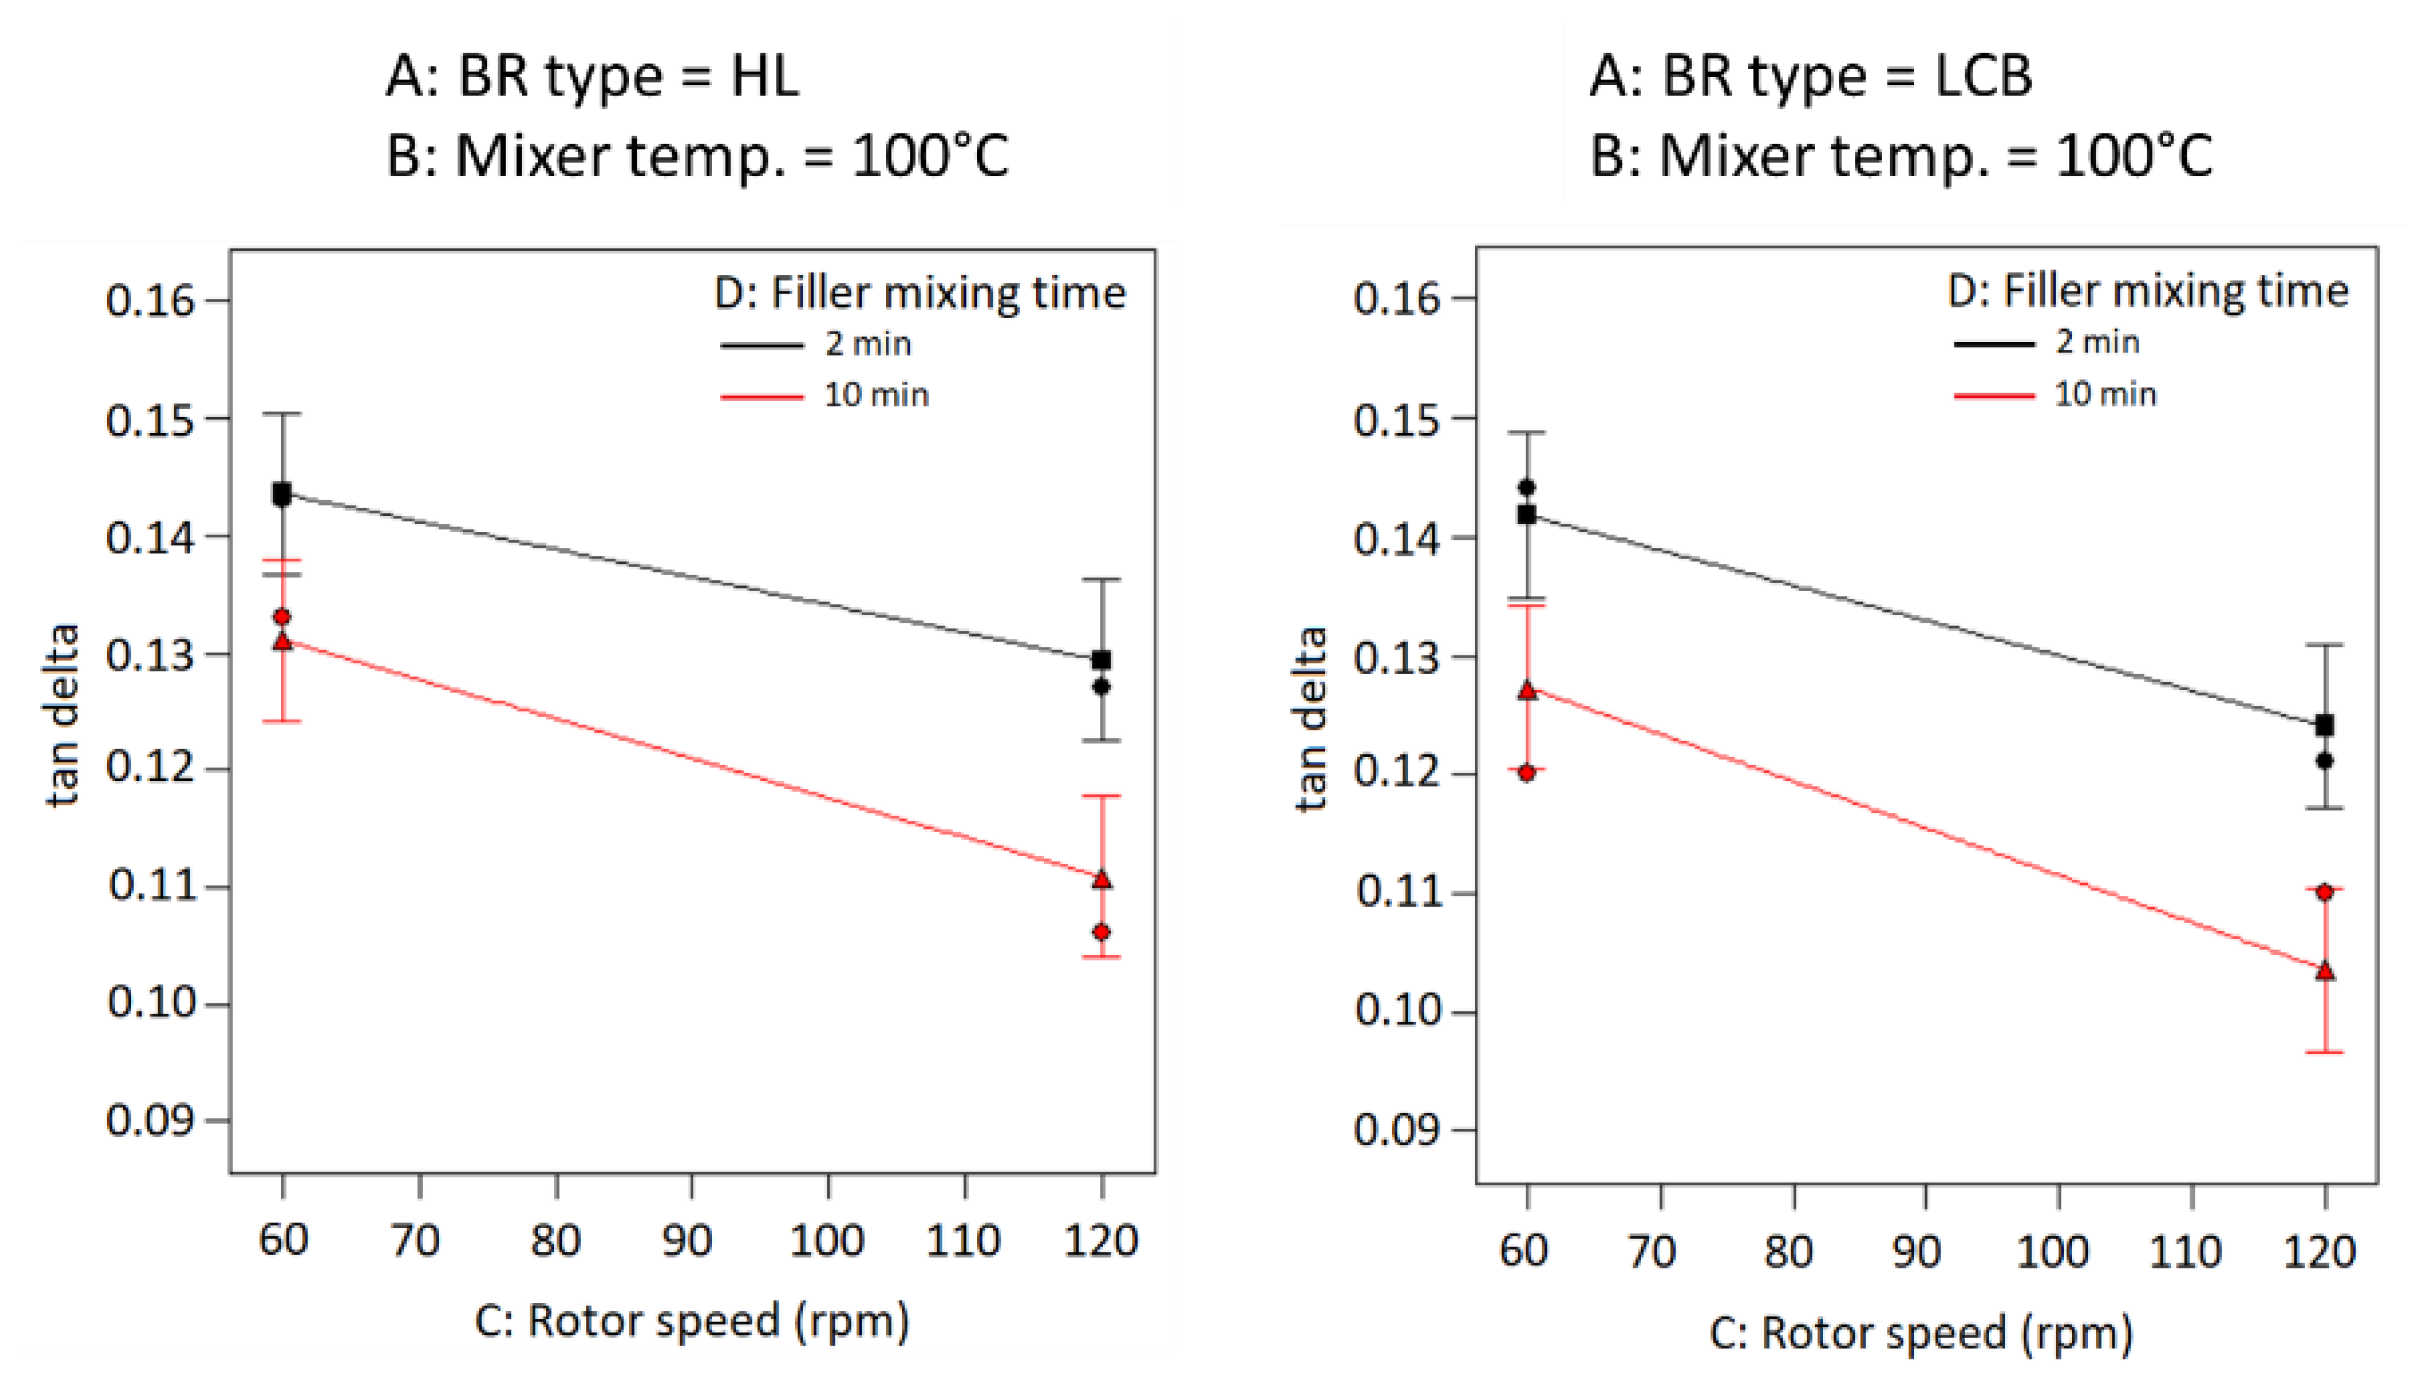
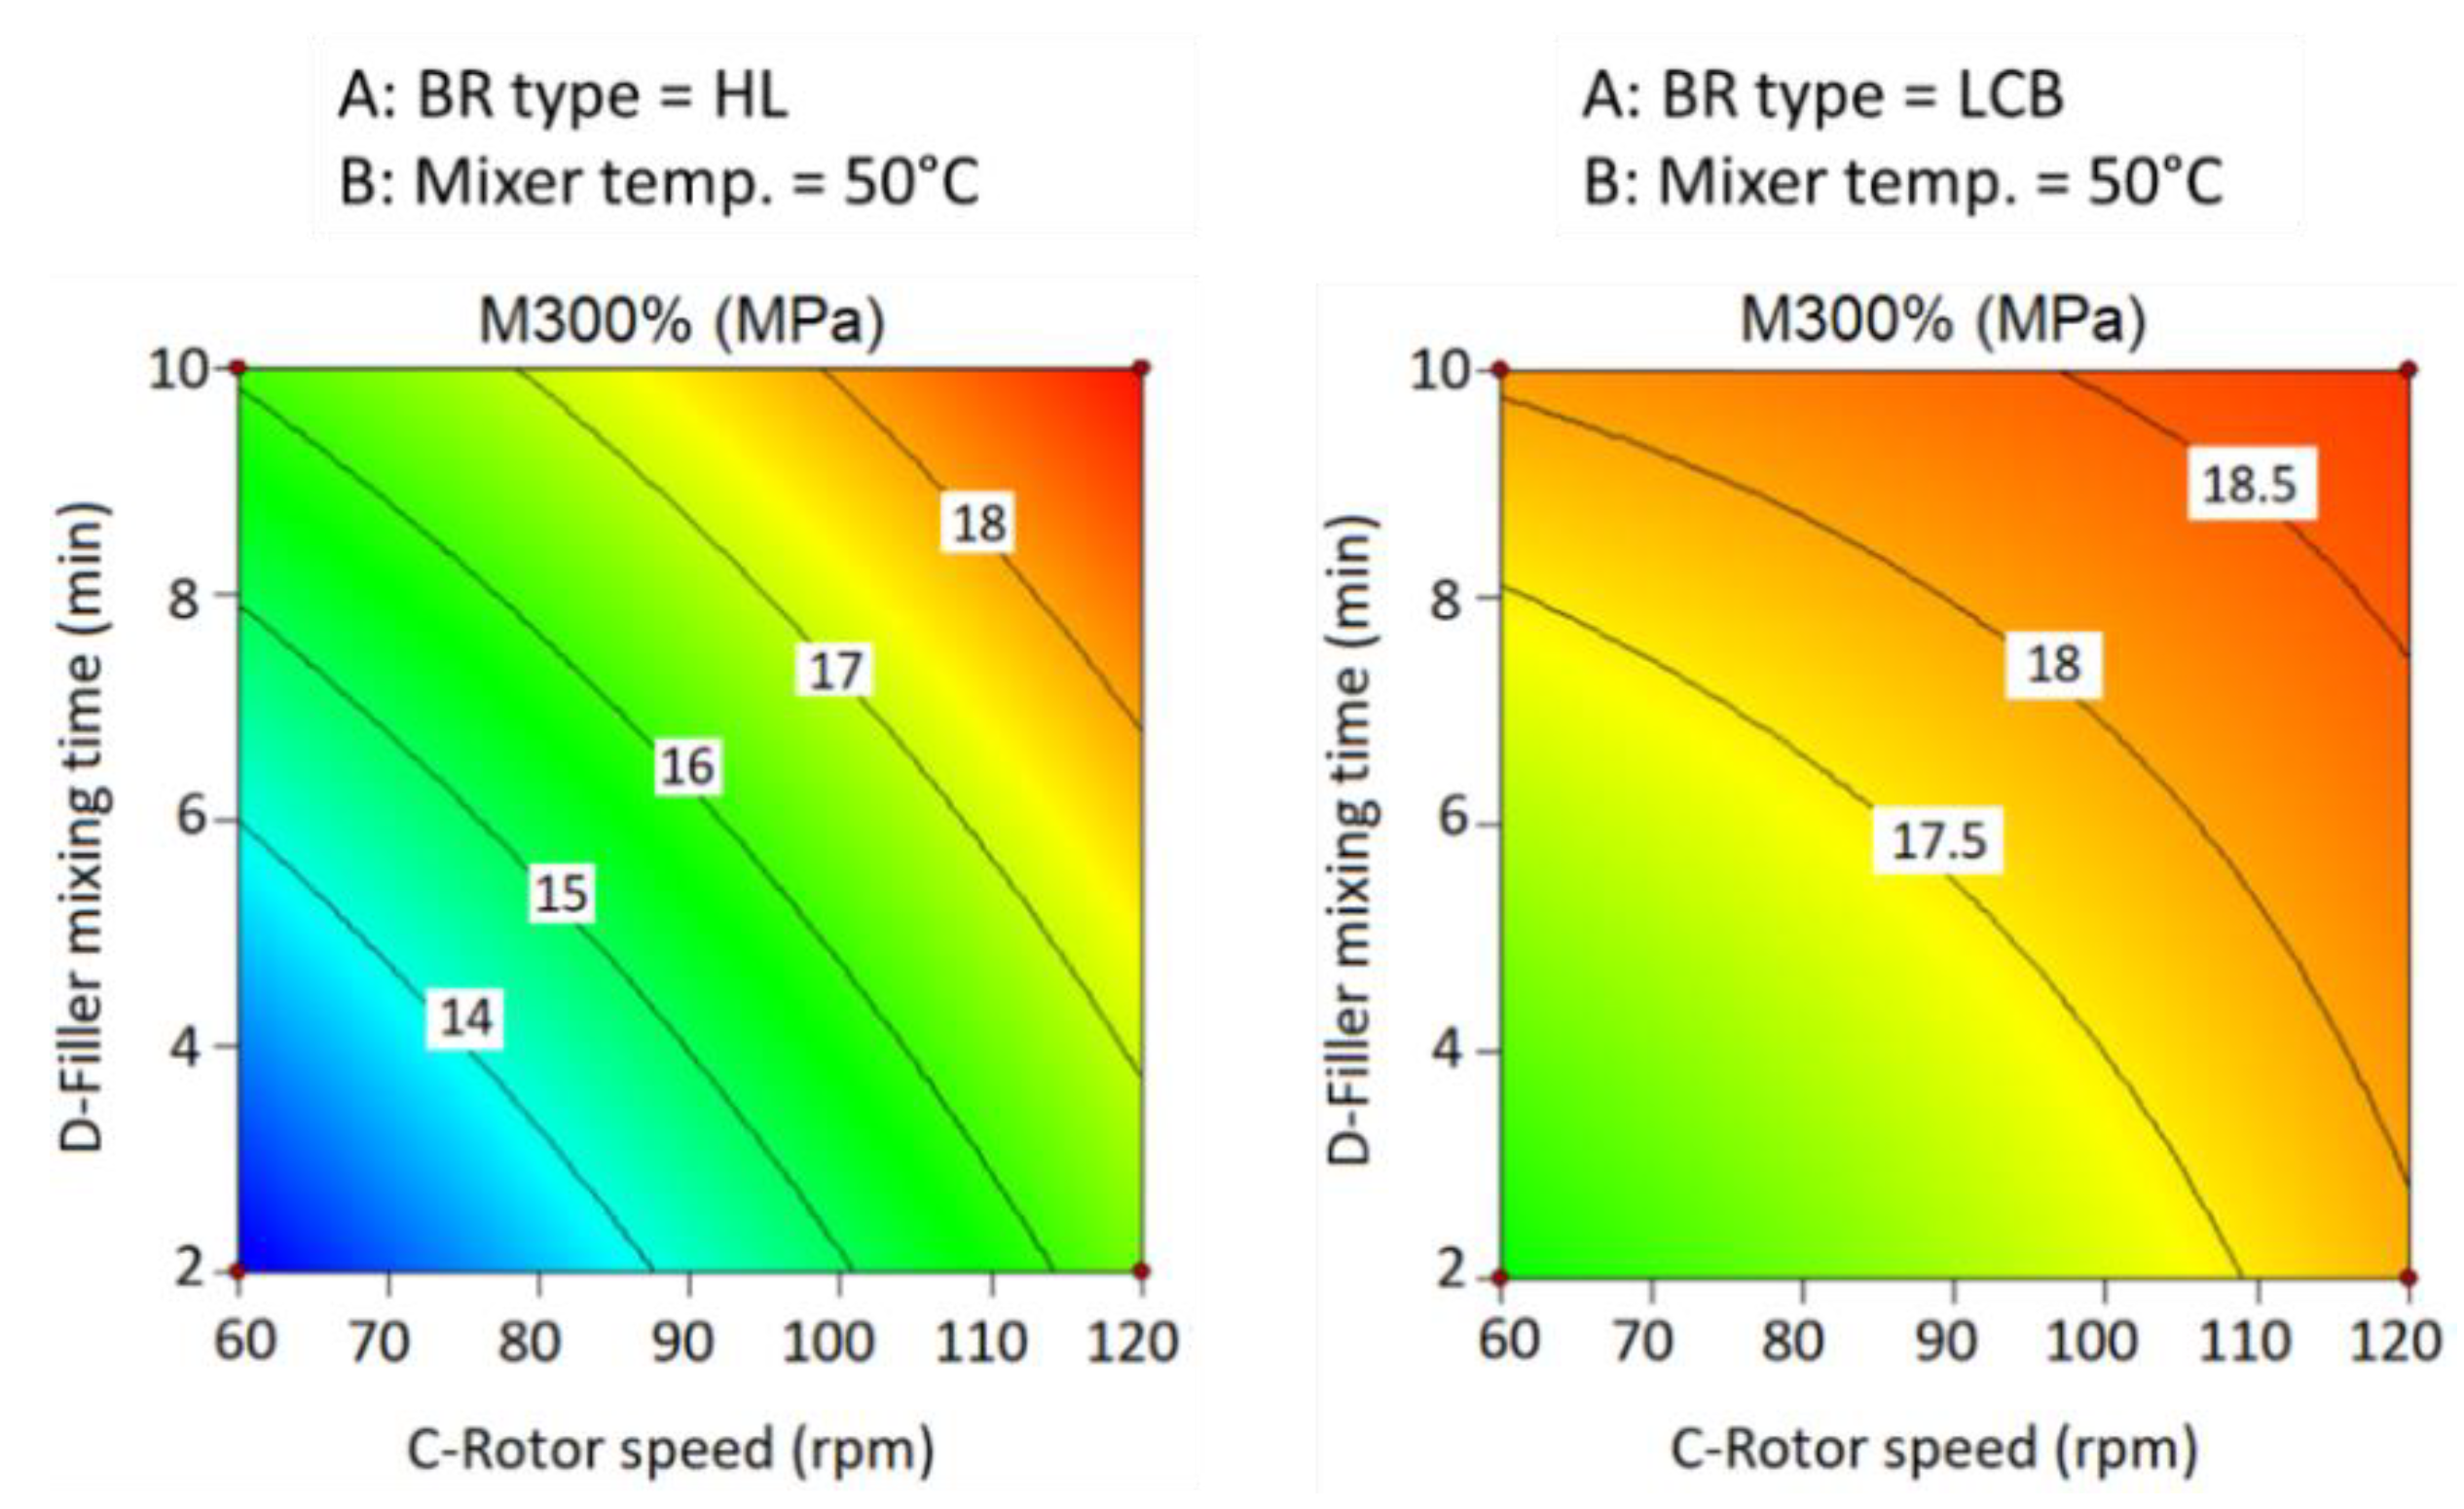
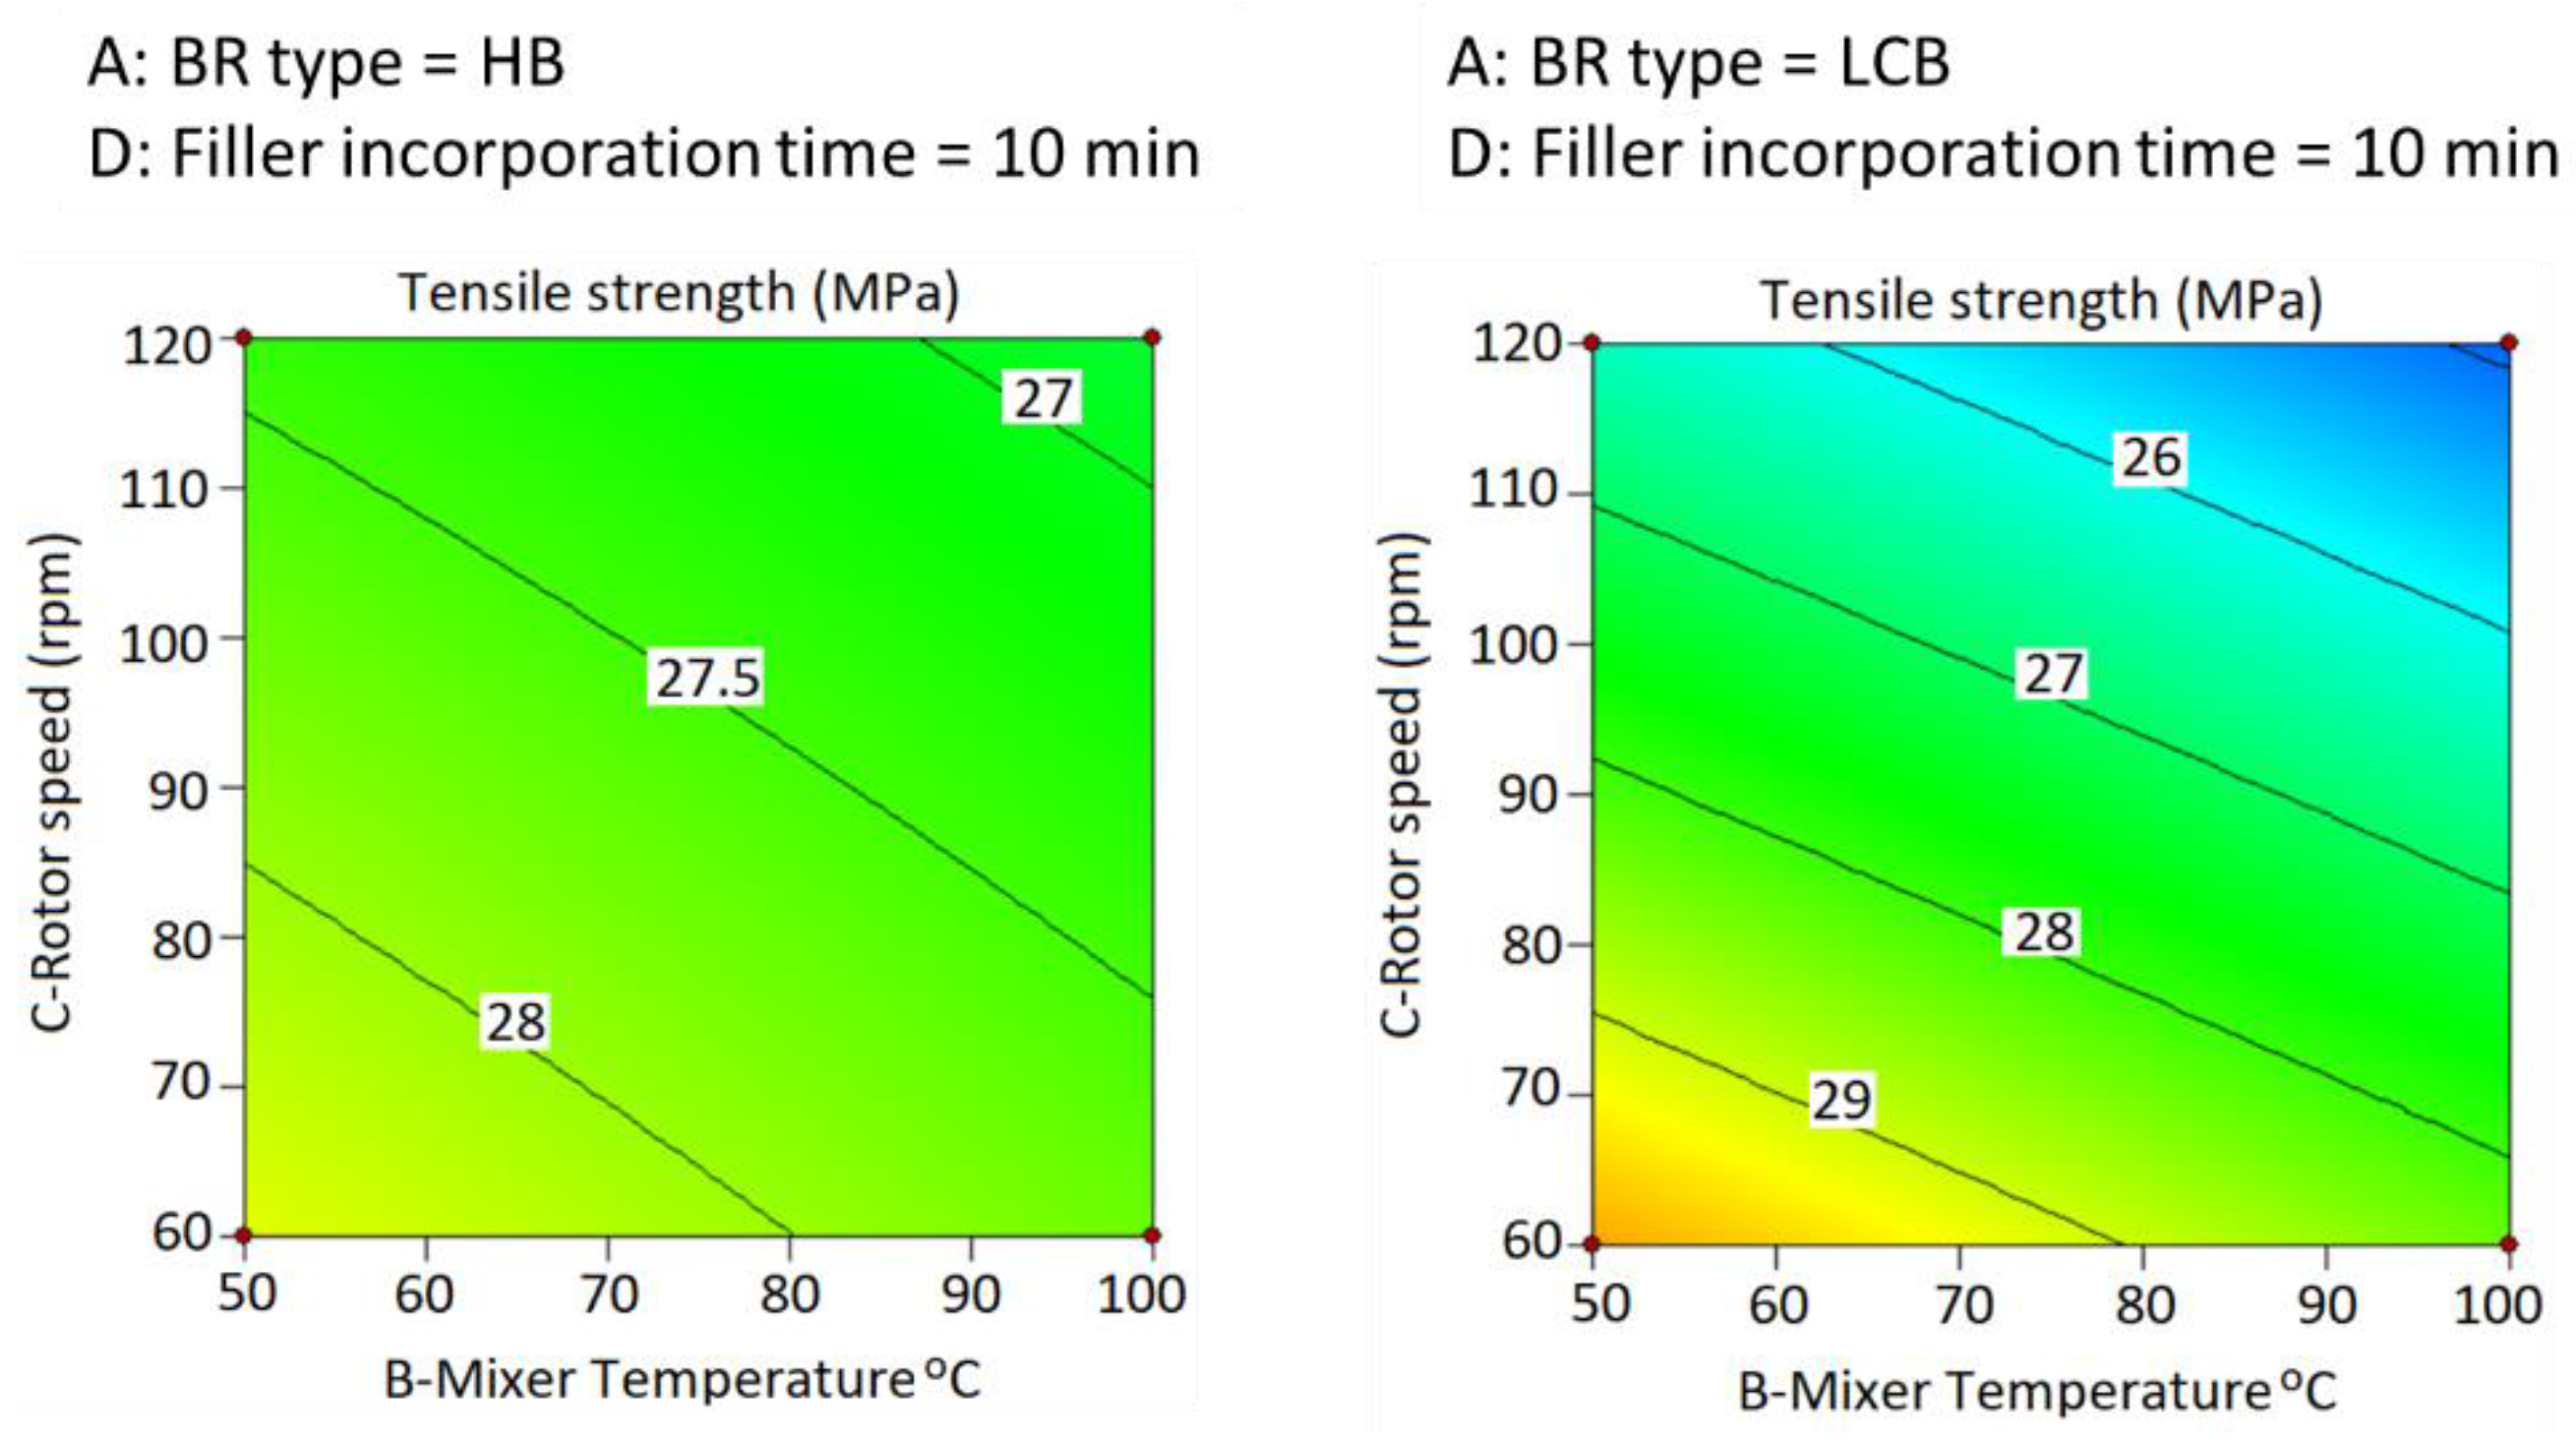
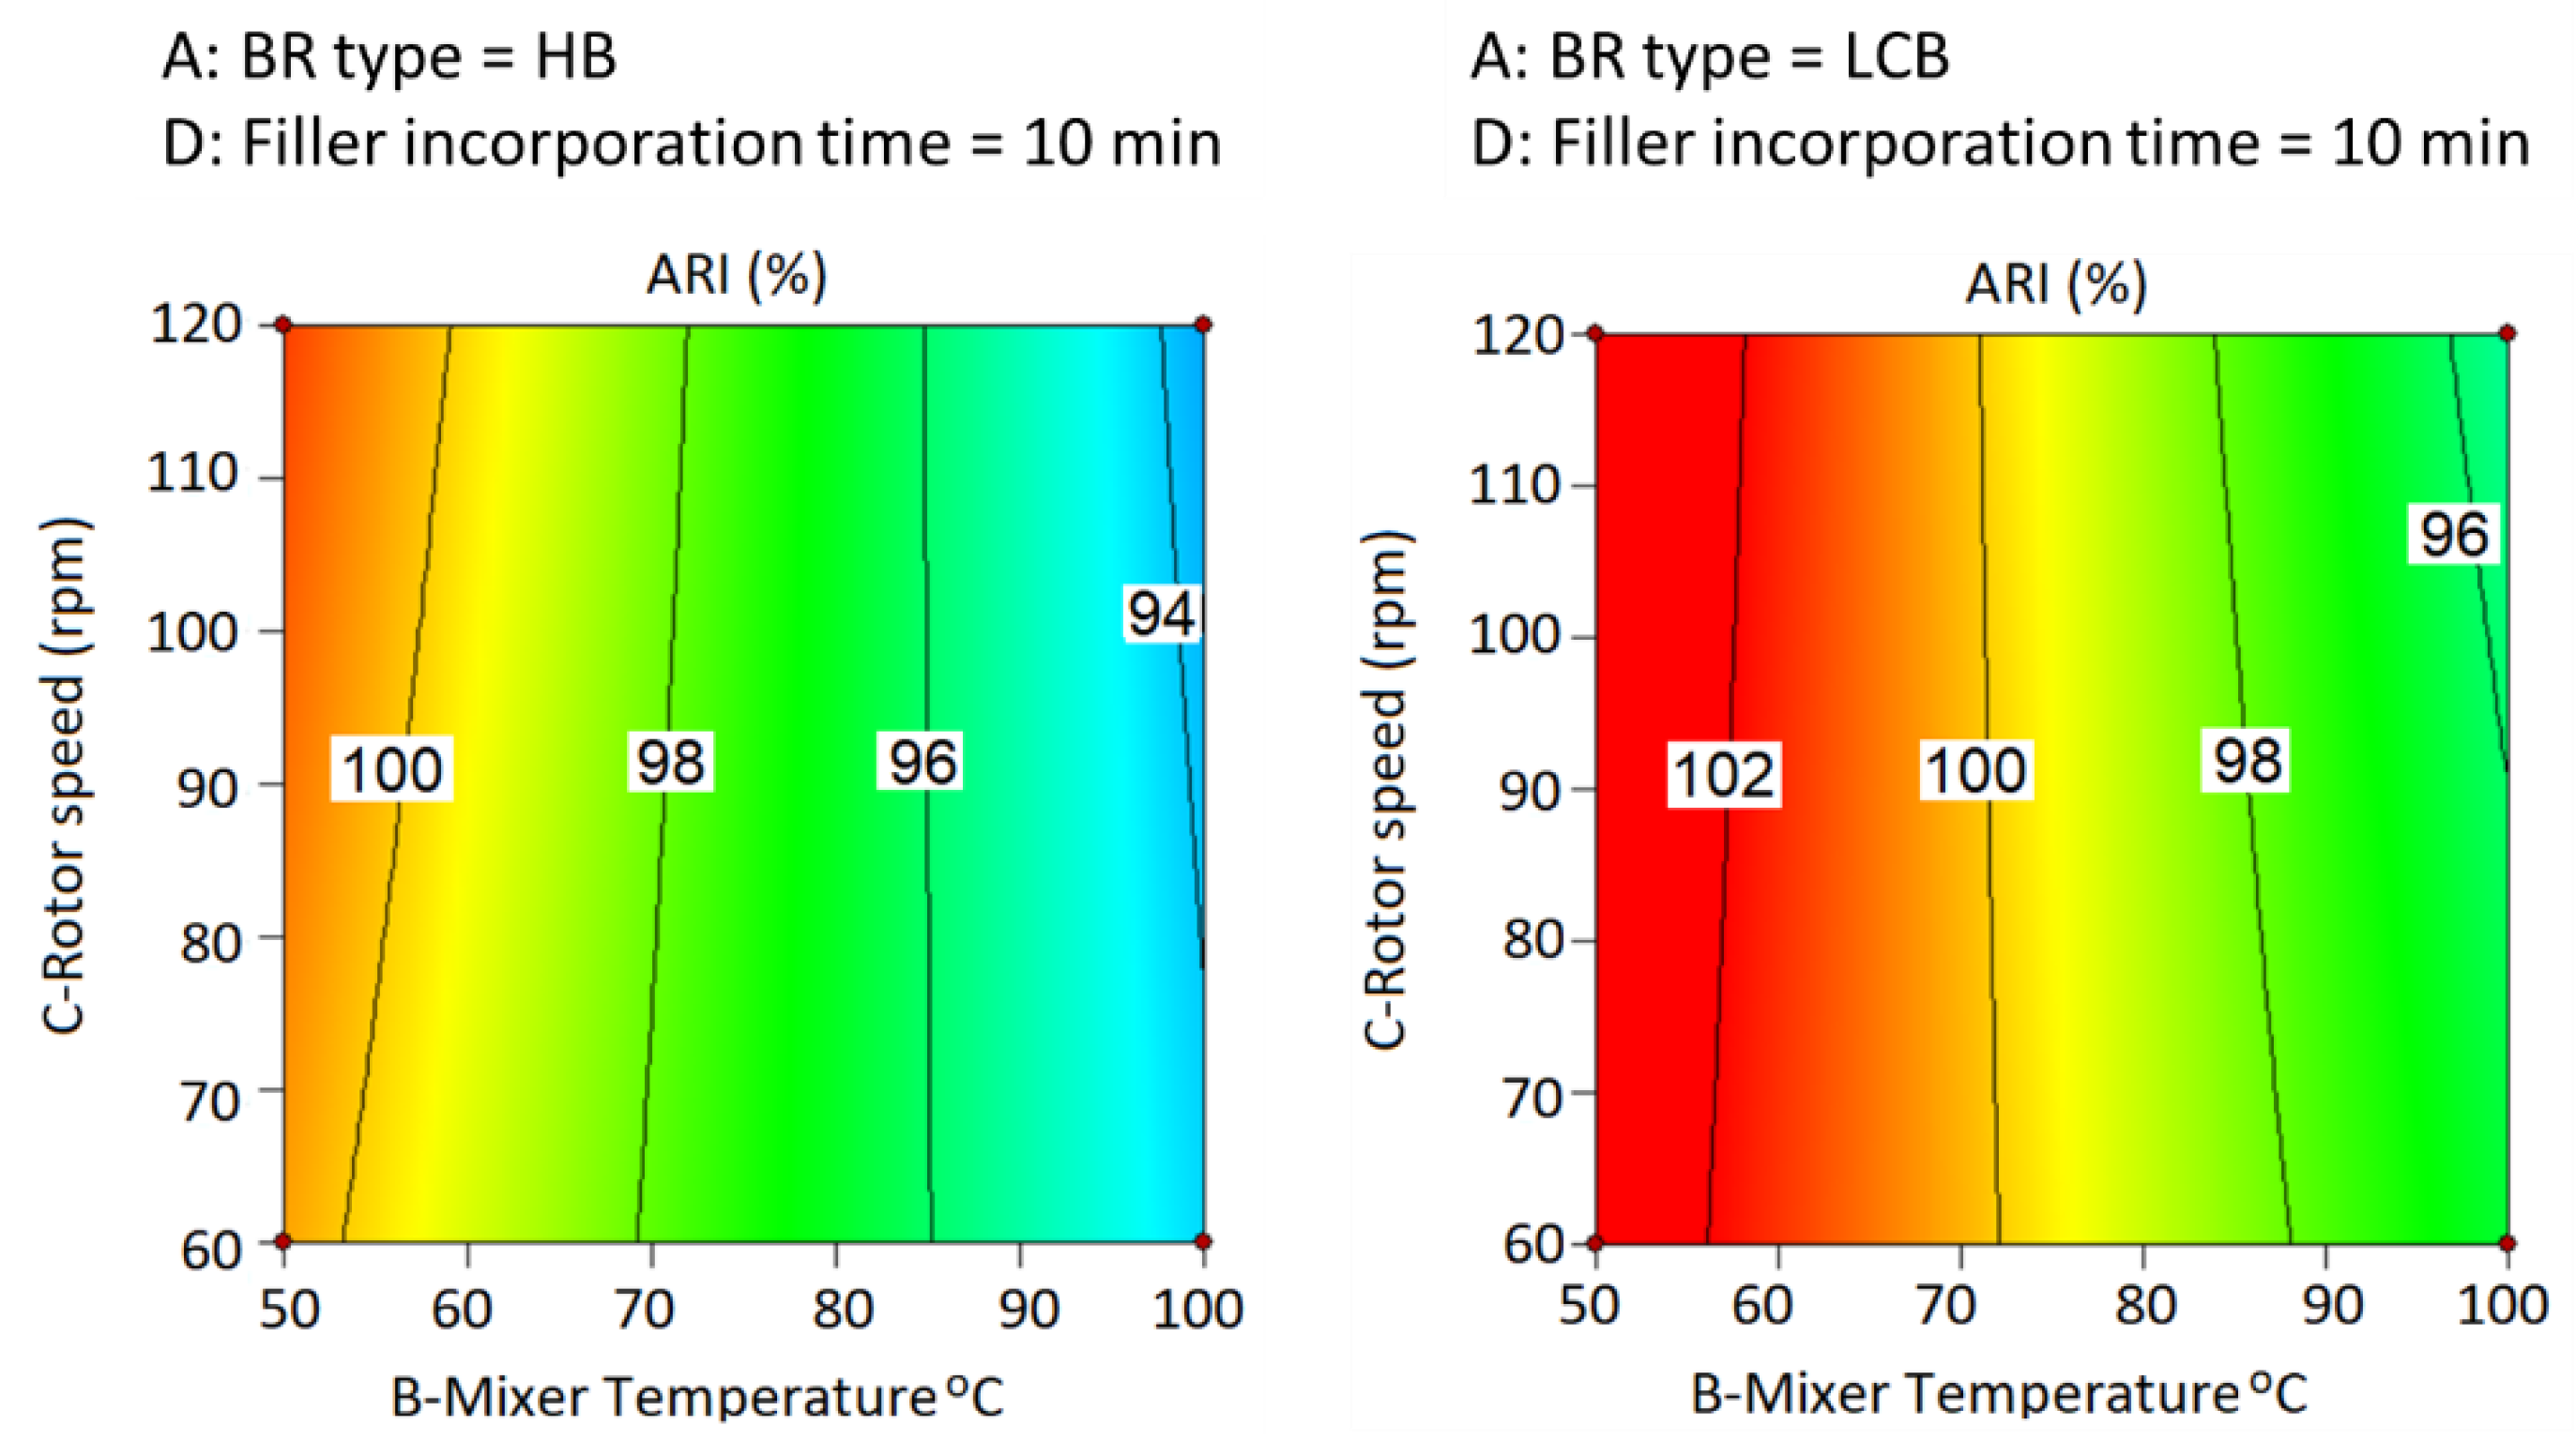
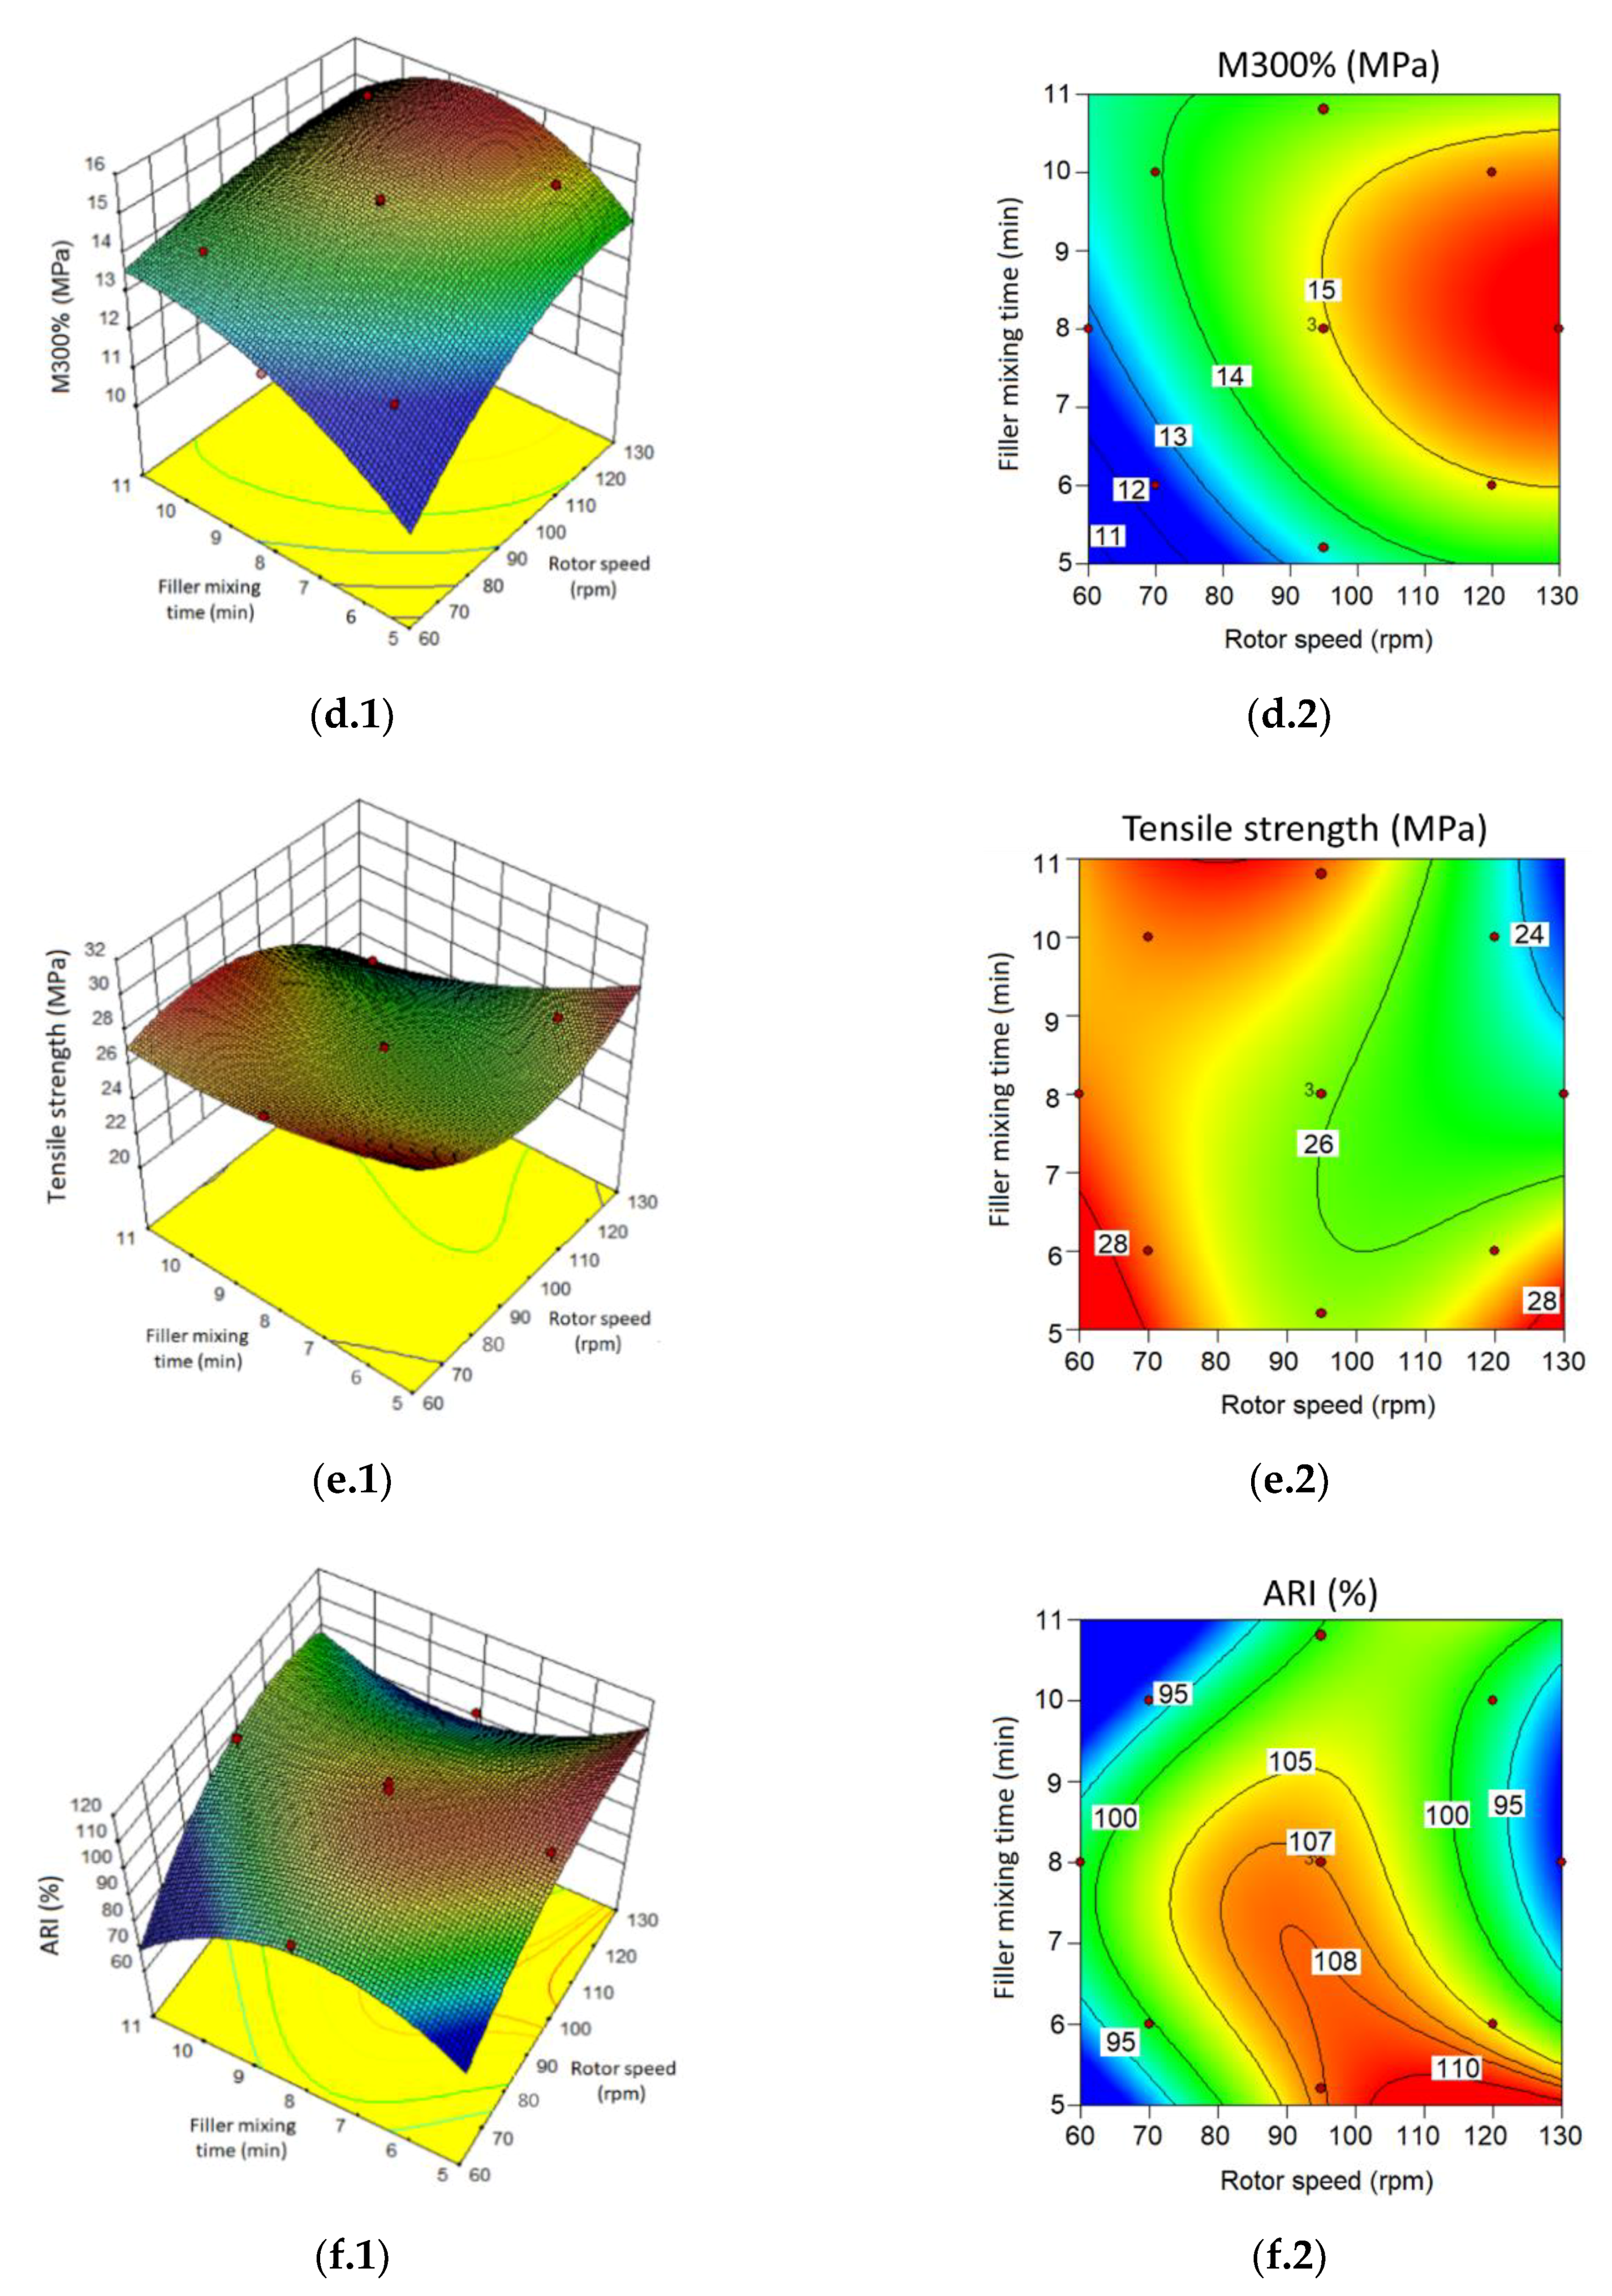
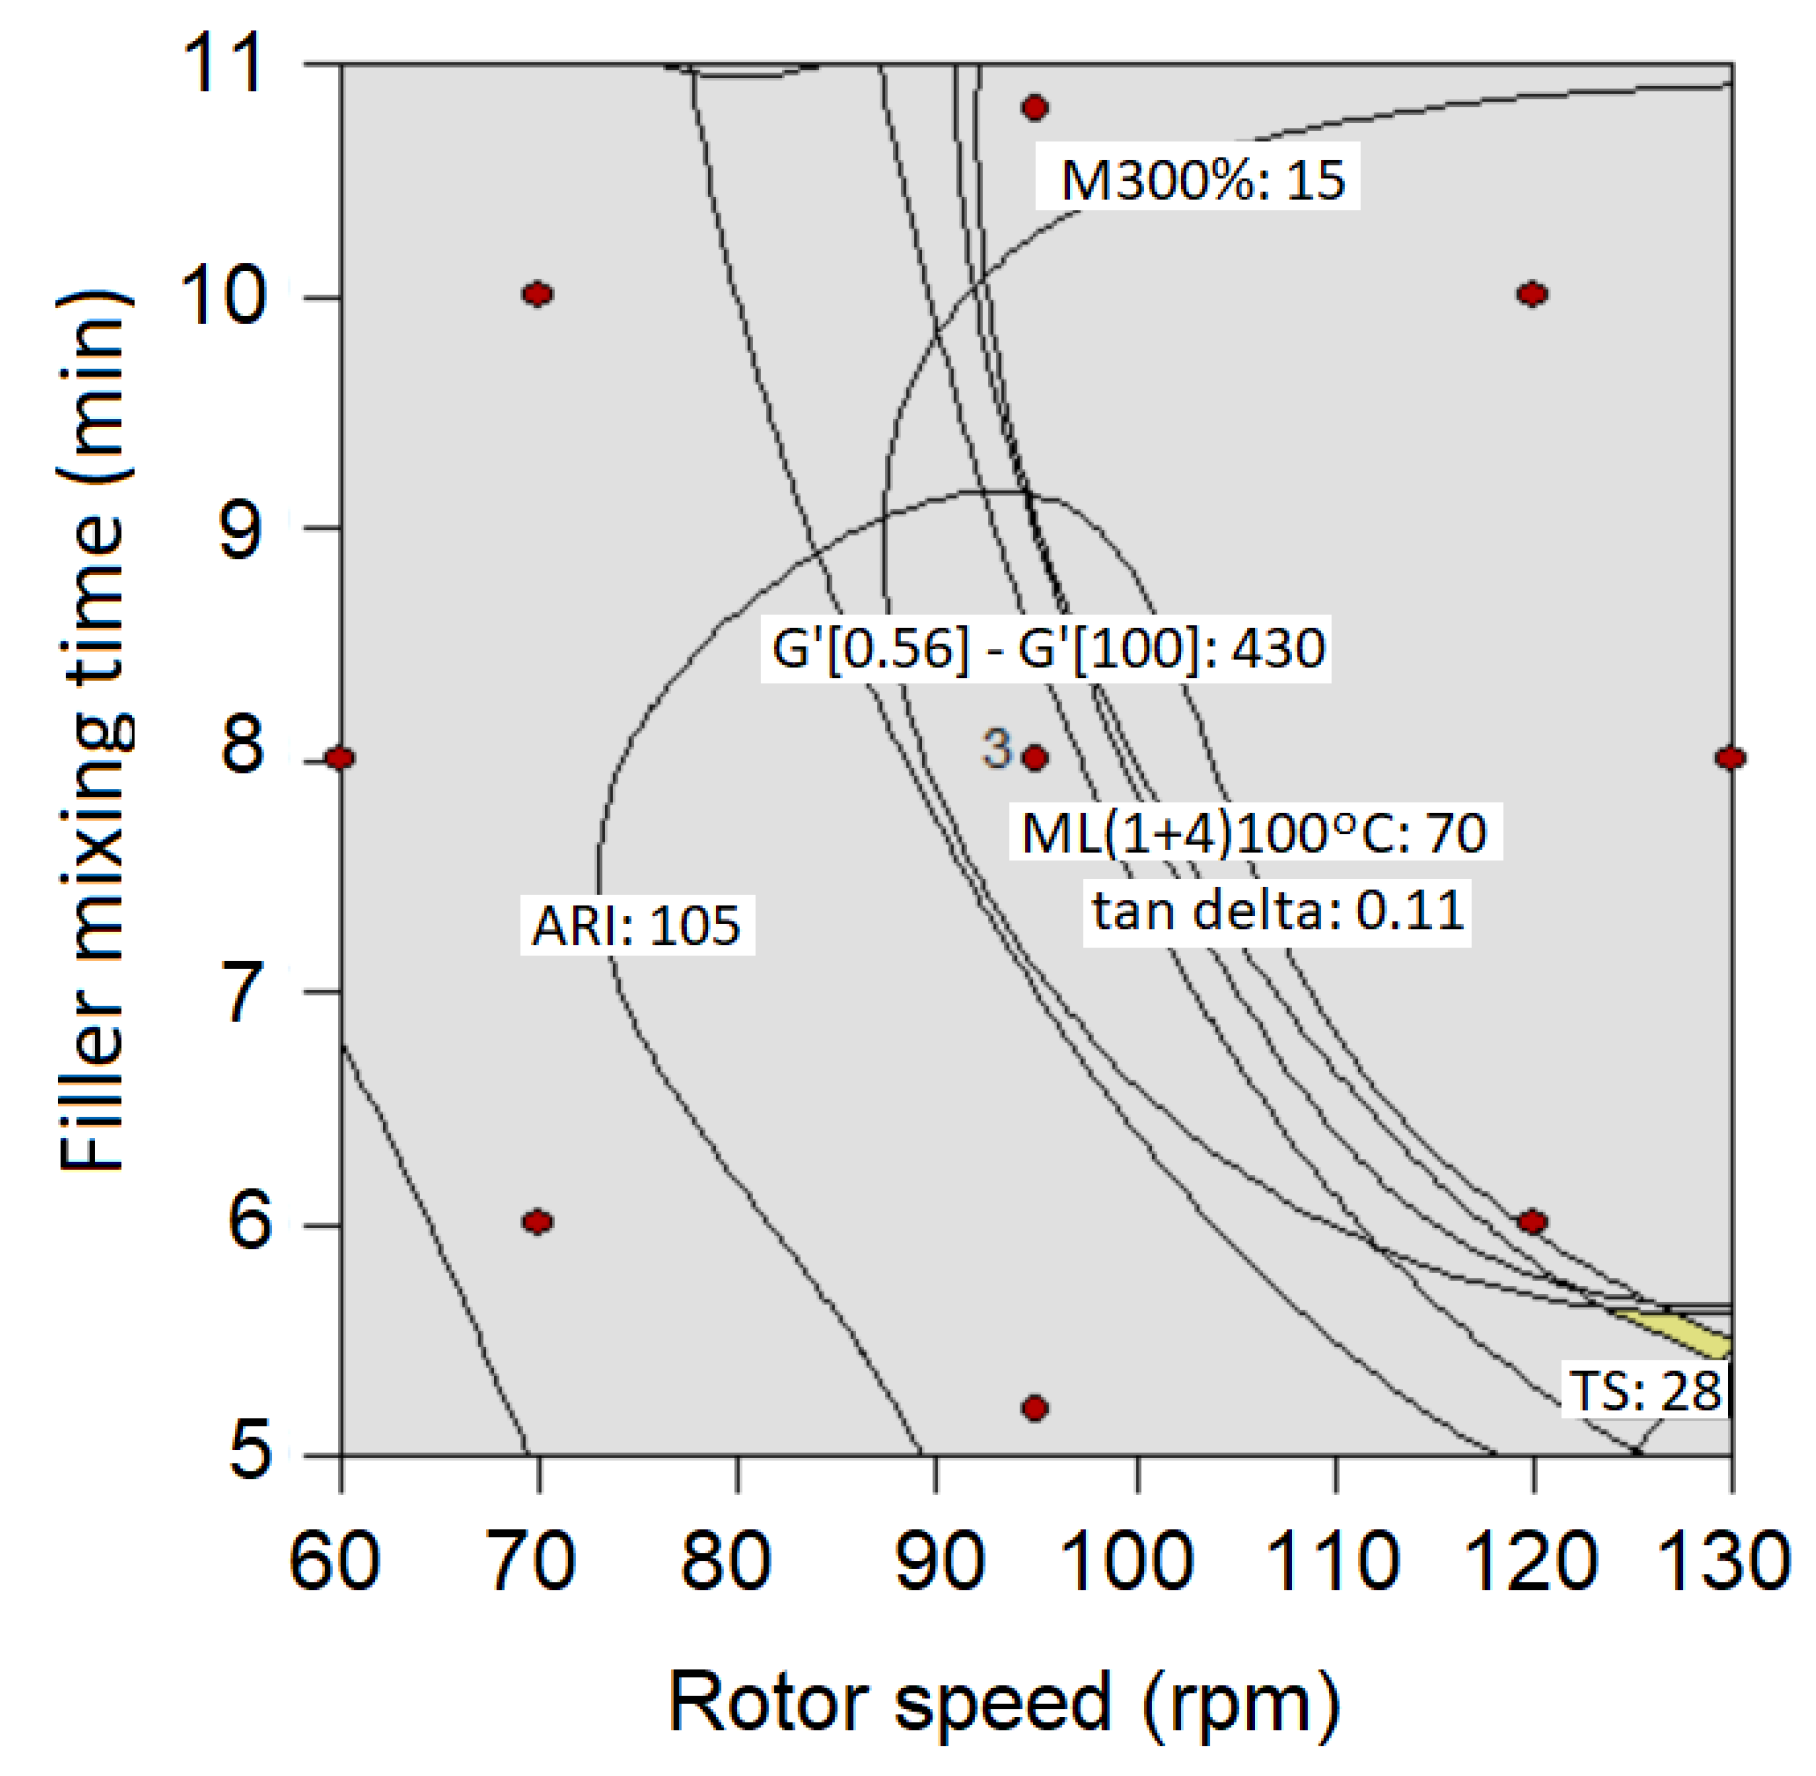
3.2. DOE Optimization
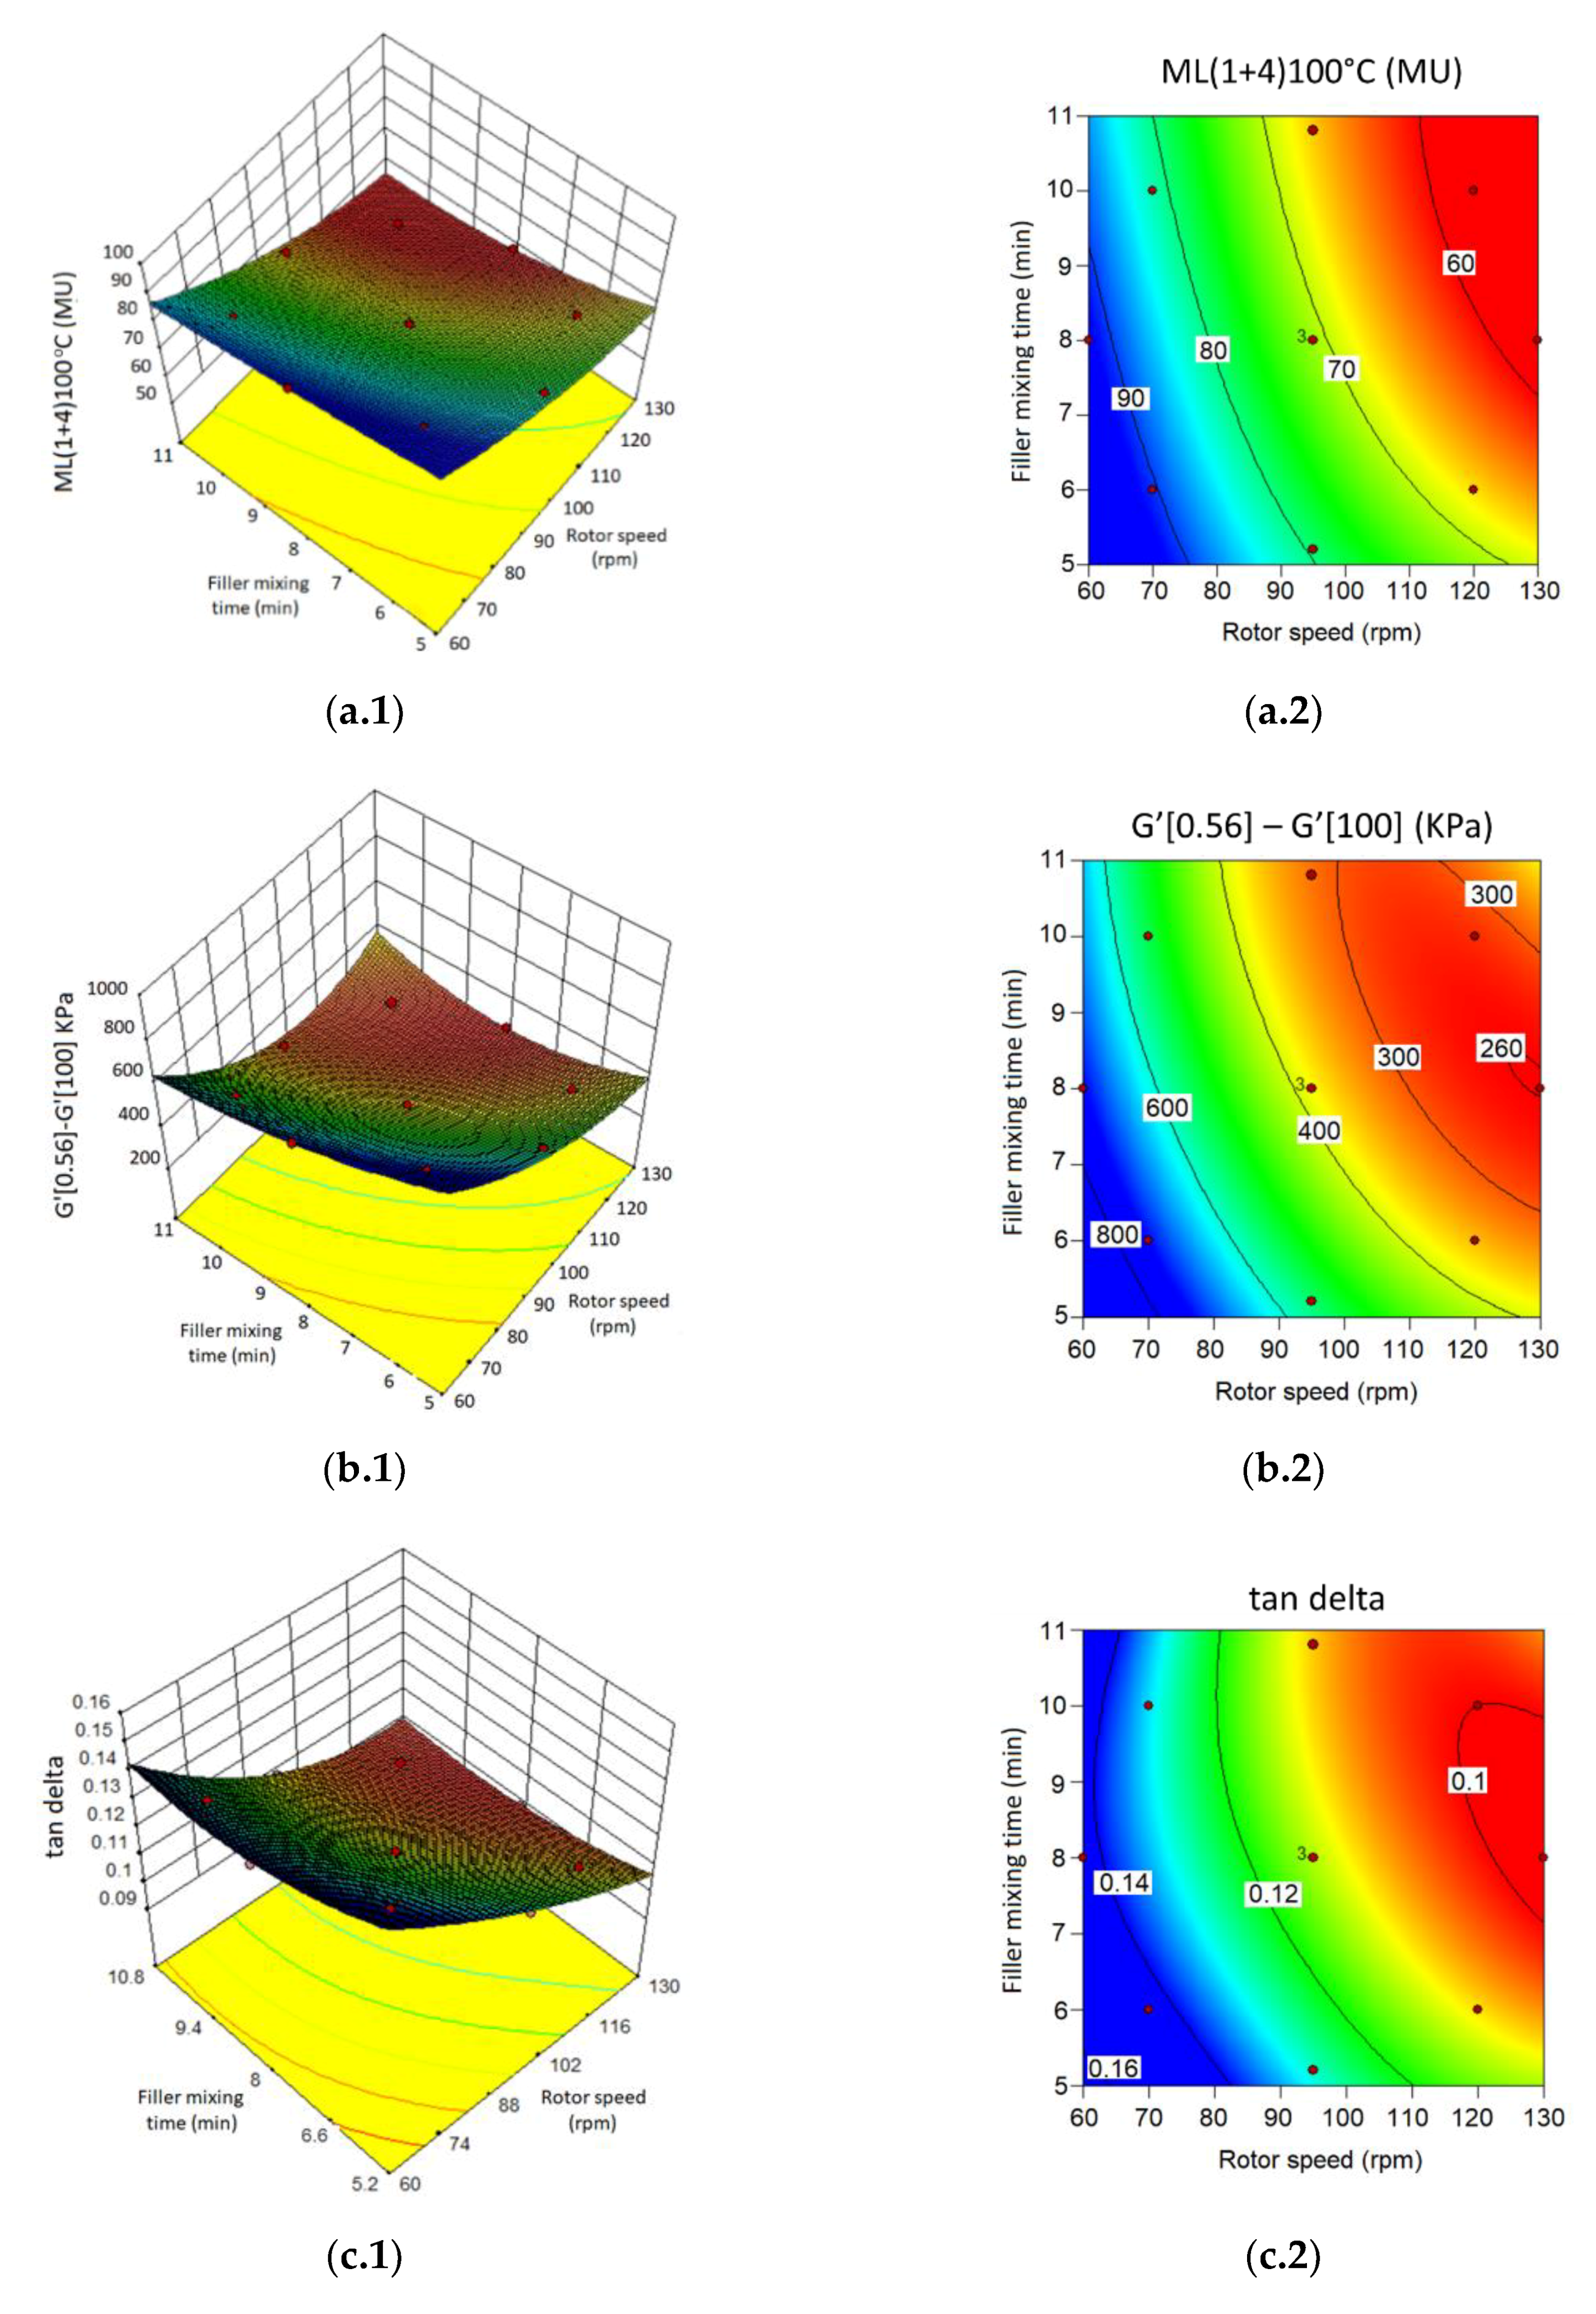
Rotor speed and filler mixing time were optimized further, while the mixer temperature was set at 50 °C, since a high mixer temperature had a negative effect on the M300%, the tensile strength, and the ARI, based on the DOE screening. LCB-BR was chosen because it gave comparable properties to HL-BR, but showed a better processability. The Response Surface Method (RSM)—Central Composite Circumscribed (CCC) design were used (see Figure 2) to find the best level setting for optimizing all properties.
The results of the DOE optimization for all responses are shown in Tables S4, S5 and Figures S7–S12 of the supplementary materials. Figure 13 shows the response surfaces and the contour plots for rotor speed and filler incorporation time, derived from the DOE optimization. Similar trends as in the DOE screening were found for the MV (ML (1 + 4) 100 °C), whereas a high rotor speed and a long filler mixing time decreased the MV. For the Payne effect, tan delta, and M300%, an optimum filler mixing time was needed, in combination with a high rotor speed, to improve those properties. In the case of tensile strength and ARI, a high rotor speed and long filler mixing time had an adverse effect, thus, decreasing these properties. Therefore, it is recommended to decrease the filler mixing time to less than 6 min, when combining with 130 rpm rotor speed.

3.3. DOE Validation

The DOE validation was performed at the last stage of the DOE process to check, how close the target value was to the actual value of all responses. The overlay plot shows that the optimum parameter settings for obtaining the target values were a rotor speed of 130 rpm and a filler mixing time of less than 6 min (see the yellow area in Figure 14). Table 5 shows the target values and the actual values of all responses when rubber was mixed at 130 rpm and 5.8 min. The targeted values were close to the actual values, thus, indicating that the predictive strength of the DOE was high.

4. Conclusions

A comprehensive study by means of DOE, to determine the most significant parameters influencing the properties of CB-filled NR/BR compounds for AC tire treads was carried out in this research. As a general conclusion, it can be said that DOE was a suitable tool for elaborating the optimum parameter settings to balance the properties as desired. This approach resulted in predictive models giving values quite close to the actually measured ones.
Among the factors studied, rotor speed and filler mixing time were the most significant ones. By optimizing the setting conditions for these factors, all required properties needed for the AC tire tread application were fulfilled. However, for the properties for which a trend was defined like hysteresis (tan delta) to be as low as possible, and abrasion resistance to be as high as possible, further improvement in material selection, as well as processing, is still needed. Incorporation of a small portion of silica in carbon-black filled rubber compounds, along with the most suitable silane coupling agent and addition of resins, are some of the approaches to further decrease hysteresis, while maintaining a high abrasion resistance.

Supplementary Materials

The following are available online at https://www.mdpi.com/2504-477X/3/2/47/s1. Scheme S1: The flow chart of design of experiments (DOE) in this research. Table S1: The design of experimental run for screening. Table S2: The results of DOE screening for all responses. Table S3: Example ANOVA calculation for MV (ML (1 + 4)100 °C in DOE screening. Table S4: The results of DOE optimization for all responses. Table S5: Example of ANOVA for MV (ML (1 + 4) 100 °C in DOE optimization. Figure S1. The response of MV of all experimental runs. Figure S2. The response of Payne effect of all experimental runs. Figure S3. The response tan delta at 100 °C, 10% strain measures, with a frequency sweep from 1 to 30 Hz. Figure S4. The response of M300% of all experimental runs. Figure S5. The response of tensile strength of all experimental runs. Figure S6. The response of ARI of all experimental runs. Figure S7. The results of MV in DOE optimization. Figure S8. The results of the Payne effect in DOE optimization. Figure S9. The results of tan delta in DOE optimization. Figure S10. The results of M300% in DOE optimization. Figure S11. The results of tensile strength in DOE optimization. Figure S12. The results of ARI in DOE optimization.

Author Contributions

Conceptualization and design of work, I., W.K.; investigation, I.; formal analysis, I., W.K.D.; supervision, W.K., W.K.D.; writing-original draft preparation, I.; writing-review and editing, W.K., W.K.D.; final review and approval, A.B.

Funding

This research was funded by RisetPro scholarship from the Ministry of Research, Technology and Higher Education of Indonesia.

Acknowledgments

Our sincere thanks to Weber & Schaer GmbH & Co. KG for providing RSS#1 sample. Sincere thanks to Arlanxeo for providing the BR samples. Sincere thanks to Cabot for providing the carbon black N234 sample.

Conflicts of Interest

The authors declare no conflict of interest.

References

  1. Sandstrom, P.H.; Balogh, G.; Cronin, S. Aircraft Tire. U.S. Patent 20060063878A1, 23 March 2006. [Google Scholar]
  2. Alroqi, A.A.; Wang, W.; Zhao, Y. Aircraft Tire Temperature at Touchdown with Wheel Prerotation. J. Aircr. 2017, 54, 926–938. [Google Scholar] [CrossRef]
  3. Rodgers, B.; Waddell, W. The Science of Rubber Compounding. In The Science and Technology of Rubber, 3rd ed.; Mark, J.E., Erman, B., Eirich, F.R., Eds.; Academic Press: San Diego, CA, USA, 2005; pp. 401–454. [Google Scholar]
  4. Arayapranee, W. Rubber Abrasion Resistance. In Abrasion Resistance of Materials; Adamiak, M., Ed.; In Tech: Rijeka, Croatia, 2012; pp. 147–166. [Google Scholar]
  5. IARC. Carbon Black, Titanium Dioxide, and Talc. In IARC Monogr Eval of Carcinogenic Risks Chem Hums; International Agency for Research on Cancer: Lyon, France, 2010; Volume 93, pp. 43–109. Available online: https://monographs.iarc.fr (accessed on 21 January 2019).
  6. Melotto, M.A. Mixing Machinery for Rubber. In The Mixing of Rubber; Grossman, R.F., Ed.; Chapman & Hall: London, UK, 1997; pp. 1–24. [Google Scholar]
  7. Phadke, M.S. Applications and Benefits of Robust Design. In Quality Engineering using Robust Design; Prentice-Hall: Englewood Cliffs, NJ, USA, 1989; pp. 8–9. [Google Scholar]
  8. Yang, X.S. Rubber Composition for Aircraft Tire Treads. U.S. Patent 2012/0252929 A1, 4 October 2012. [Google Scholar]
  9. Boeing 737–800 Operating Manual. Available online: https://virtualaircadetairlines.weebly.com (accessed on 19 February 2019).
  10. The Aircraft Tire Data Book. Available online: https://www.goodyearaviation.com (accessed on 17 May 2018).
  11. Scriver, R.M.; Ross, W.A. Pneumatic Tire with Medium Vinyl Polybutadiene/Polyisoprene Blend Tread. U.S. Patent 4192366, 22 February 1978. [Google Scholar]
Figure 1. Two-level full factorial design of the experiment (DOE) setup with the center point.
Jcs 03 00047 g001
Figure 2. Central Composite Circumscribed (CCC) design setup.
Jcs 03 00047 g002
Figure 3. Pareto charts of factors for the properties: (a) MV (ML (1 + 4) 100 °C); (b) Payne effect (G’ (0.56)–G’ (100)); (c) tan delta (measured at 100 °C, 20 Hz, 10% strain); (d) Modulus 300% (M300%); (e) Tensile strength; and (f) Abrasion resistance index (ARI).
Jcs 03 00047 g003
Figure 4. The effect of the rotor speed and filler mixing time on MV in rubber compounds containing HL-BR and LCB-BR.
Jcs 03 00047 g004
Figure 5. Interaction plot between the rotor speed and filler mixing time in rubber compounds containing HL-BR and LCB-BR.
Jcs 03 00047 g005
Figure 6. The effect of rotor speed and filler mixing time on the Payne effect in rubber compounds containing HL-BR and LCB-BR.
Jcs 03 00047 g006
Figure 7. The effect of rotor speed and filler mixing time on tan delta in rubber compounds containing HL-BR and LCB-BR.
Jcs 03 00047 g007
Figure 8. Interaction plot between rotor speed and filler mixing time on tan delta in rubber compounds containing HL-BR and LCB-BR.
Jcs 03 00047 g008
Figure 9. The effect of rotor speed and filler mixing time on M300% in rubber compounds containing HL-BR and LCB-BR.
Jcs 03 00047 g009
Figure 10. The effect of mixer temperature and rotor speed on M300 in rubber compounds containing HL-BR and LCB-BR.
Jcs 03 00047 g010
Figure 11. The effect of mixer temperature and rotor speed on the tensile strength in rubber compounds containing HL-BR and LCB-BR.
Jcs 03 00047 g011
Figure 12. The effect of mixer temperature and rotor speed on ARI in rubber compounds containing HL-BR and LCB-BR.
Jcs 03 00047 g012
Figure 13. Response surfaces and contour plots of: (a.1), (a.2) Mooney viscosity (MV); (b.1), (b.2) Payne effect; (c.1), (c.2) tan delta; (d.1), (d.2) M300%; (e.1), (e.2) tensile strength; and (f.1), (f.2) abrasion resistance index (ARI).
Jcs 03 00047 g013aJcs 03 00047 g013b
Figure 14. Overlay plot of all properties.
Jcs 03 00047 g014
Table 1. Properties of butadiene rubber used in this research.
PropertiesHL-BRLCB-BR
Catalyst typeNeodymiumNeodymium
MV (ML (1 + 4) 100 °C)6363
Cis content (%)min 96min 96
Branchinghighly linearlong chain branched
Molecular weight (Mw) g/mol59.6 × 10453.2 × 104
Mw/Mn2.21.6
Table 2. Rubber compound formulations.
IngredientsLevel −1 (phr)Level +1 (phr)
RSS-17070
HL-BR30-
LCB-BR-30
N2345555
ZnO55
Stearic acid33
6PPD22
TMQ11
TDAE7.57.5
Sulfur1.51.5
CBS1.51.5
Table 3. The two-stage mixing procedure.
Mixing ProcedureTime (mins)
Step 1: Internal mixer
Mixer temperature and rotor speed: varied depending on the factor level settings
-
Mastication of NR and BR
1
-
Addition of half (CB and TDAE oil)
Half time setting
-
Addition of half (CB and TDAE oil)
Remaining time setting
-
Addition of ZnO, stearic acid, 6PPD and TMQ
2.5
Step 2: Internal mixer
Mixer temperature: 70 °C
-
Masterbatch
1
Initial rotor speed: 50 rpm
-
Addition of curatives (sulfur and CBS)
2
Table 4. Experimental design for optimizing mixing conditions.
ParametersLevel −1Level 0Level +1
A: BR typeHL LCB
B: T. mixer (°C)5075100
C: Rotor speed (rpm)6090120
D: Filler mixing time (min)2610
Table 5. Target values vs. actual values of the desired properties.
PropertiesTarget RangeTarget Value (Input)Actual Value (130 rpm, 5.8 min)
ML (1 + 4) 100 °C65–707068
G’ (0.56)–G’ (100) (KPa)≤430430429
Tensile strength (MPa)min 22 [11]2726
M300% (MPa)min 9.8 [11]1513
Abrasion resistance index (%)as high as possible105103
Tan delta at 100 °C, 20 Hz, 10% strainas low as possible0.110.11

