1. Introduction
Wood–Plastic Composites (WPCs) were firstly introduced to the market in early 1990s as a decking material. Competitive advantages, such as low maintenance and environmentally friendly properties, in comparison to traditional wood-based products, have increased the demand for these materials in the past decade. According to a recent market research, the WPCs industry was valued at USD 4.06 Billion in 2015, the largest application of which was found in the Building and Construction Industry, with decking continuing as the most widely used application, accounting for about 80% of the total demand [
1]. Inspired by contemporary research in the composites fields, as well as the environmental concerns, it is most likely the demand for these composites will continue to rise in the future. This has been indicated in the Global Wood–Plastic Composites Market research, which predicts WPCs to achieve a value of USD 5.39 Billion by the year 2019 [
2].
The three main constituents of WPC are wood flour as filler, plastic granules as binders, and coupling agents to increase the physical bonding between the compounds. These components are blended together in known ratios as per the application requirements. Furthermore, the use of waste wood and waste plastics in the manufacturing of these WPCs produces the new material in a more sustainable and economic way. In this regard, according to United State Environmental Protection Agency (USEPA), both wood and plastic waste in combination make up to 19% of the total municipal waste generated in the USA per annum [
3]. These wastes are commonly disposed-off in landfills, which significantly deteriorates the urban areas, as well as the environment. The recovery of these wastes would not only decrease the pressure on landfill sites, but also make WPCs more economically viable.
In this context, a recent research study done by Echeverria et al. presented a technique to manufacture WPC with 100% recycled materials [
4]. In addition to recycled wood and recycled plastic, local marine bio-fillers—such as seaweed and seashell—were also incorporated to the blend, to enhance the overall material properties. Adding novel fillers can improve the properties of WPCs significantly. Bari used nano clay particles to enhance the biological resistance of WPC [
5] while Guo used Printed Circuit Boards (PCB) [
6] and Cholake et al. used vinyl banners [
7]. These research methods not only advance the material qualities by using novel fillers but also enable cascading use of resources, by further recycling of the composite material at end-of-life. Additionally, there is a great deal of research in high temperature transformation of these waste for example Mayyas et.al. [
8] producing nano-ceramics and graphitic carbon through thermal degradation from mixed waste.
However, before a new material can satisfy the requirements for different industrial applications, the prototype requires extensive trials to ensure appropriate performance throughout its life span. This process at the design phase may become time consuming and expensive, due to the need to manufacture numerous samples and to examine their material properties—different volume fractions or other features—in each test. Moreover, when a defect is diagnosed after the design process is completed; then its correction becomes very challenging. Therefore, a model that can approximate the behavior of a new material and its permutations by means of a simulation, instead of performing a series of material tests for each prototype, will facilitate rapid corrections of the digital model, and permit an evaluation of the results and their trends. For newly emerging materials like marine bio-composite from 100% waste materials it is not possible to use existing simulation models as it consists of new materials and new properties.
Therefore, the aim of this study is to introduce and explore this concept of simulation of a material to assist its design phase. It was found in the market that several simulation software based on Finite Element Method (FEM) are available for this purpose, which can be used to simulate the mechanical behavior of standard composite materials. Moreover, using the simulation modelling for predicting the mechanical properties of the material during the design process is an effective tool for optimizing the necessary parameters. This optimization is an essential step of development phase for introducing a new and high-performance material. However, existing simulation packages are mostly optimized to simulate traditional wood–plastic composite [
9]. When new fillers and manufacturing steps are introduced into the wood–plastic composite the equations and parameters need to be driven empirically and combined with existing simulation solutions to fit the purpose.
To advance in this matter, different simulation parameters have been driven empirically using experimental data and combined with finite element-based model in ANSYS 17.2. ANSYS workbench has been previously used to simulate the composite sandwich panels [
10]. Similarly, this method has been successfully used in the field of layer-based composites or laminates [
11] and also in the case of woven composites [
12]. Dickson et al. [
13] have reported producing composite filament from waste which can be used in 3D printing application, and Caminero et al. [
14] have reported producing these fibers and simulation of the process.
WPCs have a huge prospect in the future, mostly if there is a potential for high levels of customization to different client requirements [
15]. With the incorporation of greater amounts of waste resources into WPCs manufacturing in addition to material optimization through simulation, the end product can be achieved in a cost-effective systematic way. This is an objective that can be easily achieved with the assistance of simulation software. The simulation would provide the necessary confidence to the building industry to advance towards the development of new research and fields of applications.
The aim of the current study is to use empirical data to optimize a simulation process for recently developed wood–plastic marine bio-composite and validate this simulation with experimental data.
2. Material and Method
2.1. Experimental Procedure
The wood–plastic marine bio-composite panel used for defining the boundary condition in the simulation as well as validating simulation results were manufactured using a mixed sample of wood from furnace manufacturing sawdust residue and polypropylene (PP) which was procured from the used PP food containers. The fillers used to enhance the properties were sea shell and seaweed which were collected from the nearby fish market. The wood was sieved through a 425 μm sieve and kept in an oven for drying at 103 °C for 24 h. PP was milled and then sieved using a 500 μm sieve. Seaweed and seashell were dried in the oven at 103 °C for 24 h to reduce the moisture content below 6%. Both seaweed and seashell were ground into fine powder separately using a ring mill. Then the mixture was prepared using wood, PP, seashell and seaweed in the weight ratio of 40:40:10:10 respectively [
4], as this has been identified as the optimum mixture by a recent study. The total weight was taken as 150 g to get a particulate sheet panel of 190 mm dimension and a nominal thickness of 5 mm. The sample was then mixed homogeneously and pressed in a hot press under a pressure of 200 bars with the temperature being kept to 190 °C. Panel was slow cooled at room temperature, before de-molding.
2.2. Tensile Test
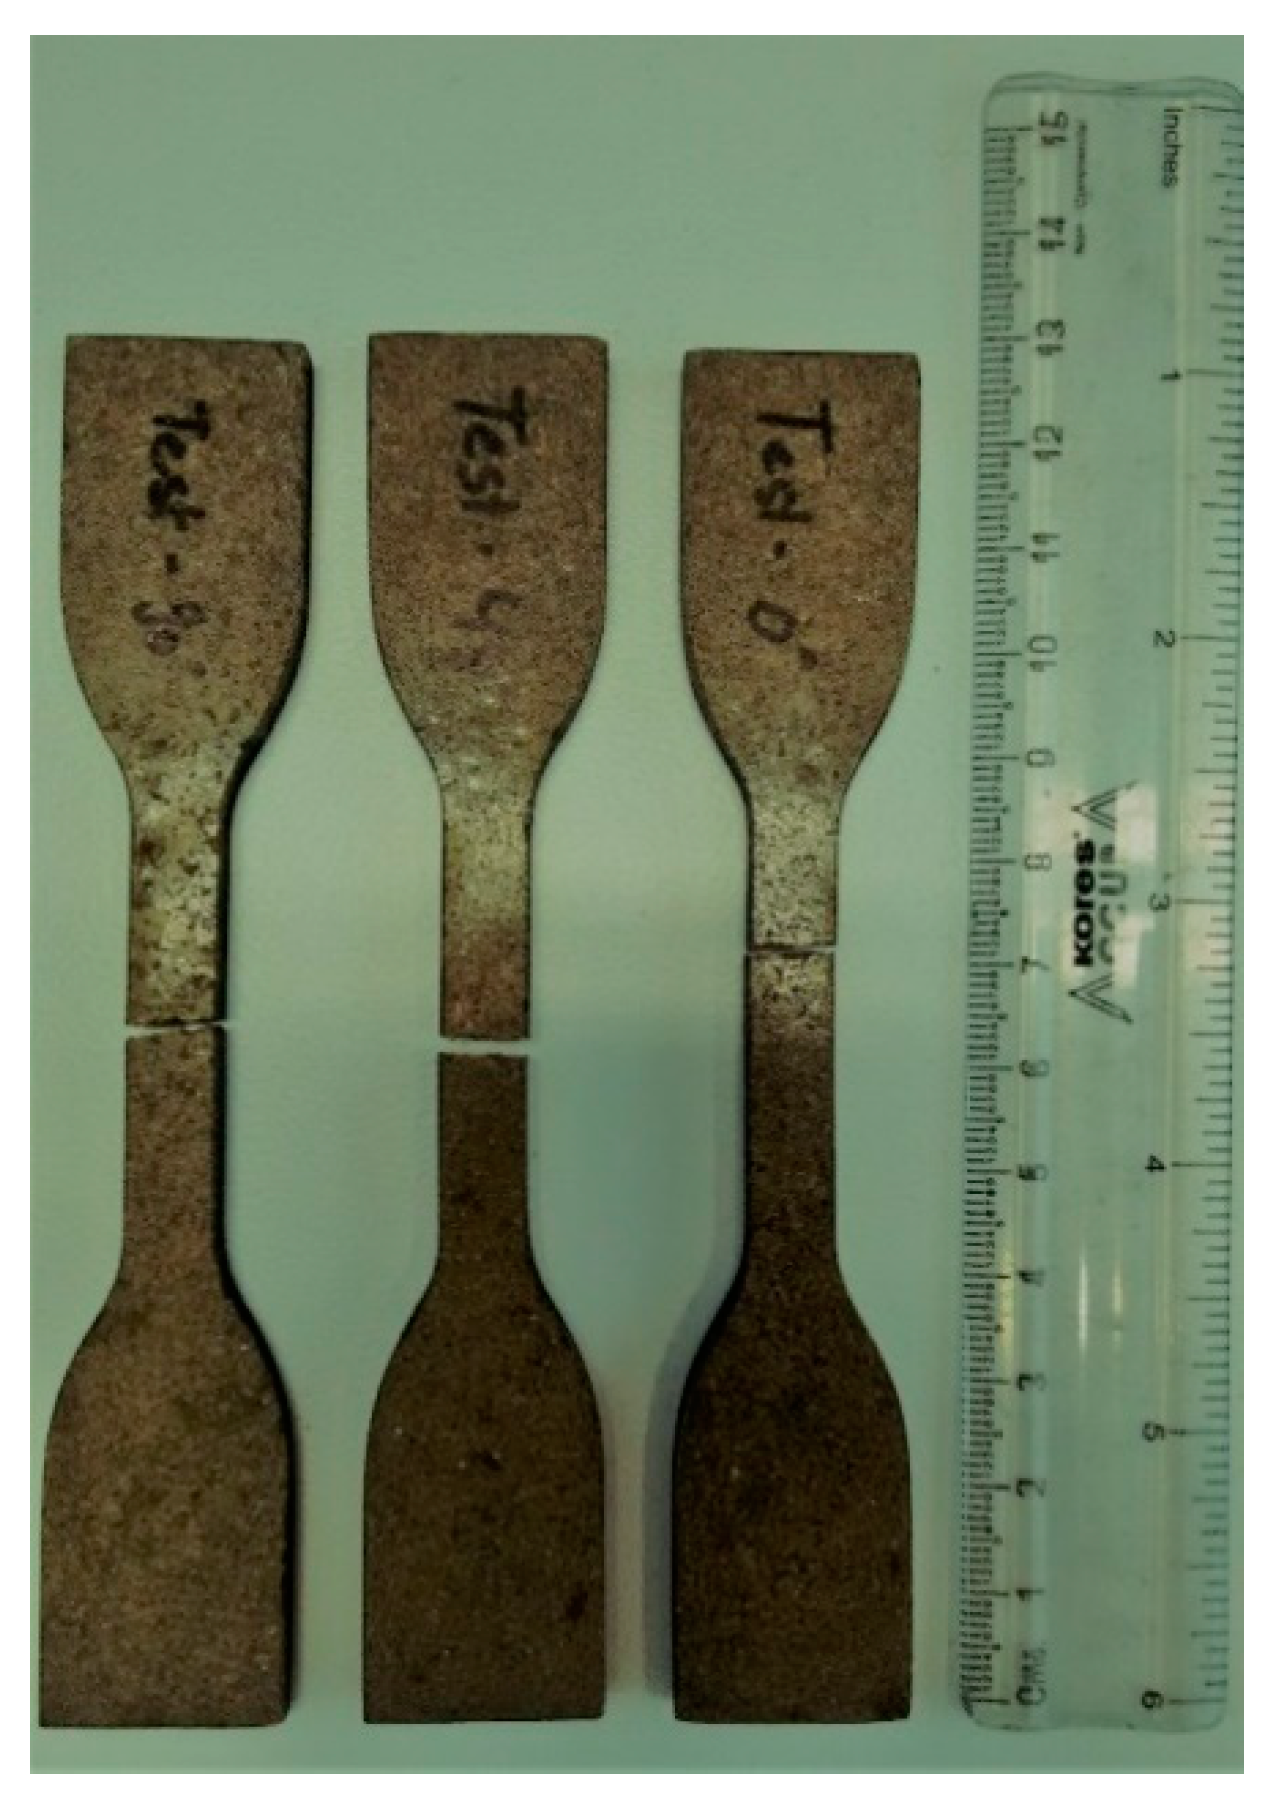
The specimens for performing tension test were cut out from a flat panel using a Trotec Speedy Laser Cutter (Trotec, Adelaide, Australia). The average thickness of the specimen was close to 5 mm and other dimensions were kept the same as described for type IV in ASTM D 638 [
16]. Dog-bone samples were cut at least 0.5 mm offset and surfaces were polished using a sand paper to reduce the effect of burnt surfaces.
The tension tests were then performed using an INSTRON 5565 electromechanical testing machine (Instron, Melbourne, Australia). The rate of loading for the test was defined as 2 mm/min. In order to get the correct directional nature of the material, another test was performed using dog-bone shaped samples.
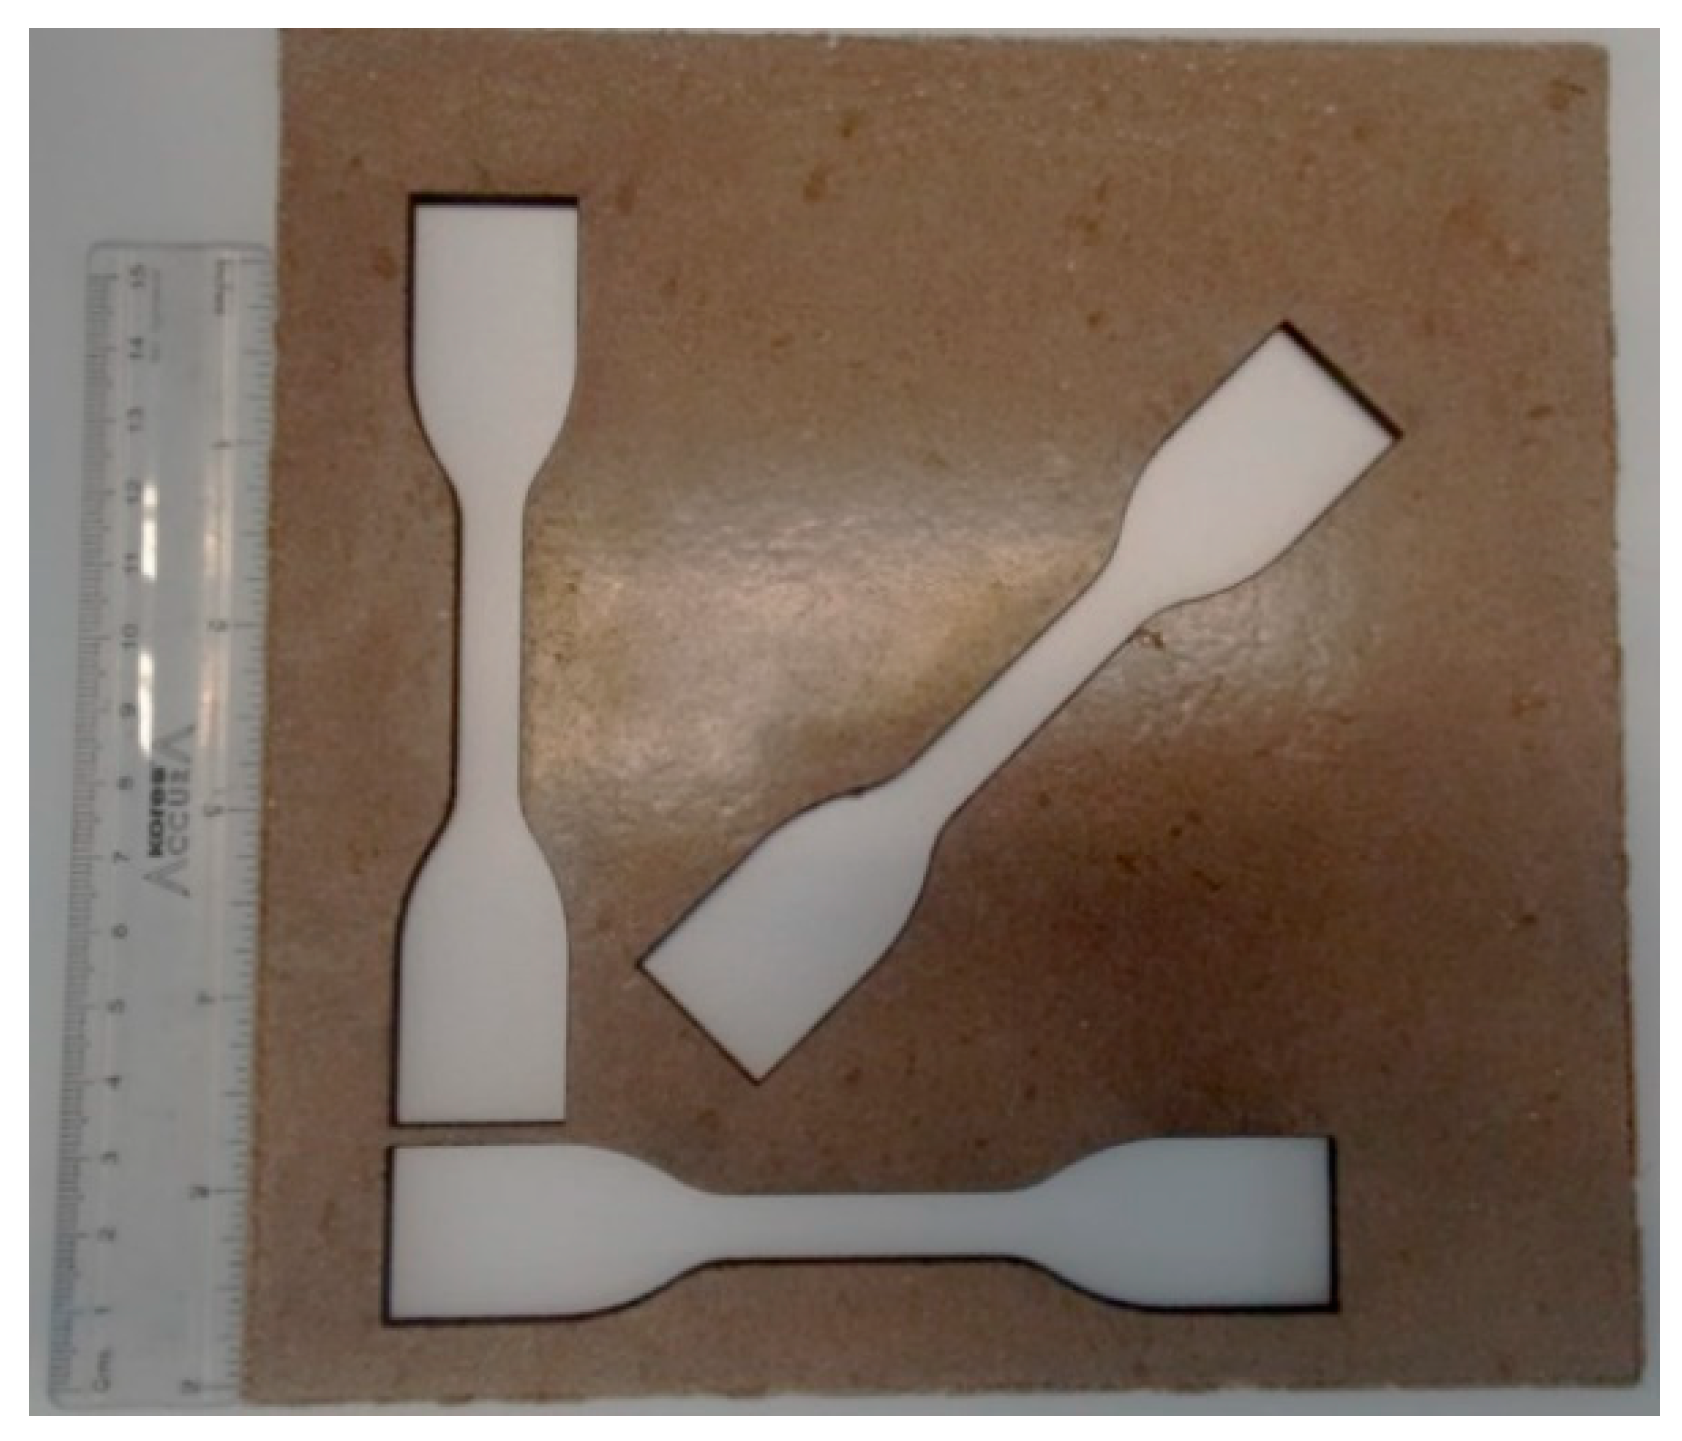
Figure 1 shows the panel that was cut in three different directions, i.e., at 0°, 45° and 90° using the laser cutter. These samples were then put under tension test in the same manner as mentioned above.
2.3. Three-Point Flexure Test
The specimens for bending tests were cut out from a flat panel using a Hare and Forbes Horizontal Band Saw (HafCo, Sydney, Australia). ASTM D1037 was followed to perform the three-point flexure test on these specimens [
17]. The average thickness of all the samples was 5 mm and the width was 51 mm, while the average span between the supports was taken as 24 times the nominal thickness of the sample as described in the standard, in this case 120 mm. The tests were performed using the same INSTRON 5565 electromechanical testing machine (Instron, Melbourne, Australia).
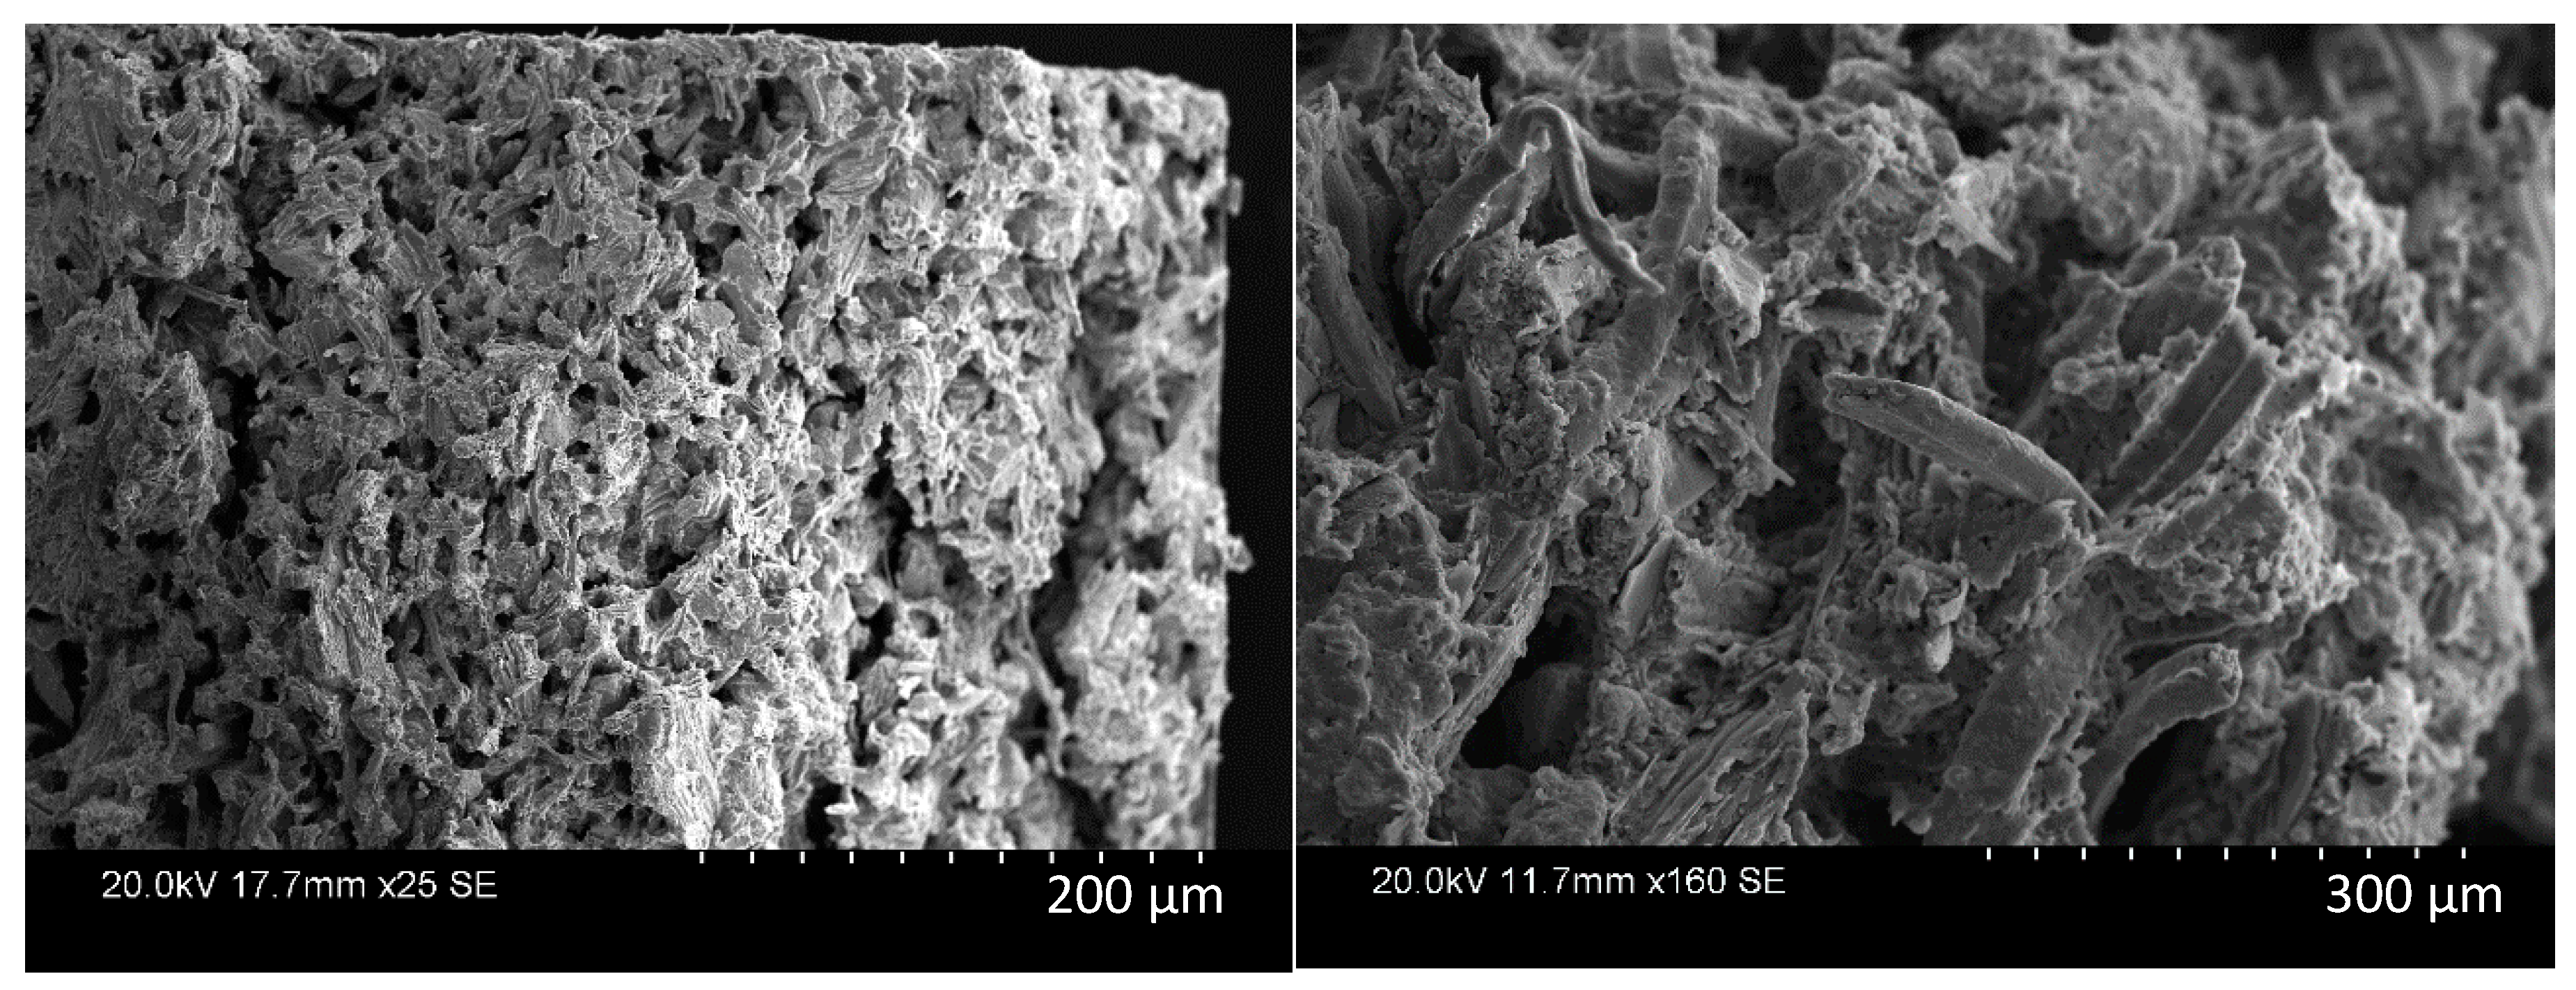
2.4. Microstructure Analysis
In order to confirm the isotropic characteristics, two different samples which were tested for tensile properties and presented different failure pattern were analyzed under a Hitachi S3400 Scanning Electron Microscope (SEM, Hitachi High Technologies America Inc., Schaumburg, IL, USA). The analyzed samples were gold coated after desiccating them for 24 h. The samples were mounted vertically on a 26 mm studs and the voltage was kept to 20 KV while maintaining the working distance of 15 mm.
2.5. Simulation Procedure
The simulation models were defined geometrically using ANSYS to imitate the results of the mechanical testing of the specimens. Relevant ASTM standards i.e. ASTM D638 and ASTM D1027 were followed while designing the models for tension and flexure test respectively to preserve the authenticity of the result.
However, before running the simulations one needs to define the material properties efficiently in ANSYS to get the correct results. Since the main focus here is to use waste materials, it is most likely that the material’s source and its composition are varying. Moreover, wood is an anisotropic material, therefore one can expect the composite to behave as an anisotropic material, but the experimental results for gauging the directional nature of the material concluded that the behavior of the material is predominantly isotropic. Since the directions of wood fibers are not manually controlled and the mixture is kept homogeneous while pressing, it is acceptable to assume the isotropic behavior of the composite, which was confirmed with tensile test in a different direction.
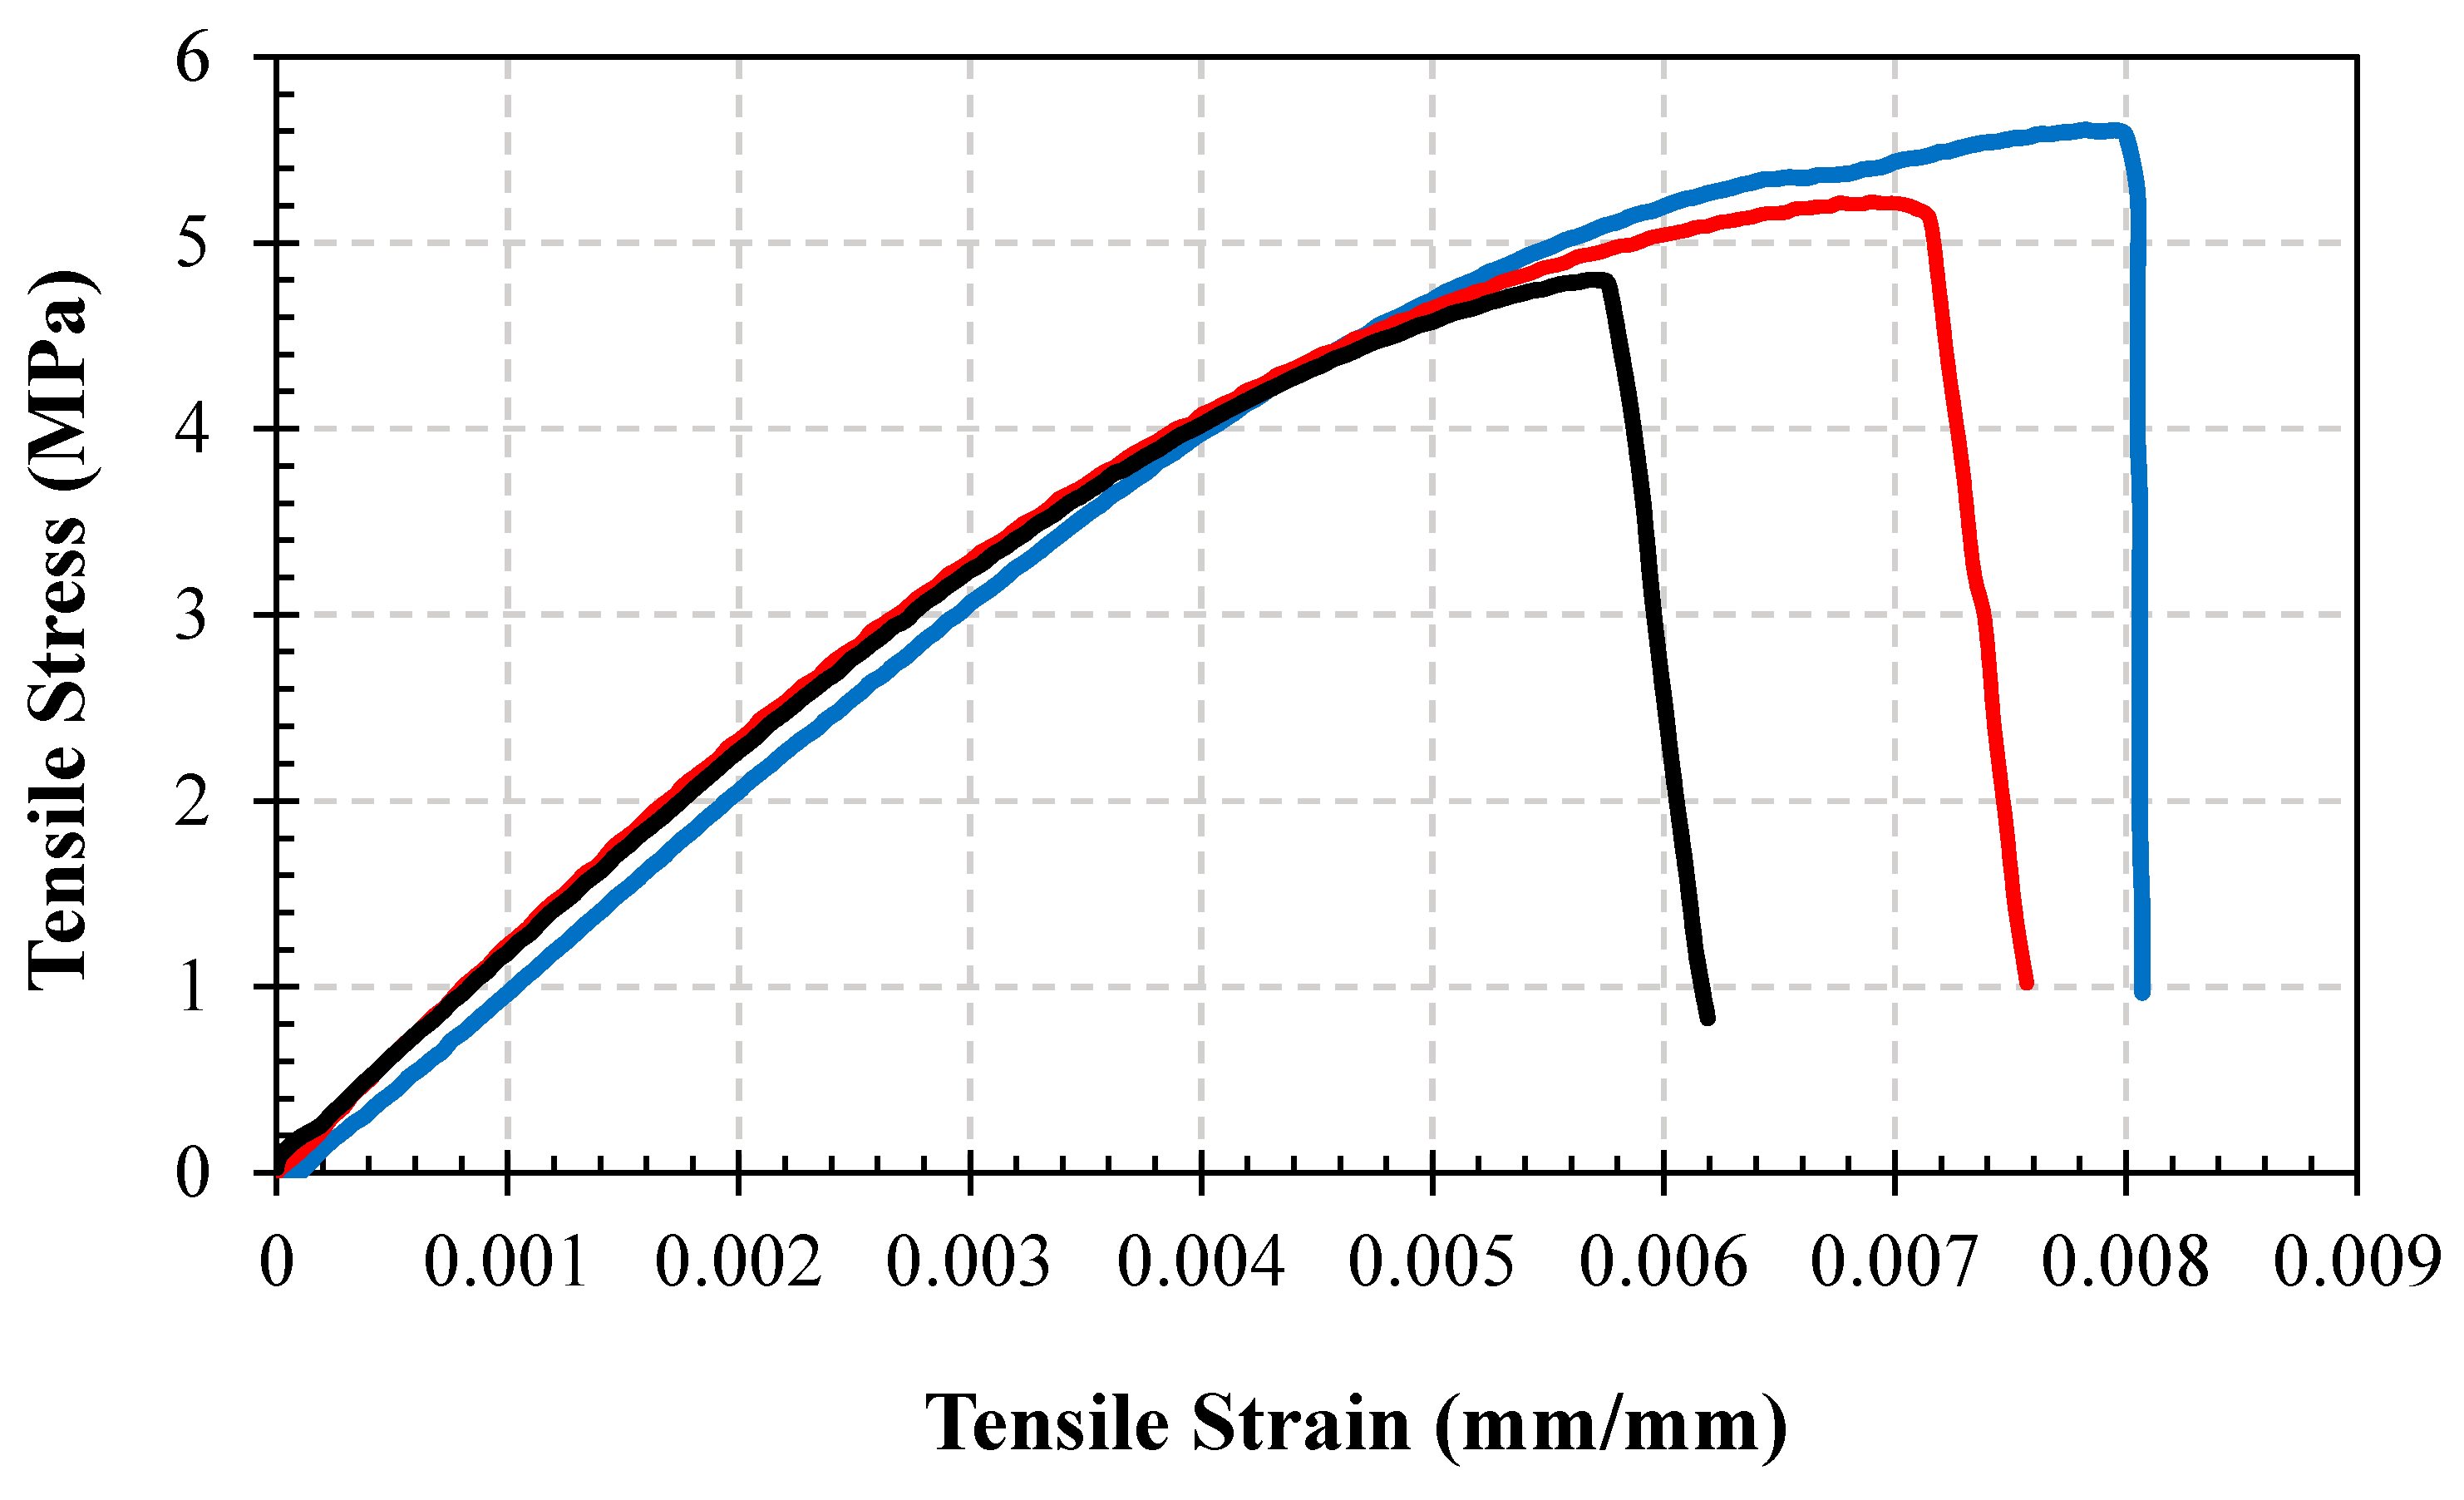
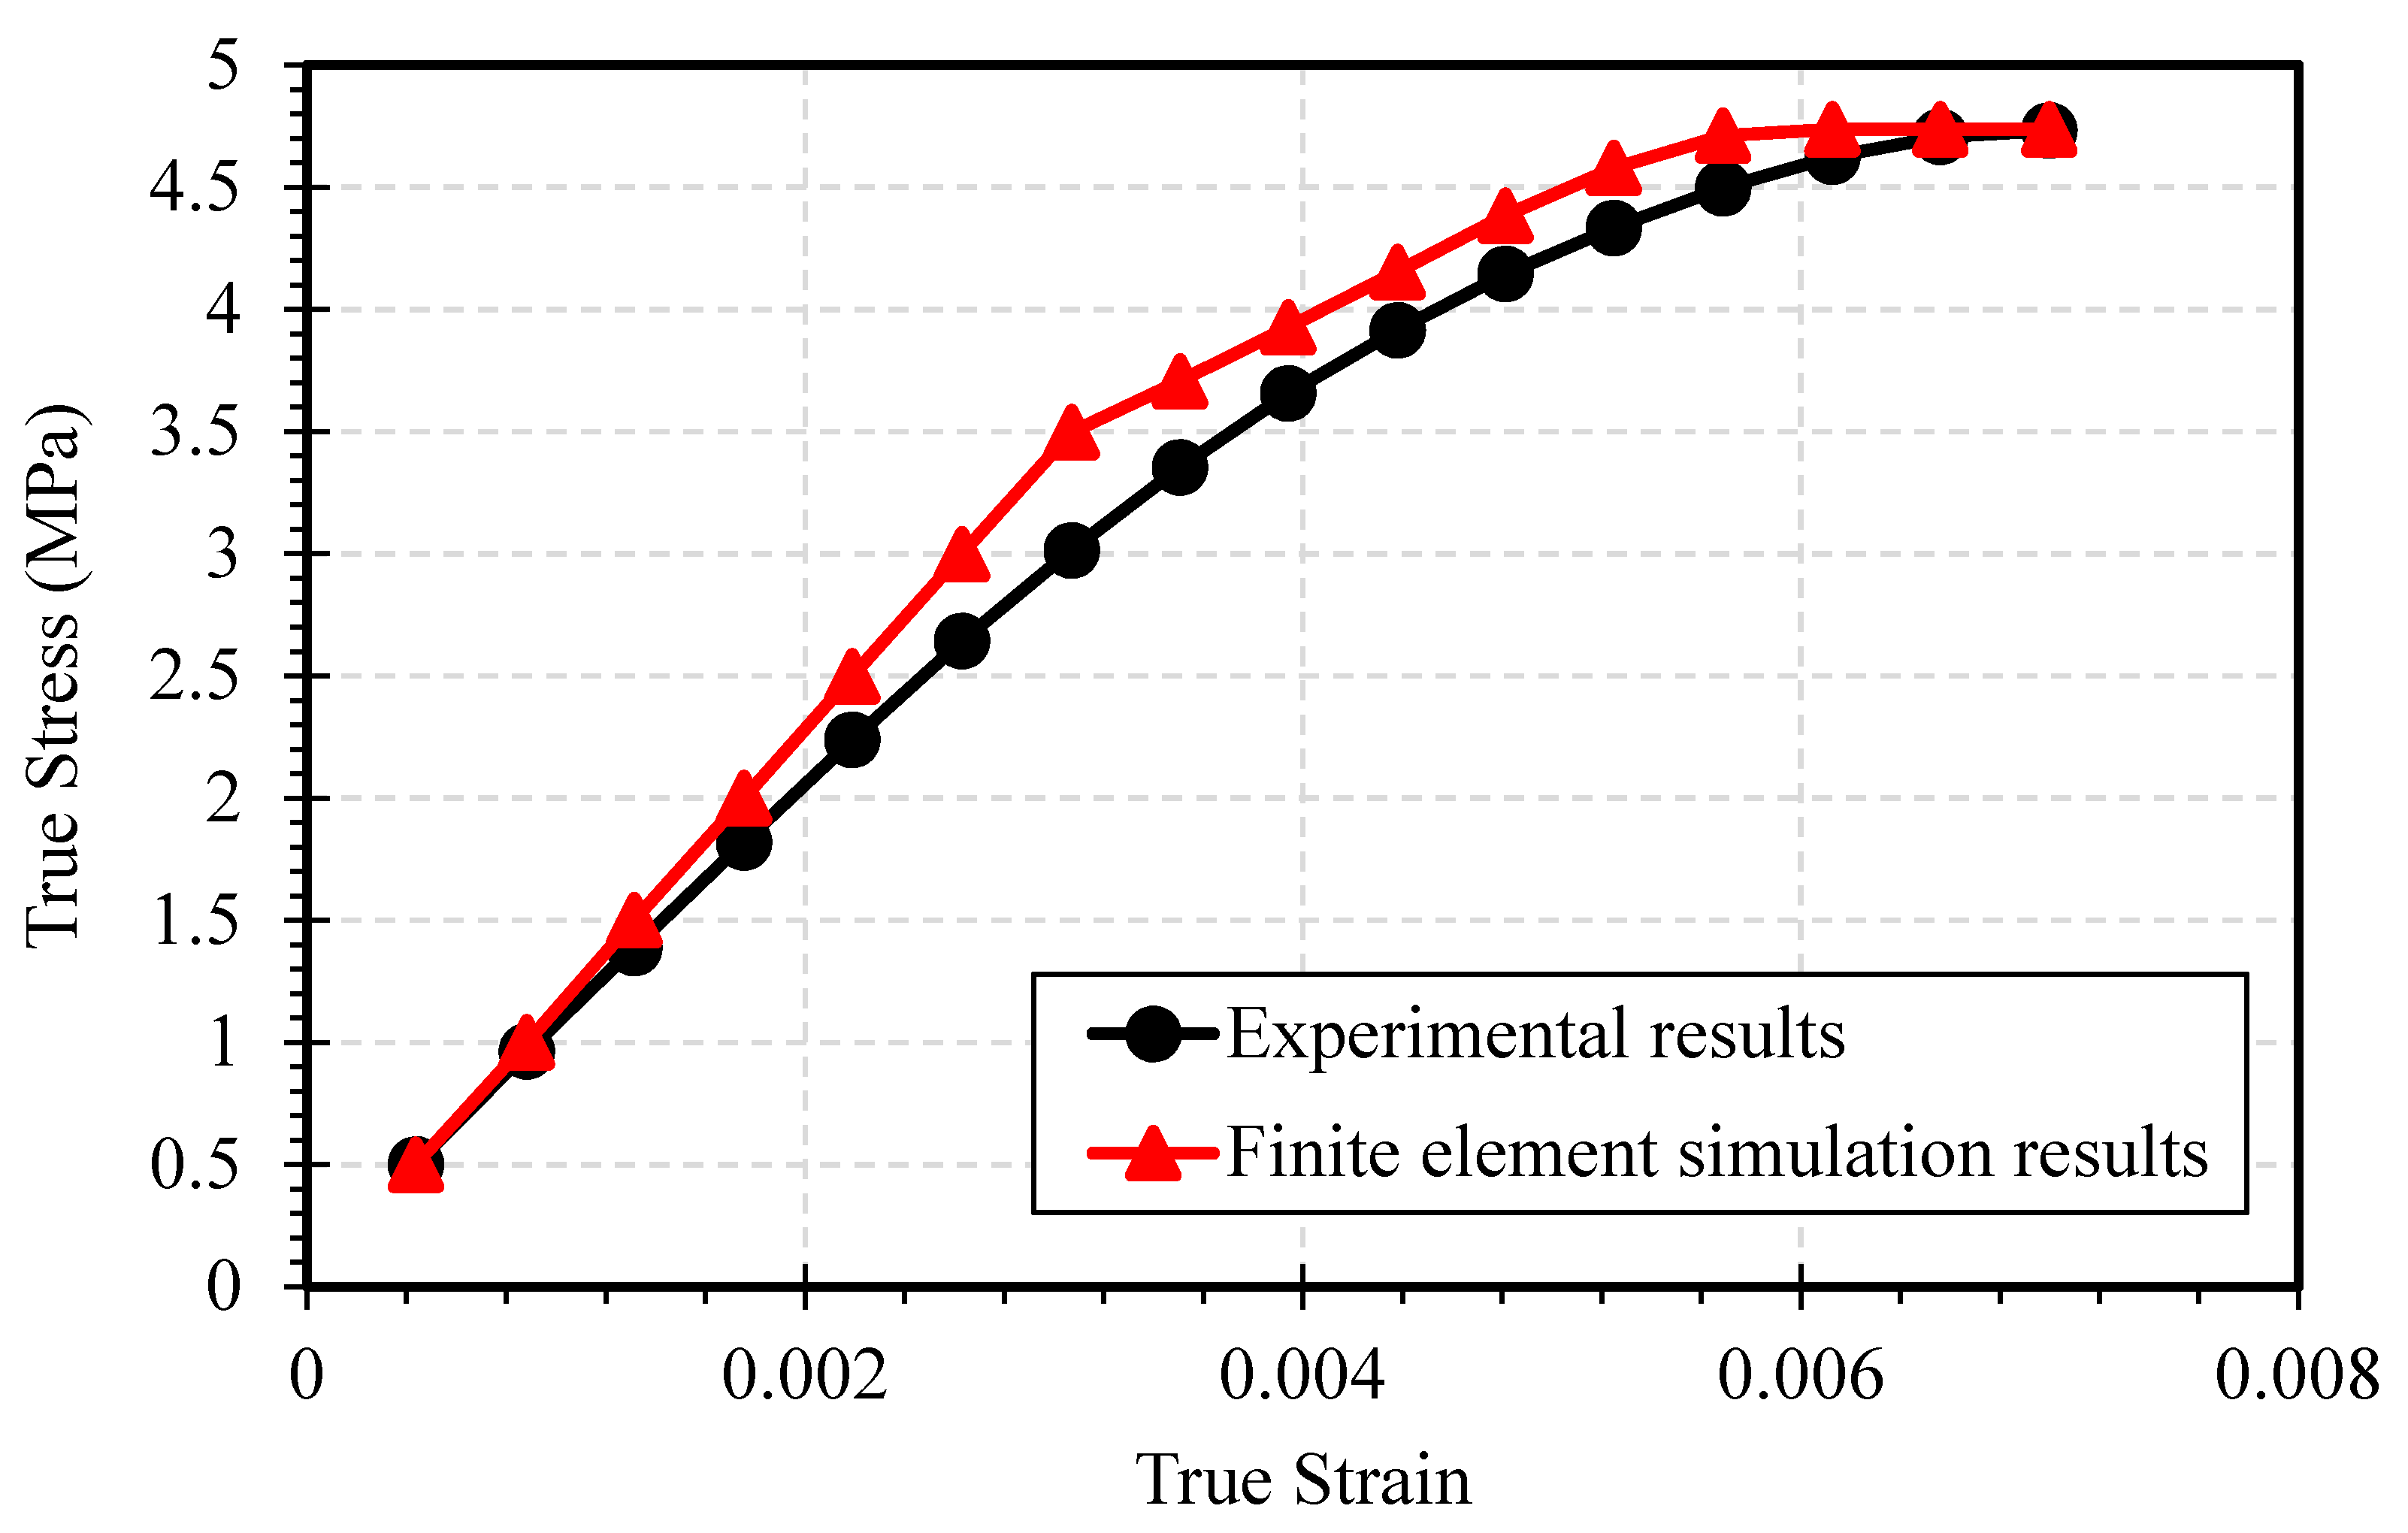
Assuming the material to be isotropic, we need its elastic coefficients and Poisson’s ratio to define it in ANSYS. Results of tension test were used to define the elastic coefficient (E), yield strength and the multilinear isotropic plastic characteristics of the material.
The engineering stress and strain values obtained in the experiment were first converted into true stress and true strain values according to Equations (1) and (2) respectively. While the plastic strain values were calculated using Equation (3):
where
represents stress,
is the strain and
E is the Young’s modulus of the material. The average value of Young’s modulus was calculated using the stress and strain values in initial range where stress is directly proportional to strain, i.e., Hooke’s law.
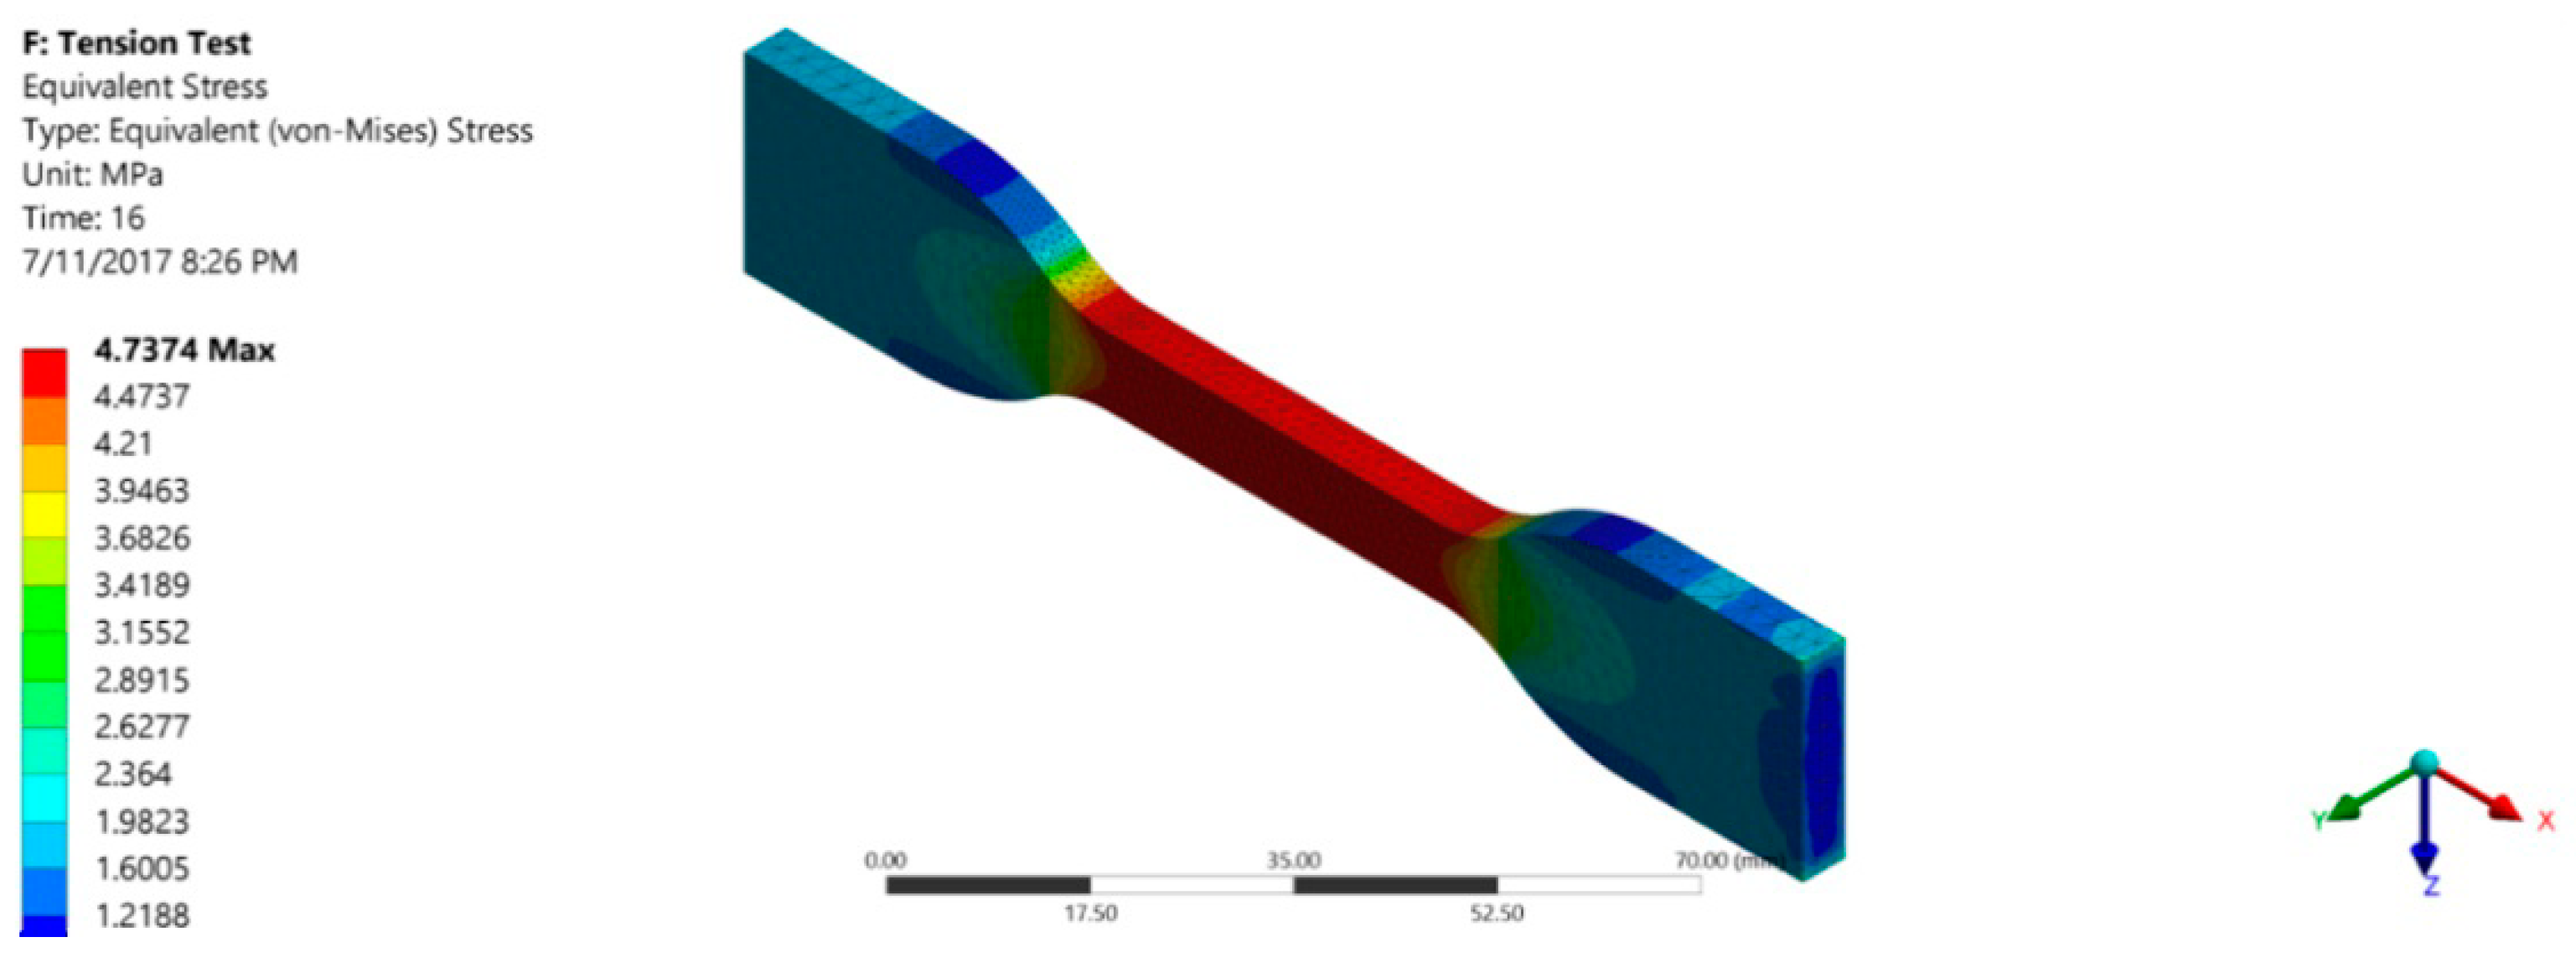
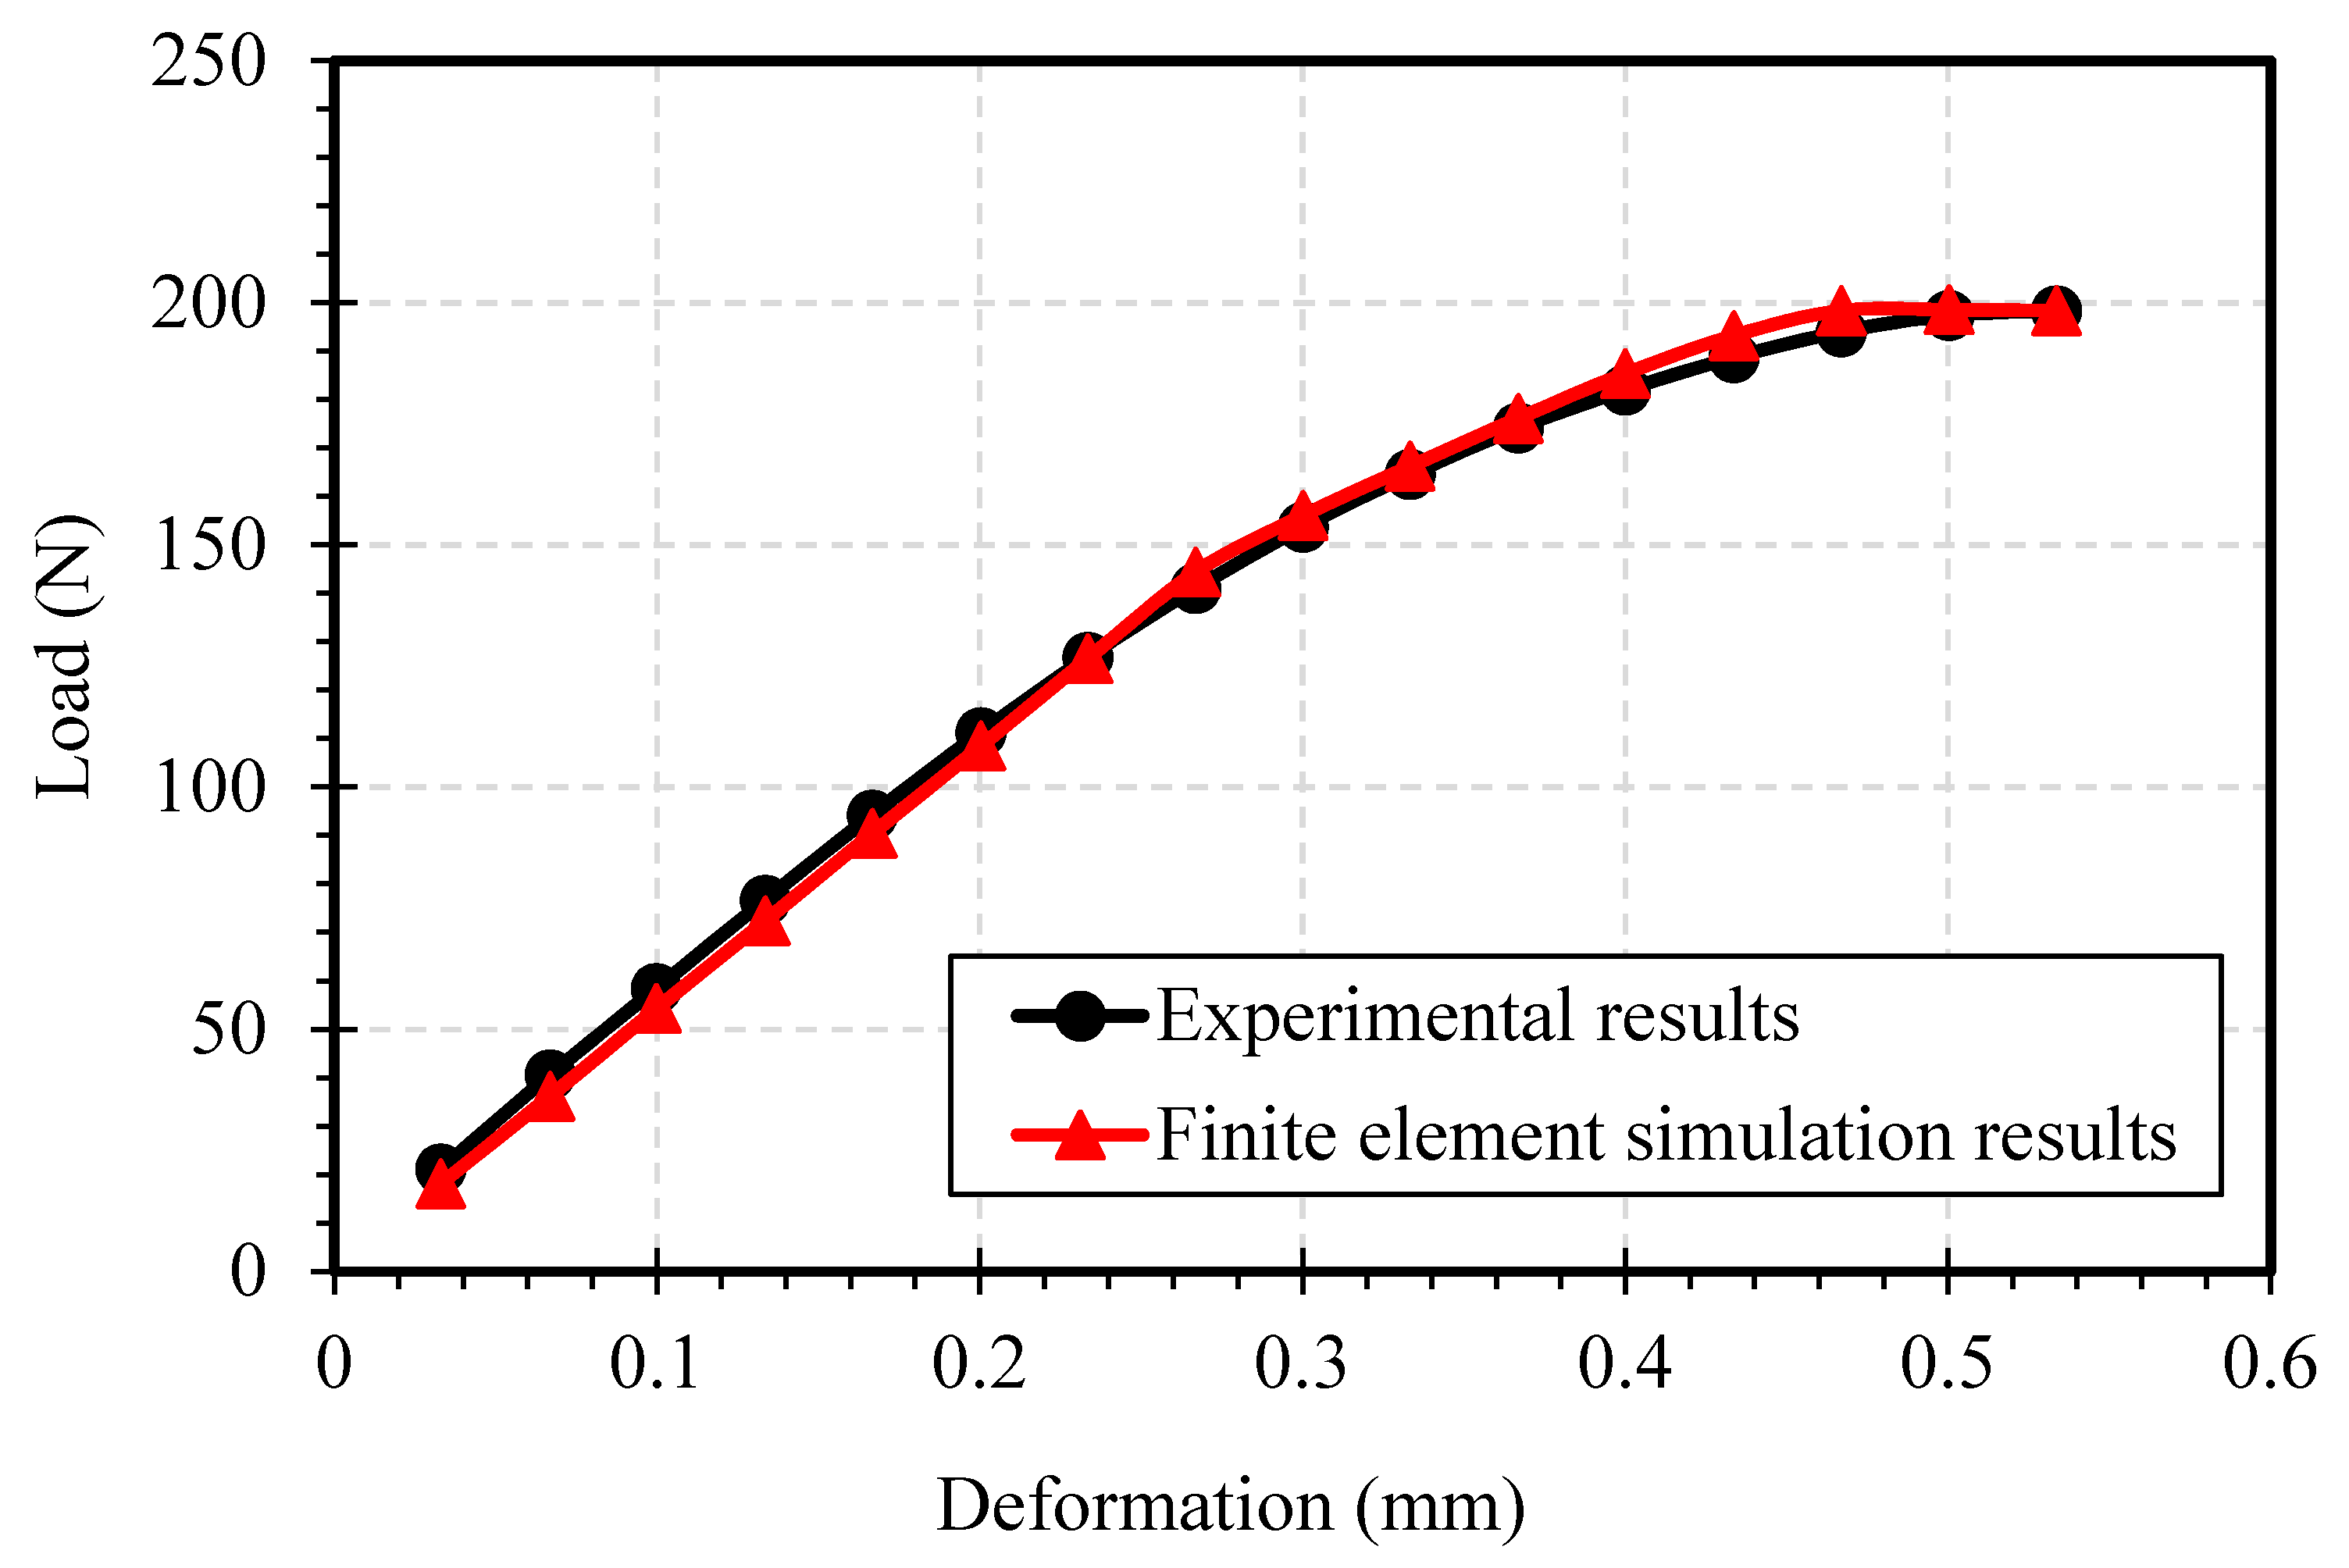
The calculated value of true stress and plastic strain was used to define the material properties such as multilinear isotropic hardening in the simulation software. The deformation rate followed in the simulation was kept the same as the one that had been used in the experiment. Mesh relevance and element size were adjusted accordingly to achieve the most accurate results. Since all the constraints and boundary conditions were the same, the simulation results were in accordance with the experimental results, and hence we could conclude that the new material definition that we described earlier is authentic.
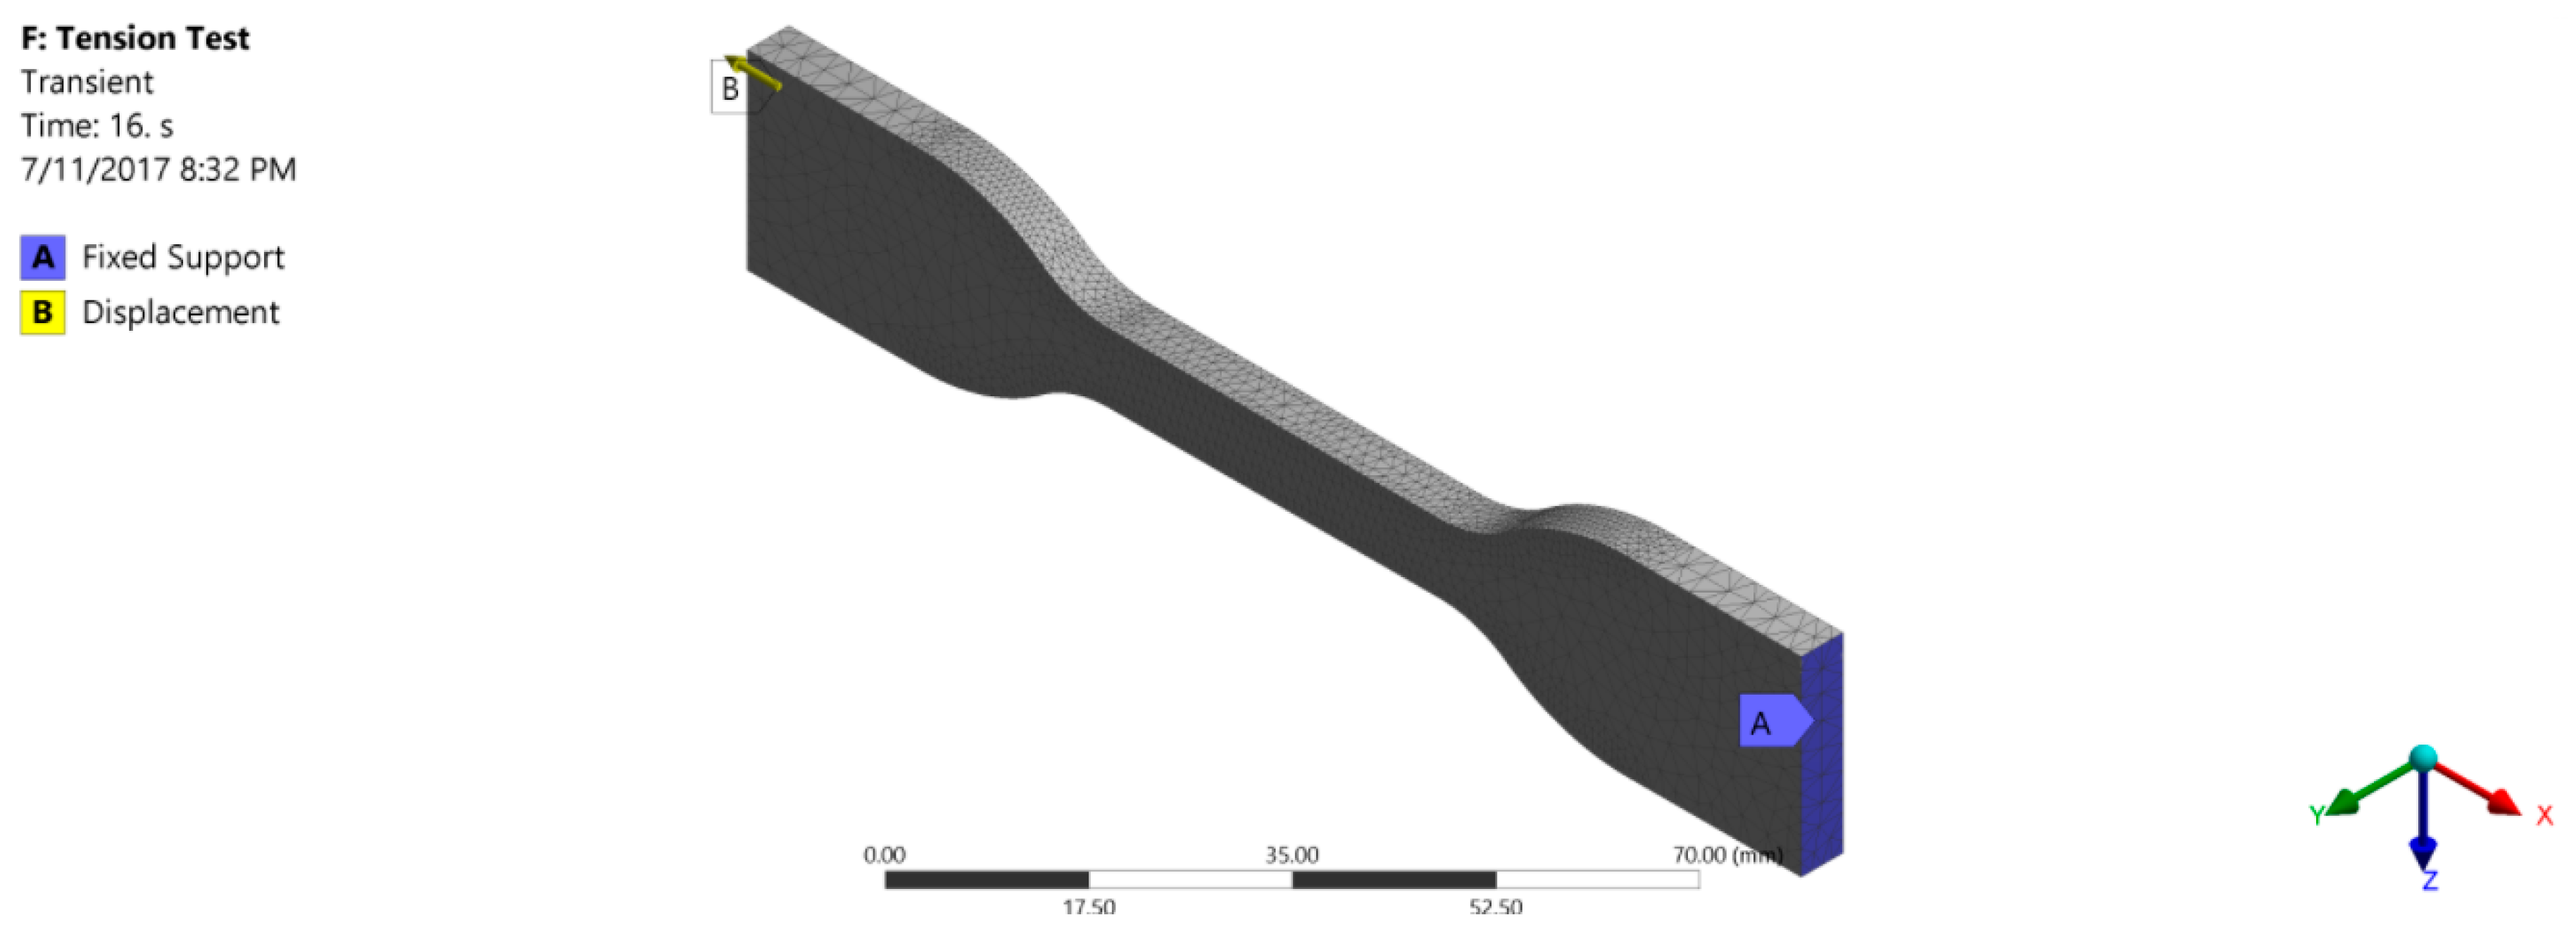
The geometric model used for simulating the tension test is shown in
Figure 2. To perform the simulation, one end of the specimen was provided with a fixed support whereas the other end was provided with a displacement in the axial direction.
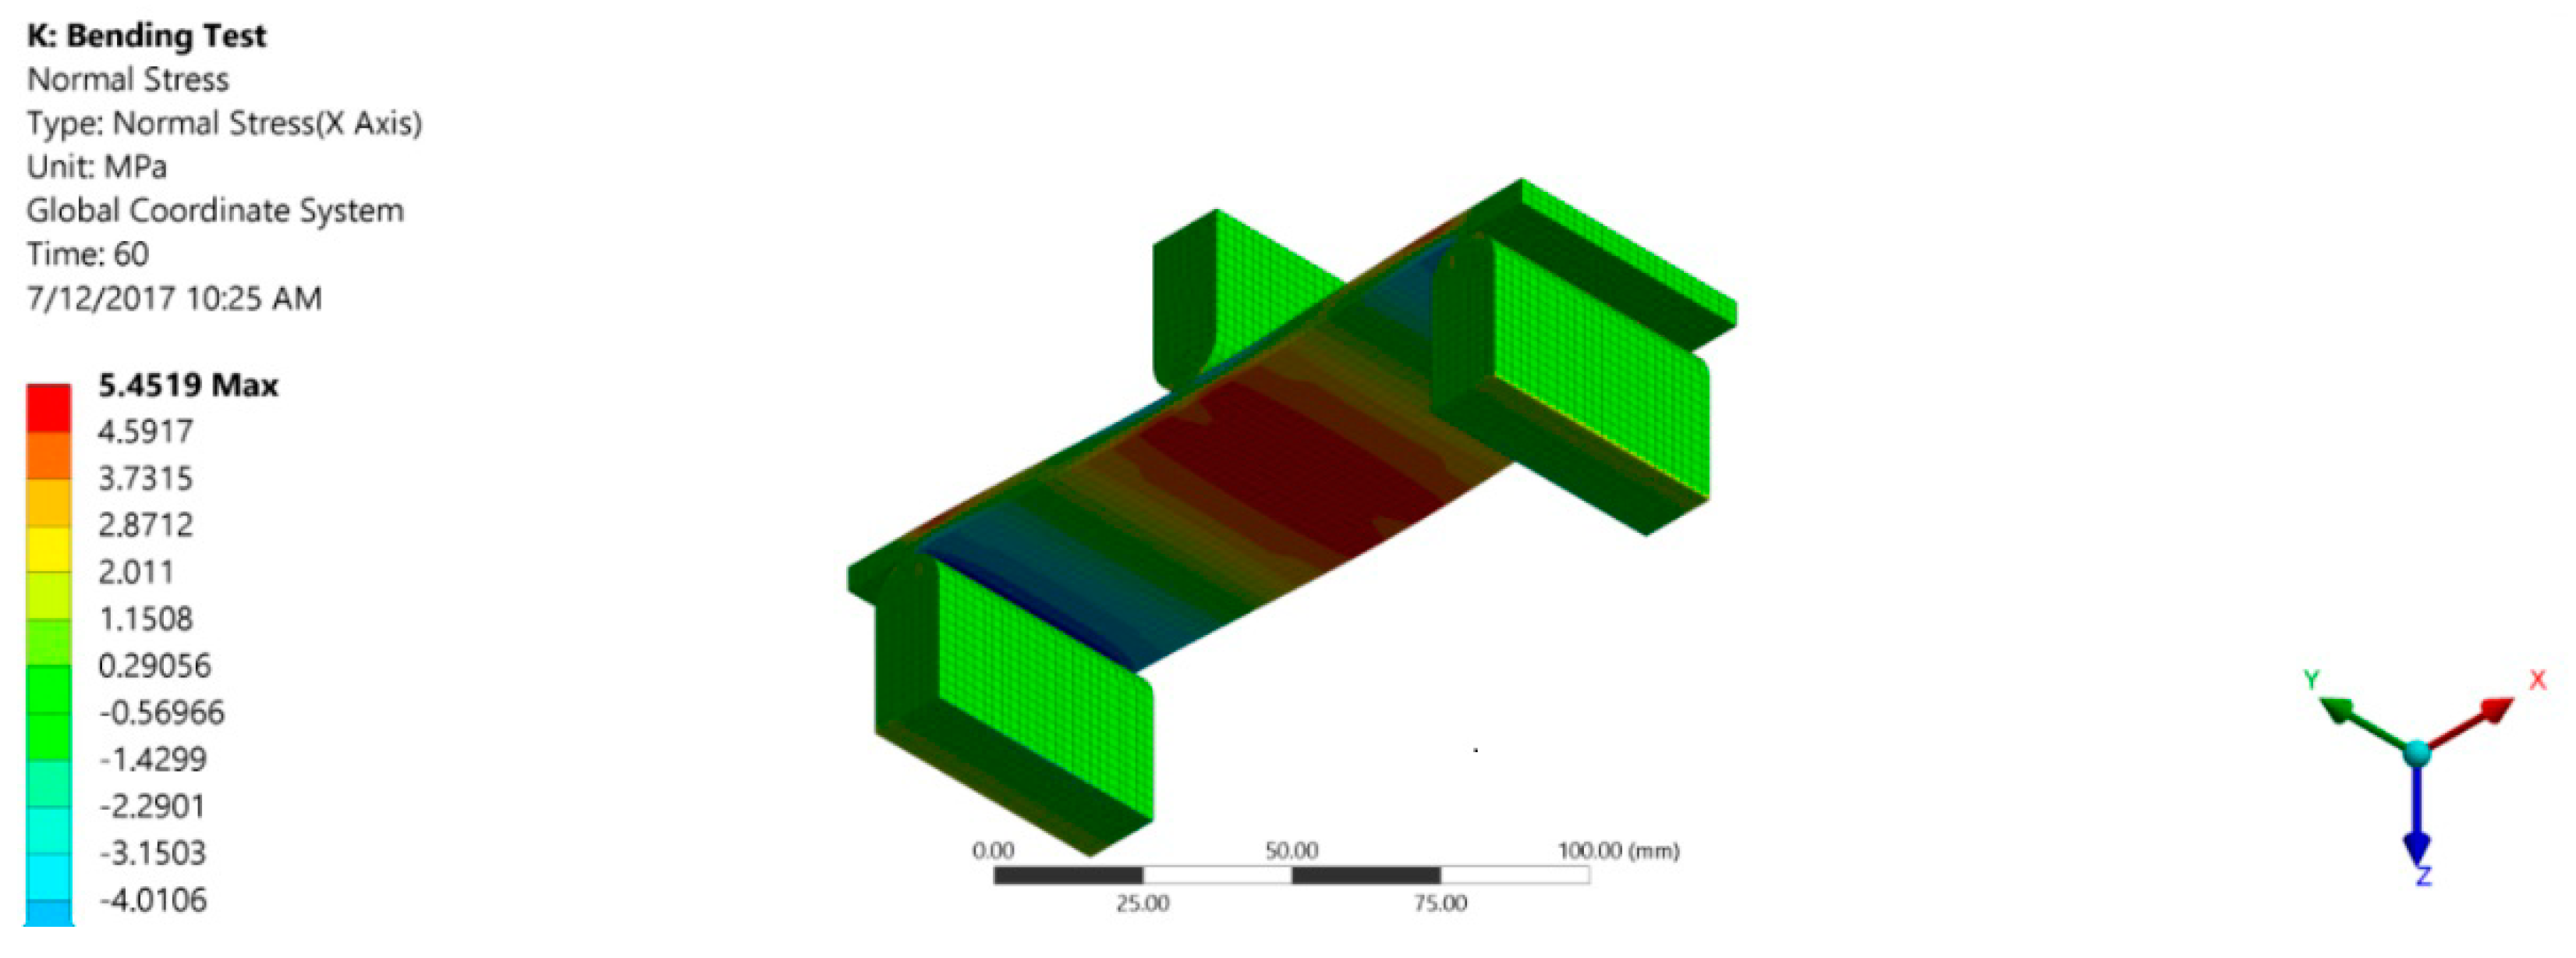
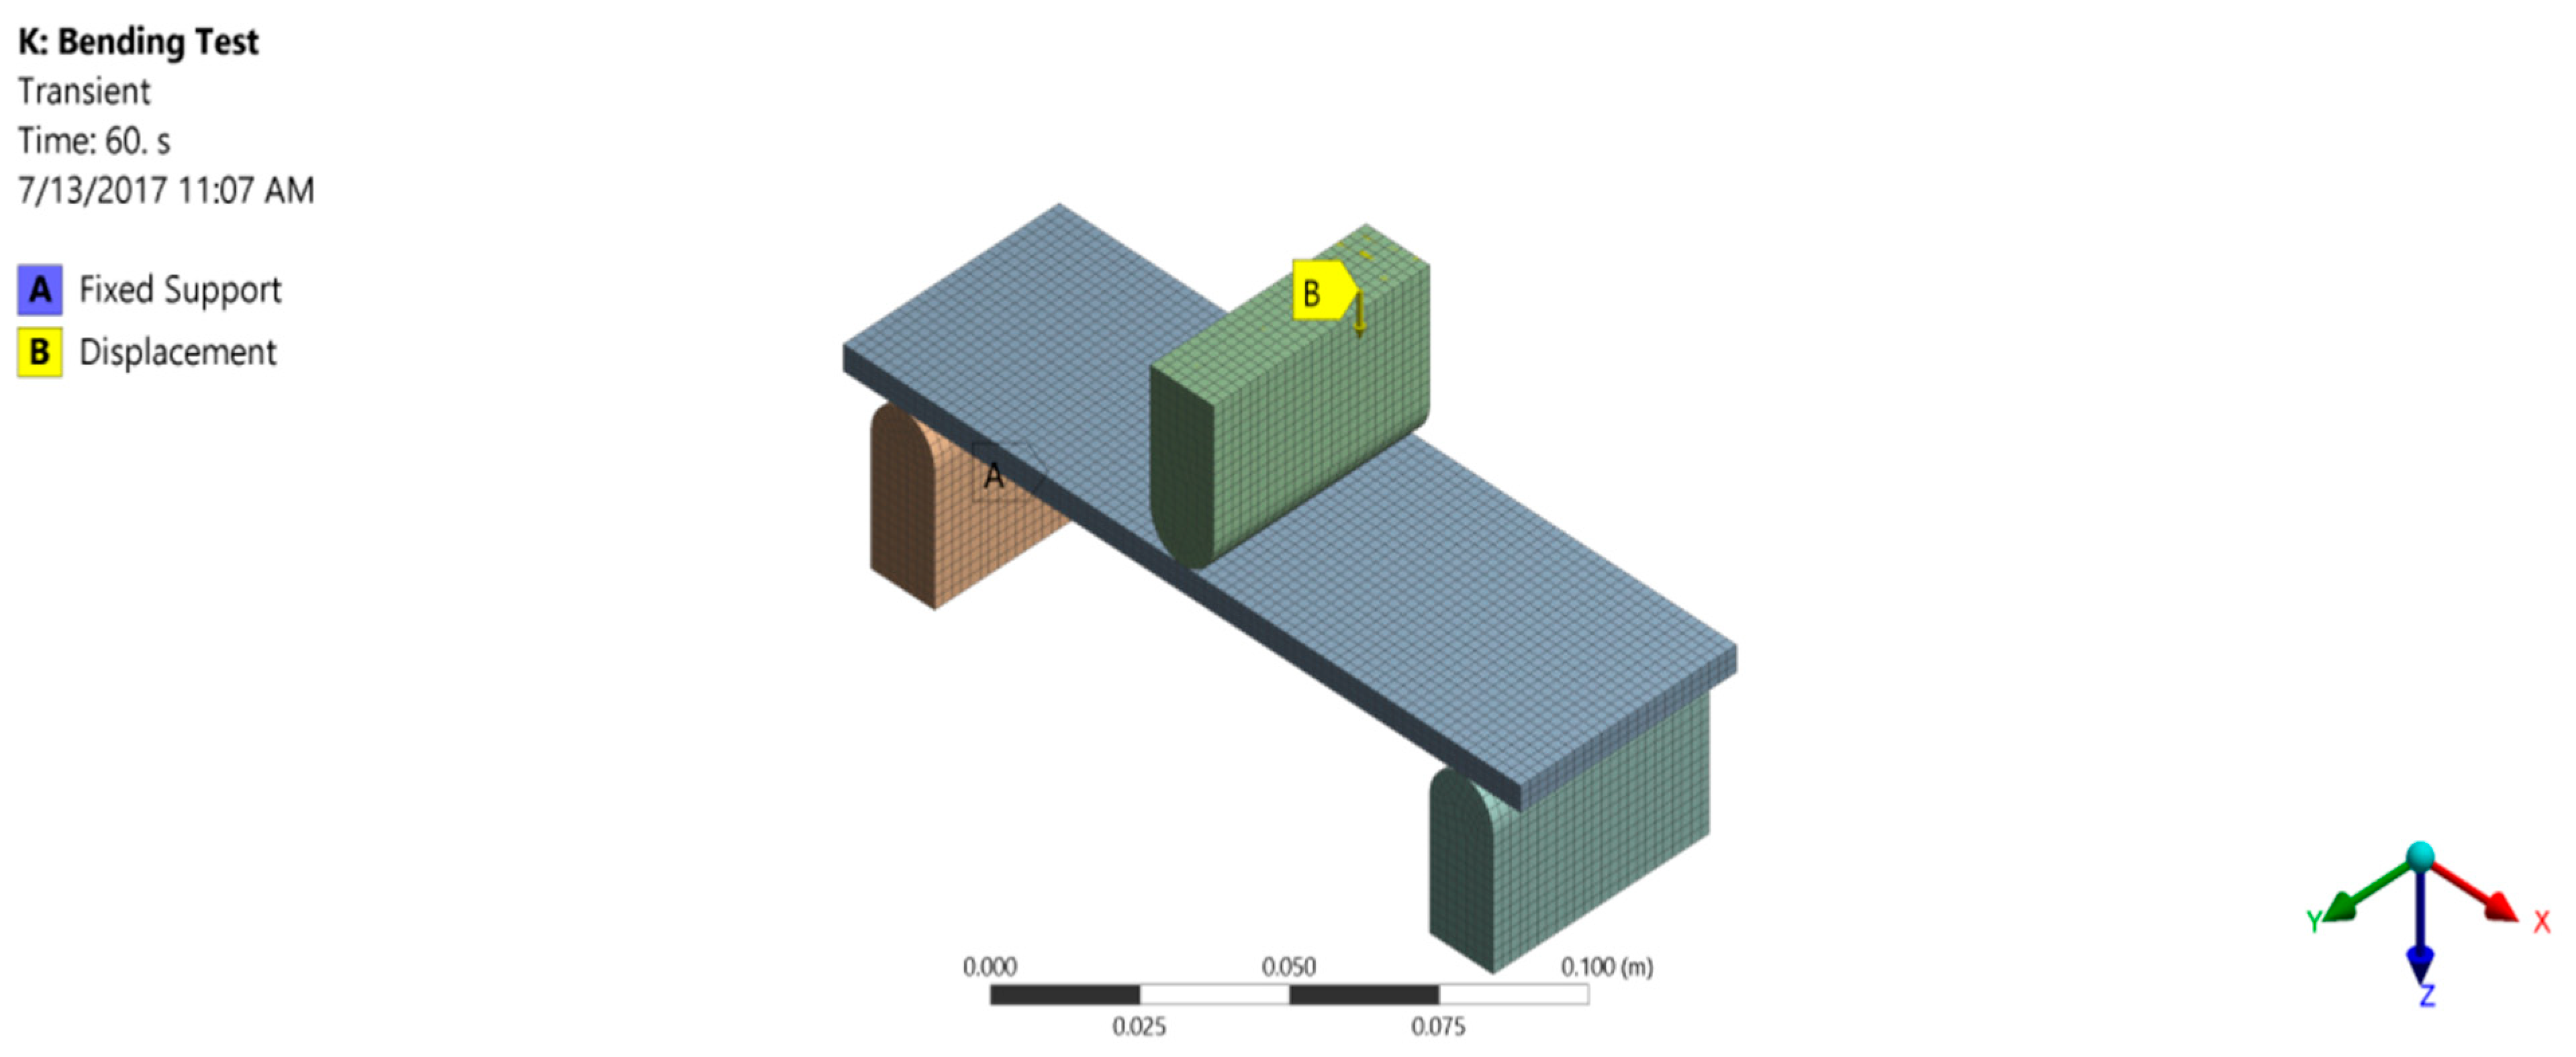
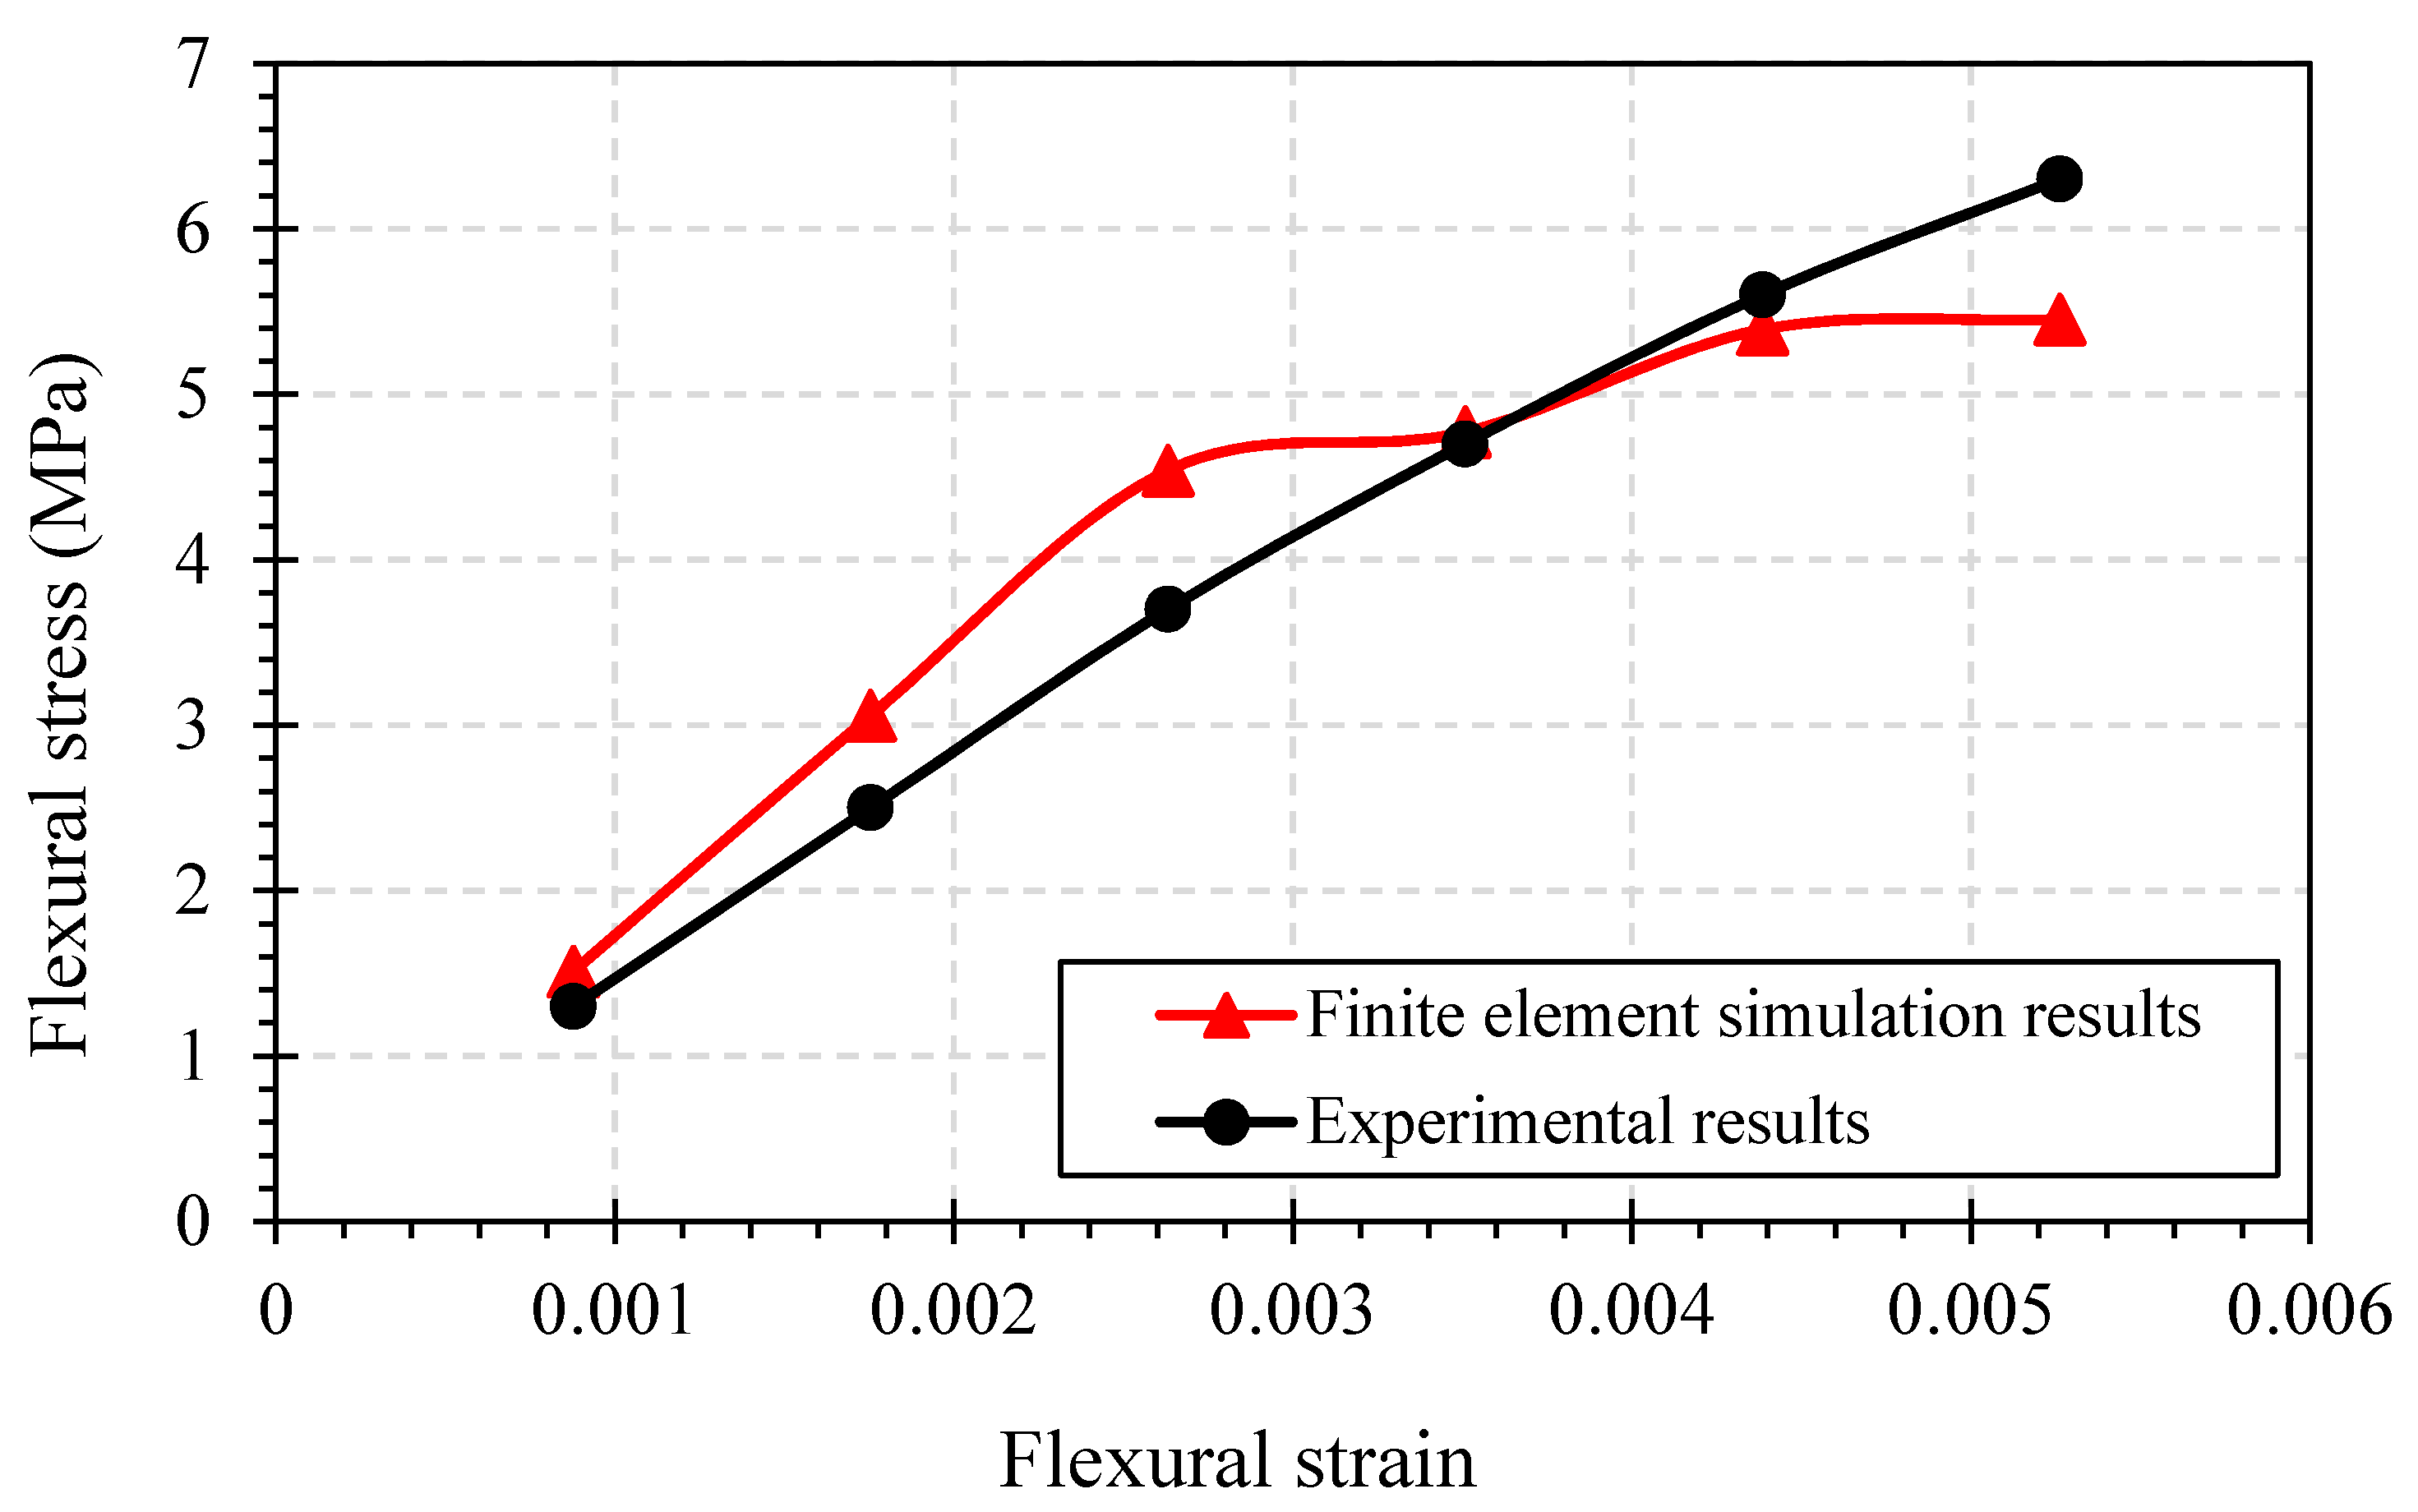
After performing the simulation of tension test successfully and defining material properties in the software, a static three-point flexure test was performed to validate the technique. The geometric model used for the flexure test is shown in
Figure 3. The two lower supports were declared as fixed and a constant displacement, calculated using the standard, was given to the crosshead at the middle to produce bending effects in the specimen. This defines the problem simply to be a supported beam with a point load at the center.
Transient structural plugin was used in ANSYS to perform these simulations for both tension and flexure test and get the results at regular time interval. Transient Structural Analysis is a powerful plugin provided in ANSYS to simulate the dynamic feedback of a structure under the action of time dependent load. The deformation and load values for the test were cross checked with the experimental results. The time interval given for the tension and flexure test was 1 s and 10 s respectively.


 ,
, 


