Article

Process-Induced Fiber Orientation in Fused Filament Fabrication

1
Department of Mechanical Engineering, University of Wisconsin-Madison, Madison, WI 53706, USA
2
AREVO, Inc., Santa Clara, CA 95054, USA
*
Author to whom correspondence should be addressed.
J. Compos. Sci. 2018, 2(3), 45; https://doi.org/10.3390/jcs2030045
Submission received: 2 July 2018 / Revised: 12 July 2018 / Accepted: 27 July 2018 / Published: 2 August 2018
(This article belongs to the Special Issue Discontinuous Fiber Composites)

Abstract

:
As the applications for additive manufacturing have continued to grow, so too has the range of available materials, with more functional or better performing materials constantly under development. This work characterizes a copper-filled polyamide 6 (PA6) thermoplastic composite designed to enhance the thermal conductivity of fused filament fabrication (FFF) parts, especially for heat transfer applications. The composite was mixed and extruded into filament using twin screw extrusion. Because the fiber orientation within the material governs the thermal conductivity of the material, the orientation was measured in the filament, through the nozzle, and in printed parts using micro-computed tomography. The thermal conductivity of the material was measured and achieved 4.95, 2.38, and 0.75 W/(m·K) at 70 °C in the inflow, crossflow, and thickness directions, respectively. The implications of this anisotropy are discussed using the example of an air-to-water crossflow heat exchanger. The lower conductivity in the crossflow direction reduces thermal performance due to the orientation in thin-walled parts.

1. Introduction

Additive manufacturing (AM) is publicized as a new, exciting technology that is on the cusp of revolutionizing manufacturing everywhere and changing the way we think about the products we buy, whether it be custom designing one’s own clothing or producing spare parts at home (or in space). Of course, there are elements of truth and exaggerations with these ideas. Although there are now many examples of metal AM end-use products in high-cost, high-value industries like aerospace [1], polymer end-use parts are less prominent. Polymer AM examples are more often related to prototyping or tool-making; however, the correct combination of material, process, and product can lead to more successful applications.
Functionalized polymer materials can increase the scope of available applications for polymer AM parts. Fused filament fabrication (FFF), a material extrusion process that melts and deposits polymer filament through a heated nozzle, is well-suited for AM with composite materials [2]. FFF filament is produced by extrusion, a mature process that lends itself to the easy incorporation of high loads of fillers [3]. FFF filaments have been produced with up to 40% vol fillers or higher [4] to enhance different properties, such as strength, stiffness, electrical conductivity, or thermal conductivity.
While electrically conductive FFF materials have been available for some time, increased thermal conductivity requires the incorporation of high loads of fillers or generally larger filler sizes. Although some increase in thermal conductivity can be achieved at low filler content [5], the largest gains are seen as conductive chains are formed along filler particles in contact, leading to increasing gains in the compound thermal conductivity [6]. These conductive chains are more easily formed by fillers with a higher aspect ratio [7]. While a sphere has an aspect ratio of 1, a square platelet 15 µm wide and 2 µm thick would have an aspect ratio of 7.5, and a fiber that is 500 µm long and 30 µm in diameter (as is used in this work) has an aspect ratio of 16.7. These high aspect ratio fillers lead to higher thermal conductivity but also exhibit a highly anisotropic thermal conductivity due to the process-induced alignment of the fillers [7]. This is well-studied in shear flows [8,9] and injection molding [7,10] but is little understood for FFF processing.
The process-induced fiber alignment in injection molding of discontinuous fiber-reinforced composites has been studied by several groups in the past [11,12,13,14,15]. However, little research work has been published on fiber alignment in FFF using discontinuous fiber-reinforced materials. Some simulation work has been done on understanding fiber orientation in a composite material as it passes through a nozzle. Heller found, using the Folgar-Tucker model [9], that the alignment will increase through the constriction section of the nozzle, and then may decrease again through the land at the nozzle tip, if the land is long enough. The orientation can decrease substantially following the nozzle exit due to die swell, which acts perpendicularly to the shear flow, however this analysis was based on an unrestricted flow through the nozzle into space [16]. In reality, material exiting the nozzle is immediately deposited on the platform or previously deposited beads, changing the flow direction by 90 degrees from vertical to its final horizontal position. Additionally, different flow lines in the deposited bead undergo different deformations. Therefore, the actual flow in FFF at the nozzle exit is more complex than simple extrusion into space with die swell.
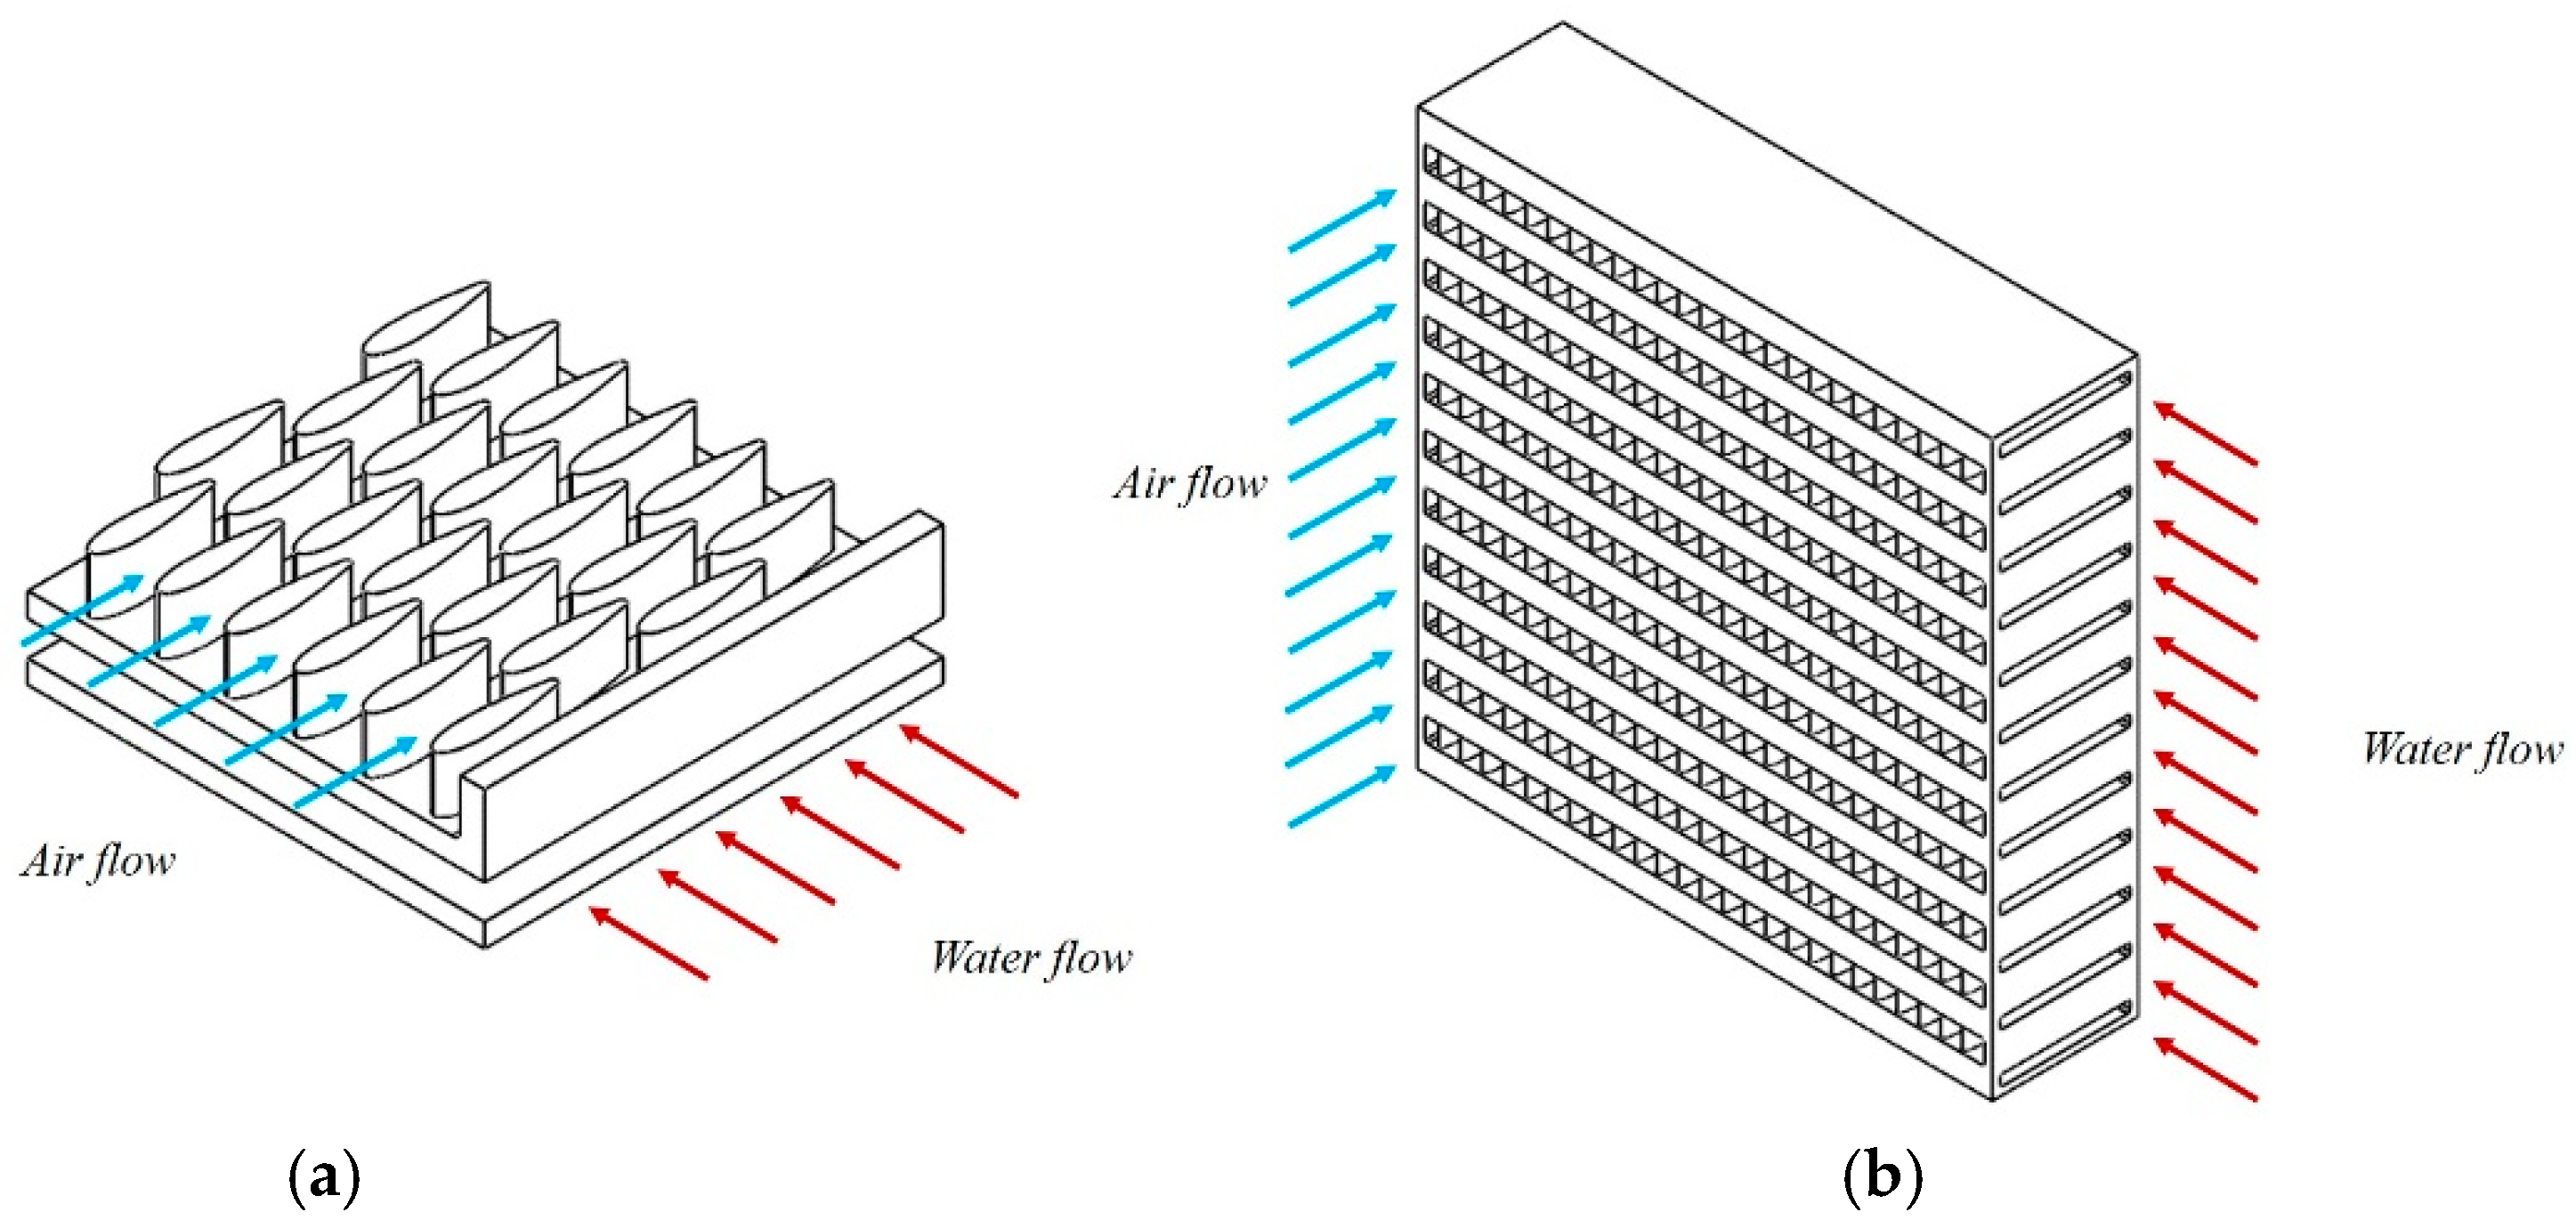
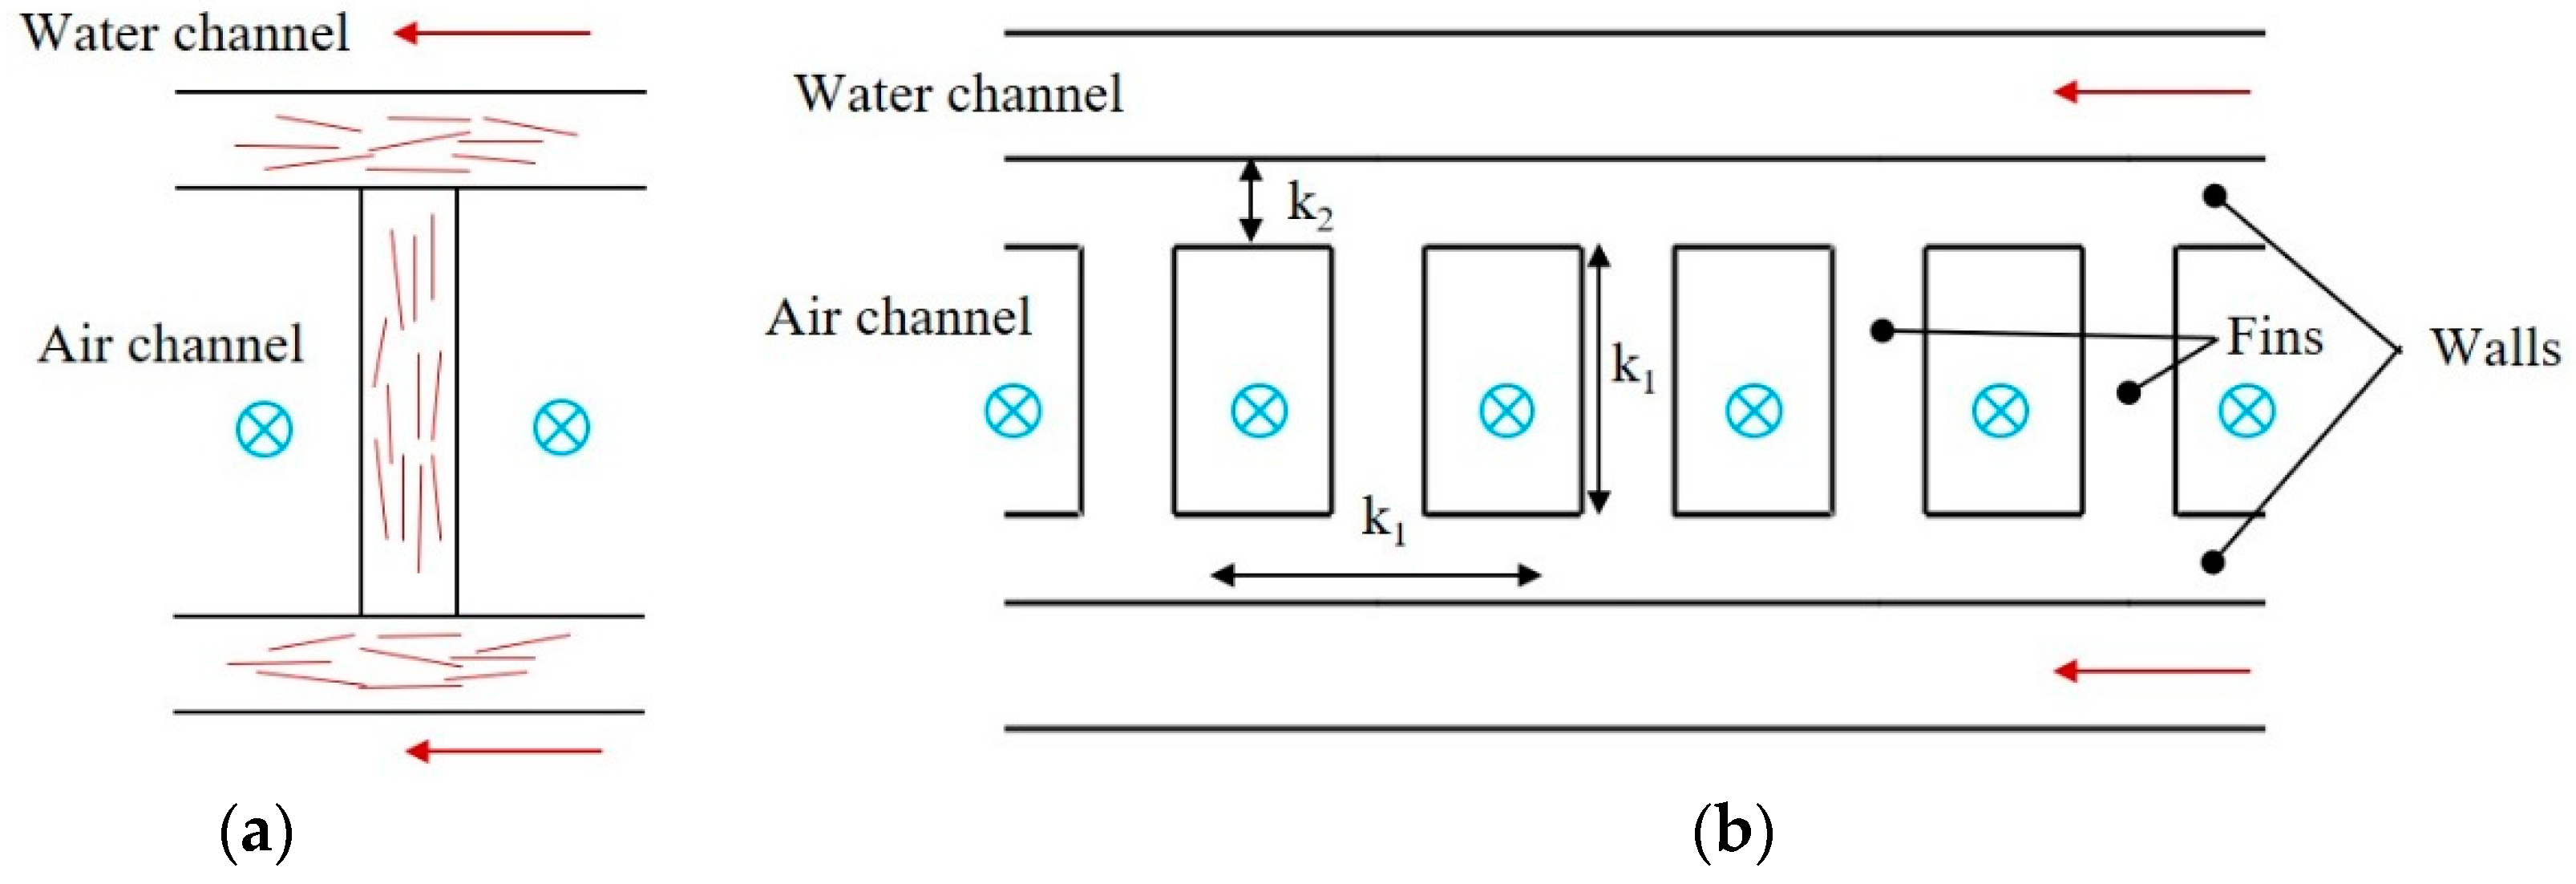
In any case, the thermal conductivity can be seven times higher or more in the flow direction compared to the through-plane direction, as shown in injection molding [7] and later in this work. This may be advantageous or may present problems in different areas of an FFF part. This work explores FFF filament produced with copper fillers in order to print parts with thermal applications: in this case, a crossflow air-cooled heat exchanger (HX). It will be shown that the flow fields in the production of the filament and the deposition during printing govern the fiber orientation, in turn governing the thermal conductivity, which is one of the main factors in the overall performance of the printed HX. A better understanding of the fiber orientation will help improve the performance of the HX and possibly lead to the prediction of the thermal conductivity in different sections of a printed part.
In addition, measuring the orientation of fibers is essential in the understanding of the physics that govern their movement during processing, but it remains a challenging task [17]. Characterization methodologies are limited for copper fibers as the measurements by polishing samples and inspecting the cross-sectional footprint of fibers are not feasible due to copper fiber’s irregular shape.
In this article, we show the results of a make-measure-model concept for 3D printing of copper filled polyamide to manufacture air-cooled heat exchangers. This work comprises the compounding and extrusion of the filament, the production and characterization of the samples, and the modeling of the thermal properties that can be achieved.

2. Materials and Methods

2.1. Filament Extrusion

Polyamide 6 (PA6, Ultramid® B33-01, BASF®, Ludwigshafen, Germany) was chosen as the polymer matrix in this work due to its ability to resist the HX service temperature of 70 °C. This was mixed with copper fibers with a 30 µm nominal diameter and 500 µm length (Deutsches Metallfaserwerk, Neidenstein, Germany) or copper spheres with a nominal diameter of 45 µm (Chemical Store, Clifton, NJ, USA). These were compounded on a Leistritz
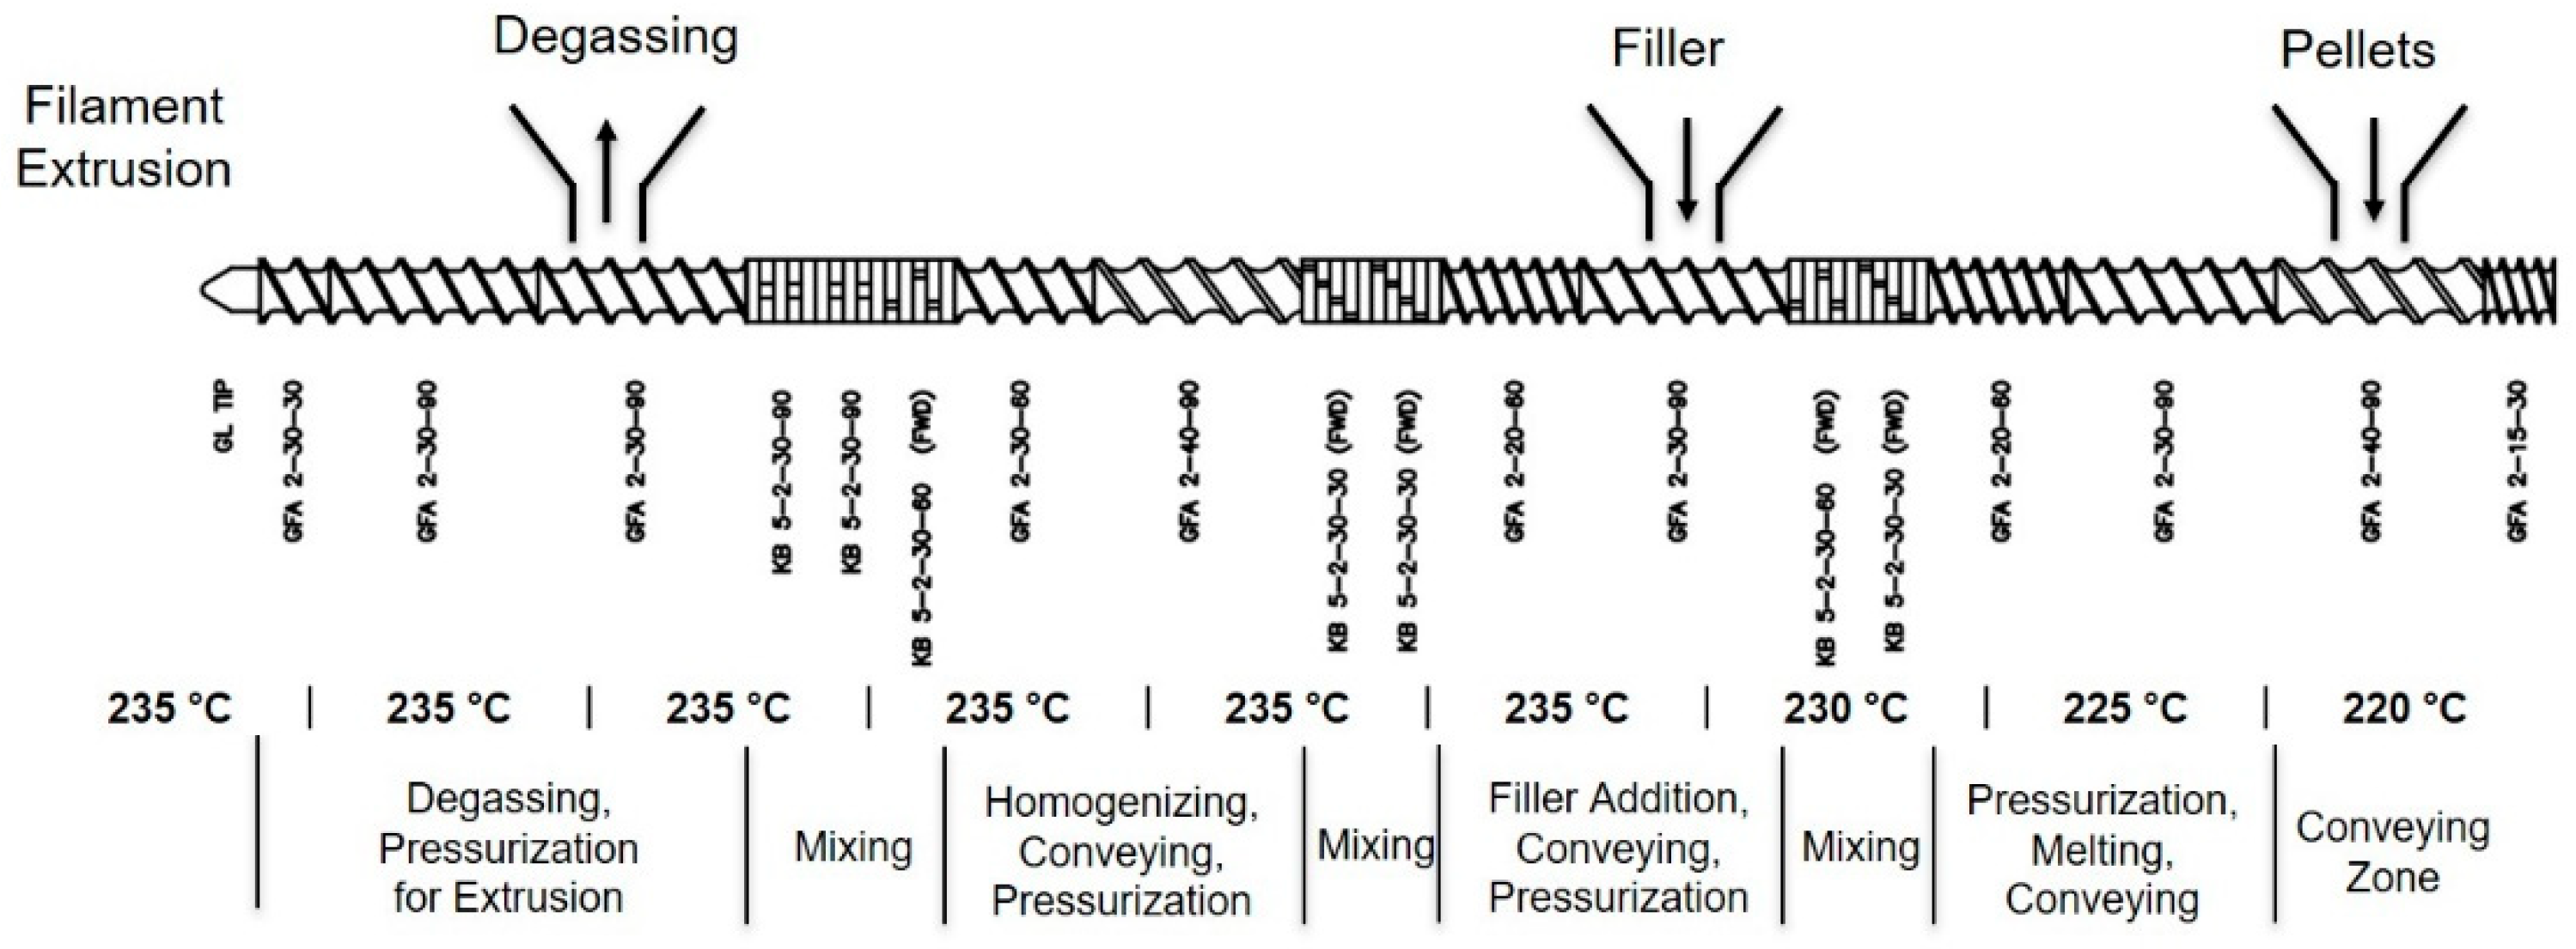
® (Nürnberg, Germany) ZSE 27 HPe corotating twin screw extruder with a screw diameter of 27 mm and L/D ratio of 36. The screw configuration, shown in Figure 1 below, was based on previous work by Amesöder [7] on thermally conductive composites for injection molding. The extruder temperature was controlled in eight zones along the barrel and another for the die, increasing along the length as indicated in Figure 1.
These temperatures produced a final melt temperature for the compounded PA6 between 248 and 251 °C. Initial trials used higher temperatures for extrusion, but these led to yellowing of the PA6, indicating degradation, so they were lowered to the given temperatures. The screw speed and the side stuffer speed were 100 RPM and 140 RPM, respectively. The resin feed rate was kept at a constant 4 kg/h, and the filler feed rate was varied to achieve the desired fill ratio. For example, 4 kg/h of PA6 with 10.5 kg/h of copper makes a filler mass fraction of 72.4% wt, or a volume fraction of approximately 25% vol. This speed was chosen to run the line slowly while still achieving a steady filler mass flow rate from the gravimetric feeders.
The extruded filament passes from the die into a vacuum cooling tank, a laser micrometer, a belt puller, and finally a winder. A strand die with a 3.5 mm orifice was used to produce the 1.75 mm filament. The strand leaves the die and enters the Conair® (Cranberry Township, PA, USA) MT104-13-3 vacuum cooling tank. This 4 m (13 ft) stainless steel tank is filled with water to a level higher than the top of the product. A light vacuum less than 1.2 kPa (5 inH2O) keeps the water at the entrance flowing inwards, improving the circularity. The strand then passes through a laser micrometer (LaserLincTM Triton331, Fairborn, OH, USA), which measures the diameter in three locations and calculates the ovality of the product. After the laser micrometer, the strand passes through a Conair® 3-20 precision belt puller, which is in a closed feedback loop with the laser micrometer to control the filament diameter. Finally, at the very end of the line is a winder, which winds the filament onto a large spool for easy handling.
Because of the weight of the copper-filled compound, startup of the downstream operations was very difficult; with the low melt viscosity of PA6, the weight would cause the strand to sag before the strand could be passed into the vacuum cooling tank. Therefore, the line had to be started with just PA6 resin. Once the line was in full operation, the side stuffer was started and the filler was added to the extruder. The maximum filler content was limited to 25% vol due to issues such as die drool causing line breakage.

2.2. Fused Filament Fabrication

Fused filament fabrication is an additive manufacturing process that is classified as material extrusion. A solid circular filament of plastic is fed into a heated nozzle, in which it is melted. The molten plastic is extruded through a small diameter nozzle. The material is then deposited onto the part in a layer-by-layer fashion. The molten plastic cools and solidifies in a very short time as it is deposited.
The printer used in this work was the Aon 3DTM (Montreal, QC, Canada), which is equipped with dual hot ends capable of printing at temperatures up to 450 °C. This printer is built in a gantry style, where the extruders move in the x- and y-directions, and the print bed only moves in the z-direction. One interesting feature of the Aon, which should become more common, is its ability to use two nozzles to print a part in two locations on the bed simultaneously. This essentially reduces the machine cost by half in a manufacturing setting.
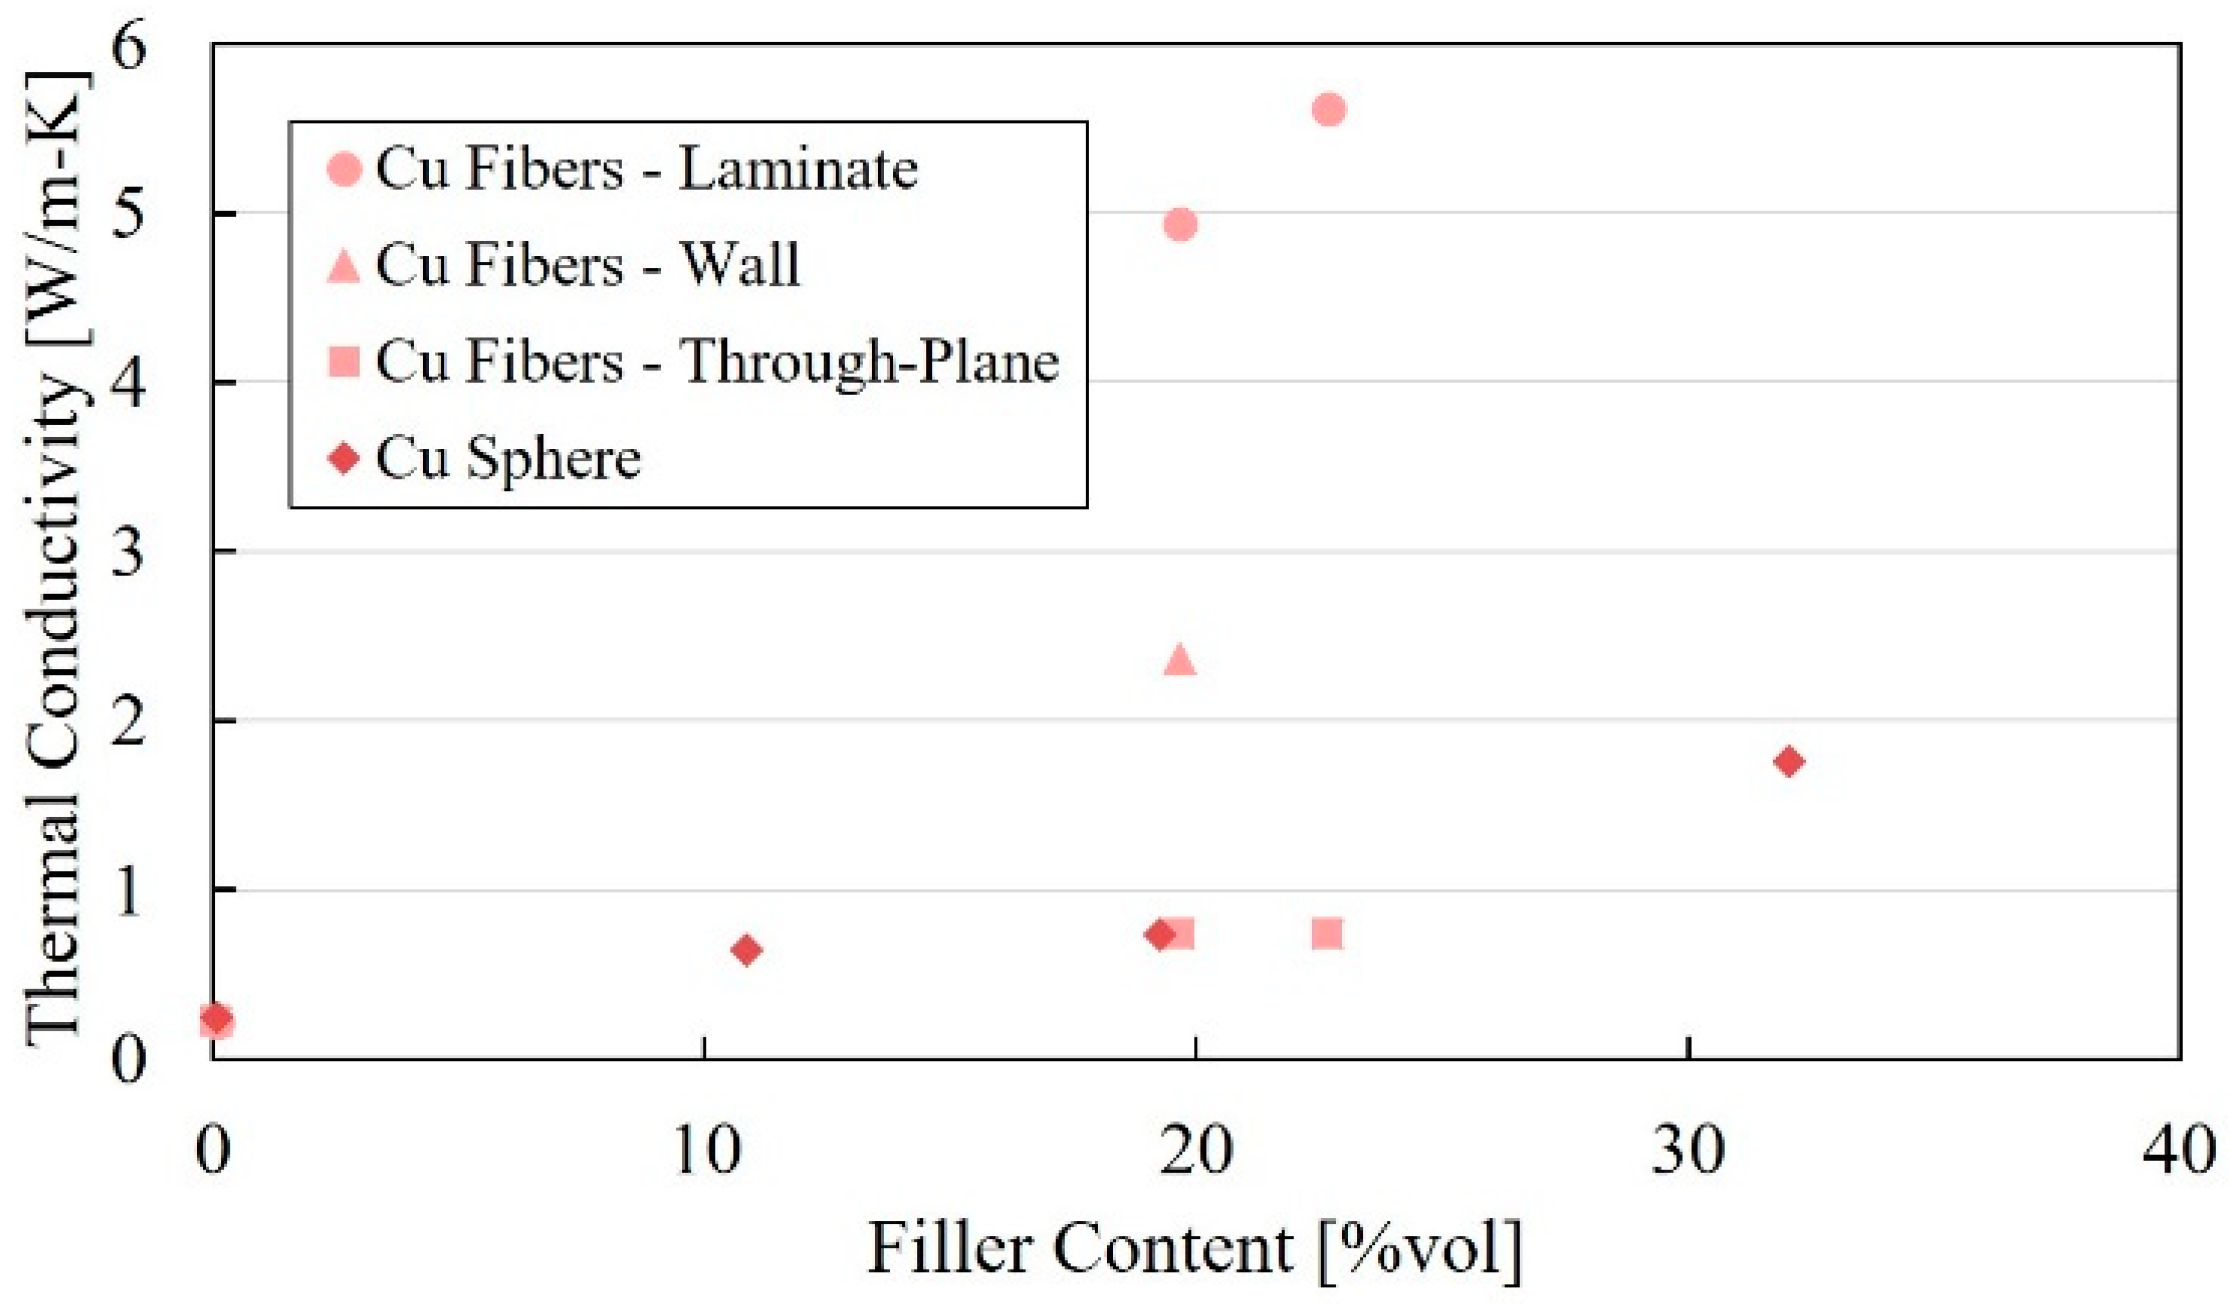
Filaments selected for printing in this work were PA6 with 20% vol copper fiber (PA6-CuF-20), 25% vol copper fiber (PA6-CuF-25), or neat PA6. Some copper sphere-filled samples were prepared by compression molding at approximately 10, 20, and 30% vol for comparison.

2.3. Laser Flash Analysis

The thermal diffusivity can be measured by laser flash analysis (LFA). The instrument, in this work a Netzsch® Instruments (Selb, Germany) Nanoflash 447, analyzes the transient heat flow in a material by firing an energy pulse at the bottom side of a sample using a xenon flash lamp. The top side of the sample is monitored with a liquid nitrogen-cooled infrared detector, which measures a signal proportional to temperature rise on the top surface. A thermal diffusivity model can then be fit to the time-dependent temperature rise. The thermal conductivity ( k ) can be calculated by multiplying the thermal diffusivity ( α ) with the mass density ( ρ ) and specific heat capacity ( c p ), as:
k = α ρ c p .
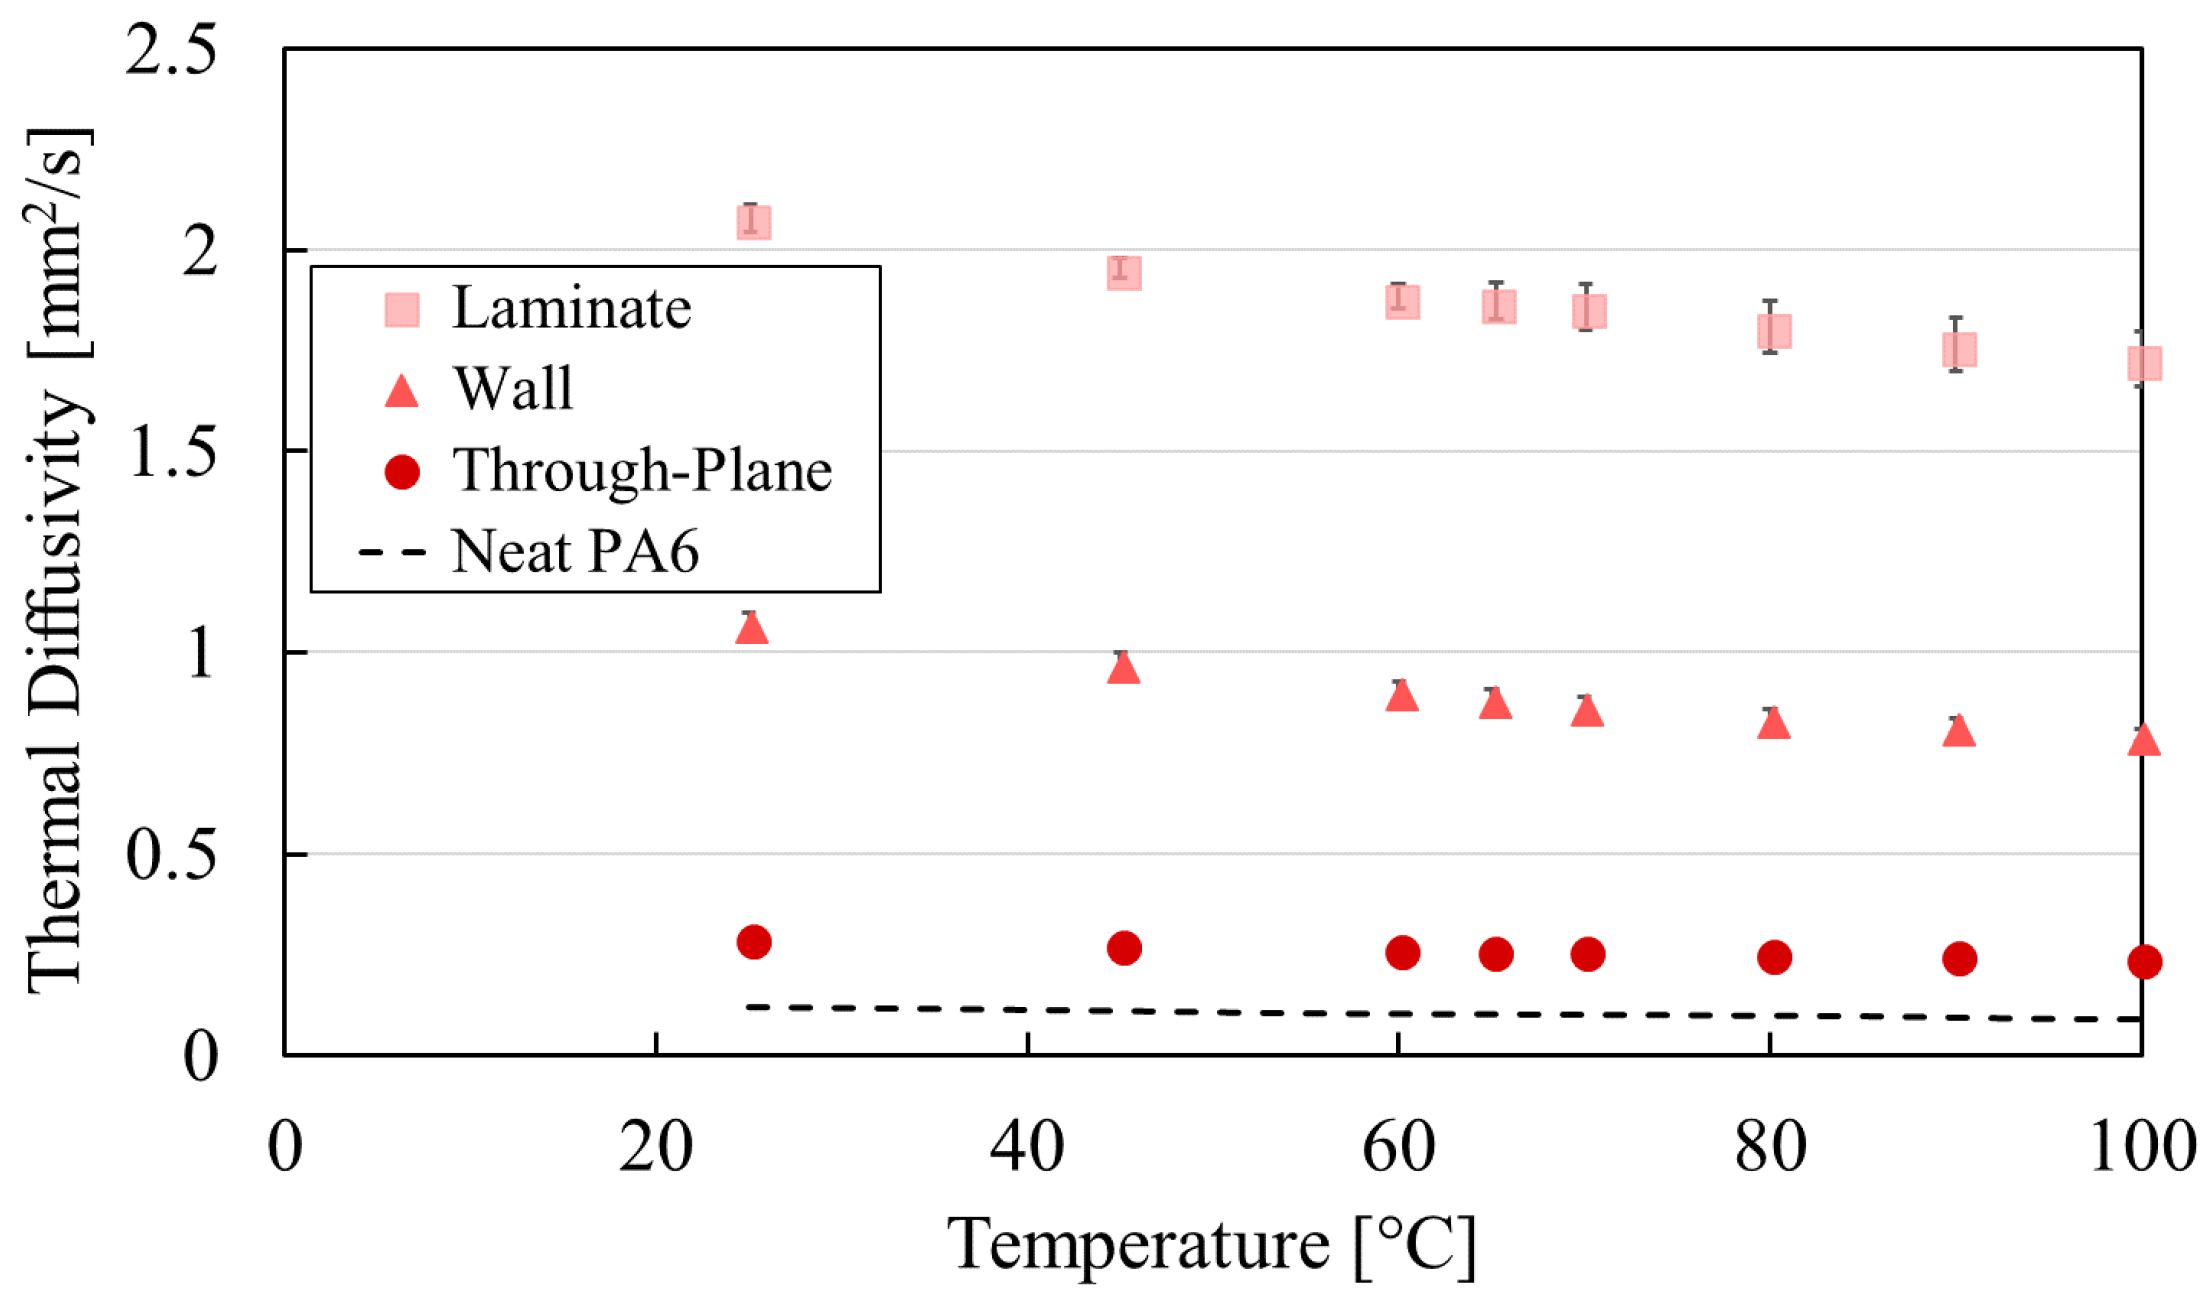
This study analyzed the thermal diffusivity in a range from 25 to 100 °C, as the working temperature for the materials was intended to be 70 °C.
The minimum testable sample size on the Nanoflash 447 LFA is a 6-mm round disc, which is much larger than an FFF filament strand of 1.75 mm or 3 mm diameter. Thus, the filament itself is not easily tested, and the thermal diffusivity must be measured on a prepared sample by printing a test bar that can be used to cut 10 mm × 10 mm × 1 mm square samples. In this case, the test bar is 60 mm × 10 mm × 1 mm. This bar is printed with all tool paths parallel to the long dimension using SciSlice, an open-source slicer developed in-house and available on GitHub [18]. The ends of the printed bar were cut and discarded, as they contain turns in the toolpath that may disrupt the fiber orientation within each printed bead. The printed bar was polished with 1000 grit sandpaper to produce a flat surface, then cut to the correct sample size. Finally, the sample was spray-coated with graphite to promote absorption of the LFA energy pulse.
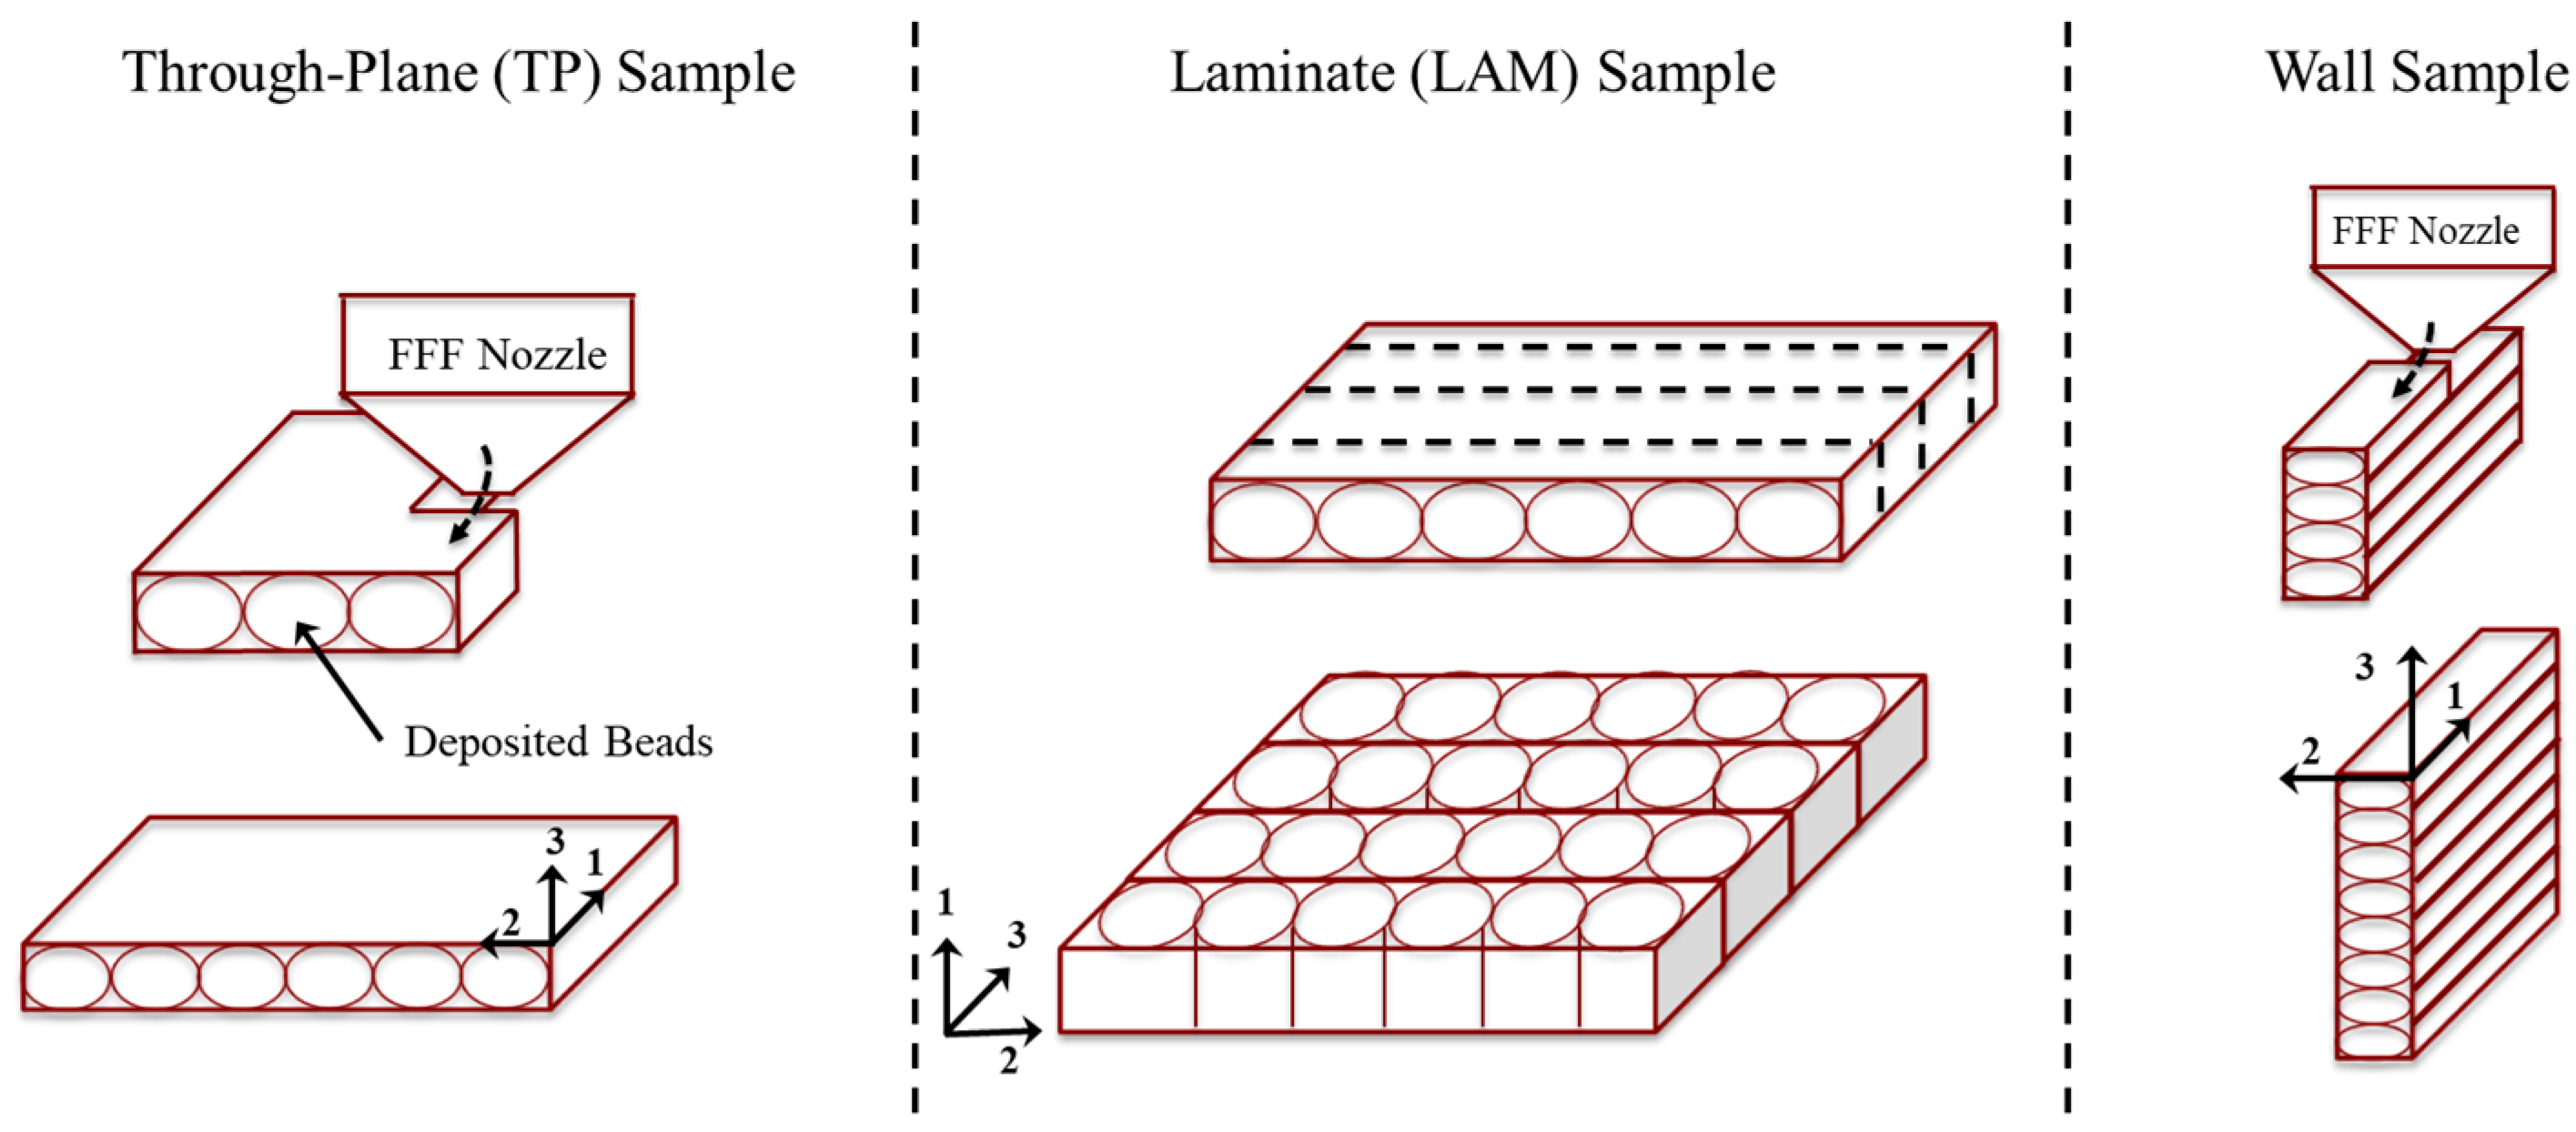
Samples produced in this way measure the thermal diffusivity perpendicular to the printhead direction (in the layer direction), therefore perpendicular to the primary fiber orientation direction. This is referred to as the through-plane (TP) direction, which is the direction through the layers of a print. To study the diffusivity parallel to the fiber orientation direction, which is referred to as the in-plane direction, the samples need to be prepared differently. Using the printed 60 mm × 10 mm × 1 mm bar, strips of dimensions 1 mm × 10 mm × 1 mm are cut with a razor blade. No additional polishing is done. Each strip is rotated 90 degrees, then placed in a sample holder with the printing direction facing the detector. The overall sample thickness was measured with a digital micrometer with the strips already in the sample holder. Now, the energy pulse travels along the length of the printed beads, and therefore along the principal fiber orientation direction. These samples are referred to as laminate (LAM) samples. Sample preparation is illustrated in Figure 2. The samples were printed with a 1-mm nozzle with an extruder temperature of 270 °C, a bed temperature of 110 °C, a layer height of 0.2 mm, an extrusion ratio of 101%, and a printhead speed of 60 mm/s. Finally, additional samples were printed to measure the crossflow thermal conductivity. Freestanding walls 20 mm long × 1 mm wide × 60 mm tall were printed with a 1-mm nozzle with an extruder temperature of 270 °C, a bed temperature of 110 °C, a layer height of 0.2 mm, an extrusion ratio of 101%, and a printhead speed of 19 mm/s. The 10 mm section of wall closest to the build plate was cut and discarded, since the build plate temperature affects this region. The remaining section was used to cut LFA samples which can be used to measure the thermal diffusivity across the width of a bead. Samples are printed this way, instead of cutting the TP samples as with LAM, because these walls are more representative of the conductivity in a thin-walled part.

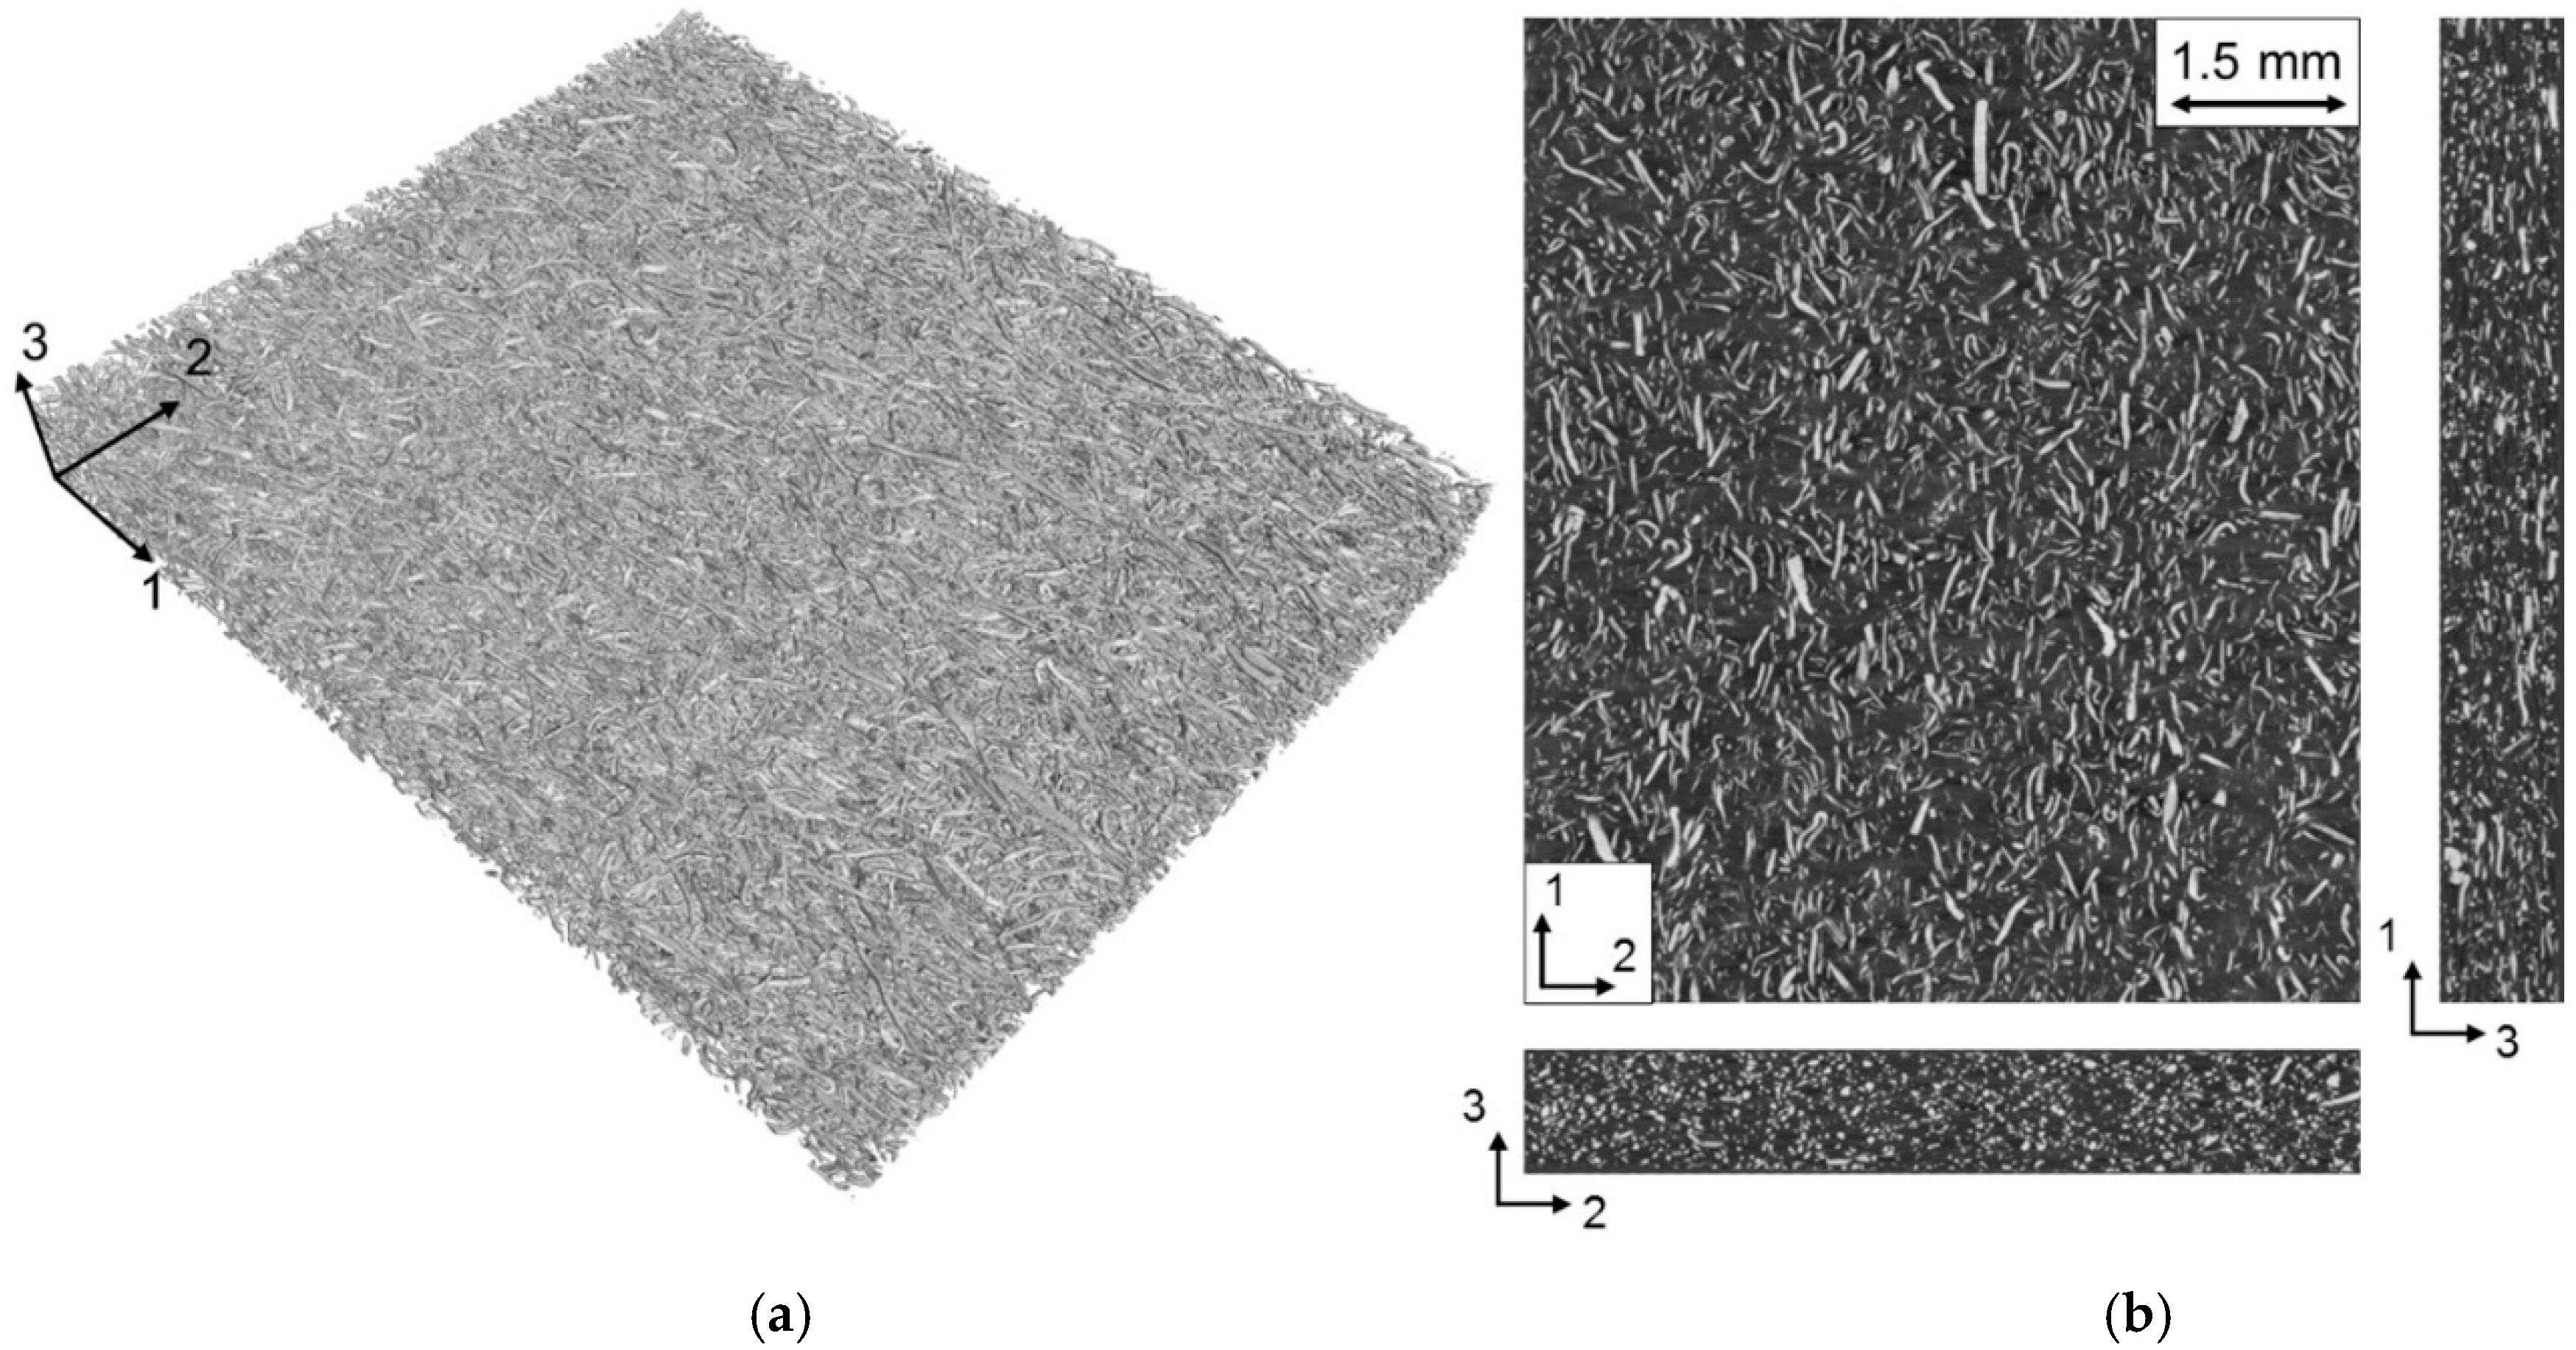
2.4. Fiber Orientation Analysis Using Microcomputed Tomography

Microcomputed tomography (µCT) is a nondestructive testing (NDT) method which allows one to obtain the internal material structure of an object and evaluate its micro-structural properties. In general, the system consists of an X-ray source, a rotating platform, and a detector. The basic principle of µCT is to irradiate a sample with penetrating X-rays, which are attenuated and captured downstream of the object with a detector system creating radiographs. At defined energy levels, the X-ray source irradiates the specimen, which is placed on a rotating platform to achieve a full scan of the sample. The detector records the attenuated X-rays as radiographs at each increment of angle during the rotation of the sample. Each captured projection (radiograph) is a two-dimensional intensity distribution of the attenuated X-rays. The intensity distribution is directly related to the material’s atomic density. A phase of high atomic density within the specimen absorbs more energy than low-density materials. The 3D reconstruction of the scanned sample is generated from all captured radiographs using tomographic reconstruction. The µCT data set can be processed using image processing algorithms for both qualitative and quantitative analyses.
The µCT scans in this work were performed with a Metrotom® 800 µCT system (Carl Zeiss® AG, Oberkochen, Germany) and the scan settings are summarized in Table 1. The fiber orientation analysis was performed using VG StudioMAX® 3.0 (Volume Graphics® GmbH, Heidelberg, Germany), which computes the fiber orientation based on the structure tensor approach [19].
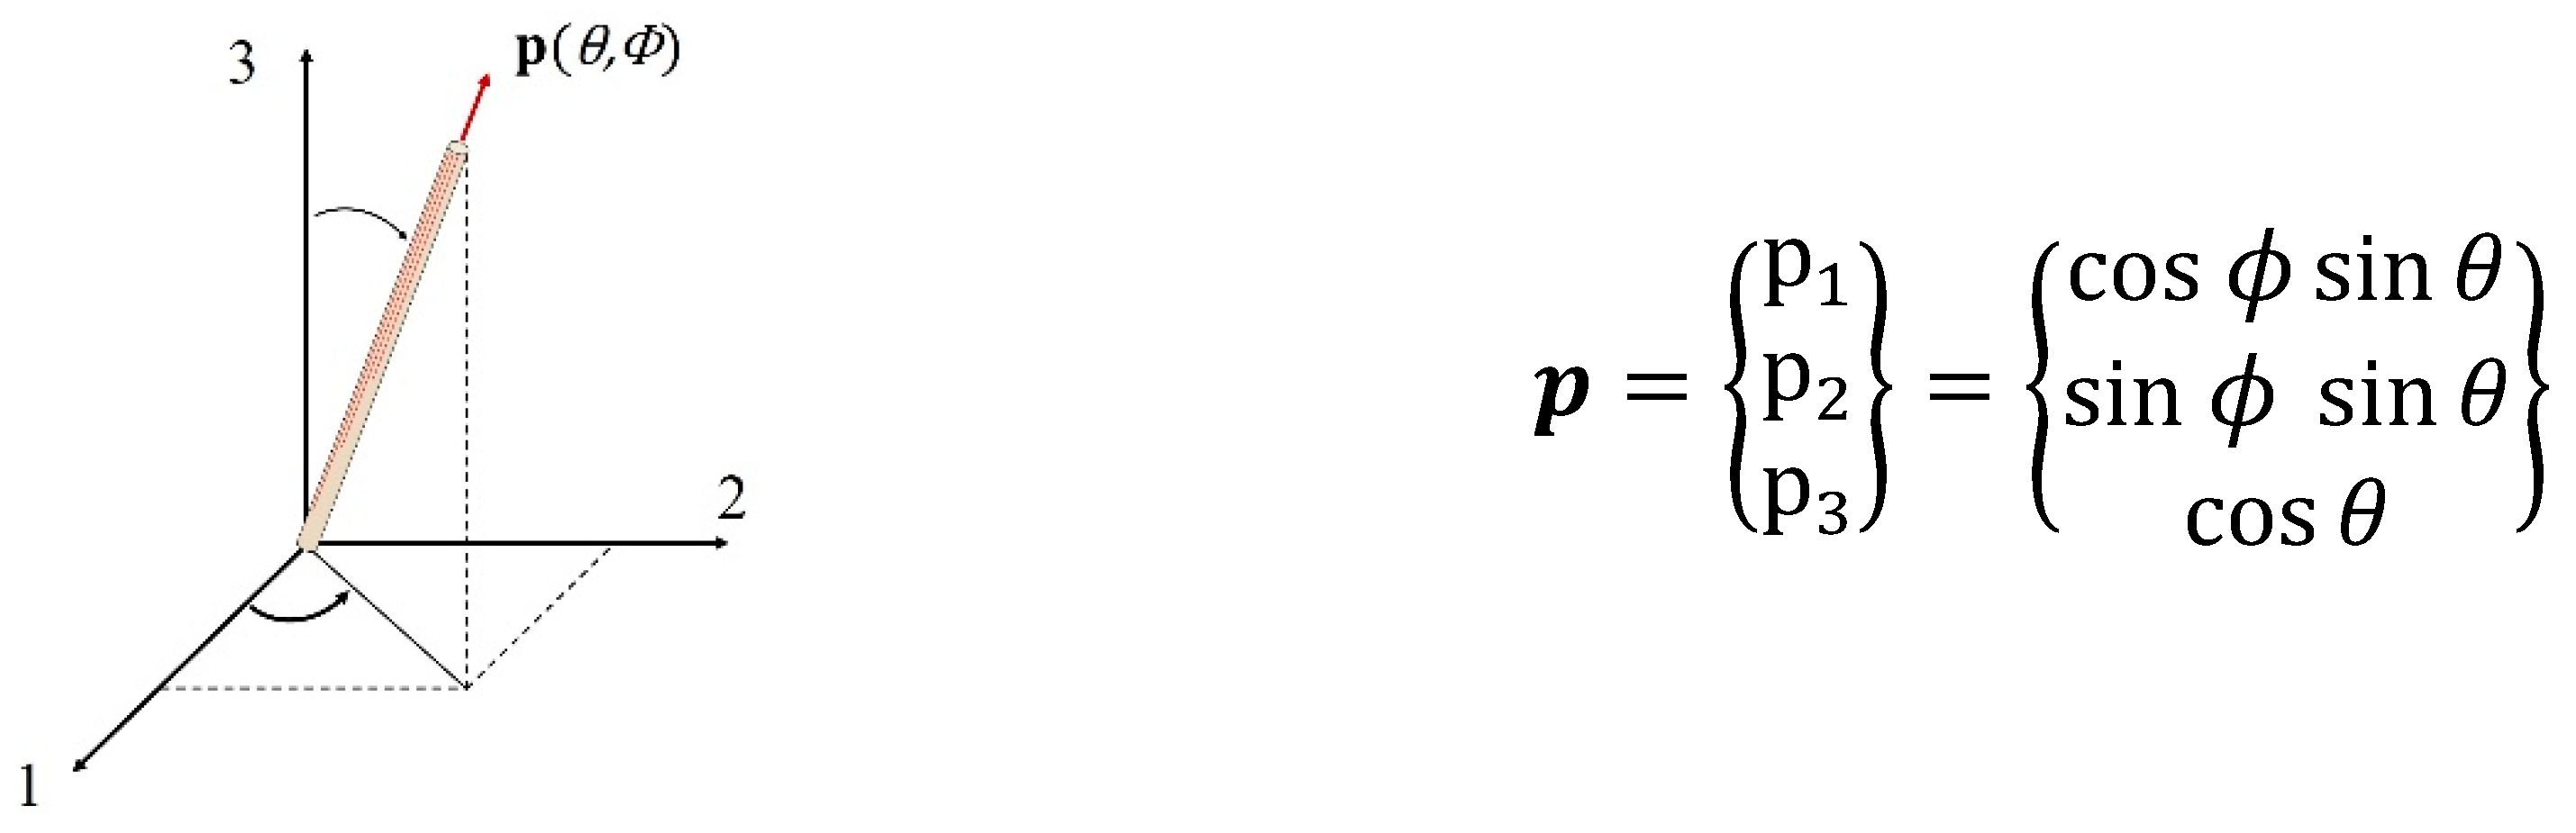
In this work, we use tensor representation proposed by Advani and Tucker [20] to describe the fiber orientation. The orientation of a single rigid fiber in three-dimensional (3D) space is described by the angle pair ( θ ,   ϕ ) , or by the unit vector p ( θ ,   ϕ ) directed along the fiber axis as shown in Figure 3.
For a fiber population in a defined volume, a complete description of the orientation is a probability density function ψ ( p ) , which describes the probability of a fiber oriented between the angles θ i and ( θ i   +   d θ ), and between ϕ i and ( ϕ i   +   d ϕ ) [9]. Advani and Tucker [20] proposed a more concise orientation of the fiber population by using a tensorial description. The Advani orientation tensor a i j computes the average orientation property of all fibers in a unit volume. The components of the symmetric second-order orientation tensor are defined as:
a i j = p i p j   ψ ( p )   d p
where p i p j is the dyadic or tensor product of the fiber orientation vector p with itself, and ( ) ψ ( p )   d p denotes an integral over all possible fiber orientations. In terms of the orientation distribution and the angle pair ( θ ,   ϕ ) , the tensor components can be calculated as follows [17]:
a 11 = cos 2   ϕ   s i n 2   θ a 12 = cos   ϕ   sin   ϕ   s i n 2   θ a 13 = cos   ϕ   s i n   θ   cos   θ
a 21 = a 12 a 22 = s i n 2   ϕ   sin 2   θ a 23 = s i n   ϕ   sin   θ   cos   θ
a 31 =   a 13 a 23 =   a 23 a 33 = cos 2   θ
where the angle brackets · indicate the average of all fibers in a volume.
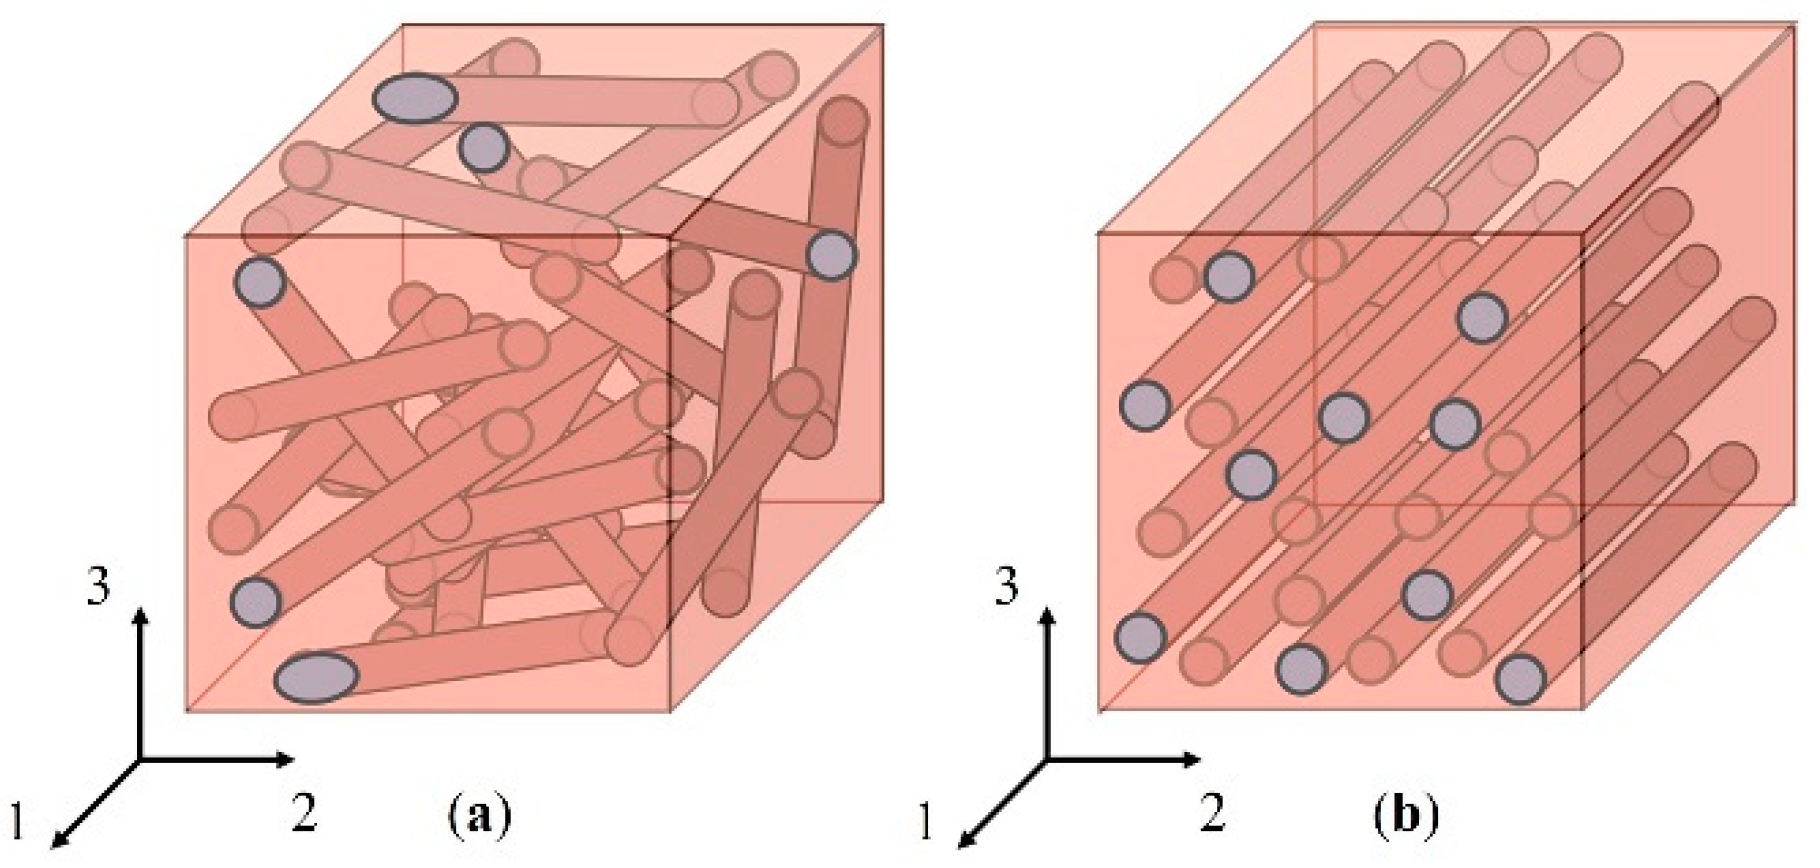
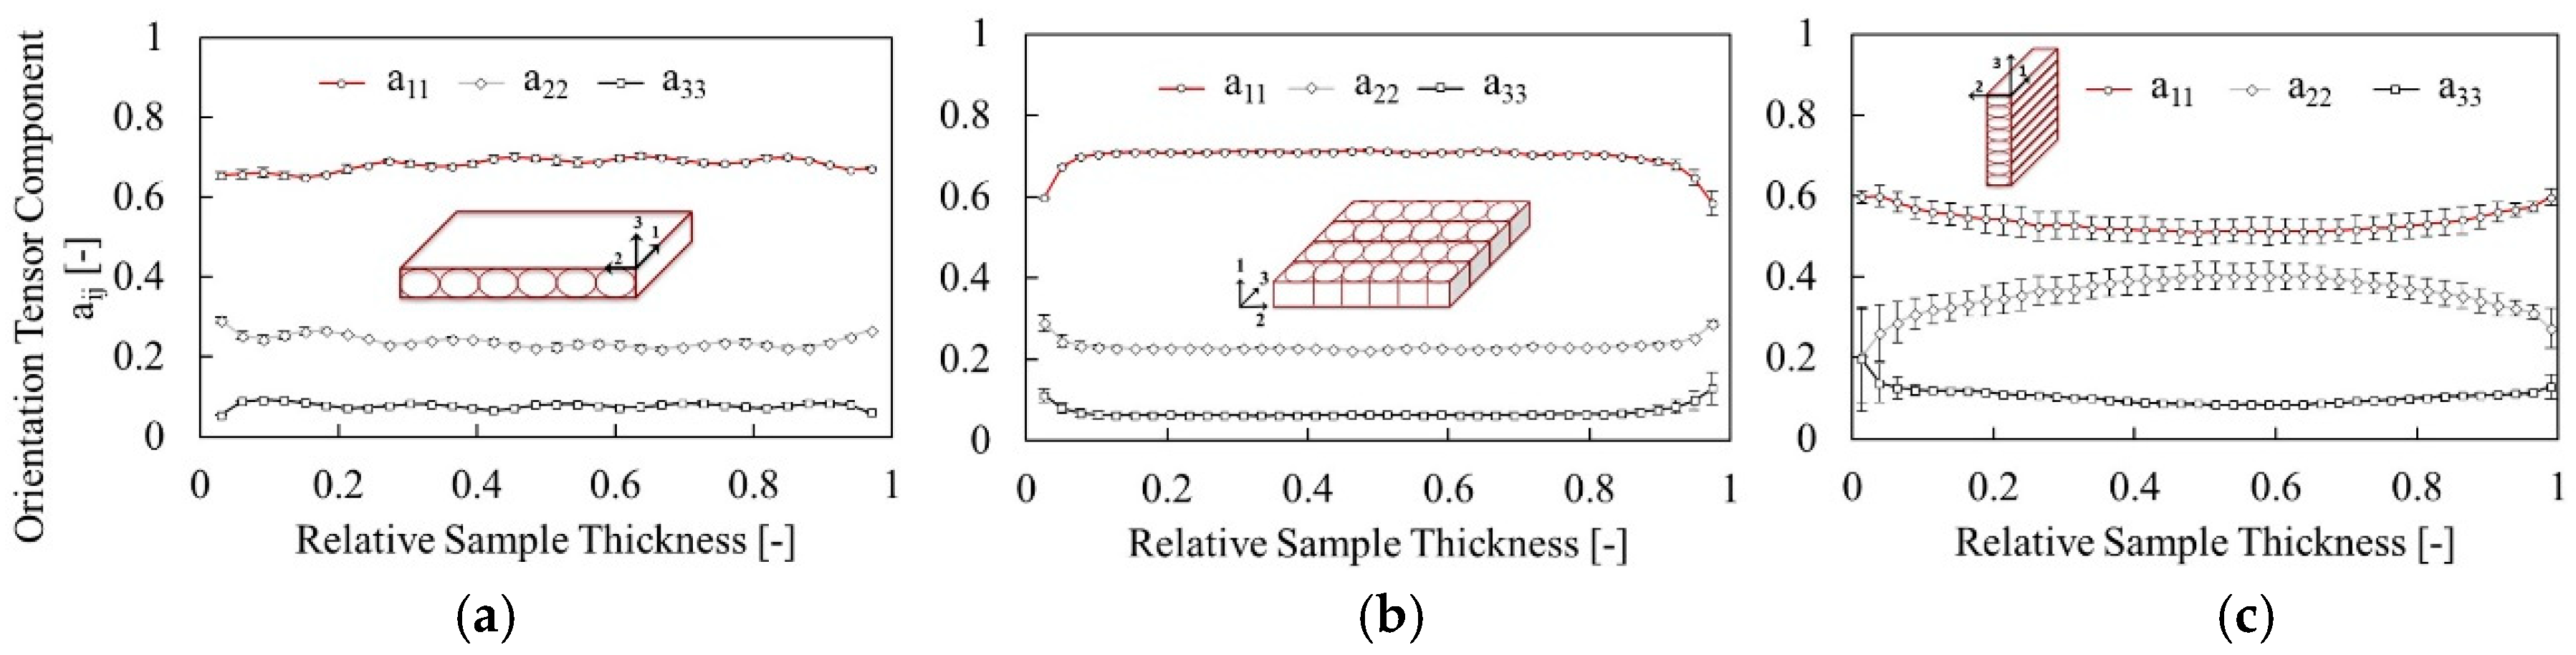
The diagonal components of the second order orientation tensor (a11, a22 and a33) describe the degree of orientation with respect to the defined coordinate system. Conventionally, the reference coordinates are defined so that the 1-direction represents the in-flow direction, the 2-direction is the crossflow direction and the 3-direction is the thickness direction. The off-diagonal components of the orientation tensor show the tilt of the orientation tensor from the coordinate axes. Hence, they are zero only if the coordinate axes align with the principal directions of the orientation tensor [20]. The physical interpretation of the tensor components focuses mainly on the diagonal components of the tensor, illustrated in Figure 4.
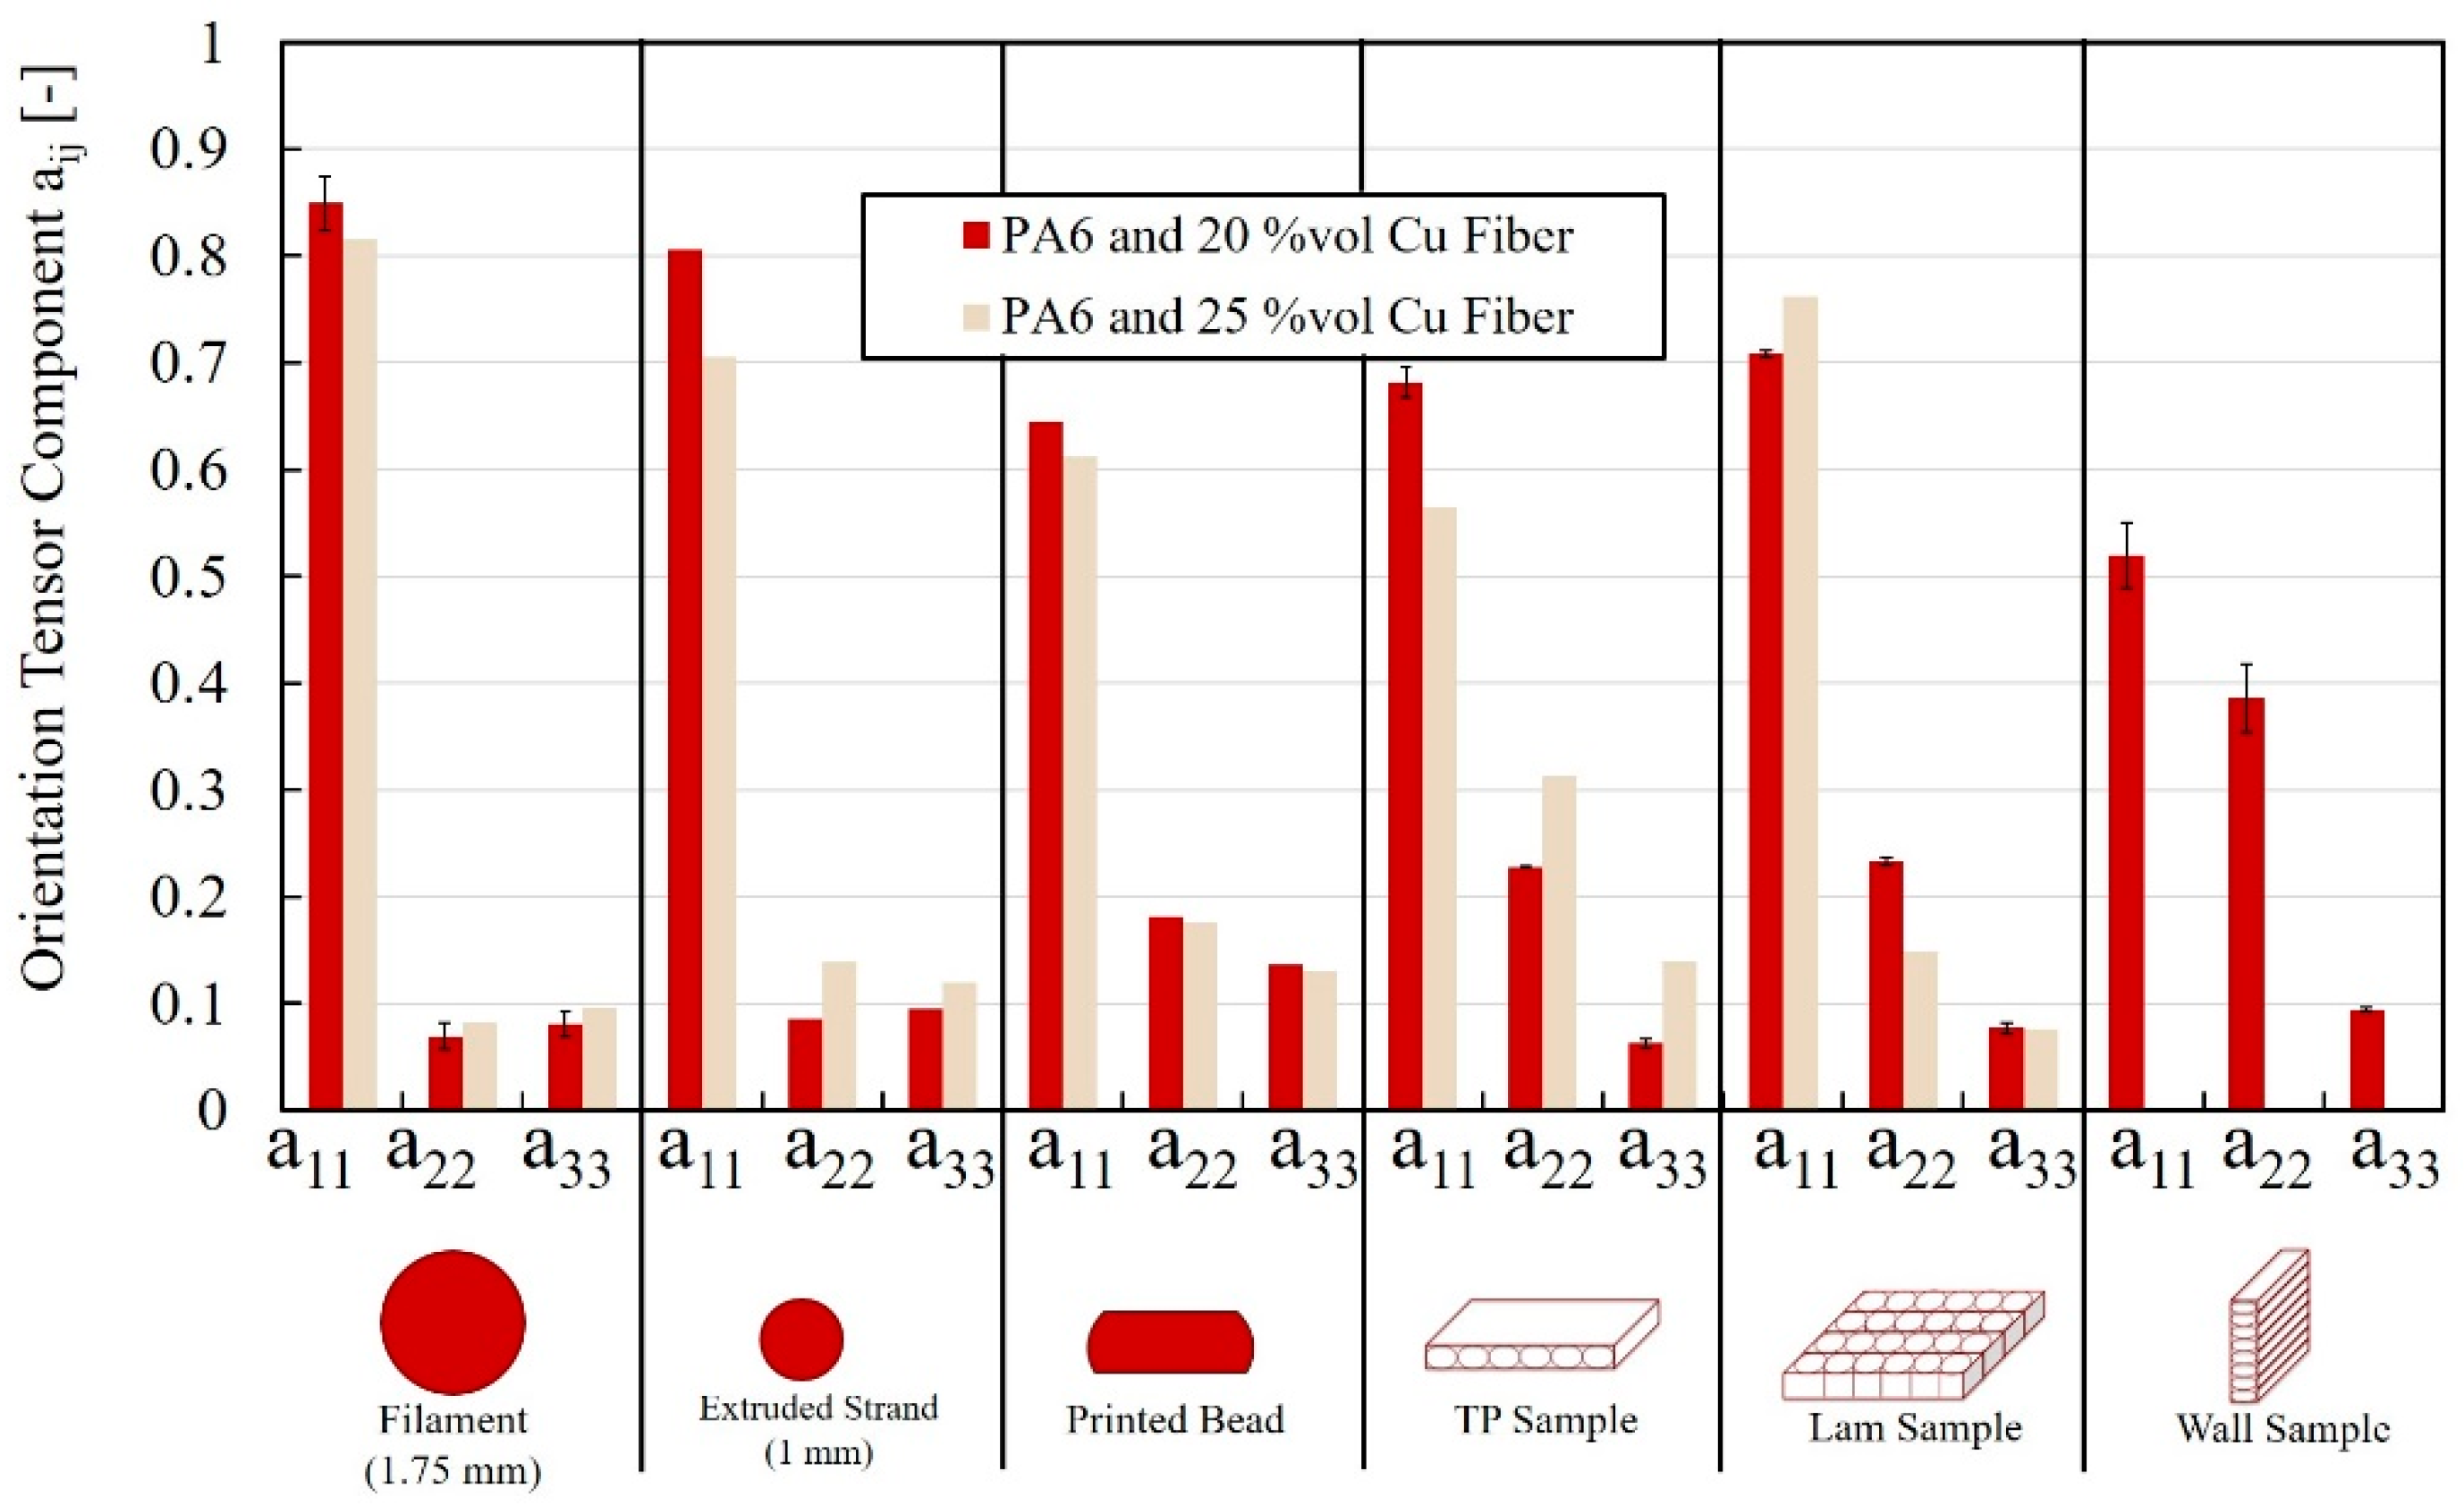
Scans of different samples were made using µCT to capture the change in orientation during processing:
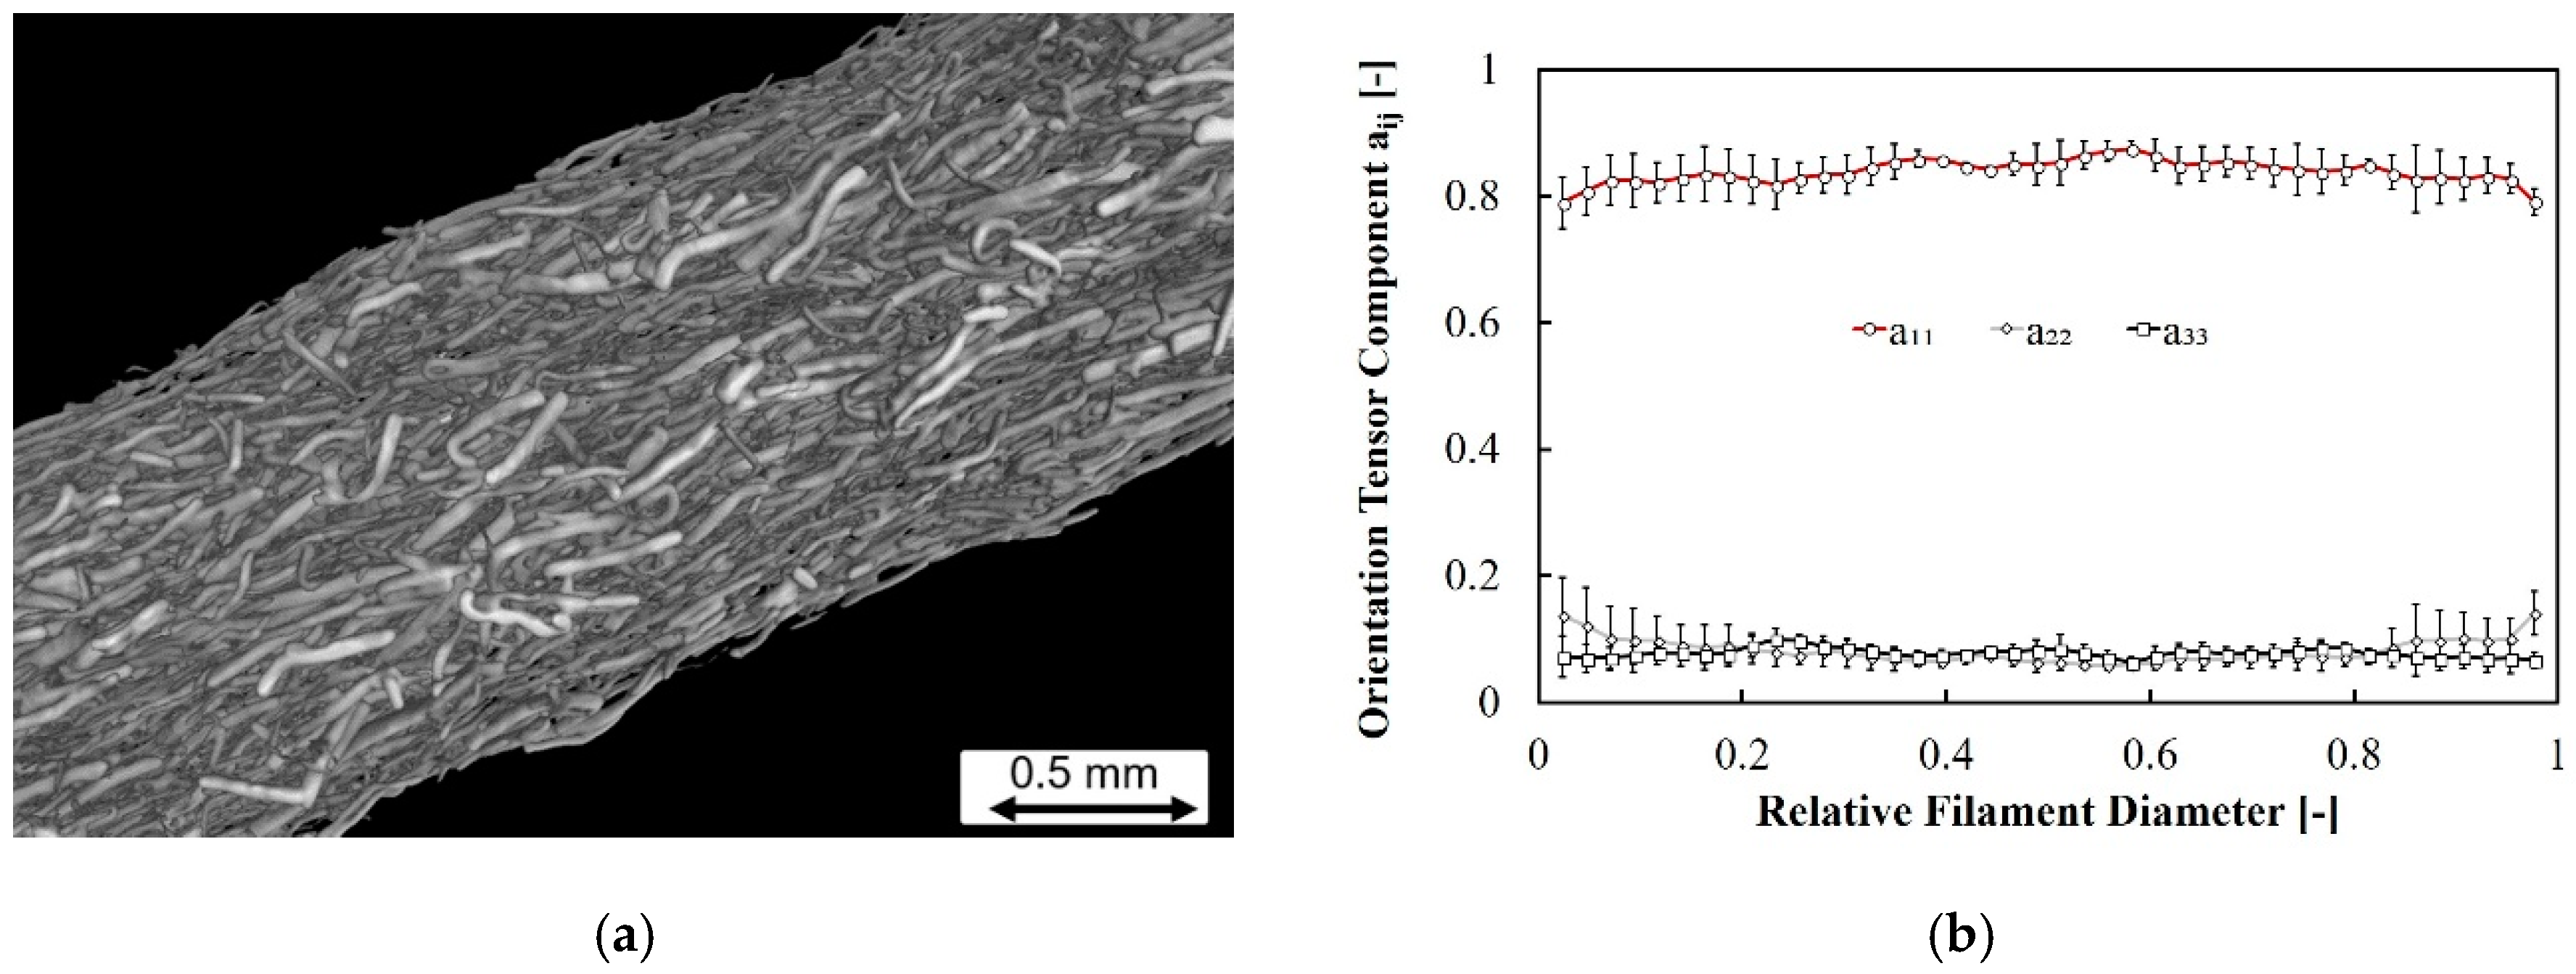
  • Strands of filament, which defines the initial orientation of the fibers;
  • Strands extruded from the 1 mm nozzle illustrating the change in fiber orientation due to shear deformations in the nozzle;
  • Single bead samples deposited on the print bed with a layer height of 0.2 mm;
  • LFA samples in the through-plane (TP, a33), wall (a22), and laminate (LAM, a11) directions. Wall samples were not tested at 25% vol copper fiber due to issues with producing quality samples at the higher filler content.
Three samples each of filament and through-plane, laminate, and wall samples were scanned for the 20% vol copper fiber material in order to understand the measurement and material variability.

3. Results

3.1. Fiber Orientation Measurements

The orientation of the copper fibers was successfully obtained from the µCT scans. Due to their isotropy and aspect ratio of 1, the orientation in the sphere-filled material was not analyzed. Figure 5a shows the 3D reconstruction of a 20% vol copper fiber-filled PA6 filament. The results of the orientation analysis are summarized in Figure 5b, which shows the degree of orientation in the extrusion direction (a11 value) and in the cross-section (a22 and a33) along the diameter of the filament. The measurements suggest a fairly constant orientation along the filament diameter with a high degree of orientation in the extrusion direction and an average tensor component value for a11 of 0.8. The orientation in the cross-section is low and random with average values for a22 and a33 of 0.1. The results correspond with the idea of fiber alignment as a function of the deformation experienced by the material. The fibers align in the shear direction (extrusion direction) during the manufacturing process. The repeatability of the measurements is very high, shown by a small standard deviation indicated as error bars in Figure 5b. Hence, the initial orientation of the copper fibers before the FFF process is known and constant throughout the compounded filament.
The 3D reconstruction and 2D slices from the µCT scan of a 20% vol copper fiber-filled PA6 through-plane (TP) sample is shown in Figure 6. The printing direction is associated with the 1-direction. As seen in the cross-section view in Figure 6b, the copper fibers can be clearly identified and qualitatively show a preferential orientation in the printing direction.
Figure 7 summarizes the quantitative results of the fiber orientation through the thickness of the through-plane (TP), laminate (LAM), and wall samples. The measurements of the TP sample suggest a preferential orientation of the fibers in the 1-direction with an average value of 0.68. The through-thickness fiber alignment (a33) is low with an average value of 0.08, and the fiber alignment perpendicular to the print direction (a22) has an average value of 0.24. These results indicate that the main fiber direction in the filament is maintained through the printing process, but it is slightly reduced from 0.8 to 0.68. The reorientation of the fibers during printing occurs mainly in the printing plane (1-2 plane) since the orientation in the through-thickness direction (a33) is reduced, the a11 is also reduced, and the a22 is increased, compared to the filament orientation. Overall, the orientation of the printed samples is uniform through the thickness.
Maintaining the coordinate system defined in Figure 2 for the prepared LAM samples, fiber orientation measurements are shown in Figure 7b. The LAM samples show fiber alignment in the thickness direction of the sample with an average value of 0.70 for a11. This shows that the fiber orientation is maintained through the preparation of the LAM by the rotation of TP sample strips. While the orientation is fairly constant throughout the sample thickness, there are some edge effects at the surfaces of the LAM sample, which can be attributed to the sample preparation leading to not perfectly uniform planes. The wall samples varied significantly from the other two types, with the a11 and a22 orientation tensor components nearly equal towards the center of the sample. Unlike the other two types, these samples are completely unconstrained at the edges, allowing the polymer to flow more into the crossflow direction and ultimately moving fibers from the 1- into the 2-direction.
The average orientation in the three axes is presented in Figure 8. Data for the filament and LFA samples were averaged from relative thicknesses between 0.2 and 0.8 to eliminate edge effects. The fiber orientation for the filament before and after passing through the 1-mm nozzle are shown on the left. The orientation in the extrusion direction decreases slightly. That principal orientation decreases further when measuring one bead deposited on the print bed. The change in fiber orientation appears higher in the 25% vol fiber material, which could be related to higher fiber-fiber interaction. However, this small difference could be attributed to scan artifacts like beam hardening caused by the fiber concentration, which results in a skewed fiber orientation calculation. The 20% vol copper fiber LAM and TP samples are nearly equal, as expected, since a LAM sample is just cut from a TP sample and turned. The standard deviations are small, from 3% in the filament to 0.7% in the laminate samples. Likewise, the orientation in the a22 direction increases from the filament to the printed TP sample, from 0.07 to 0.23 for the 20% vol copper fiber, as plotted in Figure 8. This means that the squeezing flow that occurs as material is extruded from the nozzle and flattened onto the previous layer has reoriented the fibers to some degree in this direction. This is supported by the lower a11 and higher a22 values for the wall samples. Since there are no other beads to constrain the flow, the material moves more in the crossflow direction.
The change in orientation through processing is consistent with Heller’s and Skrabala’s results [16,21], showing that orientation will decrease during the expansion due to die swell occurring after the nozzle. However, the actual flow field is more complex than simple die swell, since the material turns 90° and is deformed as it is deposited. Unfortunately, there is not much published information about the actual flow field as material is deposited on an FFF part. However, any reorientation that occurs, as suggested by these results, is positive for the wall conductivity, as discussed in the following section. Geometric changes to the nozzle could increase this effect; for example, Heller’s work suggests that lengthening the land at the nozzle exit could lead to higher perpendicular orientation [16].

3.2. Thermal Diffusivity Measurements

Figure 9 shows the thermal diffusivity for 20% vol copper fiber PA6 in the through-plane, wall, and laminate samples. As predicted, the fiber orientation in the samples has a significant effect on the thermal diffusivity. The diffusivity decreases linearly with temperature, and the laminate sample has a diffusivity about seven times larger than the through-plane sample. The same samples used for fiber orientation analysis were measured (three laminate, three wall, and three through-plane samples), and the standard deviations at different temperatures were below 4.5%, 3.3%, and 1.1%, respectively, indicating good repeatability. Since the variation in fiber orientation was very small, the larger variation in laminate sample diffusivity is probably due to variations in the cutting of the strips, leading to thickness variations.
The thermal conductivity of the materials as a function of filler content is plotted in Figure 10 for copper fiber-filled and sphere-filled PA6. As seen with the thermal diffusivity, the thermal conductivity in the fiber-filled material is highly anisotropic. For example, at 20% vol copper fiber, the conductivity in the flow direction was 5.0 W/(m·K), 2.4 W/(m·K) across the flow, and 0.75 W/(m·K) in the build direction. The large differences in thermal conductivity for different directions can lead to important design challenges for thermal products, which are discussed in more detail below.

3.3. Orientation in FFF Prints

The overall goal of this project was to produce FFF heat exchangers (HXs) printed with thermally conductive plastics. In general, air-cooled HX performance is dominated by thermal resistance on the air side, from the air into the solid. With additive manufacturing, airfoil fin arrays can be added to the air channel to enhance the heat transfer, allowing polymer HXs to compete with traditional metal designs. The HX considered here consists of air and water channels in cross-flow and can be viewed at two scales: the microstructure and the macrostructure. The air channels are filled with airfoil-shaped fins, which are separated from the water channel by a wall, as illustrated on the left in Figure 11. That microstructure is repeated many times to make the macrostructure of the HX, displayed on the right.
The process-induced fiber orientation can affect the performance of printed HXs as the toolpath will govern the principle fiber orientation direction. This presents a fundamental challenge in HX printing; the low conductivity of plastics (even filled plastics) drives the HX design to smaller and smaller features, but small features greatly constrain the possible tool paths. The two most important features in the design are the fins and the walls dividing the two fluids. The fins will ideally conduct heat from the fluid to the walls (in-plane) at a very high rate. The walls will ideally conduct heat from one fluid channel into the other (crossflow), but not conduct along the length or width of the wall (in-plane). However, the walls should be as thin as possible to minimize material use and reduce the conductive resistance, but this unfortunately leads to a lower thermal conductivity through the walls. Thin walls with a thickness of only a few beads are printed parallel to the wall, meaning the fibers orient along, not through, the wall. As illustrated in Figure 12a, the fibers are oriented in the ideal direction along the axis of the pin, but they are oriented perpendicular to the ideal direction in the walls.
A HX microstructure performance model was developed in order to simulate and optimize heat transfer. The model carries out standard HX analysis in which geometry and material properties are used to calculate thermal resistances associated with conduction resistances through the walls separating air and water channels and convection resistances in the air channel (convection resistance in the water channel is negligible). The convection heat transfer coefficient associated with flow across airfoil shaped fins was determined using computational fluid dynamics. The overall performance was calculated by finding the overall resistance to heat transfer and using the effectiveness-number of transfer units (ε-NTU) method [22]. This method employs correlations based on the flow orientation, the fluid properties, flow rates, and temperatures, and the thermal resistances to find the overall heat transfer rate.
When modeling conduction resistances and fin efficiencies, print orientation must be considered because of the fiber orientation and resulting anisotropic conductivity. The most practical way of printing the HX consists of printing the walls as perimeters and the fins as bridges. This toolpath results in the conductivities shown in Figure 12b; the conductivity parallel to bead print direction is k1 and conductivity perpendicular to bead print direction is k2.
Using that thermal model, Figure 13 shows the simultaneous effect that wall thickness, isotropic conductivity, and anisotropic conductivity have on the performance of the HX. As a function of wall thickness, the figure compares the behavior of the anisotropic conductivity of PA6-CuF-20 (4.95 W/(m·K) in-plane, 2.38 W/(m·K) crossflow, and 0.75 W/(m·K) through-plane) to three materials: a material with an isotropic conductivity of 0.75 W/(m·K), one with an isotropic conductivity of 2.38 W/(m·K), and one with an isotropic conductivity of 4.95 W/(m·K). The performance is normalized with respect to the best case. The figure demonstrates that increasing thermal conductivity leads to better performance. However, as wall thickness decreases, the performance of the anisotropic material and the lower bound isotropic material become more alike. This demonstrates the importance of the conduction resistance through the wall and how the conductivity perpendicular to bead print direction limits performance. The similarity between the 2.38 W/(m·K) case and the 4.95 W/(m·K) case demonstrates the performance-limiting effect of air-side convection resistance.

4. Conclusions

The fiber orientation in FFF filament was shown to be highly preferential in the extrusion direction. This could be analyzed and quantified with µCT analysis, displaying an average orientation as high as 0.8 in filament and 0.7 in printed parts in the principal flow direction. Consequentially, the orientation was lower in the two perpendicular directions. This anisotropy was reflected in the thermal conductivity, where the flow direction conductivity was about seven times larger than the build direction conductivity. Although the addition of fibers can increase the conductivity 19 times higher than the base resin conductivity at only 20% vol, the geometry of the printed part and the toolpath have an equally important role in the final performance, since the toolpath ultimately determines the fiber orientation in the part. While high fiber orientation leads to effective cooling fins in the analyzed air-cooled heat exchanger, the lower orientation in the walls between water and air channels also governs the performance.
The crossflow conductivity can be increased by raising the fiber content; however, a 1-mm FFF nozzle already experienced clogging at 25% vol copper fiber content, implying that higher fiber content is not possible for this filler. The relationships between filler size, shape, and content on FFF nozzle clogging and on the composite thermal conductivity is essential for optimizing the HX performance with the given manufacturing restrictions.
As additive manufacturing slowly starts to become feasible for serial production, continued development and functionalization of materials is essential. Fiber-filled plastics have significant benefits, including thermal and electrical conductivity, so it is essential to advance machine design and manufacturing techniques to take advantage of the materials for new applications.

Author Contributions

Conceptualization—T.M., T.A.O. and N.R.; Investigation—T.M., S.G. and J.B.; Writing—original draft, T.M., S.G. and J.B.; Writing—review & editing—T.M., S.G., J.B., T.A.O. and N.R.

Funding

The research was done at the University of Wisconsin-Madison. The information, data, or work presented herein was funded in part by the Advanced Research Projects Agency-Energy (ARPA-E), U.S. Department of Energy, under Award Number DE-AR0000573. The views and opinions of authors expressed herein do not necessarily state or reflect those of the United States Government or any agency thereof.

Conflicts of Interest

The authors declare no conflict of interest.

References

  1. Murr, L.E. A metallographic review of 3D printing/additive manufacturing of metal and alloy products and components. Metallogr. Microstruct. Anal. 2018, 7, 103–132. [Google Scholar] [CrossRef]
  2. Brenken, B.; Favaloro, A.; Barocio, E.; Denardo, N.M.; Kunc, V.; Pipes, R.B. Fused deposition modeling of fiber-reinforced thermoplastic polymers: Past progress and future needs. In Proceedings of the American Society for Composites 31st Technical Conference and ASTM Committee D30 Meeting, Williamsburg, VA, USA, 19–22 September 2016; pp. 1–14. [Google Scholar]
  3. Osswald, T.A.; Menges, G. Materials Science of Polymers for Engineers, 3rd ed.; Carl Hanser Verlag: Munich, Germany, 2012. [Google Scholar]
  4. Nikzad, M.; Masood, S.H.; Sbarski, I. Thermo-mechanical properties of a highly filled polymeric composites for fused deposition modeling. Mater. Des. 2011, 32, 3448–3456. [Google Scholar] [CrossRef]
  5. T’Joen, C.; Park, Y.; Wang, Q.; Sommers, A.; Han, X.; Jacobi, A. A review on polymer heat exchangers for HVAC&R applications. Int. J. Refrig. 2009, 32, 763–779. [Google Scholar]
  6. Agari, Y.; Uno, T. Thermal conductivity of polymer filled with carbon materials: Effect of conductive particle chains on thermal conductivity. J. Appl. Polym. Sci. 1985, 30, 2225–2235. [Google Scholar] [CrossRef]
  7. Amesöder, S. Wärmeleitende Kunststoffe für das Spritzgießen. Ph.D. Thesis, Universität Erlangen-Nürnberg, Erlangen, Germany, 2010. [Google Scholar]
  8. Jeffrey, G.B. The motion of ellipsoidal particles immersed in a viscous fluid. Proc. R. Soc. Lond. A 1922, 102, 161–179. [Google Scholar] [CrossRef]
  9. Folgar, F.; Tucker, C.L. Orientation behavior of fibers in concentrated suspensions. J. Reinf. Plast. Compos. 1984, 3, 98–119. [Google Scholar] [CrossRef]
  10. Heinle, C. Simulationsgestätzte Entwicklung von Bauteilen aus Wärmeleitfähigen Kunststoffen. Ph.D. Thesis, Universität Erlangen-Nürnberg, Erlangen, Germany, 2012. [Google Scholar]
  11. Goris, S.; Osswald, T.A. Fiber orientation measurements using a novel image processing algorithm for micro-computed tomography scans. In Proceedings of the 15th SPE Automotive Composites Conference & Exhibition, Novi, MI, USA, 9 September 2015. [Google Scholar]
  12. Foss, P.H.; Tseng, H.-C.; Snawerdt, J.; Chang, Y.-J.; Yang, W.-H.; Hsu, C.-H. Prediction of fiber orientation distribution in injection molded parts using Moldex3D simulation. Polym. Compos. 2014, 35, 671–680. [Google Scholar] [CrossRef]
  13. Vélez-Garcia, G.M.; Wapperom, P.; Baird, D.G.; Aning, A.O.; Kunc, V. Unambiguous orientation in short fiber composites over small sampling area in a center-gated disk. Compos. Part A Appl. Sci. Manuf. 2012, 43, 104–113. [Google Scholar] [CrossRef]
  14. Sun, X.; Lasecki, J.; Zeng, D.; Gan, Y.; Su, X.; Tao, J. Measurement and quantitative analysis of fiber orientation distribution in long fiber reinforced part by injection molding. Polym. Test. 2015, 42, 168–174. [Google Scholar] [CrossRef]
  15. Gandhi, U.; Sebastian, D.B.; Kunc, V.; Song, Y. Method to measure orientation of discontinuous fiber embedded in the polymer matrix from computerized tomography scan data. J. Thermoplast. Compos. Mater. 2016, 29, 1696–1709. [Google Scholar] [CrossRef]
  16. Heller, B.P.; Smith, D.E.; Jack, D. Effect of extrudate swell, nozzle shape, and convergence zone on fiber orientation in fused deposition modeling nozzle flow. In Proceedings of the Solid Freeform Fabrication, Austin, TX, USA, 10 August 2015; pp. 1220–1236. [Google Scholar]
  17. Bernasconi, A.; Cosmi, F.; Hine, P.J. Analysis of fibre orientation distribution in short fibre reinforced polymers: A comparison between optical and tomographic methods. Compos. Sci. Technol. 2012, 72, 2002–2008. [Google Scholar] [CrossRef]
  18. Van Hulle, L. “SciSlice”, GitHub. 2017. Available online: https://github.com/VanHulleOne/SciSlice. (accessed on 21 June 2017).
  19. Krause, M.; Hausherr, J.M.; Burgeth, B.; Herrmann, C.; Krenkel, W. Determination of the fibre orientation in composites using the structure tensor and local X-ray transform. J. Mater. Sci. 2010, 45, 888–896. [Google Scholar] [CrossRef]
  20. Advani, S.G.; Tucker, C.L. The use of tensors to describe and predict fiber orientation in short fiber composites. J. Rheol. 1987, 31, 751–784. [Google Scholar] [CrossRef]
  21. Skrabala, O. Wärmeleitfähige Kunstoffe: Verarbeitungsinduzierte Eigenschaftsbeeinflussung und Deren Numerische Vorhersage. Ph.D. Thesis, Universität Stuttgart, Stuttgart, Germany, 2016. [Google Scholar]
  22. Nellis, G.F.; Klein, S.A. Heat Transfer, 1st ed.; Cambridge University Press: New York, NY, USA, 2009. [Google Scholar]
Figure 1. The screw configuration included two mixing zones for compounding the fillers.
Jcs 02 00045 g001
Figure 2. Illustration of laser flash analysis (LFA) sample preparation. From left to right, the sample is printed and a through-plane (TP) sample is scanned through the thickness. The same sample may be cut, and each strip is rotated, making a laminate (LAM) sample, which is also scanned through the thickness. Other samples are printed as walls to scan across the bead width. The 1-direction is the principal fiber orientation direction and the printing direction. The 2-direction is the crossflow, and the 3-direction is the through-plane or build direction.
Jcs 02 00045 g002
Figure 3. Representation of the orientation of a single rigid fiber by the vector p ( θ ,   ϕ ) .
Jcs 02 00045 g003
Figure 4. Orientation of a fiber population within a volume: (a) randomly oriented fibers and (b) aligned fibers.
Jcs 02 00045 g004
Figure 5. (a) 3D reconstruction of a PA6 and 20% vol copper fiber filament strand; (b) the measured fiber orientation distribution where a11 is the orientation in the extrusion direction, and a22 and a33 are the orientation in the cross-section.
Jcs 02 00045 g005
Figure 6. Illustration of fiber alignment in the through-plane (TP) samples: (a) 3D reconstruction and (b) 2D cross-sectional views.
Jcs 02 00045 g006
Figure 7. Fiber orientation for printed samples: (a) through-plane (TP) sample, (b) laminate (LAM) sample, and (c) wall sample.
Jcs 02 00045 g007
Figure 8. Average orientation components in material after processing for PA6 with 20 and 25% vol copper fiber.
Jcs 02 00045 g008
Figure 9. The thermal diffusivity decreases with temperature in the 20% vol copper fiber material. Standard deviations are imperceptibly small in most cases.
Jcs 02 00045 g009
Figure 10. Thermal conductivity at 70 °C in the flow direction is many times higher than the through-plane direction. Sphere-filled PA6 performs about the same as the fibers through-plane.
Jcs 02 00045 g010
Figure 11. Cross-flow HX configuration displaying (a) airfoil pins in the microstructure; (b) the overall crossflow HX macrostructure.
Jcs 02 00045 g011
Figure 12. (a) Illustration of a fin between two walls showing the fiber orientation. (b) Cross-section of plate fin geometry with anisotropic conductivity orientations k1 (aligned with fibers) and k2 (perpendicular to fibers).
Jcs 02 00045 g012
Figure 13. Effect of wall thickness, conductivity, and anisotropy on normalized performance.
Jcs 02 00045 g013
Table 1. Zeiss Metrotom® 800 scan parameters.
ParameterValue
Voltage (kV)50
Current (μA)80
Integration Time (ms)1000
Gain (-)8.0
Spot Size (µm)5.0
Voxel Size (µm)5.0

