Article

Development of TPMS Lattice Substrates for Catalytic Cracking Applications via Fused Filament Fabrication


by
Rubén Dorado-Vicente
*,
Eloísa Torres-Jiménez
,
Laura Robles-Lorite
and
Fernando Cruz-Peragón
Department of Mechanical and Mining Engineering, University of Jaén, 23071 Jaén, Spain
*
Author to whom correspondence should be addressed.
J. Compos. Sci. 2026, 10(8), 432; https://doi.org/10.3390/jcs10080432
Submission received: 9 July 2026 / Revised: 31 July 2026 / Accepted: 5 August 2026 / Published: 16 August 2026
(This article belongs to the Special Issue Lattice Structures)

Abstract

The advancement of catalytic substrates through Additive Manufacturing (AM) offers notable benefits over conventional techniques, particularly for producing intricate three-dimensional forms that enable precise control over pore dimensions and surface characteristics. These attributes play a vital role in improving catalytic efficiency, which is evaluated by measuring pressure drop and mass transfer. This research focuses on the design and manufacture of a monolithic ceramic filter for catalytic cracking. The monoliths under study have a Triply Periodic Minimal Surface (TPMS) lattice. A macroporosity of about 65% is the criterion used to model the structures, and the TPMS unit cell length is the design parameter to achieve that porosity. Adapting a conventional Fused Filament Fabrication (FFF) desktop to use alumina filament, we produced samples based on three TPMS types: Schwar-Primitive (SP), Schoen Gyroid (SG), and Schwarz-Diamond (SD), which, after a plastic debinding process and subsequent sintering, resulted in meso-scale porous structures. The samples showed relative dimensional errors below 5% and a real total porosity of around 70%, with a maximum difference of 4% among the TPMS types. Because the printed SP lattices have the lowest unit cell length and real porosity, their pressure drop measurements were higher than those of the SG and SD. The opposite occurred with the estimated permeability. Although yielding similar pressure drop results, printed SG lattices had greater permeability than SD; therefore, in terms of monolith fluid dynamics, the SG lattice is the preferred geometry.

1. Introduction

The rapid development and fabrication of complex structures is now achievable through Additive Manufacturing (AM). AM can enhance the design of new topology-optimized substrates for catalysis, based, for example, on Triply Periodic Minimal Surfaces (TPMSs). TPMSs represent a transformative approach for producing advanced catalytic supports [1]. These surfaces offer precise control over porous architectures, allowing for the simultaneous optimization of heat transfer, mass transport, and mechanical stability [1]. Numerous studies on the use of TPMS in thermal management [2], biomedical applications [3] and mechanical engineering [4] have demonstrated their superior heat and mass transfer coefficients, as well as enhanced mechanical properties (such as high energy absorption and uniform stress distribution) compared to conventional geometries like truss-based lattices.
Considering the specific application to catalytic cracking of pyrolysis vapors, AM substrates promise low pressure drop and improved performance [5]. Plastic pyrolysis is a plastic-to-fuel pathway that involves heating plastic waste in the absence of oxygen to produce transport fuels. While conventional pyrolysis faces environmental scrutiny, it offers significant potential to mitigate plastic pollution and can play an important role in replacing traditional fuels in hard-to-decarbonize sectors such as aviation and maritime transportation. To further optimize this process, two-stage pyrolysis separates the thermal and catalytic phases consecutively, thereby addressing the limitations of single-stage thermal or in situ catalytic pyrolysis by enhancing hydrocarbon selectivity and protecting the catalyst [6,7,8].
While two-stage ex situ catalytic pyrolysis offers numerous advantages, the optimal design of the catalytic stage warrants further attention. Conventional packed-bed configurations present a critical trade-off, where achieving high catalytic conversion efficiency must be balanced against maintaining a low pressure drop [5]. Additionally, these setups are susceptible to clogging when processing heavy pyrolysis oils [6]. According to Bai et al. [1], heterogeneous catalytic cracking is severely constrained by coke formation in flow stagnation zones, endothermic heat-transfer resistance, and thermal fatigue during high-temperature cycling. While traditional supports suffer from stress concentrations and structural instability, TPMS architectures address these transport and degradation bottlenecks through zero mean curvature ( H = 0 ) and continuous 3D channel networks. This topology eliminates internal dead zones to suppress coking, uniformly distributes thermal-mechanical stresses to prevent washcoat spallation under cyclic loads, and continuously disrupts boundary layers to enhance convective transport.
There are examples of catalysts produced by different AM processes [9] and material extrusion technologies: Direct Ink Writing (DIW) is the primary method, and, to a lesser extent, Fused Filament Fabrication (FFF) plus catalyst coating are among the preferred solutions.
DIW can produce a catalytic lattice using self-curing pastes made from catalyst materials, such as zeolites, combined with a binder. This technique enables high solid concentration [10] and low shrinkage, making it a robust AM solution for producing structured heat-resistant filters. Several studies are exploring this approach. For instance, Li et al. [11] examined the performance of two types of 3D-printed zeolite grids for the catalytic cracking of n-hexane. DIW-printed catalysts were tested by Lawson et al. [12] for the reforming of hexane into light olefins. To produce the filter, they developed a high-solids-concentration slurry composed of insoluble oxides and H-ZSM-5 zeolite. More recently, Luzzi et al. [13] developed a multi-criteria metric to identify the optimal ink composition for constructing a 13X zeolite monolith designed for a specific gas-treatment application.
Interest in FFF approaches stems from several reasons: reproducibility in monolith production is high with FFF because conventional desktop machines can be used, and commercial filaments with advanced ceramic loadings yield parts with good mechanical properties. Further, FFF has greater capacity than DIW to obtain TPMS structures. To obtain a catalyst by means of FFF, a filament with a ceramic load (alumina or zirconia) is heated and extruded to form the filter structure (monolith), and the substrate surface is coated with an active phase (depending on the application) by impregnation.
While the existing literature on TPMS predominantly investigates individual physical domains, such as hydrodynamic transport or additive fabricability, in isolation, holistic investigations that integrate topological geometry, Additive Manufacturing constraints, thermal-fluid dynamics, and catalytic reaction kinetics remain scarce, as highlighted in recent reviews [14]. Notable recent examples of studies on the physical properties include the assessment of the geometry and chemical composition of coated zirconia simple-shaped substrates performed by Car et al. [15], and the study by Bhandari et al. [16] on fast debinding and sintering. Anil and Nadimpalli [17] demonstrated that tailoring FDM internal toolpath architectures (line, gyroid, and honeycomb) and infill densities in 3YSZ ceramics enables dynamic tuning of dielectric permittivity while simultaneously optimizing structural performance. Hamza et al. [18] developed a reactive post-processing liquid-phase infiltration route for FFF ceramic TPMS lattices, successfully increasing solar spectral absorptance. Regarding catalysis applications, the recent review by Pakov et al. [14], although mainly centered on metal powder bed fusion techniques, discusses the mechanical engineering, chemical process intensification, materials science, and computational transport physics domains of TPMS catalyst supports. This review highlights that most published studies focus discretely on either numerical flow-field optimization or material characterization, and that a holistic approach is rarely adopted.
This work focuses on the FFF approach to obtain TPMS substrates suitable for catalytic cracking, which stands out as an integrative study that analyzes the modeling and fabrication stages and discusses actual fluid-dynamics measurements. Hence, we detail the monolith design to achieve a specific macroporosity suitable for the selected application. Furthermore, we address the adjustments made to the fabrication process using a conventional desktop FFF printer to overcome technological challenges, such as printing at low temperatures and the debinding and sintering procedures, which are critical for producing functional substrates. The TPMS structures are characterized by estimating their specific surface area and macroporosity using a function implemented in the scientific software Mathematica (Version 14). The accuracy of the manufacturing procedure is validated through evaluations of shrinkage, porosity, overall dimensions, as well as wall thickness, and critical cell window measurements. Finally, the adequacy of the manufactured samples for the catalytic application is evaluated by measuring the pressure drop and permeability using an in-house test bench.
Section 2 details the design of the TPMS structures and describes the experimental procedures, materials, and equipment used. Section 3 presents the numerical and experimental results and discusses the findings. Finally, Section 4 summarizes the main conclusions.

2. Materials and Methods

2.1. TPMS: Types and Design

In this study, we develop TPMS monoliths of various shapes to serve as cracking filters with controlled porosity and specific surface area. The structural geometries enabled by AM are unlimited; among the different options, TPMS has the following characteristics: minimal (zero-mean-curvature) surfaces that are periodic in 3 spatial directions, and it stands out for catalyst applications [5]. These surfaces maximize the surface-to-volume ratio and, therefore, enhance chemical reactions and mass and heat transport [19]. Moreover, they divide the space into two non-intersecting domains of continuous channels, which are ideal for heat and fluid transport and have adequate mechanical resistance [20]. The mathematical model of TPMS enables control of parameters such as porosity and tortuosity, which are key to defining the reaction time and the pressure drop, variables that influence catalyst performance.
To model the TPMS geometries, we use the level-set approximation, in which implicit representations are defined by truncating Fourier series and setting the resulting functions equal to a constant level. While this level-set formulation is not the standard approach in conventional Computer-Aided Design (CAD) software, it avoids the complexities of parametric representations, which entail intensive offset computations and are restricted to a limited selection of TPMS geometries.
Figure 1 shows a unit cell (7 × 7 × 7 mm3) for the three TPMS evaluated in this work: Schwarz-Primitive (SP), Schoen Gyroid (SG), and Schwarz-Diamond (SD). From the currently known 100 TPMS, most applications use SP, SG, and SD geometries [21]. Among the reasons explaining the interest in SD, SP, and SG architectures, it is worth mentioning their simple mathematical formulations and low variation in Gaussian curvature [22], which yield smooth, quasi-self-supporting surfaces. Topologically, they are interconnected through the Bonnet transformation angle (θ), evolving from SD (θ = 0°, tetrahedral channels) to SG (θ ≈ 38.01°, spiral channels) and SP (θ = 90°, cubic channels). These distinct channel topologies directly govern mass/heat transfer efficiency, fluid dynamics, and mechanical stability, making comparative performance analysis essential for identifying the optimal geometry for a specific application.
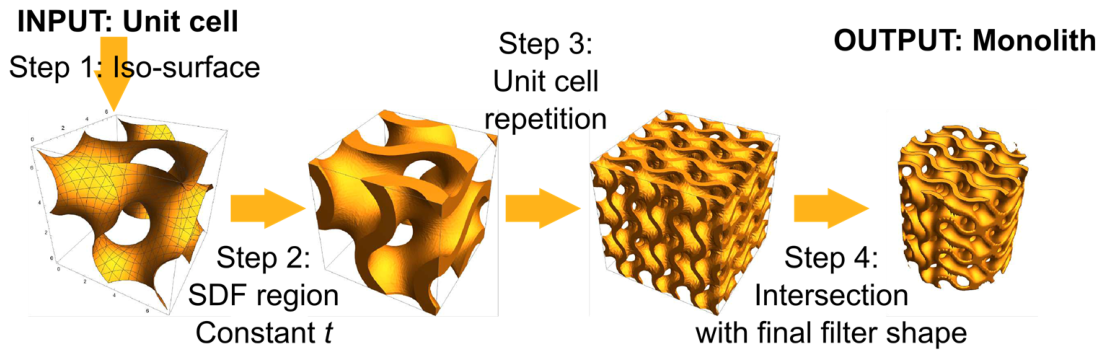
The aforementioned representation provides a surface; however, a solid must be manufactured. There are two options: defining a thickness that leads to sheet TPMS, or filling one of the TPMS domains to produce a skeleton (strut or solid network) TPMS [19]. Sheets have a higher active surface area than skeleton TPMS, and the porosity can be easily controlled; therefore, we focused on this type of lattice. In this sense, we use the procedure described in Figure 2 as follows:
  • Determine the unit-cell iso-surface using the implicit representation at c = 0.
  • To maintain a constant thickness, define a Signed Distance Function (SDF) with the iso-surface at c = 0 and solid within the cell thickness t:
    S D F t 2 ,
    noting that Equation (1) produces a sheet TPMS with near-constant thickness, and that it is difficult to control with the implicit representation.
  • The unit cell is repeated in space, producing a lattice R that fills the convex hull that contains the final filter region RF.
  • Compute the final lattice F as the Boolean intersection of RF and R. It is a straightforward calculation using their SDF representations: F = Max[SDF(R), SDF(RF)].

2.2. Materials and Manufacturing Procedure

Filter monoliths were manufactured using the Zetamix filament (Nanoe, Ballainvilliers, France) with a diameter of 1.75 mm and a plastic matrix composed of a polyolefin-based binder system, loaded with approximately 75.5% alumina by weight.
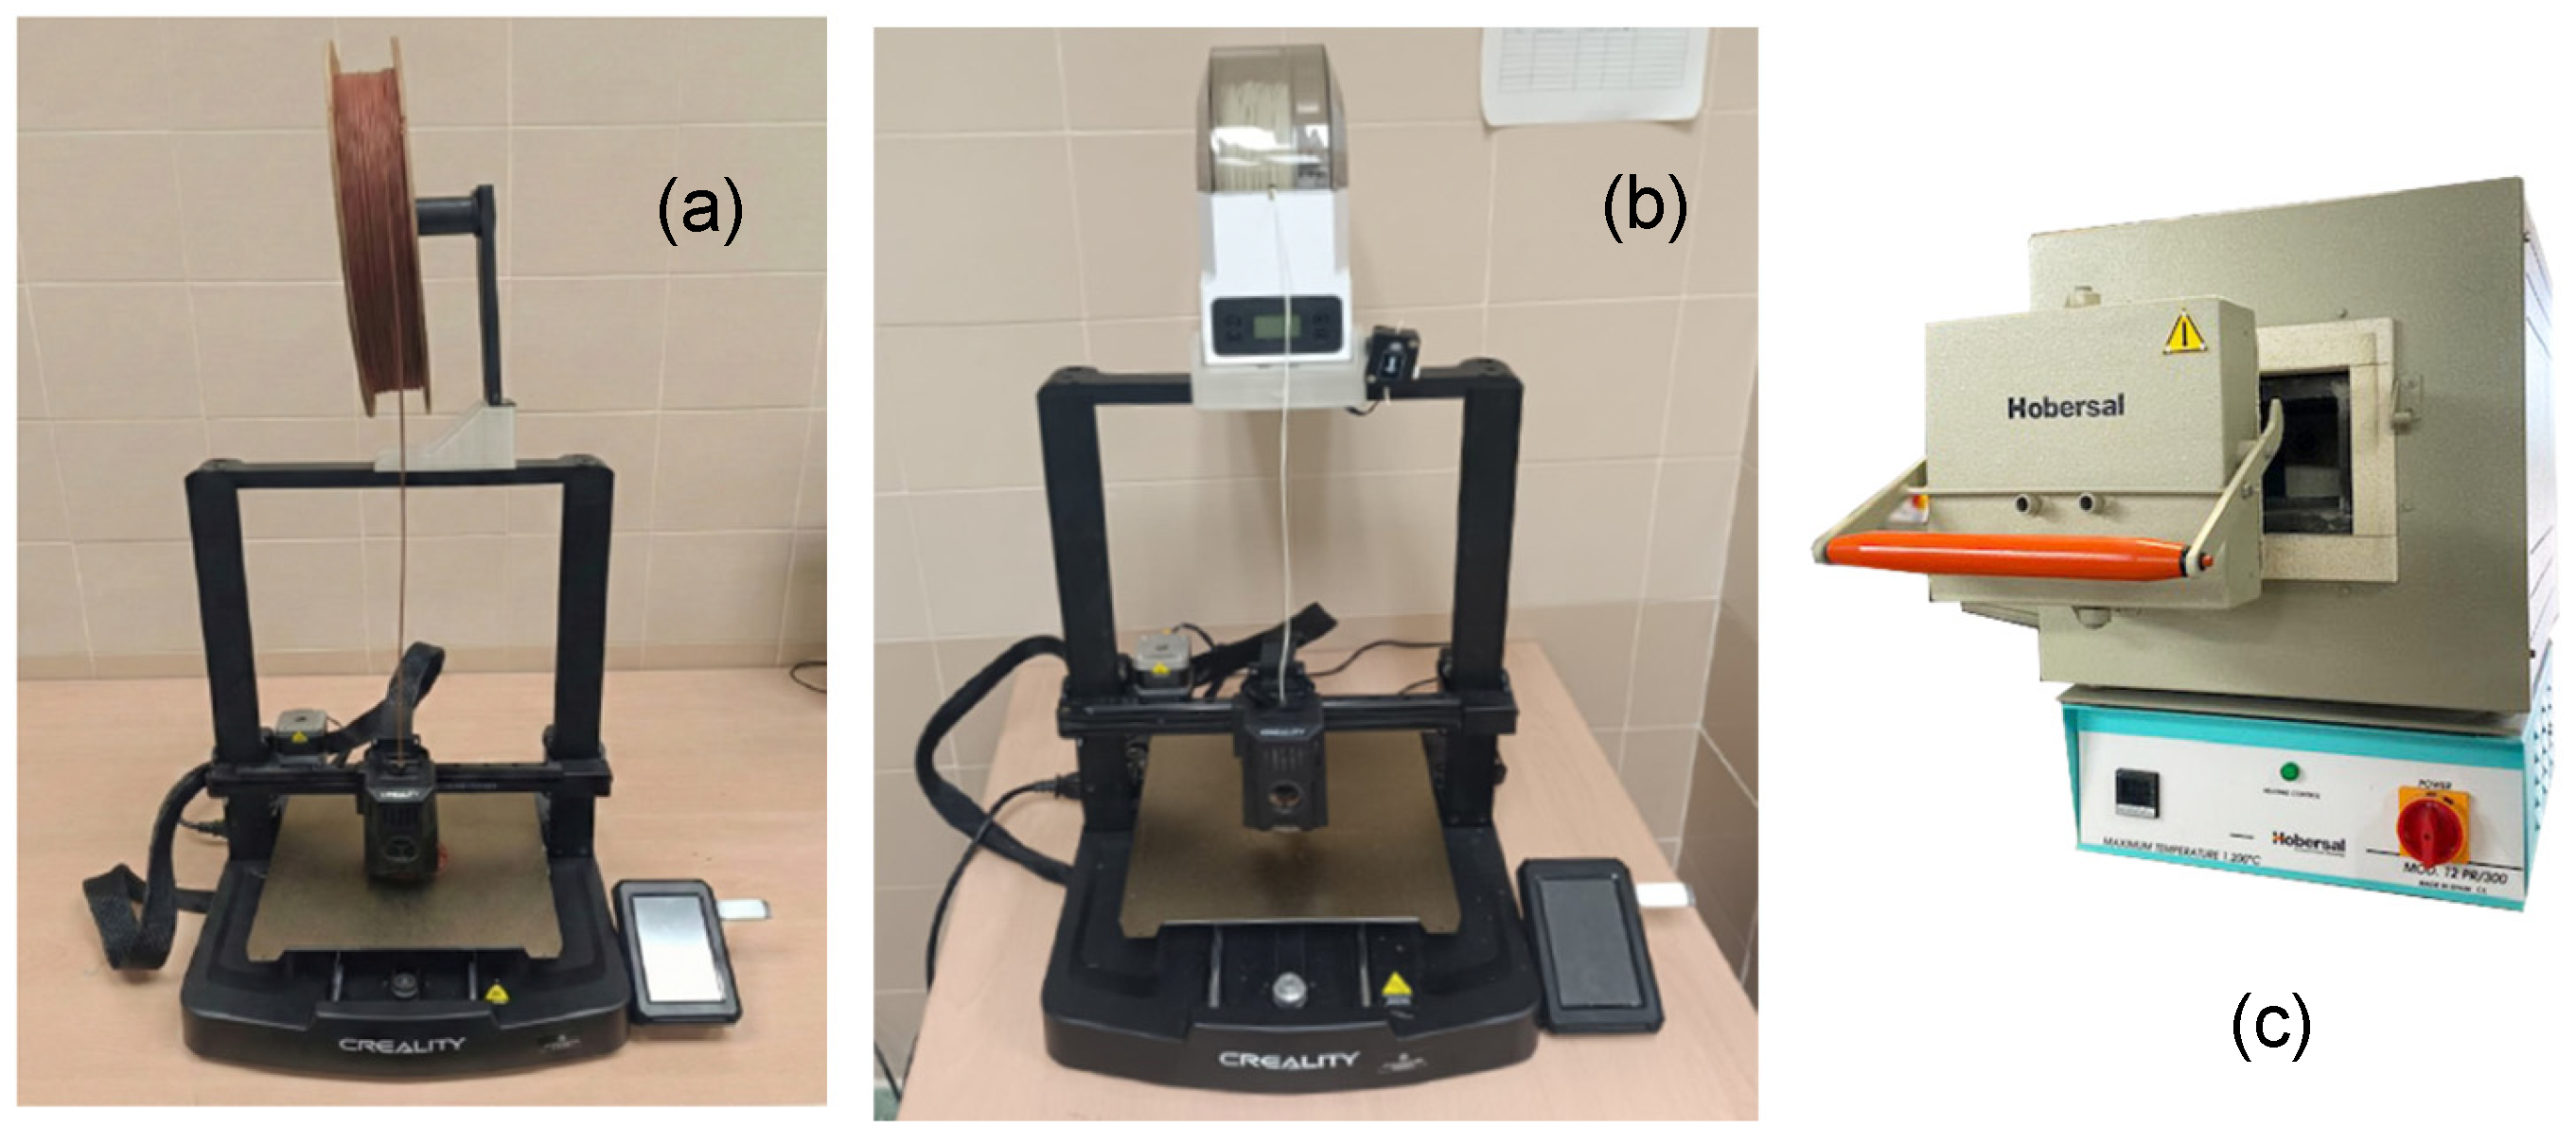
An Ender 3 V3 KE printer (Creality, Shenzhen, China) equipped with a 0.6 mm hardened steel nozzle was used (Figure 3a). The main specifications of the printer include a vertical resolution (Z) of 0.1–0.35 mm and an XY precision of 0.01 mm, and it was controlled using Ultimaker Cura v5.11 software. Regarding alumina, to improve extrusion and ensure uniform deposition, the filament was preheated before printing using a filament dryer (Figure 3b). Furthermore, to allow the commercial printer to perform printing at the low temperature (<180 °C) required by alumina filament, it was necessary to root the machine (obtain system administrator privileges) and modify its firmware, enabling controlled extrusion below the manufacturer’s default limits. The TPMS structures were printed without supports, obviating the need for support-removal post-processing. The specific printing parameters for alumina are shown in Table 1.
Once the parts are printed via FFF technology using an alumina-loaded filament, the polymeric matrix and additives are removed (debinding process). Subsequently, the sintering stage is performed to promote interparticle bonding and material densification. To conduct these thermal treatments, a HOBERSAL 1400 (Hobersal, Barcelona, Spain) furnace model was used (see Figure 3c), which has a maximum peak temperature of 1400 °C; however, for continuous operation, it is recommended to limit it to 1300 °C. Furthermore, the equipment allows programming of heating ramps, while cooling occurs naturally inside the furnace.
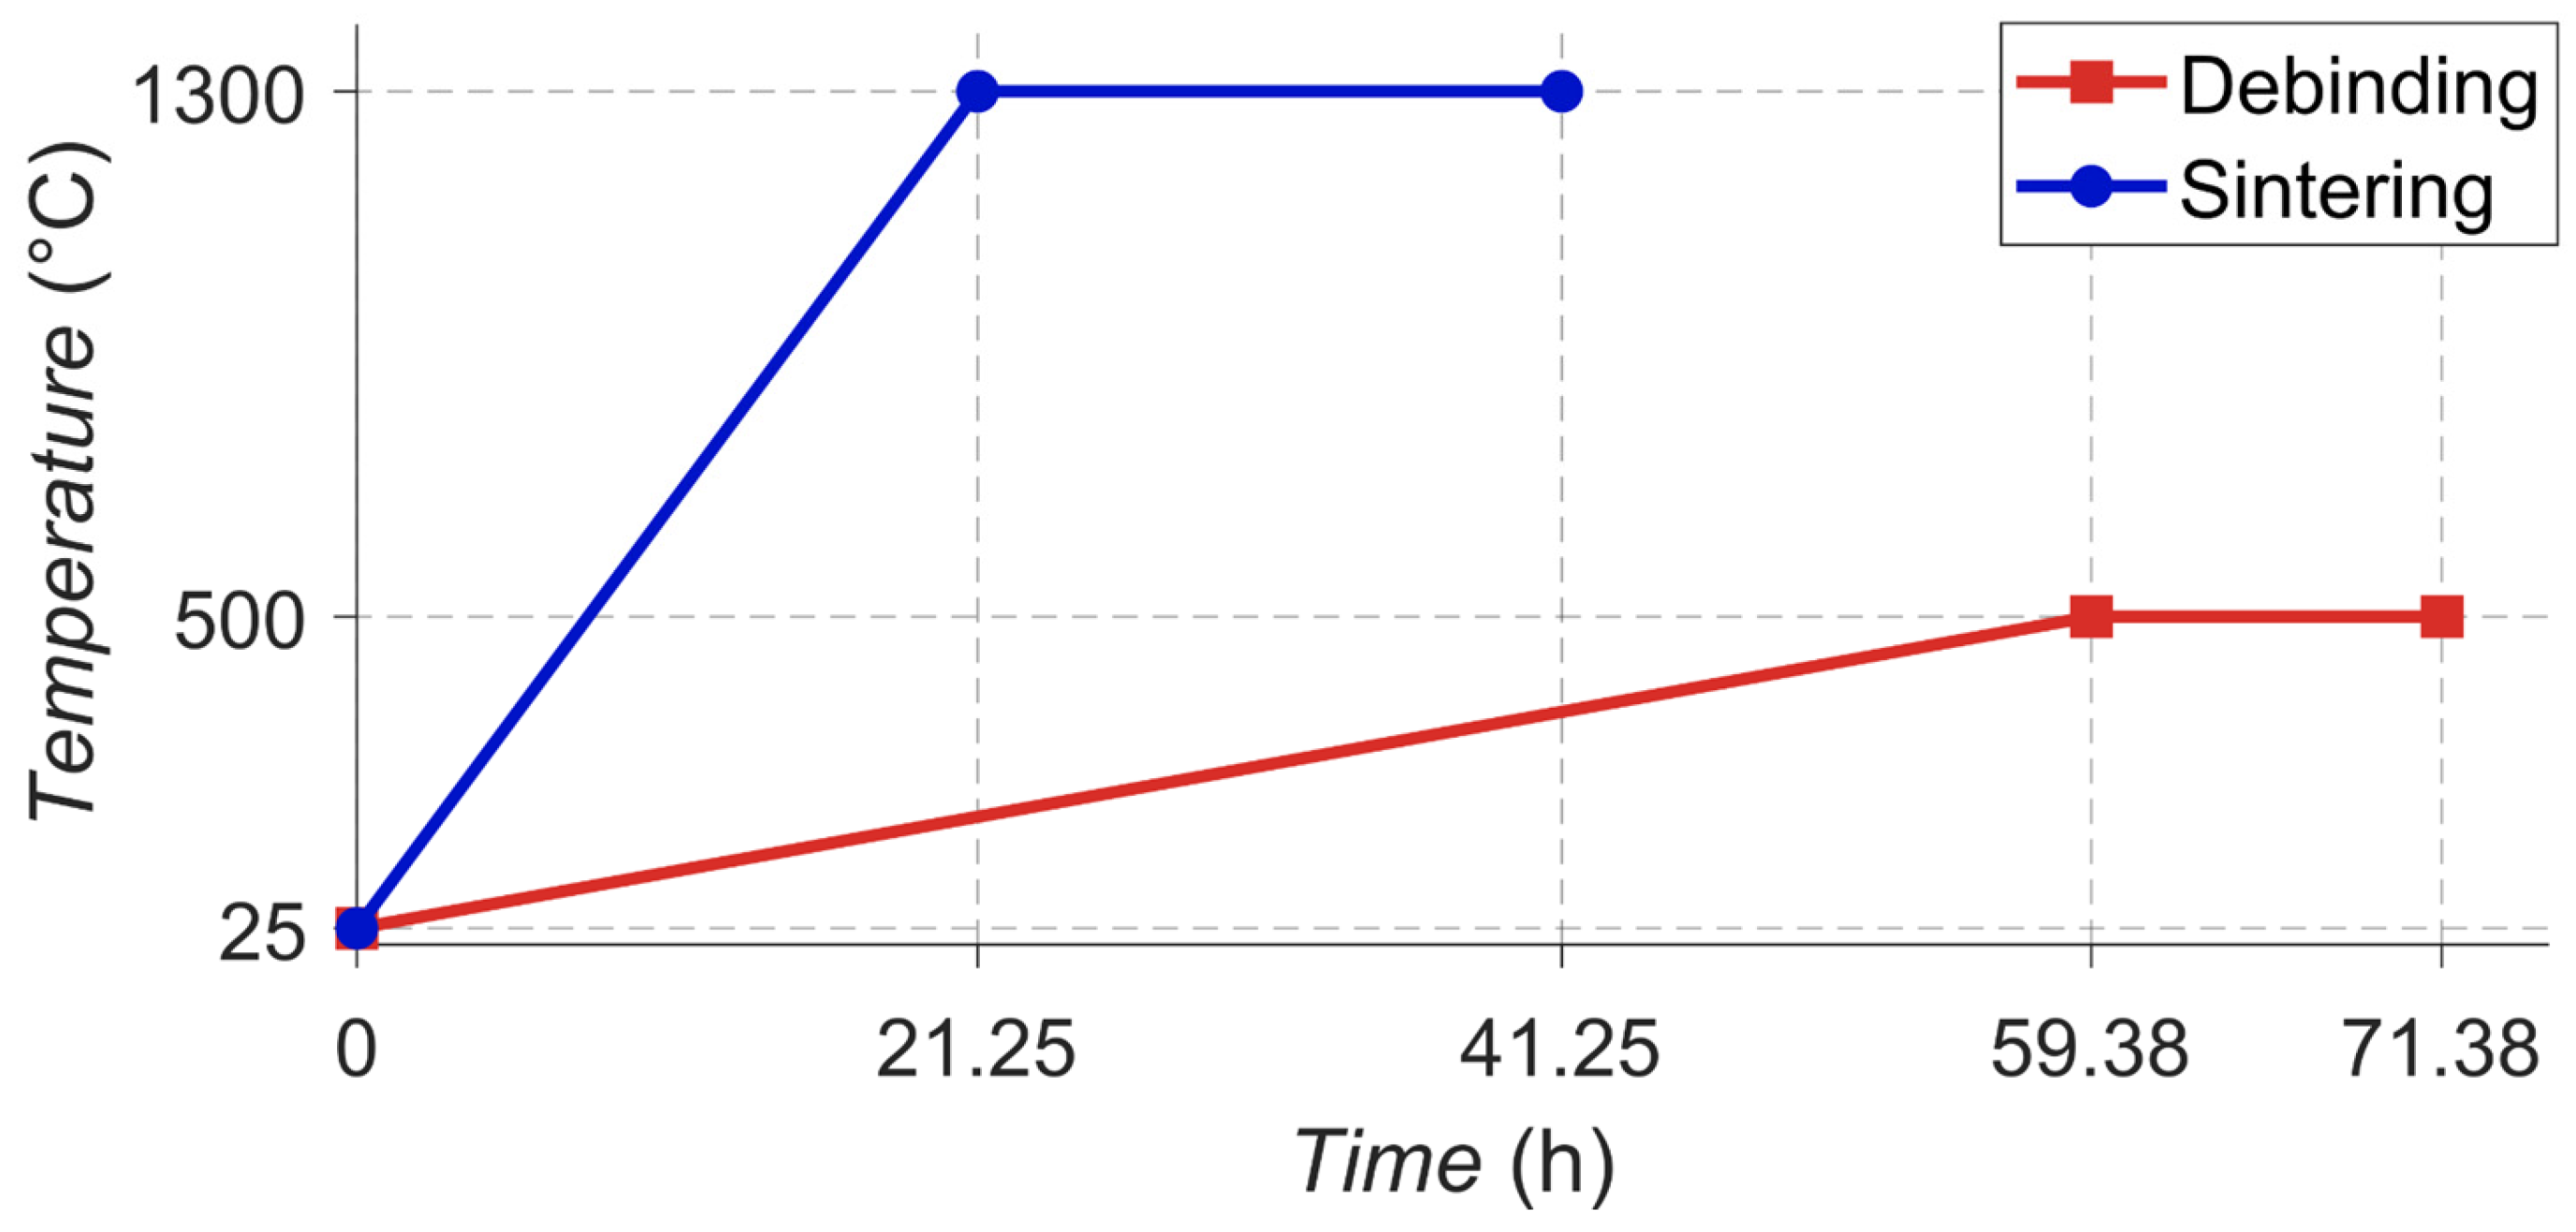
The study was conducted using parts with an approximate green weight of ≈9 g. The debinding stage is carried out in two distinct phases. The first corresponds to chemical debinding, in which the parts are immersed in acetone for 24 h, followed by a second thermal stage consisting of heating up to 500 °C at a rate of 8 °C/h, as shown in Figure 4 (red profile). The sintering process (Figure 4, blue profile), despite the manufacturer’s recommended temperature of 1550 °C, is performed at 1300 °C (partial sintering) to produce micro or textural porosity on the monolith surface. Further increasing the temperature would decrease porosity and surface area [23], thereby requiring a larger catalyst size to maintain the same efficiency. In this case, a heating ramp of 60 °C/h is applied, followed by a holding time of 20 h. All thermal stages are carried out with the parts exposed to air.
The selected thermal cycle was established through experimental tests in which samples sintered at 1550 °C were compared with samples partially sintered at 1300 °C using different holding times (10, 20, and 35 h). Full sintering at 1550 °C produced a dense structure with only 6% open porosity. In contrast, partial sintering at 1300 °C preserved a higher porosity. Among the holding times evaluated, 20 h provided the best compromise between mechanical integrity and porosity (17% open porosity), whereas extending the holding time to 35 h did not result in any appreciable additional densification.

2.3. Experimental Procedure

The experimental design of this study is divided into two main categories: numerical and physical experimental tests.
Numerical Simulations. Numerical tests were conducted, considering the minimum printable wall thickness constraint (0.8 mm), to determine the required unit cell size (L × L × L, where L is the unit cell length) to achieve a specific target theoretical porosity. Additionally, we computed approximations for the specific surface and the tortuosity.
The filter macroporosity is approximated by the unit cell macroporosity ε 0 , defined as the ratio of void volume within the unit cell volume Vvoid to the total volume of the unit cell’s convex hull L3:
ε 0 = V v o i d L 3 = 1 V T P M S L 3 ,
where VTPMS is the solid volume of the TPMS unit cell.
The specific surface, along with porosity, is a key characteristic of filters. The unit cell theoretical specific surface Sv is the ratio of active surface S to the unit cell volume:
Sv = S/L3.
In the numerical experiments, we have also approximated the lattice tortuosity as the unit-cell tortuosity τ using the equation described by Inayat et al. [24]:
τ = 1 + d w S v 4 ε 0 ,
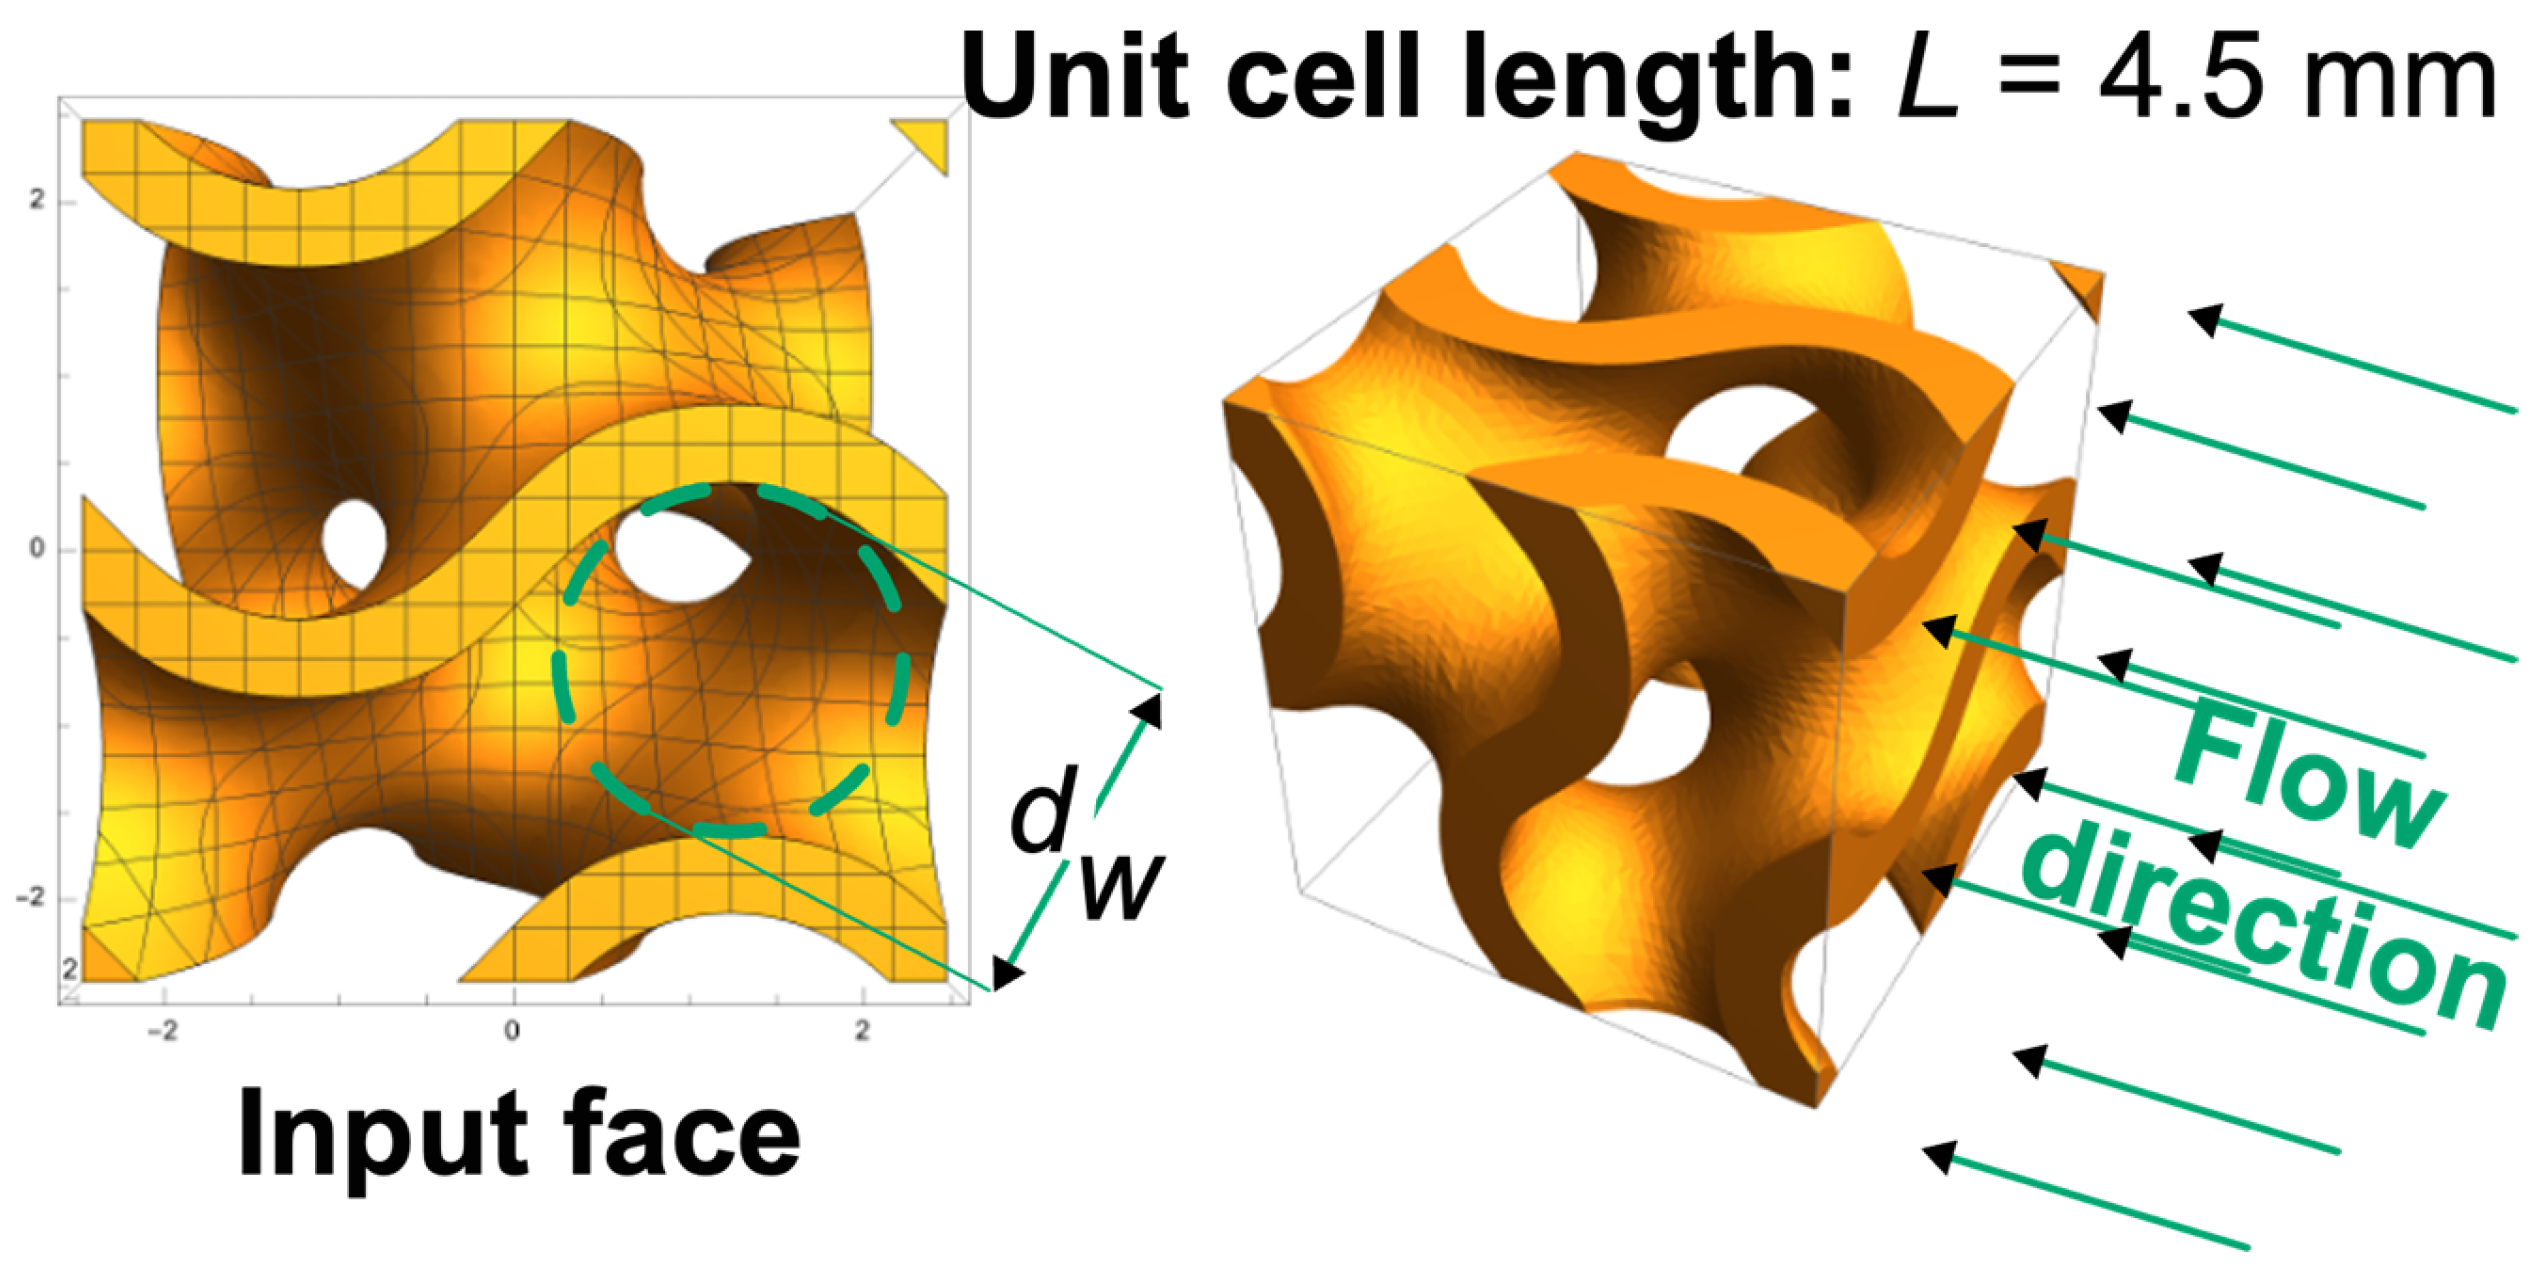
with the pore window diameter dw depending on the TPMS type; in this study, we define it as the diameter of the largest disk inscribed within the 2D void region corresponding to the unit cell face perpendicular to the gas flow (see Figure 5).
It should be noted that this expression provides a geometric tortuosity, which is used here as a descriptor of the intrinsic complexity of the TPMS structures rather than as a direct estimation of hydraulic tortuosity. While geometric tortuosity is derived from pore morphology, hydraulic tortuosity describes the deviation of fluid pathways under specific flow conditions [25]. Although these two parameters are not equivalent and may present different absolute values, they are related by their dependence on pore morphology, allowing geometric tortuosity to provide an indication of flow-path complexity and fluid transport behavior [26].
There is no simple analytical expression to determine the above values for a specific unit cell length; therefore, we computed them numerically. The procedure is implemented in Wolfram Mathematica software (version 14, Wolfram Research, Inc., Champaign, IL, USA) and consists of the following steps.
Step 1. Definition of the solid TPMS unit cell using the procedure described in Section 2.1 to obtain its SDF representation.
Step 2. Solid volume VTPMS approximation. The unit cell is discretized into voxels, and the center of each voxel is evaluated against the SDF. The total solid volume is then approximated as the sum of the volumes of all solid voxels.
Step 3. Active surface S approximation. The SDF is discretized on the TPMS surface; then the active surface area is approximated as the sum of the constituent triangular mesh areas.
Step 4. Pore window diameter estimation dw. The inlet face of the unit cell is binarized, assigning white to pixels within the void space and black to the remaining pixels. Subsequently, the DistanceTransform function in Mathematica is used to compute the distance from each white pixel to its nearest black pixel. The maximum calculated distance is then doubled to determine dw.
Step 5. Compute ε0, Sv, and τ using Equation (2), Equation (3) and Equation (4), respectively.
Physical Experimental Tests. The physical experimental campaign was further subdivided into three stages.
Stage 1. Calibration Test: Cubical samples were printed to determine material shrinkage and textural porosity. The shrinkage of the samples was calculated from the dimensional differences between the green and sintered states. In contrast, textural porosity was determined using the Archimedes method, following the procedure described by Chen et al. [10]. The results of these calibration tests are presented in Section 3.2.1.
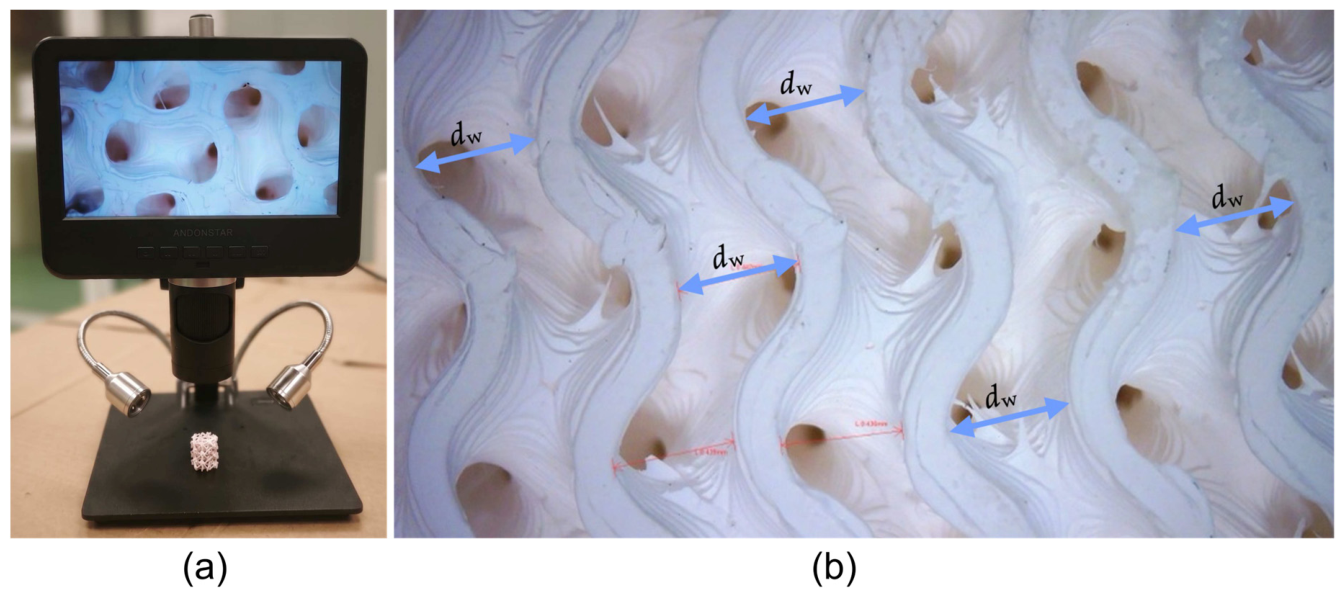
Stage 2. Dimensional Characterization: Geometrical measurements were performed on the three previously described printed filter configurations (SD, SG, and SP). To ensure reproducibility, each filter type was printed in triplicate. For all evaluated parameters, five independent measurements were taken per replica, defining each final value as the mean of fifteen total measurements per configuration. The overall diameter (D) and height (H) of the filters were measured using a caliper. Additionally, optical microscopy (see Figure 6a) was employed to determine dw and t. The calibration of the optical method involved determining the pixel-to-millimeter ratio using a steel ruler as a reference. Figure 6b illustrates an example of the dw measurement for the sample with gyroid geometry (SG). The results of these characterizations are presented in Section 3.2.2.
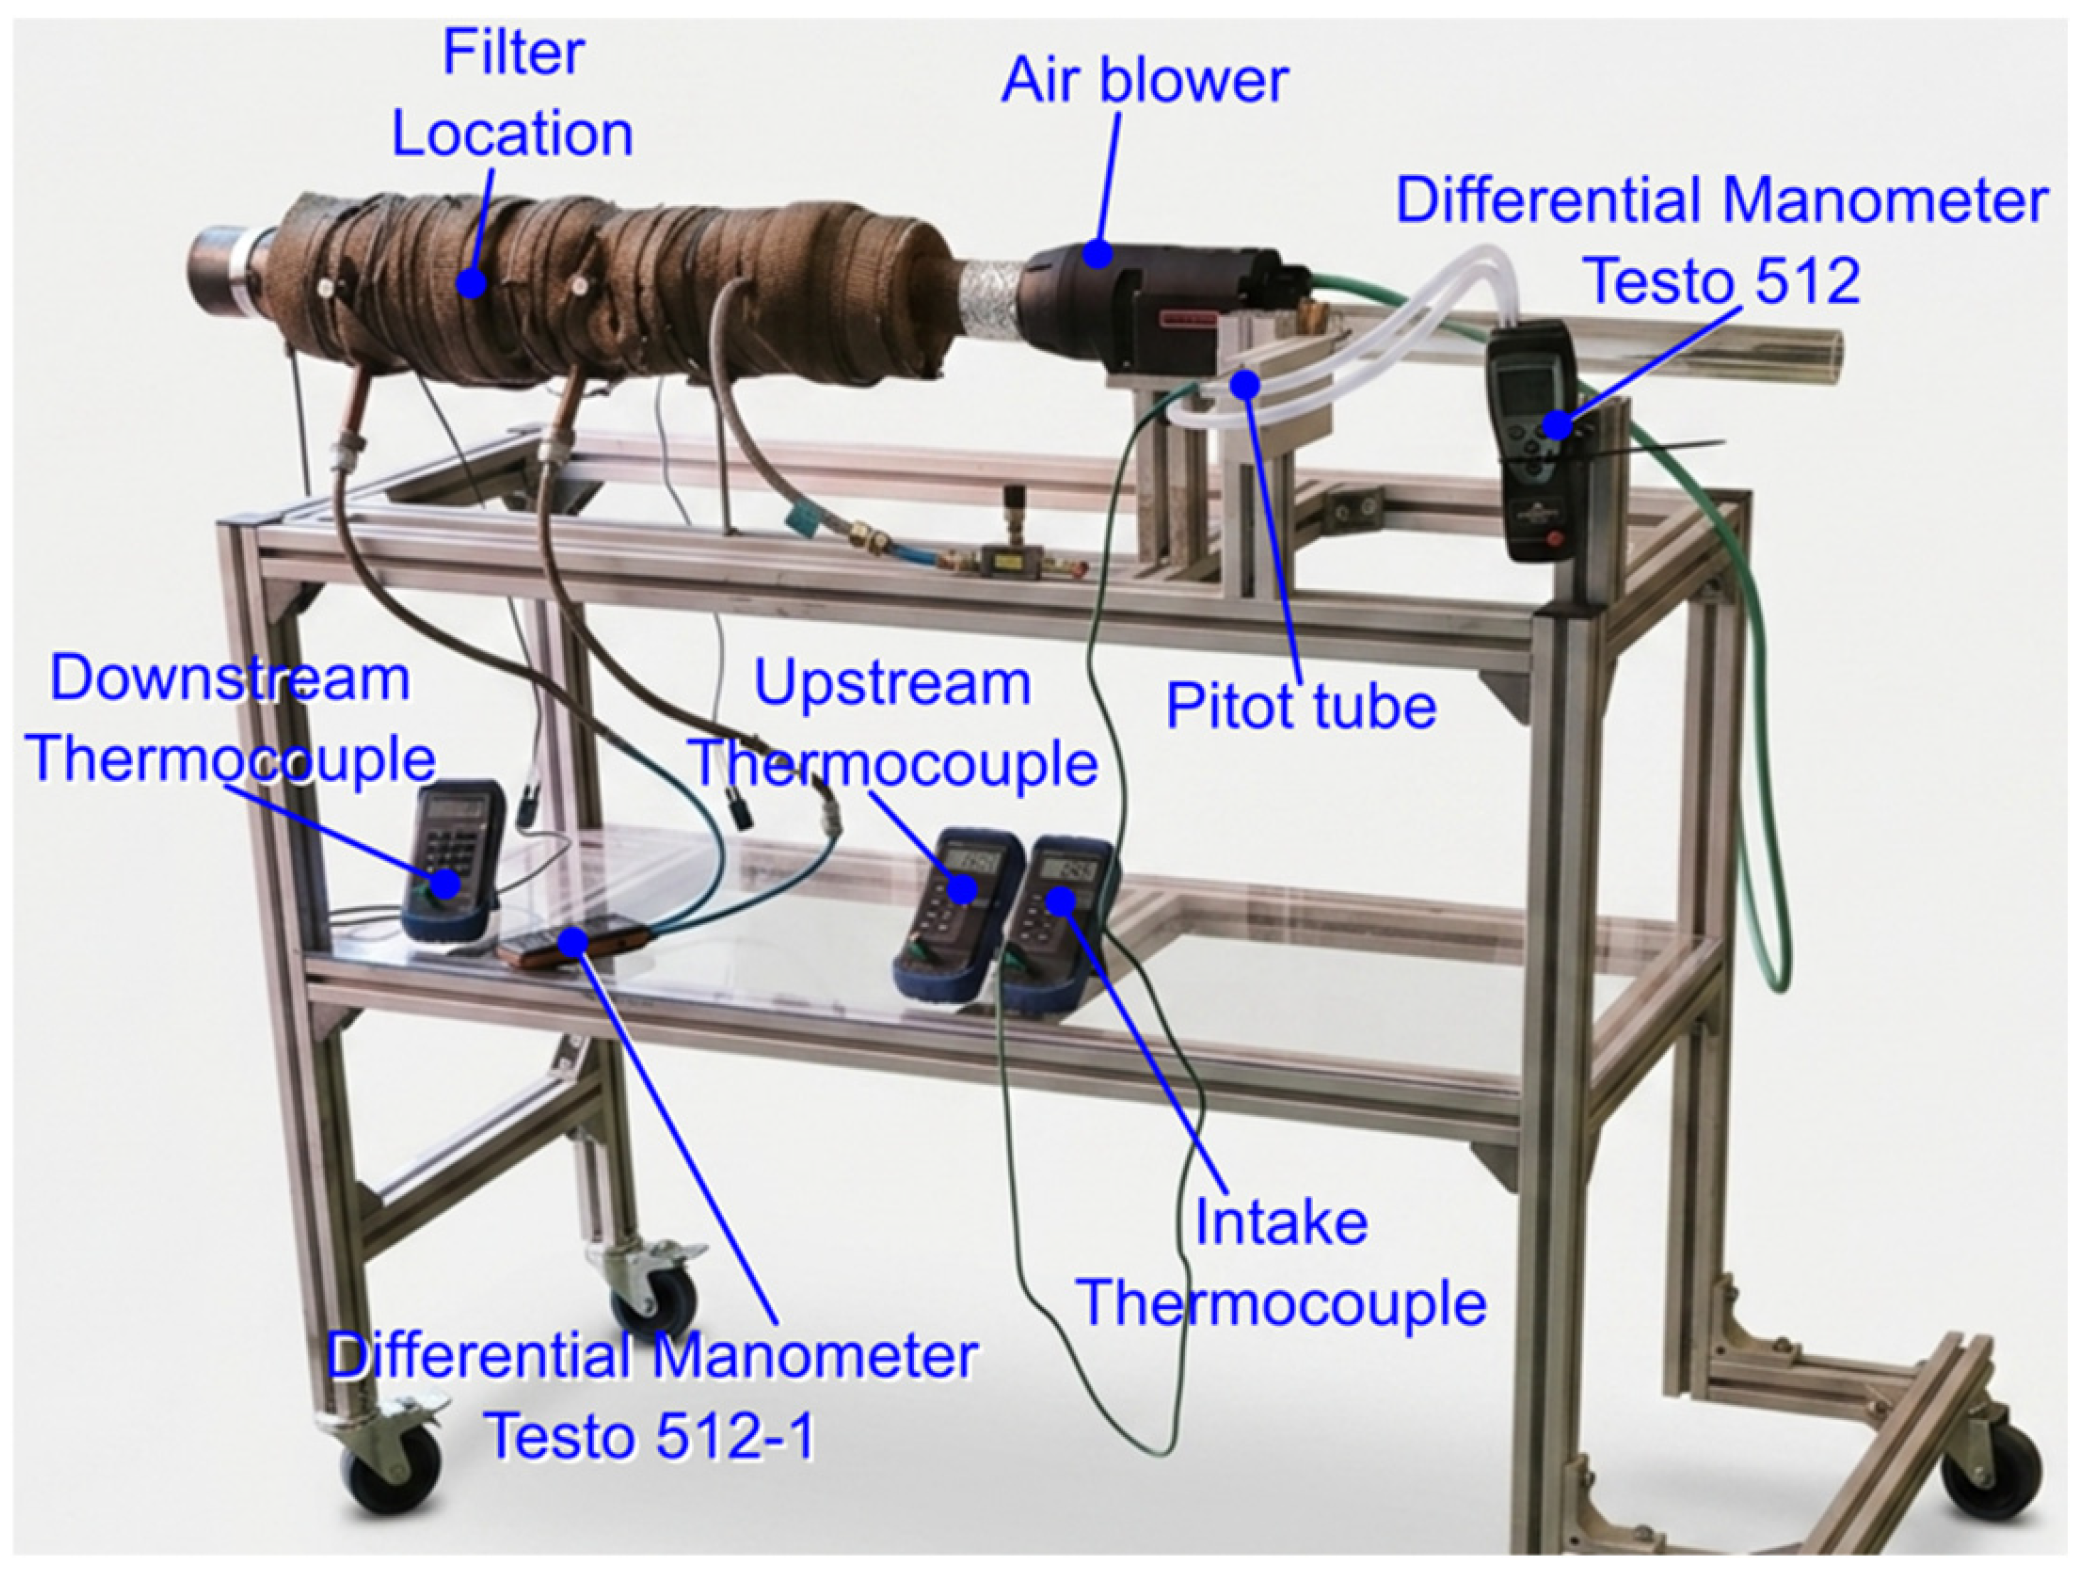
Stage 3. Performance Tests: Experimental tests were carried out to determine the pressure drop and permeability of the three printed filter monolith samples using an in-house test bench (see Figure 7). Air was selected as the working fluid for hydrodynamic characterization because nitrogen (N2) constitutes the primary sweeping medium in laboratory-scale pyrolysis (≤100 g of feedstock). Given that air consists predominantly of N2 (∼78 vol%), its thermophysical properties closely match those of the carrier gas stream during actual pyrolysis operation. A Leister Mistral 6 System 4500 W industrial blower (Leister, Kägiswil, Switzerland) was used to provide the heat source and air supply, allowing precise regulation of both temperature (up to 650 °C) and airflow by controlling the power percentage. The samples were heated to approximately 400 °C, a target temperature selected based on our previous findings on the optimal thermal conditions for plastic pyrolysis [27]. Flow velocity at the blower inlet, pressure drop, and temperatures upstream and downstream of the filter were recorded at three fan-speed levels. The experimental setup consisted of a Testo 512 differential Manometer (accuracy 0.5% fs, measurement range from 0 to +200 hPa) connected to a 3 mm diameter Pitot tube incorporating a type K thermocouple connected to a digital reader with an accuracy of ±1 °C, to determine the flow velocity and temperature within the 34 mm diameter pipe that served as the blower intake. To guarantee a fully developed fluid flow profile and minimize turbulence during velocity measurements, the Pitot tube was positioned downstream of a straight pipe section with a length exceeding 10 times the pipe diameter (>10⋅D). Furthermore, the Pitot tube was firmly held and aligned using a base support. To measure the pressure drop between the filter inlet and outlet, a Testo 512-1 differential manometer was used, which features a differential pressure measurement range from 0 to +200 hPa and an accuracy of ±0.5% of the measurement range. This manometer was connected via metallic tubes to two static pressure taps located upstream and downstream of the filter. Additionally, two type K thermocouples with digital readers (accuracy ±1 °C, resolution 1 °C) were used to measure the flow temperature upstream and downstream of the filter. Type K thermocouples were chosen for these locations instead of Type T due to their significantly broader operating temperature range (up to 1200 °C vs. ~350 °C for Type T), which matches the high-temperature air streams required during thermal tests. The sample was positioned inside a 62.8 mm diameter steel pipe, which featured an internal adapter with an inner diameter of 20 mm to precisely match the diameter of the tested monoliths. To ensure thermal stability and minimize energy losses, a thermal insulation coating consisting of rock wool and heat-resistant tape was applied, maintaining a constant temperature throughout the test duct.
The experimental parameters and measurement approach adopted in this study are in good agreement with methodologies reported in previous studies on 3D-printed ceramic architectures for catalytic supports. For instance, Al-Ketan et al. [28] investigated the pressure drop and mechanical performance of alumina TPMS catalytic substrates (20 mm diameter, 35 mm length) using an experimental apparatus equipped with digital differential pressure gauges and mass flow controllers across flow velocities ranging from 0.9 m/s to 2.7 m/s. Similarly, our experimental rig operates in a comparable velocity range and utilizes differential pressure taps located upstream and downstream of a matched internal diameter duct to evaluate pressure drop and determine permeability under viscous-dominated flow conditions.
The pressure drop and permeability were measured in triplicate for each geometry at three different fan speeds (100%, 70%, and 50% of the maximum fan load). Once the pressure drop and flow velocity were determined, the permeability was calculated using Darcy’s Law:
Δ P   = μ   L f v k   ,
where ΔP represents the pressure drop across the porous substrate, μ is the dynamic viscosity of the fluid, and Lf denotes the length of the printed filter in the flow direction. The parameter v signifies the superficial fluid velocity, and k represents the intrinsic permeability of the TPMS structure. The results of these performance tests are presented in Section 3.2.3.

3. Results and Discussion

The experimental procedure described in the previous Section 2 has two objectives: to determine the geometrical parameters for designing TPMS cylindrical samples (Section 3.1 and Section 3.2.1), and to assess the pressure drop and the permeability of the fabricated monoliths (Section 3.2.3).

3.1. Numerical Tests

To obtain the unit-cell macroporosity and the specific surface, which are critical to cracking performance, in addition to the TPMS type, we have to define the lattice’s wall thickness t and the unit-cell length L.
According to the authors’ experience with the desktop printer Ender 3 V3 KE using a nozzle diameter of 0.6 mm, it is possible to obtain a minimum wall thickness of approximately t = 0.8 mm. This thickness value was the same for all the experiments. Table 2 shows the computed values of the geometrical parameters and the estimates of ε, Sv, dw and τ, which influence filter performance.
In this study, we set a macroporosity ε 0 to around 65%. This value is within the porosity (macro plus textural surface) range (55%, 70% and 85%) considered by Kim, Tran and Philip [29] in their excellent work to clarify the relation between structured porous media and pressure drop, and potentially can become after partial sintering the monolith, around 70% porosity which was reported as an adequate value to synthesizing ammonia with a Gyroid reactor by Gargiulo et al. [30].
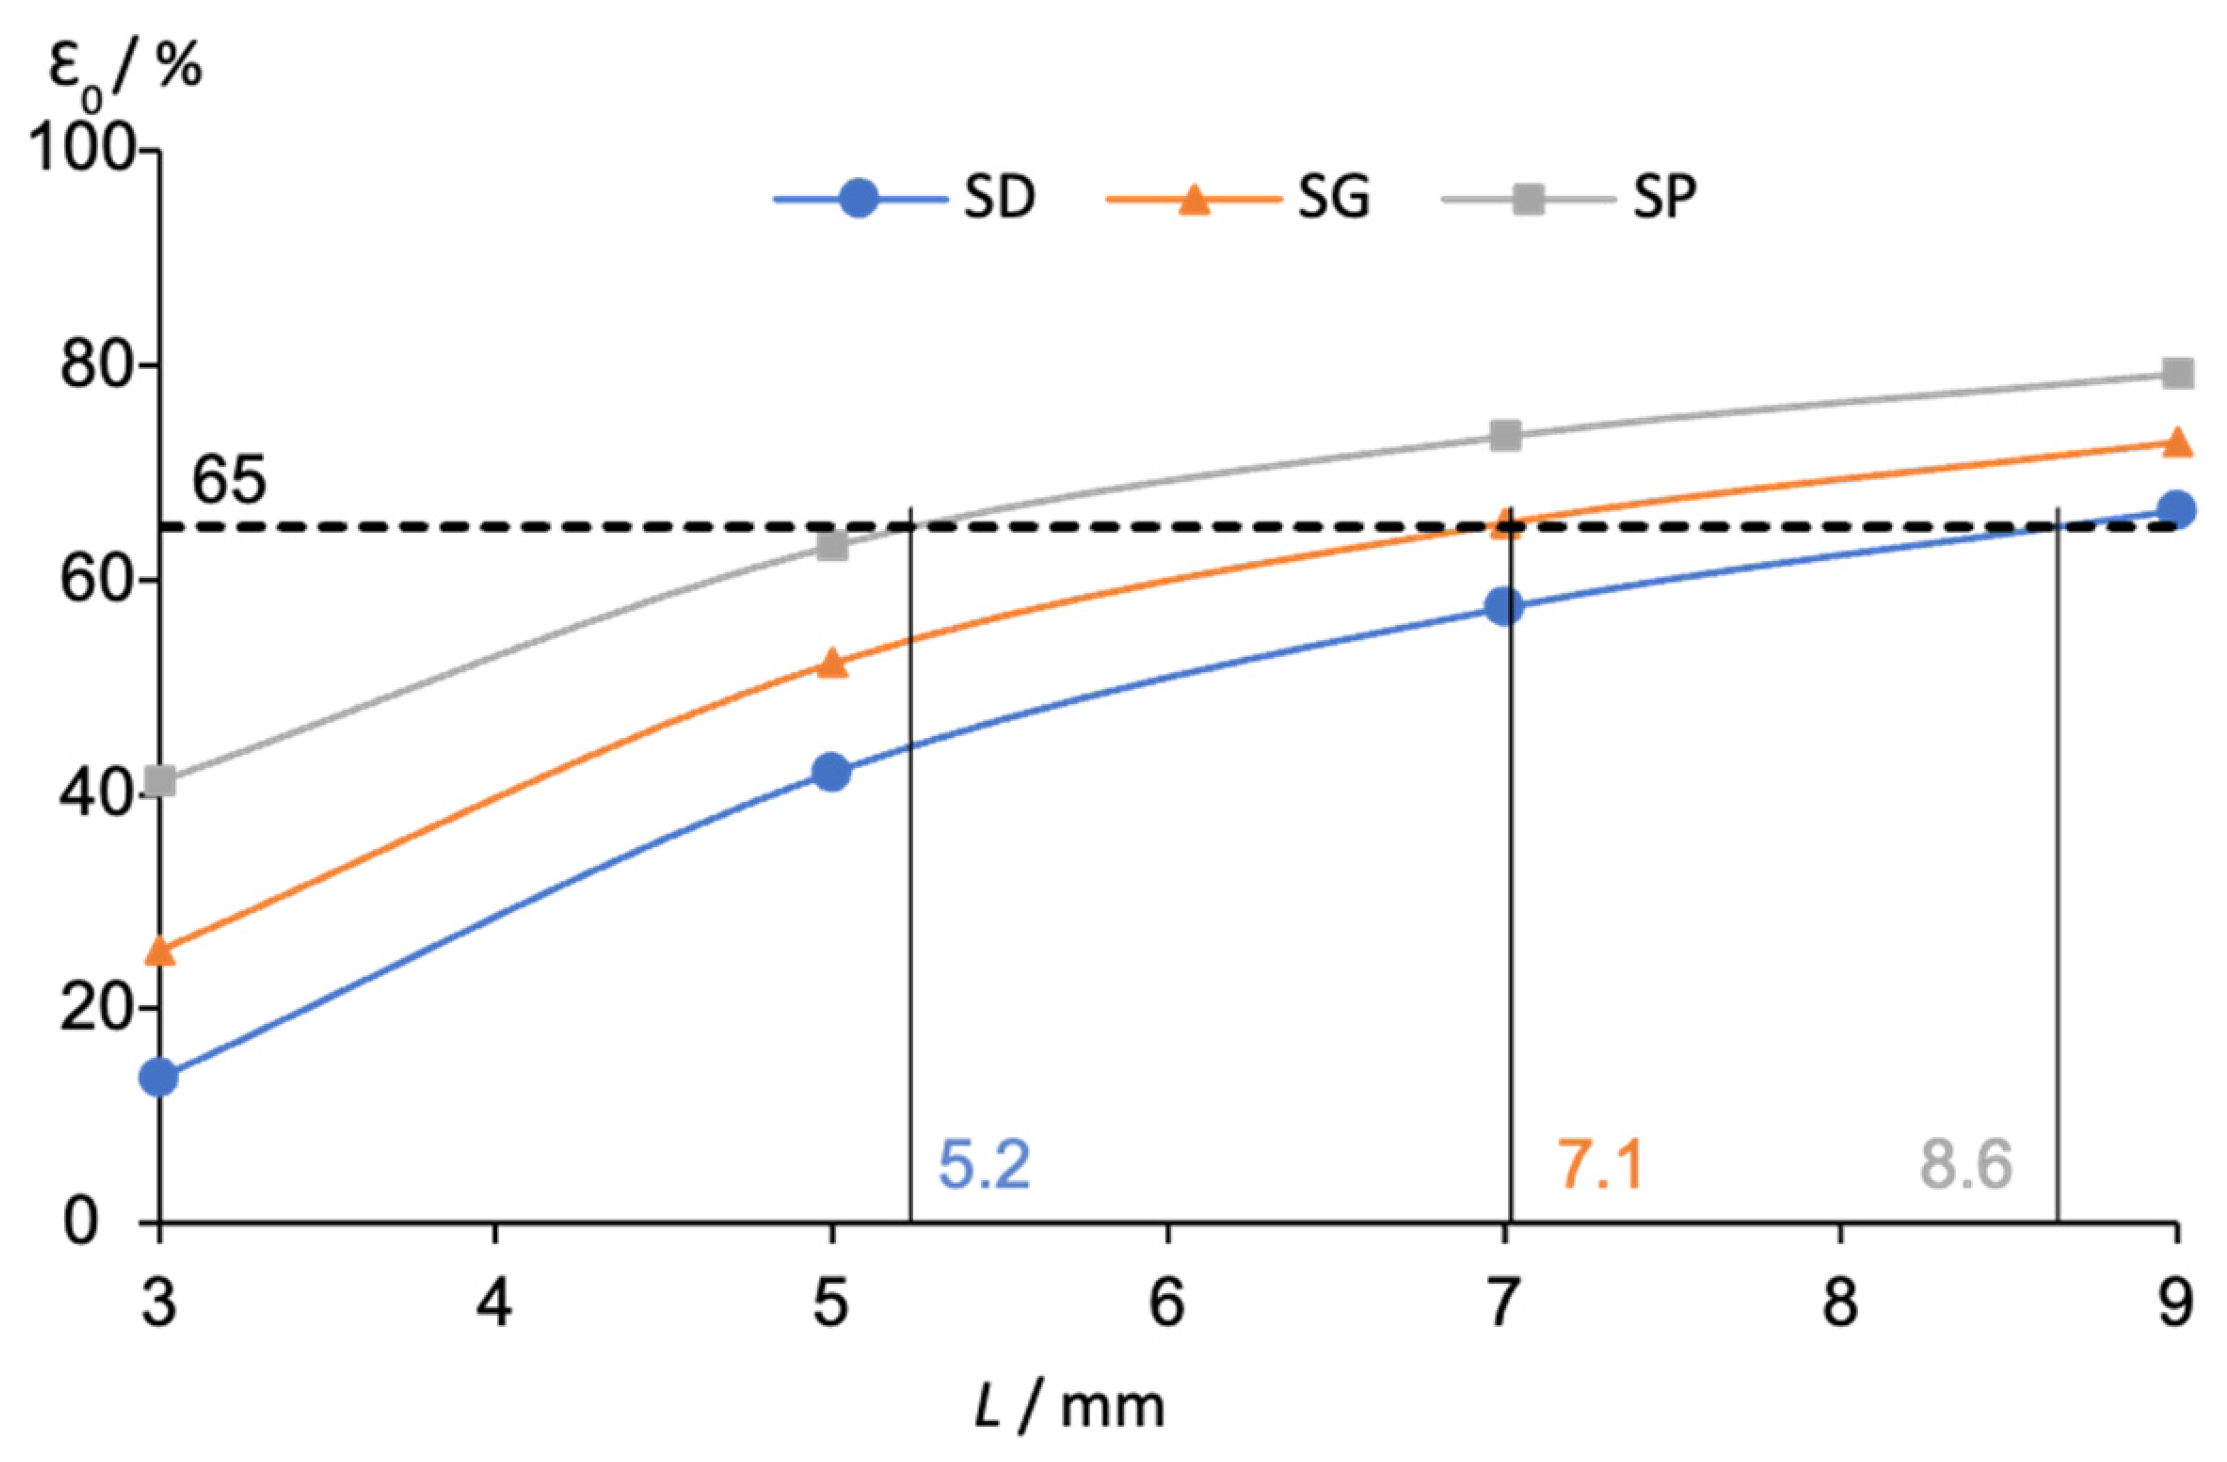
The required L to obtain ε 0 = 65% was computed by fitting Table 2 values with an order-2 polynomial. Figure 8 shows the resulting L and associated filter parameters for each TPMS type.
The unit cell for the samples printed to evaluate the influence of geometry on the pressure drop and to estimate the permeability has the characteristics shown in Table 3. It is noteworthy that, with similar macroporosity, tortuosity is the parameter that differentiates one TPMS from another.
The tortuosity values presented in Table 2 and Table 3 indicate that the structural geometry determines tortuosity, consistent with the trend: τSD > τSG > τSP. This behavior remains consistent whether evaluated through a geometric definition, as adopted in this work and by Inayat et al. [24], or via a hydraulic approach to characterize the flow pattern through the porous medium [26].

3.2. Actual Experimental Tests

3.2.1. Calibration Tests

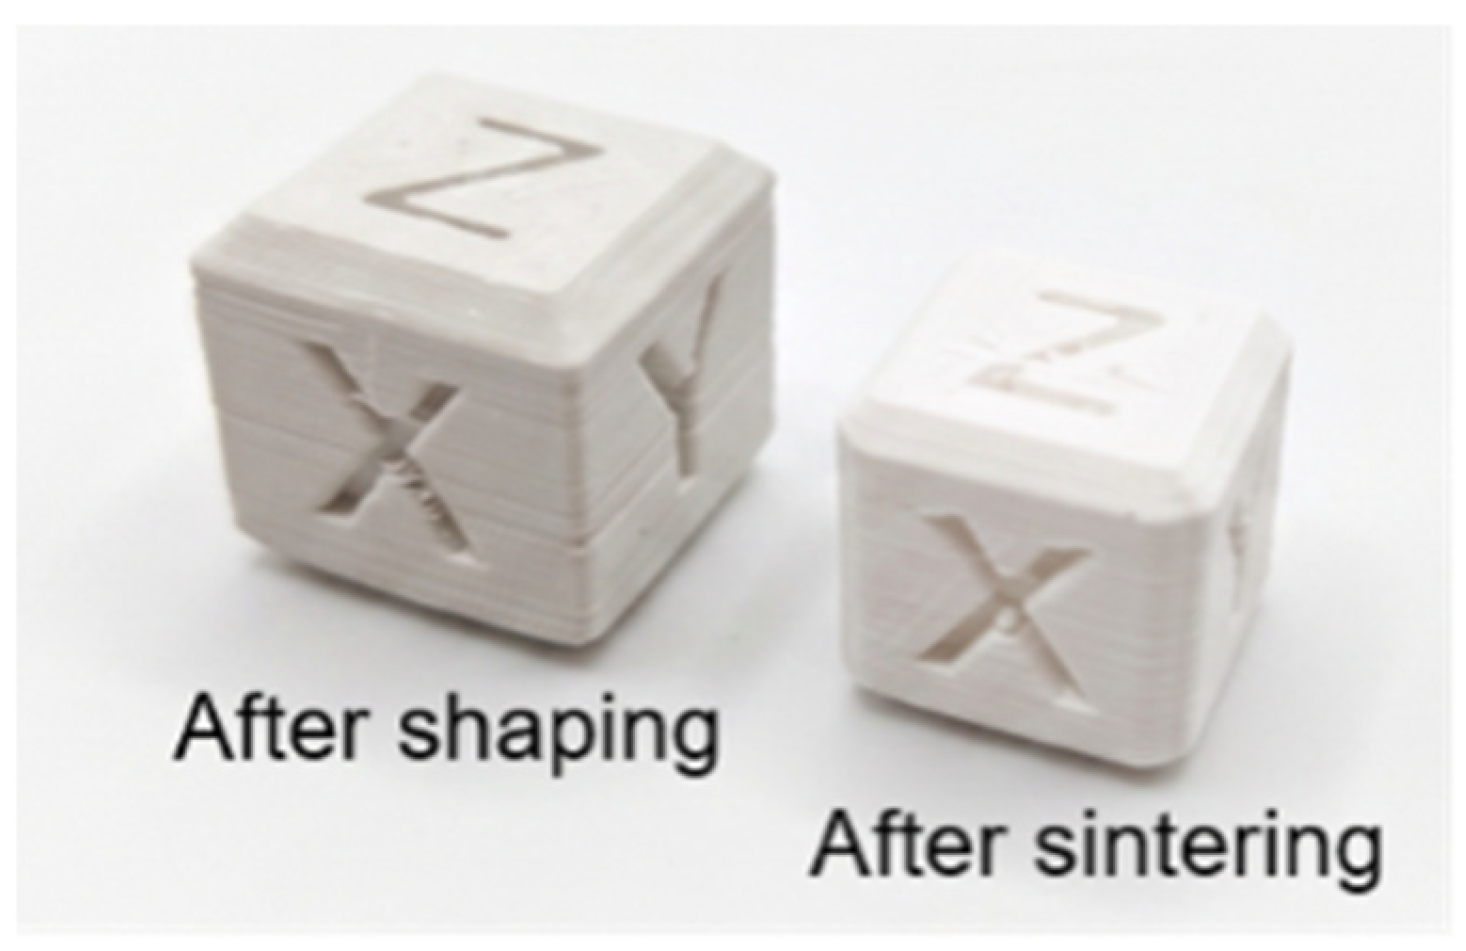
Cubical samples printed to determine material shrinkage are illustrated in Figure 9. The dimensional characterization showed that these samples had a nominal theoretical side length of 14 mm and exhibited a shrinkage behavior after sintering. The mean shrinkage values calculated across five independent samples were 12.5% on the X and Y axes, and 15.5% on the Z-axis.

3.2.2. Dimensional Characterization of SD, SG, and SP Configurations

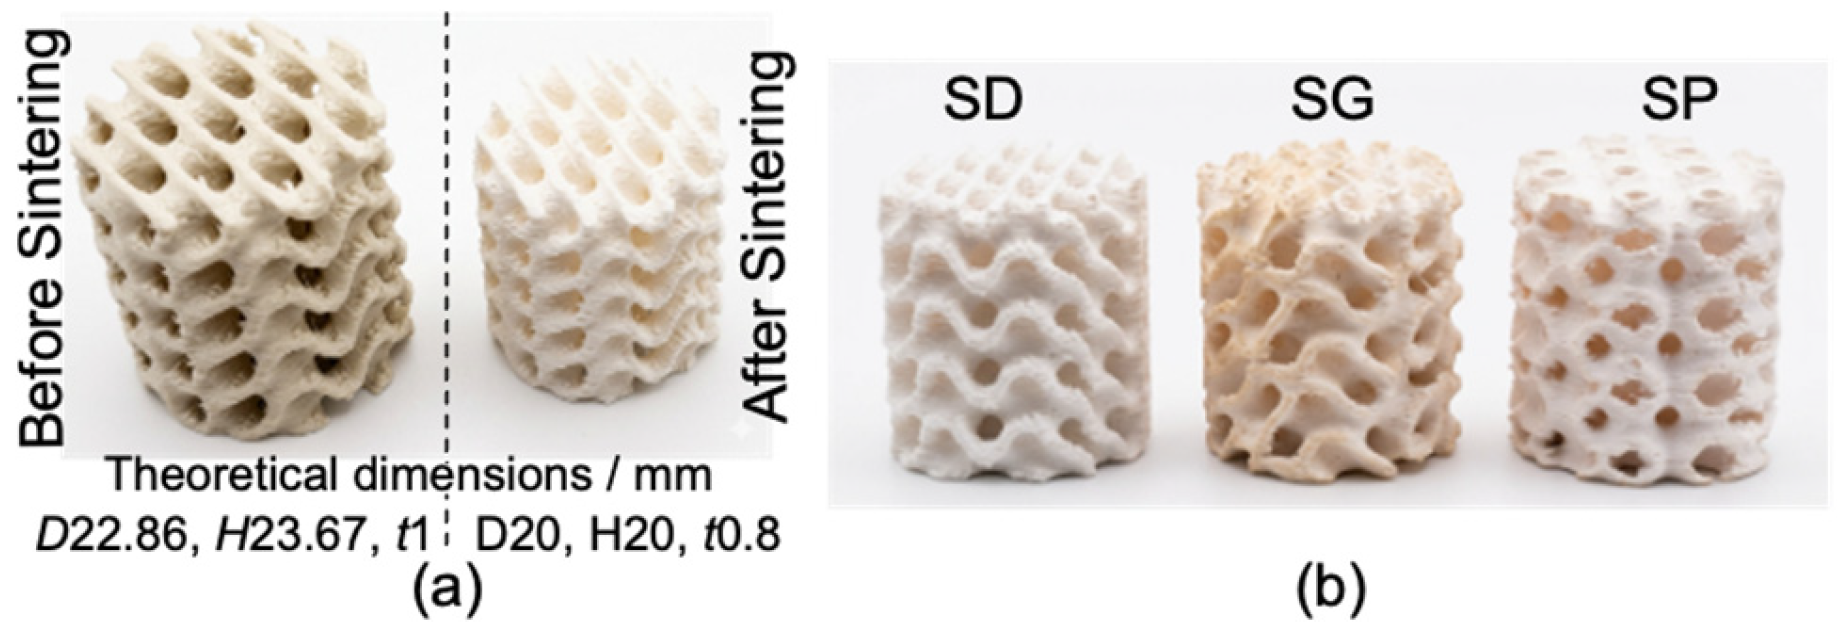
The shrinkage measurements, together with the L defined in Section 3.1, are enough to model the filter samples for testing. The nominal filter geometry, a cylinder measuring 20 mm in diameter and height, was oversized according to the shrinkage percentages estimated in the previous section. This approach is illustrated in Figure 10a for the SG configuration. By doing so, it was expected to achieve the target nominal dimensions for each configuration after sintering.
The main dimensions of the samples manufactured (three replicas for each TPMS configuration) are presented in Table 4, and an illustration of the resulting sintered filter configurations is shown in Figure 10b. Each dimension was measured 5 times per sample, and the dimension estimates shown in Table 4 are the average values. Additionally, Table 4 presents an estimate of the total porosity ε, defined as 1 minus the ratio of the measured sample mass to the theoretical mass of a solid filter (without internal structures). Note that ε includes theoretical, textural, and closed porosities, so that the “active” porosity, due to theoretical and textural empty space, will be slightly smaller and in any case within the desired design porosity goal (around 70%). Additionally, subtracting the 17% textural porosity, determined from cubic calibration samples, from the total porosity (ε) reported in Table 4 yields a real macroporosity of 53% for SP, 56% for SG, and 57% for SD.
The cause of the observed discrepancy between theoretical and estimated actual macroporosity lies within the samples: surface defects due to the stair effect and stringing manufacturing failures increase the textural porosity and, at the same time, clog the structural channels. Additionally, the actual interior pores are equal to or smaller than the theoretical ones. This deviation can be a good indicator of the monolith’s quality, helping to improve fabrication and highlighting surface irregularities introduced during monolith manufacturing.
On the other hand, the data presented in the last four columns of Table 4 indicate that the relative measurement error with respect to the theoretical design consistently remains under 5%. This low deviation confirms that the manufactured samples align closely with the theoretical filter models.

3.2.3. Performance Tests of SD, SG, and SP Configurations: Pressure Drop and Permeability

The test bench described in Section 2.3 (physical experimental tests) helps evaluate the influence of shape on pressure drop and estimate its associated permeability. As justified in the aforementioned section, thermal conditioning of the samples was carried out at approximately 400 °C. During testing, the inlet flow velocity, total pressure drop, and system temperature were logged across three predefined fan operating speeds. Table 5 provides an illustrative example of the recorded dataset.
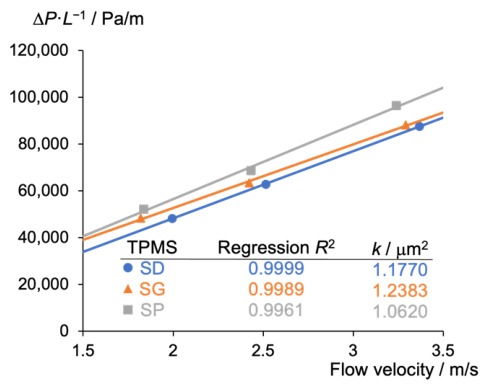
The mass flow rate was computed from the measured values and used to determine the flow velocity (u) upstream of the TPMS samples. Pressure drop results for each configuration at three different velocities are shown in Figure 11. It is clear from this figure that, within the tested range, the ΔP-u relationship is linear. The regression coefficients of determination (R2) for each geometry are also displayed in the figure. Considering that in our case the flow is dominated by viscous forces, Darcy’s Law (Equation (5)) can be applied to determine the TPMS permeability (k). According to Figure 11, SG exhibited the highest permeability value, followed by SD and SP. These results agree with the observations of Guerreiro et al. [26], who claim that SG geometries generally feature the highest k. Furthermore, the low permeability of SP samples can be attributed to their unit cell length, which is shorter than that of SD and SG, leading to lower macroporosity.
While a higher tortuosity is conventionally associated with an increased pressure drop, experimental data reveal that this correlation is inverted at moderate porosities. As demonstrated via simulations by Guerreiro et al. [26], low tortuosity yields a greater permeability sensitivity to porosity variations. Furthermore, low tortuosity promotes a predominantly linear streamflow, which limits the fluid’s effective interaction with the structure’s internal curved surfaces. Consequently, these factors suggest a clear preference during the design stage for the SD and SG geometries, which feature higher tortuosity.
On the other hand, to achieve an efficient monolith washcoating, a critical step for functional cracking filters, the high permeability of SG or SD must be paired with high microporosity. This high microporosity is provided by the surface roughness generated during FFF and the partial sintering process, as evidenced by the high textural porosity registered in the samples, which ultimately can help to promote a uniform coating.

4. Conclusions

This study demonstrates the feasibility of modeling and manufacturing ceramic filters with complex TPMS structures utilizing general scientific software (Mathematica) and a conventional FFF desktop printer. By evaluating the relationship between the TPMS unit cell length and its geometrical properties, primarily porosity, and estimating shrinkage via calibration cubes, the filters were successfully modeled. Furthermore, the FFF printer was physically modified by integrating a filament dryer to improve filament flexibility and was configured to operate at the low temperature (<180 °C) required by the alumina filament, enabling the successful fabrication of three distinct TPMS configurations: SD, SG, and SP.
Following polymer removal through debinding, the final ceramic components were produced by partial sintering. Despite printing without sacrificial supports, the observed dimensional deviations remained below 5% for both the wall thickness and pore window diameter, confirming that the described procedure provides adequate manufacturing accuracy.
Furthermore, the characterization of the total porosity provided critical insights into the quality of the manufacturing process. While the target macroporosity was set at 65%, the total porosity estimated from the sample weights yielded values of 74%, 73%, and 70% for SD, SG, and SP, respectively. Considering that the textural porosity determined from calibration cubes was approximately 17% (inherent to the achieved partial sintering), the resulting actual macroporosity values were 57%, 56%, and 53%. This confirms the presence of a highly textured surface morphology, which is consistent with the surface roughness observed in the optical microscopy images (e.g., Figure 6b).
For the TPMS structures tested, the SD and SG unit cells exhibited the lowest pressure drops (ΔP), and SG’s greater permeability makes it the preferred geometry in terms of fluid-dynamic behavior. These experimental results align with the findings of Guerreiro et al. [26] and indicate that macroporosity influences permeability. SD and SG tortuosity are also higher than those of the SP, which shows a higher pressure drop because it has the lowest unit-cell length and actual macroporosity.
On the other hand, the SD substrate exhibited greater geometric tortuosity and slightly higher real porosity (after sintering) than SG. When operated under optimal transport conditions, these enhanced structural parameters facilitate boundary-layer renewal and intra-channel fluid mixing. Therefore, while reactive validation (catalyst coating and catalytic performance) was not evaluated and lies beyond the scope of the present work, the SD architecture also holds strong potential for future deployment in the catalytic cracking of pyrolysis vapors.
Finally, building upon the catalyst substrates developed in this work, the next stage will include washcoat deposition and characterization, followed by catalytic testing. Future research efforts should focus on experimentally isolating the independent influence of macroporosity on permeability, as well as identifying the optimal trade-off between macro-permeability and wall textural porosity to maximize washcoat adhesion and catalyst performance.

Author Contributions

R.D.-V.: Conceptualization, R.D.-V. and L.R.-L.; methodology, R.D.-V., L.R.-L. and E.T.-J.; software, R.D.-V. and L.R.-L.; validation, R.D.-V., L.R.-L. and E.T.-J.; formal analysis, R.D.-V., L.R.-L. and E.T.-J.; investigation, R.D.-V., L.R.-L. and E.T.-J.; resources, R.D.-V., E.T.-J. and F.C.-P.; data curation, R.D.-V., L.R.-L. and E.T.-J.; writing—original draft preparation, R.D.-V. and E.T.-J.; writing—review and editing, R.D.-V. and E.T.-J.; visualization, R.D.-V., L.R.-L. and E.T.-J.; supervision, R.D.-V., E.T.-J. and F.C.-P.; project administration, R.D.-V., E.T.-J. and F.C.-P.; funding acquisition, R.D.-V., E.T.-J. and F.C.-P. All authors have read and agreed to the published version of the manuscript.

Funding

This research was funded by MCIU/AEI/10.13039/501100011033 and FEDER/EU, grant number PID2023-148692OB-C3, and by the Consejería de Universidad, Investigación e Innovación de la Junta de Andalucía within the framework of the FEDER−Andalucía 2014−2020 program, grant number ProyExcel−00662. The APC was funded by the publisher through a full waiver scheme.

Data Availability Statement

The raw data supporting the conclusions of this article will be made available by the authors on request.

Acknowledgments

During the preparation of this study, the authors used Gemini (Google, institutional license, July 2026 version) for the purposes of refining specific manuscript sections into scientific English and digital image processing to remove the backgrounds of selected experimental figures. Additionally, Grammarly Premium was utilized for the final spelling and grammar verification. The authors have reviewed and edited the output and take full responsibility for the content of this publication.

Conflicts of Interest

The authors declare no conflicts of interest.

Abbreviations

The following abbreviations are used in this manuscript:
AMAdditive Manufacturing
DIWDirect Ink Writing
FFFFused Filament Fabrication
SDSchwarz-Diamond
SDFSigned Distance Function
SGSchoen Gyroid
SPSchwarz-Primitive
TPMSTriply Periodic Minimal Surfaces

References

  1. Bai, S.; Hao, Y.; Yan, Y.; Li, L.; Cheng, P.; Tu, Z.; Zhou, H.; Cheng, L.; Mei, H.; Ding, W. Triply Periodic Minimal Surface (TPMS) Structures in 3D-Printed Catalyst Supports: Advanced Optimization of Heat Transfer, Mass Transport, and Mechanical Stability for Catalysis. Adv. Mater. Technol. 2026, e02352. [Google Scholar] [CrossRef] [Scilit]
  2. Wang, H.; Zhao, C.; Liu, W.; Liu, Z.; Bian, H.; Zhang, K. Advances in triply periodic minimal surface structures for thermal management systems: A comprehensive review. Appl. Therm. Eng. 2025, 279, 127481. [Google Scholar] [CrossRef] [Scilit]
  3. Li, J.; Fan, H.; Hua, L.; Du, J.; He, Y.; Jin, Y. Bone implants with triply periodic minimal surface architectures: Design, fabrication, and biological performance. Bio-Des. Manuf. 2025, 8, 672–704. [Google Scholar] [CrossRef] [Scilit]
  4. Samudin, I.M.; Radzuan, N.A.M.; Sulong, A.B.; Ma, Q.; Azman, A.H.; Zamri, W.F.H.W. Stress strain curve analysis of sheet based TPMS structures in quasi static compression test: A review. J. Mater. Res. Technol. 2025, 36, 5757–5796. [Google Scholar] [CrossRef] [Scilit]
  5. Soliman, A.; AlAmoodi, N.; Karanikolos, G.N.; Doumanidis, C.C.; Polychronopoulou, K. A review on new 3-D printed materials’ geometries for catalysis and adsorption: Paradigms from reforming reactions and CO2 capture. Nanomaterials 2020, 10, 2198. [Google Scholar] [CrossRef] [Scilit]
  6. Aguado, J.; Serrano, D.P.; Escola, J.M. Fuels from waste plastics by thermal and catalytic processes: A review. Ind. Eng. Chem. Res. 2008, 47, 7982–7992. [Google Scholar] [CrossRef] [Scilit]
  7. Ratnasari, D.K.; Nahil, M.A.; Williams, P.T. Catalytic pyrolysis of waste plastics using staged catalysis for production of gasoline range hydrocarbon oils. J. Anal. Appl. Pyrolysis 2017, 124, 631–637. [Google Scholar] [CrossRef] [Scilit]
  8. Inayat, A.; Inayat, A.; Schwieger, W.; Sokolova, B.; Lestinsky, P. Enhancing aromatics and olefins yields in thermo-catalytic pyrolysis of LDPE over zeolites: Role of staged catalysis and acid site density of HZSM-5. Fuel 2022, 314, 123071. [Google Scholar] [CrossRef] [Scilit]
  9. Murugesan, S.; Neacșu, V.A.; Marin, M.M.; Radu, I.; Cozorici, D.; Blânzeanu, E.; Zaharia, C.; Sanoja-Lopez, K.A.; Luque, R.; Verziu, M.N. Biomass valorization using 3D-printed catalysts. Commun. Chem. 2025, 9, 26. [Google Scholar] [CrossRef] [Scilit]
  10. Chen, T.; Sun, A.; Chu, C.; Wu, H.; Wang, J.; Wang, J.; Li, Z.; Guo, J.; Xu, G. Rheological behavior of titania ink and mechanical properties of titania ceramic structures by 3D direct ink writing using high solid loading titania ceramic ink. J. Alloys Compd. 2019, 783, 321–328. [Google Scholar] [CrossRef] [Scilit]
  11. Li, X.; Li, W.; Rezaei, F.; Rownaghi, A. Catalytic cracking of n-hexane for producing light olefins on 3D-printed monoliths of MFI and FAU zeolites. Chem. Eng. J. 2018, 333, 545–553. [Google Scholar] [CrossRef] [Scilit]
  12. Lawson, S.; Farsad, A.; Rezaei, F.; Ludlow, D.; Rownaghi, A.A. Direct ink writing of metal oxide/H-ZSM-5 catalysts for n-hexane cracking: A new method of additive manufacturing with high metal oxide loading. ACS Appl. Mater. Interfaces 2020, 13, 781–794. [Google Scholar] [CrossRef] [Scilit]
  13. Luzzi, E.; Rea, R.; Mangano, E.; Brandani, S.; Caputo, D.; Aprea, P. Performance− driven optimization of 3D− printed zeolite− based monoliths for carbon capture. Open Ceram. 2026, 26, 100949. [Google Scholar] [CrossRef] [Scilit]
  14. Papkov, V.; Tartakovsky, L.; Pashchenko, D. Triply periodic minimal surfaces as catalyst carriers of compact reformers for hydrogen production and storage systems: Recent advances and future perspectives. Renew. Sustain. Energy Rev. 2026, 237, 117070. [Google Scholar] [CrossRef] [Scilit]
  15. Car, F.; Zekić, N.; Vrsaljko, D.; Tomašić, V. Innovative production of 3D-printed ceramic monolithic catalysts for oxidation of VOCs by using fused filament fabrication. Catalysts 2025, 15, 125. [Google Scholar] [CrossRef] [Scilit]
  16. Bhandari, S.; Heim, T.; De Bona, E.; Sglavo, V.M.; Rheinheimer, W.; Biesuz, M.; Franchin, G. Rapid processing of Al2O3 ceramics by fused filament fabrication and ultrafast high-temperature debinding and sintering. J. Alloys Compd. 2025, 1017, 178812. [Google Scholar] [CrossRef] [Scilit]
  17. Anil, A.; Nadimpalli, R. Transforming FDM into a High-Performance Tool for Multifunctional Ceramic 3YSZ Fabrication. Open Ceram. 2025, 100887. [Google Scholar] [CrossRef] [Scilit]
  18. Hamza, A.; Azam, M.U.; Raza, A.; Mao, S.; Askar, K.; Zhang, T. Additive manufacturing of ceramic composite cellular structures by spontaneous infiltration of copper oxide in alumina. J. Mater. Res. Technol. 2025, 34, 1539–1548. [Google Scholar] [CrossRef] [Scilit]
  19. Al-Ketan, O.; Abu Al-Rub, R.K. Multifunctional mechanical metamaterials based on triply periodic minimal surface lattices. Adv. Eng. Mater. 2019, 21, 1900524. [Google Scholar] [CrossRef] [Scilit]
  20. Hossain, M.S.; Hossain, M.M.; Nilufar, S. An Overview of Additive Manufacturing of Triply Periodic Minimal Surface (TPMS) Structures. Polymers 2025, 17, 3307. [Google Scholar] [CrossRef] [Scilit]
  21. Ahmad, S.Z.; Masood, M.H.; Khattab, M.U.; Ahmad, S.S.; Zaidi, S.A.A.; Khan, S.Z. Recent Developments in Novel TPMS Lattice Materials: Design Optimization, Performance Control, and Applications in Biomimetic Scaffolds. Materials 2025, 18, 5209. [Google Scholar] [CrossRef] [Scilit]
  22. Hyde, S.; Ninham, B.W.; Andersson, S.; Larsson, K.; Landh, T.; Blum, Z.; Lidin, S. Chapter 1—The Mathematics of Curvature, The Language of Shape; Elsevier Science B.V.: Amsterdam, The Netherlands, 1997; pp. 1–42. [Google Scholar] [CrossRef] [Scilit]
  23. Reid, S.; Lecarpentier, F.; Symons, D.; Watson, M. Towards an advanced 3D-printed catalyst for hydrogen peroxide decomposition: Development and characterisation. Catal. Today 2023, 418, 114155. [Google Scholar] [CrossRef] [Scilit]
  24. Inayat, A.; Klumpp, M.; Lämmermann, M.; Freund, H.; Schwieger, W. Development of a new pressure drop correlation for open-cell foams based completely on theoretical grounds: Taking into account strut shape and geometric tortuosity. Chem. Eng. J. 2016, 287, 704–719. [Google Scholar] [CrossRef] [Scilit]
  25. Fu, J.; Thomas, H.R.; Li, C. Tortuosity of porous media: Image analysis and physical simulation. Earth-Sci. Rev. 2021, 212, 103439. [Google Scholar] [CrossRef] [Scilit]
  26. Guerreiro, R.; Pires, T.; Guedes, J.M.; Fernandes, P.R.; Castro, A.P. On the tortuosity of TPMS scaffolds for tissue engineering. Symmetry 2020, 12, 596. [Google Scholar] [CrossRef] [Scilit]
  27. Palomar-Torres, A.; Torres-Jimenez, E.; Kegl, B.; Bombek, G.; Volmajer-Valh, J.; Lešnik, L. Catalytic pyrolysis of plastic wastes for liquid oils’ production using ZAP USY zeolite as a catalyst. Int. J. Environ. Sci. Technol. 2023, 20, 17–30. [Google Scholar] [CrossRef] [Scilit]
  28. Al-Ketan, O.; Pelanconi, M.; Ortona, A.; Abu Al-Rub, R.K. Additive manufacturing of architected catalytic ceramic substrates based on triply periodic minimal surfaces. J. Am. Ceram. Soc. 2019, 102, 6176–6193. [Google Scholar] [CrossRef] [Scilit]
  29. Kim, D.; Tran, J.; Philip, J. Pressure drop in engineered (TPMS-based) porous media. J. Fluid Mech. 2026, 1028, A8. [Google Scholar] [CrossRef] [Scilit]
  30. Gargiulo, I.; Vita, A.; Italiano, C.; Tanco, M.L.; Tanaka, D.P.; Gallucci, F. Activated triply periodic minimal surfaces (TPMS) gyroid supports for efficient ammonia synthesis in membrane-integrated reactors. Int. J. Hydrogen Energy 2026, 235, 155170. [Google Scholar] [CrossRef] [Scilit]
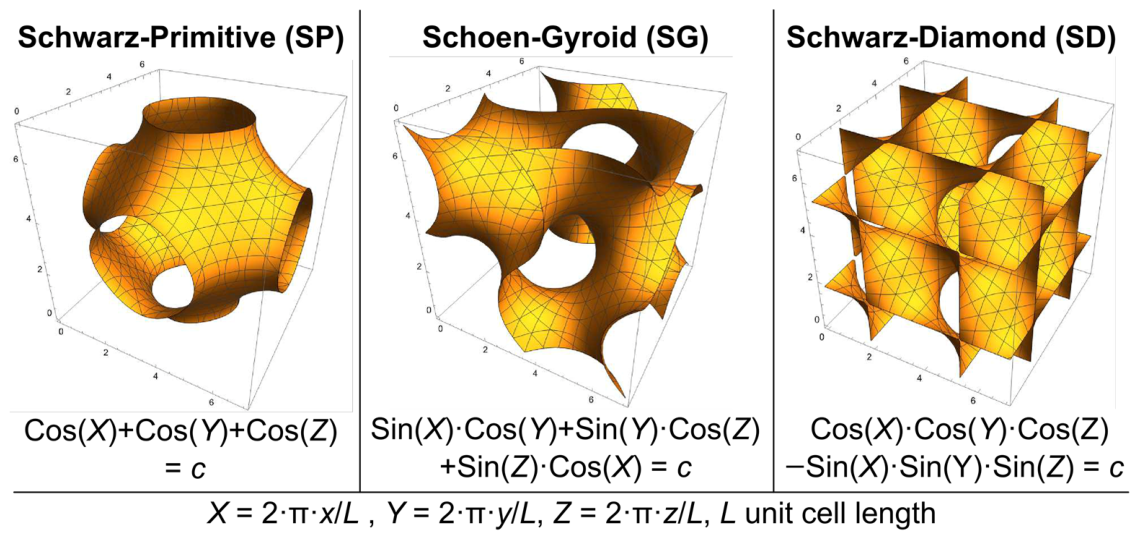
Figure 1. Geometric representation of the three TPMS unit cells evaluated in this work, along with their defining equations.
Jcs 10 00432 g001
Figure 2. Flowchart of the geometric modeling procedure used to define the internal architecture of each of the three proposed filters.
Jcs 10 00432 g002
Figure 3. Equipment used: (a) 3D printer regular configuration, (b) printer adaptation for alumina (drying), (c) HOBERSAL furnace.
Jcs 10 00432 g003
Figure 4. Temperature profile: (red) chemical debinding, (blue) sintering.
Jcs 10 00432 g004
Figure 5. Definition of pore window diameter dw.
Jcs 10 00432 g005
Figure 6. (a) Optical microscope and (b) schematic diagram of the experimental determination of pore window diameter and wall thickness.
Jcs 10 00432 g006
Figure 7. In-house test bench to determine the pressure drop and permeability of the printed monolith samples.
Jcs 10 00432 g007
Figure 8. Macroporosity and unit cell relation for the three TPMS tested and estimation of L to obtain cells with ε0 = 65%.
Jcs 10 00432 g008
Figure 9. Example of the cubical samples printed to determine material shrinkage and textural porosity.
Jcs 10 00432 g009
Figure 10. Example of printed samples: (a) SG configuration before and after sintering and (b) general view of the three filter configurations after sintering.
Jcs 10 00432 g010
Figure 11. Measured pressure drop for printed TPMS samples.
Jcs 10 00432 g011
Table 1. Printing parameters for alumina.
ParameterValue
Fan (%)100
Printing Temperature (°C)170
Bed Temperature (°C)40
Retraction distance (mm)0.8
Retraction speed (mm/s)40
Layer height (mm)0.15
Printing speed (mm/s)30
Table 2. Computed filter characteristics for different TPMS and unit-cell lengths.
TPMSL/mmVTPMS/mm3Vvoid/mm3S/mm2dw/mmFilter’s Performance
Parameters
ε 0Sv/(1/mm)τ
SD323.343.6665.740.640.142.43-
572.4852.52212.291.590.421.702.60
7146.18196.82419.072.530.571.222.35
9244.54484.46686.783.470.660.942.23
SG320.126.8864.350.650.252.382.51
559.7065.30180.881.590.521.452.10
7119.11223.89346.312.540.651.011.98
9198.19530.81562.433.490.730.771.92
SP315.8711.1352.440.560.411.941.66
545.9979.01137.711.440.631.101.63
791.17251.83261.122.330.730.761.60
9151.32577.68422.133.210.790.581.59
Table 3. TPMS unit-cell lengths to obtain ε0 = 65%.
TPMSL/mmdw/mmFilter Performance Parameters
Sv/(1/mm)τ
SD8.63.290.982.28
SG7.12.580.941.97
SP5.21.531.081.64
Table 4. Results of the experimental dimensional characterization.
Measurements/mm
(Average 3 Samples)
Relative Error/%
TPMSDHdwtε/%DHdwt
SD19.7820.553.160.76741.12.73.94.9
SG19.7020.342.660.80731.51.73.10.0
SP19.7620.611.580.78701.23.03.32.0
Table 5. Example of measurements obtained during pressure drop measurements.
SD Sample 1Pitot Tube Measurements */(m/s)Ambient
Temperature **/°C
Test Bench
Temperature **/°C
Pressure Drop */Pa
Fan 100%4.4921.44271830
Fan 70%3.4921.64201303
Fan 50%3.1921.8415995
* Profile integration of speed profile at the admission tube; ** Mean value of 10 measurements.
Disclaimer/Publisher’s Note: The statements, opinions and data contained in all publications are solely those of the individual author(s) and contributor(s) and not of MDPI and/or the editor(s). MDPI and/or the editor(s) disclaim responsibility for any injury to people or property resulting from any ideas, methods, instructions or products referred to in the content.