1. Introduction
Woven fabric-reinforced laminates (FRLs) are widely used in flexible composite structures, where service performance depends strongly on the bonding between woven reinforcements, adhesive materials, and polymeric films [
1,
2]. The recent yarn pullout in laminate (YPiL) test developed in our prior work is a unique pullout-based method specifically designed for adhesive-bonded woven FRLs. It differs fundamentally from yarn pullout tests from dry woven fabrics and from classical fiber pullout tests in fiber-reinforced composites [
1,
2,
3]. Although these test methods may appear similar, they involve different material systems, controlling mechanisms, and evaluation purposes.
Yarn pullout tests of dry woven fabrics are primarily used to characterize yarn mobility, frictional locking, and structural energy dissipation in non-bonded textile fabrics [
4,
5,
6,
7,
8]. By contrast, classical fiber pullout tests in fiber-reinforced composites are commonly used to evaluate the fiber–resin interface. Their response is commonly interpreted by whether the embedded fiber debonds and pulls out cleanly or fractures. In general, fiber fracture indicates stronger interfacial load transfer, whereas clean pullout indicates weaker bonding [
9,
10]. The YPiL test addresses a different problem. It is designed to avoid yarn breakage during pullout from the laminate. The measured response reflects the combined effects of woven structural restraint, adhesive anchoring, and complex bonding failures within the laminate. Therefore, the YPiL test should not be interpreted as a conventional pullout test reported in the literature.
Our prior work introduced YPiL to overcome the limitations of conventional T-peel and shear-type methods for FRLs and demonstrated that maximum pullout force correlates with peel strength and adhesive chemistry, establishing YPiL as an effective bonding quality assessment method [
1,
2]. A more recent comparative study showed that YPiL correlates strongly with T-peel behavior while exhibiting lower standard deviations and coefficients of variation across operators and testing equipment, supporting YPiL as a more consistent and service-relevant adhesion test for FRLs [
3]. However, the analytical value of YPiL is not limited to maximum pullout force alone, because the force–displacement curve records a multi-stage pullout process unique to adhesive-bonded woven FRLs. Laminates with similar maximum pullout force can still differ substantially in curve shape and total energy dissipation. This motivates the present study, which further develops the YPiL test into an energy-based framework for evaluating bonding performance in woven FRLs.
Extensive research on yarn pullout in dry woven fabrics has shown that resistance force is mainly due to yarn-to-yarn friction, crimp interchange, pre-tension, and structural restraint of the woven construction, yielding multi-zone force–displacement curves [
4,
5,
6,
7,
8,
9,
10] that reflect complex structural energy dissipation [
6,
7]. These mechanisms are also observed in YPiL tests of FRLs, but the presence of adhesives adds anchoring effects that significantly alter the pullout process. Likewise, micromechanical studies of fiber pullout in composites [
11,
12,
13], cementitious materials [
14,
15,
16], and elastomeric matrices [
17,
18,
19] have revealed distinct bonded, debonding, and post-debonding friction phases [
11,
18,
19]. These studies also emphasize the roles of interface condition, embedded length, shear stress distribution, and pullout resistance [
11,
12,
20]. Although they provide useful background for interpreting pullout mechanisms, they do not represent yarn pullout from adhesive-bonded woven FRLs. Therefore, neither dry-fabric yarn pullout tests nor classical composite fiber pullout tests provide a complete framework for interpreting YPiL responses in woven FRLs.
Due to the multi-stage yarn pullout behavior in YPiL tests, understanding parameter effects and their interactions on bonding performance is essential for advanced FRL design. Statistical analysis provides a practical way to quantify these effects and develop predictive relationships. Analysis of variance (ANOVA) and general linear modeling (GLM) are widely used in composite research to quantify main effects, interactions, and performance indicators, with GLM being particularly effective for handling multi-level factors and developing predictive models from large datasets [
21,
22,
23]. For instance, GLM has been used to optimize the mechanical properties of various composite materials, including 3D-printed CF/PA composites [
24], carbon fabric/PEK laminates [
25], and silk fiber-reinforced polypropylene composites [
26]. It has also been applied to evaluate thermal properties and identify key factors affecting the thermal stability of PLA/PCL blends for fused filament fabrication [
27]. These applications demonstrate the value of GLM in identifying important parameter effects and interactions and developing predictive relationships for composite performance.
Our prior YPiL studies generated a comprehensive dataset covering laminated flexible composite structures with different woven fabric parameters and adhesive contents, making it well-suited for GLM. This enables identification of significant bonding-related parameters and their interactions, as well as development of predictive models for laminate bonding performance and energy dissipation in YPiL tests. Ultimately, the goal is to design laminates with high bonding quality to meet the end-use requirements.
1.1. Theory
Mechanistically, a typical YPiL force–displacement curve should not be interpreted as a single “strength” event defined only by the maximum pullout force. Instead, it records a sequence of interactive processes, potentially including yarn straightening/de-crimping, elastic deformation, interfacial debonding, cohesive deformation of the adhesive material, and frictional sliding during yarn pullout [
1,
6,
8,
11,
19]. Consequently, yarn pullout performance of the YPiL test is more appropriately evaluated using energy/work. This is consistent with yarn pullout studies in woven fabrics, where the geometry of the force–displacement curve shows mechanistic information related to yarn interlacement, friction, and progressive slippage [
5,
6,
8].
From a mechanistic perspective, bonding performance in composite structures can be quantified by the work required to separate the reinforcement from the matrix. In a pullout test, this work is directly equivalent to the dissipated energy, E. Likewise, the energy metrics in YPiL tests can be mathematically expressed as:
where F represents the yarn pullout force (N), and δ is the displacement (mm), with δ
* denoting the displacement at the zone transitioning points of the curves [
1,
11].
In YPiL tests of woven FRLs, yarn pullout mechanisms are further complicated by adhesive anchoring effects and by the coexistence of adhesive and cohesive failure mechanisms. As a result, the force–displacement response exhibits distinct multi-stage behavior. By contrast, classical single-fiber pullout studies in polymer matrices or cementitious composites do not involve woven structures and only emphasize fiber–matrix interfacial debonding, simple frictional sliding, and associated energy dissipation [
11,
12,
13,
14,
15,
16,
17,
18,
19,
20]. Likewise, yarn pullout studies in dry woven fabrics capture inter-yarn friction, yarn interlacement, and crimp-related sliding effects, but do not represent the bonded laminate condition of woven FRLs. A comprehensive interpretation of YPiL curves must therefore integrate both effects of woven fabric structural parameters and complex adhesive–reinforcement bonding failure mechanisms. This is necessary for reliable bonding performance prediction and laminate design optimization.
As illustrated in
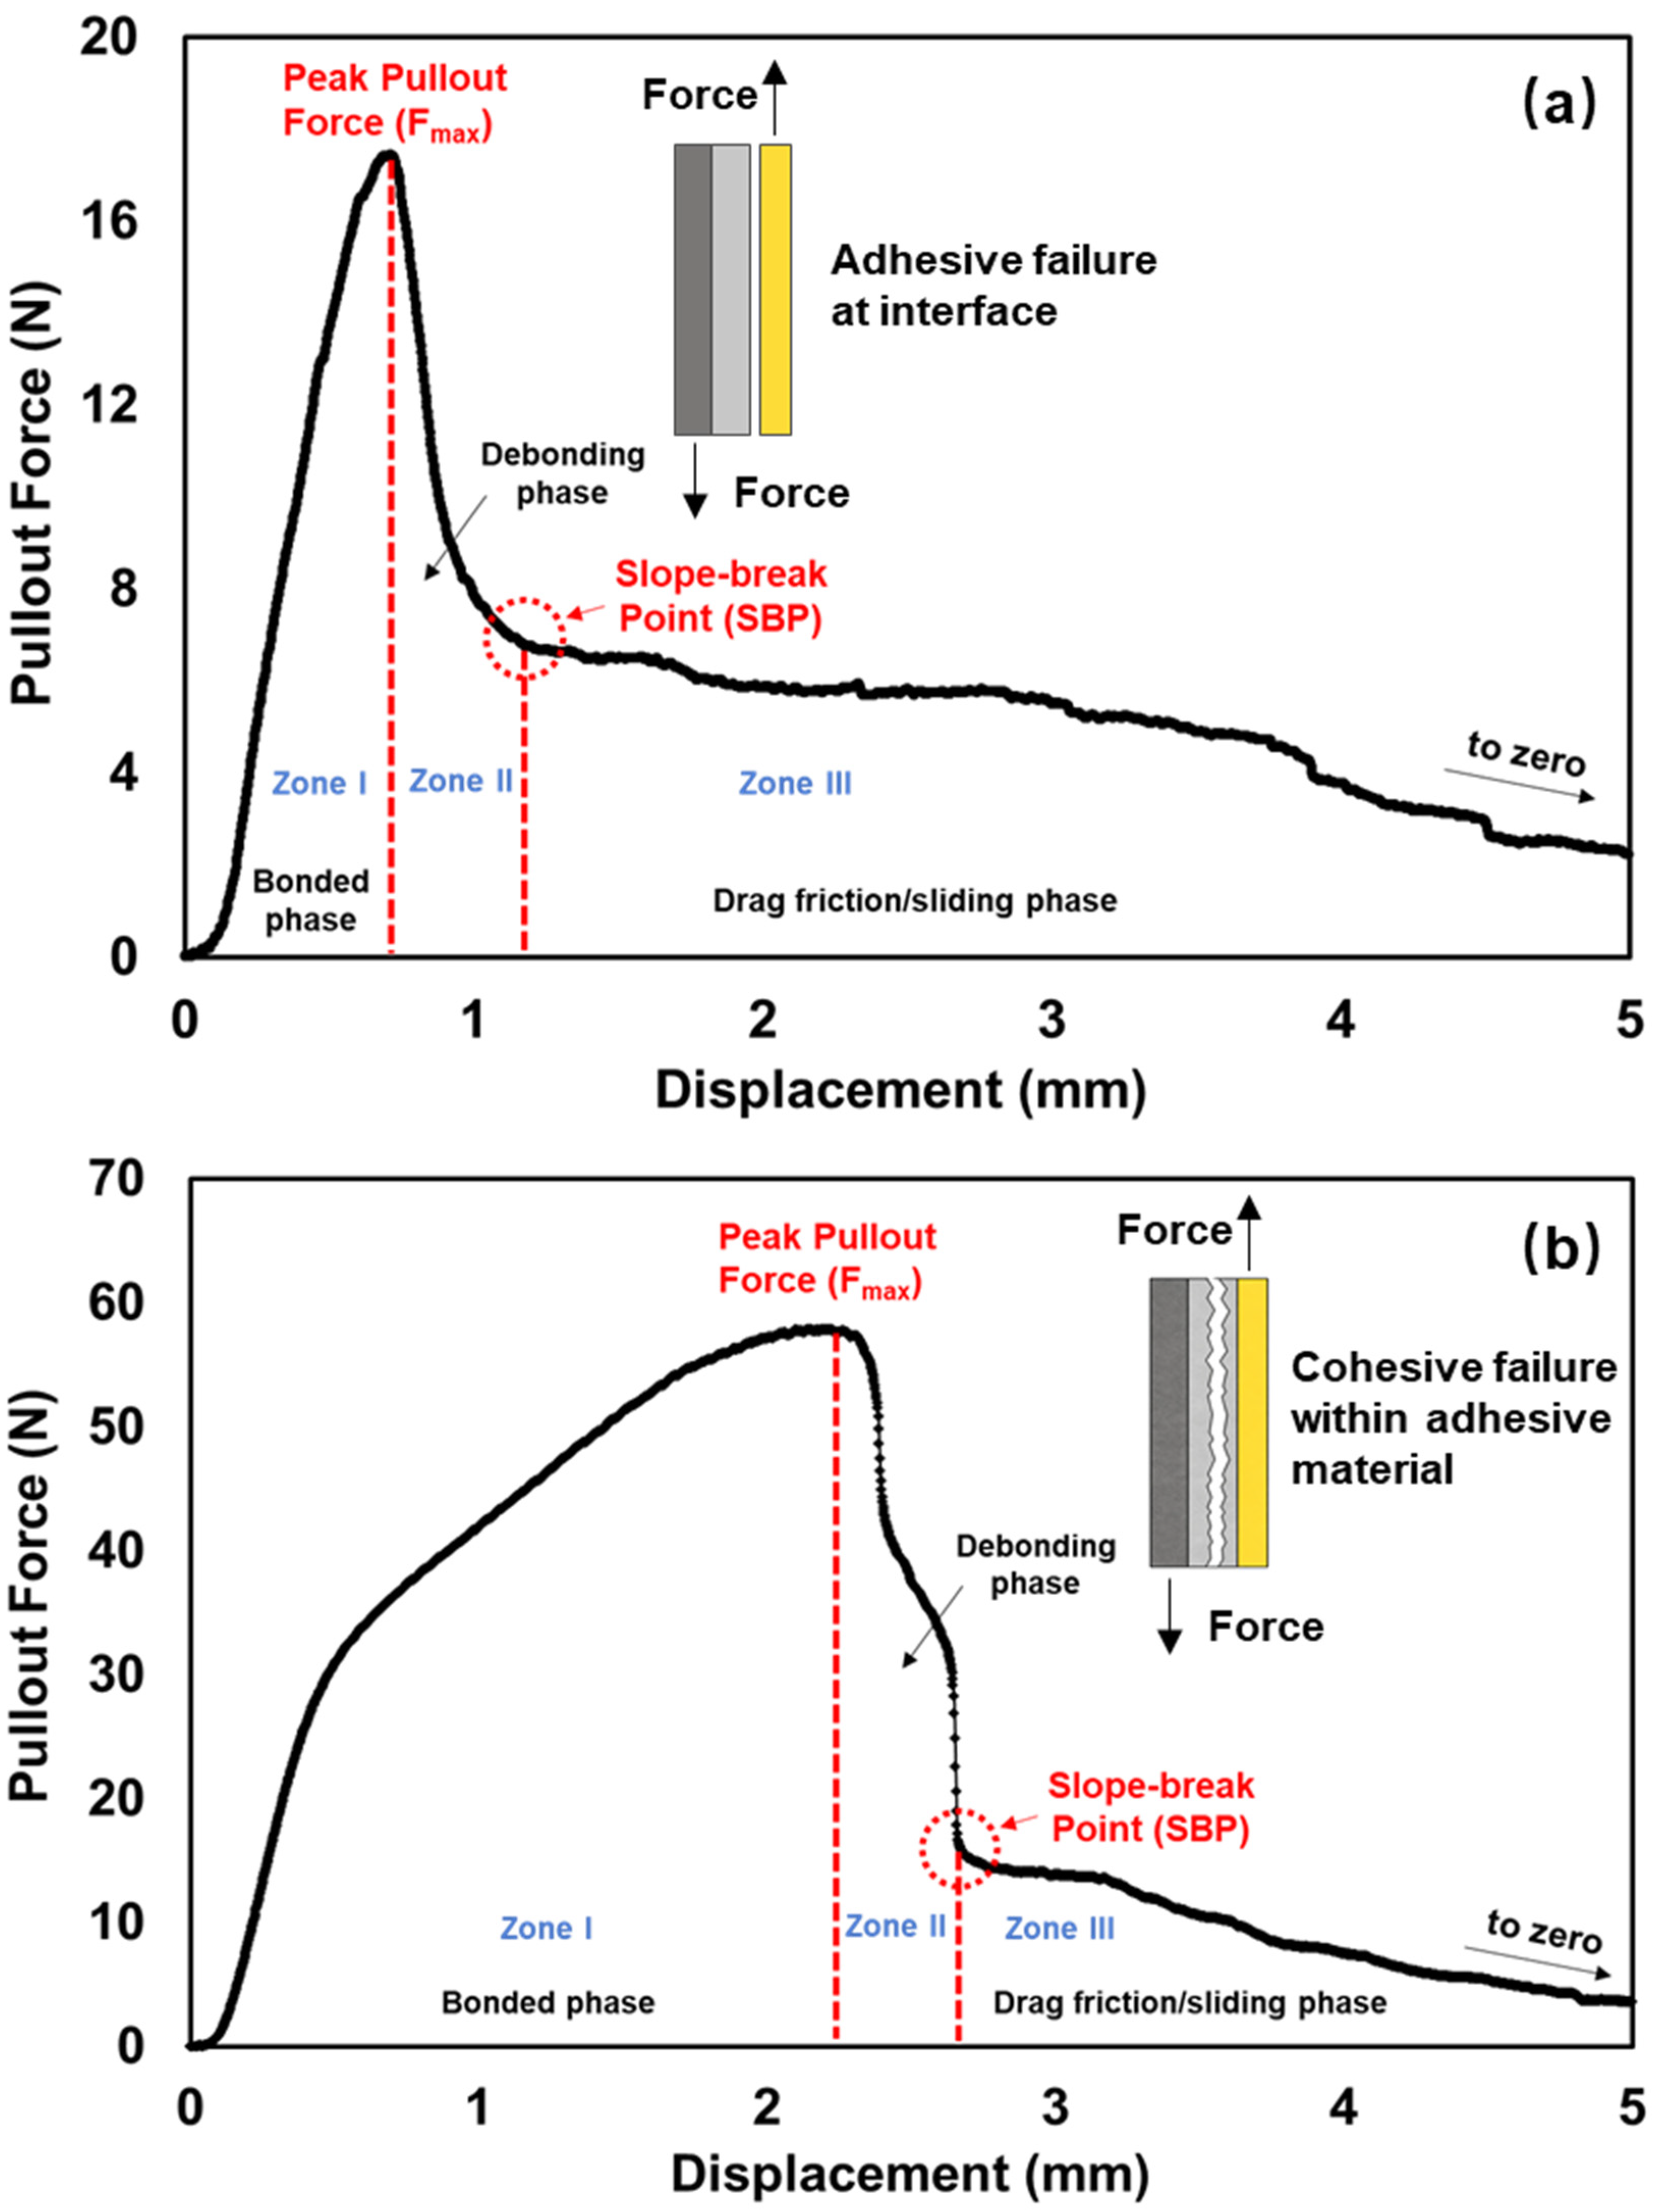
Figure 1, a practical framework for interpreting YPiL responses is to divide the force–displacement curve into mechanistically distinct zones. Two representative curve types are identified in this study, corresponding to adhesive-failure-dominant response (
Figure 1a) and cohesive-failure-dominant response (
Figure 1b), both of which can be segmented into three characteristic zones. In this study, adhesion specifically refers to the bonding between the pullout yarn and the surrounding adhesive material, with adhesive failure occurring primarily at the yarn–adhesive interface, as illustrated schematically in
Figure 1a. Cohesion refers to the integrity of the adhesive material itself, with cohesive failure occurring by deformation or rupture within the adhesive material, as illustrated schematically in
Figure 1b. The broader term “bonding performance” is used to describe the overall laminate resistance to structural failures during yarn pullout without implying a single controlling mechanism, since it may reflect adhesion, cohesion, or both. In practice, these descriptors are used to indicate the dominant bonding failure mechanism reflected by the YPiL response, while recognizing that secondary contributions from the other mechanism may also be present.
1.2. Zone I—Bonded Phase
In the bonded phase, the pullout yarn remains mechanically anchored within the laminate structure. In the adhesive failure response shown in
Figure 1a, this region exhibits a steep, quasi-linear increase in force with displacement, indicating elastic interaction between the yarn and the surrounding adhesive material and an intact yarn–adhesive interface. The pullout resistance in this scenario is primarily from elastic deformation of the yarn and adhesive material, together with the shear stiffness of the bonded interface [
1,
11]. In contrast, the cohesive failure response in
Figure 1b displays a two-stage behavior, with an initial steep linear segment followed by a reduced-slope region prior to reaching the maximum pullout force. This slope reduction may suggest the onset of distributed deformation within the adhesive material while strong adhesion between yarn and adhesive is still largely maintained. Under this condition, energy dissipation in Zone I is not purely elastic; a portion of the accumulated energy is dissipated through adhesive material deformation and stress redistribution before macro-damage begins [
11,
17,
18]. The maximum pullout force at the end of Zone I represents the maximum load-bearing capacity of the adhesive-bonded woven FRL system. The energy dissipated in Zone I, denoted E
1, accounts for yarn–adhesive elastic interaction, early cohesive deformation, and resistance to interfacial debonding [
11,
19,
20].
1.3. Zone II—Debonding Phase
This phase captures the transition from stable load transfer to damage-dominated behavior and begins immediately after the maximum pullout force. In the adhesive failure curve, this phase is characterized by a gradual force reduction associated with progressive interfacial debonding, consistent with crack propagation along the yarn–adhesive interface [
1,
11]. The slope-break point (SBP) marks the transition from an interfacial debonding regime to a friction-dominant sliding regime. By contrast, in the cohesive failure curve, Zone II is distinguished by a more abrupt force drop after the maximum pullout force. This behavior is consistent with rapid rupture of the load-bearing adhesive material after substantial deformation, rather than with progressive interfacial debonding [
1,
17,
28]. In more elastic adhesives, this type of response is often accompanied by adhesive flow along the yarn and extended ductile tails. The SBP in this case indicates a loss of adhesive material structural continuity. Although Zone II is typically a small displacement range, it plays a critical role in differentiating cohesive failure from adhesive failure. The energy accumulated up to this point, denoted E
2, reflects the resistance of the laminate to damage initiation and propagation. It provides a more representative measure of laminate adhesion and cohesion performance of the adhesive material [
1,
11,
28].
1.4. Zone III—Drag Friction/Sliding Phase
This phase corresponds to post-failure sliding, during which the yarn is progressively pulled out from the laminate under decreasing resistance. In both curve types, the pullout force declines with increasing displacement. This response is governed by frictional forces between the yarn and surrounding adhesive material, as well as geometric resistance from the woven structure. As yarn pullout progresses, this resistance decreases because the number of crossing yarns interlaced with the pullout yarn reduces. Since the yarn is pulled through a crimped path, it must progressively straighten and pass successive crossover points, producing a decreasing resistance that can exhibit stick–slip features. The dissipated frictional energy represents the work done against drag friction as the yarn slides out of the laminated woven structure [
6,
8]. The total energy, denoted E
total, comprising the sum of E
2 and frictional energy, thus quantifies the total fracture work during the entire yarn pullout process, offering a holistic measure of laminate bonding and structural integrity [
1].
1.5. Definition of Curve Markers and Energy Metrics
To ensure consistent interpretation across different laminate configurations, several characteristic points and energy metrics are defined on the YPiL force–displacement curve. The maximum pullout force, Fmax, is defined as the highest measured force during yarn pullout. The slope-break point (SBP) is defined as the displacement at which a clear reduction in tangent slope is observed. Depending on the dominant laminate bond failure mode, this point may correspond to the onset of interfacial debonding, matrix softening, or loss of structural continuity in the adhesive. Based on these markers, the energy E1 corresponds to the work accumulated from the onset of loading to Fmax. The energy E2 corresponds to the work accumulated from the onset of loading to the SBP. The total pullout energy, Etotal, corresponds to the work required to fully pull the yarn out from the laminate. These energy metrics provide a unified framework for quantifying bonding performance across different failure modes without requiring direct observation of adhesive or cohesive failures.
The objective of this study is to extend the YPiL methodology from maximum pullout force evaluation to an energy-based framework for bonding assessment of woven FRLs, supported by statistical modeling. First, we analyzed the bond failure mechanisms controlling yarn pullout in woven FRLs and interpreted the YPiL force–displacement response to define total and physically meaningful zone-specific energy metrics. Second, we applied a numeric GLM to identify critical laminate parameters and interactions affecting woven FRL bonding performance and to construct a predictive model for the laminate structures examined in this study. By integrating experimental YPiL data, bonding mechanics, energy-based interpretation, and statistical analysis, this study provides a quantitative framework for comparing and predicting the bonding performance of woven FRLs.
3. Results and Discussion
3.1. Optical Microscopy of Post-YPiL Failure Morphology
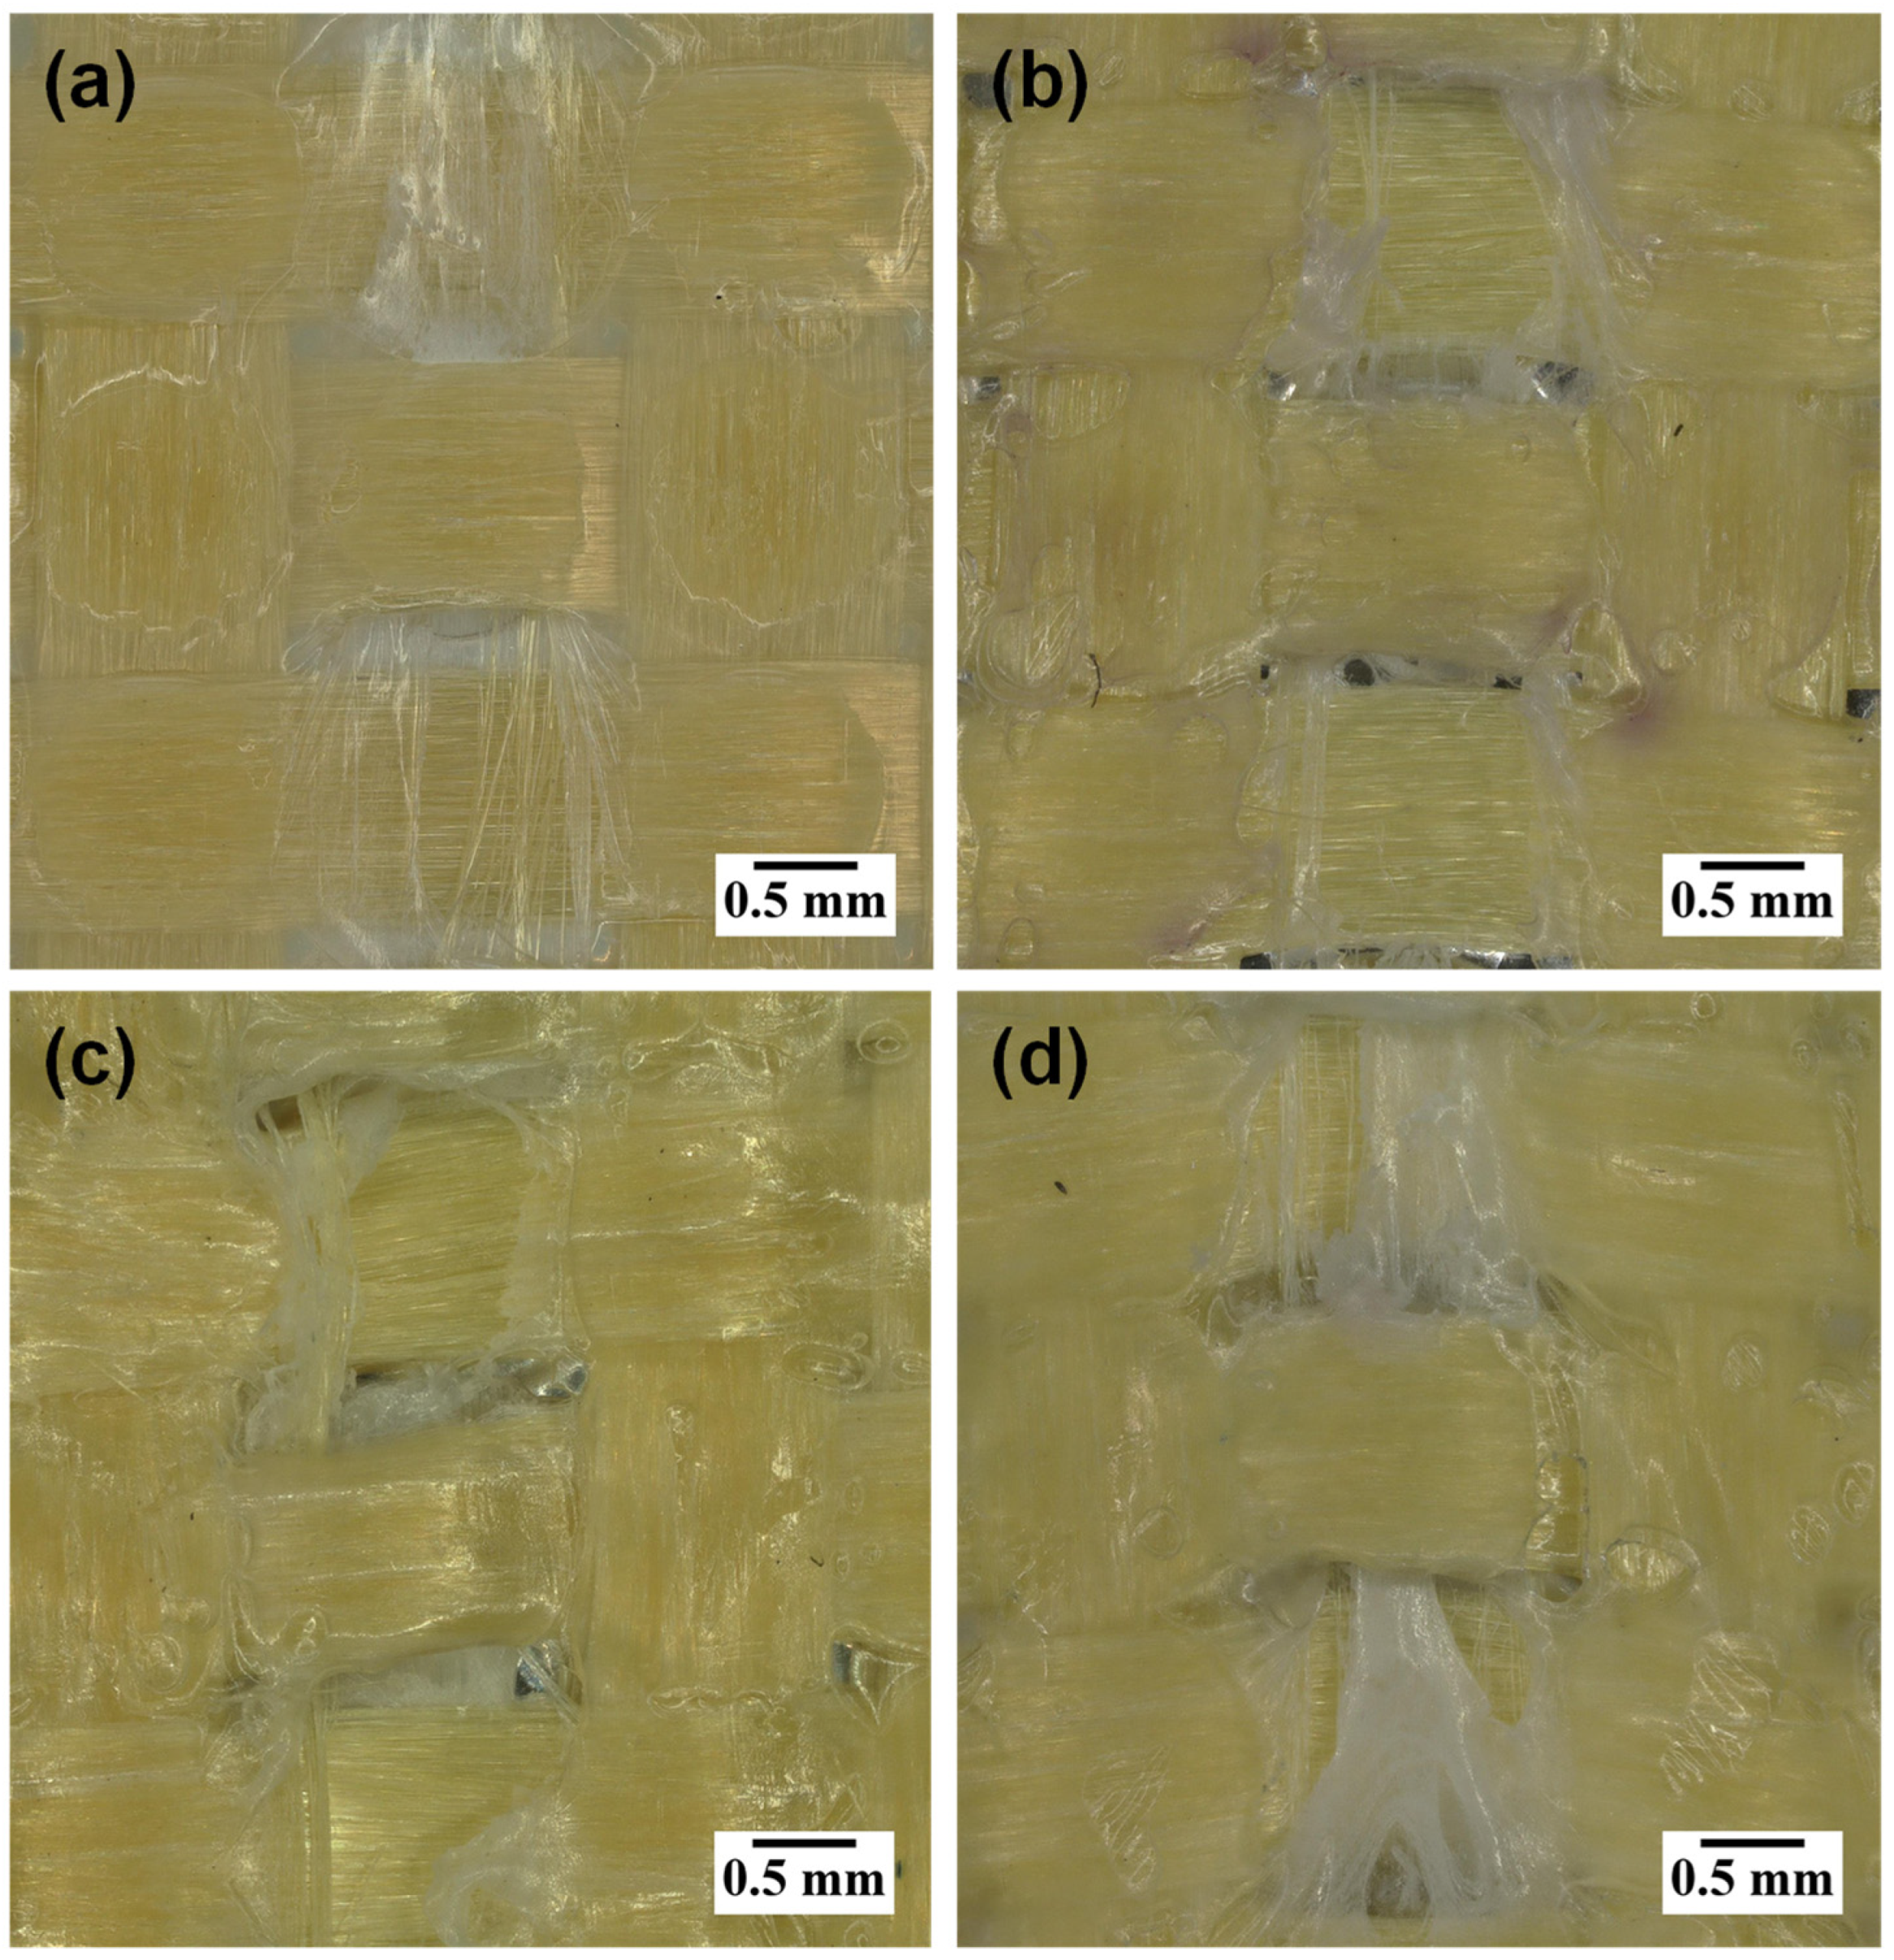
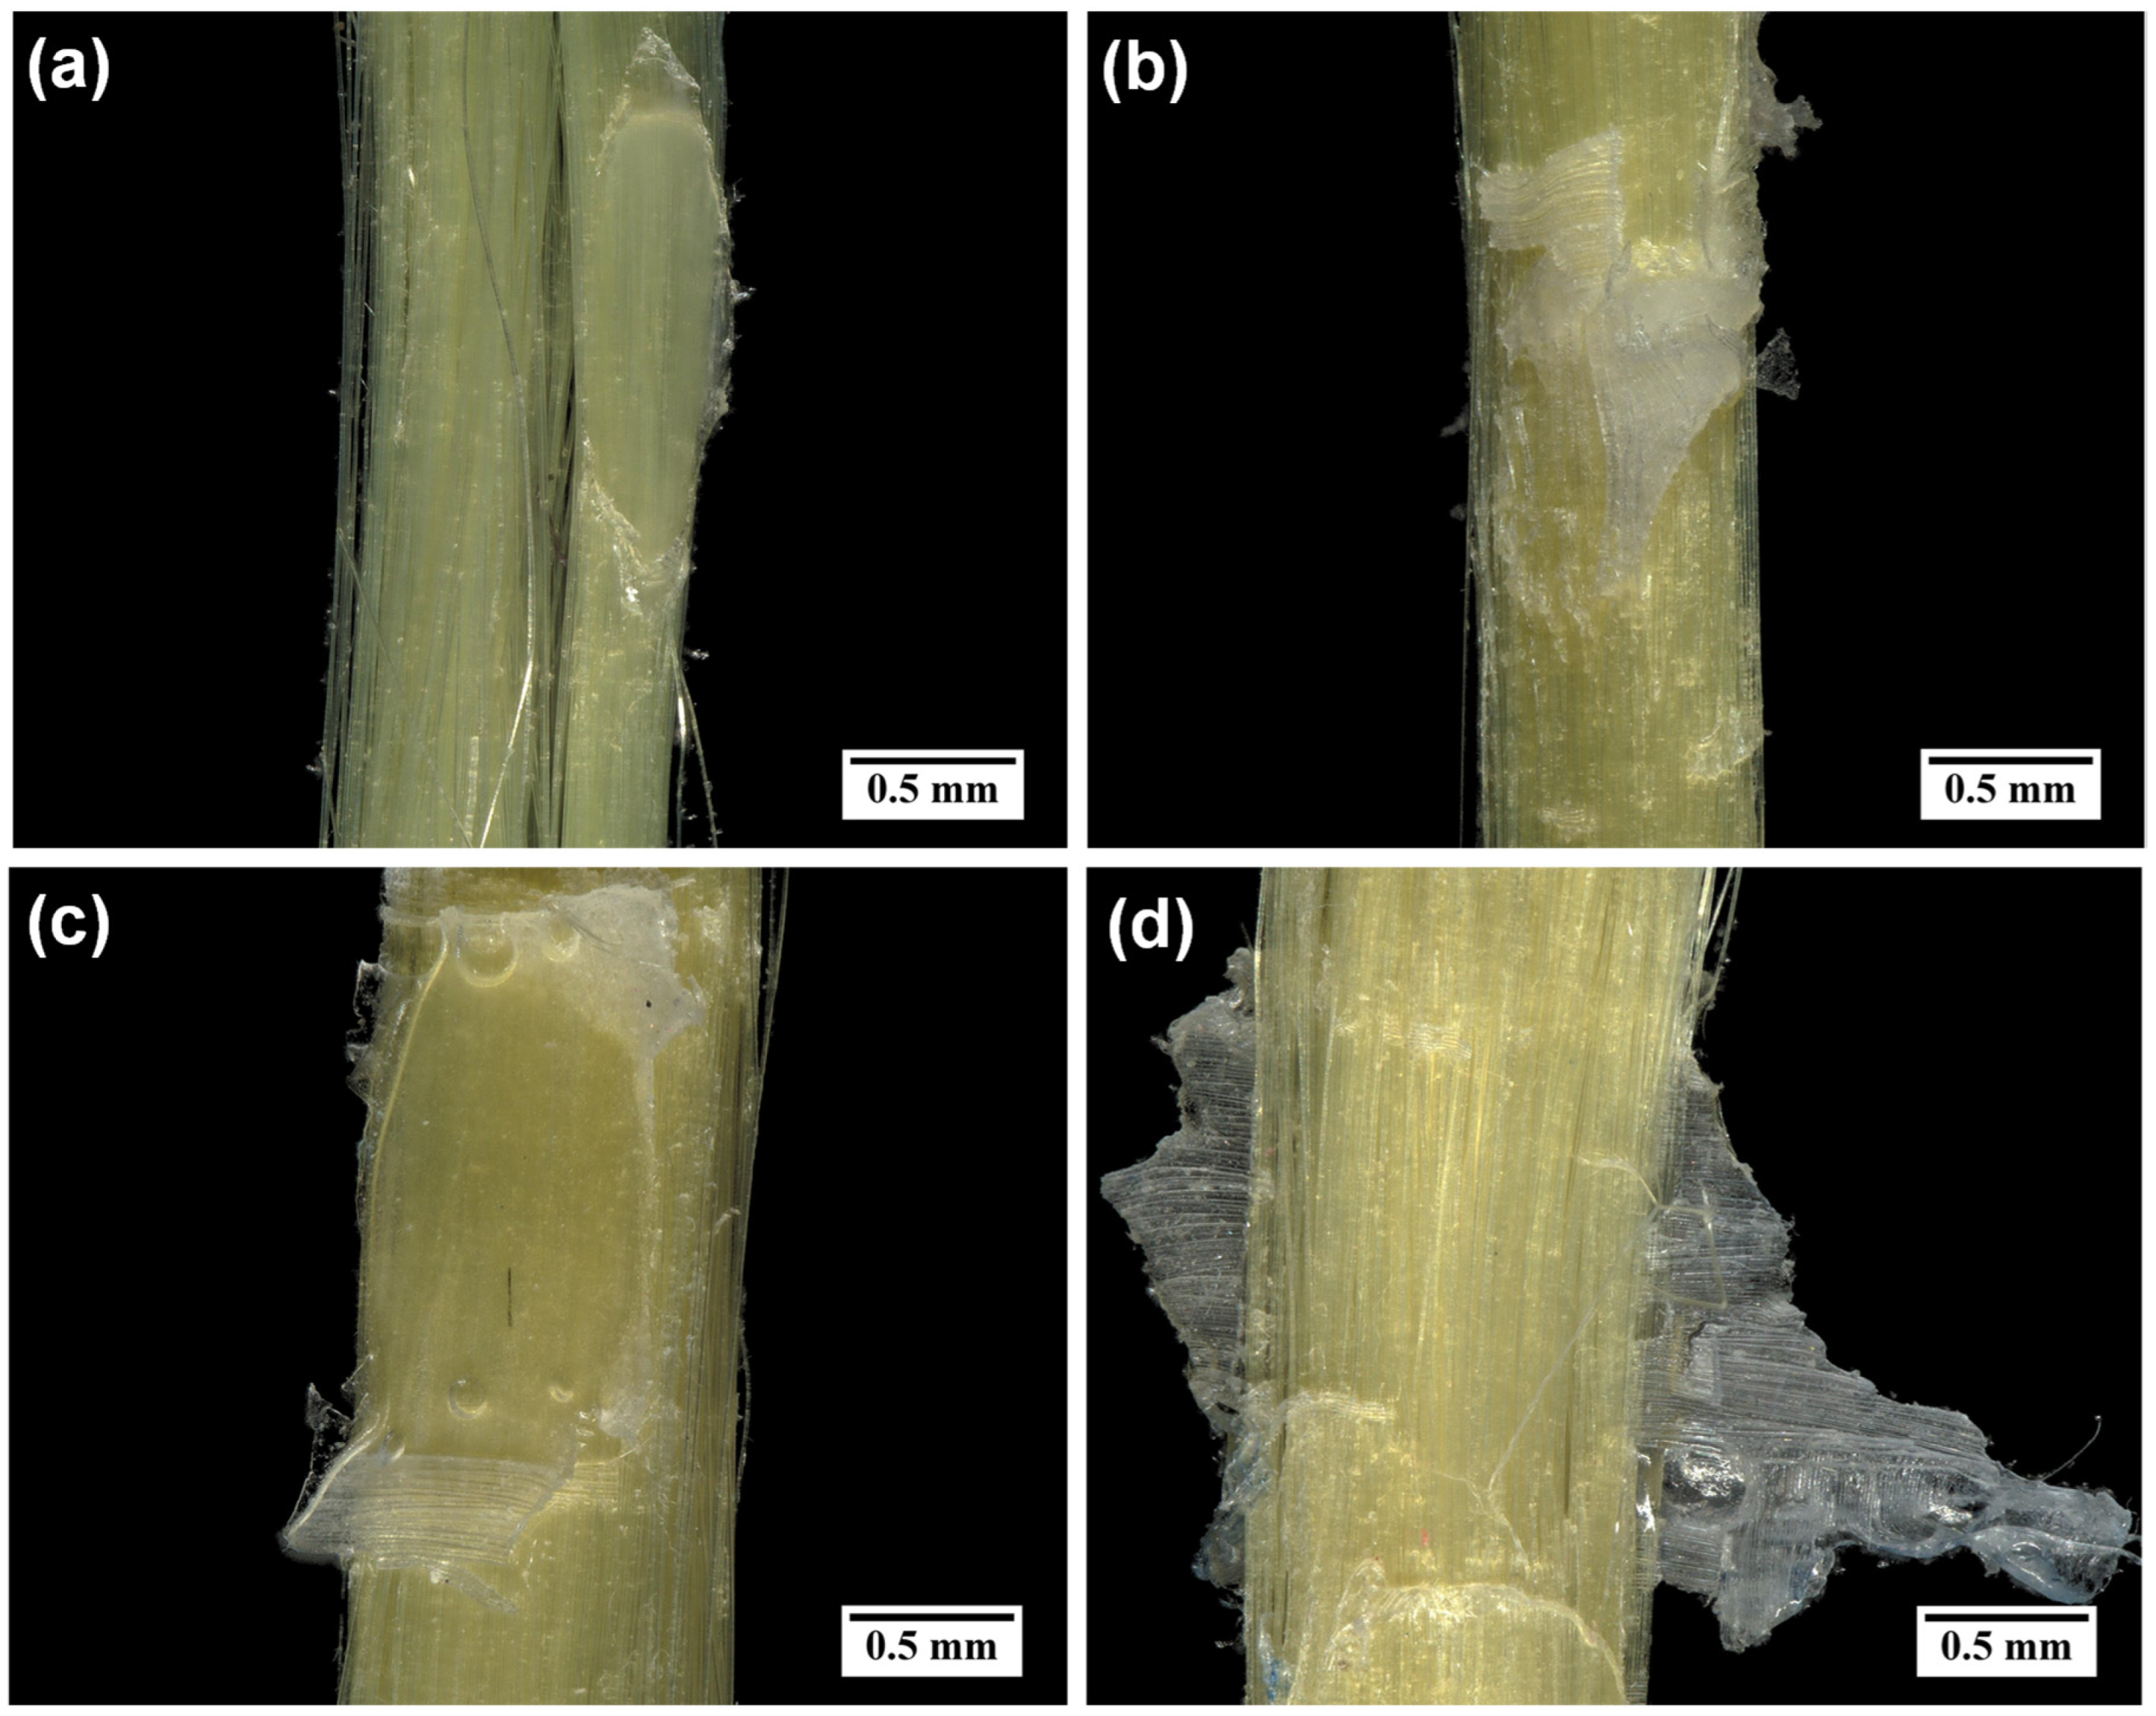
To provide qualitative optical support for the bonding failure interpretation discussed in the Theory section above, representative post-YPiL optical microscopic images were taken from the 170 g/m2 FRL specimens at different fabric-to-adhesive ratios (r). These images are used to examine changes in residual adhesive morphology on both the laminate pullout region and the pullout yarn surface as adhesive content increases (r decreasing). In general, they offer useful visual evidence of how post-YPiL sample morphology changes with adhesive ratio and are therefore helpful for interpreting the YPiL response.
Figure 4 shows representative optical microscopic images of the pullout region in the laminate after YPiL testing. At the lowest adhesive content (r = 2.83),
Figure 4a shows a relatively clean pullout path, with most of the adhesive remaining on the laminate and limited visible deformation in the surrounding region. The neighboring crossing yarns also remain close to their original positions. As adhesive content increases (
Figure 4b,c), more fracture and distortion are observed in the residual adhesive around the pullout path, indicating stronger adhesive engagement with the tested yarn during pullout. At the highest adhesive content (
Figure 4d, r = 0.67), adhesive stretching, ligament formation, and larger residual adhesive regions become more apparent. These observations are qualitatively consistent with a transition from more adhesive-failure-dominant behavior at high r to more cohesive-failure-dominant behavior at low r. However, these optical images are used here as qualitative supporting evidence rather than as direct proof of the underlying crack path or failure sequence.
Figure 5 shows representative optical microscopic images of the pullout yarn after YPiL testing for the same 170 g/m
2 FRL specimens. At low adhesive content (r = 2.83), the yarn surface appears relatively clean, with only limited adhesive residue, which is consistent with weaker adhesive engagement and a more adhesive-failure-dominant response. As adhesive content increases (r decreasing), larger amounts of residual adhesive remain attached to the yarn surface, together with more visible adhesive deformation and fracture. In
Figure 5c and especially
Figure 5d, adhesive material is seen bridging adjacent filaments and locally joining them together, indicating adhesive penetration into the yarn structure. This inter-filament bonding is consistent with an anchoring effect that increases pullout resistance and promotes a greater cohesive contribution to the bonding failure response.
Observations in
Figure 4 and
Figure 5 provide qualitative optical support for the curve-based interpretation, but they do not by themselves establish the full microscopic failure mechanism.
3.2. Force–Displacement Curve Characteristics
While optical microscopic images provide qualitative support for the proposed bonding failure interpretation, the force–displacement curves give the corresponding mechanical response during yarn pullout.
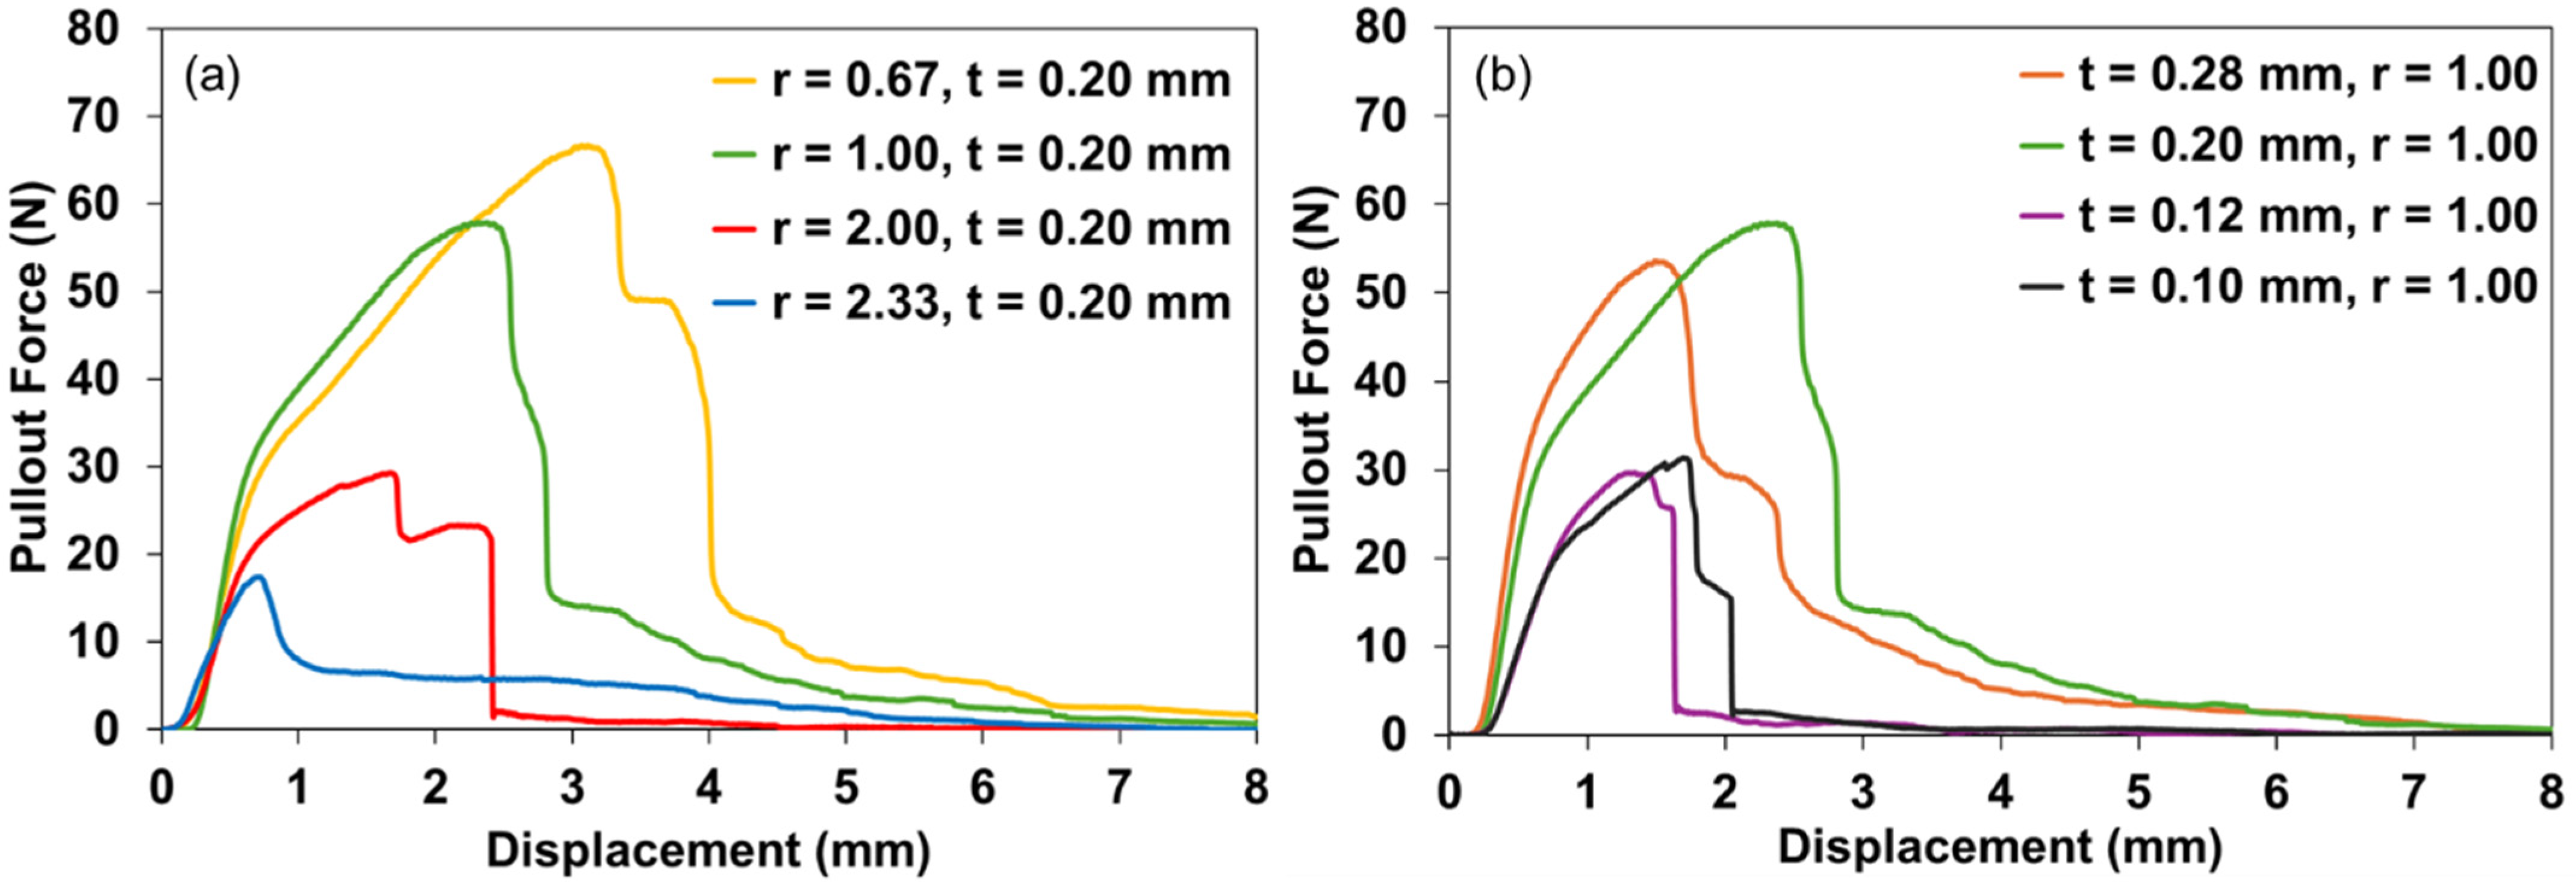
Figure 6 shows representative YPiL force–displacement curves illustrating the coupled effects of fabric-to-adhesive ratio (r) and fabric thickness (t) on pullout mechanics. In
Figure 6a, decreasing r (increasing adhesive content) at constant t = 0.20 mm produces a systematic increase in maximum pullout force, a delayed onset of force drops, and a significant post-peak tail. At the lowest r value (r = 0.67), the curve exhibits the highest F
max with an extended Zone III sliding regime that spans the longest displacement range of all curves shown. This response is a characteristic of cohesive failure behavior. In this case, sufficient adhesive material penetrates and encapsulates the woven fabric reinforcement, promoting good load transfer in Zones I-II and sustained post-peak frictional resistance after debonding. As r increases (r ≥ 2.0), the curves transition toward adhesion response, marked by early force collapse near F
max and minimal post-peak drag frictional sliding resistance. In this regime, limited adhesive availability leads to insufficient wetting of yarns, weak yarn–adhesive interfacial load transfer, and early yarn debonding from adhesive. At r = 2.33, Zone I and II are almost minimal, and the residual curve area is confined to a low-force sliding tail.
Figure 6b isolates the effect of fabric thickness at constant r = 1.00. F
max and the overall energy dissipation do not increase monotonically with t. The fabric with t = 0.20 mm (w = 1.88 mm) produces the highest F
max value and a long Zone III tail, while the curve of the thicker fabric with t = 0.28 mm (w = 1.54 mm) is obviously below it, showing both smaller F
max and total curve area. This indicates that thickness alone does not govern pullout performance; rather, the co-varying pullout yarn width (w) and other woven fabric parameters collectively determine the adhesive contact area and frictional interaction during yarn pullout. The two thinner fabrics (t = 0.10 mm and t = 0.12 mm), with the same yarn width (w = 0.74 mm), overlap closely at the bottom of the plot. They show nearly identical F
max values and compact curve shapes, indicating that yarn width is a crucial woven structural parameter across the four fabric types. In Zones I and II, the two fabrics with wider yarns provide increased contact areas and higher contact forces at yarn intersections. This enhances load transfer between the pullout yarn and adhesive, resulting in steeper initial slopes and higher maximum pullout forces. After the slope-break point (SBP), however, the controlling mechanism shifts to drag friction sliding, and therefore, the impact of woven structure becomes more evident, particularly due to weave-induced yarn crimp. The pullout yarns in the thicker fabrics also have higher yarn crimp values, as shown in
Table 1. According to Peirce’s geometric model [
29], the approximate relations can be written as:
The subscripts 1 and 2 denote warp and weft parameters. The relations show that the crimp height (h) of one set of yarns is a function of their crimp (c) and spacing (p) of the crossing yarns. The higher crimp means that the pullout yarn follows a more undulated path within the woven structure and must undergo greater straightening as it is pulled. This sustains frictional resistance over a longer displacement range and produces longer and smoother sliding tails observed for the laminates reinforced by thicker woven fabrics in
Figure 6b. In contrast, the thinner fabrics had lower crimp values, so the pullout yarn required less straightening and followed a less tortuous sliding path, leading to sharper post-peak drops and smaller Zone III regimes once the cohesive failure occurred. Together, these observations support a mechanistic transition in which adhesion/cohesion dominates the response in Zones I and II, while crimp-related drag friction/sliding resistance increasingly governs energy dissipation in Zone III.
3.3. Effect of Fabric-to-Adhesive Ratio (r)
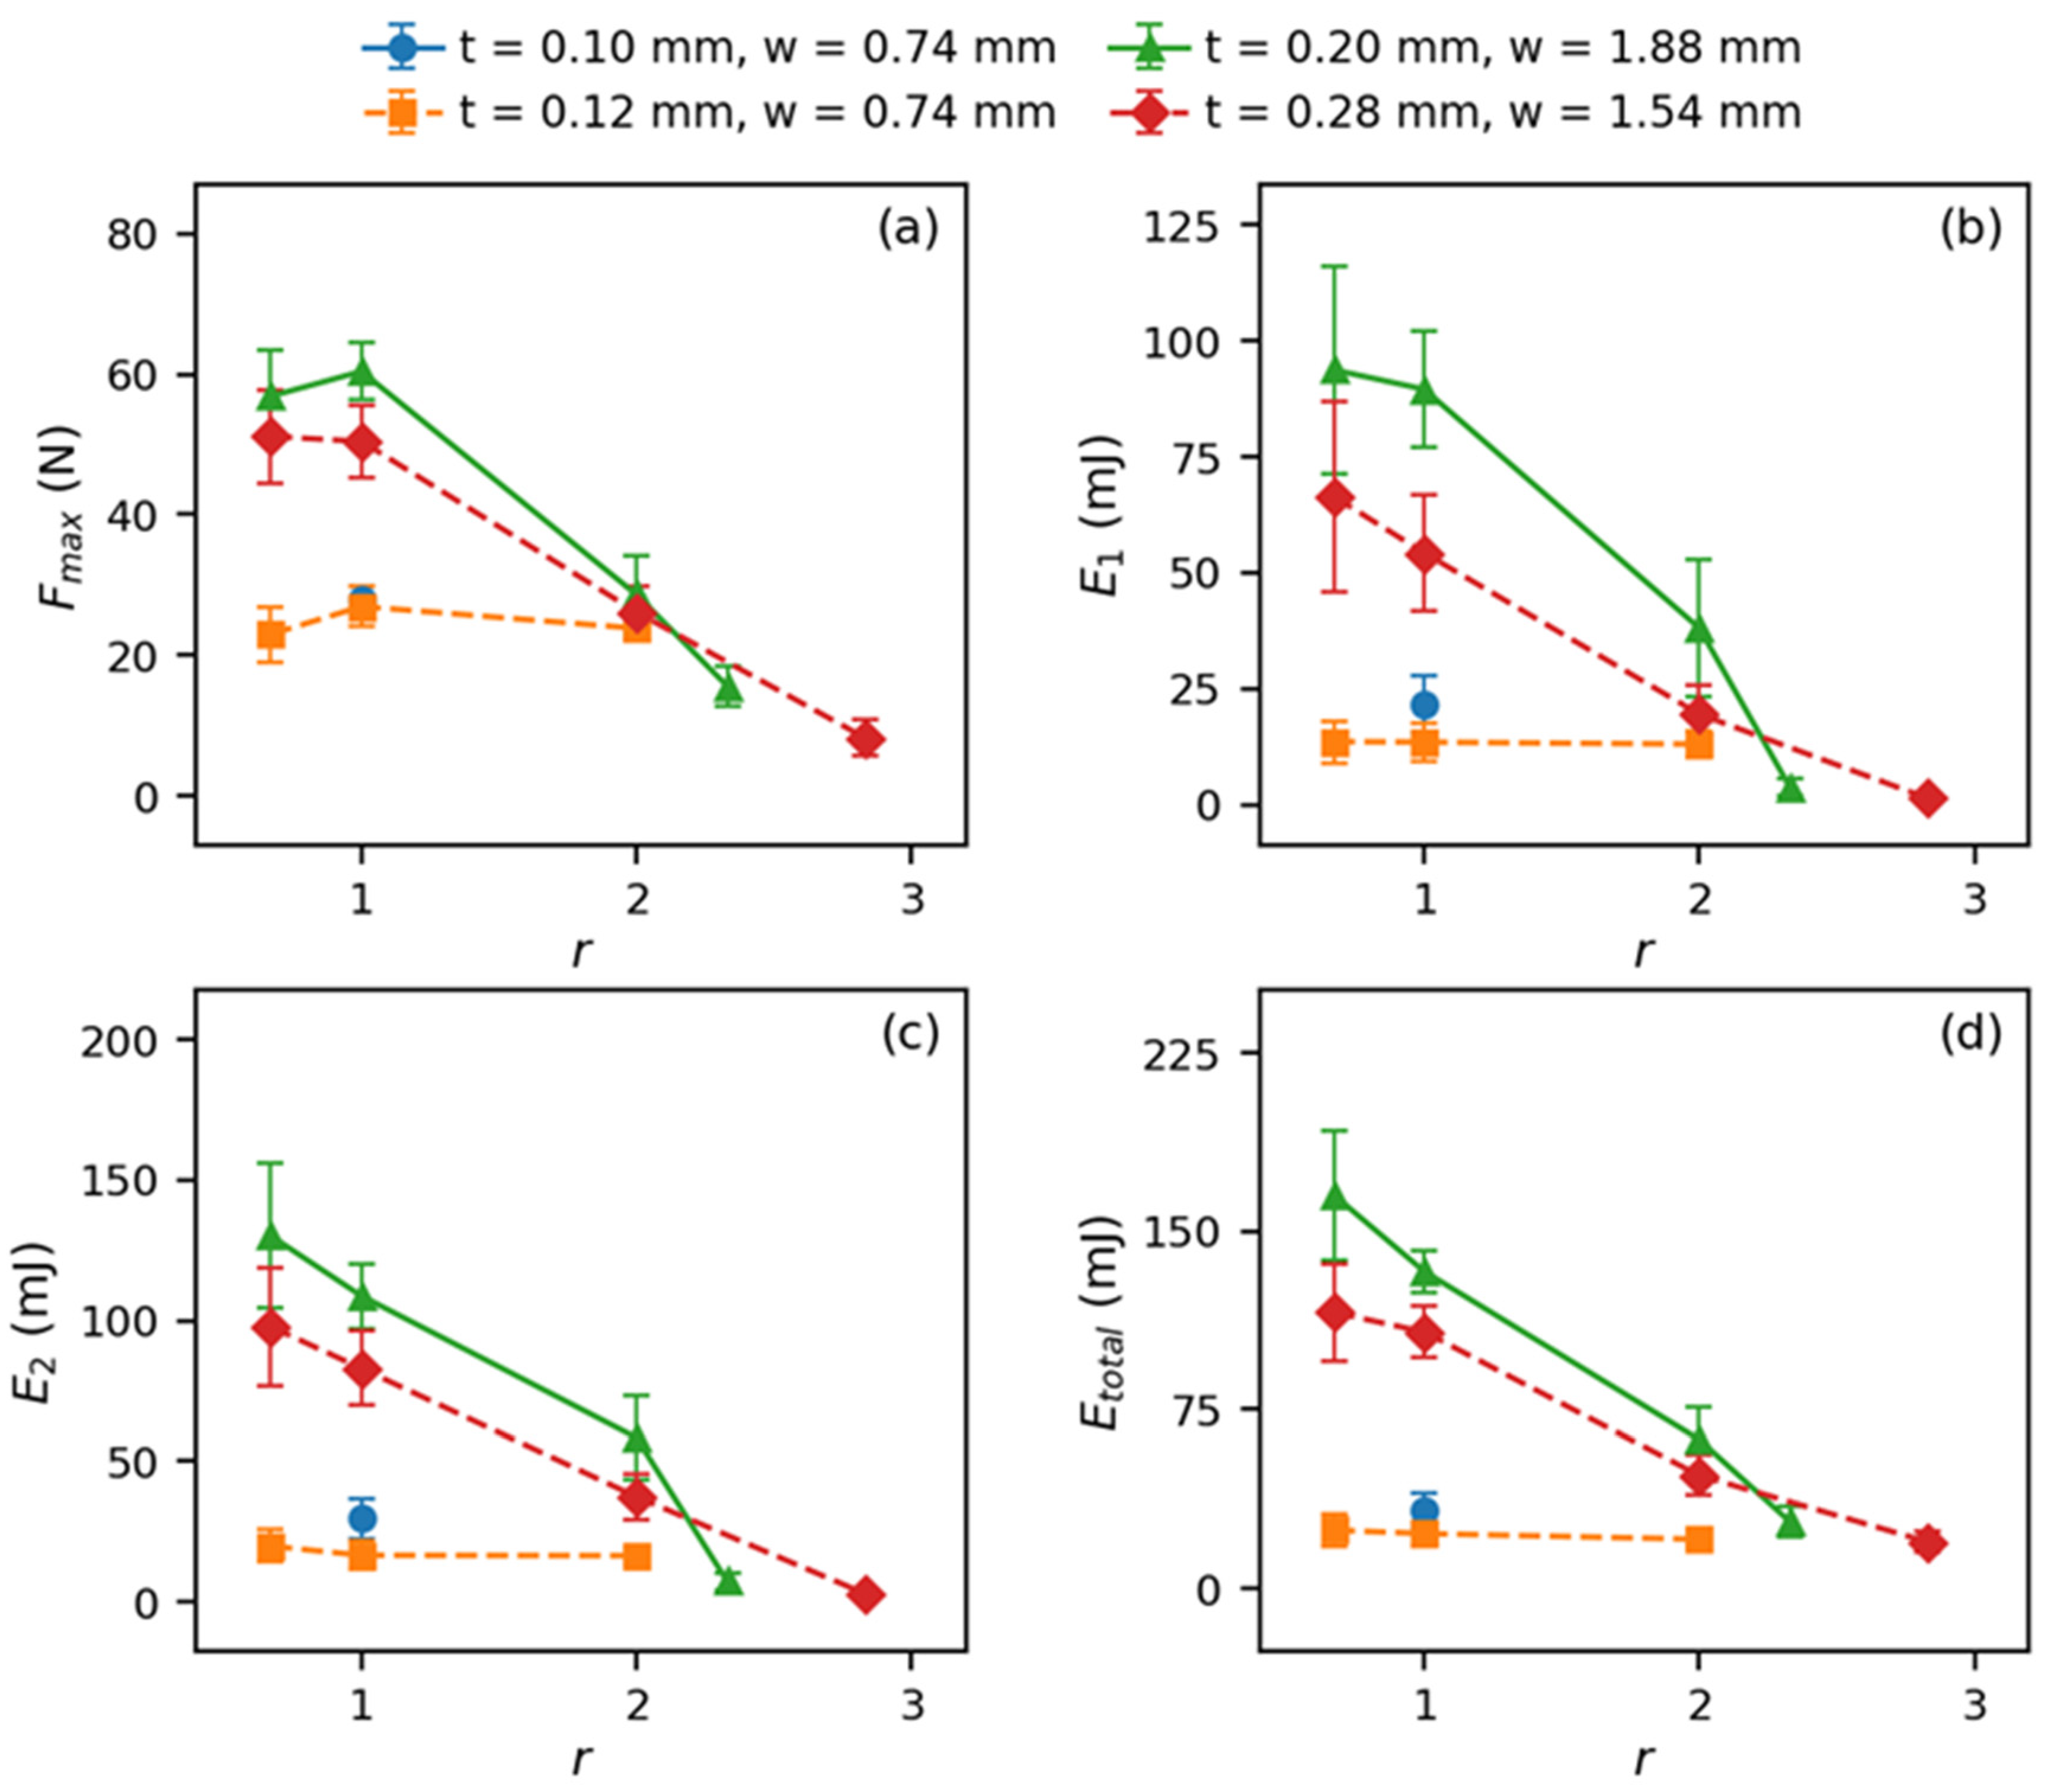
Figure 7 shows the effect of fabric-to-adhesive ratio (r) on the four YPiL test responses across all tested fabrics. Since r is the only parameter varied systematically within each fabric type,
Figure 7 provides a direct view of how adhesive amount impacts yarn pullout performance.
A clear overall trend is observed in all four plots: as r increases, the pullout response generally decreases. This trend appears in F
max, E
1, E
2, and E
total, although the magnitude of the decrease differs among fabrics. In
Figure 7a, F
max decreases with the increase in r, showing lower maximum pullout force at higher fabric-to-adhesive ratios. The same downward pattern is also seen in the three energy plots, but it is more pronounced in E
2 and E
total than in E
1. This means that increasing r not only lowers F
max but also the overall amount of energy the laminate can absorb during pullout.
The slope of the curves in
Figure 7 is also important. The two thicker fabrics with wider pullout yarns show a much stronger response to r than the two thinner fabrics with the narrow yarn width. In the two thicker fabrics, E
total decreases by nearly fourfold from r = 0.67 to the highest tested r values, while F
max drops by about 73–84% over the same range. In contrast, the two thinner fabrics (t = 0.10 and 0.12 mm, w = 0.74 mm) remain at much lower response levels throughout and show flatter trends across the tested r range. This means that lowering r improves the response in all cases, but the degree of that improvement depends strongly on reinforcement structural parameters, particularly pullout yarn width (w) and fabric thickness (t).
Although E1 changes with r, its range is smaller than that of E2 and Etotal. By comparison, E2 and especially Etotal separate more clearly between low-r and high-r laminates. This indicates that the impact of adhesive amount becomes more visible when the post-peak parts of the pullout event are included in the evaluation. Therefore, the energy-based metrics, particularly Etotal, are more sensitive indicators of laminate bonding performance than Fmax.
The different slopes among the four fabrics suggest that r does not act independently. Laminates with the same r can still behave very differently depending on the structural parameters of fabric reinforcements. For example, at r = 1.00, the laminate made with the t = 0.28 mm fabric shows a much higher response than the laminate made with the t = 0.12 mm fabric.
The mean ± SD values shown for each laminate structure represent specimen-level experimental variability, whereas the GLM is intended to capture the underlying mean response trends across laminate parameters.
3.4. GLM Interaction Analysis
To further examine how r and the structural parameters of woven fabric act together, a reduced numeric GLM was fitted for each of the four YPiL test responses, F
max, E
1, E
2, and E
total, using t, w, r, k, and the two-way interaction terms t × r and w × r as predictors. The parameter estimates and effect rankings are summarized in
Table 4,
Table 5,
Table 6 and
Table 7. In the present dataset, t, w, and k were not varied independently. Therefore, the woven-structure-related terms in the GLM should not be interpreted as isolated one-factor effects.
Across all four responses, r is the dominant predictor. Its Logworth values are 70.2, 52.4, 62.7, and 77.5 for F
max, E
1, E
2, and E
total, respectively, making it the highest-ranked term in every model. The corresponding parameter estimates are all negative, with values of −17.850, −31.127, −41.508, and −47.514, confirming that increasing r reduces pullout response in every case. This agrees directly with
Figure 7, where all four responses decrease as r increases. It also supports the earlier discussion that adhesive amount is the primary factor controlling laminate bonding performance.
Among all interaction terms, w × r is the strongest and most consistent across the four models. It ranks second in effect importance in all four responses and remains highly significant in every case. Its estimated coefficients are −21.161, −52.205, −60.886, and −73.532 for F
max, E
1, E
2, and E
total, respectively. These large negative coefficients indicate that the reduction in response associated with increasing r becomes larger in fabrics with wider pullout yarn. This trend is consistent with
Figure 7, where the two fabrics with wider yarns start at much higher response levels at low r and decline much more steeply as r increases, while the two fabrics with narrower yarns remain relatively flat and low over the same range. The GLM therefore confirms that the benefit of lowering r becomes much more significant in fabrics with wider pullout yarns.
The t × r interaction shows a weaker and less consistent trend than w × r but still indicates that thickness-related fabric characteristics modify the response to fabric-to-adhesive ratio. This result is also in line with the observations from
Figure 6b, where thickness alone did not produce a simple monotonic change in the force–displacement curve. Instead, its impact was always tied to changes in yarn width w, fabric thickness t, and pullout yarn crimp. The GLM captures the same behavior quantitatively, indicating that the contribution of thickness and thickness-related woven fabric characteristics is secondary to width-related effects in the present dataset.
The model also shows that woven-structure-related trends are expressed more clearly in the energy responses than in F
max. The interaction term w × r grows in magnitude from −21.161 in F
max to −73.532 in E
total, and the main effect of r follows the same pattern, becoming more negative from F
max to E
total. This result agrees with the earlier discussions.
Figure 6 showed that low-r laminates not only reach higher F
max but also exhibit a broader transition region and a longer post-peak tail in the pullout force–displacement curves.
Figure 7 also shows that these differences become much more apparent in E
2 and E
total than in F
max alone. The GLM supports the same conclusion from a statistical perspective: that energy-based metrics, particularly E
total, are more sensitive indicators of laminate bonding performance difference than F
max.
The contribution of k is smaller but still informative. The term is significant for E2 (p = 0.014) and Etotal (p = 0.030) but is weak or non-significant for E1 and Fmax. This suggests that the role of crossing yarns becomes more important in the later stages of pullout than at the maximum pullout force. That trend is reasonable physically, since the woven structures are expected to contribute more significantly once the pullout yarn begins to straighten, disengage, and slip after reaching the maximum pullout force. However, because k is also coupled with the woven fabric structure, this term should be interpreted as part of the overall woven fabric structural effect rather than as an independent crossing yarn contribution.
3.5. GLM Predictive Equations and Model Evaluation
The four fitted reduced numeric GLM equations, derived from the parameter estimates in
Table 3,
Table 4,
Table 5 and
Table 6, are:
where t is fabric thickness (mm), w is pullout yarn width (mm), r is fabric-to-adhesive ratio, and k is the number of crossing yarns during pullout. These equations are valid within the tested parameter ranges: t = 0.10–0.28 mm, w = 0.74–1.88 mm, r = 0.67–2.83, and k = 4–10. Extrapolation beyond these bounds is not supported by the present data. In practice, the dominant terms in every equation are r, w × r, and t × r, meaning that the predicted response is most sensitive to changes in fabric-to-adhesive ratios and their interactions with pullout yarn width and fabric thickness.
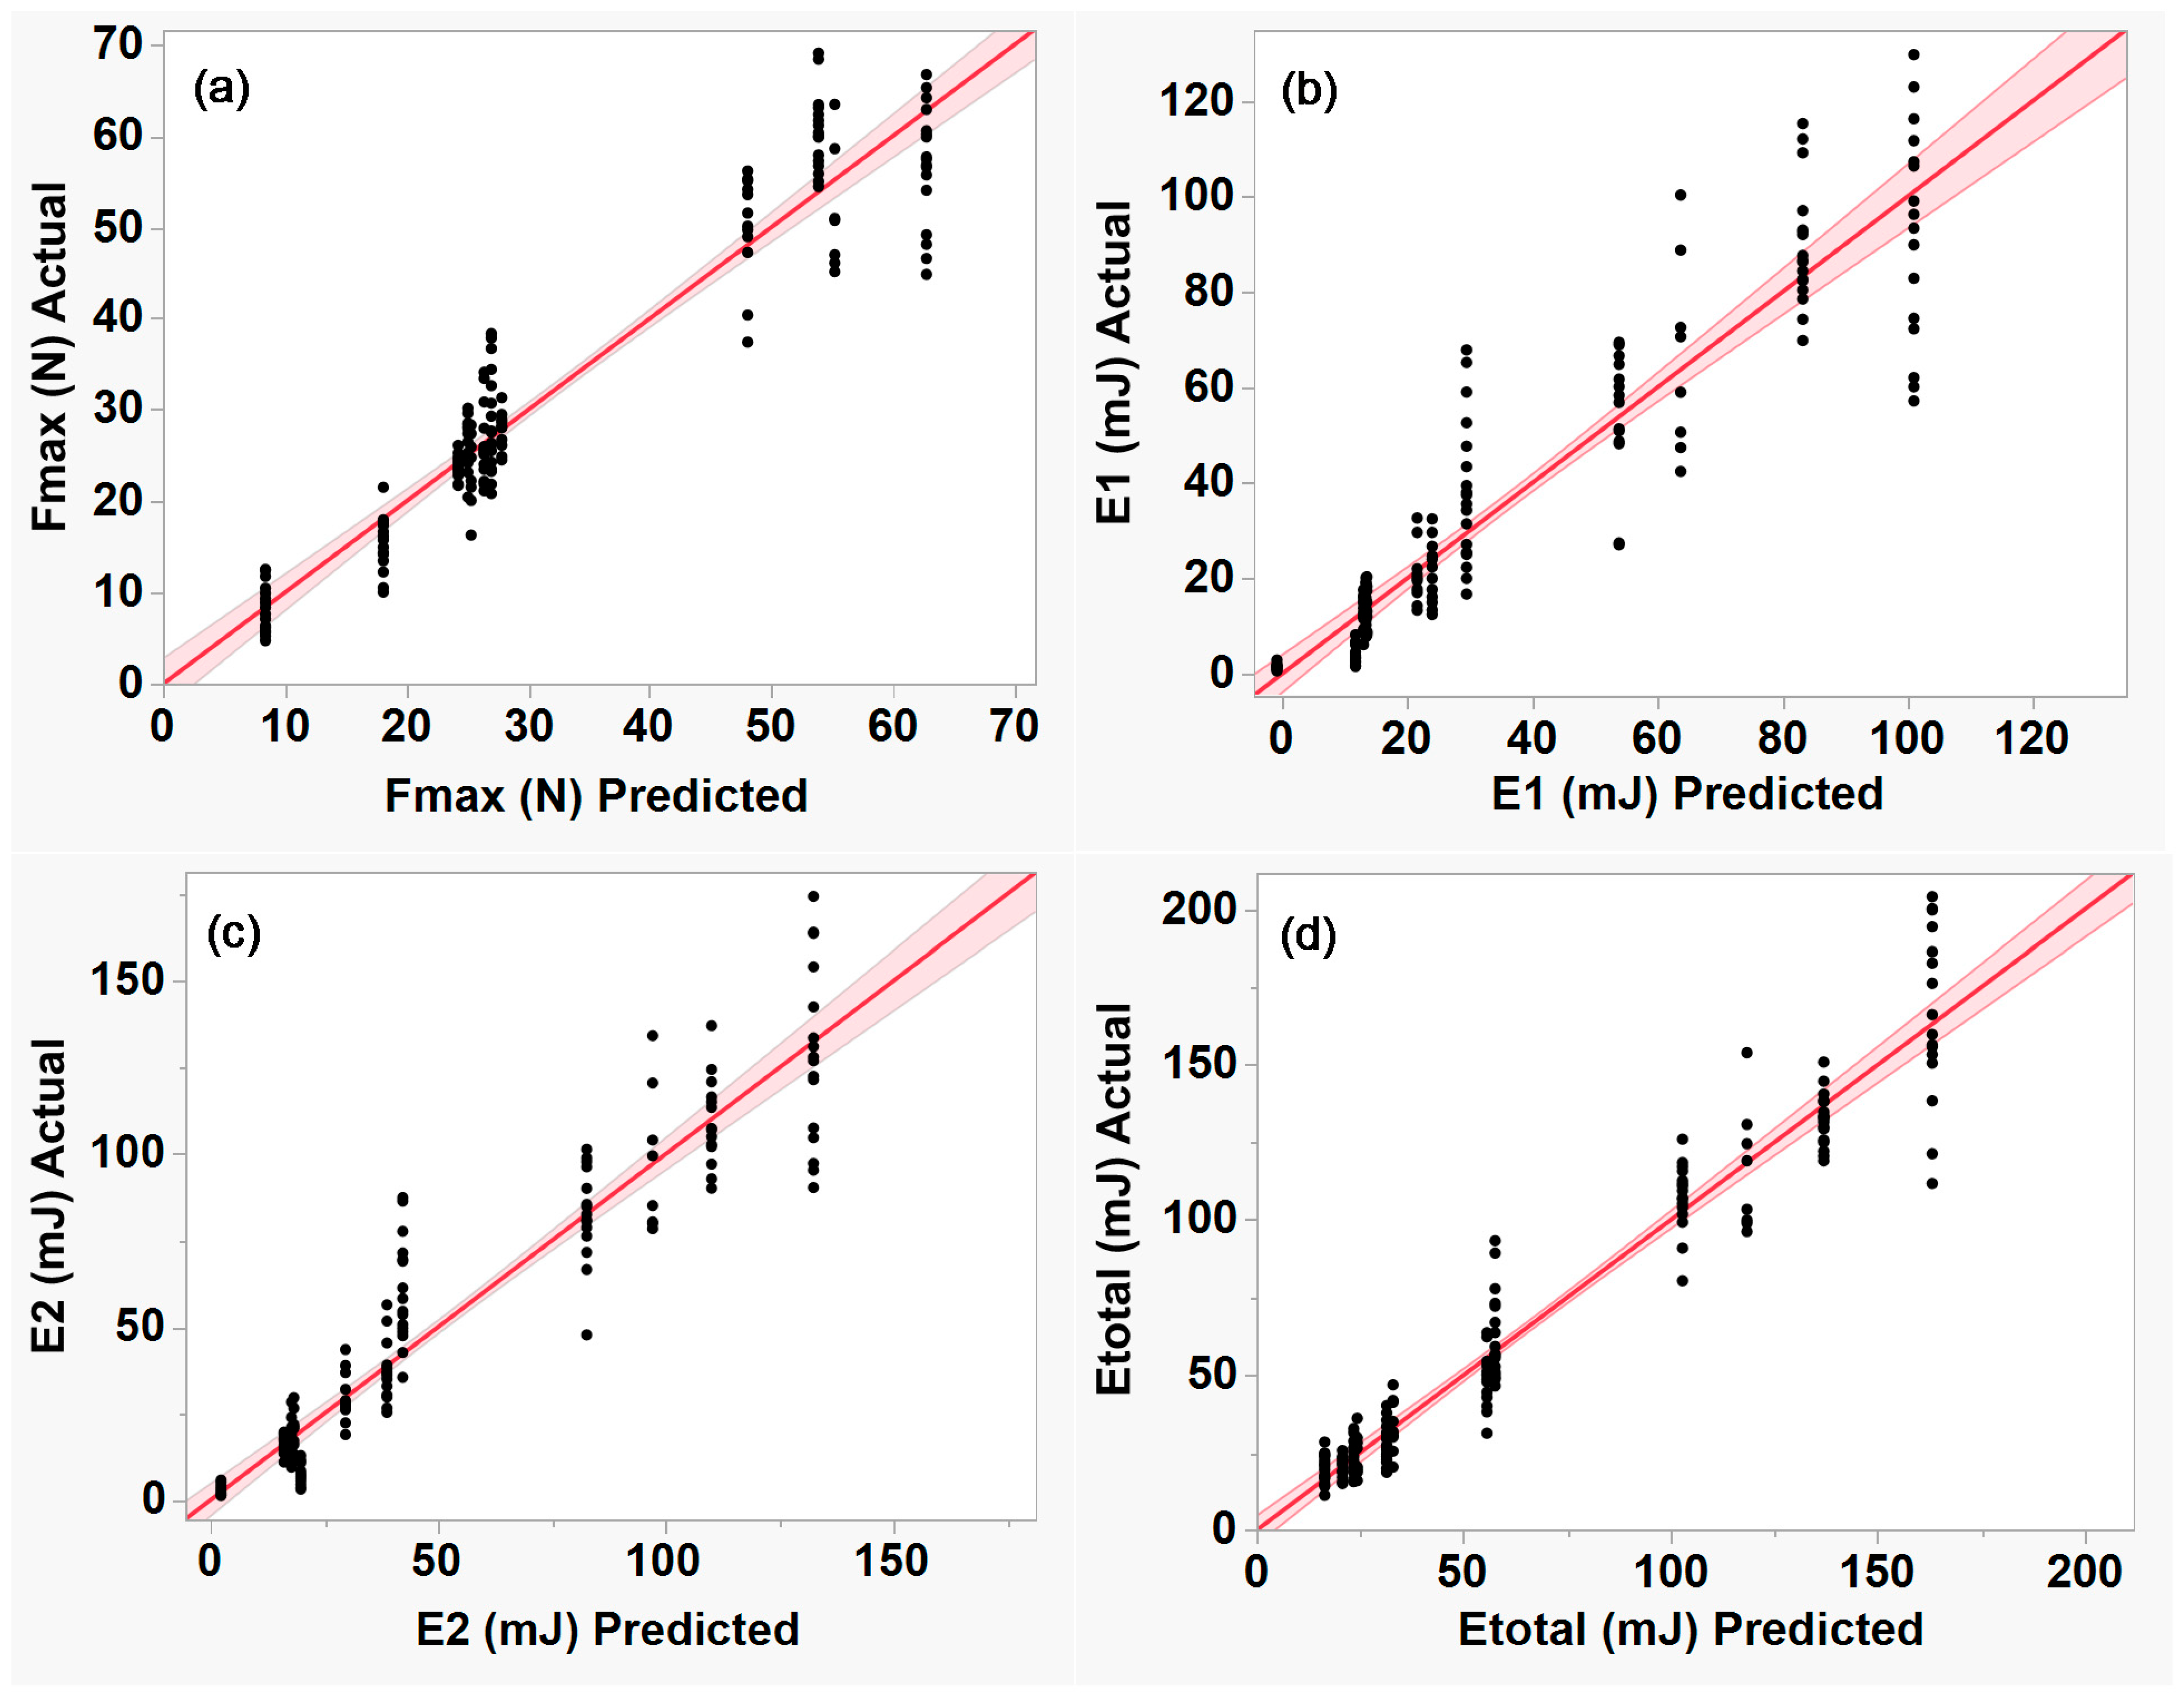
The predictive performance of these four GLM equations was assessed internally by comparing predicted values against the observed measurements across all 187 specimens. The resulting actual vs. predicted plots are shown in
Figure 8, with fit statistics summarized below.
All four models achieve strong overall fit. The R2 values are 0.91 for Fmax, 0.88 for E1, 0.91 for E2, and 0.94 for Etotal (p < 0.0001 in all cases), indicating that the six-term linear model captures the majority of response variation across the full dataset. The RMSE values are 5.22 N for Fmax, 12.16 mJ for E1, 13.64 mJ for E2, and 12.42 mJ for Etotal, respectively. The present assessment reflects model performance within the available dataset and should therefore be interpreted as an internal evaluation of predictive capability rather than external validation on an independent dataset.
In
Figure 8, the data points follow the 1:1 line closely across the full prediction range for all four responses, and the 0.05 significance curves remain narrow throughout. This indicates that the model performs consistently rather than fitting well only at the extremes. Notably, E
total achieves the highest R
2 (0.94) despite spanning the widest absolute range (11–204 mJ), suggesting that the w × r and t × r interaction terms are particularly effective at capturing the large performance differences among different woven fabrics across different r levels.
Overall, the results show that the GLM equations can reasonably predict the average response of the tested FRL samples within the investigated range. They can therefore be used to compare the relative bonding performance of different fabric-adhesive combinations within the available dataset.
4. Conclusions
This study advanced our unique YPiL test from a pullout-force-based method to an energy-based framework for evaluating bonding performance in woven fabric-reinforced laminates. A key contribution of this work is the interpretation of the YPiL test load–displacement curve for adhesive-bonded woven FRLs, which is distinct from pullout responses reported for dry woven fabrics or fiber-reinforced composites. We developed a practical framework for separating bonded load transfer, damage development after debonding, and drag friction/sliding resistance through three characteristic zones and four response metrics: Fmax, E1, E2, and Etotal. The damage development led to differentiation between cohesive and adhesive failure mechanisms that are essential to performance enhancement and helpful in designing durable FRLs.
Within this framework, the results showed that the fabric-to-adhesive ratio, r, is the dominant factor governing yarn pullout behavior, while the w × r interaction is the most important structural interaction. The energy-based responses, especially Etotal, were more sensitive than Fmax to differences in the woven fabric structural parameters and bonding condition, showing that maximum pullout force alone does not fully capture the bonding performance of FRLs. From an FRL design perspective, these findings are useful because they provide a foundation for comparing and predicting bonding performance. The developed GLM equations link the structural parameters of woven fabrics and adhesive quantity to expected pullout response, offering a practical basis for selecting and tuning laminate configurations with bonding behavior suited to end-use requirements. However, because the models were developed from a constrained dataset with co-varying woven structural parameters and were evaluated only within the available experimental range, their predictive use should be limited to the laminate configurations examined in this study until further external validation is conducted.