
Article

Quantifying Interphase Evolution in Epoxy/WS2 Nanocomposites: A Raman Spectroscopic Study of Aminoacetic Acid Surface Modification


by
Amirbek Bekeshev
1,*,
Anton Mostovoy
2,*,
Andrey Shcherbakov
3 and
Bibinur Iztleuova
1
1
Laboratory of Polymer Composites, K. Zhubanov Aktobe Regional University, Aliya Moldagulova Avenue 34, Aktobe 030000, Kazakhstan
2
Laboratory of Modern Methods of Research of Functional Materials and Systems, Yuri Gagarin State Technical University of Saratov, Polytechnichskaya St., 77, Saratov 410054, Russia
3
Laboratory of Support and Maintenance of the Educational Process, Yuri Gagarin State Technical University of Saratov, Polytechnichskaya St., 77, Saratov 410054, Russia
*
Authors to whom correspondence should be addressed.
J. Compos. Sci. 2026, 10(3), 161; https://doi.org/10.3390/jcs10030161
Submission received: 27 February 2026 / Revised: 12 March 2026 / Accepted: 13 March 2026 / Published: 17 March 2026
(This article belongs to the Section Nanocomposites)

Abstract

The performance of polymer nanocomposites is governed primarily by the structure and properties of the matrix–filler interphase. This study presents a quantitative Raman spectroscopy analysis of interphase evolution in epoxy nanocomposites reinforced with two-dimensional WS2, whose surface chemistry was systematically tuned via grafting of aminoacetic acid (AA) at concentrations of 2.5, 5.0, and 7.5 wt.%. By tracking peak shifts, linewidths, intensity ratios, and integrated areas of the characteristic WS2 phonon modes (2LA(M) + E2g1, A1g, and defect-related bands), we establish a non-linear, concentration-dependent interfacial response. Minor spectral variations at 2.5 wt.% AA indicate limited interfacial interaction. At 5.0 wt.% AA, suppression of the A1g mode and significant band broadening reflect increased structural disorder. At 7.5 wt.% AA, coordinated red shifts (~−1.8 cm−1) and the appearance of an additional band near 432.8 cm−1 suggest the development of a strain-mediated interfacial state. Overall, increasing AA concentration leads to a non-linear evolution of the WS2–epoxy interface, as reflected in peak positions, linewidths and intensity ratios. These Raman-derived descriptors correlate directly with enhanced mechanical properties (flexural and tensile strength) and thermal stability (Vicat softening point) of the composites. The results demonstrate that effective interfacial coupling requires a critical surface coverage and that Raman spectroscopy serves as a powerful tool for non-destructively probing and optimizing interphase architecture in TMD/polymer systems.

1. Introduction

Epoxy polymers are widely used as structural and functional materials owing to their high stiffness, chemical resistance and strong adhesion [1]. Their overall performance depends not only on the intrinsic properties of the cured resin but also on how effectively inorganic fillers become integrated into the crosslinked structure [2,3].
Against this background, we selected tungsten disulfide (WS2), which belongs to the family of two-dimensional transition-metal dichalcogenides, as a model filler for modifying the polymer matrix [4]. The combination of a stacked morphology, tunable interfacial behaviour, and a mechanically robust response makes these materials strong candidates for modifying and reinforcing epoxy matrices [5]. In WS2, rigid covalent layers are stacked on top of one another and held together only by weak van der Waals forces. This layered architecture greatly improves the material’s ability to be exfoliated, chemically adjusted, and more uniformly dispersed within polymeric environments [6]. The Raman-active bands of this material, especially the 2LA(M) + E2g1 in-plane mode and the A1g out-of-plane mode, have been extensively used as indicators for the interaction of the material with strain fields, defect states, interlayer distance changes, and chemical environment changes [7]. As a result, WS2 not only serves as a strengthening agent but also as an internal sensor that shows the structural state of the composite. Raman spectroscopy is a dependable, non-intrusive method which can be used to monitor such changes and can bring insight into phonon responses, defect levels, symmetry changes, and interfacial properties in layered materials [8].
The properties of epoxy/WS2 composites depend strongly on dispersion and the quality of the polymer–filler interface. Unmodified WS2 typically exhibits limited compatibility with organic matrices, often resulting in aggregation and reduced load transfer. Surface modification is therefore commonly used to improve dispersion and interaction. Aminoacetic acid, a small bifunctional molecule, has been applied to modify ceramic and carbon fillers, leading to better compatibility and improved mechanical performance of epoxy systems [9,10]. Despite the widespread use of WS2 in lubrication, tribological applications and polymer composites, the specific effects of amino acid modification on its lattice structure and vibrational behaviour inside an epoxy matrix are still not well described. This is noteworthy, as the interfacial region often has a stronger influence on the final properties of a nanocomposite than the bulk characteristics of either component. Even small shifts in vibrational order, defect content or interlayer coupling can signal changes in the efficiency of polymer–filler interactions [11].
Owing to its sensitivity to phonon symmetry, frequency shifts, band broadening and relative intensities, Raman spectroscopy is particularly suitable for analyzing these interfacial phenomena. Parameters such as red or blue shifts, FWHM changes and the activation of disorder-related modes help identify whether the filler experiences tensile or compressive strain, whether its layers are disturbed or partially exfoliated, and whether surface modification results in stabilizing or destabilizing interactions within the polymer [12,13,14].
Recent advances in Raman spectroscopy have solidified its role not just as a characterization tool, but as a sophisticated probe for understanding nanoscale phenomena in materials. Foundational reviews by Gouadec and Colomban [15] and Arora et al. [16] have established how spectral changes—such as asymmetric broadening and peak shifts—are direct consequences of optical phonon confinement in nanostructures, a principle that underpins the analysis of filler particles like WS2. Building on this, Koniakhin et al. [17] have demonstrated that the phonon confinement model (PCM), while widely used, has critical limitations for very small particles and propose a more physically grounded dynamical matrix method, offering a pathway to more accurate size and strain assessments from Raman data. The application of these principles to composite materials is powerfully illustrated by Fernández-Álvarez et al. [18], who used confocal Raman microscopy to quantify how superior nanoparticle dispersion directly correlates with enhanced mechanical and wear properties in epoxy/TiO2 systems, highlighting the critical role of the interface. Furthermore, the work of Ivanda et al. [19] shows that the low-frequency Raman spectrum can be analyzed with the elastic sphere model (ESM) to determine nanoparticle size distributions, a technique valuable for assessing filler morphology within a matrix. Collectively, these recent studies confirm that a quantitative, multi-parameter Raman analysis—examining peak positions, widths, and intensities—is essential for moving beyond empirical composite formulation towards a structure-property guided design based on a deep understanding of the nanoscale interphase.
The aim of this work is to conduct a detailed, quantitative Raman spectroscopic investigation into the nanoscale mechanisms by which aminoacetic acid (AA) surface modification influences the structure and properties of epoxy/WS2 nanocomposites. Unlike previous studies that often rely on indirect evidence or macroscopic property correlations, this study systematically analyzes a comprehensive set of Raman spectral descriptors—including precise peak shifts, full width at half maximum (FWHM) values, integrated peak areas, and key intensity ratios (e.g., A1g/2LA(M) + E2g1)—to directly probe the evolution of the WS2 lattice and its interfacial coupling with the epoxy matrix as a function of AA concentration (2.5, 5.0, and 7.5 wt.%). A distinctive feature of this work is the explicit correlation of these nanoscale Raman fingerprints with independently measured macroscopic mechanical properties (flexural and tensile strength/modulus) and thermal stability (Vicat softening point). By establishing this direct structure–property relationship, we aim to determine the critical surface coverage required to transition from a weakly interacting, disordered filler state to a strain-mediated, coherent interfacial architecture that maximizes composite performance. Ultimately, this research seeks to validate Raman spectroscopy as a robust, non-destructive tool for the rational design and optimization of interphase chemistry in high-performance polymer nanocomposites reinforced with two-dimensional transition metal dichalcogenides.

2. Materials and Methods

Epoxy resin ED-20 was used as the polymer matrix, and polyethylene polyamine (PEPA) served as a curing agent (15 wt.% relative to the resin). Tungsten disulfide nanopowder (WS2, 0.5 wt.% with respect to the total composite mass) was subjected to surface treatment in aqueous amino acid (AA) solutions of 2.5, 5.0, and 7.5 wt.%. For each modification batch, 5 g of WS2 was dispersed in 50 mL of the corresponding AA solution and stirred for 2 h using a mechanical agitator, followed by ultrasonic treatment for 15 min. The suspensions were dried at 105 °C for 8 h and the resulting powders were ground in a mortar. The modified fillers are denoted as WS2–AA2.5, WS2–AA5.0, and WS2–AA7.5, while untreated WS2 served as a control.
Composite samples were prepared by first mixing ED-20 resin with the respective WS2 filler for 5 min, followed by 2–3 ultrasonic cycles (5 min each) with intermittent cooling to avoid overheating. After homogenization, PEPA was added and the mixture was stirred thoroughly. The formulations were cast into silicone moulds pre-coated with a release agent and cured under ambient conditions for 1–3 days. Post-curing was performed at 90 °C for 2 h and subsequently at 120 °C for 2 h. The resulting materials included neat EP, EP/WS2 (unmodified), and the modified composites EP/WS2–AA2.5, EP/WS2–AA5.0, and EP/WS2–AA7.5.
Raman analysis was conducted using a RamanTouch VIS-NIR ZBU spectrometer (Bruker, Germany) equipped with 532 and 785 nm excitation lasers. Spectra were collected under uniform experimental conditions: laser power ~0.9 mW (power density ≈ 2.6 × 10⁴ W/cm2), 50 μm slit width, 30 s exposure time. A 20× objective lens (NA 0.45) in XY Averaging (AreaFlash) mode was employed. Signal detection was performed with a cooled CCD detector (−70 °C) operating in low-noise mode at a 2 MHz readout speed and high gain. The spectrograph was aligned to 1200 cm−1 with a 300 gr/mm grating. Minor wavenumber deviations (≈−2.9 cm−1) were corrected during data processing. Unless otherwise specified, the presented results correspond to the 784.66 nm excitation. Each spectrum represents the average of five measurements collected at different locations on the sample surface. The standard deviation of peak positions did not exceed ±0.4 cm−1.
Tensile tests were performed on dog bone specimens (4 mm thick, 10 mm wide, 50 mm of working part length), and bending tests were performed on block specimens (4 × 10 × 80 mm). Impact toughness was determined on block specimens (15 × 10 × 120 mm). Tensile and bending tests were performed using a WDW 5E universal testing machine (Time Group Inc., Beijing, China) at a crosshead speed of 5 mm/min and 50 mm/min, respectively, in accordance with the standards [20,21]. All mechanical tests were conducted under controlled environmental conditions: temperature of 23 ± 2 °C and relative humidity of 50 ± 10%. For each composition, 5 specimens (n = 5) were tested. Before testing, the specimens were conditioned for 72 h at 23 ± 2 °C.
Thermal stability was additionally assessed through Vicat softening temperature measurements. The Vicat softening point was determined in accordance with ISO 306:2022, using standard loading and heating rate conditions specified in the method [22].
In this work, the interpretation of Raman spectra was structured around four principal analytical descriptors: (i) the shifts of the characteristic WS2 phonon modes, (ii) the intensity ratios between in-plane, out-of-plane and defect-related vibrations, (iii) the full width at half maximum (FWHM), and (iv) the integrated peak areas. Together, these parameters provide a coherent quantitative basis for evaluating the degree of interfacial interaction within the epoxy–WS2 system, and all subsequent data processing steps were performed to ensure their accurate extraction.
Spectral processing was performed using RAMANviewer software 4.7.3_HF1 (Nanophoton, Osaka, Japan), integrated with the confocal Raman microscope RamanTouch (Nanophoton, Osaka, Japan; co-developed with Bruker, Ettlingen, Germany). Full width at half maximum (FWHM) and peak areas were calculated from the raw spectra to preserve the original line shape. Peak fitting was performed in the Bruker package using Lorentzian or Gaussian functions (selected individually for each peak) to ensure accurate representation of the spectral features [23].
For Raman peak shifts and intensity ratios, the spectra were analyzed after baseline correction using the Bruker software. Baseline correction was carried out by spline approximation as described in Equation (1). To reduce random noise while preserving narrow Raman bands, a second-order Savitzky–Golay filter was used (polynomial order 2, window size 3 points), according to Equation (2) [24].
I c o r r ( ν ) = I r a w ν B ( ν )
I ^ ν = j = m m c j I c o r r ν i + j
where I r a w ν is the raw intensity, B ( ν ) is the spline-fitted baseline, and c j represents the Savitzky–Golay convolution coefficients for a second-order polynomial within a window of 2m + 1 = 3.

3. Results

3.1. Raman Wavenumber Modes of WS2 in Epoxy Matrix

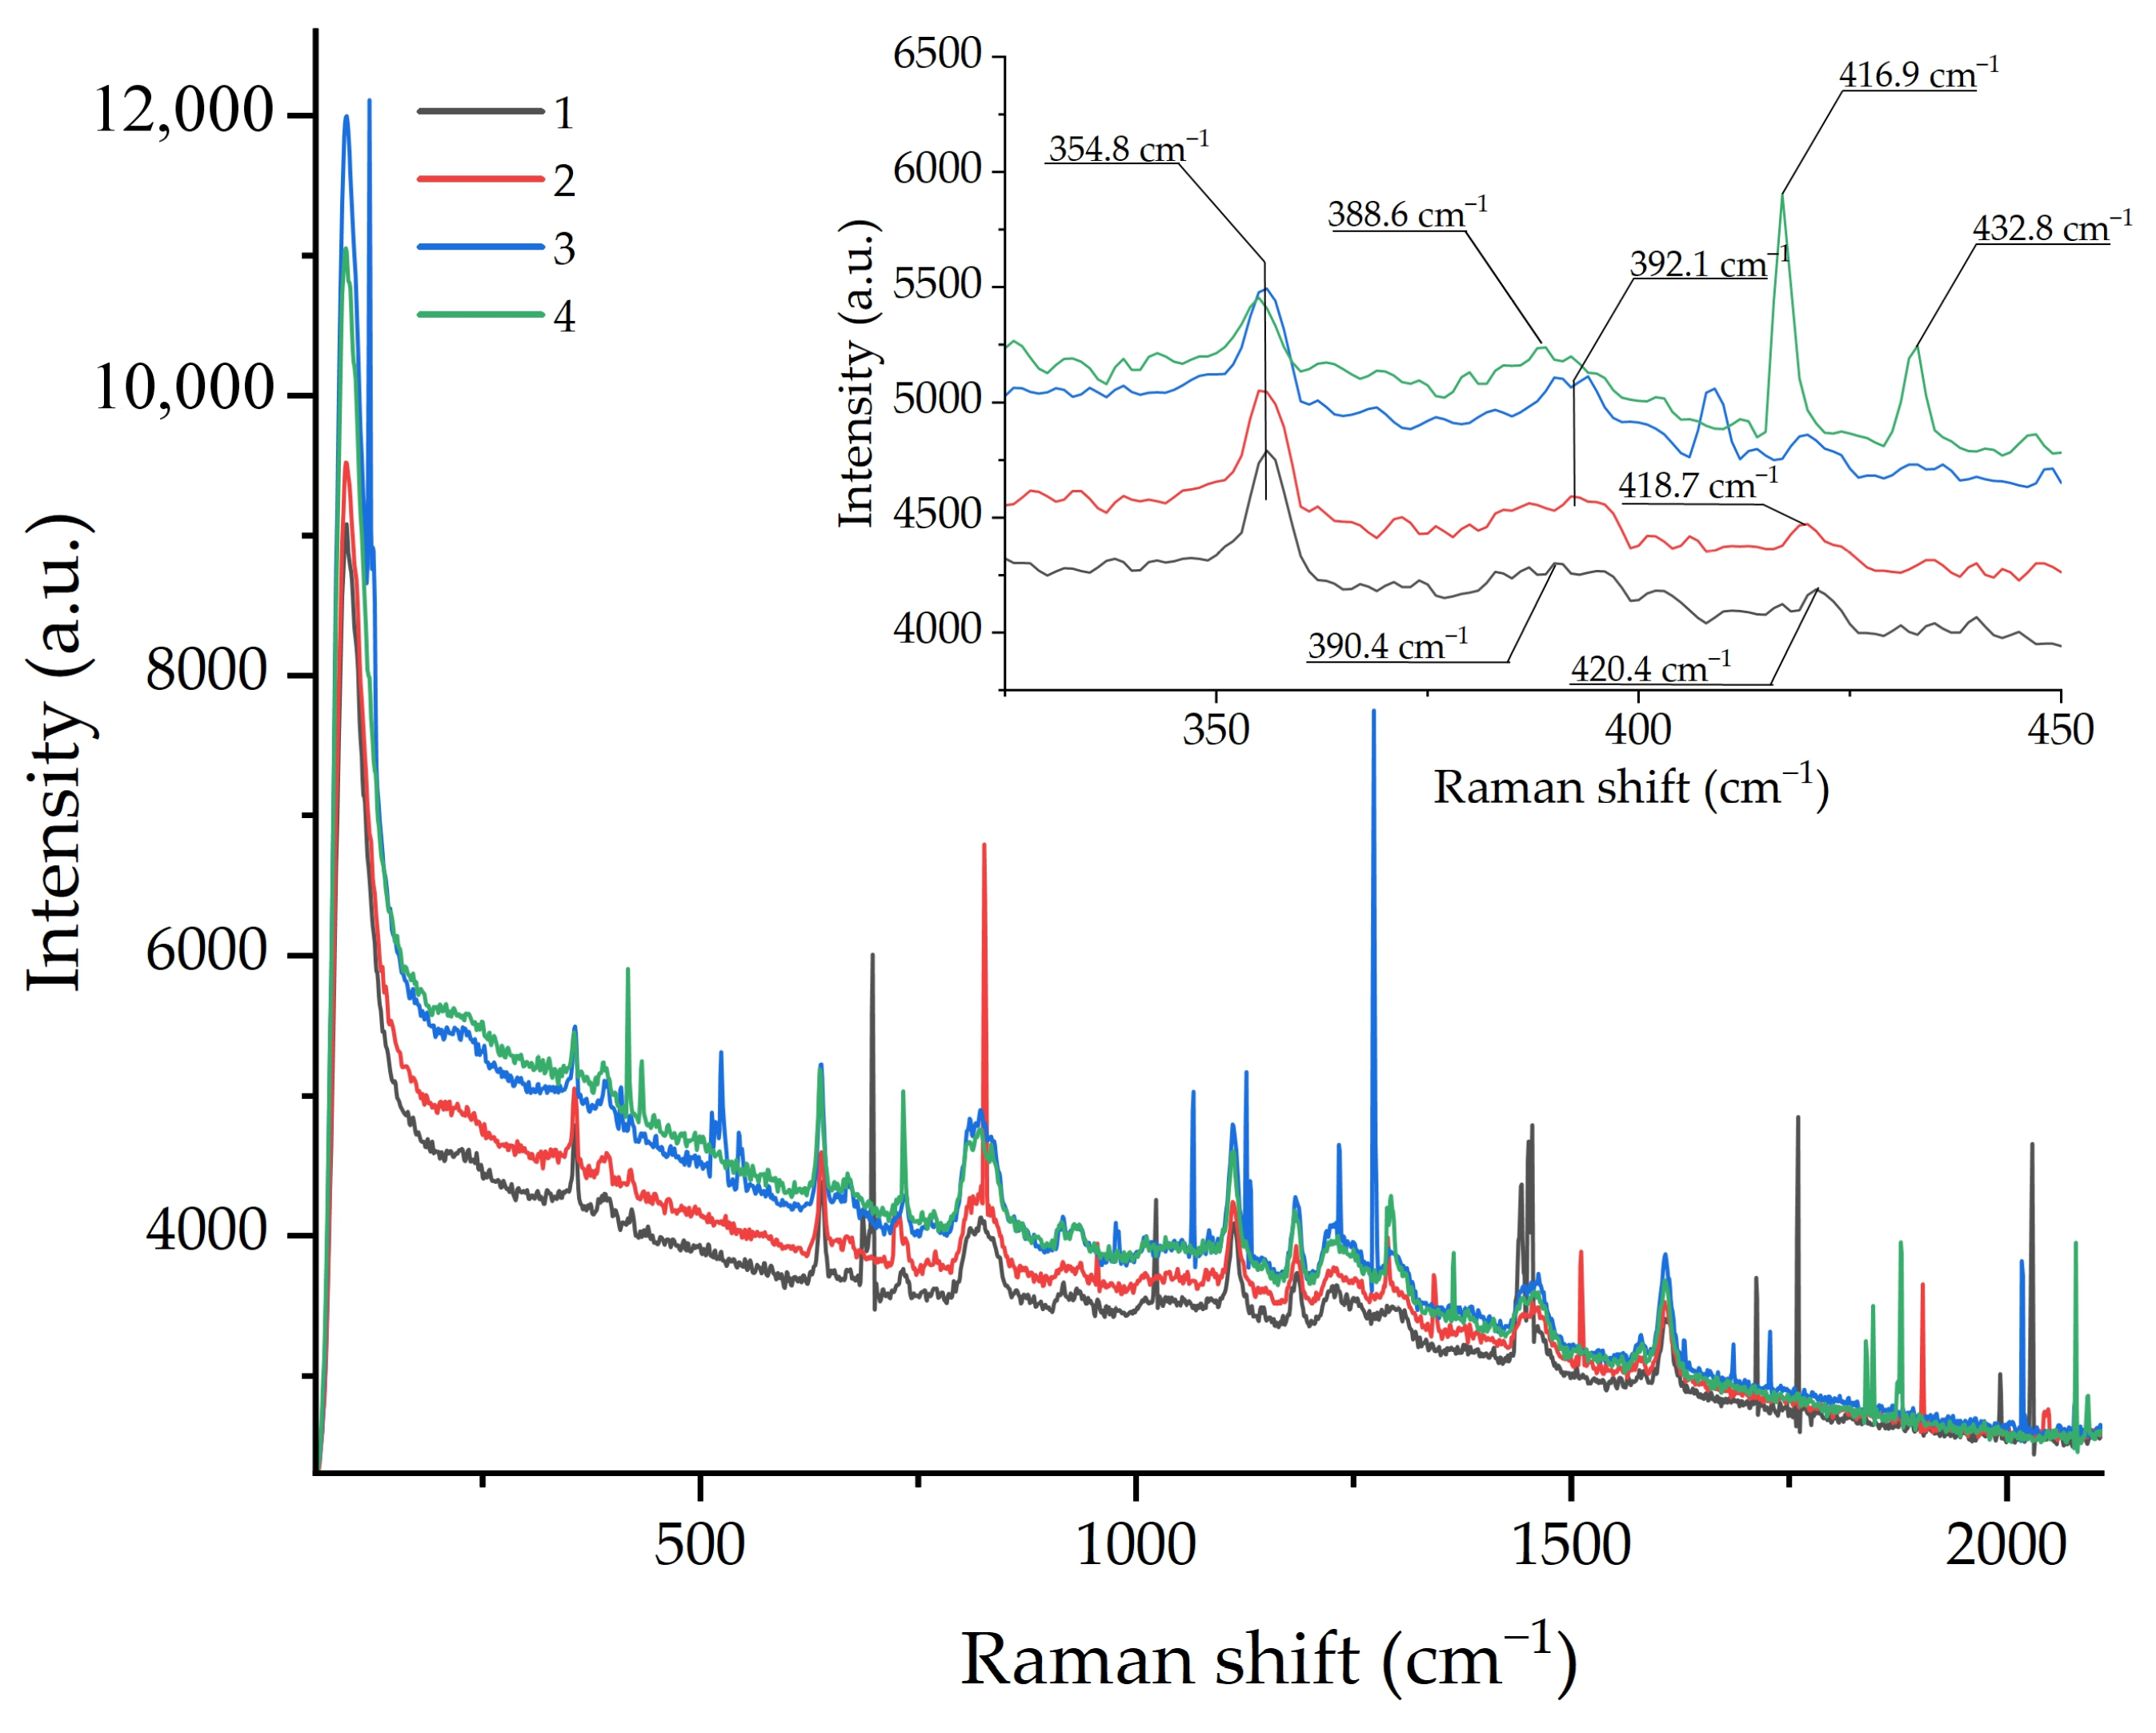
Figure 1 shows the Raman spectra of all WS2-containing composites alongside the pristine-reference system. Regardless of whether surface modification was applied, the WS2 nanosheets in all samples exhibit the characteristic vibrational bands of the 2H-WS2 phase: the in-plane 2LA(M) +   E 2 g 1 mode near 355 cm−1 and the out-of-plane A1g mode in the 417–420 cm−1 region. A weaker feature near 390 cm−1 corresponds to defect-related vibrations commonly attributed to local sulfur deficiency or mixed W–O–S coordination [25].
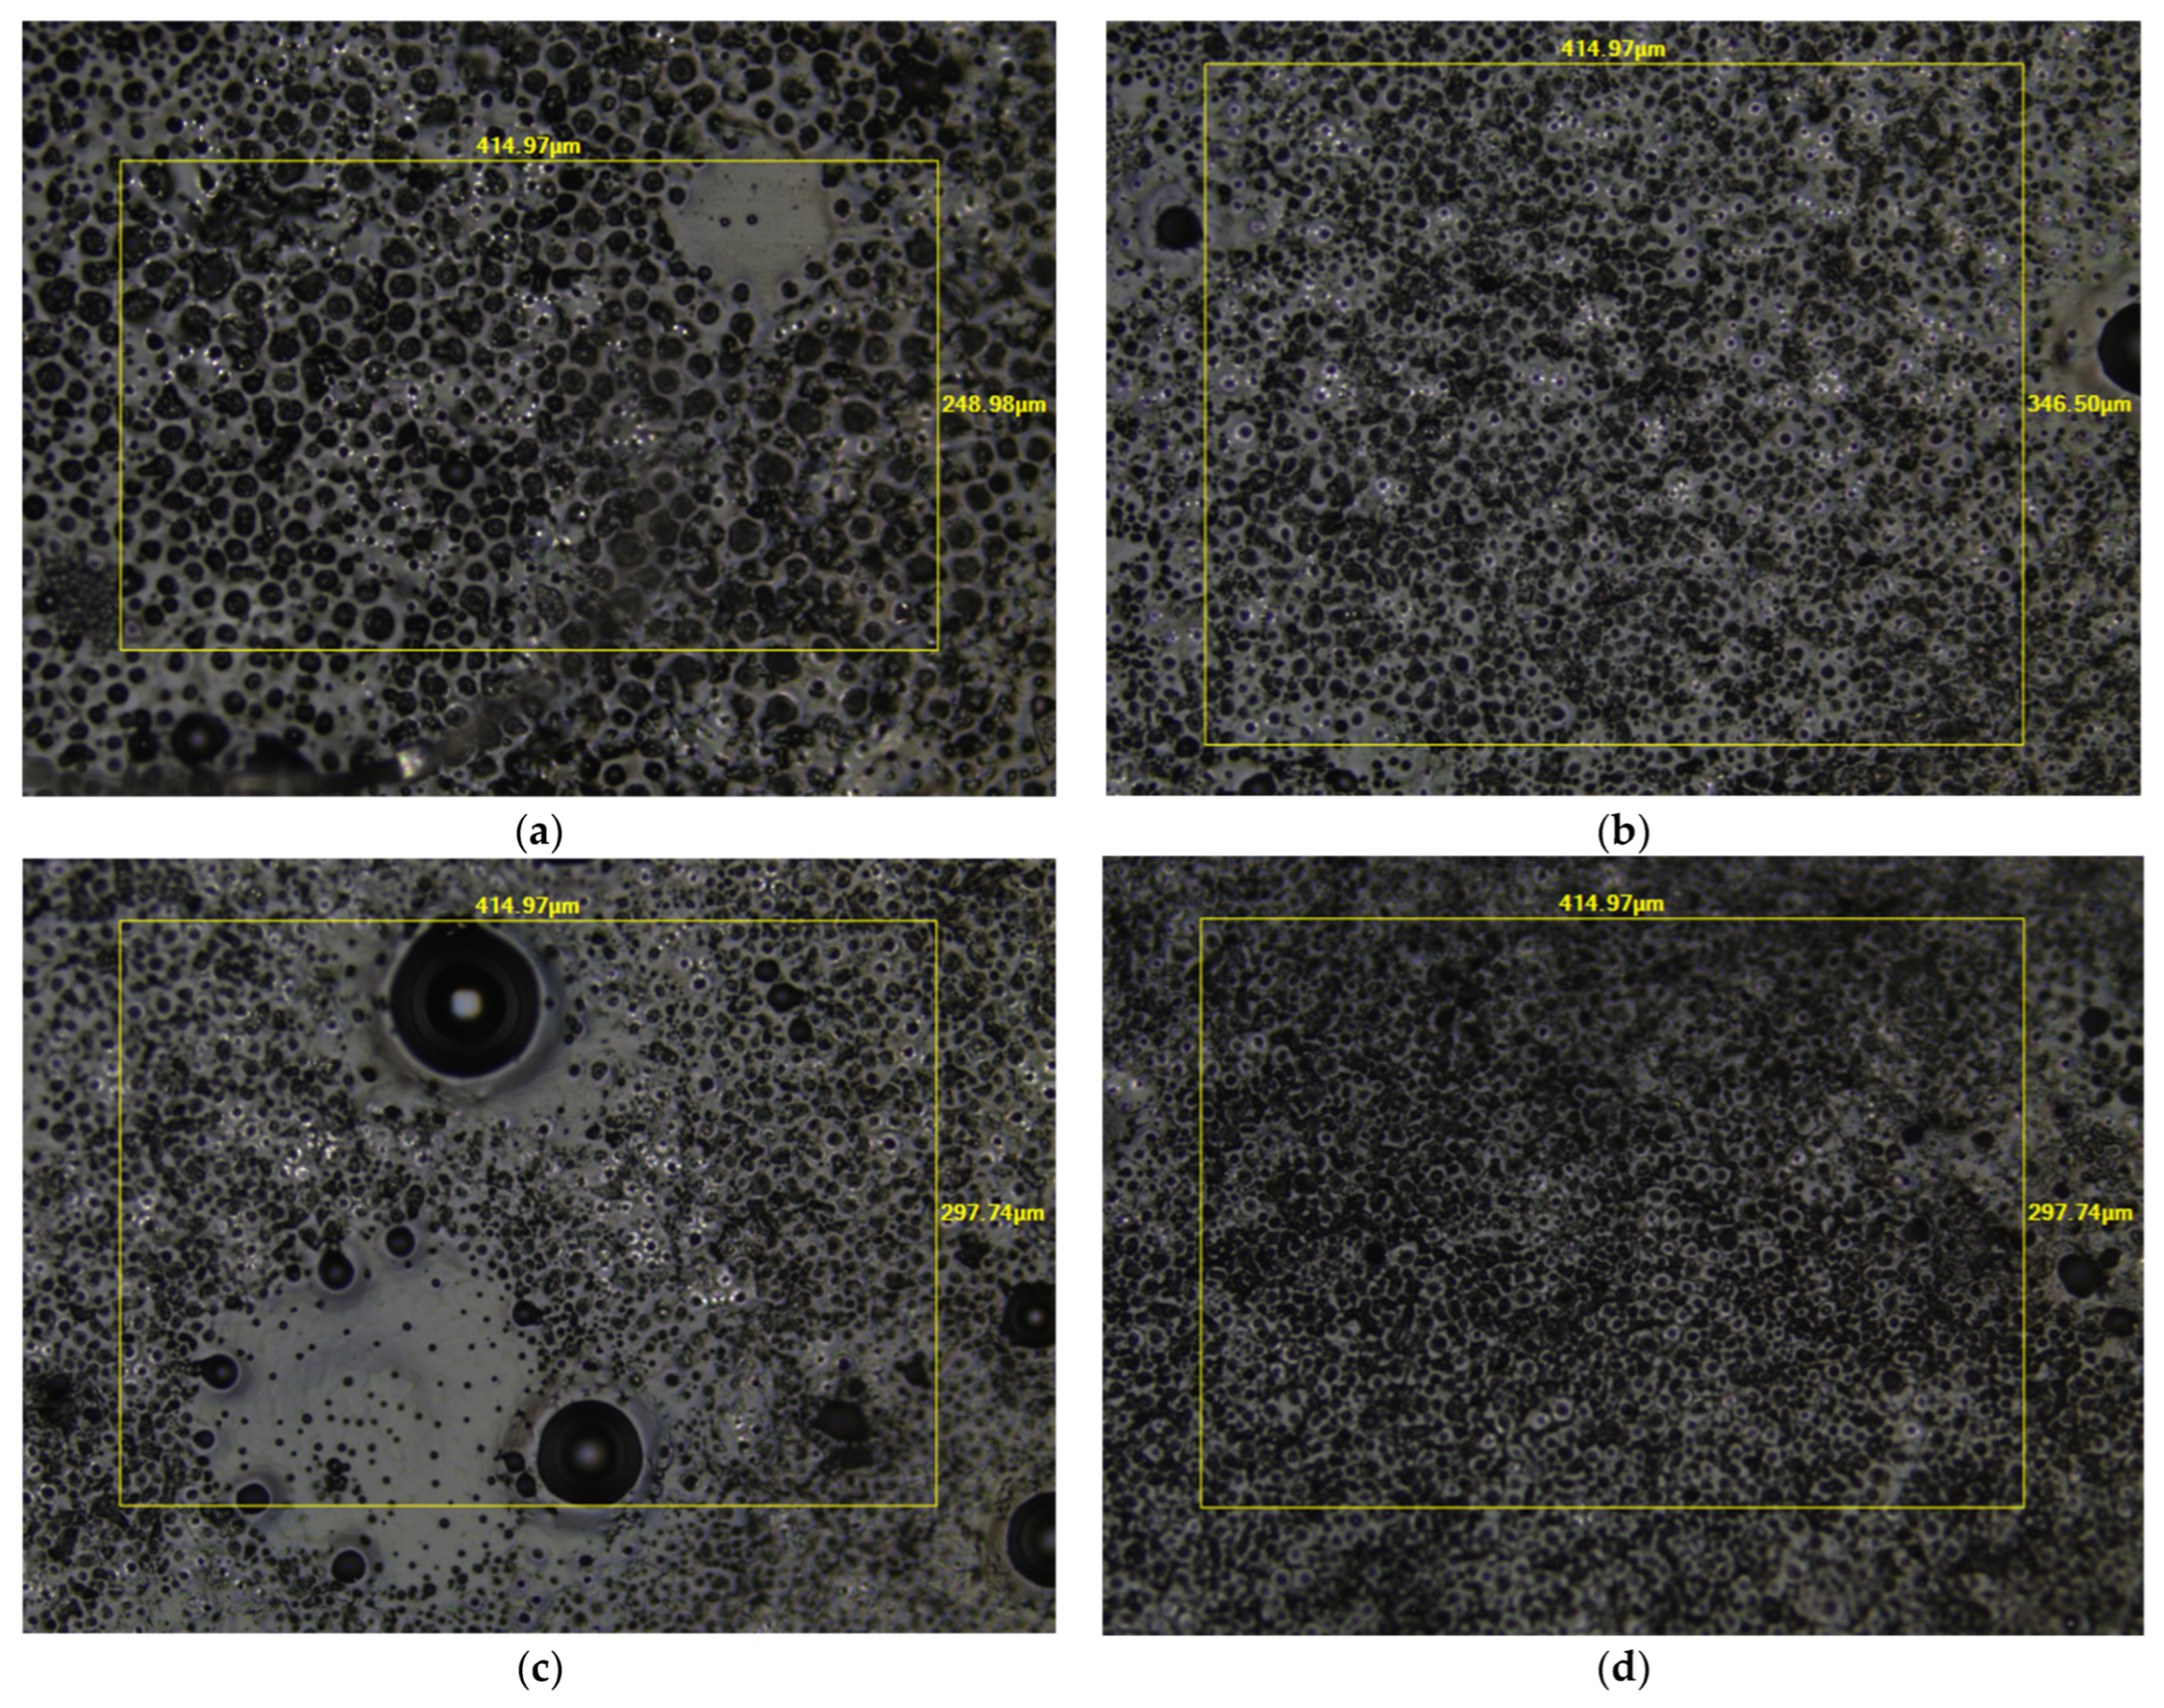
The optical microscopy images in Figure 2 provide visual evidence of the evolution in WS2 dispersion quality within the epoxy matrix as a function of aminoacetic acid (AA) surface modification. In the unmodified composite (Figure 2a), the pristine WS2 exhibits a pronounced tendency to form large, micron-sized agglomerates, which appear as dark, irregularly shaped clusters unevenly distributed throughout the matrix. This poor dispersion state is typical for unfunctionalized WS2 due to its limited compatibility with the organic resin and strong inter-particle van der Waals forces. Upon modification with 2.5 wt.% AA (Figure 2b), a noticeable reduction in the size of the largest agglomerates is observed, suggesting that the grafted AA molecules begin to improve interfacial compatibility, although some heterogeneity remains. Interestingly, at the intermediate concentration of 5.0 wt.% AA (Figure 2c), the dispersion quality does not follow a linear trend of improvement. Instead, the image reveals a reappearance of larger, more irregular agglomerates alongside finer particles, indicating a state of structural instability. This visually observed heterogeneity at 5.0 wt.% AA is consistent with the Raman spectroscopic data, which show maximum structural disorder, suppression of the A1g mode, and significant band broadening—confirming that this intermediate level of surface coverage disrupts the layered WS2 structure without establishing coherent interfacial bonding. In contrast, at the optimal concentration of 7.5 wt.% AA (Figure 2d), the WS2 nanosheets achieve the finest and most uniform dispersion across the epoxy matrix, with virtually no large-scale agglomerates visible at this magnification. This progressive, non-linear improvement in dispersion quality correlates directly with the spectral changes observed in the Raman analysis and is a key factor in the enhanced mechanical and thermal properties of the EP/WS2-AA7.5 composite, as a homogeneous distribution facilitates efficient load transfer throughout the material.

3.2. Comparative Raman Intensity Spectra

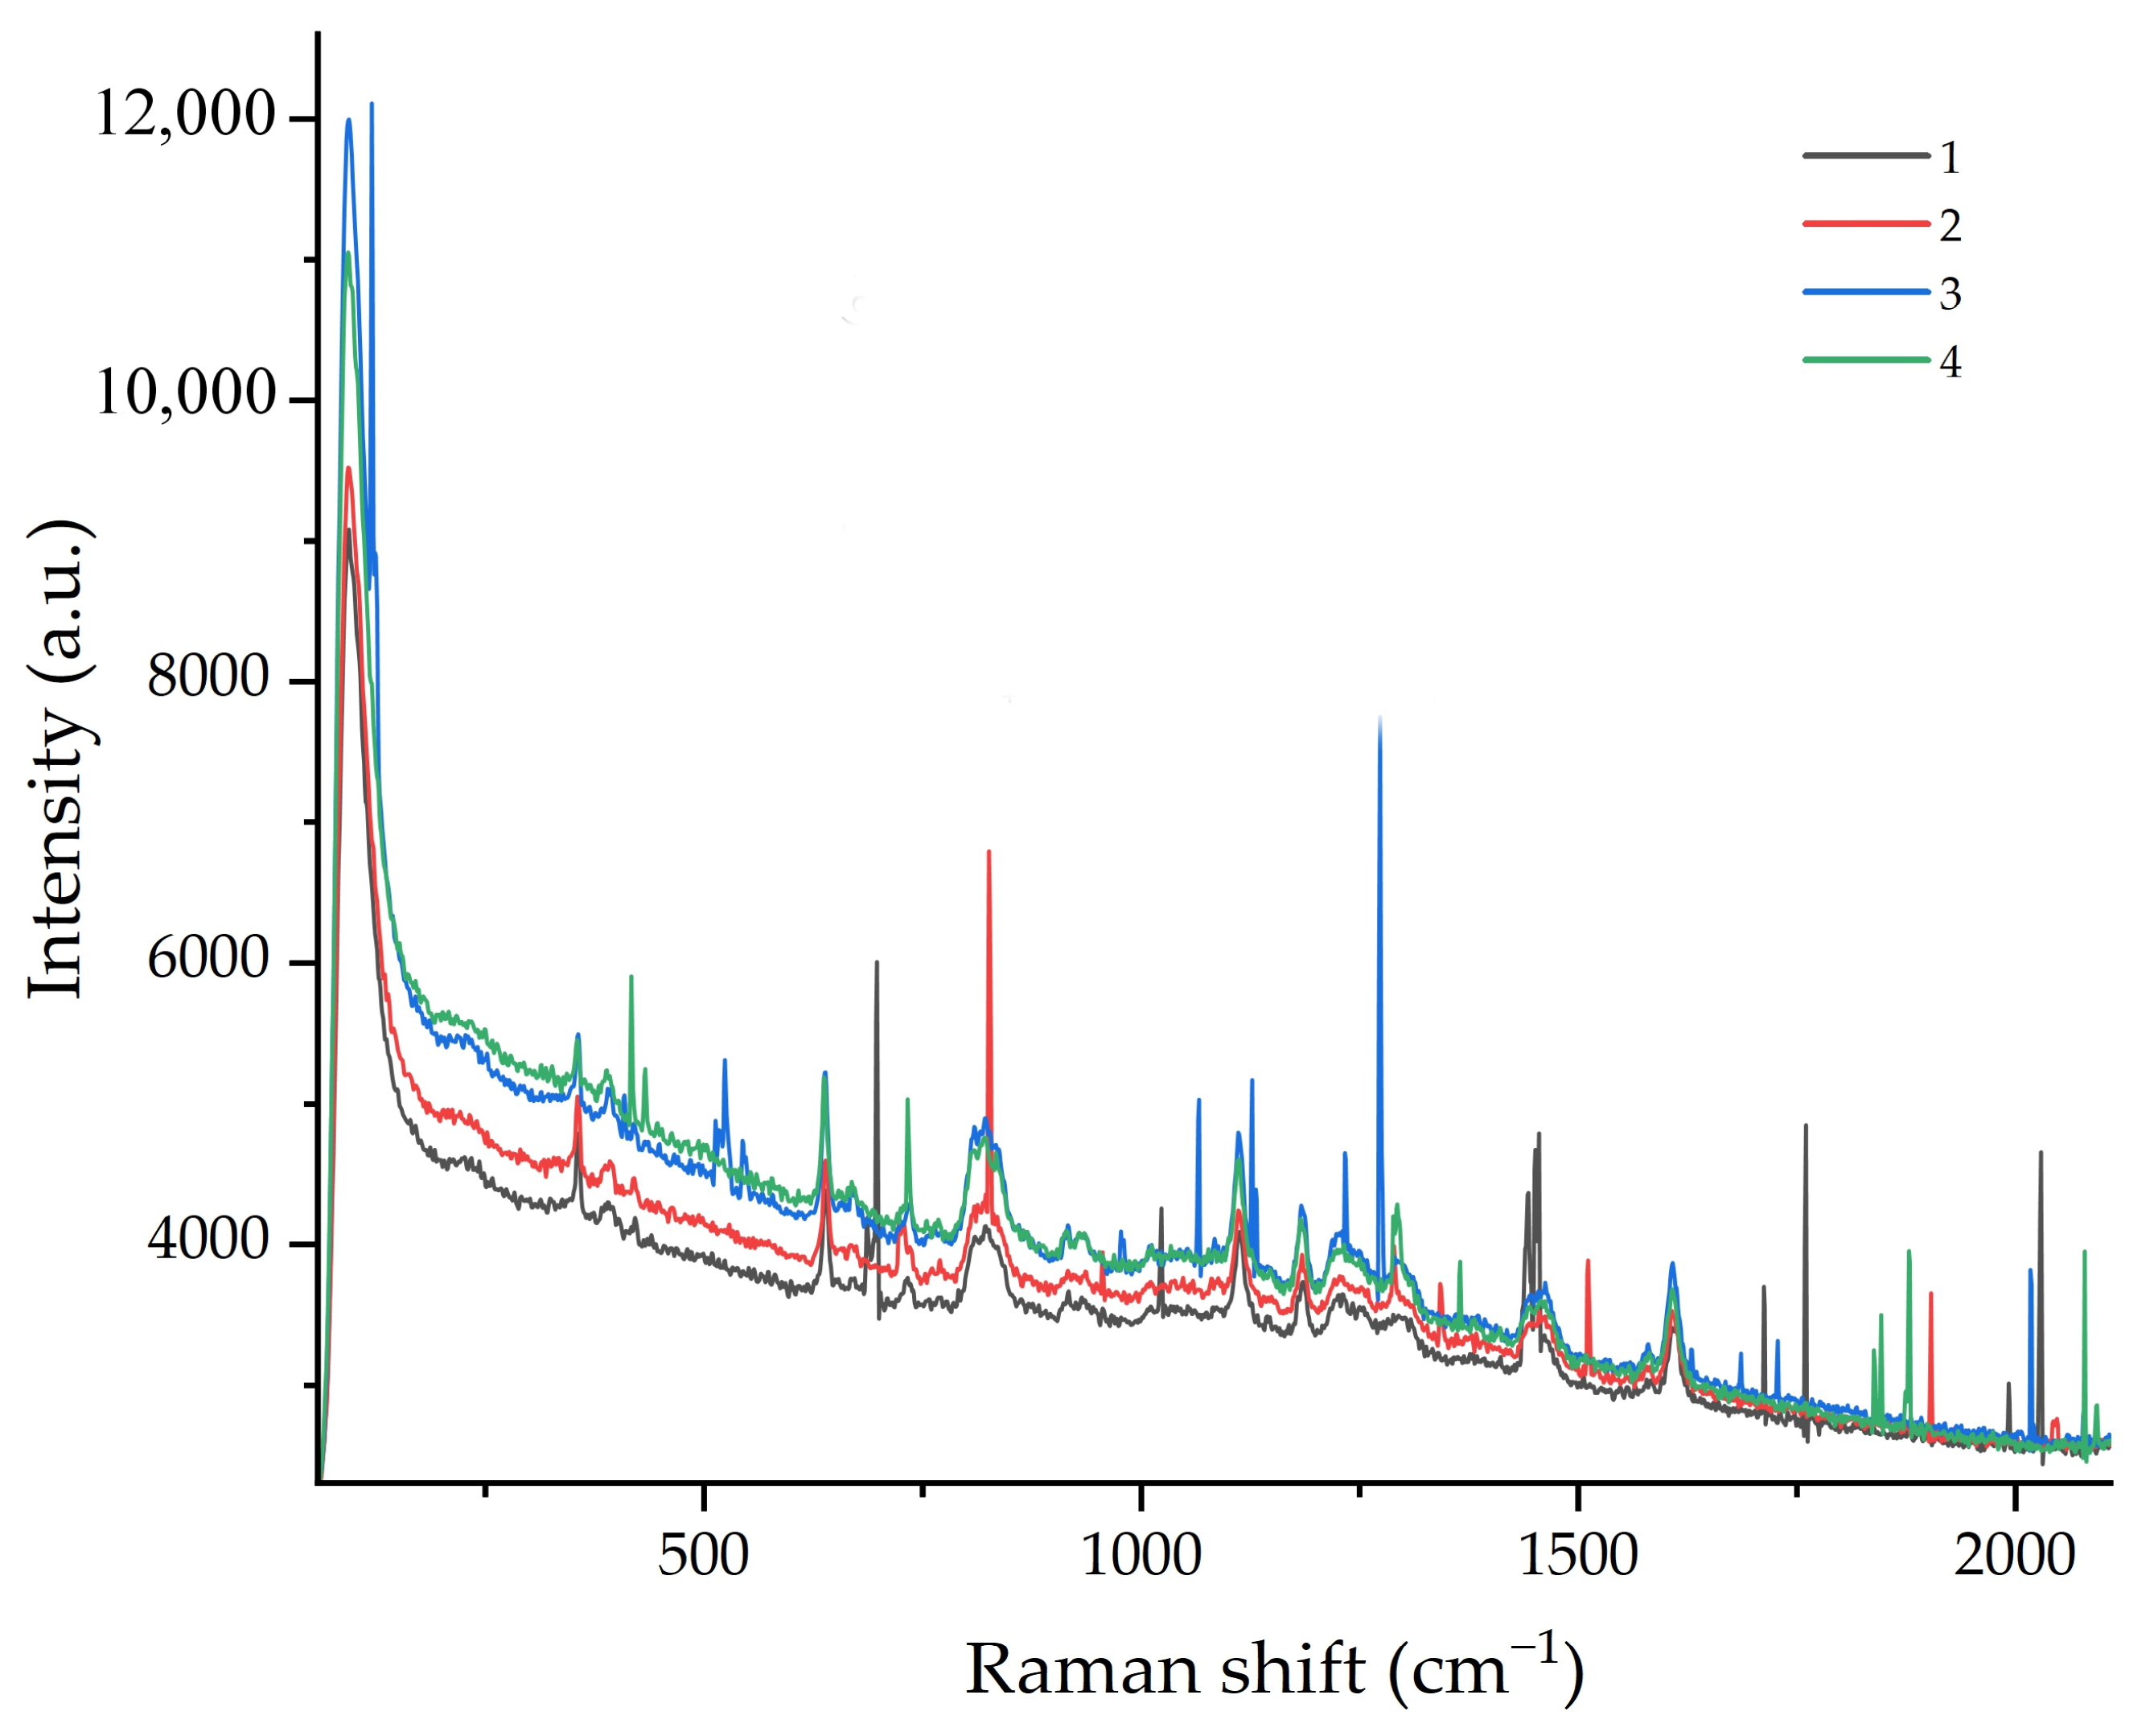
The superimposed spectra (Figure 3) highlight more clearly the intensity evolution induced by AA modification. Pristine WS2 in epoxy displays moderate Raman intensity, whereas AA-treated samples show a systematic increase, most pronounced at 7.5 wt.% AA. The enhancement cannot be attributed solely to concentration effects, as the WS2 loading remains constant across samples. Instead, the rise in intensity points to better dispersion of the WS2 particles and a stronger interaction with the surrounding polymer. So such behaviour is typically observed when agglomeration is reduced and the filler becomes more effectively integrated into the matrix, which also enhances the optical response of the material.
Notably, the A1g mode becomes progressively more prominent with increasing AA concentration. This enhancement can be explained by two interrelated factors. First, the improved dispersion of functionalized WS2 nanosheets—confirmed by optical microscopy (Figure 2) and previous studies on similar systems [10,26]—increases the density of individually accessible filler particles within the laser excitation volume, thereby amplifying the overall Raman signal from WS2 [27]. Second, and more fundamentally, the prominence of the A1g mode specifically indicates enhanced out-of-plane vibrational coupling. The A1g mode involves atomic displacements perpendicular to the WS2 basal planes and is highly sensitive to the local dielectric environment and interfacial bonding [7,28]. As aminoacetic acid grafting creates a more chemically compatible interface, the polymer chains interact more strongly with the WS2 surface, effectively “anchoring” the nanosheets within the epoxy network. This anchoring restricts random orientation and may promote partial alignment of the nanosheets, which increases the scattering cross-section for out-of-plane vibrations and makes the A1g mode more detectable [28,29]. Thus, the increased prominence of the A1g mode is a direct spectroscopic consequence of both better physical dispersion and stronger chemical coupling at the filler–matrix interface.

3.3. Peak Position Shift

According to Equation (3), the Raman peak position shift is
Δ ν = ν s a m p l e ν r e f e r e n c e
from the processed Raman spectra after baseline correction and smoothing.
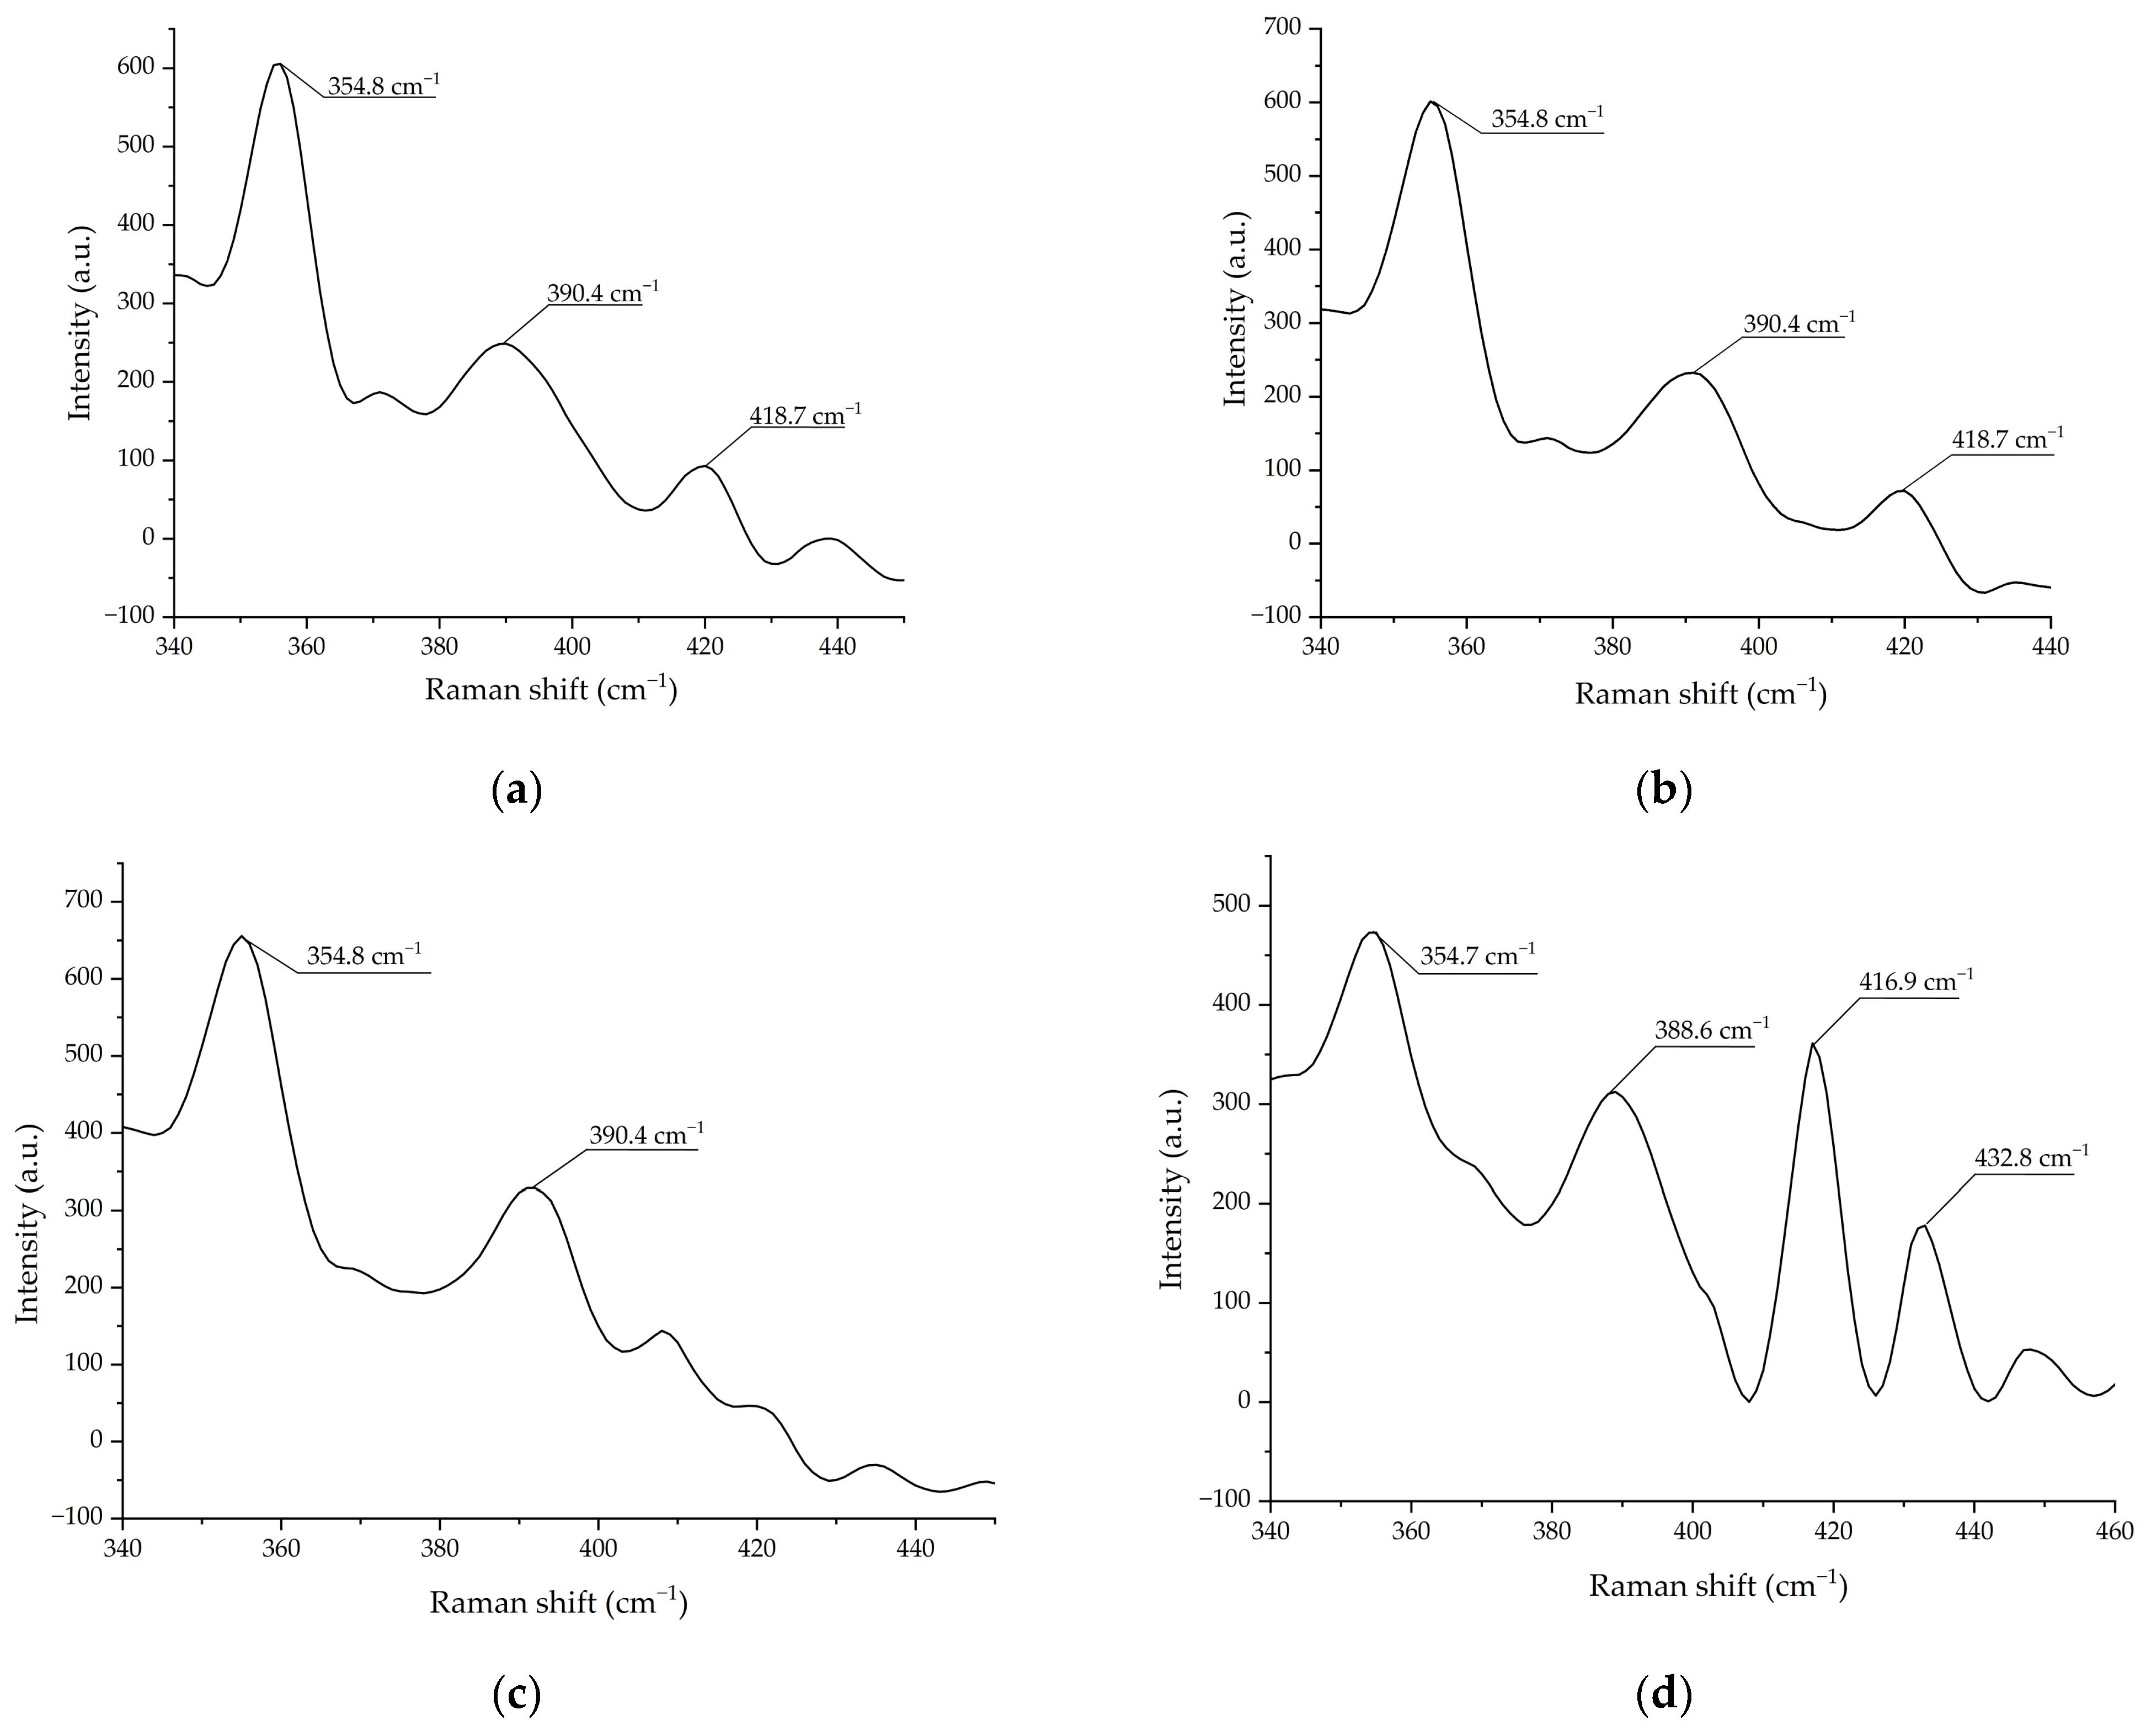
Figure 4 and Table 1 summarize the shifts in vibrational frequencies. The in-plane 2LA(M) + E2g1 mode remains essentially invariant at ~354.8 cm−1 for all samples, suggesting that the intralayer bonding configuration remains largely preserved during modification.
In contrast, the A1g mode undergoes distinct behaviour: 2.5 wt.% AA: negligible shift, slight broadening; 5.0 wt.% AA: A1g becomes unresolved; 7.5 wt.% AA: clear red shift (~–1.8 cm−1).
All spectra were baseline-corrected and smoothed prior to peak identification
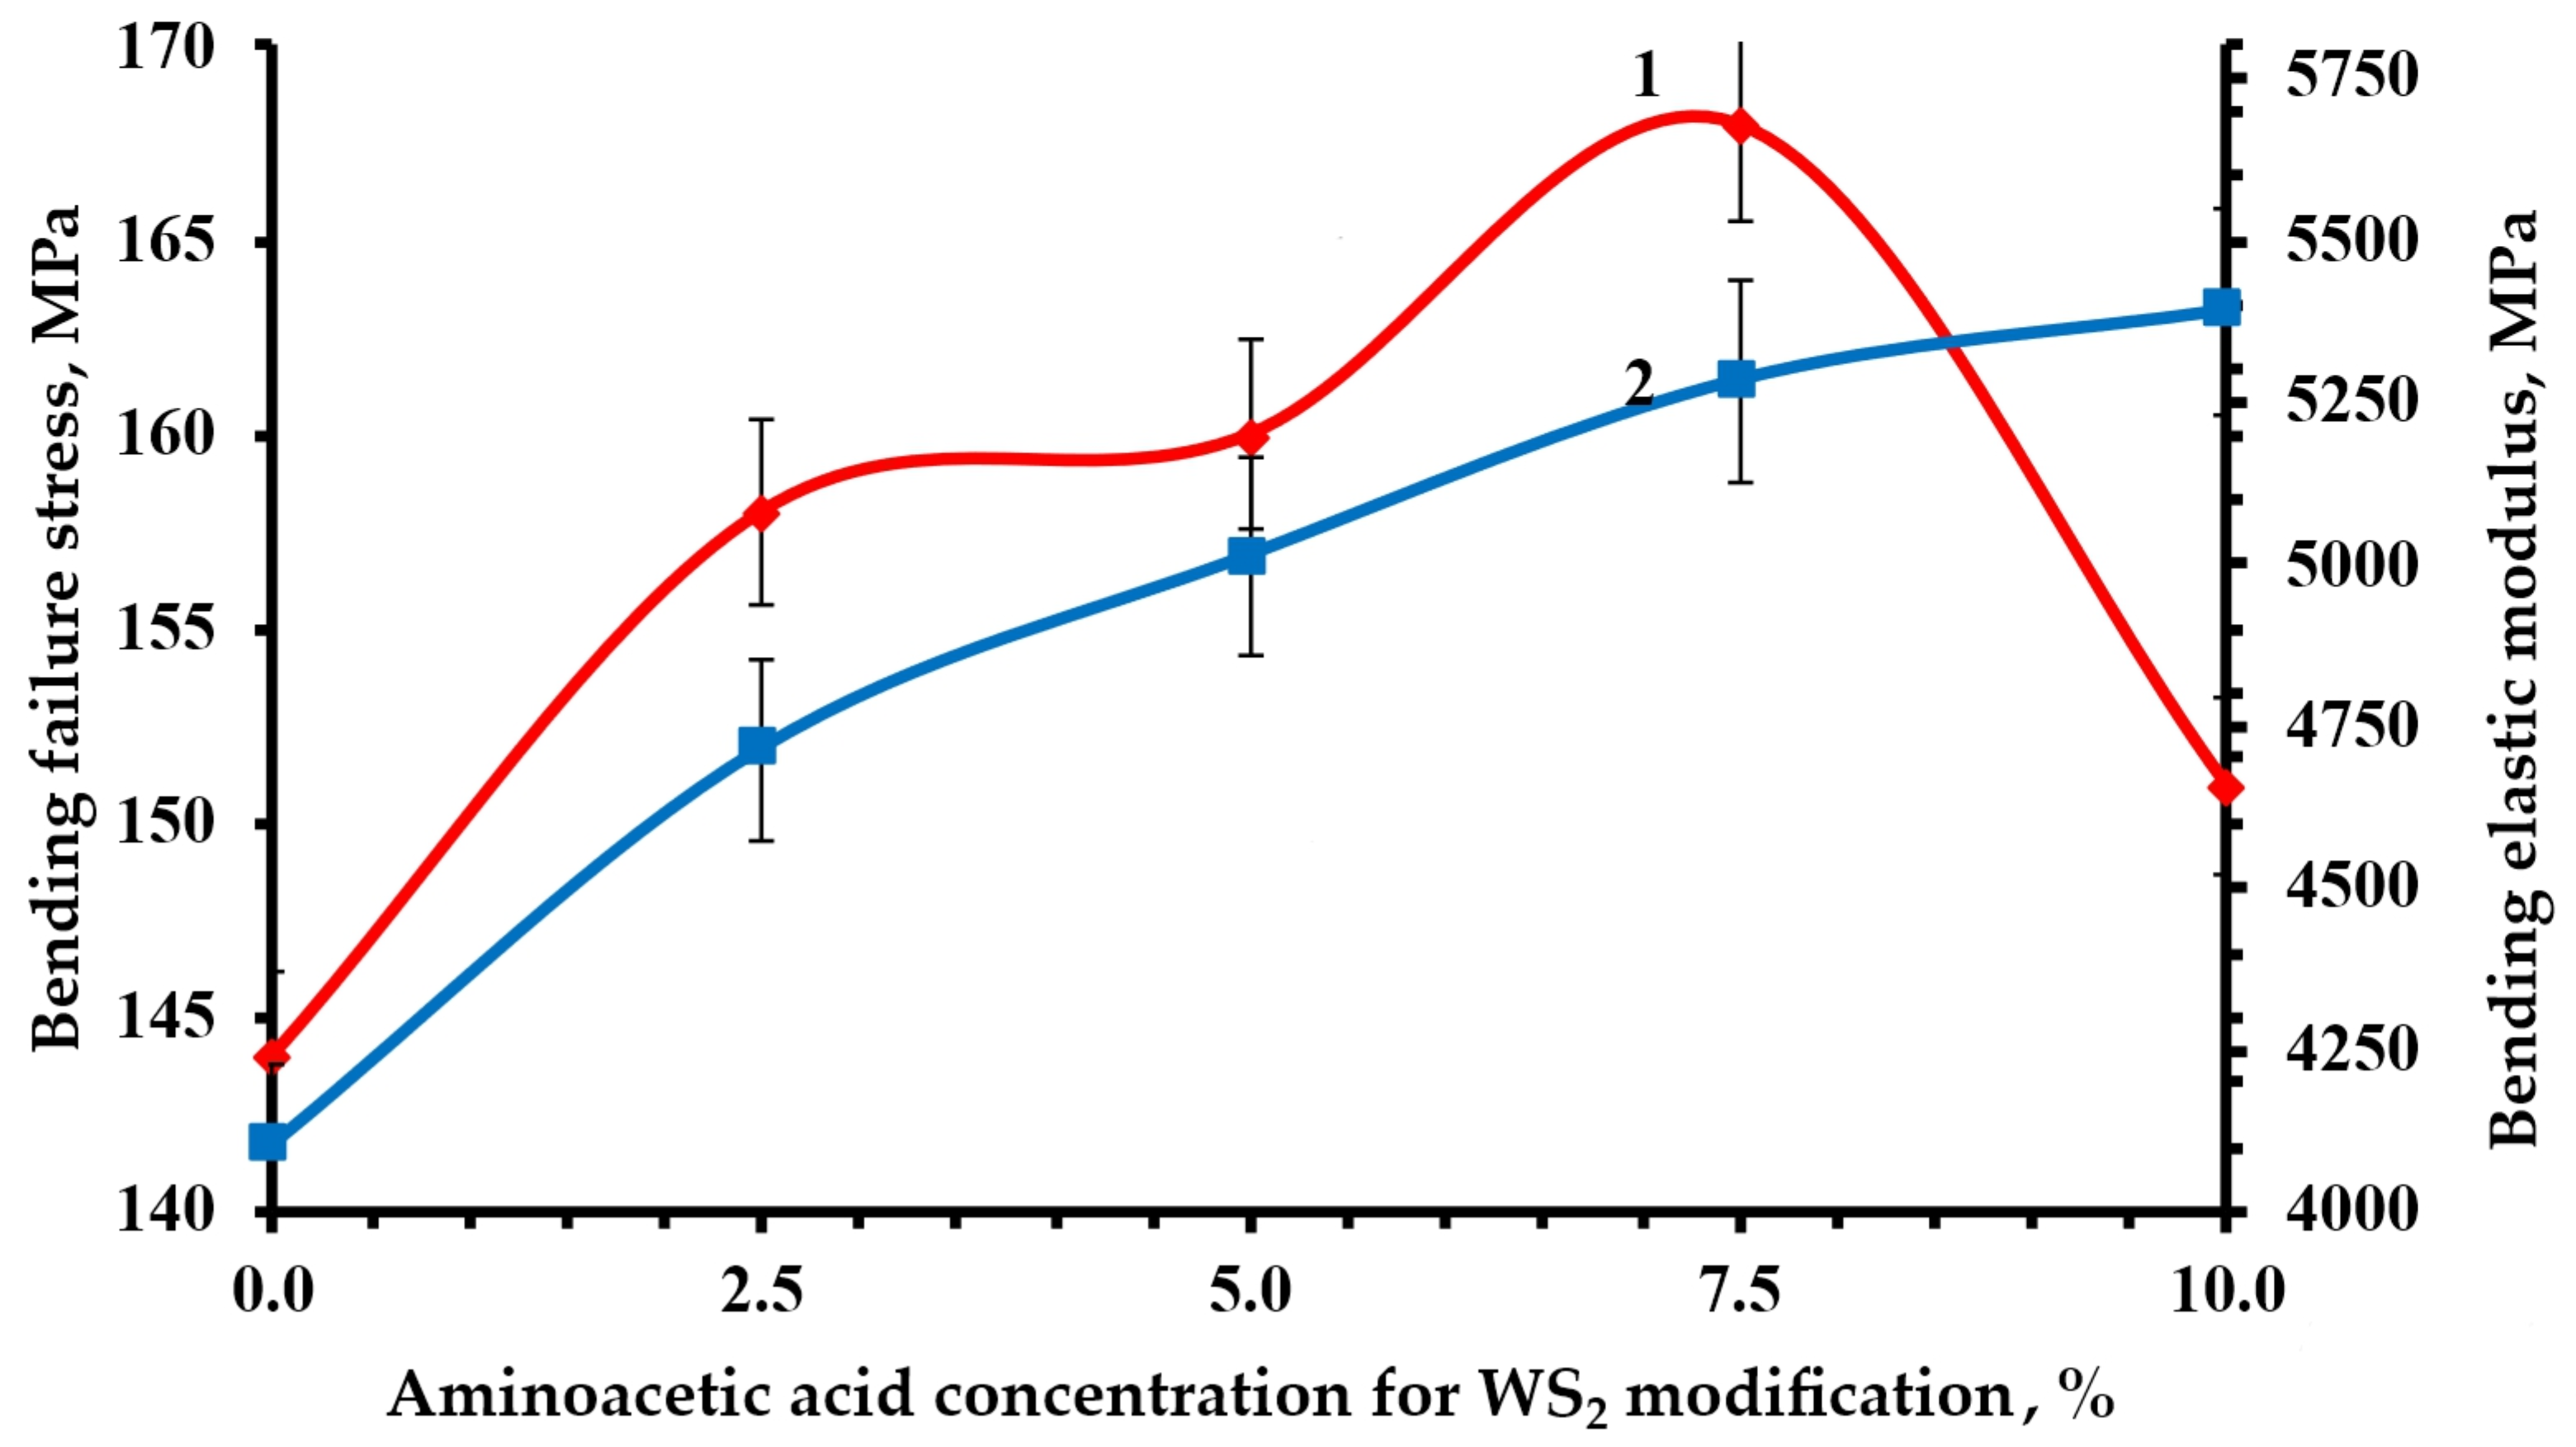
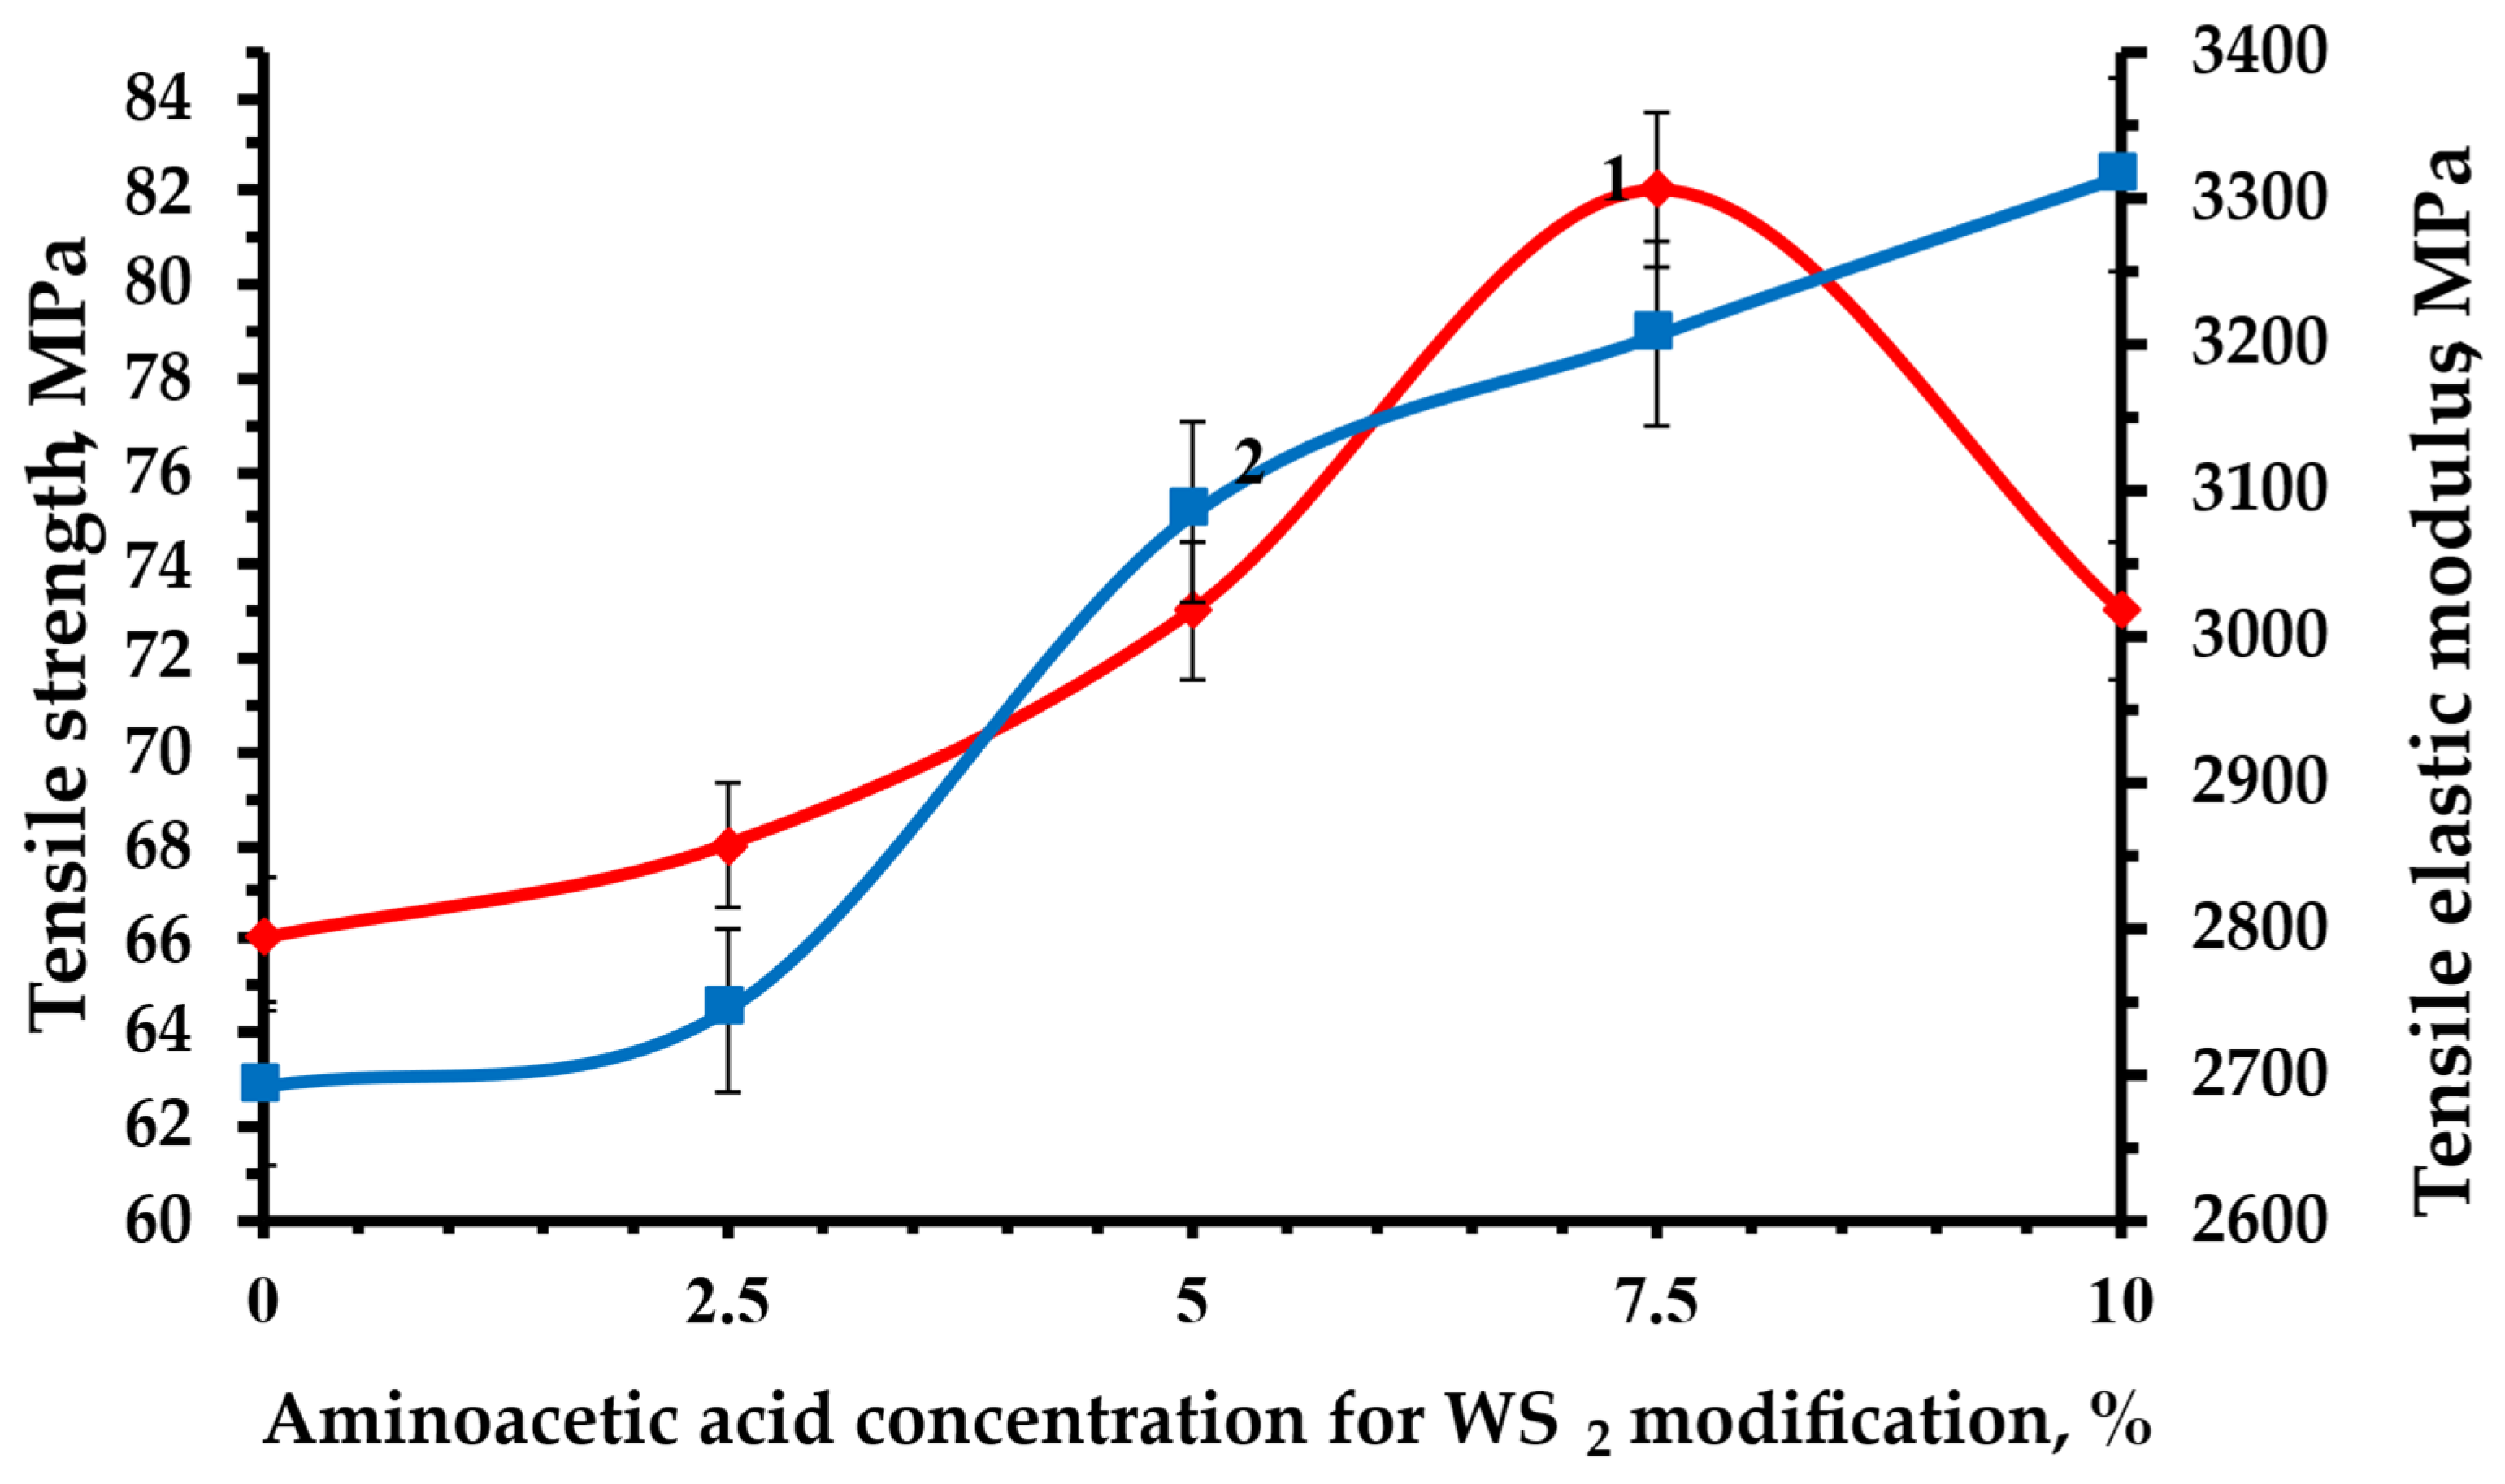
Independent mechanical tests show that the maximum enhancement of physico-mechanical properties occurs at a WS2 content of ~0.5 phr and an AA concentration of approximately 7.5 wt.% (Figure 5 and Figure 6). At these levels, both tensile and flexural strength, as well as the corresponding elastic moduli, increase significantly. This agreement between Raman-derived indicators of improved lattice–matrix coupling and the macroscopic mechanical response requires a mechanistic explanation based on established principles of polymer nanocomposite reinforcement.
The observed property enhancements can be attributed to a causal chain beginning with the chemical grafting of aminoacetic acid onto the WS2 surface. FTIR and EDS analyses confirmed that AA molecules form a stable organic layer through chemical bonding rather than simple physisorption [30]. This grafted layer serves two critical functions. First, it provides steric stabilization that prevents WS2 reagglomeration during composite curing, ensuring a homogeneous dispersion of nanofillers throughout the matrix [5,6]. Second, the amino groups (-NH2) introduced by AA modification can participate in the epoxy curing reaction, forming covalent linkages between the WS2 surface and the polymer network [10,31]. This covalent integration creates a stiff interphase region where stress can be efficiently transferred from the compliant epoxy matrix to the rigid WS2 nanosheets.
At the optimal AA concentration of 7.5 wt.%, the surface coverage reaches a critical threshold where a continuous, strain-compatible interphase forms. The Raman evidence supports this interpretation: the coordinated red shift of the A1g mode (−1.8 cm−1) indicates that the WS2 lattice experiences a homogeneous tensile strain field, which is precisely what occurs when load is effectively transferred from the matrix to a higher-modulus filler [32,33]. Simultaneously, the recovery of A1g intensity and the emergence of the ordered defect mode at 432.8 cm−1 suggest that the interface is not merely present but is structurally organized, allowing for coherent phonon propagation.
When external mechanical stress is applied to such a composite, the covalently bonded interface enables shear stress transfer from the matrix to the WS2 nanosheets. The high intrinsic modulus and two-dimensional geometry of WS2 allow it to bear a significant portion of the load, effectively reinforcing the polymer matrix [34,35]. Furthermore, the well-dispersed, strongly bonded nanosheets act as physical barriers that impede polymer chain mobility in the interphase region, increasing the effective crosslink density and thereby enhancing both stiffness and strength [29,31].
The thermal stability improvement (Vicat softening point rising to 165 °C) (Table 2) follows the same logic: restricted chain mobility and covalent filler–matrix bonding delay the onset of polymer chain relaxation at elevated temperatures [26,31]. Thus, the Raman-identified interfacial state at 7.5 wt.% AA is not merely correlated with but is mechanistically responsible for the observed enhancements in mechanical and thermal performance.

3.4. Intensity Ratio as an Indicator of Mode Balance and Structural Disorder

To quantify the balance between out-of-plane and in-plane (or defect-assisted) vibrations, the intensity ratio
R = I A 1 g I 2 L A M + E 2 g 1
was calculated from the raw, non-smoothed spectra (Table 3) [15].

3.5. Full Width at Half Maximum and Integrated Peak Areas

Full width at half maximum and integrated areas
FWHM = ν 2 ν 1
provide information about crystallinity: narrower peaks correspond to a higher degree of ordering, while broadening indicates structural defects or strain.
Peak fitting for the 2LA(M)+ E 2 g 1 mode (~354.8 cm−1) in all samples was performed using a Lorentzian function
I x = A 1 + ( x x 0 w 2 2 )
without additional parameters, as this profile provided the best description of the peak shape (Table 4).

4. Discussion

Before discussing the modal shifts, it is important to note that aminoacetic acid modification directly alters the surface state of WS2 and its interfacial behaviour in the epoxy matrix. FTIR revealed the appearance of –NH2 and –COOH bands together with a reduction in the broad O–H signal, indicating chemical grafting rather than simple physisorption of AA. EDS further confirmed an increased surface content of carbon and oxygen while preserving the intrinsic W/S ratio; the persistence of these elements after repeated washing also supports the presence of a firmly attached organic layer. SEM micrographs showed pronounced morphological changes: pristine WS2 formed large, compact agglomerates, whereas AA-treated particles appeared more separated, with smoother edges and markedly reduced secondary aggregation. Together, FTIR, EDS and SEM provide convergent evidence for the formation of a stable grafted layer that improves filler dispersion, modifies the local chemical environment and sets the stage for the spectral changes observed in the subsequent Raman analysis of the E2g1, A1g and defect-related modes [29].
This red shift at the highest AA concentration is commonly associated with tensile lattice strain or reduced interlayer coupling, both of which soften the out-of-plane vibration. The simultaneous shift of the defect-induced mode (~390 cm−1) further supports this interpretation. Such coordinated softening across multiple modes indicates that the WS2 nanosheets experience a more homogeneous strain and stress field and stronger interaction with the epoxy matrix at high AA levels [36,37].
This progressive improvement indicates that AA grafting enhances the thermal stability of the network by promoting more efficient filler–matrix coupling and restricting segmental mobility in the cured epoxy. The coincidence of maximum heat resistance at 7.5 wt.% AA with the Raman-identified strain-mediated interfacial organization and with the maxima in flexural and tensile properties further confirms that the chemically grafted WS2 phase stabilizes the polymer structure both mechanically and thermally [38,39].
The intensity ratio between the out-of-plane A1g vibration and the in-plane 2LA(M) + E2g1 mode serves as an indicator of symmetry, scattering pathways, and the balance between layered and perturbed WS2 states. In the pristine and AA2.5 composites, the ratio remains above unity, which is consistent with WS2 retaining its multilayer structure and a noticeable level of interlayer coupling. At 5.0 wt.% AA, this ratio can no longer be determined because the A1g mode becomes indistinct. Its disappearance is not linked to measurement limitations but reflects a pronounced disturbance of the lattice, where vibrational coherence is largely lost [40].
For the EP/WS2–AA7.5 material, the ratio drops below 1 (R = 0.92). This shift points to a stronger contribution from in-plane and defect-related scattering processes. Such a change is commonly observed when partial exfoliation, symmetry alterations, or strain-induced effects begin to influence the selection rules. The behaviour aligns with what has been reported for other TMD systems undergoing controlled structural perturbation, where the interaction between the filler and polymer matrix becomes sufficiently strong to affect phonon activity [32].
FWHM analysis highlights systematic changes in phonon lifetime and structural coherence. The 2LA(M) + E 2 g 1 peak broadens gradually from pristine WS2 (4.87 cm−1) to AA-treated samples (5.13–5.74 cm−1). This broadening reflects increased phonon scattering caused by surface perturbation, lattice disorder and heterogeneous strain fields inside the epoxy matrix [41].
The most dramatic change occurs at 5.0 wt.% AA: the 2LA(M) + E 2 g 1 mode becomes significantly broadened; the A1g mode vanishes entirely; the defect-related band intensifies. Such behaviour is characteristic of a vibrational state dominated by disorder, where the resulting structural disturbances are unevenly distributed and the interface is not sufficiently stabilized [42].
At 7.5 wt.% AA, the spectral behaviour changes noticeably. The A1g mode reappears with higher intensity and a narrower linewidth, indicating a partial restoration of the vibrational coherence that had been suppressed at lower modifier levels. In addition, a distinct band at 432.8 cm−1 becomes clearly visible. The appearance of this feature suggests a more orderly type of symmetry alteration, implying that the lattice is not merely experiencing random distortions but is undergoing a more systematic interfacial reorganization [43].
Taken together, these features show that increasing the amount of AA does not simply create extra defects. Instead, it alters the WS2–epoxy boundary in a way that supports a more stable vibrational and mechanical environment. As the degree of modification increases, the filler and polymer begin to interact in a more coordinated manner, leading to a more coherent interfacial configuration [35].
The integrated area of each Raman band provides information on scattering efficiency, mode accessibility and nanosheet orientation. At 2.5 and 5.0 wt.% AA, the areas of both the 2LA(M) + E 2 g 1 and A1g modes increase, which suggests that surface functionalization improves dispersion and enhances optical coupling between WS2 and the polymer [27].
The behaviour changes at 7.5 wt.% AA: the area of the 354.8 cm−1 mode decreases; the new ~432.8 cm−1 mode becomes dominant; the A1g area increases sharply.
This redistribution of spectral weight is characteristic of symmetry perturbation and activation of new vibrational channels, rather than simple signal enhancement. It indicates that the WS2 structure enters a new interfacial state, where chemical interactions with the polymer matrix influence vibrational pathways [44].
The EP/WS2–AA5.0 composite presents the strongest evidence of structural instability: A1g is fully suppressed; FWHM for 2LA(M) + E 2 g 1 reaches its maximum; defect contributions intensify; the ratio R cannot be defined.
This set of observations indicates a regime in which the AA content is too low to establish coherent interfacial bonding with WS2, yet sufficiently high to disrupt layer stacking and phonon scattering symmetry. Similar trends have been described for other TMD-based systems exposed to non-uniform strain or only partially completed surface treatment, where the loss of vibrational coherence and deviations from the usual selection rules are typical. In this context, the sample containing 5.0 wt.% AA can be viewed as a transitional state rather than a level of modification that stabilizes the filler [45].
Overall, the Raman data reveal a concentration-dependent evolution of the WS2–epoxy interface. At low AA content (2.5 wt.%), only minor spectral variations are observed, indicating limited interfacial interaction. At intermediate loading (5.0 wt.%), significant band broadening and suppression of A1g suggest increased structural disorder. At higher AA concentration (7.5 wt.%), coordinated red shifts, recovery of A1g intensity and the emergence of the ~432.8 cm−1 mode indicate a more organized strain-mediated interfacial state. These observations suggest that the influence of AA modification is non-linear and that effective interfacial coupling develops only at sufficiently high surface coverage [31,33,34].

5. Conclusions

This study employed quantitative Raman spectroscopy to elucidate the concentration-dependent evolution of the interphase in epoxy/WS2 nanocomposites functionalized with aminoacetic acid (AA). The analysis of peak shifts, linewidths, intensity ratios, and activation of new vibrational modes revealed a non-monotonic restructuring of the filler–matrix interface.
Low AA concentration (2.5 wt.%) induced only minor spectral variations, indicating weak interfacial interaction. Intermediate modification (5.0 wt.%) led to maximum structural disorder, characterized by suppression of the A1g mode and significant broadening of the in-plane vibration, confirming that insufficient surface coverage disrupts the WS2 structure without establishing coherent interfacial bonding. In contrast, optimal modification at 7.5 wt.% AA promoted an organized, strain-mediated interfacial state, evidenced by a coordinated red shift of the A1g mode (–1.8 cm−1), a decrease in the A1g/2LA(M) + E2g1 intensity ratio to below unity (R = 0.92), and the emergence of a disorder-activated mode at 432.8 cm−1.
These Raman-derived indicators of interfacial quality showed strong agreement with independently measured mechanical and thermal properties. The 7.5 wt.% AA formulation simultaneously achieved maximum flexural strength, tensile modulus, and Vicat softening temperature (165 °C). The results demonstrate that aminoacetic acid modification is an effective but highly concentration-dependent strategy for tailoring the WS2–epoxy interface, with the 7.5 wt.% level representing the optimal balance where sufficient surface coverage facilitates stable strain transfer and maximizes composite performance. This work establishes quantitative Raman spectroscopy as a robust methodology for the rational design of high-performance polymer nanocomposites reinforced with two-dimensional materials.
More broadly, this work establishes quantitative Raman spectroscopy as a robust methodology for the rational design of high-performance polymer nanocomposites reinforced with two-dimensional materials, enabling a transition from empirical formulation towards structure–property-guided development based on nanoscale interfacial phenomena.

Author Contributions

Conceptualization, A.M., A.B., A.S. and B.I.; Data curation, A.M., A.S. and B.I.; Formal analysis, A.B.; Funding acquisition, A.B.; Investigation, A.M., A.S. and B.I.; Methodology, A.M., A.B., A.S. and B.I.; Project administration, A.B.; Resources, A.B.; Software, A.M., A.B. and B.I.; Supervision, A.M.; Validation, A.B.; Writing—original draft, A.M., A.B. and B.I.; Writing—review and editing, A.M., A.B., A.S. and B.I. All authors have read and agreed to the published version of the manuscript.

Funding

This research was funded by the Science Committee of the Ministry of Science and Higher Education of the Republic of Kazakhstan (grant No. BR24992882).

Data Availability Statement

Data are contained within the article.

Conflicts of Interest

The authors declare no conflicts of interest.

References

  1. Fekiač, J.J.; Krbata, M.; Kohutiar, M.; Janík, R.; Kakošová, L.; Breznická, A.; Eckert, M.; Mikuš, P. Comprehensive Review: Optimization of Epoxy Composites, Mechanical Properties, & Technological Trends. Polymers 2025, 17, 271. [Google Scholar] [CrossRef]
  2. Lim, W.Y.L.; Jaafar, M.; Ishak, K.M.K.; Chinniah, K.; Chan, W.K. Thermo-mechanical Properties of Epoxy Composites Filled with Inorganic Particulate Fillers for Robust Solder Mask Application. Polym. Int. 2024, 73, 779–788. [Google Scholar] [CrossRef]
  3. Gonçalves, F.A.; Santos, M.; Cernadas, T.; Alves, P.; Ferreira, P. Influence of Fillers on Epoxy Resins Properties: A Review. J. Mater. Sci. 2022, 57, 15183–15212. [Google Scholar] [CrossRef]
  4. Manzeli, S.; Ovchinnikov, D.; Pasquier, D.; Yazyev, O.V.; Kis, A. 2D Transition Metal Dichalcogenides. Nat. Rev. Mater. 2017, 2, 17033. [Google Scholar] [CrossRef]
  5. Riaz, S.; Park, S.-J. Effective Reinforcement of Melamine-Functionalized WS2 Nanosheets in Epoxy Nanocomposites at Low Loading via Enhanced Interfacial Interaction. Macromol. Res. 2020, 28, 1116–1126. [Google Scholar] [CrossRef]
  6. Ahmadi, M.; Zabihi, O.; Jeon, S.; Yoonessi, M.; Dasari, A.; Ramakrishna, S.; Naebe, M. 2D Transition Metal Dichalcogenide Nanomaterials: Advances, Opportunities, and Challenges in Multi-Functional Polymer Nanocomposites. J. Mater. Chem. A 2020, 8, 845–883. [Google Scholar] [CrossRef]
  7. Zhang, X.; Qiao, X.-F.; Shi, W.; Wu, J.-B.; Jiang, D.-S.; Tan, P.-H. Phonon and Raman Scattering of Two-Dimensional Transition Metal Dichalcogenides from Monolayer, Multilayer to Bulk Material. Chem. Soc. Rev. 2015, 44, 2757–2785. [Google Scholar] [CrossRef] [PubMed]
  8. Saito, R.; Tatsumi, Y.; Huang, S.; Ling, X.; Dresselhaus, M.S. Raman Spectroscopy of Transition Metal Dichalcogenides. J. Phys. Condens. Matter 2016, 28, 353002. [Google Scholar] [CrossRef]
  9. Haba, D.; Brunner, A.J.; Pinter, G. Dispersion of Fullerene-like WS2 Nanoparticles within Epoxy and the Resulting Fracture Mechanics. Compos. Sci. Technol. 2015, 119, 55–61. [Google Scholar] [CrossRef]
  10. Bekeshev, A.; Mostovoy, A.; Shcherbakov, A.; Tastanova, L.; Akhmetova, M.; Apendina, A.; Orynbassar, R.; Lopukhova, M. The Influence of Pristine and Aminoacetic Acid-Treated Aluminum Nitride on the Structure, Curing Processes, and Properties of Epoxy Nanocomposites. J. Compos. Sci. 2023, 7, 482. [Google Scholar] [CrossRef]
  11. Yoo, J.; Yang, K.; Cho, B.W.; Kim, K.K.; Lim, S.C.; Lee, S.M.; Jeong, M.S. Identifying the Origin of Defect-Induced Raman Mode in WS2 Monolayers via Density Functional Perturbation Theory. J. Phys. Chem. C 2022, 126, 4182–4187. [Google Scholar] [CrossRef]
  12. Ling, X.; Fang, W.; Lee, Y.-H.; Araujo, P.T.; Zhang, X.; Rodriguez-Nieva, J.F.; Lin, Y.; Zhang, J.; Kong, J.; Dresselhaus, M.S. Raman Enhancement Effect on Two-Dimensional Layered Materials: Graphene, h-BN and MoS2. Nano Lett. 2014, 14, 3033–3040. [Google Scholar] [CrossRef] [PubMed]
  13. Ferrari, A.C.; Robertson, J. Interpretation of Raman Spectra of Disordered and Amorphous Carbon. Phys. Rev. B 2000, 61, 14095–14107. [Google Scholar] [CrossRef]
  14. Malard, L.M.; Pimenta, M.A.; Dresselhaus, G.; Dresselhaus, M.S. Raman Spectroscopy in Graphene. Phys. Rep. 2009, 473, 51–87. [Google Scholar] [CrossRef]
  15. Gouadec, G.; Colomban, P. Raman Spectroscopy of Nanostructures and Nanosized Materials. J. Raman Spectrosc. 2007, 38, 598–603. [Google Scholar] [CrossRef]
  16. Arora, A.K.; Rajalakshmi, M.; Ravindran, T.R.; Sivasubramanian, V. Raman Spectroscopy of Optical Phonon Confinement in Nanostructured Materials. J. Raman Spectrosc. 2007, 38, 604–617. [Google Scholar] [CrossRef]
  17. Koniakhin, S.V.; Utesov, O.I.; Terterov, I.N.; Siklitskaya, A.V.; Yashenkin, A.G.; Solnyshkov, D. Raman Spectra of Crystalline Nanoparticles: Replacement for the Phonon Confinement Model. J. Phys. Chem. C 2018, 122, 19219–19229. [Google Scholar] [CrossRef]
  18. Fernández-Álvarez, M.; Moure, A.; Delgado, L.A.; Reinosa, J.J.; Fernández, J.F. Raman Spectroscopy Study of the Role of Dispersion and Interfaces in the Improvement of the Mechanical Properties of Epoxy-TiO2 Composites. J. Mater. Res. Technol. 2025, 34, 1744–1758. [Google Scholar] [CrossRef]
  19. Gouadec, G.; Colomban, P. Raman Spectroscopy of Nanomaterials: How Spectra Relate to Disorder, Particle Size and Mechanical Properties. Prog. Cryst. Growth Charact. Mater. 2007, 53, 1–56. [Google Scholar] [CrossRef]
  20. ISO 527-1:2019; Plastics—Determination of Tensile Properties—Part 1: General Principles. ISO: Geneva, Switzerland, 2019.
  21. ISO 178:2019; Plastics—Determination of Flexural Properties. ISO: Geneva, Switzerland, 2019.
  22. ISO 306:2022; Plastics—Thermoplastic Materials—Determination of Vicat Softening Temperature (VST). International Organization for Standardization: Geneva, Switzerland, 2022.
  23. Schulze, H.G.; Rangan, S.; Vardaki, M.Z.; Blades, M.W.; Turner, R.F.B.; Piret, J.M. Rapid Vector-Based Peak Fitting and Resolution Enhancement for Correlation Analyses of Raman Hyperspectra. Appl. Spectrosc. 2023, 77, 957–969. [Google Scholar] [CrossRef]
  24. Savitzky, A.; Golay, M.J.E. Smoothing and Differentiation of Data by Simplified Least Squares Procedures. Anal. Chem. 1964, 36, 1627–1639. [Google Scholar] [CrossRef]
  25. Berkdemir, A.; Gutiérrez, H.R.; Botello-Méndez, A.R.; Perea-López, N.; Elías, A.L.; Chia, C.-I.; Wang, B.; Crespi, V.H.; López-Urías, F.; Charlier, J.-C.; et al. Identification of Individual and Few Layers of WS2 Using Raman Spectroscopy. Sci. Rep. 2013, 3, 1755. [Google Scholar] [CrossRef]
  26. Mostovoy, A.; Bekeshev, A.; Shcherbakov, A.; Tastanova, L.; Akhmetova, M.; Apendina, A.; Lopukhova, M. Investigating the Structure and Properties of Epoxy Nanocomposites Containing Nanodiamonds Modified with Aminoacetic Acid. Polymers 2024, 16, 449. [Google Scholar] [CrossRef]
  27. Ott, S.; Lakmann, M.; Backes, C. Impact of Pretreatment of the Bulk Starting Material on the Efficiency of Liquid Phase Exfoliation of WS2. Nanomaterials 2021, 11, 1072. [Google Scholar] [CrossRef] [PubMed]
  28. Rajeswaran, B.; Konar, R.; Yitzhari, R.; Nessim, G.D.; Tischler, Y.R. Enhancement of the E12g and A1g Raman Modes and Layer Identification of 2H-WS2 Nanosheets with Metal Coatings. J. Raman Spectrosc. 2023, 54, 1030–1037. [Google Scholar] [CrossRef]
  29. Dong, M.; Zhang, H.; Tzounis, L.; Santagiuliana, G.; Bilotti, E.; Papageorgiou, D.G. Multifunctional Epoxy Nanocomposites Reinforced by Two-Dimensional Materials: A Review. Carbon 2021, 185, 57–81. [Google Scholar] [CrossRef]
  30. Tastanova, L.; Bekeshev, A.; Nurlybay, S.; Shcherbakov, A.; Mostovoy, A. Environmentally Sustainable Functionalized WS2 Nanoparticles as Curing Promoters and Interface Modifiers in Epoxy Nanocomposites. Nanomaterials 2025, 15, 1145. [Google Scholar] [CrossRef] [PubMed]
  31. Sahu, M.; Narashimhan, L.; Prakash, O.; Raichur, A.M. Noncovalently Functionalized Tungsten Disulfide Nanosheets for Enhanced Mechanical and Thermal Properties of Epoxy Nanocomposites. ACS Appl. Mater. Interfaces 2017, 9, 14347–14357. [Google Scholar] [CrossRef]
  32. Rice, C.; Young, R.J.; Zan, R.; Bangert, U.; Wolverson, D.; Georgiou, T.; Jalil, R.; Novoselov, K.S. Raman-Scattering Measurements and First-Principles Calculations of Strain-Induced Phonon Shifts in Monolayer MoS_2. Phys. Rev. B 2013, 87, 081307. [Google Scholar] [CrossRef]
  33. Wang, F.; Li, S.; Bissett, M.; Kinloch, I.; Li, Z.; Young, R. Strain Engineering in Monolayer WS2 and WS2 Nanocomposites. 2D Mater. 2020, 7, 045022. [Google Scholar] [CrossRef]
  34. Kim, J.; Jeong, J.; Min, K. Strain Engineering in Ti2CX2/WS2 van Der Waals Heterostructures: First-Principles Calculations on Mechanical Robustness and Bandgap Tunability. J. Mater. Sci. Technol. 2026, 253, 166–178. [Google Scholar] [CrossRef]
  35. Eksik, O.; Gao, J.; Shojaee, S.A.; Thomas, A.; Chow, P.; Bartolucci, S.F.; Lucca, D.A.; Koratkar, N. Epoxy Nanocomposites with Two-Dimensional Transition Metal Dichalcogenide Additives. ACS Nano 2014, 8, 5282–5289. [Google Scholar] [CrossRef]
  36. Souliou, S.M.; Tornatzky, H.; Gillen, R.; Kuffer, S.; Michail, A.; Parthenios, J.; Bosak, A.; Paolasini, L.; Maultzsch, J.; Papagelis, K. Phonon Dispersion in WS2. 2D Mater. 2025, 12, 045012. [Google Scholar] [CrossRef]
  37. Molina-Sánchez, A.; Wirtz, L. Phonons in Single-Layer and Few-Layer MoS_2 and WS_2. Phys. Rev. B 2011, 84, 155413. [Google Scholar] [CrossRef]
  38. Hardis, R.; Jessop, J.L.P.; Peters, F.E.; Kessler, M.R. Cure Kinetics Characterization and Monitoring of an Epoxy Resin Using DSC, Raman Spectroscopy, and DEA. Compos. Part A Appl. Sci. Manuf. 2013, 49, 100–108. [Google Scholar] [CrossRef]
  39. Zobeiri, H.; Xu, S.; Yue, Y.; Zhang, Q.; Xie, Y.; Wang, X. Effect of Temperature on Raman Intensity of Nm-Thick WS2: Combined Effects of Resonance Raman, Optical Properties, and Interface Optical Interference. Nanoscale 2020, 12, 6064–6078. [Google Scholar] [CrossRef]
  40. Lee, C.; Jeong, B.G.; Yun, S.J.; Lee, Y.H.; Lee, S.M.; Jeong, M.S. Unveiling Defect-Related Raman Mode of Monolayer WS2 via Tip-Enhanced Resonance Raman Scattering. ACS Nano 2018, 12, 9982–9990. [Google Scholar] [CrossRef] [PubMed]
  41. Kadlečíková, M.; Hotový, I.; Kumar, N.; Kostič, I.; Sojková, M.; Řeháček, V.; Gregušová, D. Raman Spectral Analysis of Sputtered and Sulfurized Nanostructured WS2 Films. Crystals 2025, 15, 955. [Google Scholar] [CrossRef]
  42. Tonndorf, P.; Schmidt, R.; Böttger, P.; Zhang, X.; Börner, J.; Liebig, A.; Albrecht, M.; Kloc, C.; Gordan, O.; Zahn, D.R.T.; et al. Photoluminescence Emission and Raman Response of Monolayer MoS2, MoSe2, and WSe2. Opt. Express 2013, 21, 4908–4916. [Google Scholar] [CrossRef]
  43. Mitioglu, A.A.; Plochocka, P.; Deligeorgis, G.; Anghel, S.; Kulyuk, L.; Maude, D.K. Second-Order Resonant Raman Scattering in Single-Layer Tungsten Disulfide WS_2. Phys. Rev. B 2014, 89, 245442. [Google Scholar] [CrossRef]
  44. Zhao, Y.; Luo, X.; Li, H.; Zhang, J.; Araujo, P.T.; Gan, C.K.; Wu, J.; Zhang, H.; Quek, S.Y.; Dresselhaus, M.S.; et al. Interlayer Breathing and Shear Modes in Few-Trilayer MoS2 and WSe2. Nano Lett. 2013, 13, 1007–1015. [Google Scholar] [CrossRef] [PubMed]
  45. Gaur, A.P.S.; Sahoo, S.; Scott, J.F.; Katiyar, R.S. Electron–Phonon Interaction and Double-Resonance Raman Studies in Monolayer WS2. J. Phys. Chem. C 2015, 119, 5146–5151. [Google Scholar] [CrossRef]
Figure 1. Raman spectra: 1—EP/WS2; 2—EP/WS2–AA2.5; 3—EP/WS2–AA5; 4—EP/WS2–AA7.5.
Jcs 10 00161 g001
Figure 2. Optical microscopy images illustrating the dispersion of WS2 fillers in epoxy matrix for (a) EP/WS2 (pristine); (b) EP/WS2–AA2.5; (c) EP/WS2–AA5; (d) EP/WS2–AA7.5.
Jcs 10 00161 g002
Figure 3. Comparative Raman spectra of epoxy composites containing pristine WS2 (black) and WS2 modified with 2.5 wt.% (red), 5.0 wt.% (blue), and 7.5 wt.% (green) aminoacetic acid.
Jcs 10 00161 g003
Figure 4. Characteristic Raman modes of WS2 in epoxy composites: (a) EP/WS2, (b) EP/WS2–AA 2.5, (c) EP/WS2–AA 5.0, and (d) EP/WS2–AA 7.5.
Jcs 10 00161 g004
Figure 5. Variation in flexural strength (1) and flexural modulus (2) of the epoxy composite with 0.5 phr WS2 as a function of the aminoacetic acid concentration applied for WS2 surface modification.
Jcs 10 00161 g005
Figure 6. Variation in tensile strength (1) and tensile modulus (2) of the epoxy composite with 0.5 phr WS2 as a function of the aminoacetic acid concentration employed for WS2 surface modification.
Jcs 10 00161 g006
Table 1. Raman peak positions of EP/WS2 composites and their amino acid modifications.
ModeEP/WS2EP/WS2–AA2.5EP/WS2–AA5.0EP/WS2–AA7.5
2 L A M + E 2 g 1 354.8354.8354.8354.8
Defect-induced mode390.4390.4390.4388.6
A 1 g 418.7418.7-416.9
Disorder-activated mode---432.8
Δ ν for defect-induced ν r e f e r e n c e --−1.8
Δ ν   f o r   A 1 g ν r e f e r e n c e --−1.8
Table 2. Vicat heat resistance of epoxy composites containing 0.5 phr WS2 modified with different concentrations of aminoacetic acid.
Composition of the Composite, Phr, Cured with 15 Phr PEPAHeat Resistance, °C
100ED-20 + 40 TCEP + 0.5WS2152
100ED-20 + 40 TCEP + 0.5WS2 (2.5 wt.% AA)158
100ED-20 + 40 TCEP + 0.5WS2 (5.0 wt.% AA)160
100ED-20 + 40 TCEP + 0.5WS2 (7.5 wt.% AA)165
Table 3. Intensity values of the A1g and 2LA(M) + E2g1 Raman modes and the corresponding intensity ratio (R).
Sample I A 1 g I 2 L A M + E 2 g 1 R
EP/WS2479941871.15
EP/WS2-AA2.5504444631.13
EP/WS2-AA5.05482--
EP/WS2-AA7.5545559270.92
Table 4. FWHM and area of Raman peaks.
SamplePeak (cm−1)FWHMArea
EP/WS2354.84.94739.9
390.48.2571.9
418.74.8704.9
EP/WS2–AA2.5354.85.14885.5
416.86.11594.2
390.54.9462.8
EP/WS2–AA5.0354.85.75115.8
392.15.8 996.3
EP/WS2–AA7.5354.85.32809.6
416.83.53067
432.82.81272.9
388.64.91252.2
Disclaimer/Publisher’s Note: The statements, opinions and data contained in all publications are solely those of the individual author(s) and contributor(s) and not of MDPI and/or the editor(s). MDPI and/or the editor(s) disclaim responsibility for any injury to people or property resulting from any ideas, methods, instructions or products referred to in the content.