Article

Investigation of Quasi-Static and Dynamic Material Properties of a Structural Sheet Molding Compound Combined with Acoustic Emission Damage Analysis

Institute for Applied Materials, Karlsruhe Institute of Technology, 76131 Karlsruhe, Germany
*
Author to whom correspondence should be addressed.
J. Compos. Sci. 2017, 1(2), 18; https://doi.org/10.3390/jcs1020018
Submission received: 28 October 2017 / Revised: 3 December 2017 / Accepted: 11 December 2017 / Published: 14 December 2017
(This article belongs to the Special Issue Discontinuous Fiber Composites)

Abstract

:
Sheet molding compounds (SMC) are discontinuously fiber-reinforced thermosets, attractive to the automotive industry due to their outstanding specific strength and stiffness, combined with a cost efficient manufacturing process. Increasingly important for structural components, a structural SMC-based improved resin formulation featuring no fillers is investigated in this study. The influence of fiber volume content, fiber length, and manufacturing induced fiber orientation on quasi-static and dynamic mechanical properties of vinylester-based SMC is characterized. Stiffness and strength increased with increasing fiber volume content for tensile, compression, and flexural loadings. Fiber length distribution did not significantly influence the mechanical properties of the material. The movement of the conveyor belt leads to an anisotropic fiber orientation and orientation-dependent mechanical properties. Acoustic emission coupled with machine learning algorithms enabled the investigation of the damage mechanisms of this discontinuous glass fiber SMC. The acoustic emission analysis was validated with micro computed tomography of damaged specimens. The dominant failure mechanisms of the SMC exposed to bending loading were matrix cracking and interface failure.

1. Introduction

Discontinuous fiber-reinforced polymeric composites are attractive materials, especially in the automotive industry, due to their high specific stiffness and strengths combined with low materials and manufacturing costs.
Among these materials, sheet molding compounds (SMC) stand out due to the many favorable aspects of their production, providing the ability to manufacture structures at very high productivity rates combined with good part reproducibility, cost efficiency, and surface quality, as well as the ability to manufacture complex part geometries. SMCs are thermosetting resin-based fiber-reinforced semi-finished materials. To a large extent, SMC is also a generic term describing this type of compound combined with the process to convert it into a composite part, which is usually based on compression molding [1]. In 2016, SMCs, in combination with bulk molding compounds (BMC), were the most produced glass fiber-reinforced composites [2], highlighting the importance of this material class for numerous technical applications. SMC have played an important role in different technical sectors since the 1960s. However, compared to SMC materials developed in the past, a novel class of SMC materials, called structural SMC, is rapidly advancing and different car manufacturers have already successfully included structural SMC components into their vehicle concepts [3,4,5]. The resin formulations for structural SMC aim to manufacture a material that can fulfill more stringent demands on its mechanical properties. Much research has been done to determine the influence of resin formulations and fiber content on the mechanical properties of standard SMC. This contribution aims to identify the influence of fiber volume content and fiber length on mechanical material properties of a structural unfilled SMC. The following literature review focuses on some advanced and structural SMC materials, so all of them feature a significant amount of fillers.
Boylan et al. [6] investigated the mechanical material properties of soft and hard glass fiber-reinforced SMC, featuring a fiber volume content of 21%. The material was based on an unsaturated polyester resin, whereas the resin formulation contained a significant amount of calcium carbonate (CaCO3) as filler. Their results indicated that tensile strength and stiffness strongly depend on the fiber type. Longer fibers tended to increase mechanical performance. This study also demonstrated the anisotropic mechanical material properties for SMC sheets due to material flow during compression molding. The study did not consider different fiber volume contents but only the mixture of soft and hard glass fiber featuring different fiber lengths.
Considering material anisotropy described by Boylan et al. [6], similar results were found by Lamanna et al. [7]. This research group investigated the mechanical properties of polyester resin-based glass fiber-reinforced SMC with calcium carbonate with a nominal wt/wt/wt ratio of 39:27:34. The investigated material was considered for structural components in the automotive industry. The focus in the study was a broad material characterization for one specific material. No variation of fiber volume content or fiber length was considered. The observed specific SMC exhibited substantial in-plane anisotropy in terms of tensile stiffness and strength.
Oldenbo et al. [8] investigated the mechanical properties of SMC material developed for automotive exterior body panels containing hollow glass micro-spheres and thermoplastic toughening additives, compared to a conventional standard SMC containing CaCO3 as filler. The hollow glass spheres reduced the density of the investigated material, but Young’s modulus and compressive strength also decreased, which was explained by the replacement of stiffer CaCO3 fillers by hollow glass spheres.
These three examples show the investigations and developments in the field of SMC. Nevertheless, the SMC recipes investigated contain fillers to compensate for the resin shrinkage during molding for a superior surface quality, and none of these studies focused on unfilled SMC. To further improve the mechanical properties of structural SMC, resin formulations without fillers must be developed, as reducing the filler content allows for increasing the glass fiber content. Increased glass fiber content is a crucial factor for the improved mechanical performance, allowing for the structural use of SMC. In this regard, the usual outstanding surface quality in comparison to filled SMC is a secondary aspect. Scientific publications on filler-free structural SMC are rare. To the best of the authors’ knowledge, the mechanical material properties of unfilled SMC have rarely, if at all, been previously considered.
The International Research Training group on the ‘‘Integrated engineering of continuous-discontinuous long fiber reinforced polymer structures’’ (GRK 2078) focused on the development of a structural hybrid continuous-discontinuous SMC, whereas the vinylester-based discontinuous SMC considered within this study offers the possibility of being hybridized in a one shot compression molding process [9]. Since the material flow of the discontinuous SMC can lead to misalignment of the continuous locally placed tapes as well as fiber misalignment [10], the sheets in the study were manufactured with a 100% mound coverage. Due to the material movement on the conveyor belt during manufacturing of the semi-finished sheets, the fibers tend to orient in the manufacturing direction. This study was the first step in investigating the anisotropic material properties resulting from the manufacturing of semi-finished sheets, which did not flow during compression molding. The study also aimed to prove it was possible to manufacture SMC sheets with 100% mold coverage. To further improve this novel hybrid material class that has superior mechanical properties, a profound understanding of the two individual components, the discontinuous glass fiber SMC and the continuous carbon fiber SMC, is necessary.
Thus, our study is the next step to better understand the material behavior of an unfilled structural discontinuous glass fiber SMC, based on vinylester with a focus on the influence of fiber volume content and fiber length on mechanical quasi-static and dynamic material properties. We also wanted to evaluate the anisotropy introduced due to the manufacturing of SMC semi-finished sheets.
The locally reinforced structural SMC is of major importance as flow molding may displace continuous fiber inlays [10]. This can be effectively prevented by high mold coverage and, for this purpose, the semi-finished material considered within this study was compression molded with 100% mound coverage to ensure no additional flow of the material in the mold. Hence, the composition and the potential processing impacts on the material properties are different between conventional, filled SMC, and structural SMC, even at the early stage of the manufacturing of the semi-finished materials. This influence is unique to structural SMC with respect to the hybridization option and has not been investigated to date.
To further improve the simulation tools and optimize applications of structural SMC components, a profound understanding of damage and failure of SMC is of major importance. Hence, this paper analyzed the damage mechanisms of discontinuous glass fiber SMC. In general, the damage to a fiber-reinforced material is a complex phenomenon based on various microscopic failure types [
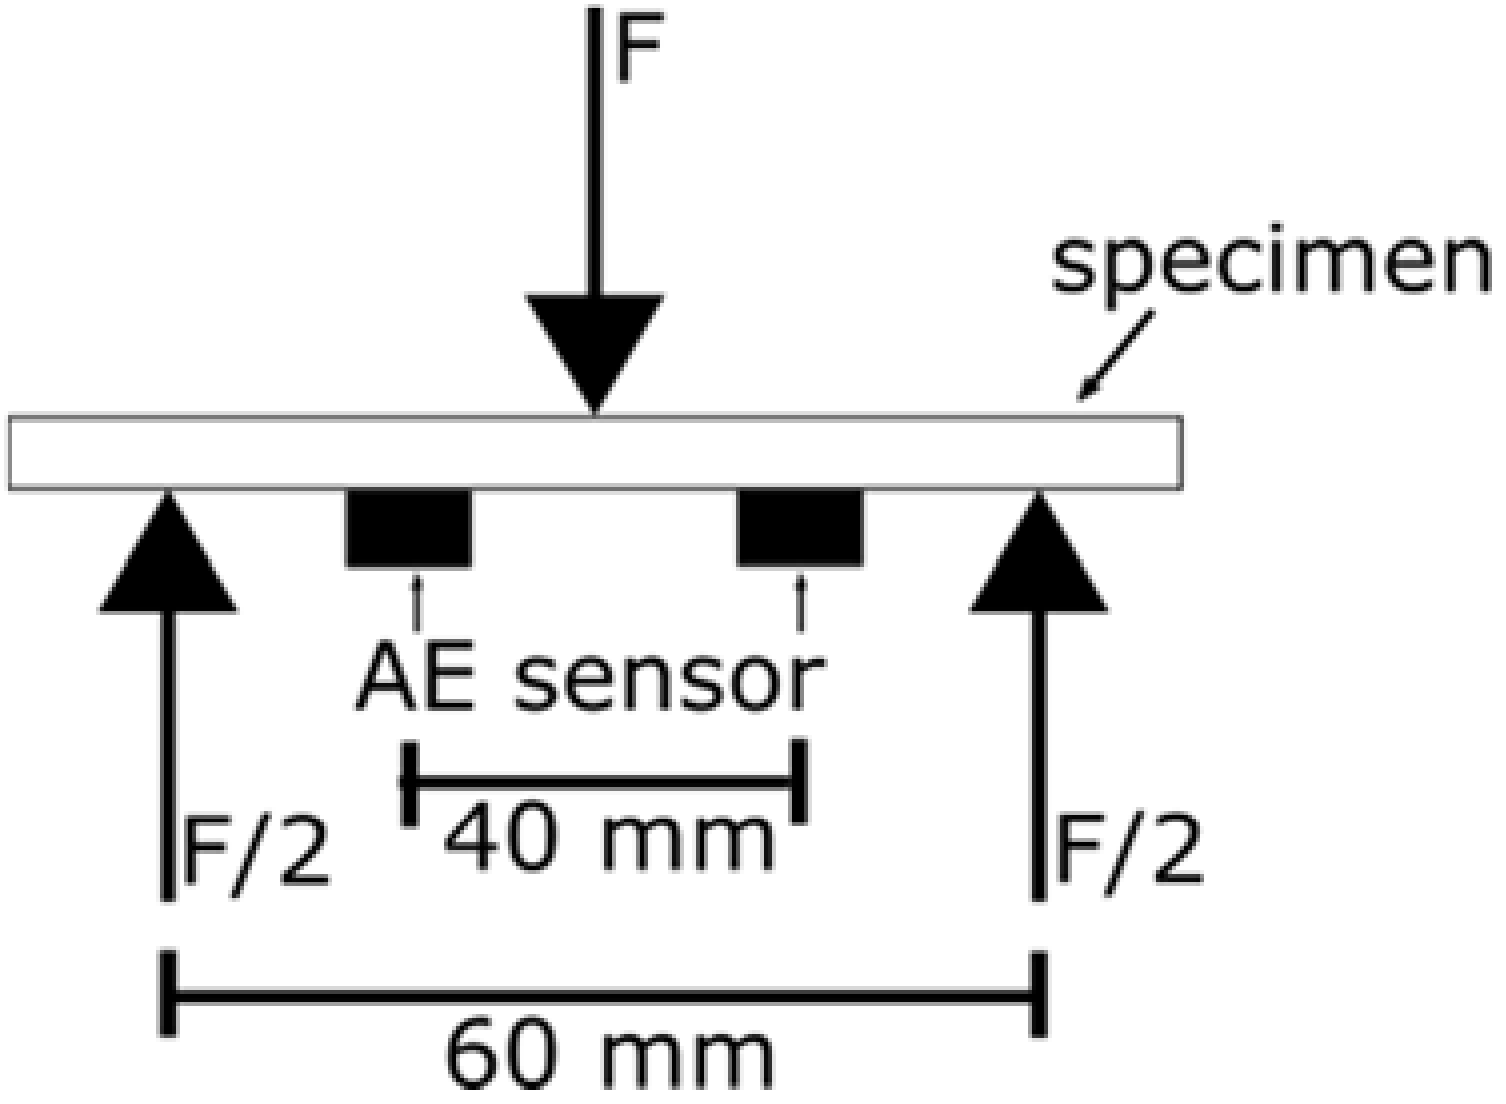
11]. The goal of this study was to gain a profound understanding of damage and failure mechanisms of SMC by combining in situ acoustic emission (AE) with micro computed tomography (µCT) observation of damaged specimens. The acoustic emission technique has already been proven to be a suitable technique to characterize damage of materials. If a material is mechanically loaded, it stores elastic energy. The release of this strain energy in the form of a stress wave, which travels through the material by creating cracks or defects, can be measured with the appropriate sensors [12]. For this purpose, piezoelectric sensors were attached to the surface. These sensors detect the waves and produce a voltage output [13]. Different research groups indicated a correlation between failure type and AE signal for glass fiber-reinforced materials.
For chopped glass fiber-reinforced polypropylene, Barré et al. showed that low amplitude signals can be linked to matrix cracking, whereas higher amplitude signals were linked to fiber failure [14]. The fracture behavior of SMC has also been successfully investigated using AE [15].
In addition to the amplitude of AE signals, other signal properties, such as signal duration, energy distribution, and counts/duration ration, are suitable aspects used to investigate composite failure [16,17]. A problem with AE analysis is the large amount of signals resulting from a structural test, since each failure event creates thousands of hits, to which numerous AE parameters can be associated. In addition, filtering of background noise and signals from non-structural sources is necessary [18]. To address this, recognition methods were proven to be a promising technique to reduce this type of uncertainty pattern. The proposed method was based on the formation of different clusters to separate AE signals. The formation of clusters was based on pattern recognition algorithms [19]. Machine learning and pattern recognition techniques are suitable tools to characterize the failure of fiber-reinforced composites by means of acoustic emission. [20,21,22,23].
To enhance these studies, this paper addressed the application of pattern recognition techniques to investigate the failure of discontinuous glass fiber-reinforced SMC exposed to flexural loadings. The objective was to identify and better understand the failure mechanisms to provide data for failure and damage simulation, which is a crucial factor for the use of structural SMC. Furthermore, this study aimed to prove the suitability of combining machine learning algorithms with the acoustic emission technique to identify the failure mechanisms of discontinuous fiber reinforced materials.
This research focused on structure–property relationships of an unfilled structural SMC, and namely the influence of fiber volume content and fiber length on mechanical material properties, as well as on anisotropic material properties resulting from the movement of the conveyor belt. An additional objective was the investigation of failure and damage mechanisms. To address this purpose, an in situ acoustic emission (AE) analysis was combined with a µCT observation ofpost-damaged specimens. This study also aimed to prove the suitability of machine learning algorithms to process AE data and to identify different failure mechanisms for SMC materials.

2. Materials

2.1. Material Manufacturing

The material considered within this study is a discontinuous glass fiber SMC based on a vinylester resin (Altac XP810X supplied by Alyancis (former DSM), Schaffhausen, Switzerland). To optimize structural properties no fillers were added, and only a low amount of flow additives (BYK 9085 supplied by BYK, Wesel, Germany), peroxide (Trigonox 17 supplied by Akzonobel, Amsterdam, The Netherlands), and an MgO thickener (Luvatol EK 100 KM supplied by Lehmann&Voss&Co., Hamburg, Germany) were mixed into the resin. A flat conveyor belt (type HM-LB-800 by Schmidt & Heinzmann, Bruchsal, Germany) was used to manufacture the semi-finished sheets. The length of the reinforcing glass fiber (Multistar 272 by Johns Manville, Denver, CO, USA) was set to either 25.4 mm (1 inch) or to a mixture of 25.4 mm (1 inch) and 50.8 mm (2 inch) with a 6:5 ratio, and different fiber volume contents (FVCs) ranging from 17 to 31 volume percent (vol %) were used. After maturation at 30 °C for several days, the semi-finished SMC sheets were cut into plies, stacked, and compression molded into plaques at approximately 150 °C, with a maximum force of 1600 kN, and a 92-second mound closing time.
Due to material movement on the conveyor belt during manufacturing of the semi-finished sheets, the fibers tend to orient in the manufacturing direction. To evaluate this anisotropy introduced due to manufacturing, the sheets were compression molded with 100% mound coverage to ensure no flow of the material in the mound. The dimensions of the compression molded plaques were 250 mm × 800 mm. Depending on fiber volume content, the sheets had thicknesses between 2 mm and 2.7 mm.

2.2. Specimen Preparation

Specimens for quasi-static and dynamic characterization were extracted using a water jet cutting technique by GENTHNER SchneidTechnik GmbH & Co. KG in Straubenhardt, Germany. The water-jet beam had a width of 0.8 mm with and cutting pressure of 360 N/mm2. GMA Garnet™ 80 mesh was used as the abrasive. Before mechanical testing, the specimens were stored at room temperature (22 °C) and at a relative humidity of approximately 50% for several days. Mechanical testing was performed under the same conditions

3. Methods

3.1. Determination of Fiber Volume Content

To determine the real fiber volume content of the sheets, a thermogravimetric analysis (TGA) was completed with a Leco TGA701 (LECO Corporation, St. Joseph, MI, USA). Heating rate was 37 °C/min up to 550 °C. This temperature stayed constant for 2 h. Nine rectangular specimens per sheet, having a section of approximately 100 mm2 each, were used to determine the real fiber volume content of at least three different sheets for each configuration.

3.2. Mechanical Characterization

3.2.1. Tensile Testing

The quasi-static tensile properties were measured with a ZwickRoell ZMART.PRO universal testing machine (Zwick Roell Group, Ulm, Germany) with a maximum capacity of 200 kN. Longitudinal displacement was measured with a tactile extensometer. Force and displacement data were acquired at 10 Hz. The tests were performed following the DIN EN ISO 527-4 standard [24], but a slightly different specimen type was considered within this study. The specimens had dog-bone geometry with a gauge length of 60 mm × 20 mm. The clamping distance was 150 mm. Testing velocity was 2 mm/min leading to a test duration of approximately one minute per specimen. The tensile modulus was calculated in the strain range of εt = 0.05–0.25%. Additionally, the tensile strength, the maximum tensile stress sustained by the specimen during the test, was evaluated. For the six material configurations, the five samples that failed in the measurement region for each orientation (0°, 45°, 90°, and 135° with respect to the longitudinal axes of the plaques) were analyzed.

3.2.2. Flexural Testing

Three-point bending tests were performed according to DIN EN ISO 14125 [25] on a ZwickRoell Z2.5 testing machine with a 2.5-kN load cell. Deflection of the specimen was measured with a tactile displacement transducer. Force and deflection data were acquired at 10 Hz. The rectangular specimen had a width of 15 mm and a thickness to span ratio of 1:16.
According to [25], the testing velocity v was determined from a target strain rate of ε ˙ = 0.001/min. To consider the different thicknesses of the specimens, the testing velocity was set individually for each of the six configurations. Bending stress σf and surface strain εf were calculated according [25].
Based on these values, the flexural modulus was calculated in the strain range of εf = 0.05–0.25%. Additionally, the bending strength, the maximum bending stress sustained by the specimen during the test, was determined. At least four specimens of each configuration in 0°, 45°, 90°, and 135°, with respect to the longer side of the plaque, were used for testing.

3.2.3. Compression Testing

Compression tests were conducted on a ZMART.PRO 100 kN universal testing machine according to DIN EN ISO 14126 [26]. The machine was equipped with a Hydraulic Composite Compression Fixture (HCCF) by Zwick clamping unit. The rectangular specimens had a length of 110 mm and a width of 10 mm. The measurement length was 12 mm. Deformation was detected by two clip-on sensors, one at each side of the specimen to additionally measure bending of the specimens. Testing velocity was 1 mm/min and the compression modulus was calculated over the strain range of εc = 0.05–0.25%. The compression strength was determined as the maximum compression stress sustained by the specimen during the test.
For each material configuration, five samples in the 0°, 45°, 90°, and 135° direction, that failed in the measurement region and did bend during loading, were analyzed. Bending was controlled by evaluating the bending factor according to [26].

3.2.4. Charpy Impact Testing

To assess impact strength, Charpy impact tests were conducted on rectangular specimens with a length of 50 mm and a width of 15 mm according to DIN EN ISO 179 [27]. The specimen, which was supported near its ends as a horizontal beam, was impacted by a swinging striker (impact energy of 5 J) and the Charpy impact strength ac was calculated according to EN ISO 179. At least 14 specimens per configuration were tested. The non-instrumented impact tests allowed only determining the Charpy impact strength as the force-deflection response was not recorded.

3.3. Acoustic Emission (AE) Analysis

3.3.1. Data Acquisition

To assign the mechanisms of damage of the material, in situ acoustic emission was used. When in service, SMC components are most frequently loaded by bending loads. Due to this, the mechanisms of failure of discontinuous glass fiber SMC exposed to three point bending were examined. The tests were completed on an INSTRON E3000 universal testing machine (Instron, Norwood, MA, USA) with a load cell capacity of 3 kN. The testing velocity was 2.6 mm/min. The span of the two lower supports was 60 mm. The crosshead displacement was measured to determine the displacement of the specimen. Two broadband B-1025 piezoelectric transducers (DigitalWave Corporation, Centennial, CO, USA), attached to the lower surface of the specimen, captured the AE signals. The two transducers were linked to a preamplifier type AEP3 (Vallen System GmbH, Icking, Germany). The distance between the two sensors was 40 mm (Figure 1).
A coupling agent, treacle, ensured contact between transducers and specimen. The AE signals were captured with a sampling rate of 10 MHz and an AMSY-4 system (Vallen System GmbH). To reduce the captured signals arising from testing machine or background, the AE acquisition threshold was set to 23 dB. The duration discrimination time was 200 µs and the rearm time was set to 0.4 ms. The signal duration of one hit was the time from first exceeding the threshold until it is not crossed for the duration discrimination time.

3.3.2. Data Processing

Data processing included amplifying the sensors’ output by 49 dB and a filtering of the signal with a 10 kHz high pass filter. Force and displacement signals, continuously recorded by the load frame with a sampling rate of 100 Hz, were fed to the AMSY-4 system, enabling a correlation of the captured AE signal with the load-displacement curve resulting from bending of the specimen.

3.3.3. Data Clustering

Data clustering of acquired signals was largely based on the method introduced by Sause et al. [20]. First, different features of the signal that were the most promising to find natural clusters within the dataset were chosen (Table 1).

3.3.4. Signal Processing

Signal processing was completed in MATLAB (Version R2016b, The MathWorks, Inc., Natick, MA, USA). The acoustic emission data was imported with an import tool implemented by Vallen. Signal processing started with a Fourier transformation of the recorded signals by the MATLABbuilt-in fast Fourier transformation with 2048 data points. With a cropped signal using the hat function, edge-effects results were due to the sudden drop or rise of the time signal at the borders. To reduce this effect, the time window was multiplied with a hamming function of the same length. Finally, all features in the frequency domain described in Table 1 could be derived.
To find a suitable feature space for the following clustering, all possible combinations of the 10 preselected features listed in Table 1 were compared. The minimum number of features Q min = 2 and a maximum of Q max = 6 for a cluster were set as restrictions for the algorithm. This led to 837 different combinations. All combinations with the number of clusters ranging from P min = 2 to P max = 6 , were considered, and in total there were 4185 clustering processes to solve. The clustering was based on a Gaussian mixture model with P components.
The validation of each configuration was based on an algorithm developed by Günter et al. [28], which is a combination of different validation algorithms. In this study, different validation methods were considered, and the methods introduced by Davies et al. [29], Rousseeuw et al. [30], and Calinski et al. [31] were applied. The different methods were combined as proposed by Sause et al. [20], and the procedure was performed twice: once to find the optimum number of clusters for each feature combination for the number of clusters for all combinations of features defined, then a second time, for all combinations of features, considering the optimum number of clusters that was determined in the previous step. A similar voting scheme, as proposed by Sause et al. [20], was considered, with 25 points being the best configuration, 24 for the second, and 23 for the third. A feature combination, recognized as the best solution by all three cluster validation methods, attained up to 75 points in the best case scenario. The objective of this method was to find an optimum configuration of features with a number of clusters for the present dataset.

3.4. Micro Computed Tomography

To assign natural clusters from AE to a certain failure mechanism, µCT scans were used to obtain insight into the damaged samples. Therefore, samples were scanned in an Yxlon-CT precision computed tomography system (Yxlon International Ct GmbH, Hattingen, Germany) containing an open micro-focus X-ray transmission tube with tungsten target and a 2048 × 2048 pixel flat panel detector from Perkin Elmer (Waltham, MA, USA). The acceleration voltage was 100 kV and the tube current 0.05 mA. The scans were acquired with a focus–object distance of 64.13 mm and a focus–detector distance of 999.79 mm, leading to a voxel size of 12.83 µm.

4. Results

4.1. Fiber Volume Content and Fiber Length

Table 2 lists the measured fiber volume content (FVC) and fiber length of the six different considered configurations.

4.2. Mechanical Material Properties

The following section addresses the mechanical properties of the considered SMC materials. The figures within this section show the mechanical properties for specimens extracted in different directions with respect to the movement of the conveyor belt.

4.2.1. Tensile, Compression, and Flexural Stiffness

Figure 2, Figure 3 and Figure 4 show the elastic moduli resulting from tension, compression, and flexural loading of the specimens, which were extracted in different directions with respect to the manufacturing direction, where 0° is the direction of the movement of the conveyor belt. In general, the investigated SMC materials showed a slight anisotropic material behavior for tensile compression and flexural loading due to the orientation of the fibers on the conveyer belt.
The elastic tensile modulus increased with increasing fiber volume content from 7.3 GPa to 12.5 GPa, from lowest to highest fiber volume content in the manufacturing direction (Figure 2). The modulus perpendicular to the manufacturing direction increased from 7.3 GPa to 11 GPa for materials with fibers only 25.4 mm long. For materials with two different fiber lengths, the tensile modulus ranged between 8.2 GPa and 13.6 GPa in the manufacturing direction, and from 7 GPa to 12.1 GPa perpendicular to it. Thus, only a slight increase in tensile stiffness occurred for materials consisting of longer fibers. The higher the FVC of the material, the higher the observed anisotropy.
Compression stiffness (Figure 3) showed a slightly anisotropic trend, though anisotropy was less severe than the tensile loads. The compression modulus increased from 6.8 GPa to 10 GPa for specimens with 25.4 mm long fibers extracted in the manufacturing direction, and from 6.4 GPa to 8.2 GPa perpendicular to the manufacturing direction. An increase in fiber length did not significantly increase the compression. The considered SMC materials showed lower stiffness due to compression loads compared to tensile loads.
If the material was exposed to flexural loads (Figure 4), only those materials with the highest FVC showed a significant increase in flexural stiffness. The flexural modulus ranged between 7.7 GPa and 12.2 GPa in the manufacturing direction, for materials with 25.4 mm long fibers. Perpendicular to the manufacturing direction, the values ranged from 7.1 GPa to 10.6 GPa. Longer fibers were found not to significantly influence the flexural stiffness of the material. For SMC with 25.4 mm and 50.8 mm long fibers, the flexural modulus ranged from 7.5 GPa to 13.4 GPa in the manufacturing direction, and from 7.1 GPa to 11.3 GPa perpendicular to the movement of the conveyer belt.

4.2.2. Tensile, Compression, and Flexural Strength

Figure 5, Figure 6 and Figure 7 depict the tensile, compression, and flexural strengths of the considered SMC material configurations. Tensile strength (Figure 5) increased significantly with increasing FVC, from 64 MPa to 150 MPa for the specimens extracted in the manufacturing direction of SMC with fibers only 25.4 mm long. Due to the movement of the conveyor belt during manufacturing, the strength exhibited an anisotropic trend for materials with higher FVC. The tensile strength perpendicular to the manufacturing direction ranged from 67 MPa to 116 MPa, and was slightly lower than in the direction of manufacturing. A variation in fiber length only influenced the tensile strength for materials with higher FVCs, ranging from 71 MPa to 165 MPa in the manufacturing direction, and from 62 MPa to 133 MPa perpendicular to the conveyor movement direction for SMC containing 25.4 mm and 50.8 mm long fibers.
The considered SMC materials generally showed higher values for compression than tensile strength (Figure 6), ranging from 149 MPa to 196 MPa in the manufacturing direction, and from 132 MPa to 202 MPa for specimens perpendicular to conveyor belt motion with 25.4 mm long fibers. If the material also consisted of 50.8 mm long fibers, the compression strength varied from 157 MPa to 194 MPa in the manufacturing direction, and from 139 MPa to 207 MPa perpendicular to it. An increase in fiber length only slightly changed the compression strength, as the measured values were highly scattered.
The flexural strength (Figure 7) of the material was directionally dependent on FVC. The flexural strength ranged from 157 MPa to 277 MPa for materials with 25.4 mm long fibers in the manufacturing direction, and from 156 MPa to 245 MPa perpendicular to it. Materials with longer fibers showed a slight increase in flexural strength, ranging from 164 MPa to 303 MPa in the manufacturing direction, and from 141 MPa to 261 MPa perpendicular to it.

4.2.3. Charpy Impact Properties

Specific to Charpy impact properties, an increase in FVC resulted in increased energy absorption capabilities (Figure 8). For the SMC material with 25.4 mm fibers, the energy absorption capability increased from 51 kJ/m2 to 91 kJ/m2 from the lowest to highest FVC, for specimens extracted in manufacturing direction (Figure 8). Perpendicular to the manufacturing direction, absorbed energy increased from 46 kJ/m2 to 79 kJ/m2. The higher the FVC, the more significant the resulting anisotropy. No significant influence of fiber length was found on Charpy impact properties. Energy absorption capability increased from 58 kJ/m2 to 95 kJ/m2 in the manufacturing direction, and from 42 kJ/m2 to 83 kJ/m2 in the perpendicular direction for SMC consisting of 25.4 mm and 50.8 mm fibers.

4.3. Acoustic Emission Analysis and Damage Evolution

The algorithm applied in this study leads to two natural clusters for the discontinuous glass fiber reinforced SMC (Figure 9). The best clustering results were obtained by considering the weighted peak frequency and partial power three, with the highest rating possible, and 75 points.
Considering the accumulated energy of each cluster for the discontinuous glass fiber SMC specimen, cluster one rapidly increased in energy, with a small drop in force at a displacement of approximately 3.7 mm. From this point, the slope of the force-deflection curve decreased slightly, and did not show any further linear increase. This indicates the first appearance of damage inside the material. Cluster two also showed a growth at this point, but not as significant as cluster one (Figure 10). The discontinuous sample showed an almost steady rise of cluster one and two, without sharp jumps in both of the curves. Nevertheless, cluster one increased its energy much faster than cluster two. Computed tomography of the damaged discontinuous glass fiber SMC specimen showed two important failure mechanisms: matrix cracking and interface failure (Figure 11). Since signal processing of the AE data leads to two different clusters, each failure mechanism can be linked with one of these clusters. Since matrix cracking most likely starts and ends at a fiber-matrix interface, these two failure mechanisms cannot be considered separately, but significantly influence each other.

5. Discussion

For this study, vinylester-based unfilled structural SMC sheets were successfully manufactured with 100% mold coverage. Due to the mixing of the individual resin components in a vacuum atmosphere, entrapped air was minimized, leading to mechanical material properties comparable to and even better than standard SMC material investigated by different research groups [6,7,
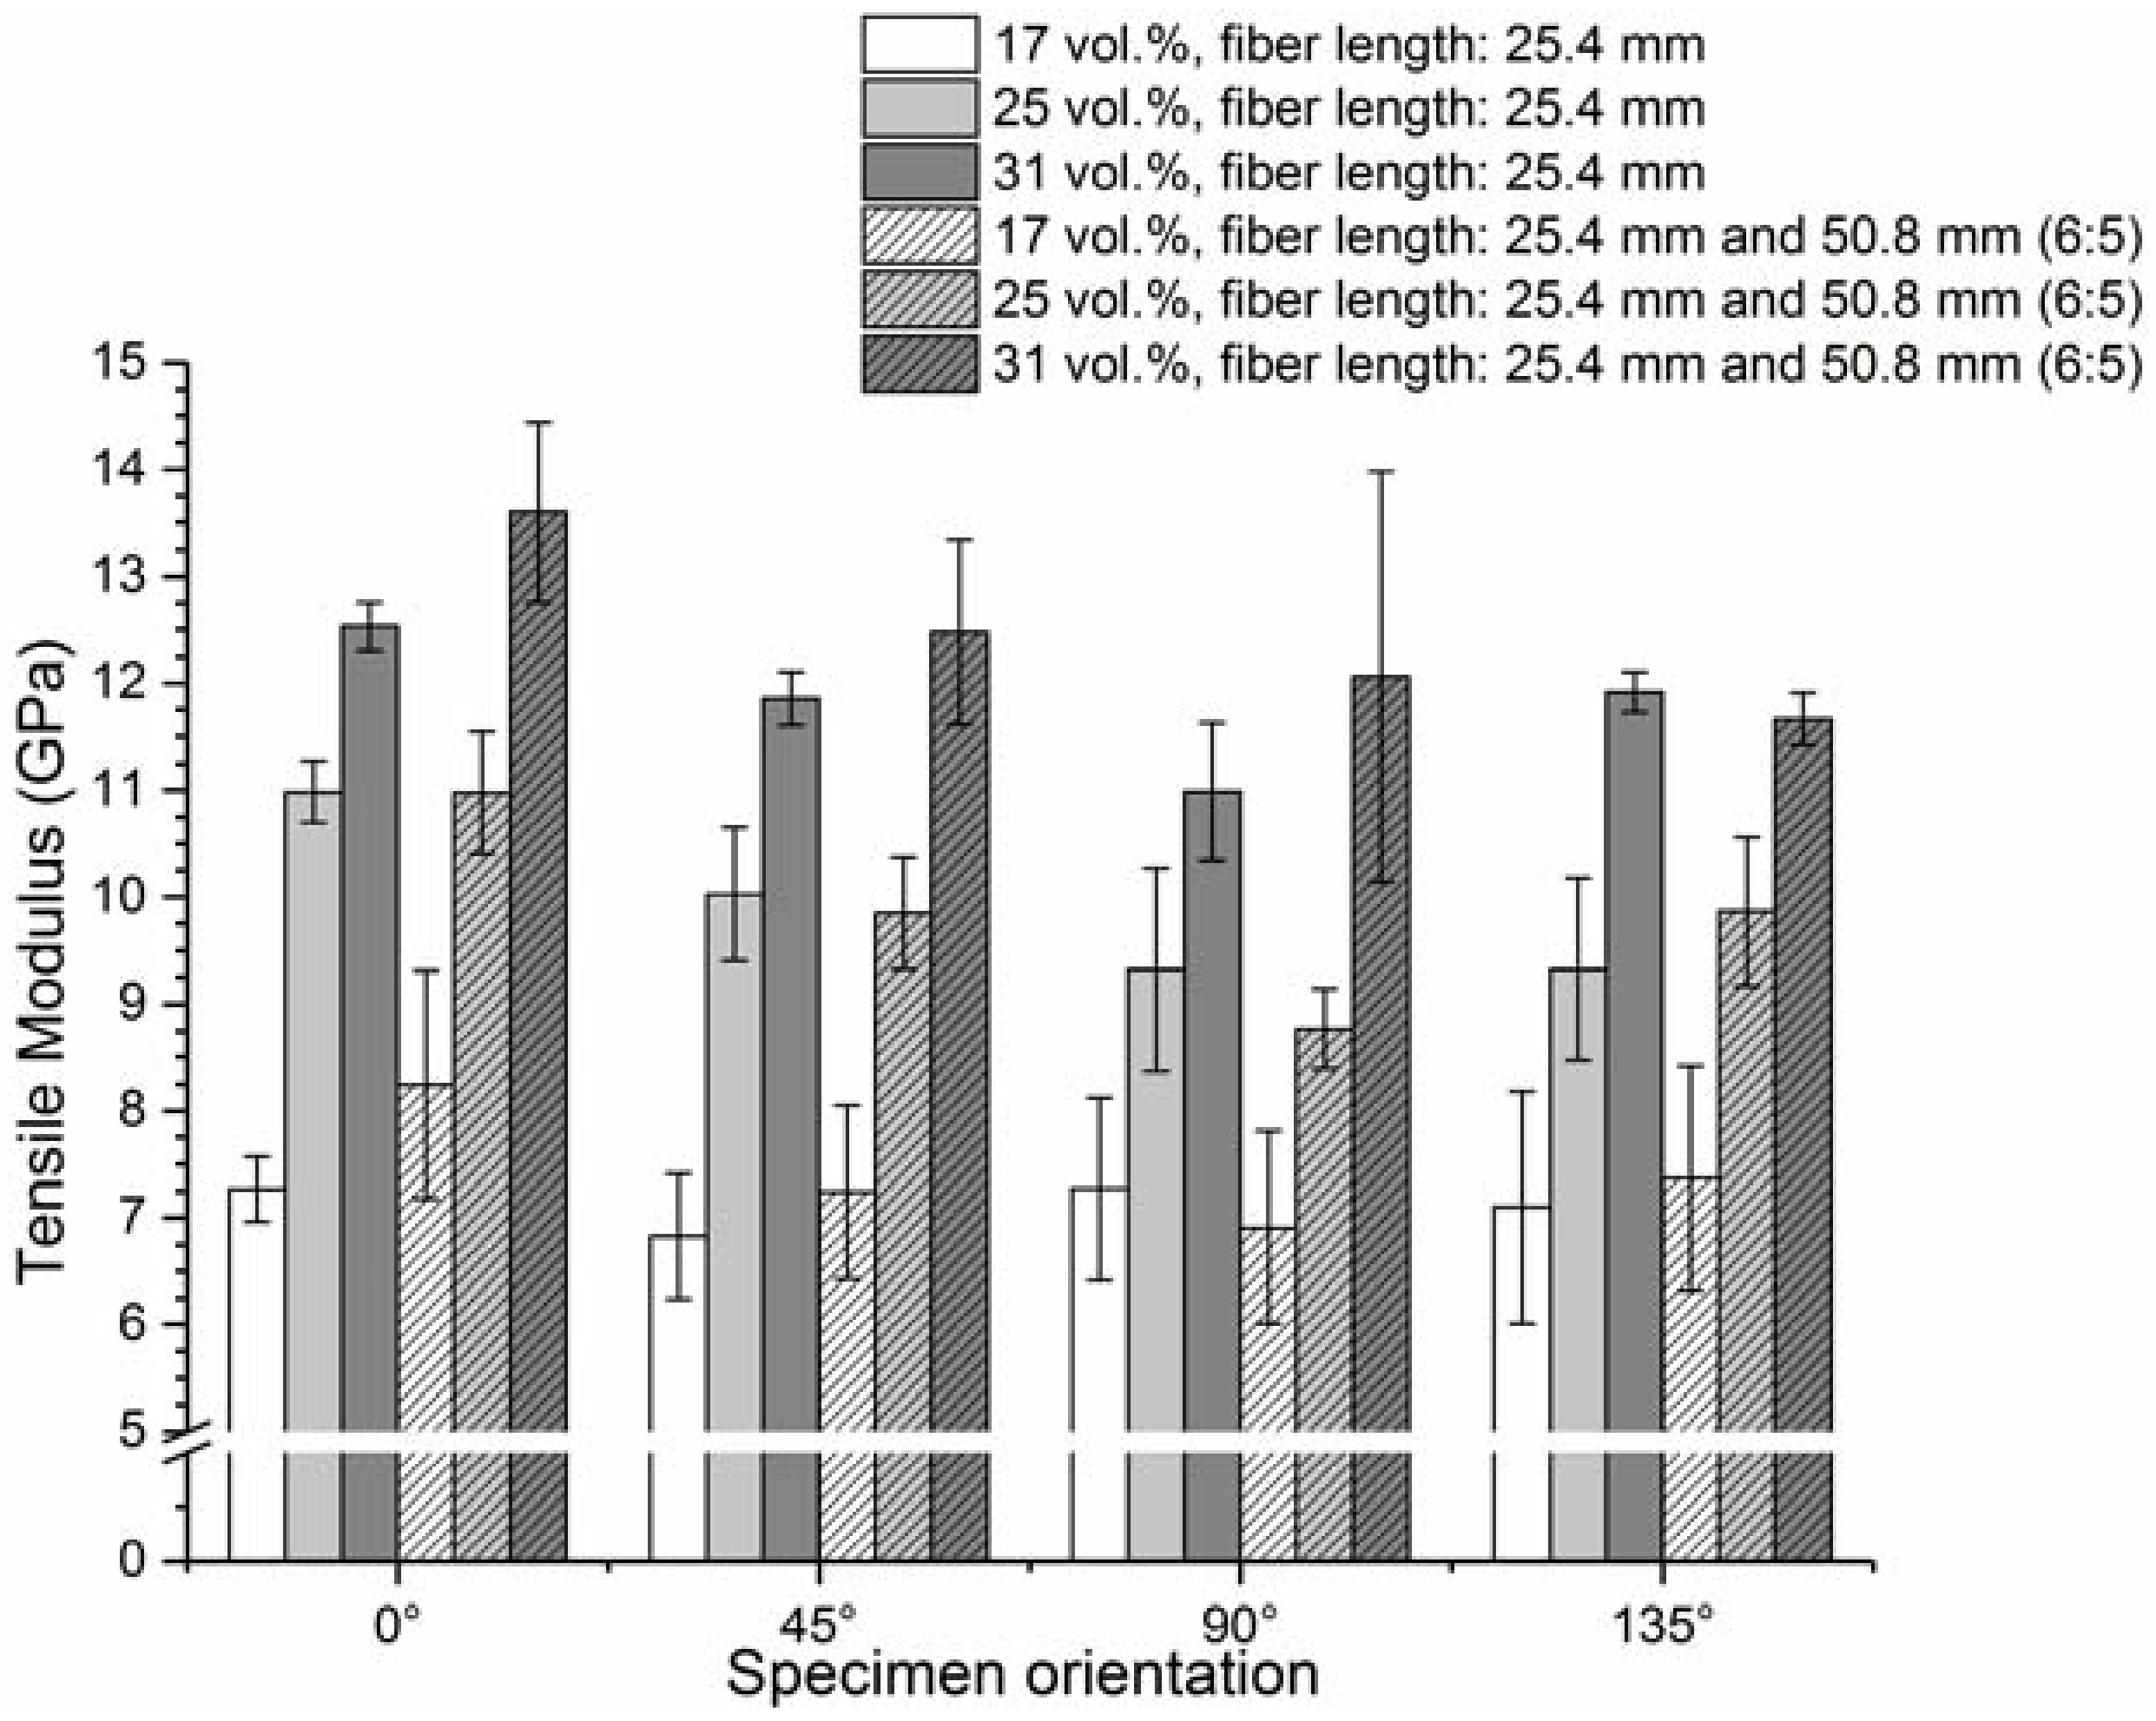
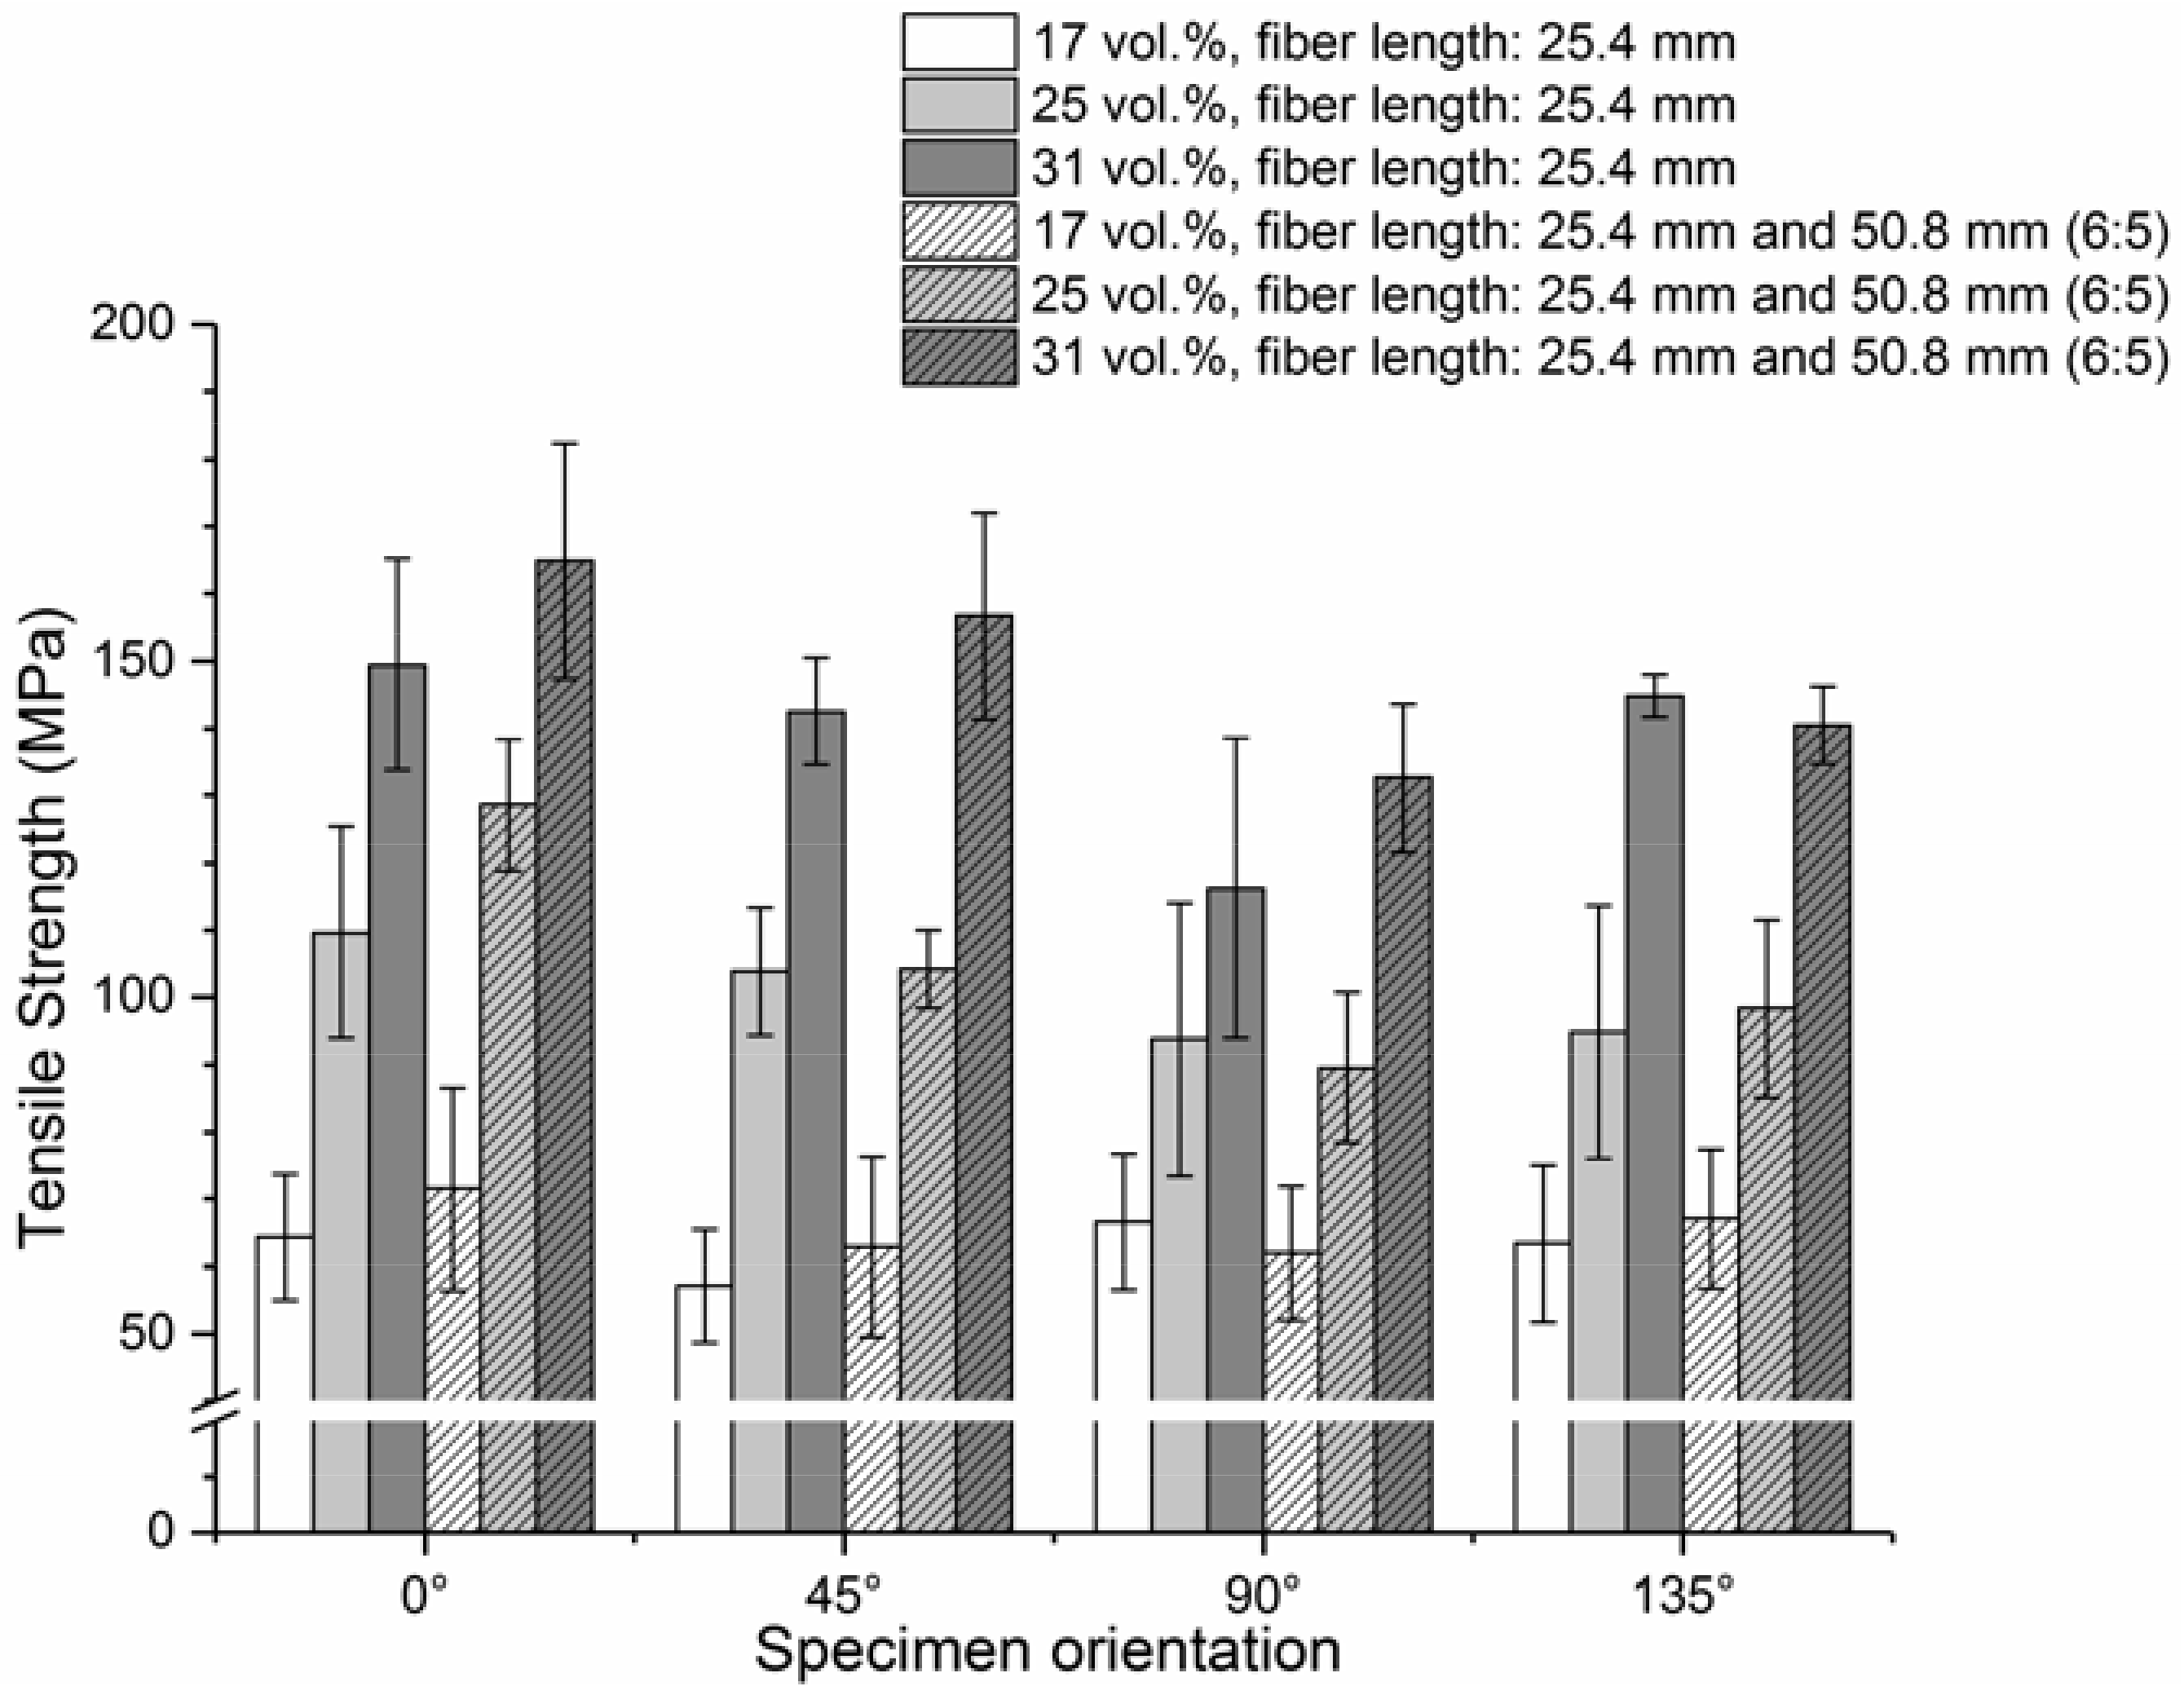
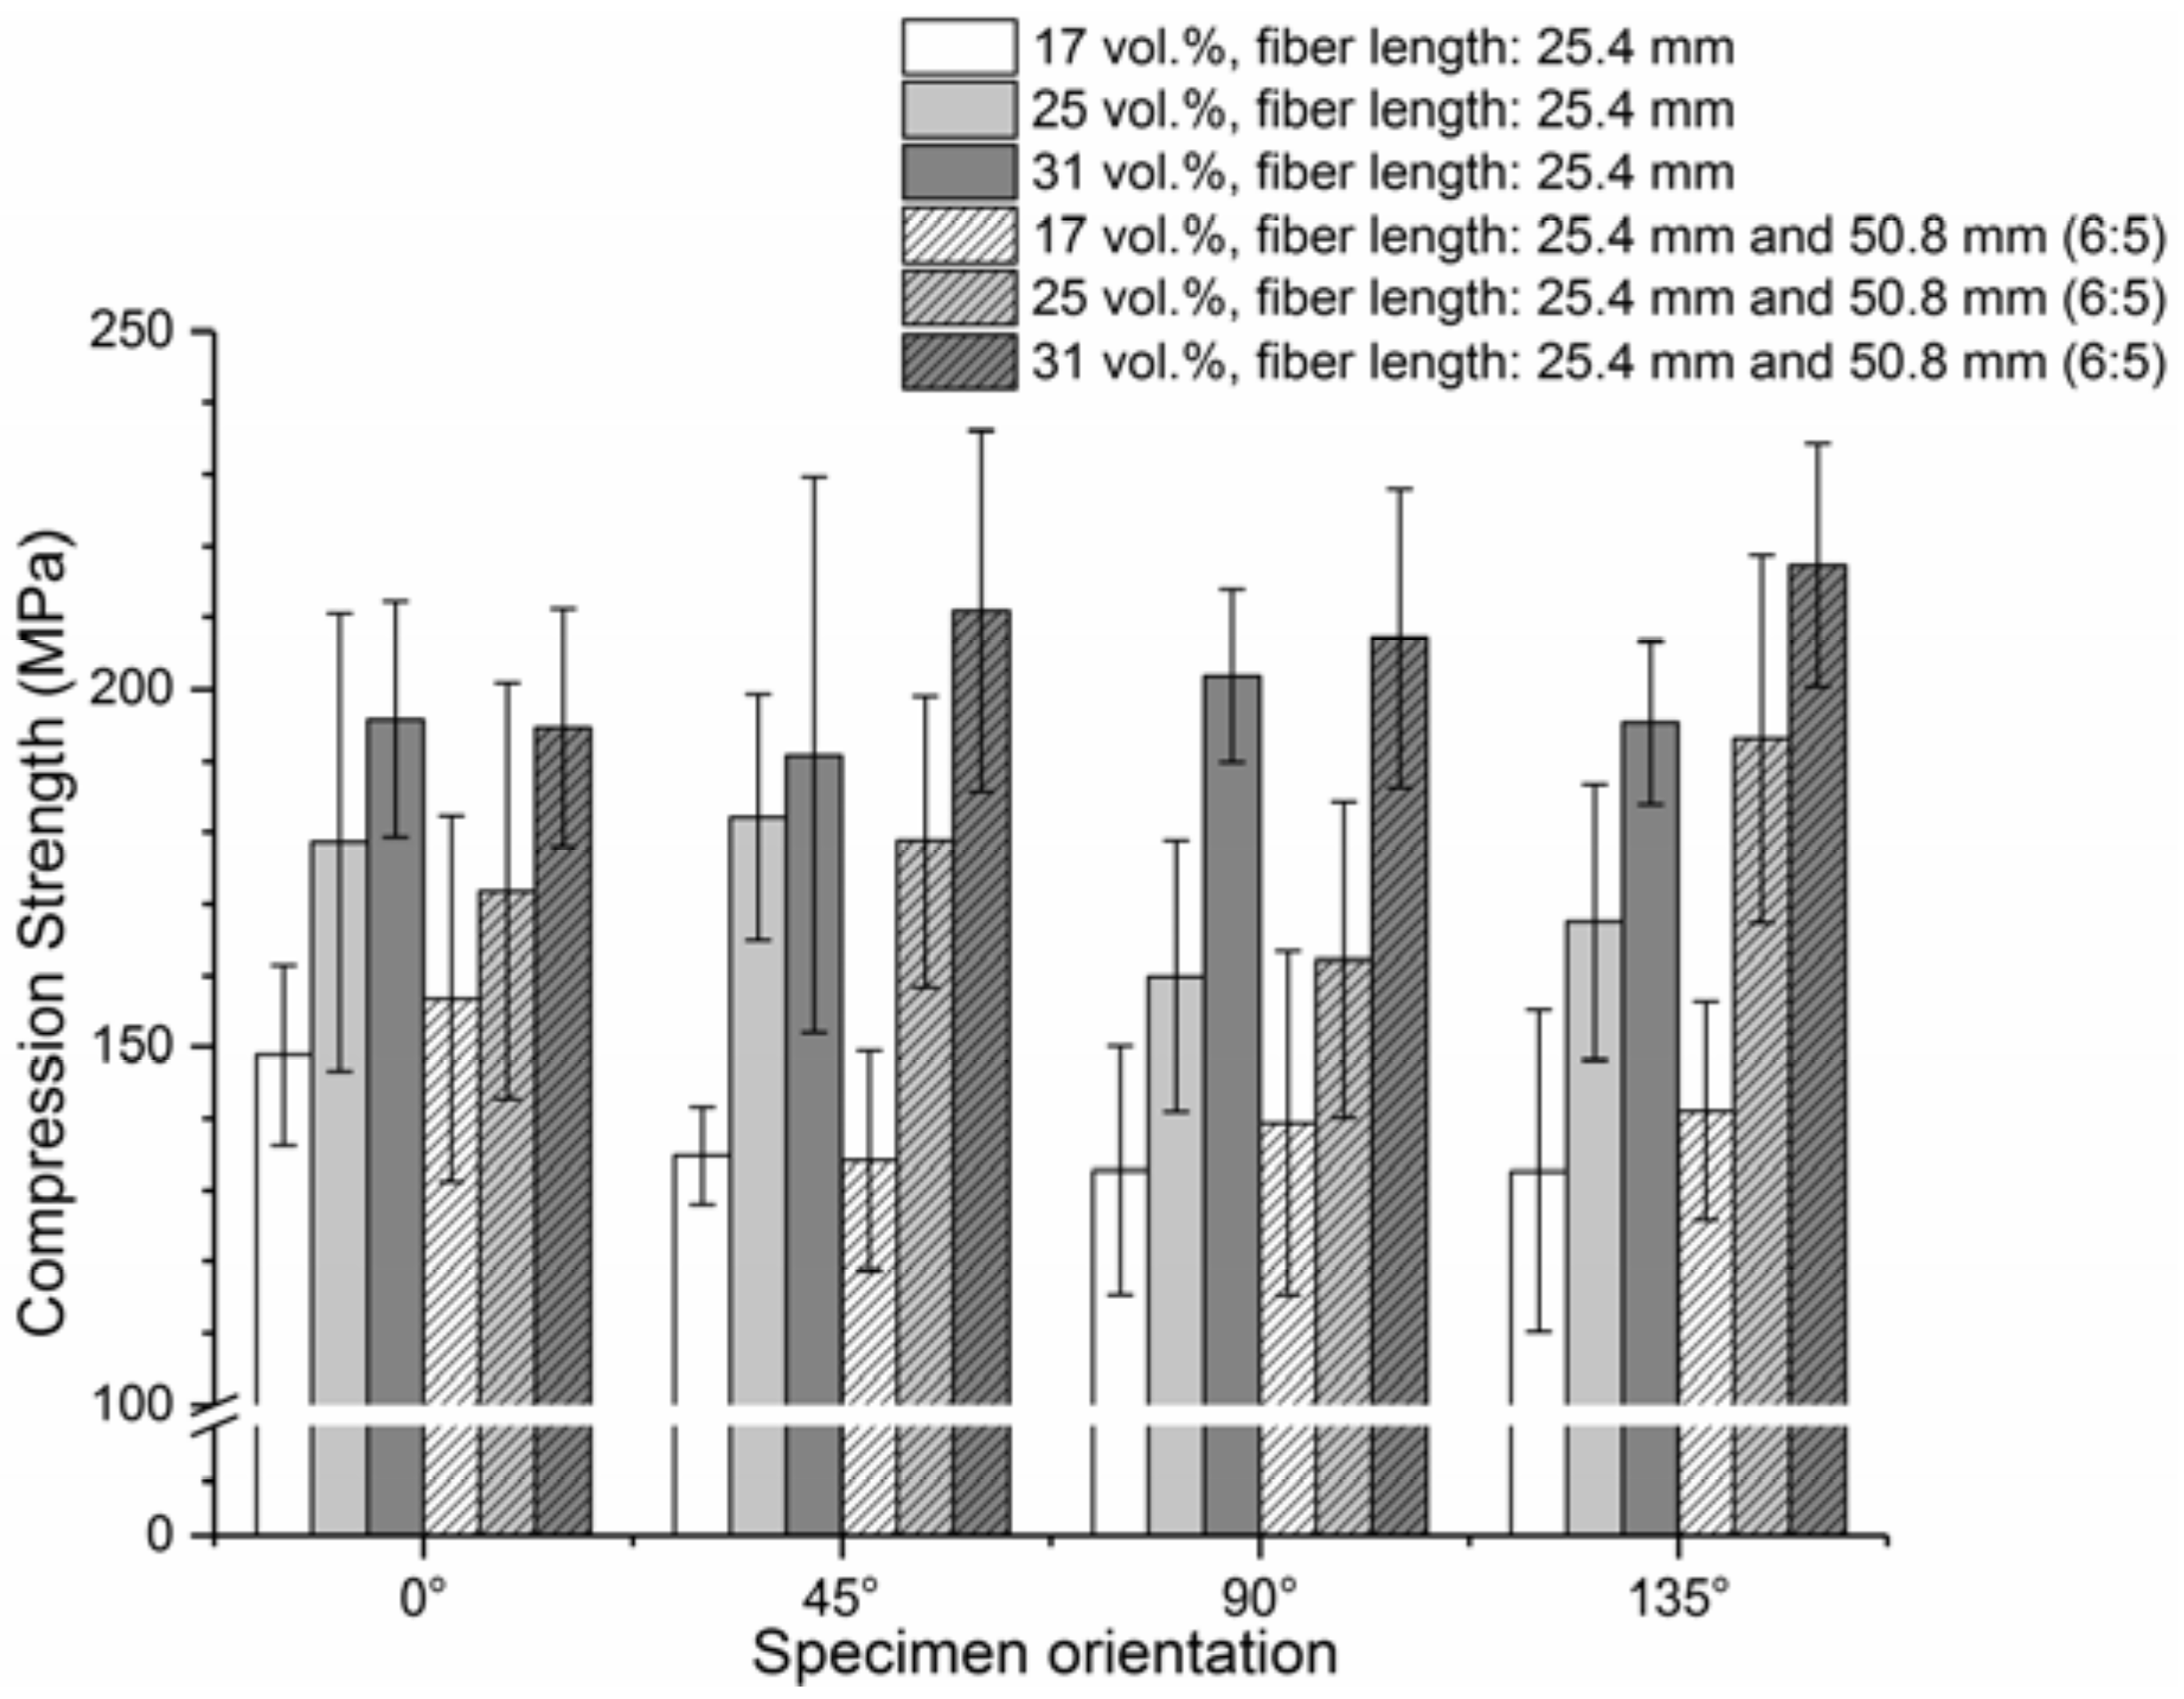
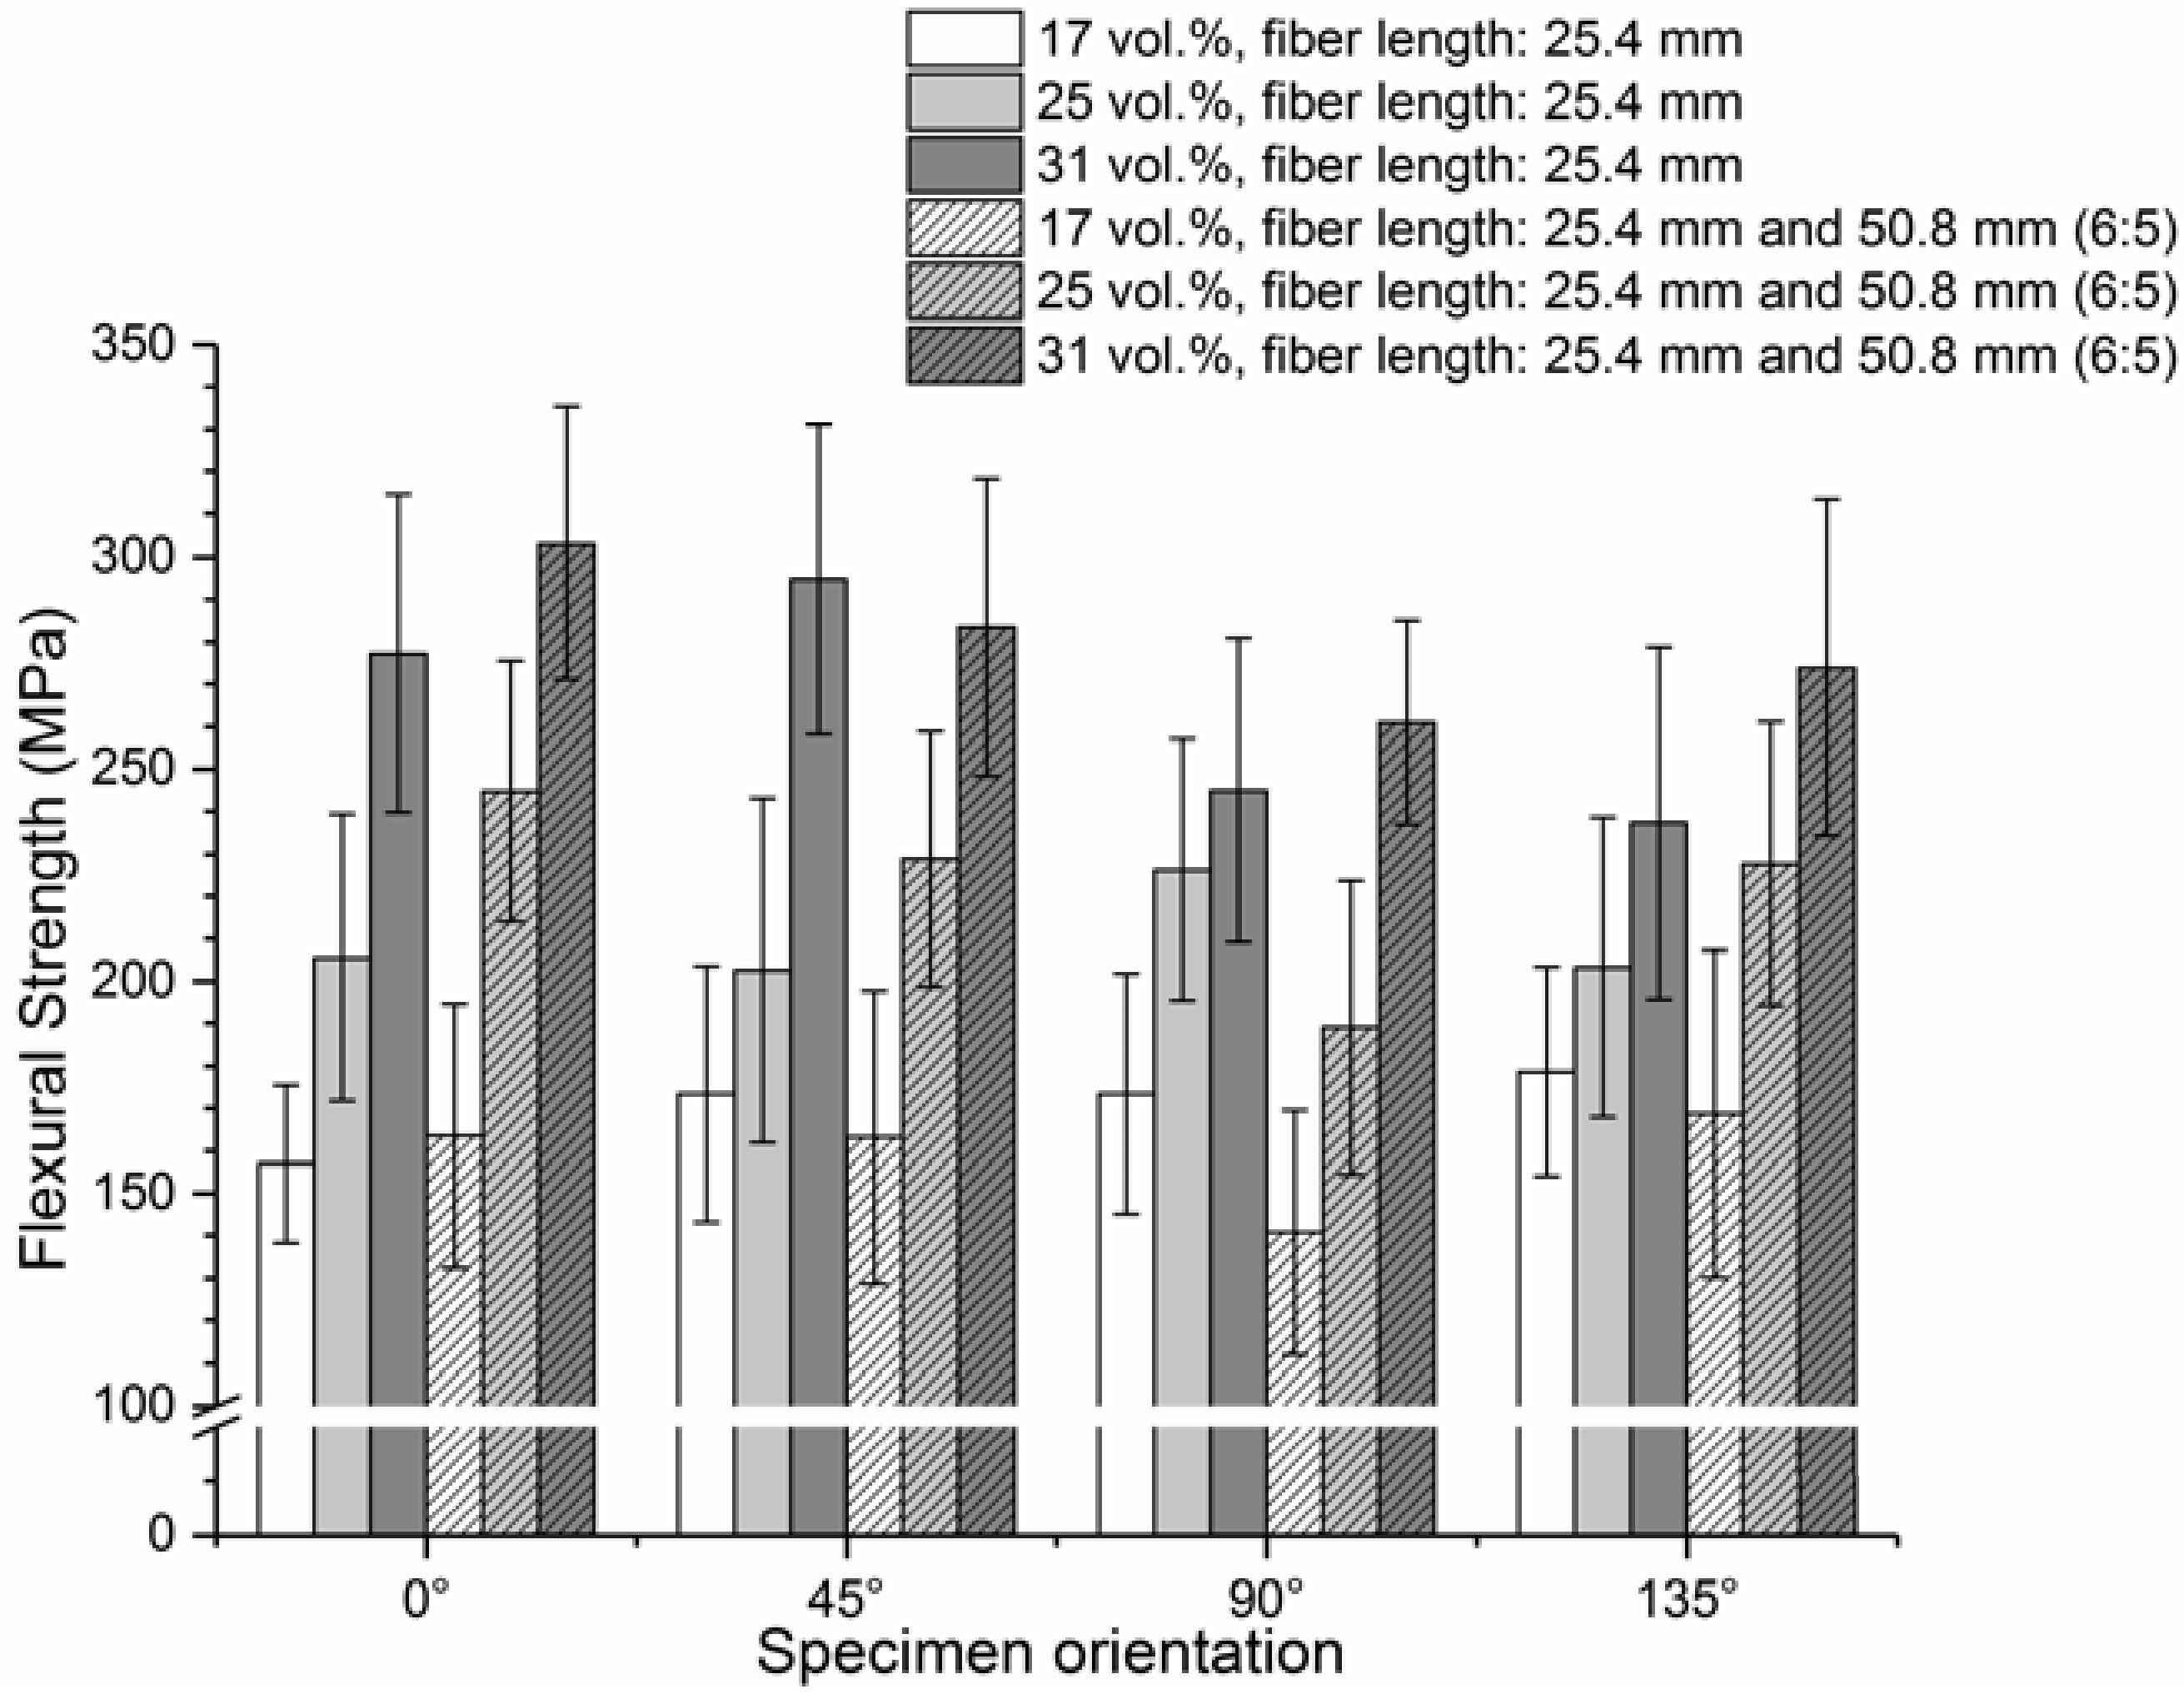
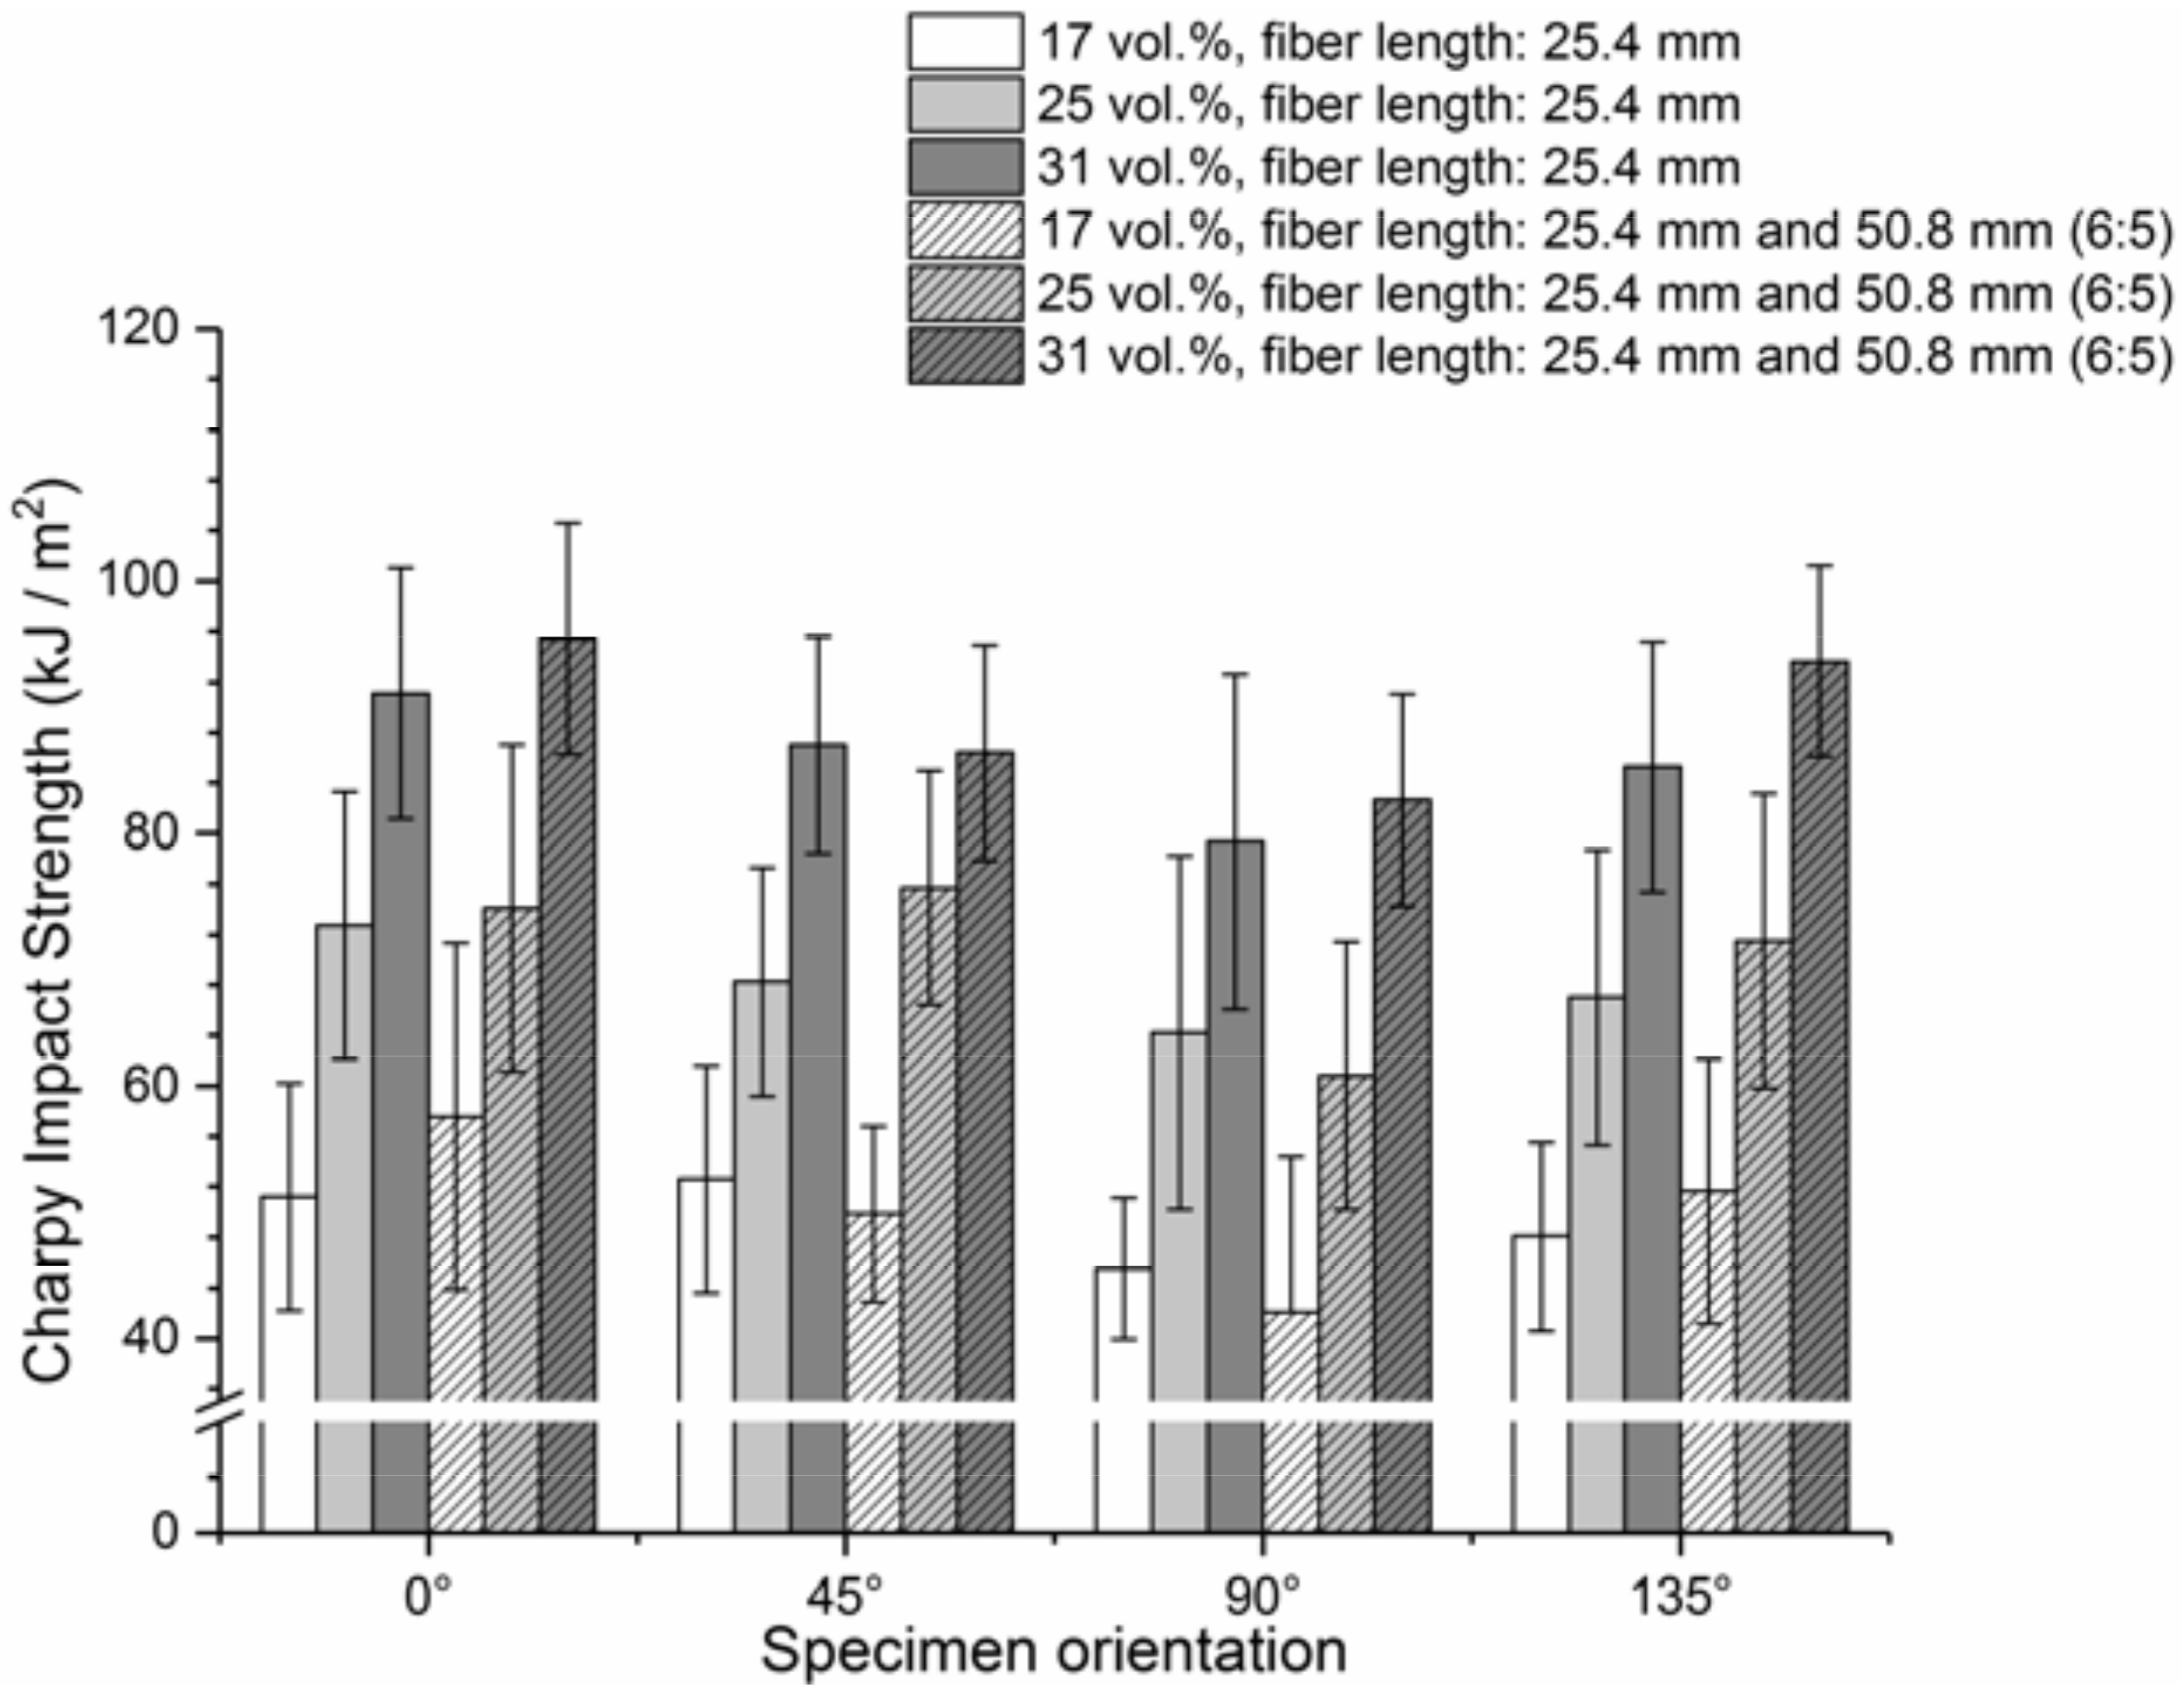
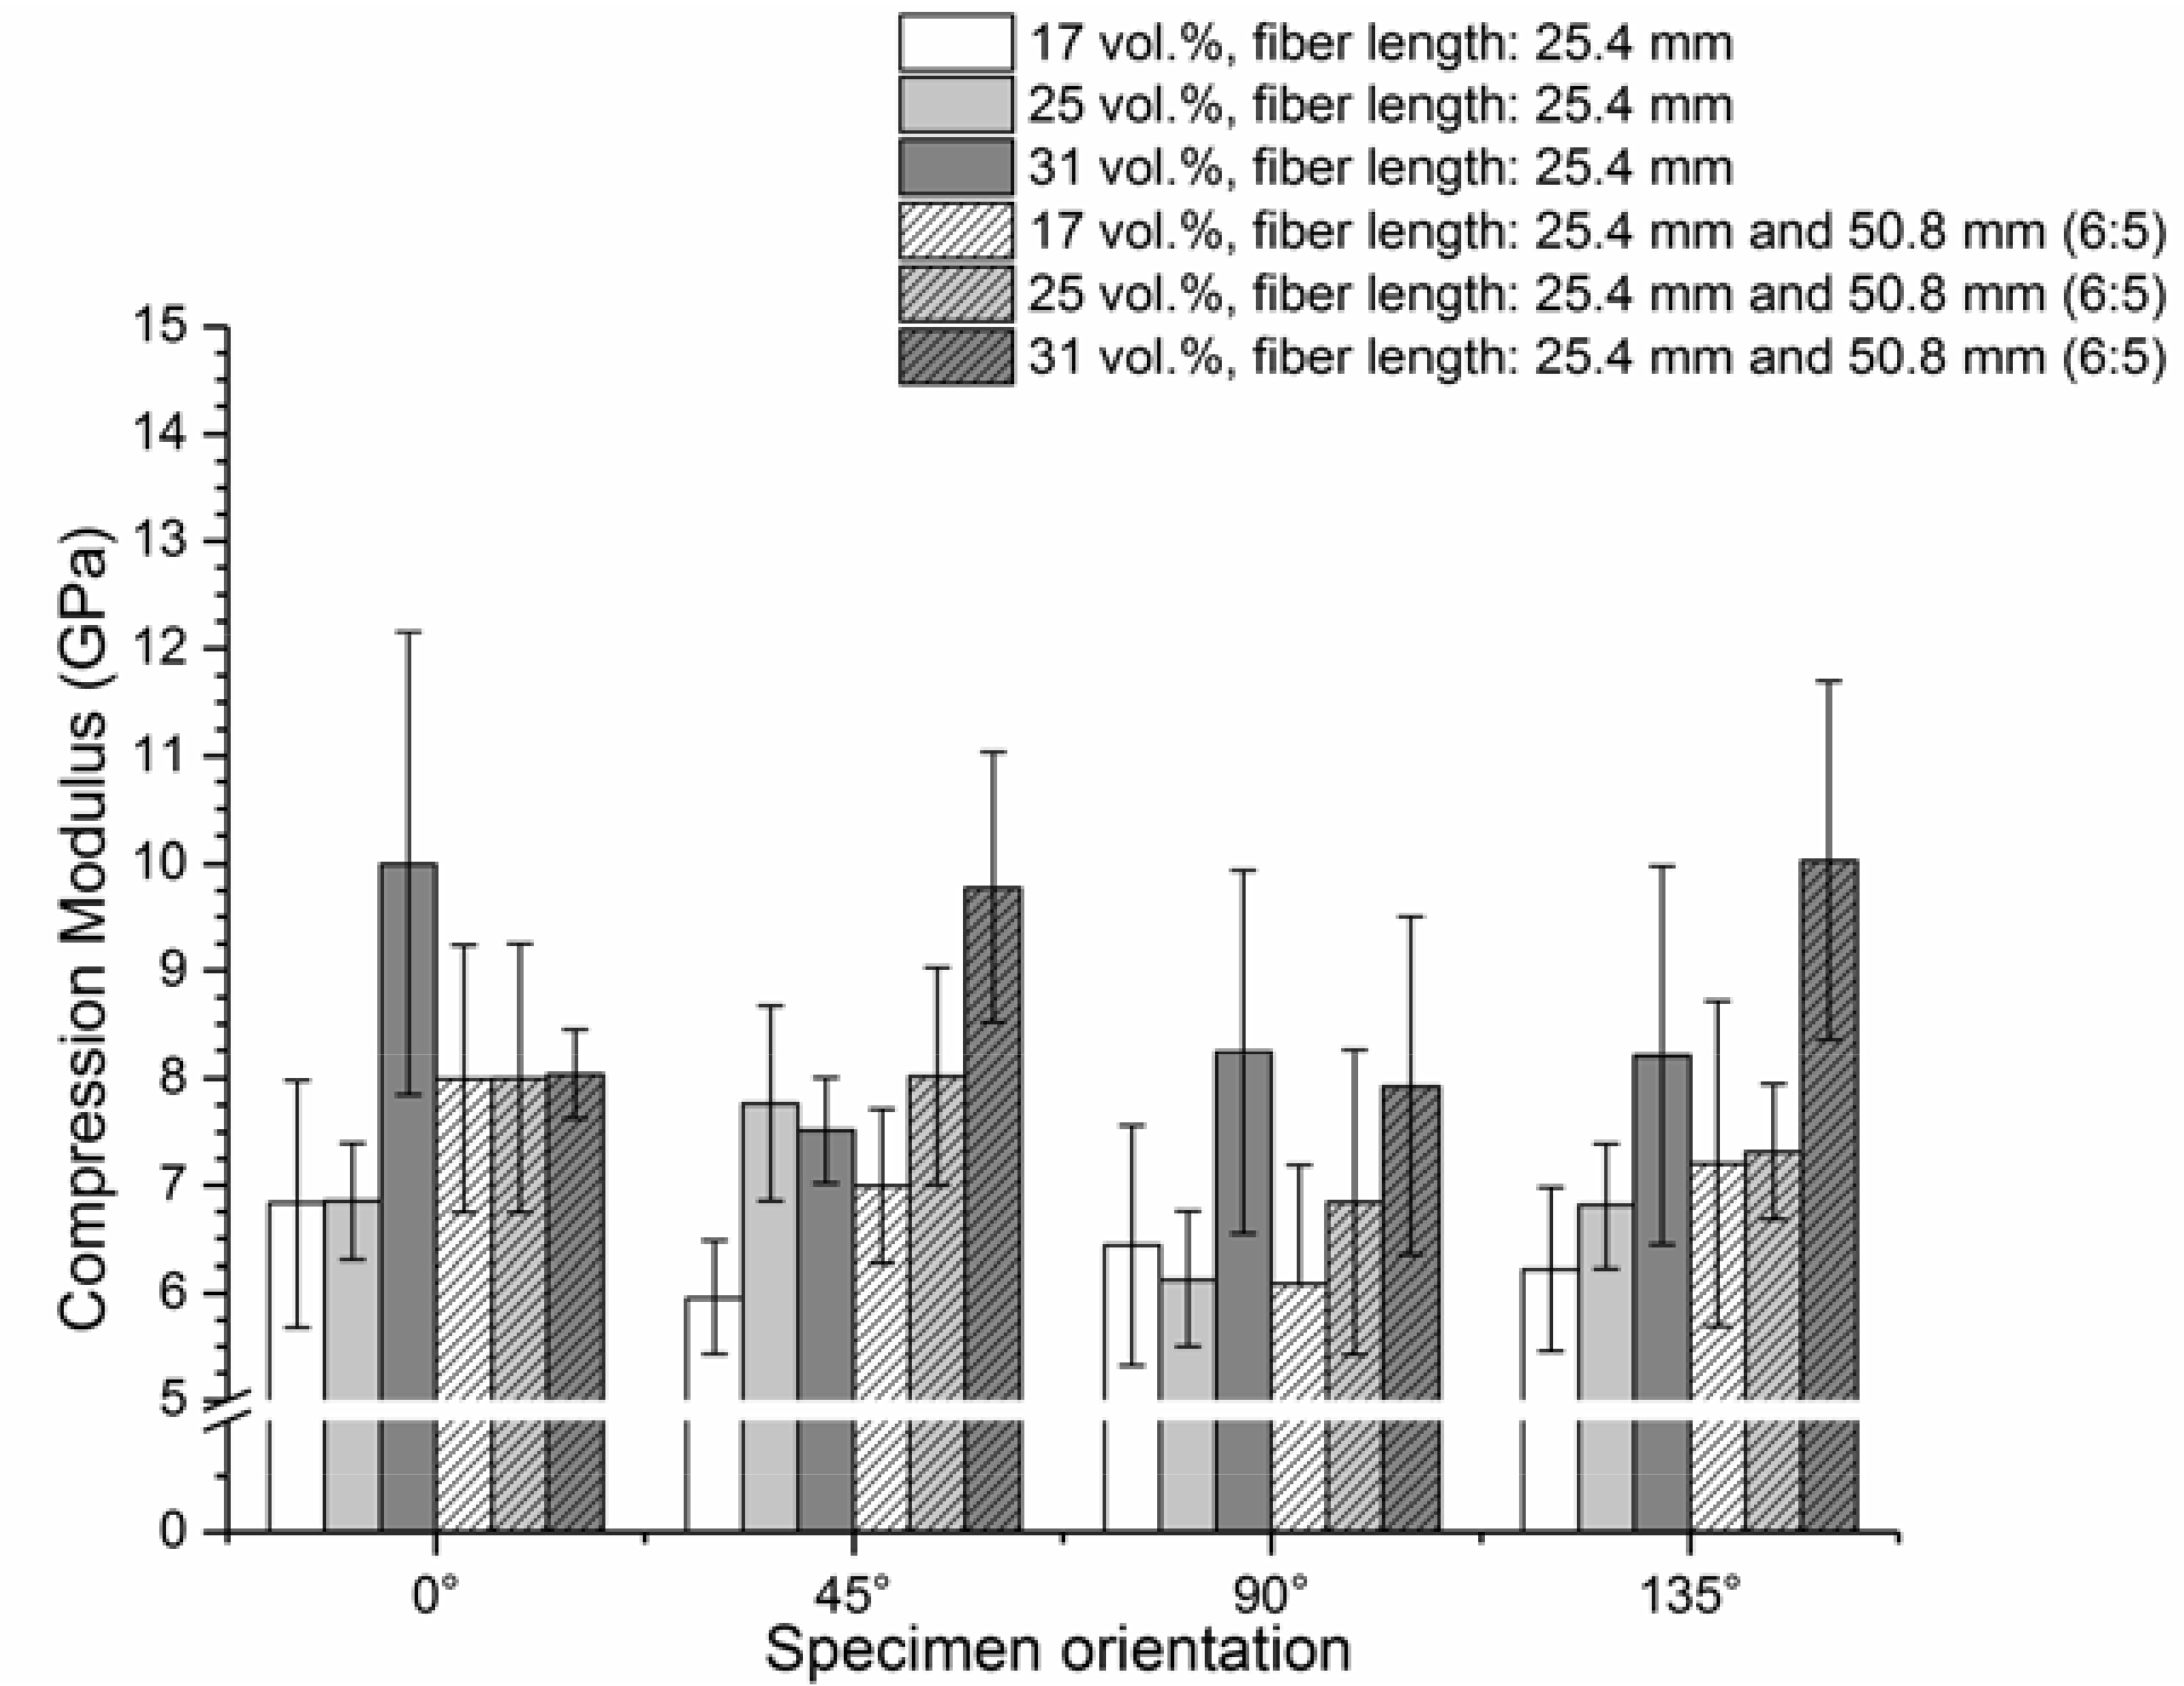
8]. This study aimed to determine the influence of fiber volume content, fiber length, and fiber orientation on the mechanical properties of a glass fiber-reinforced SMC based on a vinylester resin. The six investigated SMC materials showed increasing mechanical properties with increasing FVC in the investigated range, from approximately 17 vol % to 31 vol %. This remained the same for quasi-static and for dynamic loading.
The observed material behavior aligns well with the material behavior of chopped fiber reinforced polymers. No significant difference was found between tensile and flexural stiffness for the considered materials in this study, but the observed compression moduli were smaller for all six material configurations. One possible reason for the lower compression moduli can be micro-buckling, which is frequently present when fiber-reinforced polymers are exposed to compressive loading. For the different materials, the strength was observed to increase from tensile to compression to flexural loads. An increase in fiber length did not significantly influence the mechanical properties for the materials considered within this study. From the authors’ point of view, this result cannot be generalized, since, contrary to the findings, the results observed by Boylan et al. [6] showed an increase in tensile strength of SMC as fiber length increased, whereas the tensile modulus did not change with different fiber lengths. This contradiction can be explained by different specimen types considered in the different studies.
To evaluate the results within this study, the specimen size and thus the representative volume differed for the different test configurations, although the testing was based on standardization, and even larger specimens than proposed by the standard were considered for tensile testing. Marissen et al. [32] indicated that specimen geometry and specimen size have an influence on measured mechanical material properties. This must be considered when evaluating the measured mechanical properties and anisotropy. According to the study of Marissen et al. [28], the width of the specimen largely affects the mechanical properties, since a specimen with a small width contains many cut fibers, which decreases the average fiber length. Thus, the effect of reinforcement is less efficient. Considering specimen size, the representative volume is very small, thus the longer fibers did not significantly influence the microstructure of the considered materials. Although the considered specimen volume for tensile loads was relatively big, only a small volume was loaded during compression, increasing the scatter of the measured properties. The difference in specimen size, and thus the considered volume loaded during mechanical testing, could also be a reason for the lower compression stiffness compared to the tensile stiffness of the material.
For the Charpy impact tests, the specimens were exposed to very localized loadings. Understandably, the longer fibers did not influence the impact properties due to this localization of loading. To obtain a better understanding of the influence of fiber length on the impact properties of SMC, another test, for example penetration tests with larger specimens, would be more suitable. Additionally, instrumented impact tests would allow for the investigation of the entire force-deflection response to gain a deeper insight into the elastic energy and energy absorption capability.
The SMC sheet, from which specimens were extracted for this study, did not flow during molding, but the material nevertheless showed anisotropic material properties, which resulted only from the movement of the conveyor belt. Although all considered loading cases within this study showed anisotropic mechanical material properties, the anisotropy was most severe for tensile loadings.
Anisotropic material properties of SMC were also reported by Lamanna et al. [7], but since this study did not provide any details on mold coverage and material properties for different orientations, a quantitative comparison is not possible.
The SMC material observed by Oldenbo et al. [8] featuring 21 vol % glass fibers, 20 vol % fillers, and 18 vol % of hollow glass spheres, only showed a slight anisotropy with a ratio of 1.21 for the elastic modulus measured in longitudinal (0°) and transverse (90°) directions. Tensile strength showed a ratio of 1.16. No details were provided on mold coverage during molding within this study, making it difficult to compare the findings by Oldenbo et al. [8] directly with the findings of this study. However, we assumed that a two-dimensional flow occurred, since the specimens for mechanical testing were extracted from a square mold. The ratio of longitudinal to transverse tensile modulus and tensile strength of the SMC investigated within this study, featuring 25 vol % of 1 inch long fibers, were equal to 1.18 and 1.16, respectively. The anisotropy of the SMC material, featuring the same fiber volume content but a mixture of one and two inch long fibers, was more pronounced, with a ratio of 1.25 (tensile modulus) and 1.44 (tensile strength). We concluded that only the movement of the conveyor belt led to the anisotropic material properties of the material.
The specimens investigated by Boylan et al. [6] were extracted from rectangular sheets, featuring either one or two inch long fibers and a fiber volume content of 21%, whereas the stack of semi-finished material was exposed to either one- or two-dimensional flow during compression molding. The observed ratio of tensile modulus was 1.85 for SMC featuring only one-inch fibers and 1.55 for SMC with only two inch long fibers. This is an opposite trend compared to the findings of this study. With a ratio of 2.8, the tensile strength of the material investigated by Boylan et al. [6] showed a significantly more pronounced anisotropy than the resulting mechanical properties, due to fiber orientation resulting only from the movement of the conveyor belt, as observed within this study. In general, we concluded that material flow during the manufacturing of the semi-finished sheets or during compression molding more significantly affects the material’s strength than the elastic properties. Entrapped air, which normally causes problems in the manufacturing process of SMC [6] and is one reason for using a flow molding process, did not cause significant problems while processing the material investigated within this study.
The SMC material investigated by Oldendo et al. [8] featured a fiber volume content of 18–20% with approximately the same amount of hollow glass spheres and fillers. The material featured a density of 1.57 g/cm3. The material investigated within this study had a lower density (density of approximately 1.48 g/cm3 for SMC with approximately 25 vol % of glass fibers) for higher fiber volume contents, since no fillers were added to the resin formulation. With comparable tensile and compression properties, the introduced material offers an increased lightweight potential, since the presented structural SMC enables the manufacturing of a material featuring higher fiber volume contents combined with a lower density than standard SMC materials, as the fillers can be replaced by load carrying fibers.
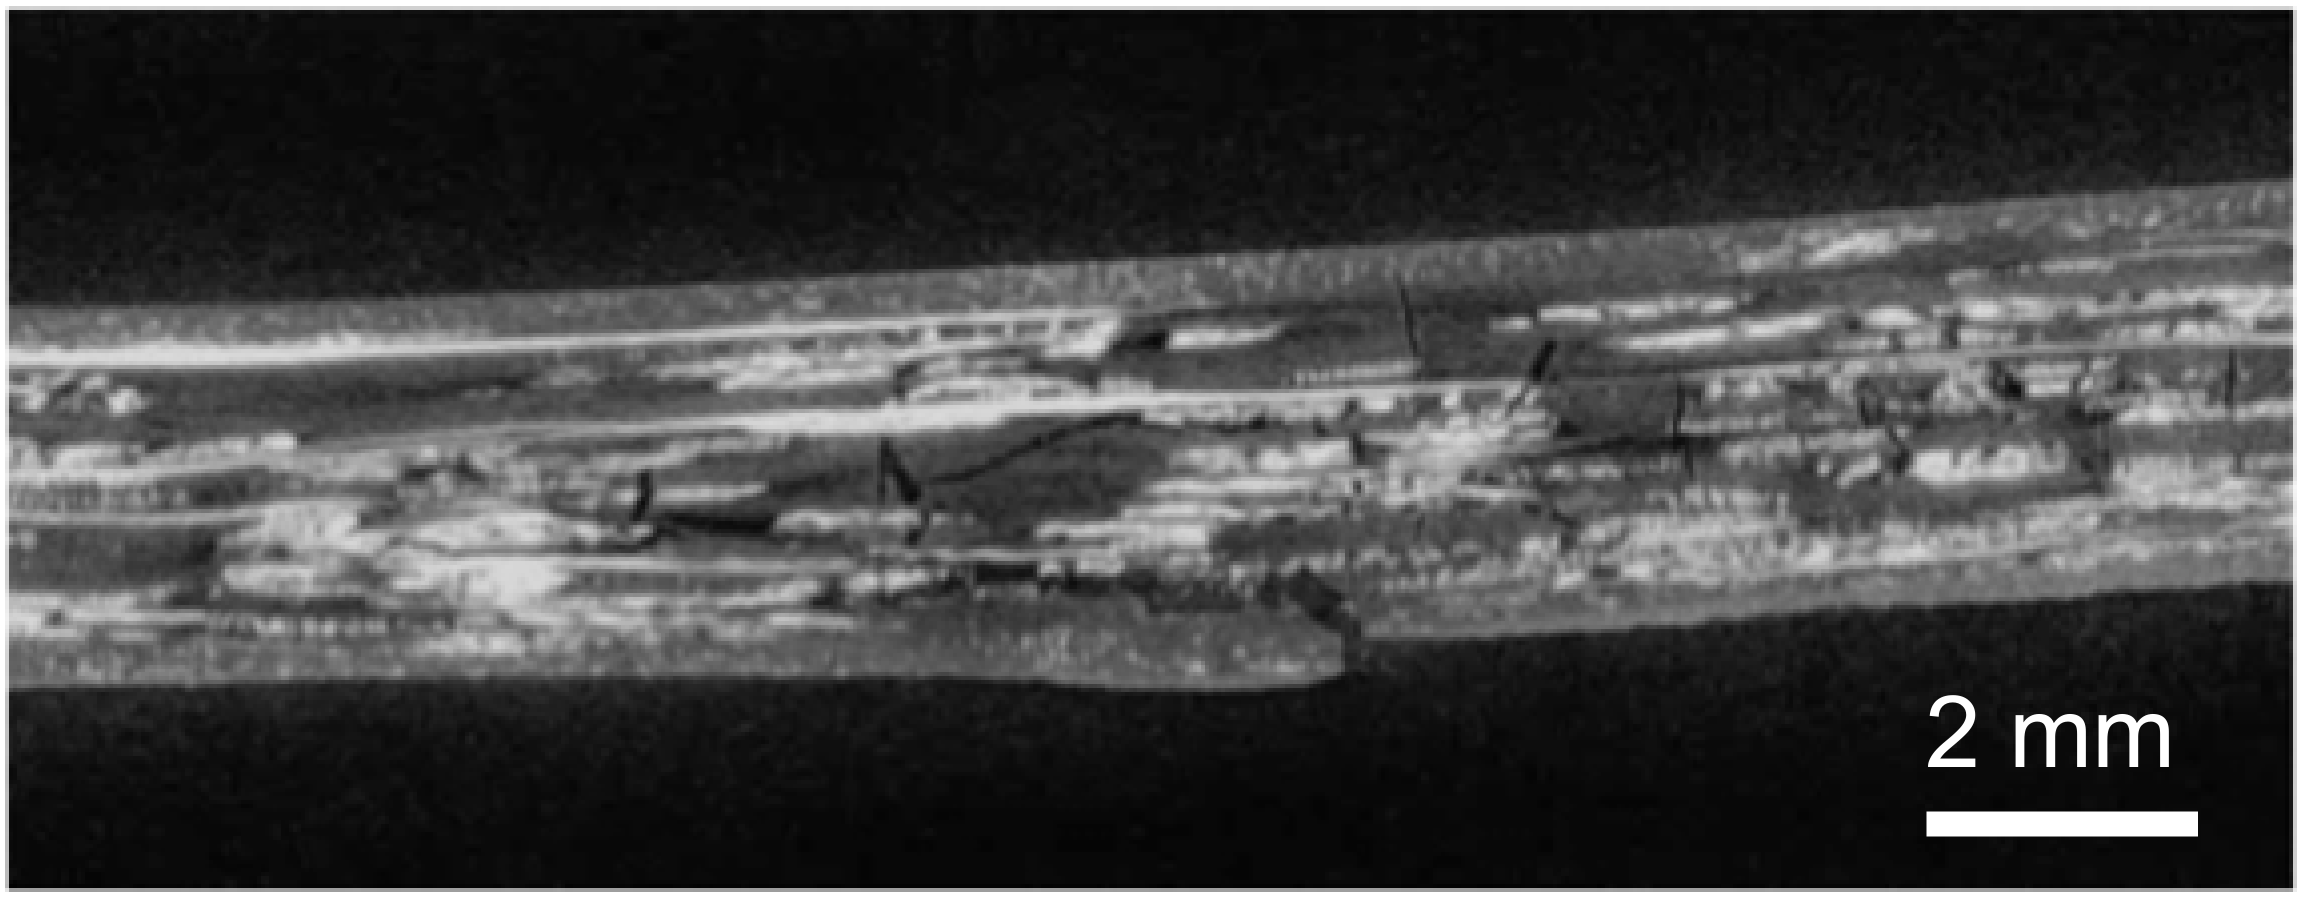
This contribution also focused on the identification of failure mechanisms, which are present during bending loadings of glass fiber SMC. The µCT investigation of the damaged specimen showed two dominant failure mechanisms resulting from bending loading: matrix cracking and interface failure. These findings align with the results of different research groups, that investigated the failure of sheet molding compounds [33,
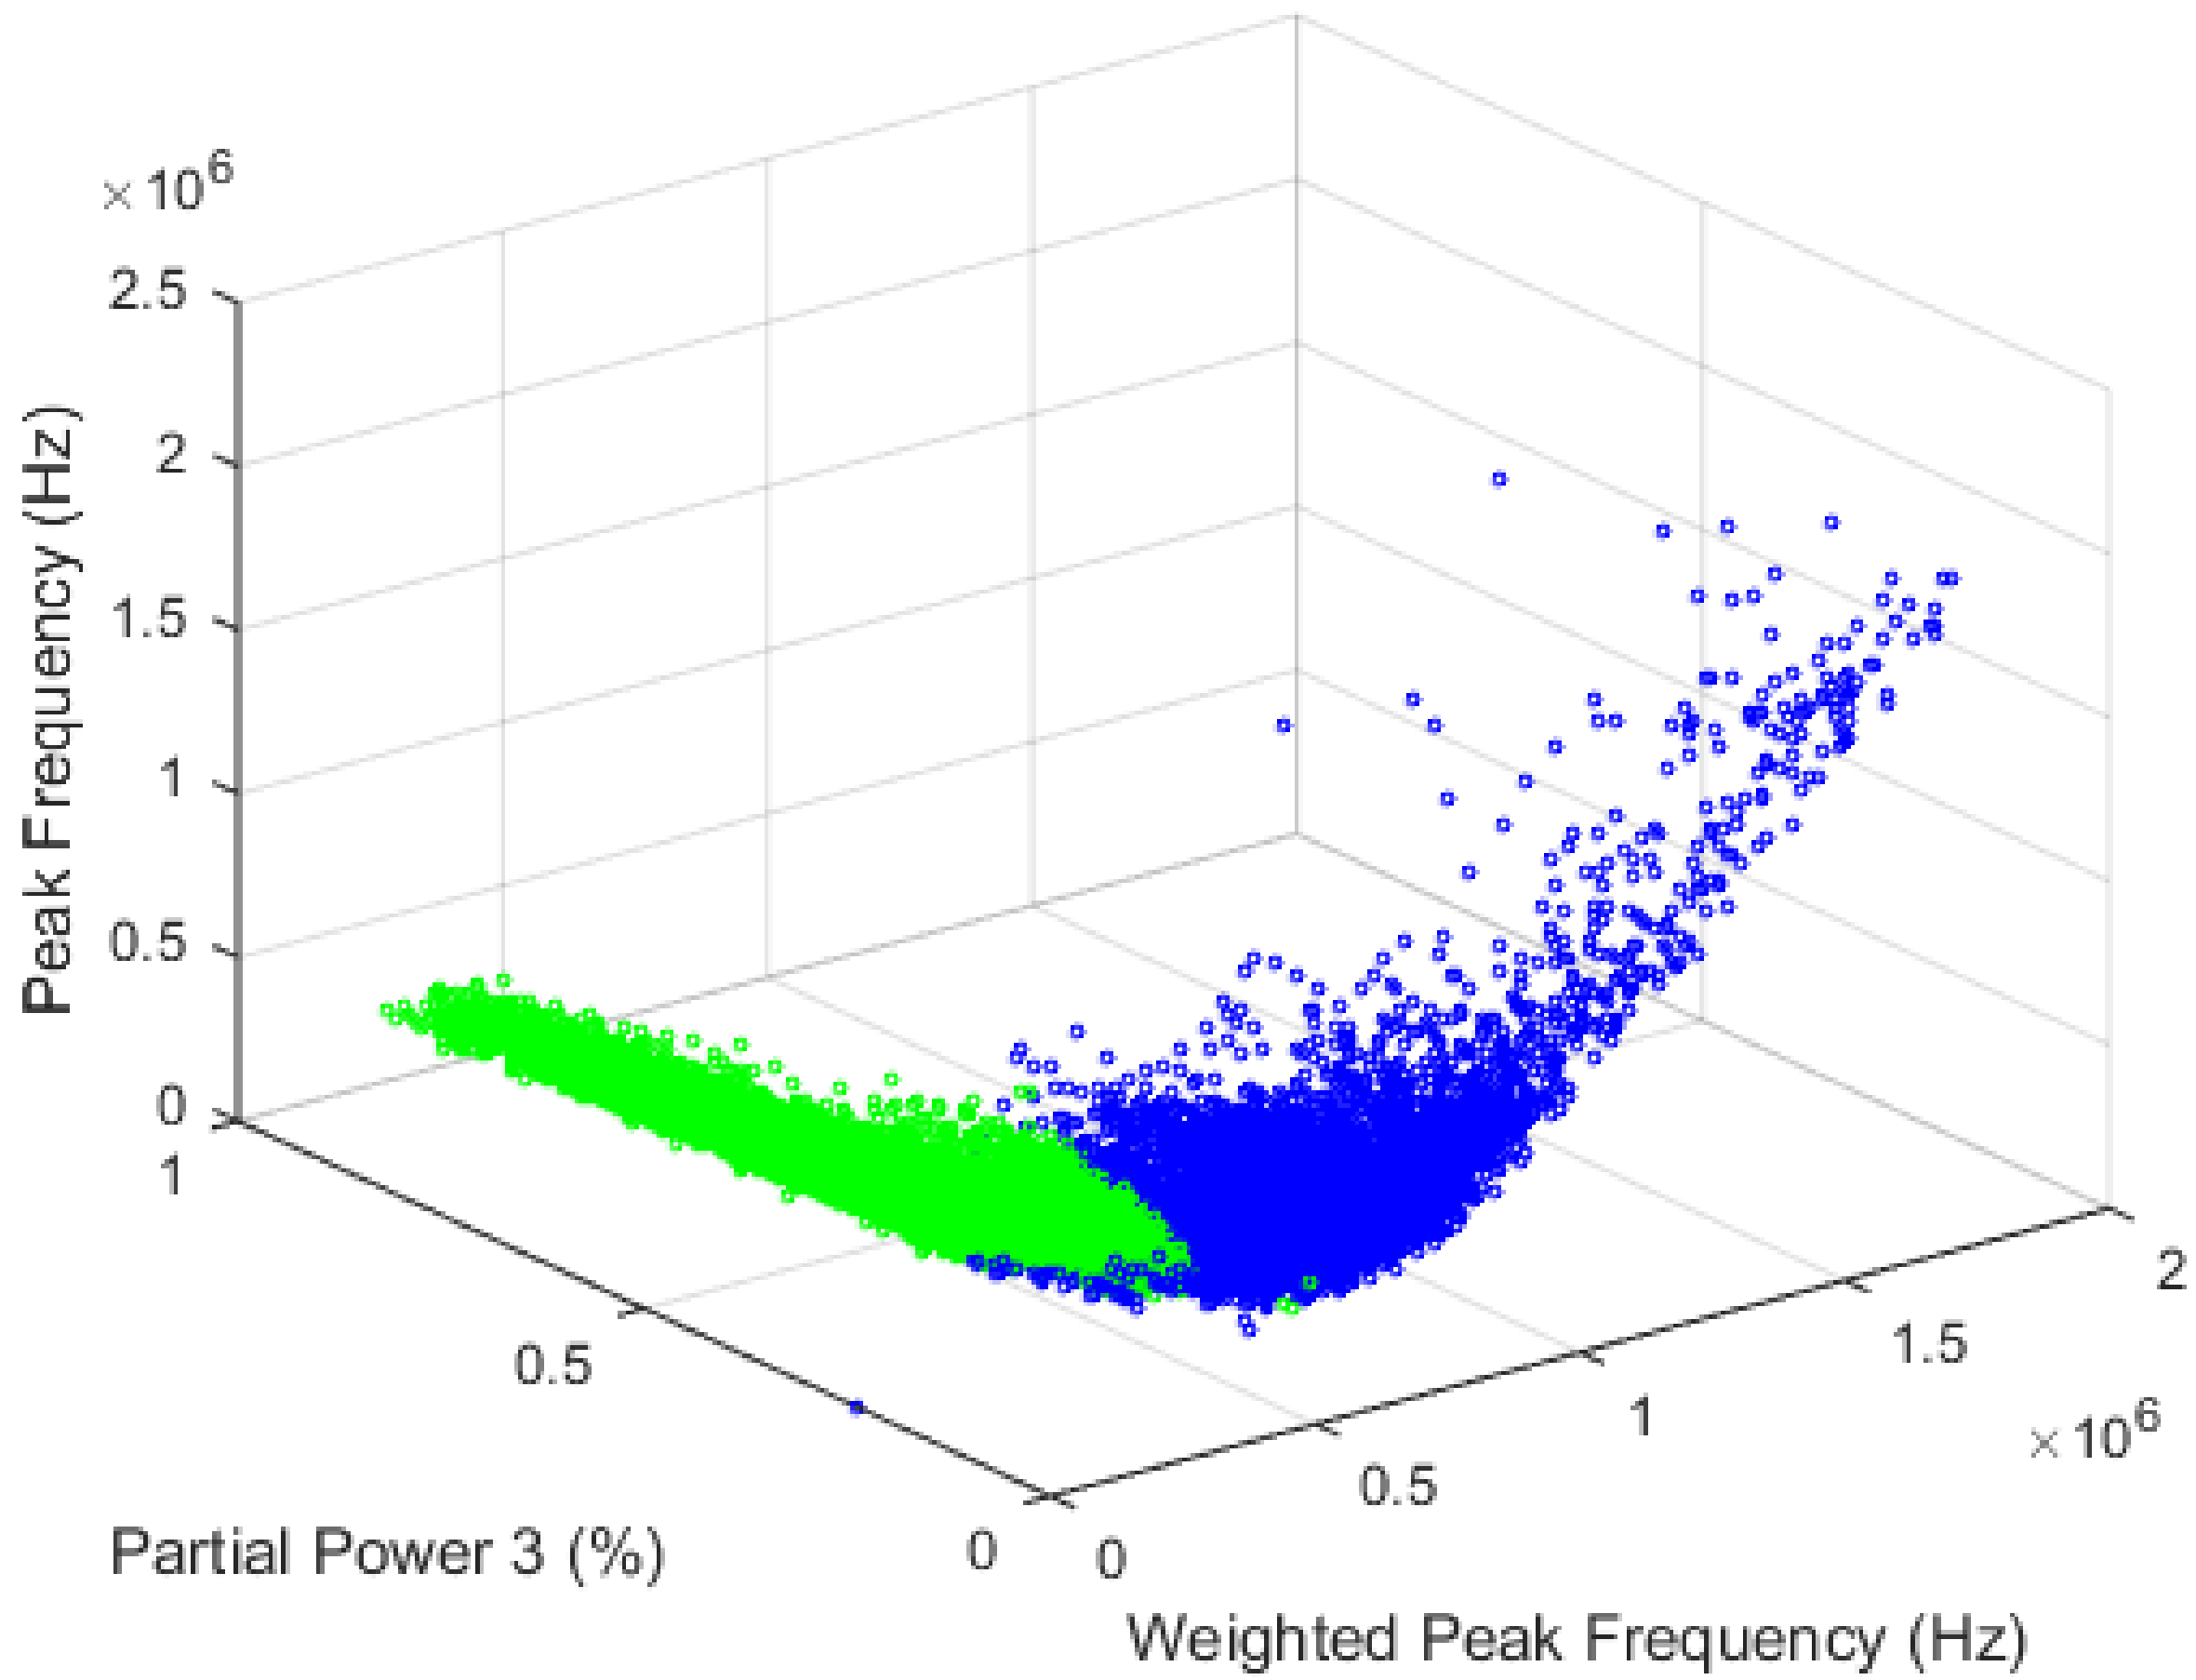
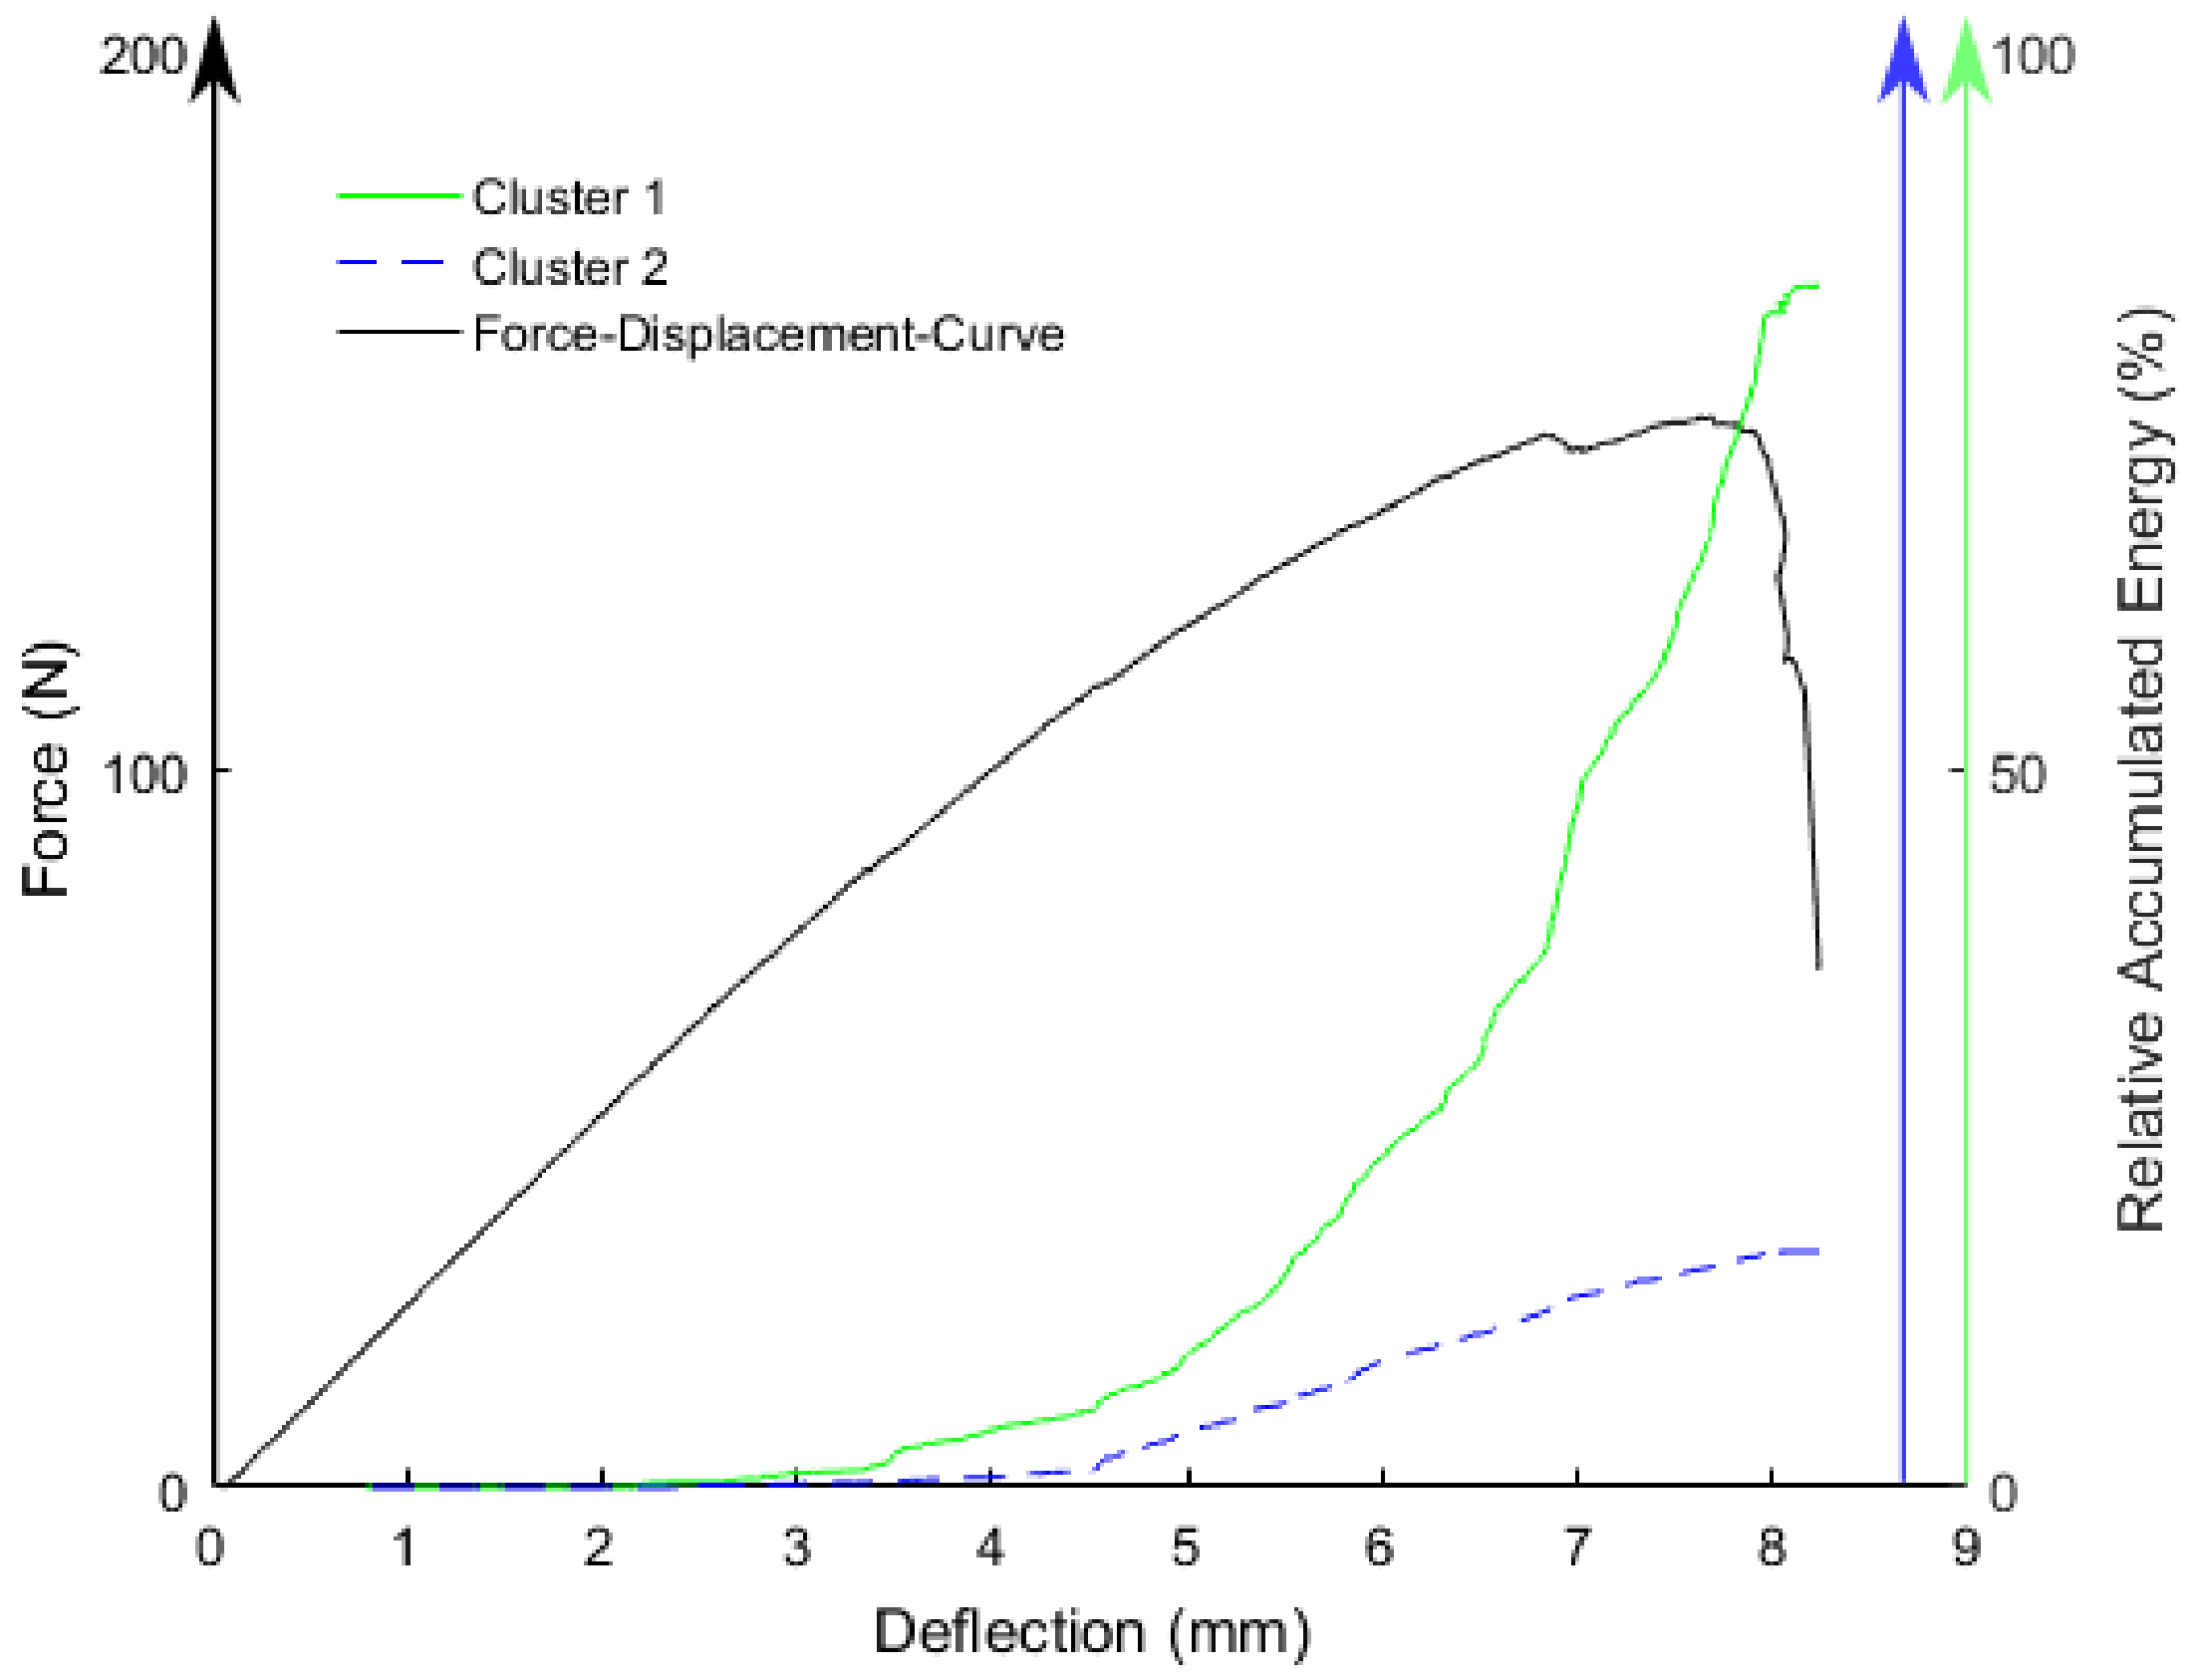
34]. Fiber breakage was not observed as a failure mechanism for the investigated SMC material. The acoustic emission analysis performed in this contribution, being coupled with machine learning algorithms, led to the identification of two natural signal clusters. In general, different clusters represent different failure mechanisms. To describe the damage of a discontinuous glass fiber SMC, the two clusters were attributed to the two observed failure mechanisms. Machine learning tools for AE are still in an early stage and are being steadily developed. New feature spaces could help offer a sharper line between the clusters seen in Figure 9, and hence to minimize erroneously clustered hits. Various material systems could also use an adjustment of the feature space, such as the range of the frequencies for integration of partial powers. Nevertheless, machine learning algorithms represent a helpful tool to analyze the large volume of data created in AE analysis, which may be a first step toward a better understanding of the damage behavior and evolution of discontinuous composites, as it allows for continuous observation and identification of the damage evolution and the underlying mechanisms.

6. Conclusions

This paper investigated the influence of fiber length, fiber volume content, and fiber orientation on quasi-static and dynamic material properties of discontinuous glass fiber-reinforced vinylester-based SMC. Six different materials, featuring different fiber volume contents and two different fiber length configurations, were considered. The acoustic emission technique and data processing by means of machine learning algorithms were used to determine damage mechanisms of this material.
The results showed that manufacturing SMC sheets with a 100% mold coverage is possible. An increase in fiber volume content from 17 vol % to 31 vol % led to increased stiffness and strength for tension, compression, and flexural loads for the considered unfilled SMC material. This behavior aligns well with the mechanical behavior of fiber-reinforced polymers featuring different fiber volume contents in general. The combination of one and two inch long fibers did not significantly influence the quasi-static and dynamic material properties for the considered materials. This result is possibly due to the small effective loaded regions of the specimen. Fiber orientation, which occurred only due to the movement of the conveyer belt during the manufacturing of the semi-finished materials, led to slightly anisotropic quasi-static and dynamic material properties, whereas the anisotropy was less severe than for SMC sheets which flew during compression molding. The omission of fillers led to materials with high fiber volume contents and lower densities, compared to standard SMC materials. Hence, the material considered within this study has high potential for lightweight applications. Machine learning algorithms are appropriate to cluster AE signals. Comparison of the results of the post-damaged µCT analysis and acoustic emission analysis, performed during loading of the specimen, pointed out that damage of discontinuous vinylester SMC was based on matrix cracking and interface failure. These findings are in good agreement with literature.

Acknowledgments

The research documented in this manuscript has been funded by the German Research Foundation (DFG) within the International Research Training Group ‘‘Integrated engineering of continuous-discontinuous long fiber reinforced polymer structures’’ (GRK 2078). The authors also kindly acknowledge the Fraunhofer ICT in Pfinztal, Germany for manufacturing the SMC sheets with a special thanks to David Bücheler and Leopold Giersch for his support to carry out parts of the mechanical testing. Furthermore, the authors would like to thank Markus Sause from Experimental Physics II in Augsburg for his suggestions in data processing as well as Florentin Pottmeyer and Stefan Dietrich from IAM-WK for valuable discussions.

Author Contributions

Anna Trauth conceived, designed and performed the experiments; Pascal Pinter performed the µCT scans; Anna Trauth, Pascal Pinter and Kay André Weidenmann analyzed the data; Pascal Pinter contributed machine learning and analysis tools; Anna Trauth and Pascal Pinter wrote the paper.

Conflicts of Interest

The authors declare no conflict of interest.

References

  1. Orgéas, L.; Dumont, P.J.J.; Nicolais, L. Sheet Molding Compounds. In Wiley Encyclopedia of Composites, 2nd ed.; Nicolais, L., Borzacchiello, A., Eds.; John Wiley & Sons, Inc.: Hoboken, NJ, USA, 2011. [Google Scholar]
  2. Witten, E.; Kraus, T.; Kühnle, M. Composites Market Report 2016: Market Developments, Trends, Outlook and Challenges; AVK: Frankfurt, Germany, 2016. [Google Scholar]
  3. Reimer, U.; Esswein, G.; Derek, H. Quo Vadis—SMC im Automobilbau. Ku Kunststoffe Online-Archive 2000, 90, 86–90. [Google Scholar]
  4. Bruderick, M.; Denton, D.; Shinedling, M.; Kiesel, M. Application of Carbon Fiber SMC for the Dodge Viper. Available online: http://www.quantumcomposites.com/pdf/papers/viper-spe-paper.pdf (accessed on 21 October 2017).
  5. Gardiner, G. Is the BMW 7 Series the Future of Autocomposites? Available online: http://www.compositesworld.com/articles/is-the-bmw-7-series-the-future-of-autocomposites (accessed on 21 October 2017).
  6. Boylan, S.; Castro, J.M. Effect of Reinforcement Type and Length on Physical Properties, Surface Quality, and Cycle Time for Sheet Molding Compound (SMC) Compression Molded Parts. J. Appl. Polym. Sci. 2003, 90, 2557–2571. [Google Scholar] [CrossRef]
  7. Lamanna, G.; Ceprano, A. Mechanical Characterization of Sheet Moulding Composites for the Automotive Industry. Open Mater. Sci. J. 2014, 8, 108–113. [Google Scholar] [CrossRef]
  8. Oldenbo, M.; Fernberg, S.; Berglund, L. Mechanical Behaviour of 5SMC6 Composites with Toughening and Low Density Additives. Compos. Part A Appl. Sci. Manuf. 2003, 34, 875–885. [Google Scholar] [CrossRef]
  9. Trauth, K.A. Mechanical Properties of Continuously Discontinuously Fibre Reinforced Hybrid Sheet Moulding Compounds; Euro Hybrid: Kaiserslautern, Germany, 2016. [Google Scholar]
  10. Bücheler, D.; Henning, F. Hybrid Resin Improves Position and Alignment of Continuously Reinforced Prepreg during Compression Co-Molding with Sheet Molding Compound. In Proceedings of the 17th European Conference on Composite Materials, Munich, Germany, 26–30 June 2016. [Google Scholar]
  11. Puck, A. Festigkeitsanalyse von Faser-Matrix-Laminaten: Modelle für Die Praxis; Carl Hanser Verlag: Munich, Germany, 1996. [Google Scholar]
  12. Muravin, B. Acoustic Emission Science and Technology. Available online: http://www.muravin.com (accessed on 21 October 2017).
  13. Jackson, C.N.; Moore, P.O.; Sherlock, C.N. Nondestructive Testing Handbook, Acoustic Emission Testing, 3rd ed.; ASNT: Columbus, OH, USA, 2005. [Google Scholar]
  14. Barré, S.; Benzeggagh, M.L. On the Use of Acoustic Emission to Investigate Damage Mechanisms in Glass-Fibre-Reinforced Polypropylene. Compos. Sci. Technol. 1994, 52, 369–376. [Google Scholar] [CrossRef]
  15. Jiao, G.Q.; Zheng, S.T.; Suzuki, M.; Iwamoto, M. Damage Evaluation of Sheet Moulding Compound Composite by Acoustic Emission. Theor. Appl. Fract. Mech. 1990, 14, 135–140. [Google Scholar] [CrossRef]
  16. Alander, P.; Lassila, L.V.J.; Tezvergil, A.; Vallittu, P.K. Acoustic Emission Analysis of Fiber-Reinforced Composite in Flexural Testing. Dent. Mater. 2004, 20, 305–312. [Google Scholar] [CrossRef]
  17. Huguet, S.; Godin, N.; Gaertner, R.; Salmon, L.; Villard, D. Use of Acoustic Emission to Identify Damage Modes in Glass Fibre Reinforced Polyester. Compos. Sci. Technol. 2002, 62, 1433–1444. [Google Scholar] [CrossRef]
  18. Santulli, C. Matrix Cracking by Acoustic Emission in Polymer Composites and Counts/Duration Ratio. Available online: http://www.ndt.net/search/docs.php3?showform=off&id=13678 (accessed on 21 October 2017).
  19. Dahmene, F.; Yaacoubi, S.; Mountassir, M.E.L. Acoustic Emission of Composites Structures: Story, Success, and Challenges. In Proceedings of the 2015 ICU International Congress on Ultrasonics, Metz, France, 10–14 May 2015. [Google Scholar]
  20. Sause, M.; Gribov, A.; Unwin, A.R.; Horn, S. Pattern Recognition Approach to Identify Natural Clusters of Acoustic Emission Signals. Pattern Recognit. Lett. 2012, 33, 17–23. [Google Scholar] [CrossRef]
  21. De Oliveira, R.; Marques, A.T. Health Monitoring of FRP Using Acoustic Emission and Artificial Neural Networks. Smart Struct. 2008, 86, 367–373. [Google Scholar] [CrossRef]
  22. Mccrory, J.P.; Al-Jumaili, S.K.; Crivelli, D.; Pearson, M.R.; Eaton, M.J.; Featherston, C.A.; Guagliano, M.; Holford, K.M.; Pullin, R. Damage Classification in Carbon Fibre Composites Using Acoustic Emission: A Comparison of Three Techniques. Compos. Part B Eng. 2015, 68, 424–430. [Google Scholar] [CrossRef]
  23. Sause, M.; Horn, S.; Klug, M.; Scholler, J. Anwendung von Mustererkennungsverfahren zur Schadensanalyse in Faserverstärkten Kunststoffen. In Proceedings of the 17th Colloquium Acoustic Emission, Bad Schandau, Germany, 24–25 September 2009. [Google Scholar]
  24. Deutsches Institut für Normung e.V. Determination of Tensile Properties of Plastics–Part 4: Test Conditions for Isotropic and Orthotropic Fibre-Reinforced Plastic Composites (ISO 527-4: 1997), German version EN ISO 527-4; Deutsches Institut für Normung e.V.: Berlin, Germany, 1997. [Google Scholar]
  25. Deutsches Institut für Normung e.V. Fibre-Reinforced Plastic Composites–Determination of Flexural Properties (ISO 14125: 1998 + Cor.1: 2001 + Amd.1: 2011), German version EN ISO 14125:1998 + AC: 2002 + A1; Deutsches Institut für Normung e.V.: Berlin, Germany, 2011. [Google Scholar]
  26. Deutsches Institut für Normung e.V. Fibre Reinforced Plastic Composites–Determination of Compressive Properties in the In-Plane Direction (ISO 14126: 1999), German version EN ISO 14126; Deutsches Institut für Normung e.V.: Berlin, Germany, 1999. [Google Scholar]
  27. Deutsches Institut für Normung e.V. Plastics–Determination of Charpy Impact Properties–Part 1: Non-Instrumented Impact Test (ISO 179-1: 2010), German version EN ISO 179-1; Deutsches Institut für Normung e.V.: Berlin, Germany, 2010. [Google Scholar]
  28. Günter, S.; Bunke, H. Validation Indices for Graph Clustering. Pattern Recognit. Lett. 2003, 24, 1107–1113. [Google Scholar] [CrossRef]
  29. Davies, D.L.; Bouldin, D. A Cluster Separation Measure. IEEE Trans. Pattern Anal. Mach. Intell. 1979, 1, 224–227. [Google Scholar] [CrossRef] [PubMed]
  30. Rousseeuw, P.J. Silhouettes: A Graphical Aid to the Interpretation and Validation of Cluster Analysis. J. Comput. Appl. Math. 1987, 20, 53–65. [Google Scholar] [CrossRef]
  31. Caliński, T.; Ja, H. A Dendrite Method for Cluster Analysis. Commun. Stat. 1974, 3, 1–27. [Google Scholar] [CrossRef]
  32. Marissen, R.; Linsen, J. Variability of the Flexural Strength of Sheet Moulding Compounds. Compos. Sci. Technol. 1999, 59, 2093–2100. [Google Scholar] [CrossRef]
  33. Fitoussi, J.; Guo, G.; Baptiste, D. A Statistical Micromechanical Model of Anisotropic Damage for S.M.C. Composites. Compos. Sci. Technol. 1998, 58, 759–763. [Google Scholar] [CrossRef]
  34. Sayari, M.; Baptiste, D.; Bocquetand, M.; Fitoussi, J. Characterization and Damage Evolution of S.M.C Composites Materials by Ultrasonic Method. In Proceedings of the 12th International Conference on Composite Materials, Paris, France, 1999; Available online: http://www.iccm-central.org/Proceedings/ICCM12proceedings/site/papers/pap1129.pdf (accessed on 13 December 2017).
Figure 1. Testing setup for three-point bending with in-situ acoustic emission analysis.
Jcs 01 00018 g001
Figure 2. Tensile modulus of different SMC materials in different directions with respect to the movement of the conveyor belt.
Jcs 01 00018 g002
Figure 3. Compression modulus of different SMC materials in different directions with respect to the movement of the conveyor belt.
Jcs 01 00018 g003
Figure 4. Flexural modulus of different SMC materials in different directions with respect to the movement of the conveyor belt.
Jcs 01 00018 g004
Figure 5. Tensile strength of different SMC materials in different directions with respect to the movement of the conveyor belt.
Jcs 01 00018 g005
Figure 6. Compression strength of different SMC materials in different directions with respect to the movement of the conveyor belt.
Jcs 01 00018 g006
Figure 7. Flexural strength of different SMC materials in different directions with respect to the movement of the conveyor belt.
Jcs 01 00018 g007
Figure 8. Charpy impact strength of different SMC materials considered in different directions with respect to the movement of the conveyor belt.
Jcs 01 00018 g008
Figure 9. Results of clustering algorithms and the clusters in feature space.
Jcs 01 00018 g009
Figure 10. Relative accumulated energy of cluster one and cluster two and the force-deflection response.
Jcs 01 00018 g010
Figure 11. Micro computed tomography (µCT)-scan of damaged discontinuous glass fiber SMC specimen exposed to bending loading.
Jcs 01 00018 g011
Table 1. Initial feature space.
Peak Frequency (Hz) f p e a k
Frequency Centroid (Hz) f centroid = f U ( f ) d f U ( f ) d f
Weighted Peak Frequency (Hz) < f peak >   = f peak f centroid
Amplitude (dB) in Time Domain A
Partial Power 1…6 (%) P P 1 P P 6 = f 1 f 2 U 2 ( f ) d f   0 kHz 1200 kHz U 2 ( f ) d f
- P P 1 : f 1 = 0   kHz ,   f 2 = 150   kHz
P P 2 : f 1 = 150   kHz ,   f 2 = 300   kHz
P P 3 : f 1 = 300   kHz ,   f 2 = 450   kHz
P P 4 : f 1 = 450   kHz ,   f 2 = 600   kHz
P P 5 : f 1 = 600   kHz ,   f 2 = 900   kHz
P P 6 : f 1 = 900   kHz ,   f 2 = 1200   kHz
Table 2. Real fiber volume content and fiber length distribution of the six different sheet molding compounds (SMC) materials considered within this study.
Configuration123456
Measured Fiber Volume Content (FVC) (%)17 ± 225 ± 231 ± 217 ± 225 ± 231 ± 2
Fiber Length (mm)25.425.425.425.4 and 50.8 (6:5)25.4 and 50.8 (6:5)25.4 and 50.8 (6:5)

