Article

Effect of Laser Shock Peening on the Fatigue Performance of Q355D Steel Butt-Welded Joints

1
School of Mechanical and Automotive Engineering, South China University of Technology, Guangzhou 510640, China
2
National Engineering Research Center of Near-Net-Shape Forming for Metallic Materials, Guangzhou 510640, China
3
Guangzhou Shipyard International Corporation Limited, Guangzhou 511462, China
*
Authors to whom correspondence should be addressed.
J. Manuf. Mater. Process. 2025, 9(8), 273; https://doi.org/10.3390/jmmp9080273
Submission received: 7 July 2025 / Revised: 1 August 2025 / Accepted: 7 August 2025 / Published: 11 August 2025
(This article belongs to the Special Issue Progress in Laser Materials Processing)

Abstract

This study investigated the effect of laser shock peening (LSP) treatment on the fatigue performance of Q355D steel butt-welded joints. The results demonstrate that LSP sig-nificantly enhances joint fatigue resistance through gradient hardening in surface lay-ers, introduction of high-magnitude residual compressive stress fields, and micro-structural refinement. Specifically, microhardness increased across all joint zones with gradient attenuation of strengthening effects within an approximately 700 μm depth. LSP effectively suppressed residual tensile stress concentration in regions beyond 4 mm on both sides of the weld. Fatigue tests confirmed that LSP substantially extended joint fatigue life: by 113–165% in the high-stress region (250–270 MPa) and 46–63% in the medium-low-stress region (230–240 MPa). Fractographic analysis further revealed reduced fatigue striation spacing and lower microcrack density in LSP-treated speci-mens, reflecting the synergistic effect of residual compressive stress fields and micro-structural refinement in retarding crack propagation. This work substantiates LSP as an effective method for enhancing fatigue resistance in Q355D steel welded joints.

1. Introduction

Steel structures are widely used in heavy-duty fields such as buildings, bridges, and offshore platforms due to their high strength and lightweight properties. However, under complex cyclic loading, fatigue damage emerges as the predominant failure mechanism, with fatigue cracks predominantly originating at welded joints [1,2]. Consequently, improving the fatigue strength of welded joints is critically important for ensuring structural integrity in engineering applications. For welded joints of heavy-duty engineering structures, post-weld treatment methods are commonly adopted, such as TIG dressing, high-frequency mechanical impact (HFMI), shot peening, and other post-weld treatment techniques [3,4,5,6]. These methods improve fatigue strength by reducing geometric stress concentration factors or introducing residual compressive stress, but they face issues such as insufficient spatial accuracy, limited depth of microstructural strengthening, and risks of thermal damage [7,8]. As a high-energy beam surface strengthening and modification technology, laser shock peening (LSP) induces plasma shock waves on metal surfaces through high-power-density, short-pulse lasers, enabling grain refinement, residual stress field modulation, and fatigue life enhancement without thermal input. Compared with traditional surface-strengthening technologies, laser shock peening technology offers significant advantages, including ultra-high pressure peaks, deep penetration capability, and spatially precise controllability [9,10,11,12,13].
Currently, the potential beneficial effects of LSP on the fatigue resistance of metallic materials received considerable attention. For example, Zhou, et al. [14] investigated the effect of LSP on the high-cycle fatigue performance of 1Cr18Ni9Ti/GH1140-dissimilar metal welded joints. The study found that LSP significantly enhanced the high-cycle fatigue limit of 1Cr18Ni9Ti/GH1140-dissimilar welded joints through the synergistic effects of introducing high-magnitude residual compressive stress, grain refinement, and gradient plastic deformation. Li, et al. [15] studied the influence of laser shock peening (LSP) on the bending fatigue performance of U75VG rail flash butt-welded joints. It was discovered that LSP treatment increased the bending fatigue limit of U75VG rail flash butt-welded joints by 6.7%, and significantly extended the fatigue life under low stress by introducing deep residual compressive stress, substantially increasing dislocation density, and optimizing the surface stress state. Thangamani, et al. [16,17] conducted a series of studies on wire arc additive-manufactured stainless steel, demonstrating that LSP can significantly improve the material’s tensile strength, yield strength, and compressive strength. Recently, Jin, et al. [18] adopted an experimental–numerical simulation method to study the mechanism of LSP on the fatigue performance of FV520B steel; they focused on analyzing the role of LSP-induced residual stress fields in inhibiting fatigue crack initiation and propagation. The authors proposed that LSP enhances fatigue strength primarily through residual compressive stress, which reduces K e f f to suppress crack initiation and propagation, thereby extending fatigue life. Therefore, LSP treatment is considered a time-suitable method for solving fatigue-related problems [19].
Q355D low-alloy high-strength steel has become one of the preferred materials for heavy-duty engineering applications subjected to critical loads, such as large bridges, building structures, and heavy machinery, due to its excellent tensile strength, high yield strength, outstanding toughness, and good impact resistance [20,21]. Currently, welding is one of the most common steel connection techniques in construction and engineering [22]. However, temperature variations during the welding process cause different solid-state phase transformations in the welded region, resulting in a heat-affected zone (HAZ) between the weld zone (WZ) and base metal (BM) [23]. This zone is often a preferential location for fatigue crack initiation, leading to a significant degradation in the overall fatigue strength of the welded joint compared to the base metal [24], constituting a key factor restricting structural safety. Although Q355D possesses a good engineering application base and weldability, significant attention is still required for the fatigue issues of its welded joints under cyclic loading [25]. Current research on improving the fatigue performance of welded joints using laser shock peening (LSP) primarily focuses on aluminum alloy or dissimilar metal welded joints [26]. Although these studies confirmed the effectiveness of LSP, they fail to systematically reveal the influence of LSP on the fatigue behavior of typical high-strength low-alloy steel (such as Q355D) welded joints. For high-strength low-alloy steel welded joints such as Q355D, which are widely used in heavy-duty engineering, research on LSP technology exhibits a significant gap, lacking in-depth understanding of its effects on fatigue performance enhancement and the underlying mechanisms.
To address the research gap on LSP for high-strength low-alloy steel welded joints, this paper studies the effect of LSP on the fatigue performance of Q355D butt joints through an experimental–simulation coupled method, establishes a progressive simulation model from welding the residual stress field to the LSP shock response, and reveals the influence of LSP on the surface and depth-direction hardness of welded joints. The results indicate that laser shock peening treatment significantly affects the near-surface and depth hardness as well as residual stress distribution of Q355D welded joints, achieves substantial fatigue life improvement in high-stress zones under axial tension–compression loading, and provides valuable information for enhancing the fatigue strength of Q355D welded joints in engineering practice.

2. Materials and Methods

2.1. Specimen Design

This study employed an 8 mm thick high-strength low-alloy structural steel Q355D as the experimental material. Forty-two dog bone specimens were designed across three groups: base metal specimens, welded joint specimens, and laser surface-strengthened specimens (Table 1). Butt welds adopted a “V-shaped” double-bevel groove weld. Specimens were cut from welded plates using wire electrical discharge machining, then ground and polished to remove weld reinforcement awaiting post-weld LSP treatment. Specimen sampling locations and dimensions are shown in Figure 1. The welding wire grade for Q355D was ER100S-G. The chemical compositions of the base metal and welding wire are listed in Table 2. Experimental materials were welded using K-TIG welding with a welding current of 120–170 A, welding voltage of 10.5–11.9 V, and welding speed of 50–100 cm/min. The yield strengths of Q355D and ER100S-G were 730 MPa and 397 MPa, respectively. Parameters of Q355D were tested according to (GB/T 228.1—2021).

2.2. LSP Experiment and Parameter Determination

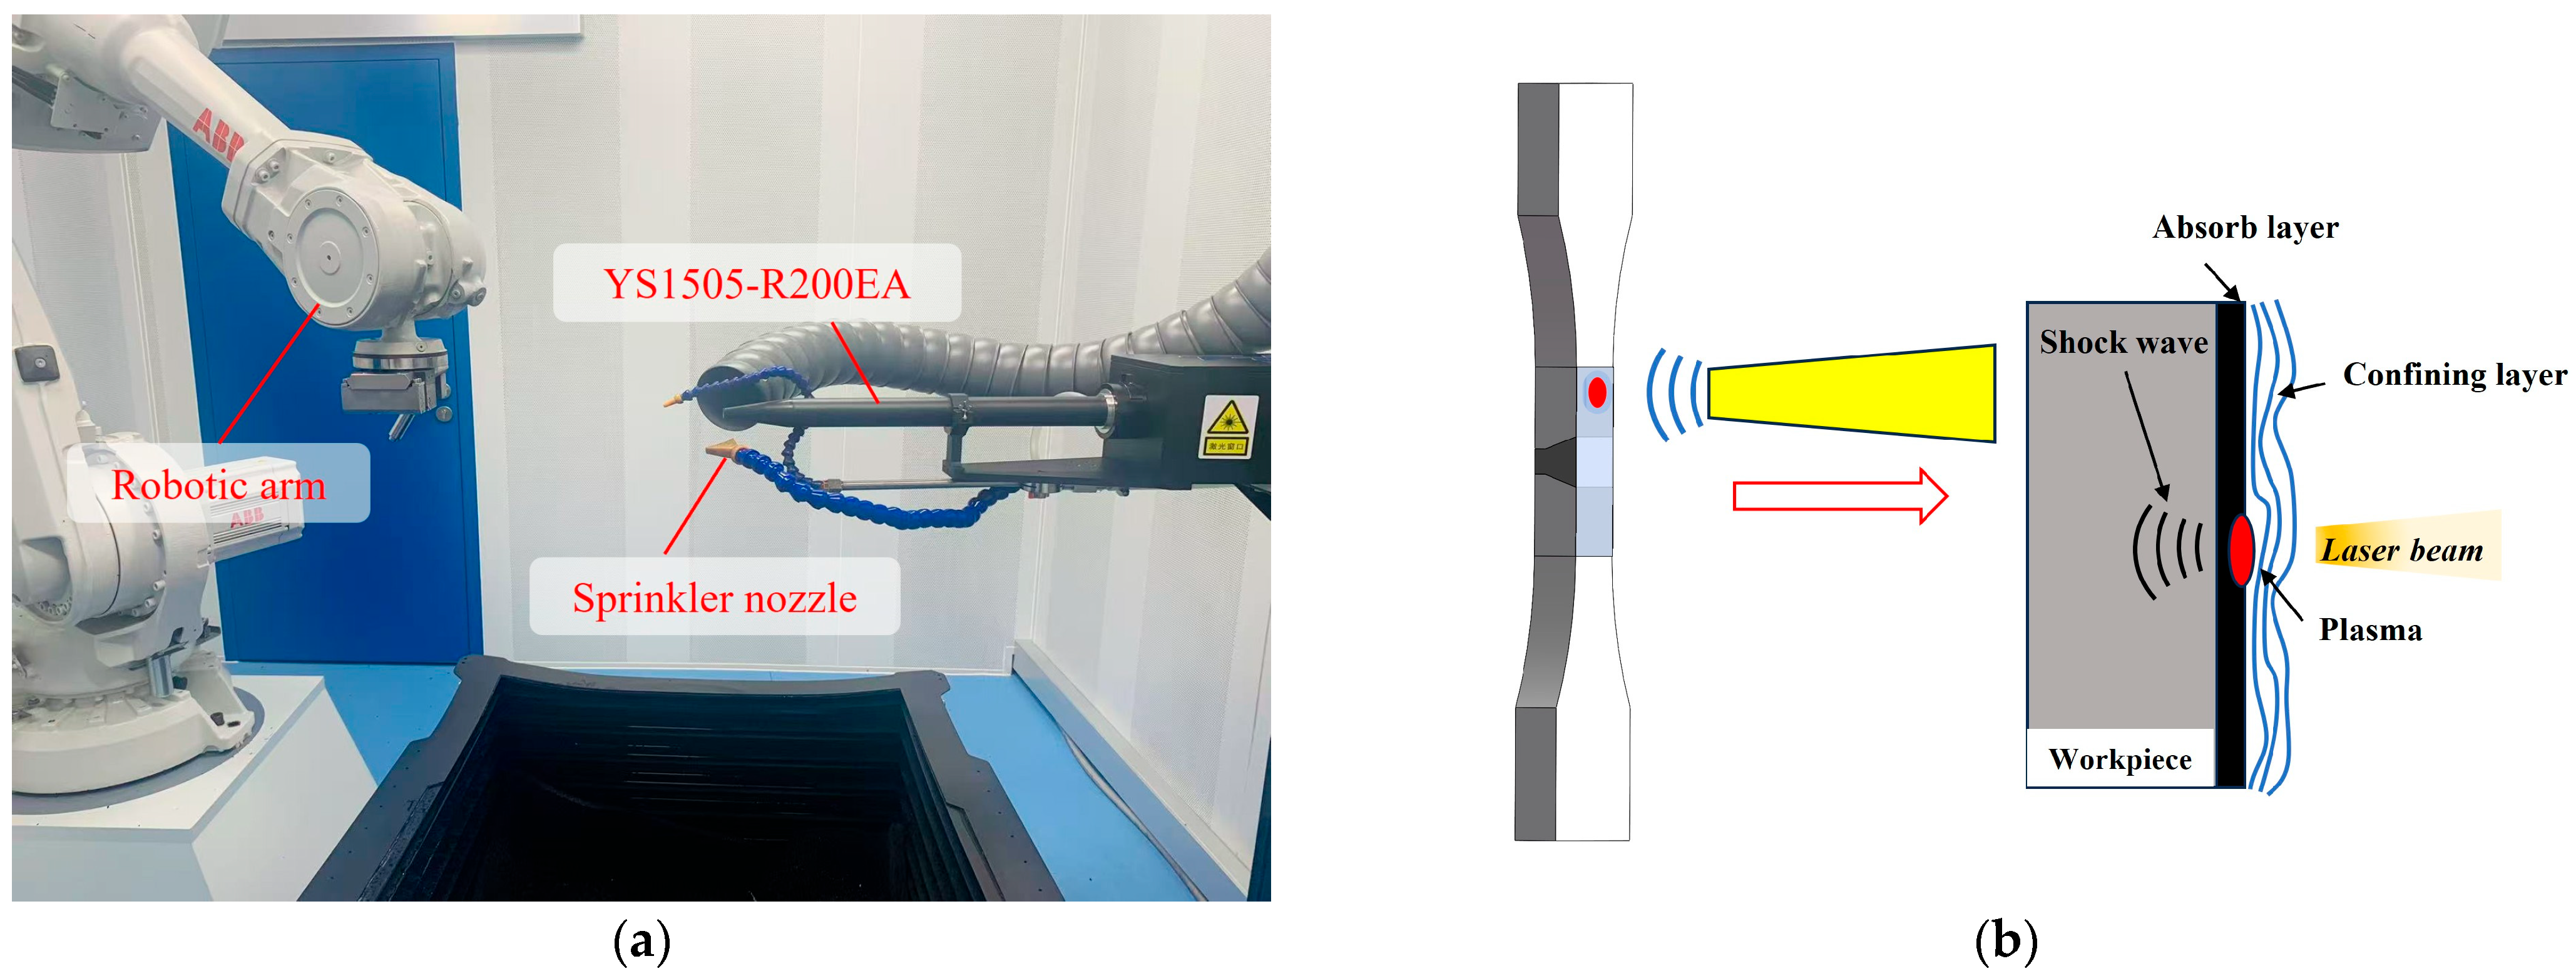
The laser shock peening equipment was the YS1505-R200EA model produced by Xi’an Tyrida Optoelectronic Technology Co., Ltd (Xi’an, China). The specimen’s upper surface was defined as the weld face reference plane, while the lower surface corresponded to the weld root backside. The laser beam was vertically irradiated onto both surfaces and full LSP treatment was applied to both the upper and lower surfaces, with treatment areas covering the weld face zone and root back zone. Current research indicates that the selection of absorption and confinement layers is crucial, as they influence shock pressure and duration. Excessively thick or thin confinement layers reduce peak pressure and affect the magnitude/distribution of residual stress [19]. Comparing existing studies [27,28], this experiment selected approximately 100 μm-thick 3M black tape as the absorption layer, and a water layer approximately 1–2 mm thick covered the target as a confinement layer. The specimen was moved along the x-y axes using a programmed robotic arm. The schematic diagram of the laser shock peening equipment and principle is shown in Figure 2.
Laser processing parameters are a crucial part of LSP experimental setup, as appropriate parameters optimize the strengthening effect. Johnson, et al. [29] verified that the Hugoniot elastic limit ( σ H E L ) represents the maximum stress a metal can withstand under high-velocity impact. If the impact stress exceeds this value, the material transitions from elastic to plastic strain, generating residual stress. The calculation formula for σ H E L is as follows:
σ H E L = σ D y n 1 μ 1 2 μ .
In the above formula, μ is the Poisson’s ratio of Q355D material, taken as 0.3. The predictive accuracy of the σ H E L theoretical model for materials is limited by the reliability of the dynamic yield strength value [30]. Li, Wei et al. [31] found that under high strain rates, the dynamic yield strength ( σ D y n ) of Q355D steel increases by approximately 58% compared to its static yield strength. Thus, the assumed dynamic yield strength of Q355D is 627.9 MPa. Based on preliminary calculations, the σ H E L of experimental material Q355D is 1098.7 MPa. Peyre, et al. [32] demonstrated that the optimal peak shock pressure ( P m a x ) during laser shock peening should range between 2 σ H E L and 2.5 σ H E L . Therefore, P m a x for Q355D should be between 2197.6 MPa and 2747 MPa. Wang, et al. [33] used a plasma expansion model to estimate peak pressure. The peak pressure formula is given below:
P m a x = 0.01 α 2 α + 2 2 Z 1 Z 2 Z 1 + Z 2 I 0
Z = 2 Z 1 Z 2 Z 1 + Z 2 .
In the P m a x estimation formula proposed by Wang, et al., the ratio of plasma thermal energy to internal energy (α) typically ranges from 0.1 to 0.2. The acoustic impedance resistance of Q355D ( Z 1 ) is 4.54 × 10⁶ g cm−2 s−1, while the confinement layer Z 2 (water in this test) has an acoustic impedance resistance of 0.165 g cm−2 s−1. Thus, the composite acoustic impedance resistance is 0.318 × 10⁶ g cm−2 s−1. Substituting P m a x   = 2.1976 − 2.747 GPa, Z = 0.318 g cm−2 s−1, and α = 0.1 into Equation (2), the optimal laser power I 0 is determined to be between 4.84 and 7.57 GW/cm2. Shang, et al. [34] further discussed the relationship between incident laser average power I 0 and laser pulse energy E, as shown in the formula below:
I 0 = 4 E τ π d 2 .
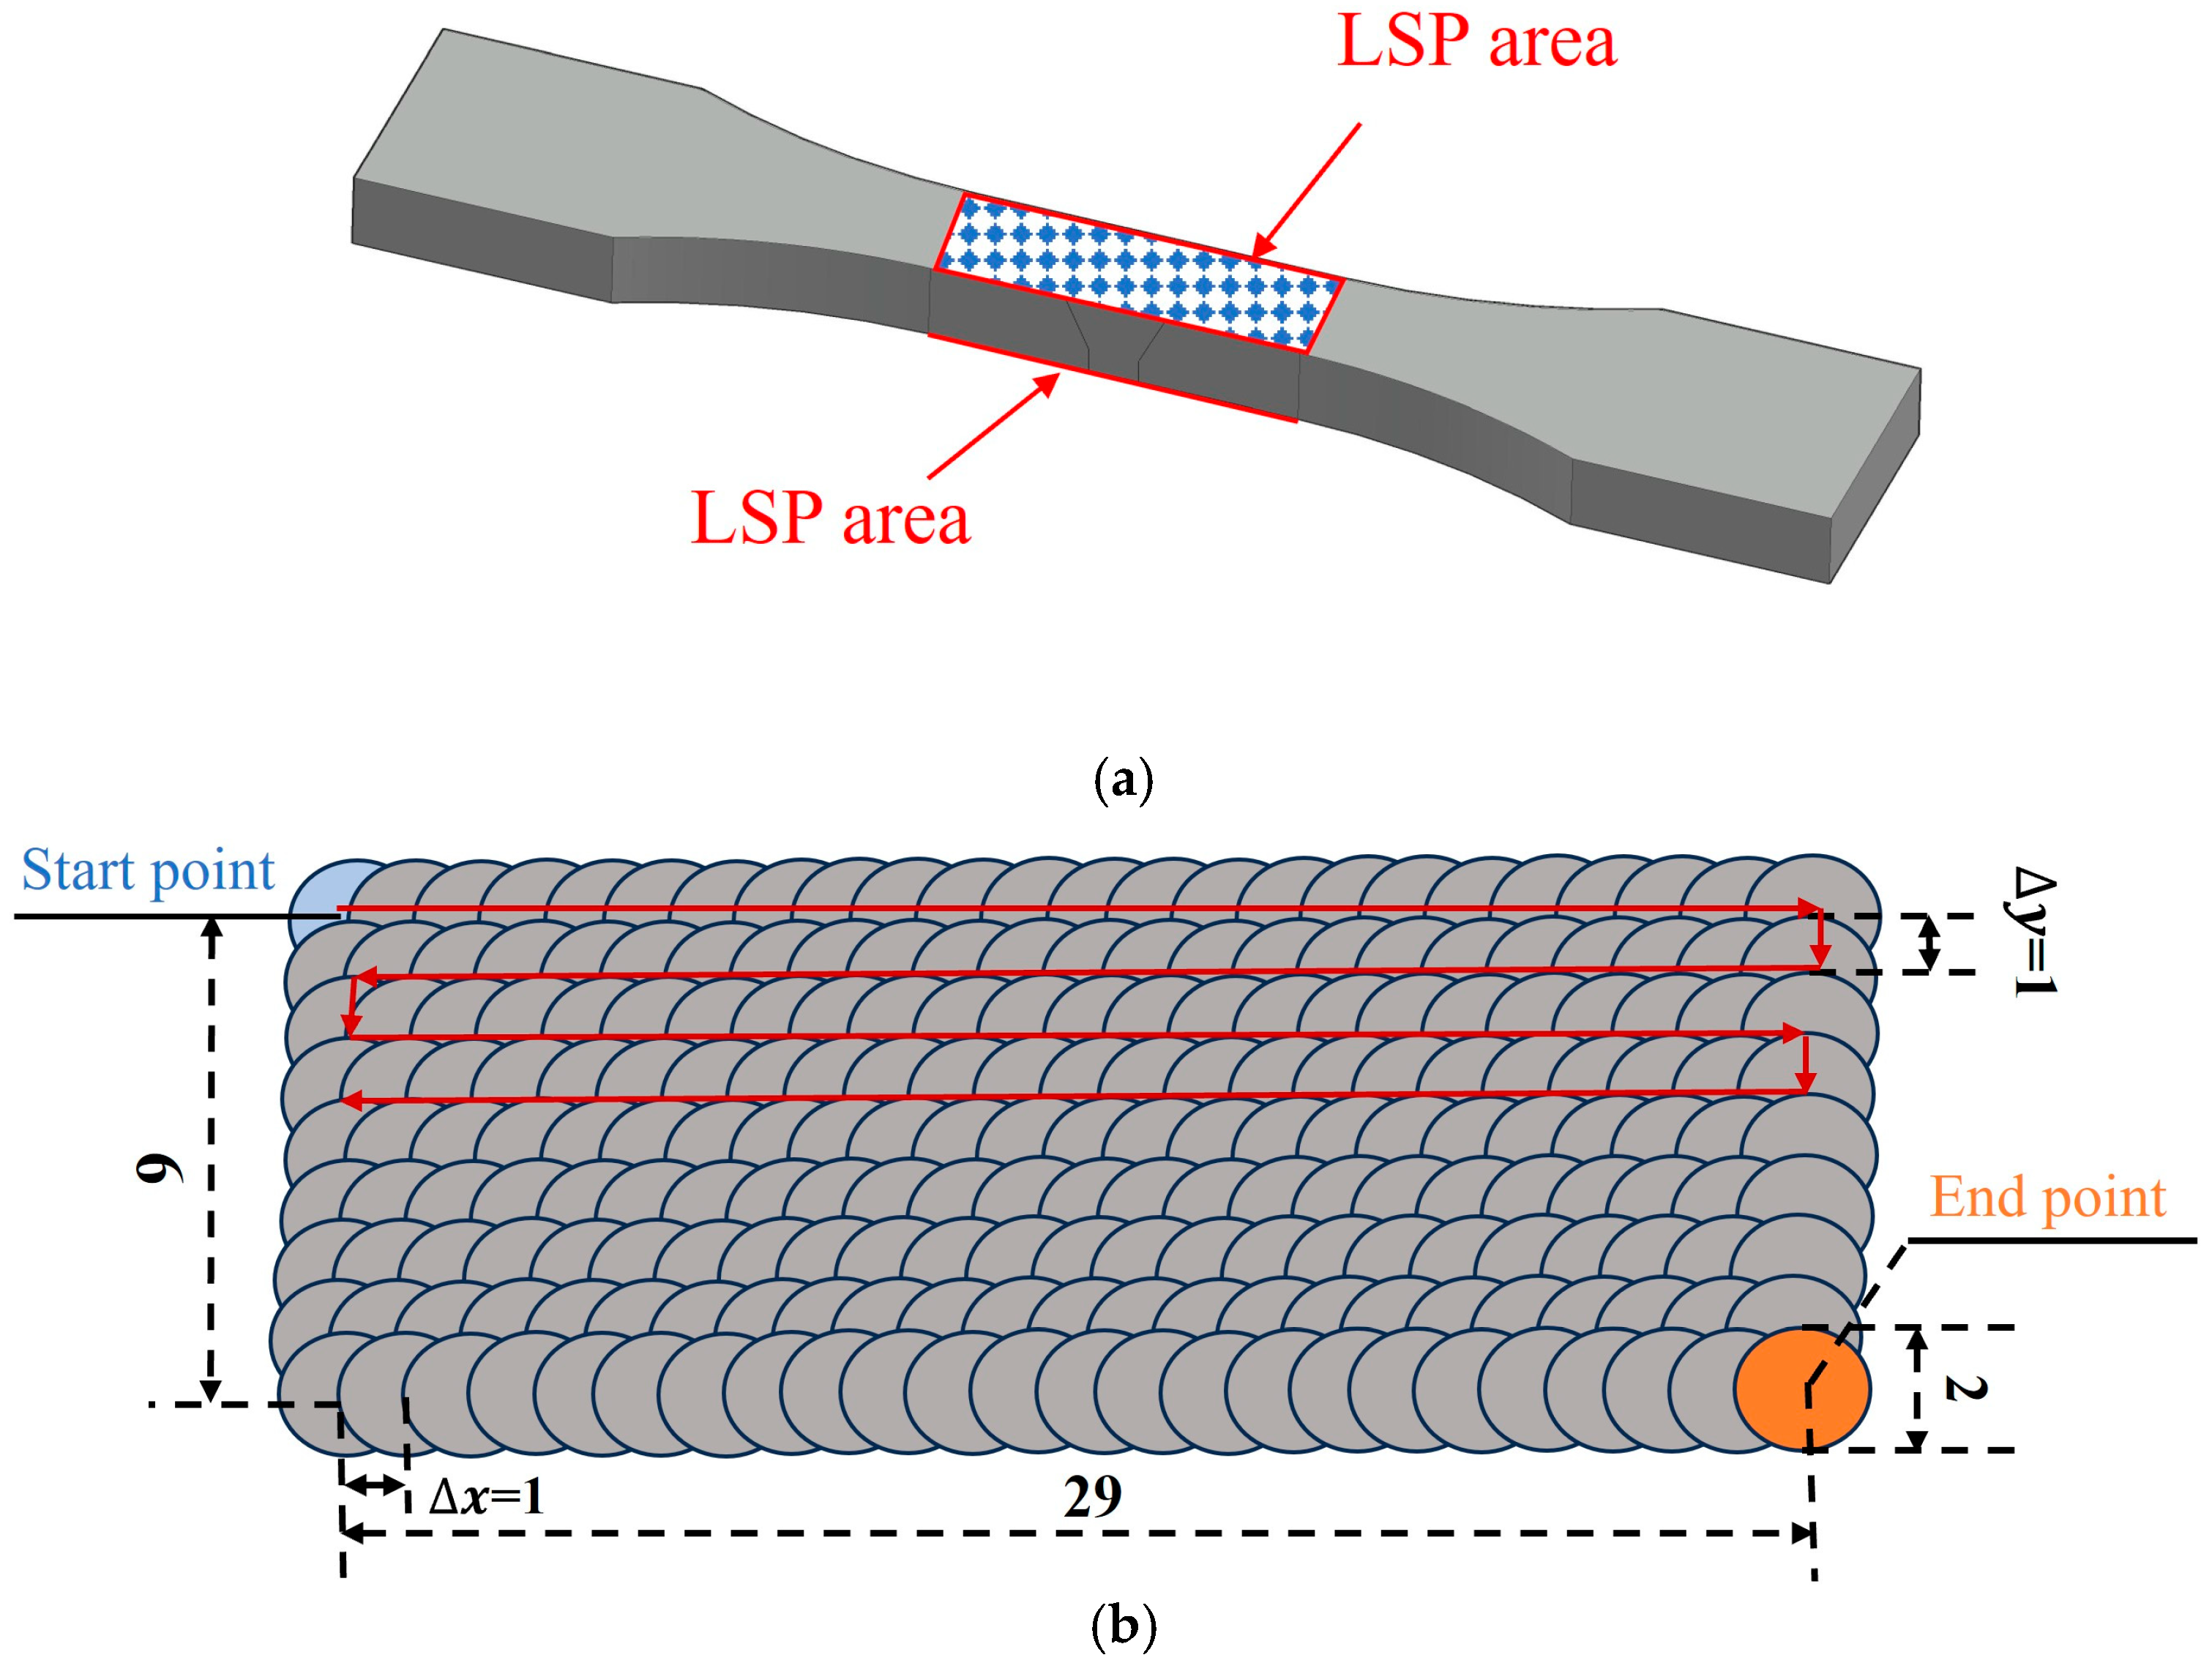
In the formula, τ is the laser pulse width in nanoseconds (ns), laser pulse energy (E), in Joules (J), and spot diameter (d) in centimeters (cm) (this test selected a spot diameter of 2 mm). Based on the above parameters, the laser pulse energy (E) range is determined to be 3.04–4.75 J. Considering practical conditions and the experimental setup, the laser pulse energy for LSP experiments was set between 3 and 5 J and this study selected a laser pulse energy of 5 J. Recent studies [33,35] reveal that an overlap rate of 50% provides superior surface roughness and hardness distribution uniformity in specimens. Thus, this experiment adopted a 50% spacing overlap. The LSP process parameters are listed in Table 3, while the treatment zone and scanning path are illustrated in Figure 3.

2.3. Material Performance Testing and Chanracterization

Microhardness can indirectly reflect the local yield strength and plastic deformation capacity of materials, and its distribution gradient significantly influences fatigue crack initiation [9]. Microhardness testing was performed on the base metal, welded joints, and laser shock peened (LSP) joints using a microhardness tester (SCTMC HV-50). Hardness tests were conducted along the weld centerline on both upper and lower surfaces of welded joint specimens and LSP-treated welded joint specimens, with 20 points tested at 2 mm intervals. In the depth direction of the specimens, 16 points were tested at 0.1 mm intervals. During testing, the temperature was 25 °C, load was 98 N, and duration was 15 S. Fatigue fracture morphology was observed using a Quanta200 scanning electron microscope to comparatively analyze morphological differences among base metal, welded joint, and LSP-treated joint specimens, as well as the micro-fatigue effects of LSP on welded joints.
Fatigue tests were conducted in the INSTRON 8801 electro-hydraulic servo fatigue testing machine. Force-controlled loading was applied during testing with a constant-amplitude sinusoidal waveform at a frequency of 20 Hz and stress ratio of R =   S m i n / S m a x = 1 . The fatigue limit was determined using the multi-specimen discrete stress method. Each group of specimens underwent constant-amplitude fatigue testing at fixed stress levels S m a x . Initial stress levels were estimated based on material tensile strength, with subsequent levels decreasing by 3–5%. If a specimen did not fail within 106 cycles, it was deemed to meet the fatigue limit requirement at that stress level. Testing was terminated when abnormal specimen fracture occurred or the cycle count reached 106.

2.4. Finite Element Analysis

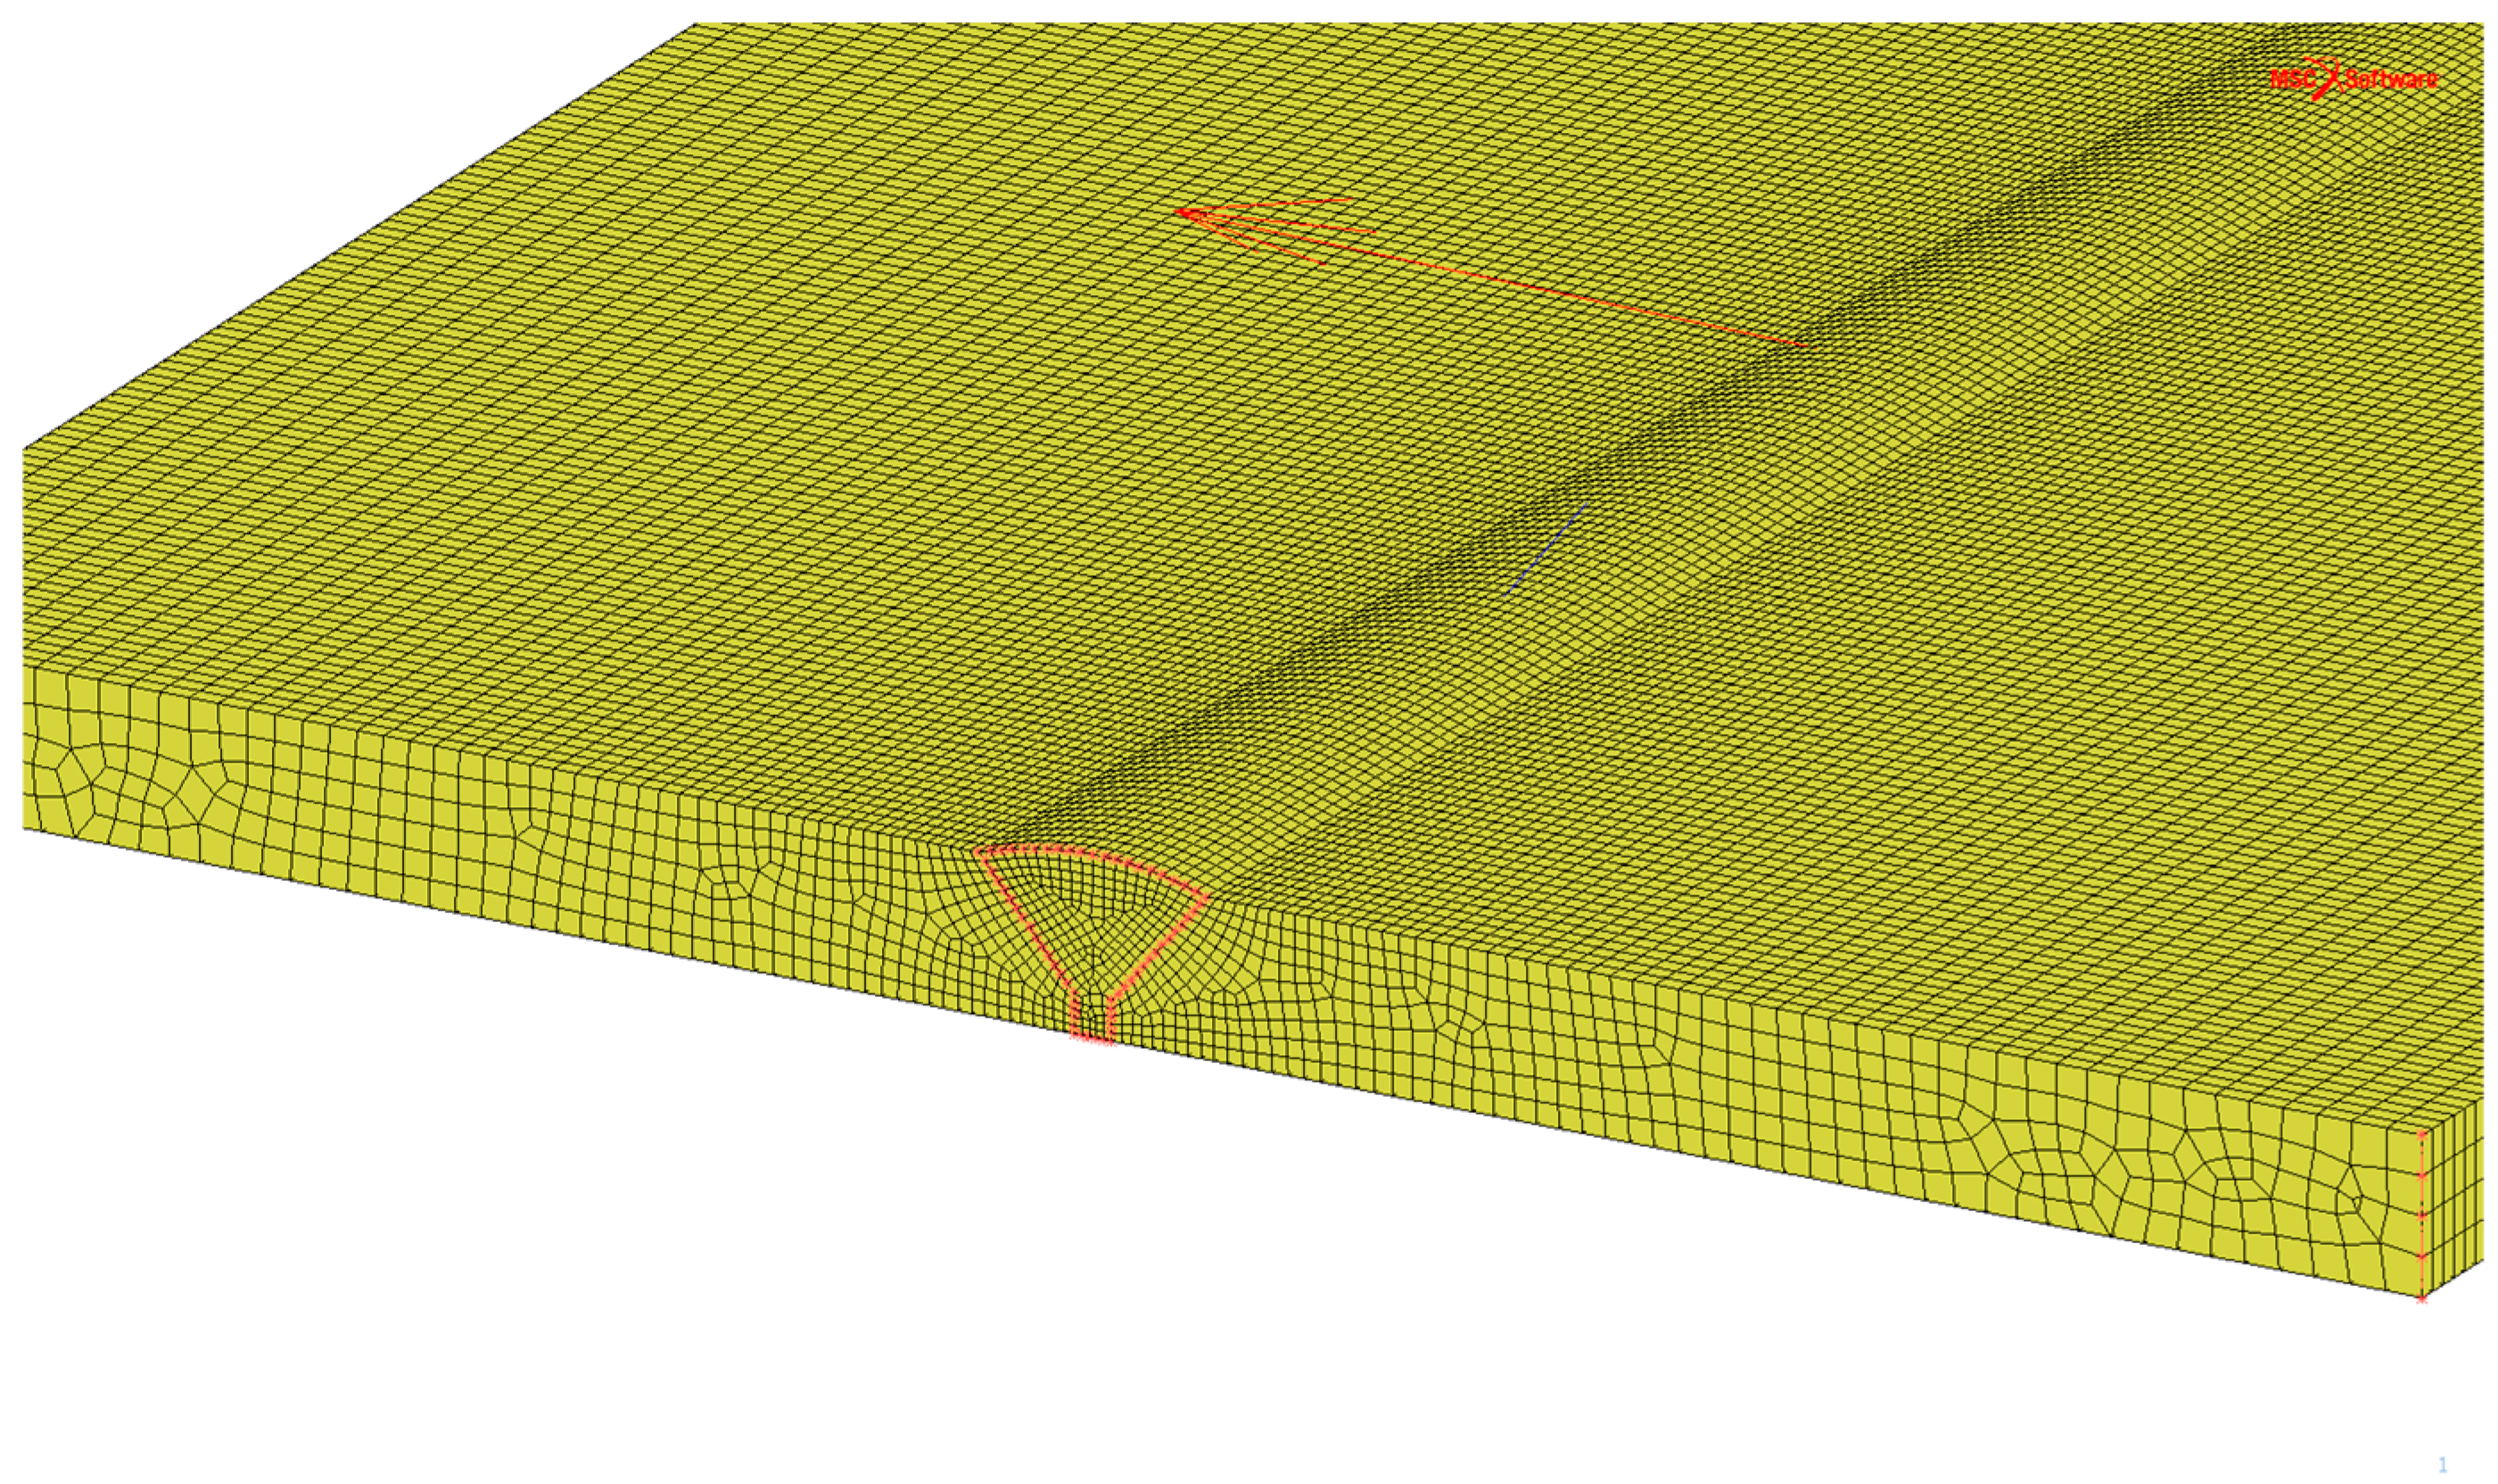
To predict the residual stress distribution in Q355D steel butt-welded joints, this study established a three-dimensional thermo-mechanical-coupled finite element model using commercial software MSC.MARC. First, a 3D solid model was created based on actual workpiece geometry. To accurately capture steep temperature and stress–strain gradients within the weld and heat-affected zone (HAZ), a refined mesh was predefined in these regions (as shown in Figure 4), while relatively coarse meshes were adopted in areas distant from the weld to improve computational efficiency. The final model comprised 189,342 nodes and 147,600 hexahedral elements. Second, key thermophysical and mechanical properties of base metal Q355D and filler metal ER100S-G—including density, thermal expansion coefficient, Young’s modulus, specific heat capacity, thermal conductivity, yield strength, and related parameters—were calculated as functions of temperature and exported via JMatPro 7.0 software. These data were input into MSC.MARC 2020 in tabular form to define temperature-dependent nonlinear material behavior. Welding heat input was simulated using the widely adopted double-ellipsoidal distributed heat source model (Goldak heat source). The shape parameters (major axis, minor axis, peak power and location factor) of the front and rear ellipsoids in this model were calibrated by matching simulated molten pool morphology (weld width, penetration depth) with actual weld metallographic profiles. Welding process parameters strictly followed actual welding procedures: arc voltage U = 11.1 V, welding current I = 120 A, welding speed v = 50 mm/s, and thermal efficiency η = 0.7. Finally, a sequentially coupled method simulated the welding process and subsequent cooling. A convective heat transfer coefficient (0.004 W/mm2) was defined on the workpiece surface with an ambient temperature of 25 °C. The temperature history from thermal analysis was applied as a body load to the structural model. To simulate actual clamping, all degrees of freedom were constrained at nodes on both end faces along the workpiece length. The filler metal was defined as an independent material model and activated via the “birth-and-death element” technique in corresponding welding steps. The mechanical analysis employed an isotropic hardening model following the Mises yield criterion. Calculations continued until the entire model cooled to a uniform room temperature (25 °C), at which point the residual stress field was extracted.
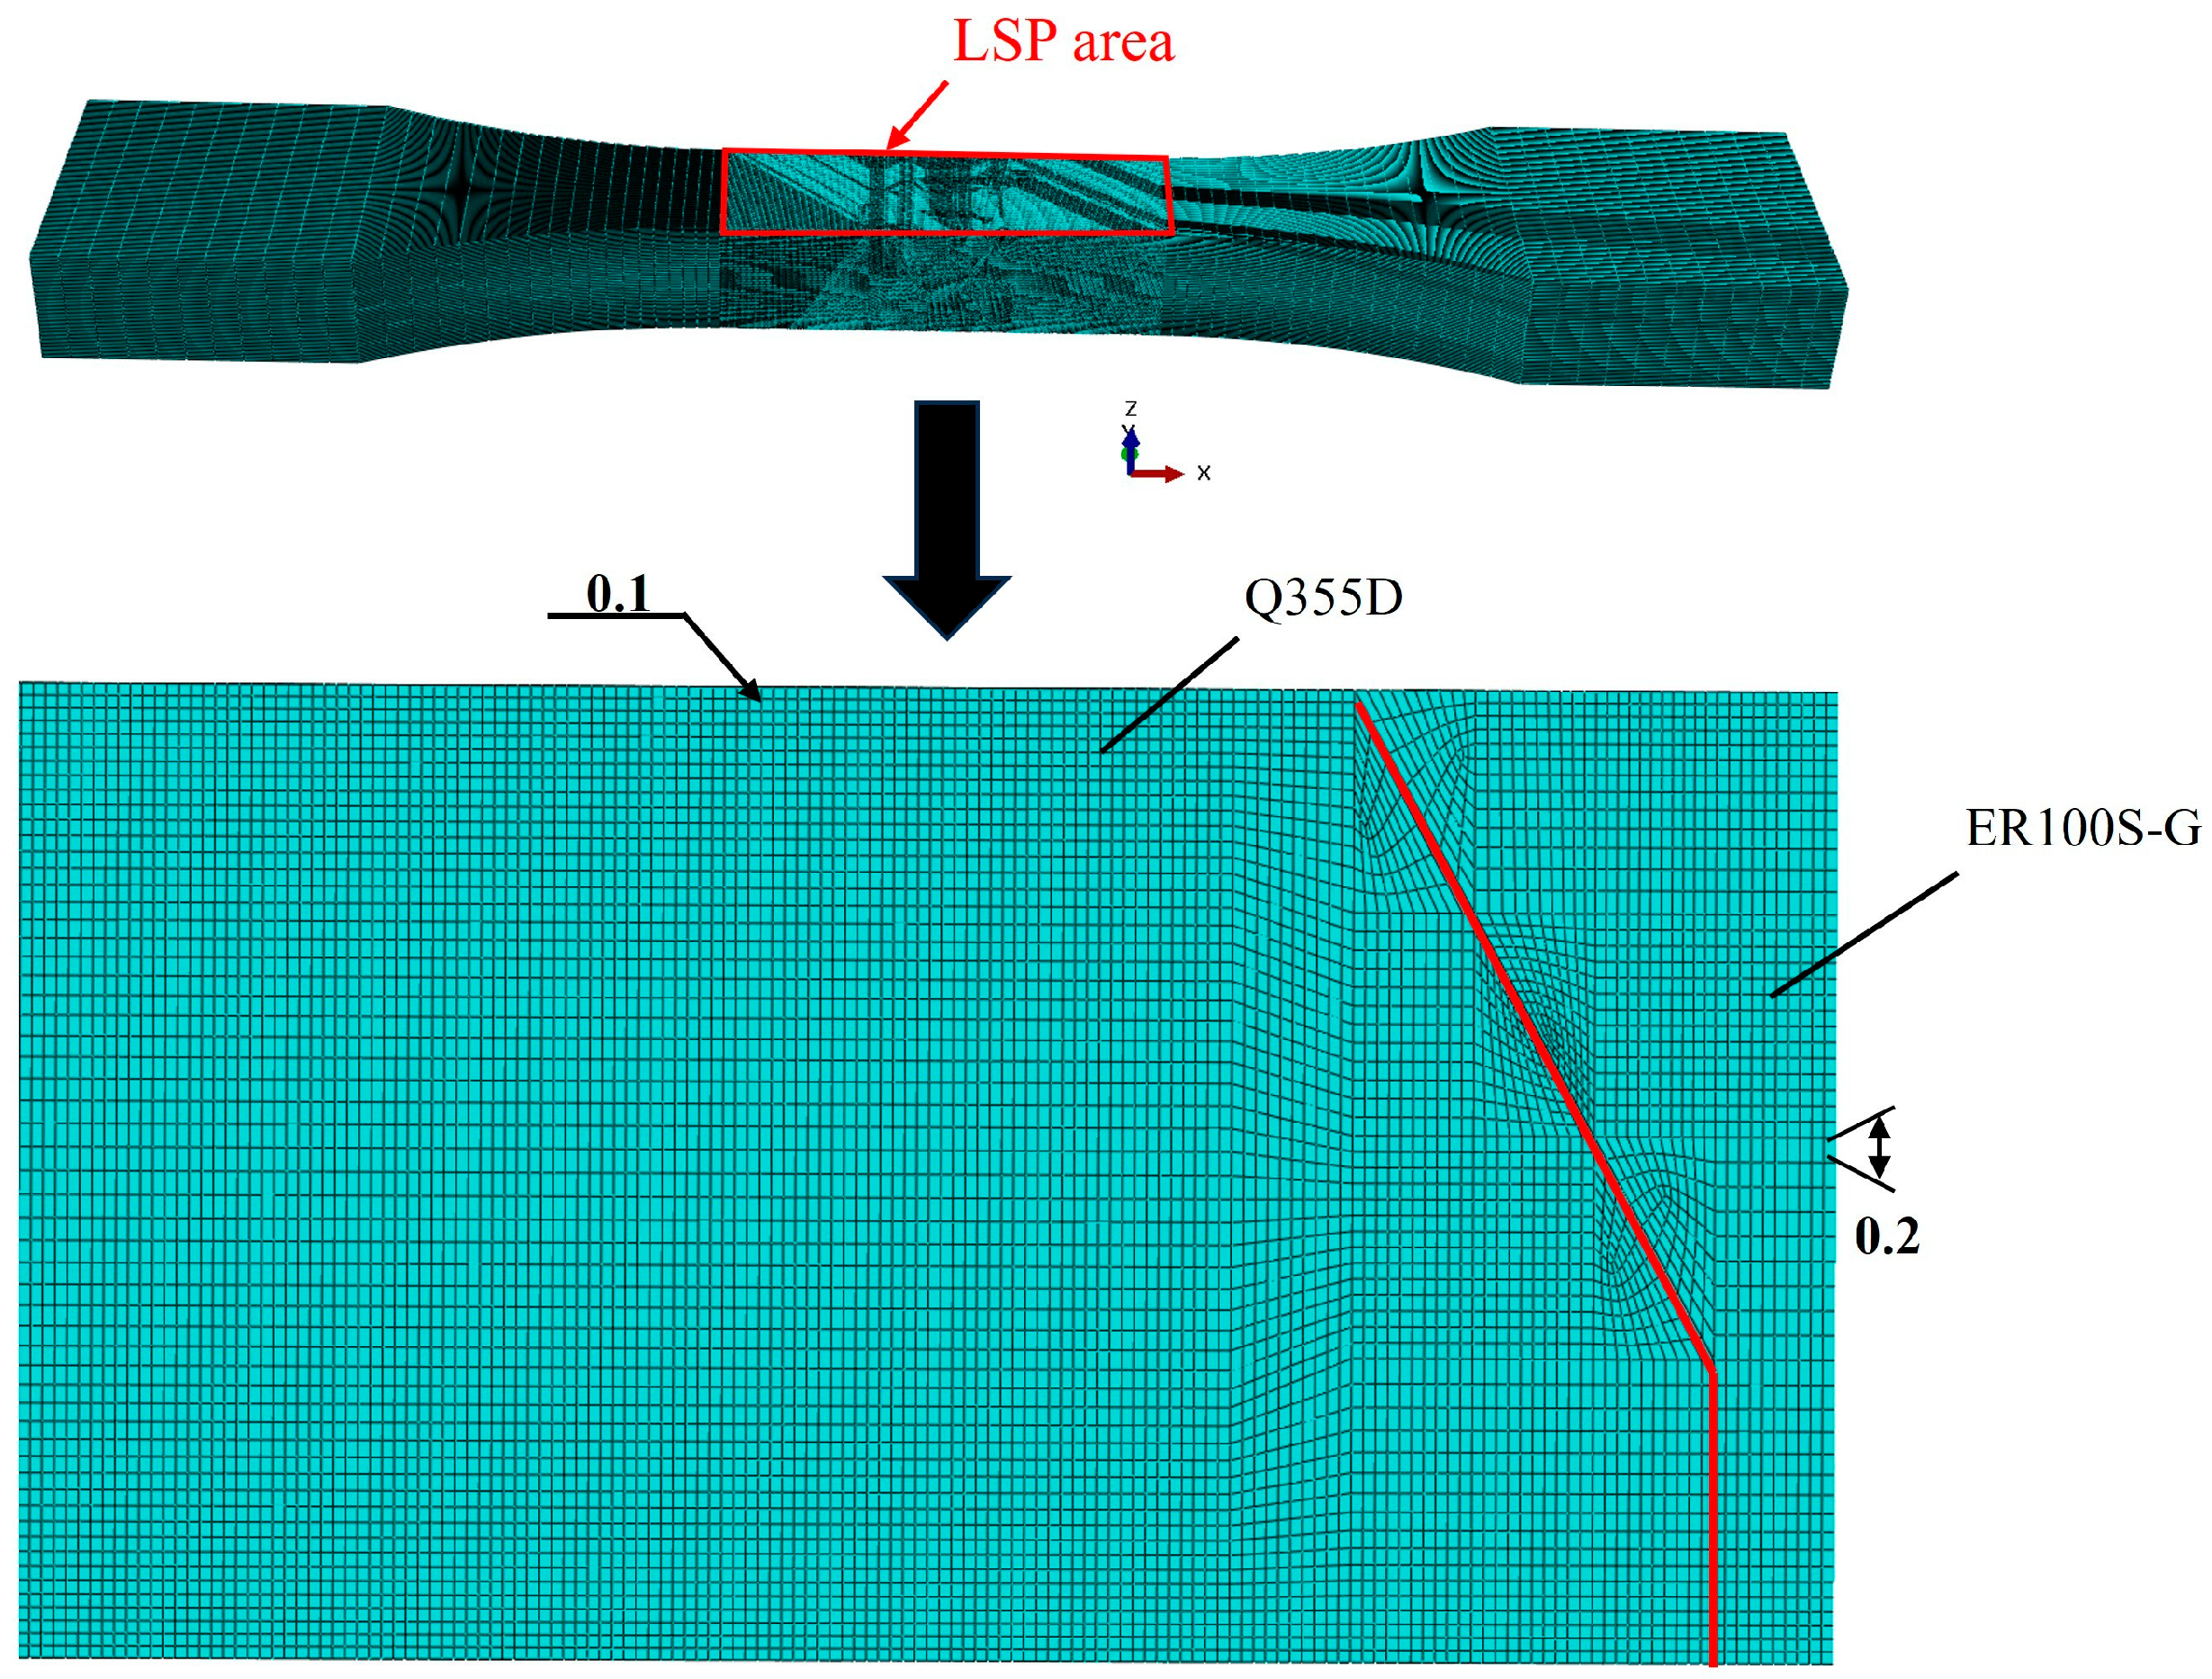
To evaluate the regulatory effect of laser shock peening (LSP) on welding residual stress, a 3D finite element model for LSP was established based on the ABAQUS/Explicit platform. The mesh configuration and treatment region are illustrated in Figure 5, meshed with 2,051,900 reduced-integration hexahedral elements (C3D8R). Local mesh refinement (minimum size 0.1 mm) was applied in the region beneath the laser shock path to accurately capture high-gradient plastic deformation. The welding residual stress field calculated by MSC.MARC was imported as a predefined field. Given the ultra-high strain rates involved in LSP, the Johnson –Cook constitutive model was adopted to characterize material dynamic plastic behavior, where its strain rate sensitivity coefficient (C) effectively quantifies shock response. The Johnson–Cook parameters for Q355D were derived from literature data fitted for Q355 steel [31]. For ER100S-G filler metal—which lacks published dynamic constitutive data—parameters were modified from aerospace high-strength steel AISI 4340 [36] (AMS 6414) by applying a yield strength reduction factor (0.91) to strain-hardening parameter A, increasing the hardening exponent n by 15% to compensate for low-carbon effects, and decreasing strain rate coefficient C by 12% to counteract strain rate sensitivity suppression in high-manganese filler metal [37,38,39]. Johnson–Cook parameters for Q355D and ER100S-G are listed in Table 4.
In current LSP [40] finite element analysis, two methods are generally adopted to obtain residual stress fields: (1) dynamic explicit analysis studying shock wave propagation and (2) static analysis calculating residual stress fields using implicit algorithms. This experiment involved numerous shock loads, employing multiple dynamic explicit steps to estimate the post-LSP residual stress field. A Fortran subroutine (VDLOAD type) generated non-uniform spatial–temporal loading P x ,     y ,     t to precisely locate shock positions. The P = f x ,     y   distribution was adjusted to accurately fit experimental surface deformation for the given laser intensity I (W/cm2).
P x ,   y ,   t = P 0 t 1 1 2 x 2 + y 2 r 2
where P 0 t is peak pressure and r is the spot radius. Transverse residual stress S11 parallel to the LSP processing direction and longitudinal residual stress S22 perpendicular to the LSP direction along identical paths before/after LSP were extracted to analyze shock strengthening effects.

3. Results

3.1. Finite Element Modeling

3.1.1. Welding Residual Stress Distribution

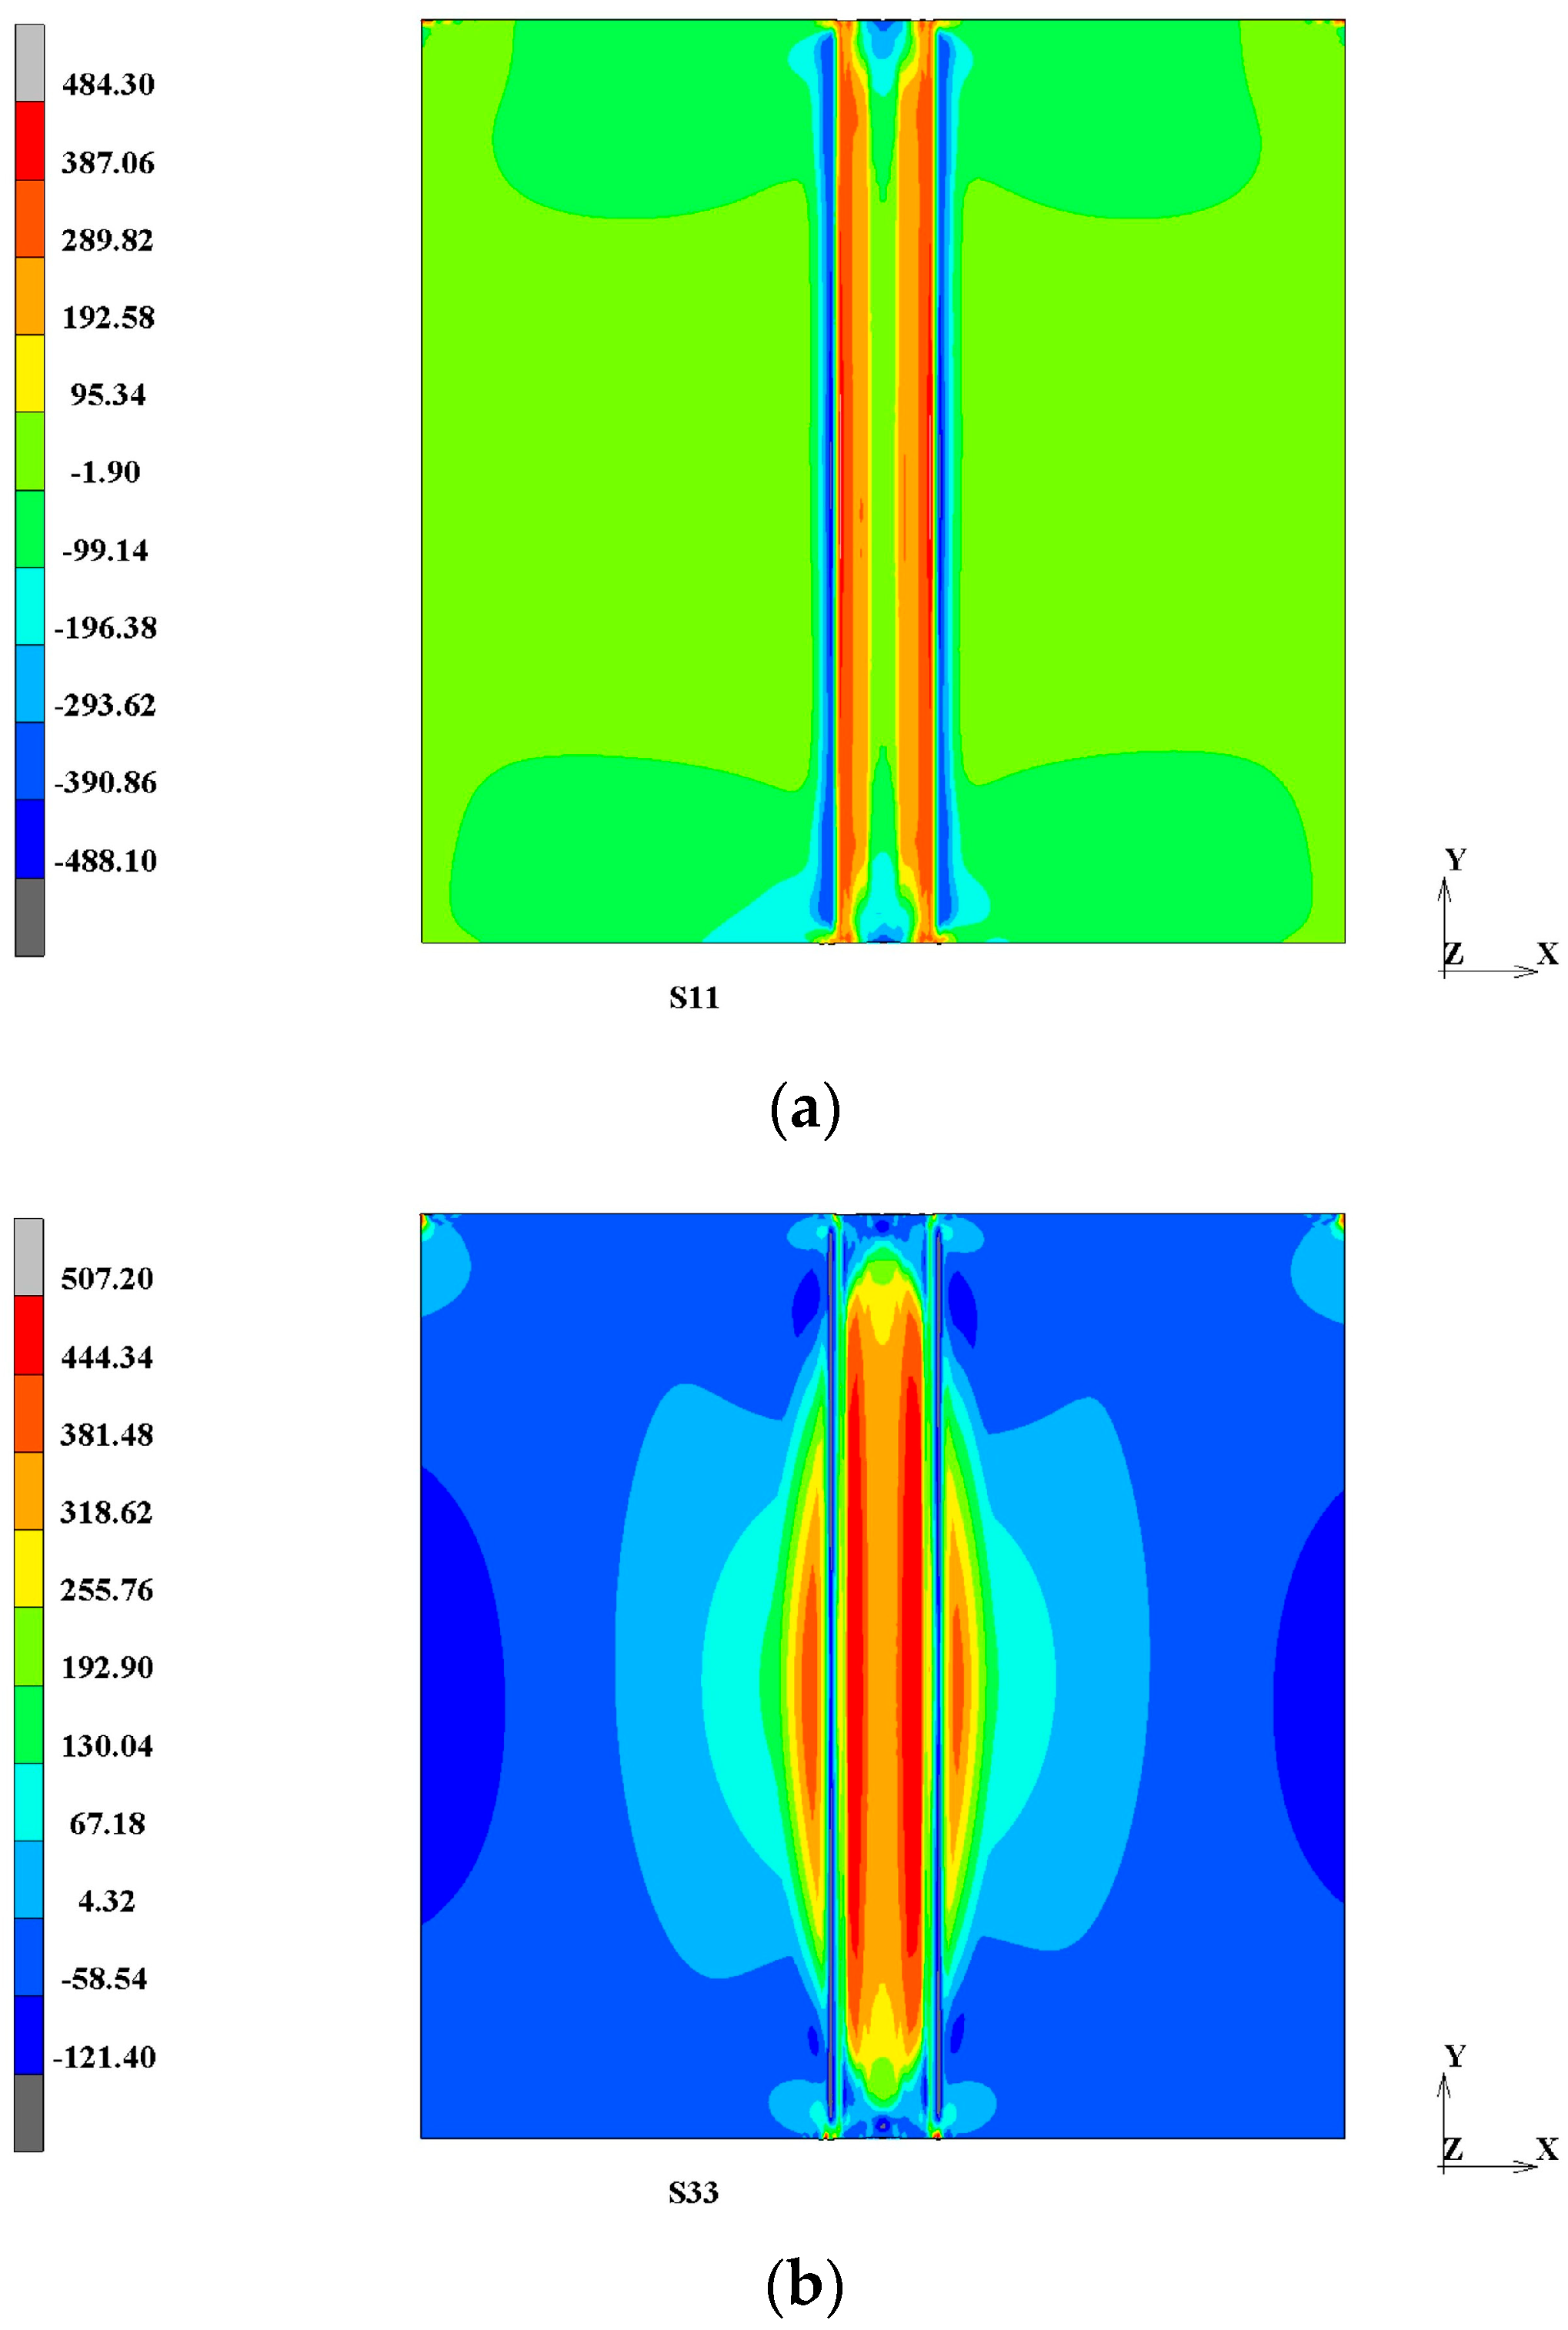
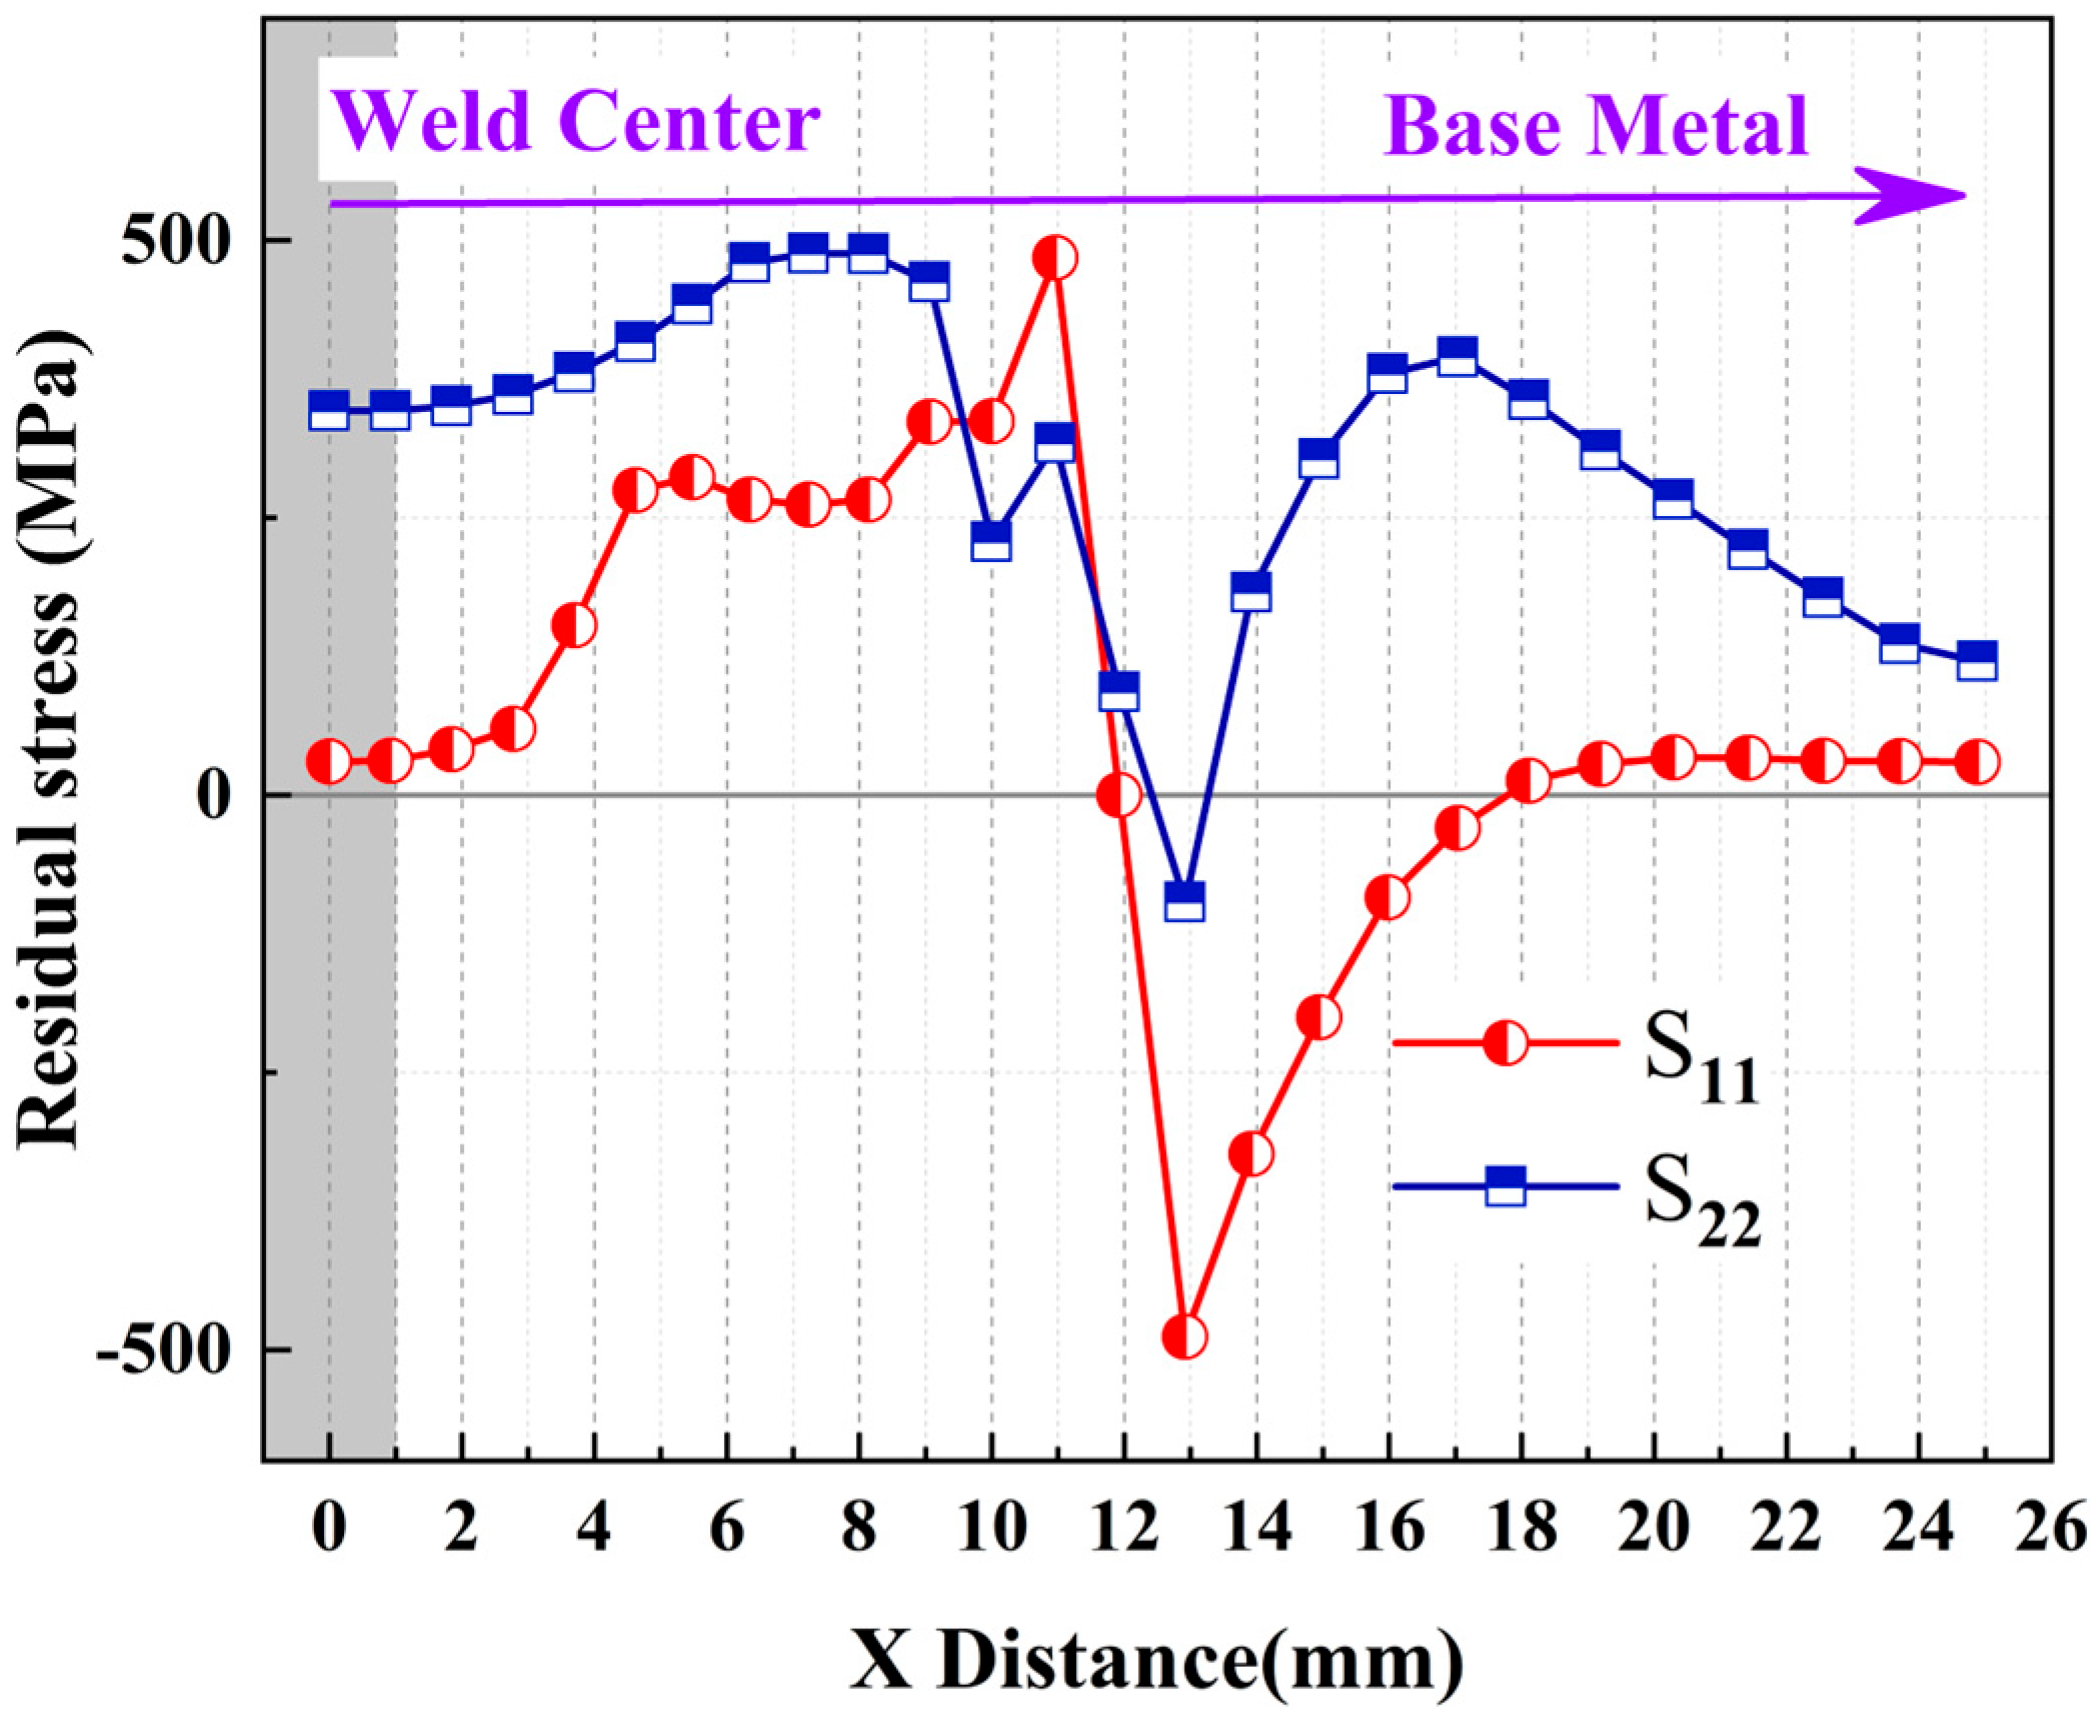
The contour plot of welding residual stress distribution is shown in Figure 6. Simulation results indicate that after Q355D butt welding, significant residual stress gradients exist in the weld and adjacent regions. Figure 7 further displays the distribution curves of transverse residual stress (S11) perpendicular to the weld (X-direction) and longitudinal residual stress (S22) parallel to the weld (Y-direction) along the path from the weld centerline toward the base metal on the specimen surface.
The distribution characteristics of welding residual stresses, particularly the high-magnitude tensile stresses near the weld and heat-affected zone (HAZ) and their associated fatigue risks, constitute a key focus in the study of mechanical behavior of welded structures. Existing studies [41,42,43] on Q345/Q355 steel series consistently report significant high-magnitude longitudinal residual tensile stresses in the weld center region (peak range: 370.9–500 MPa), along with the typical distribution feature of transverse residual stresses manifesting as compressive stresses in the far-weld zone. These observations are broadly consistent with the simulation results of this study. As shown in Figure 7, the S11 stress distribution exhibits a typical “tension–compression–tension” three-stage evolution. The region within approximately 12 mm from the weld center manifests as a tensile stress zone, with a peak stress of about 484 MPa (located at the weld center), gradually attenuating with increasing distance from the weld center. The 12–18 mm region transitions into a compressive stress zone, reaching a peak compressive stress of –488 MPa at an approximately 12.5 mm depth. Beyond 18 mm, the stress reverts to tensile stress and stabilizes around 30 MPa. In contrast, although the initial attenuation trend of S22 stress in the near-weld zone (less than 11 mm) resembles that of S11 (decaying from tensile stress), its distribution characteristics differ significantly. First, the peak compressive stress of S22 is substantially lower at approximately −96 MPa (located at 12.5 mm). Second, the compressive stress zone narrows to the 12.5–13.5 mm range, rapidly transitioning to tensile stress beyond 4 mm.
The above stress distribution characteristics indicate significant residual tensile stresses (peak 500 MPa and stabilized 150 MPa) in two zones: near the weld center (less than 12 mm) and beyond 18 mm on both sides of the weld centerline (S11 tensile zone at 150 MPa). Current research identifies high-magnitude residual tensile stress as a key mechanical driver for fatigue crack initiation and early propagation in welded structures [44,45,46]. Consequently, the S11 tensile stress zones (at 30 MPa) within 12 mm on both sides of the weld and beyond 18 mm are recognized as potential high-risk regions for fatigue crack initiation. Subsequent studies should focus on evaluating the fatigue performance of these regions. The compressive stress (−96 MPa) exhibited by S22 in the far-weld zone (in the range greater than 12.5–13.5 mm) may play a positive role in inhibiting the initiation of fatigue cracks in this region.

3.1.2. Residual Stress Distribution in LSP-Treated Specimens

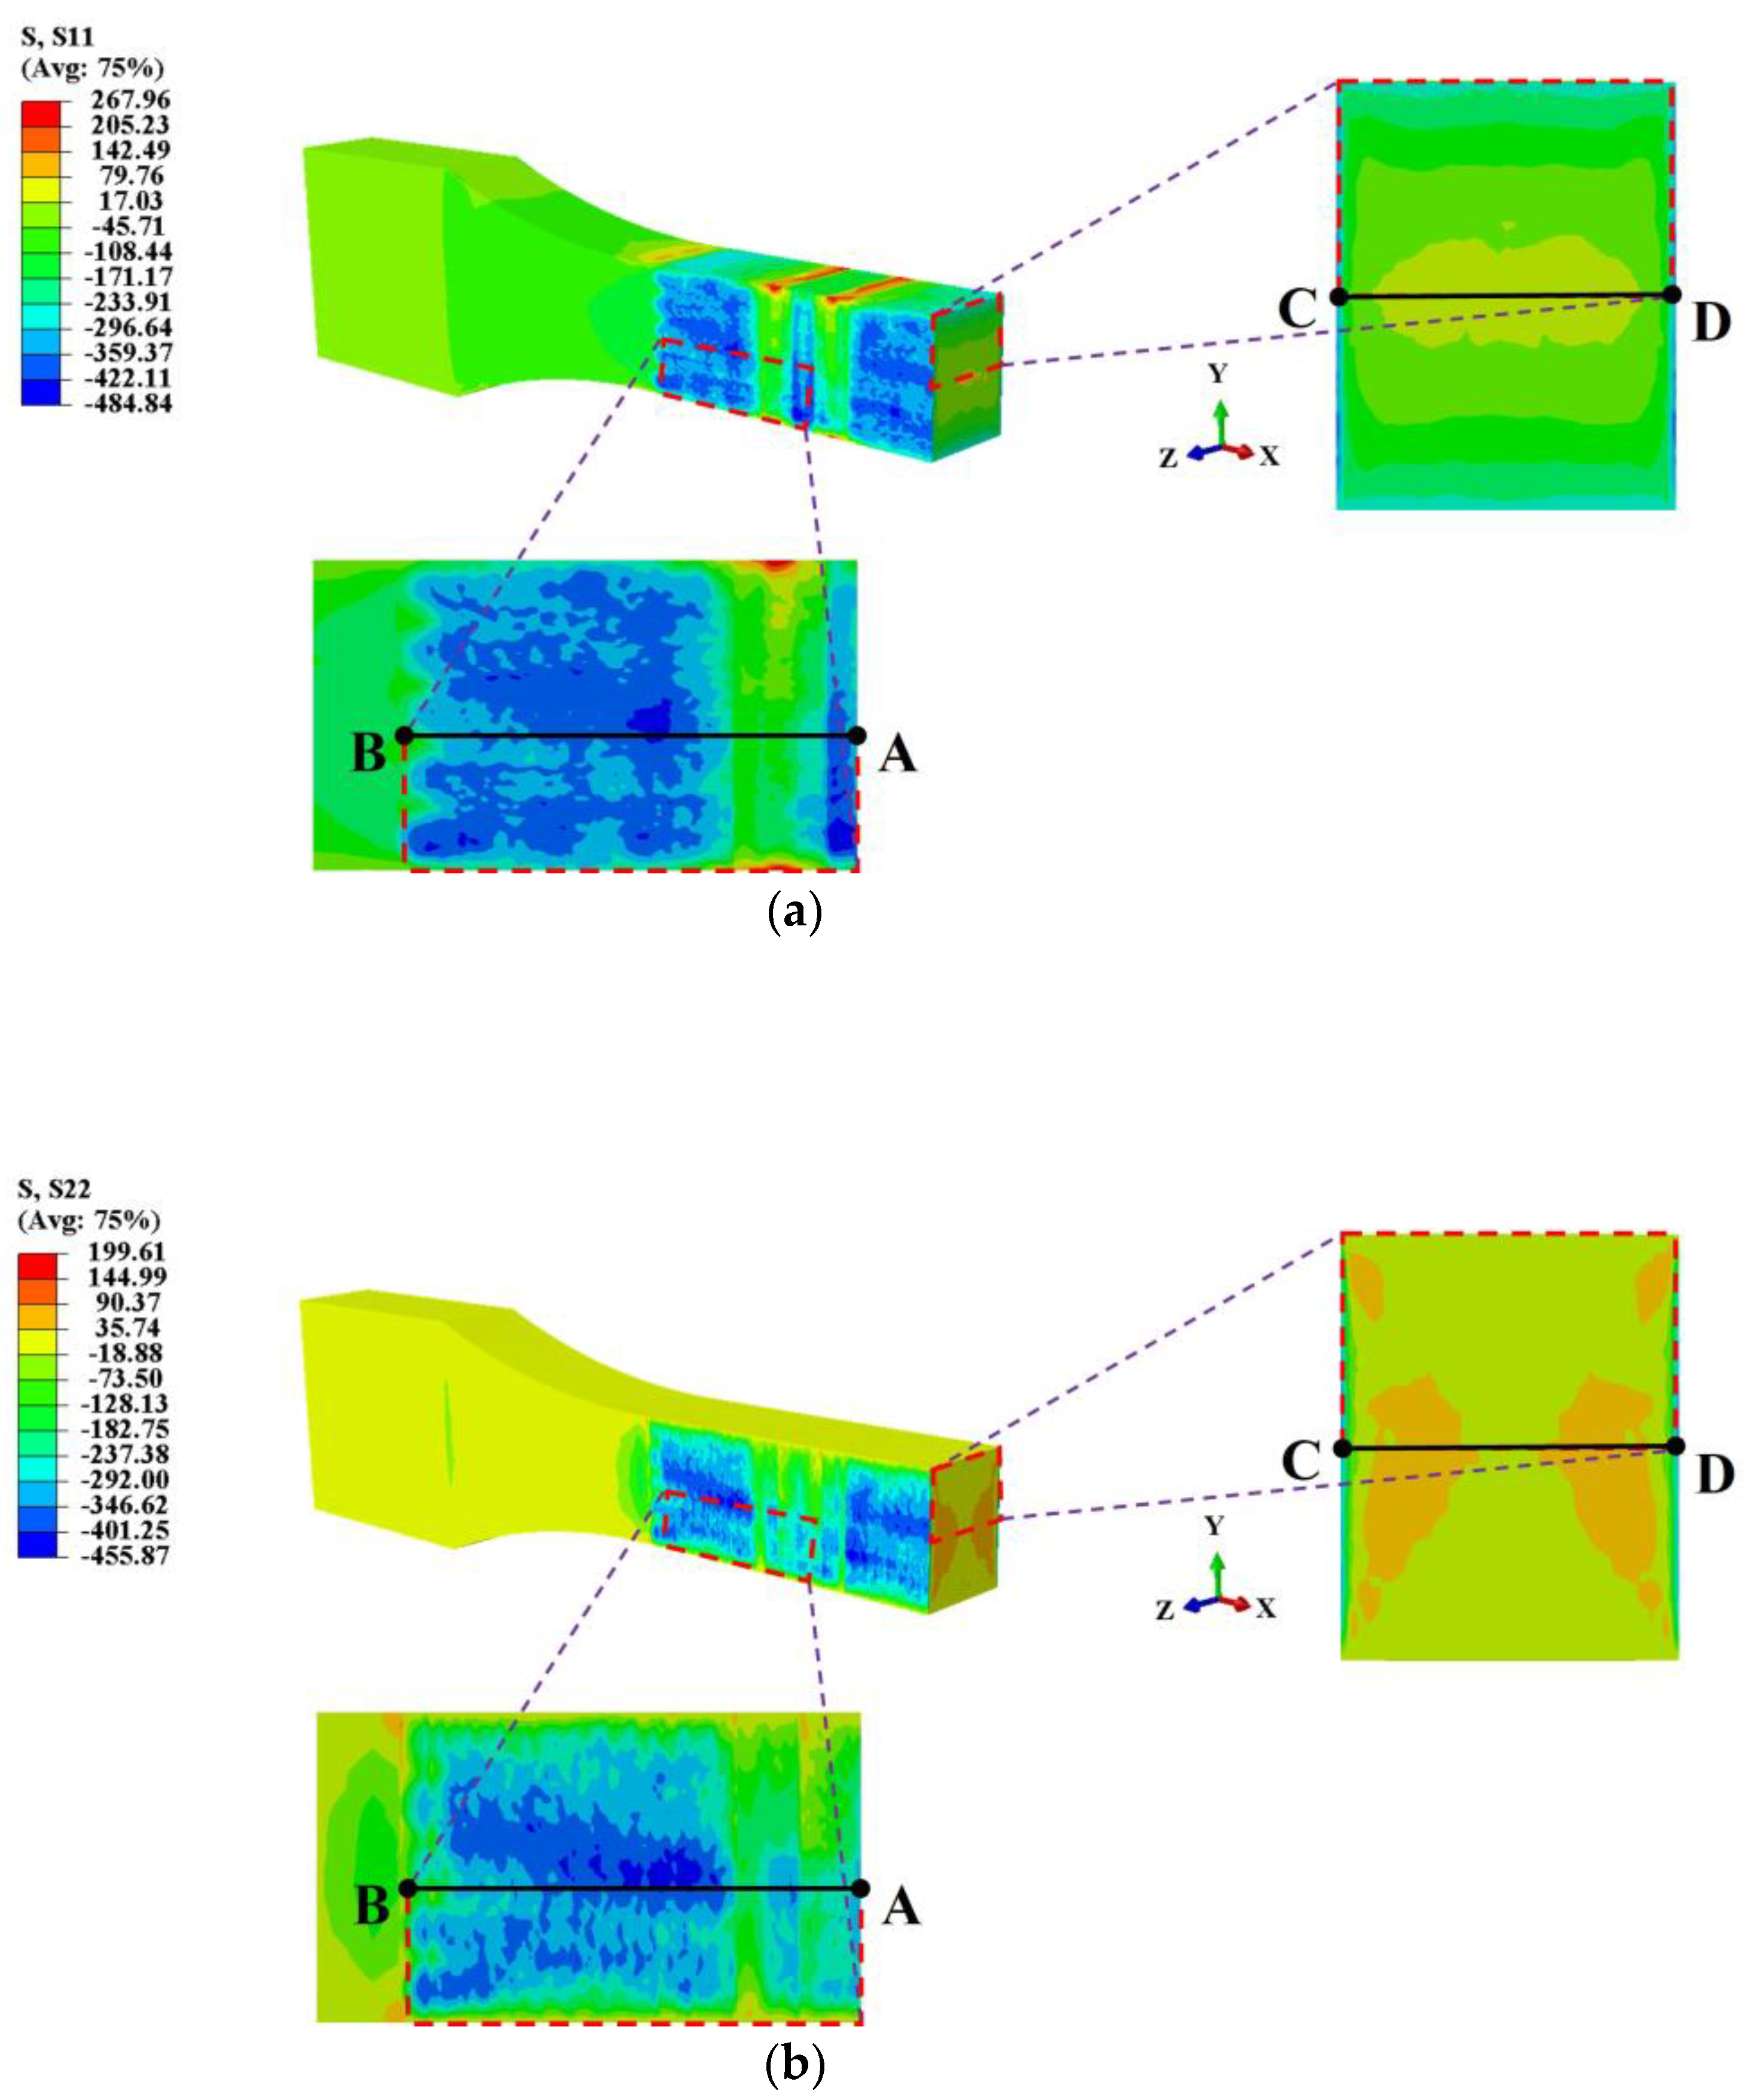
As indicated in Figure 7, the maximum residual tensile stresses of S11 are located approximately 11 mm from the weld centerline. In this tension–compression fatigue testing, S11 stress plays a dominant role in fatigue crack initiation; thus, we focus on assessing residual stress improvement at this specific location. The LSP simulation sequentially applied shock loading to the upper and lower surfaces using identical parameters (Table 3). The residual stress distribution of LSP-treated specimens is shown in Figure 8, with the cross-section located approximately 11 mm from the weld center. Line AB corresponds to the residual stress distribution from the weld center to the edge on the specimen surface, while line CD corresponds to the residual stress depth profile at the center region of the specimen cross-section. Figure 9 shows the residual stress distributions obtained along lines AB and CD in Figure 8. The region severely affected by LSP is referred to as the severe plastic deformation (SPD) layer [47].
Simulation results indicate that laser shock peening (LSP) significantly improved the residual stress distribution in welded Q355D steel. However, due to the circular spot and 50% overlap scanning strategy, shock wave interference occurred in overlap zones, creating a non-uniform stress field on the specimen surface (Figure 8a,b), with an affected depth of approximately 150–200 μ m. With increasing depth, shock wave energy attenuates. Below a 200 μ m depth, the laser-induced shock pressure falls below the material’s dynamic yield strength, failing to induce significant plastic deformation. Consequently, the stress distribution becomes increasingly uniform.
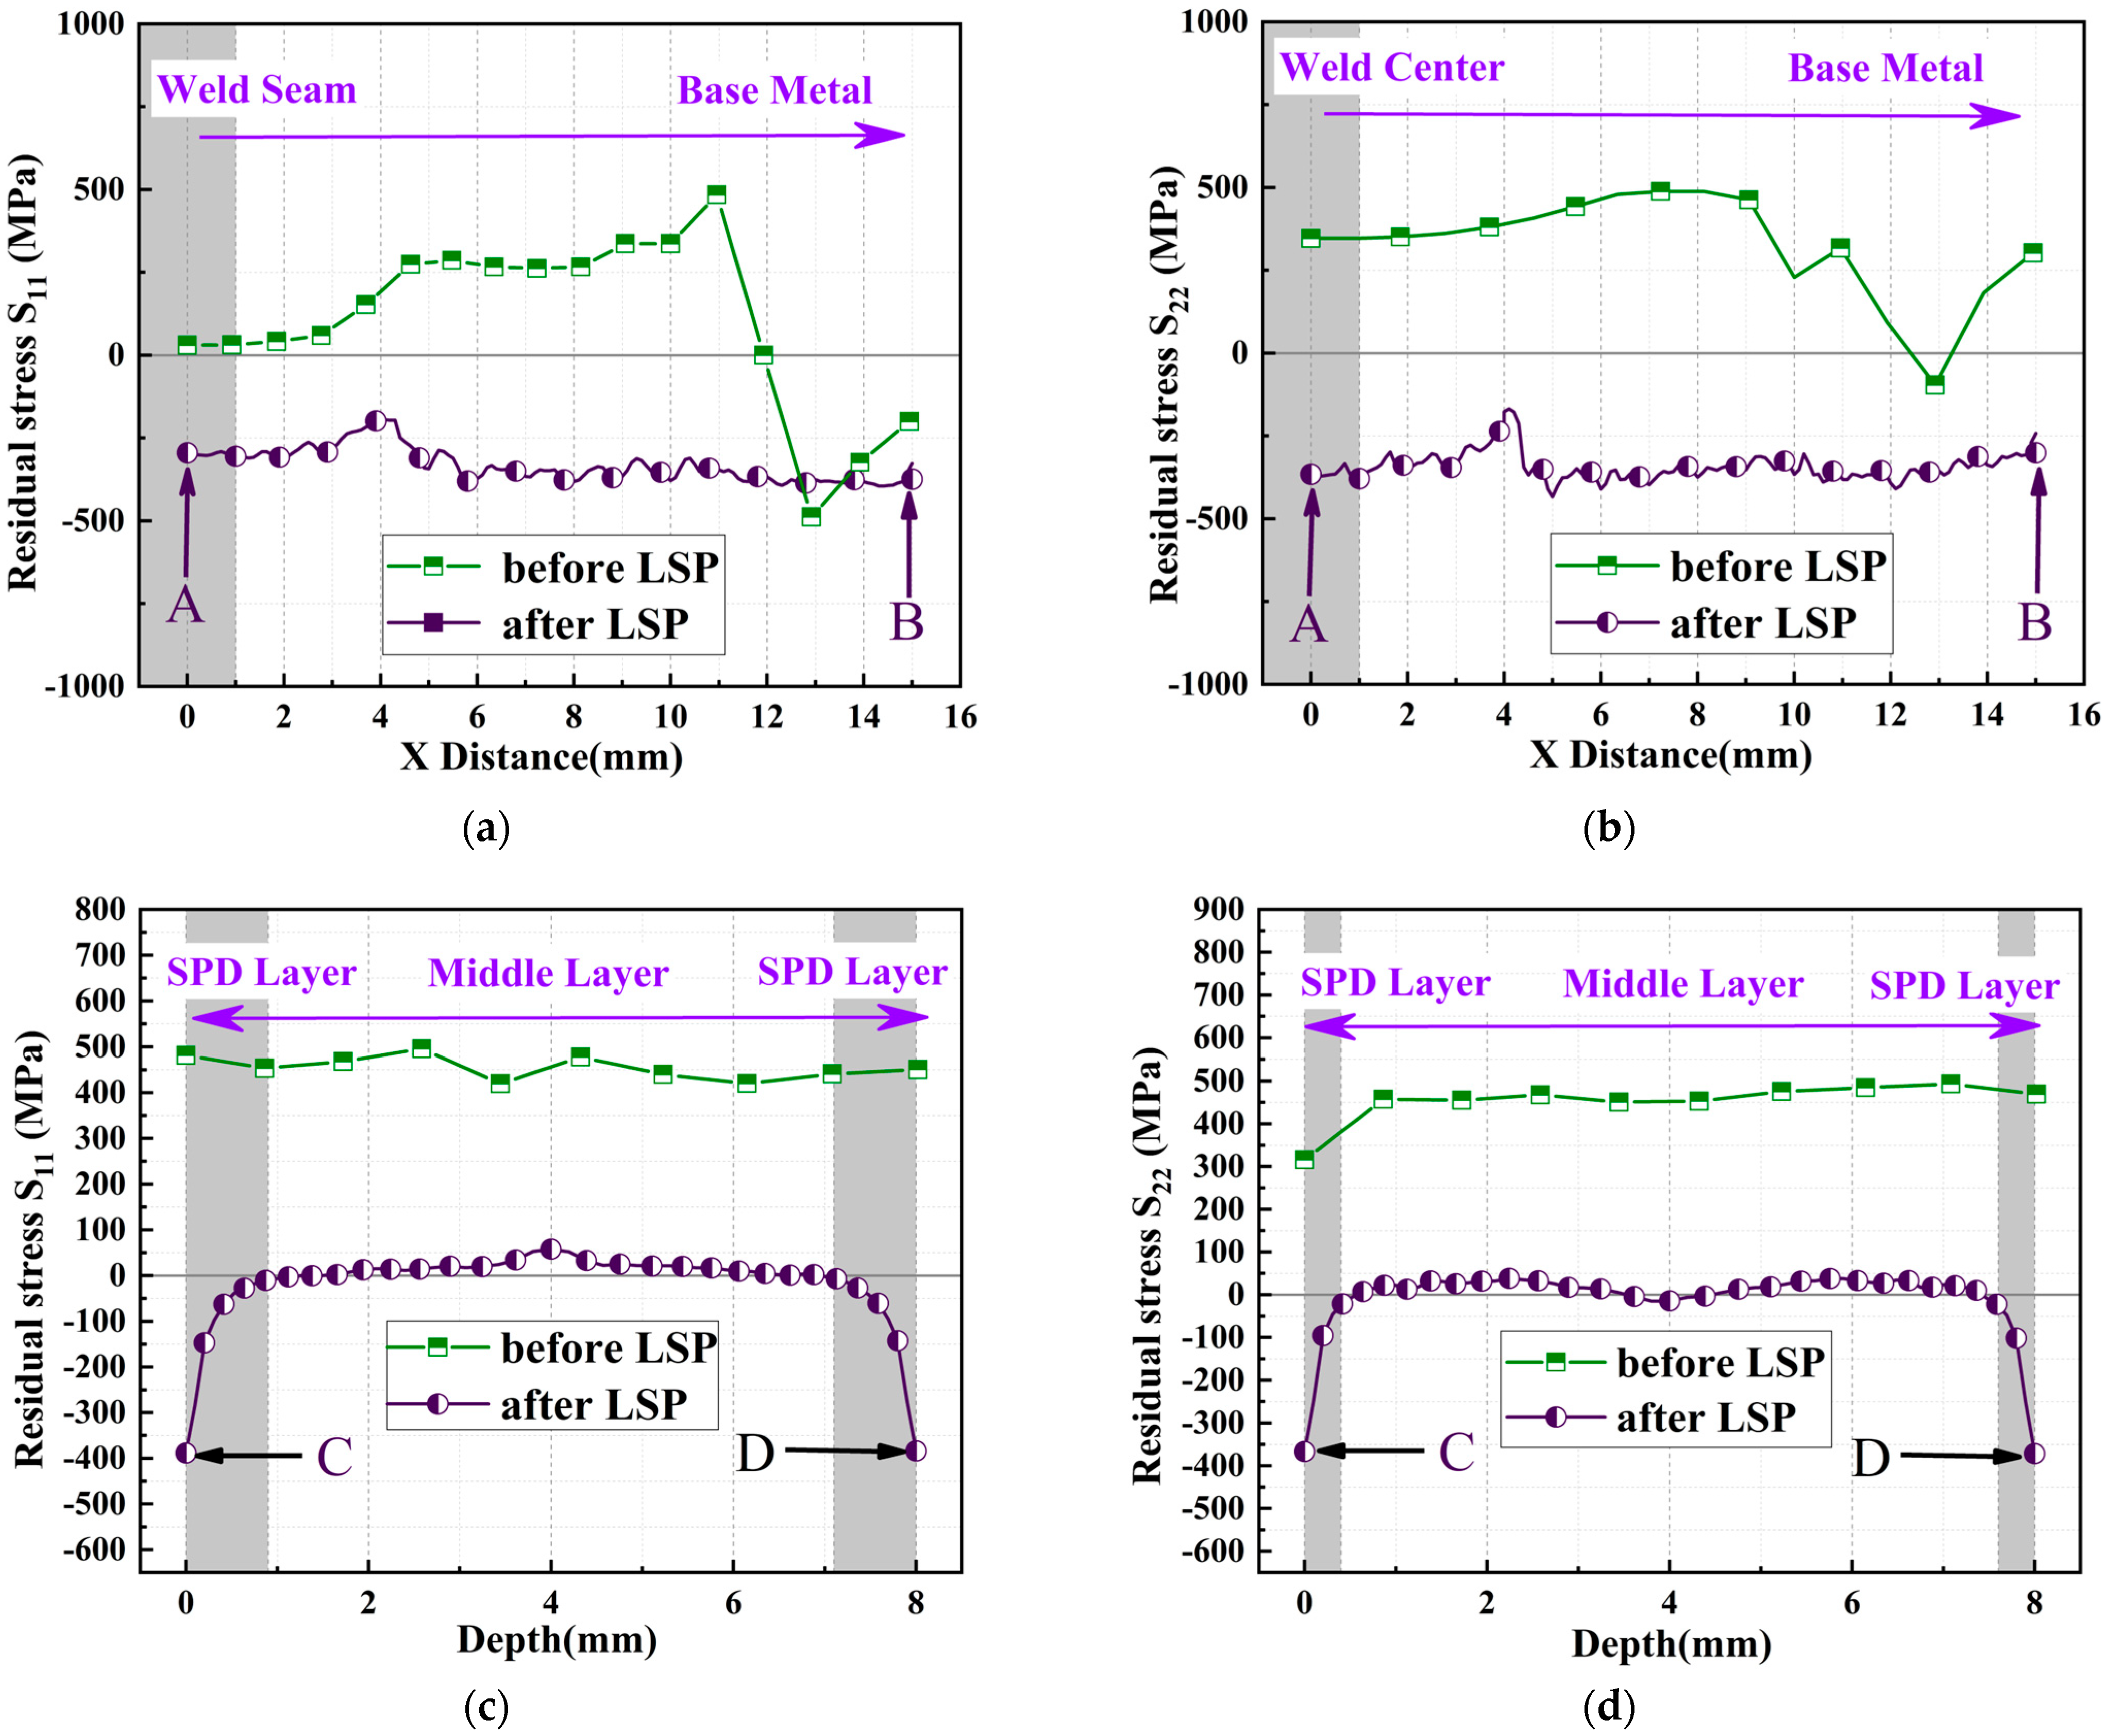
As shown in Figure 9a, after LSP treatment, the transverse residual stress component (S11) transformed from as-welded tensile stress (peak ~484 MPa) near the weld center (0–12 mm) into compressive stress (−297 to −392 MPa). In regions away from the weld (12–15 mm), high-magnitude as-welded compressive stress (peak −488 MPa) was reduced to –100 to −396 MPa, significantly improving stress distribution uniformity. This transformation originates from LSP’s dynamic compression effect, where shock waves induce compressive plastic deformation in surface material, causing residual compressive stress to balance the original tensile stress field [48]. Similarly, the longitudinal residual stress component (S22) exhibited violent tension–compression oscillations in the as-welded state (tensile stress peak 488 MPa, compressive stress peak −96 MPa). After LSP treatment, the entire surface predominantly transformed into compressive stress (−67 to −397 MPa), as shown in Figure 9b. The optimization of S22 stems from high-strain-rate deformation homogenizing the as-welded stress gradient [49], where the dislocation slip releases local stress concentrations, resulting in a more continuous stress distribution.
Depth-direction residual stress distributions (at 11 mm from weld center) are shown in Figure 9c,d. S11 showed compressive stress at the surface (−388 MPa), with the absolute value gradually decreasing with depth. It transitioned to tensile stress (peak 20 MPa) at ~1.52 mm depth, then gradually decreased. S22 exhibited compressive stress at the surface (−367 MPa), slightly increasing at 0.1 mm depth (−340 MPa), then gradually decreasing and transitioning to tensile stress (peak 38 MPa) at 0.63 mm depth. It reverted to compressive stress beyond ~3 mm depth. Notably, the SPD layer thickness reached ~0.9 mm for LSP-treated S11, compared to ~0.3 mm for S22. This smaller thickness for S22 is attributed to the violent tension–compression oscillations present in the as-welded state. Its high-stress gradient hindered shock wave energy transmission to deeper regions [50]. Nevertheless, both S11 and S22 formed beneficial residual compressive stress layers near the surface and eliminated tensile stress concentrations present in the as-welded state.
These results align with existing studies. LSP refines grains through dislocation multiplication and grain boundary sliding induced by high-strain-rate deformation [51], while its dynamic compression effect transformed transverse residual stress near the weld center from as-welded tensile stress (peak ~372 MPa) to compressive stress (−342 MPa). This stress reversal mechanism is identical to that observed by Sheng, et al. [52] in SUS 304 stainless steel welded joints. Simultaneously, although shock wave interference caused surface stress field non-uniformity, it significantly reduced stress gradients in both S 11 and S22, validating the stress homogenization theory proposed by Wan, et al. [53]. Ultimately, the formed residual compressive stress field cooperates synergistically with dislocation tangles to suppress crack initiation. This synergistic mechanism has been experimentally confirmed by Wen, et al. [49] to substantially enhance fatigue life in aluminum alloy joints.

3.2. Hardness Test

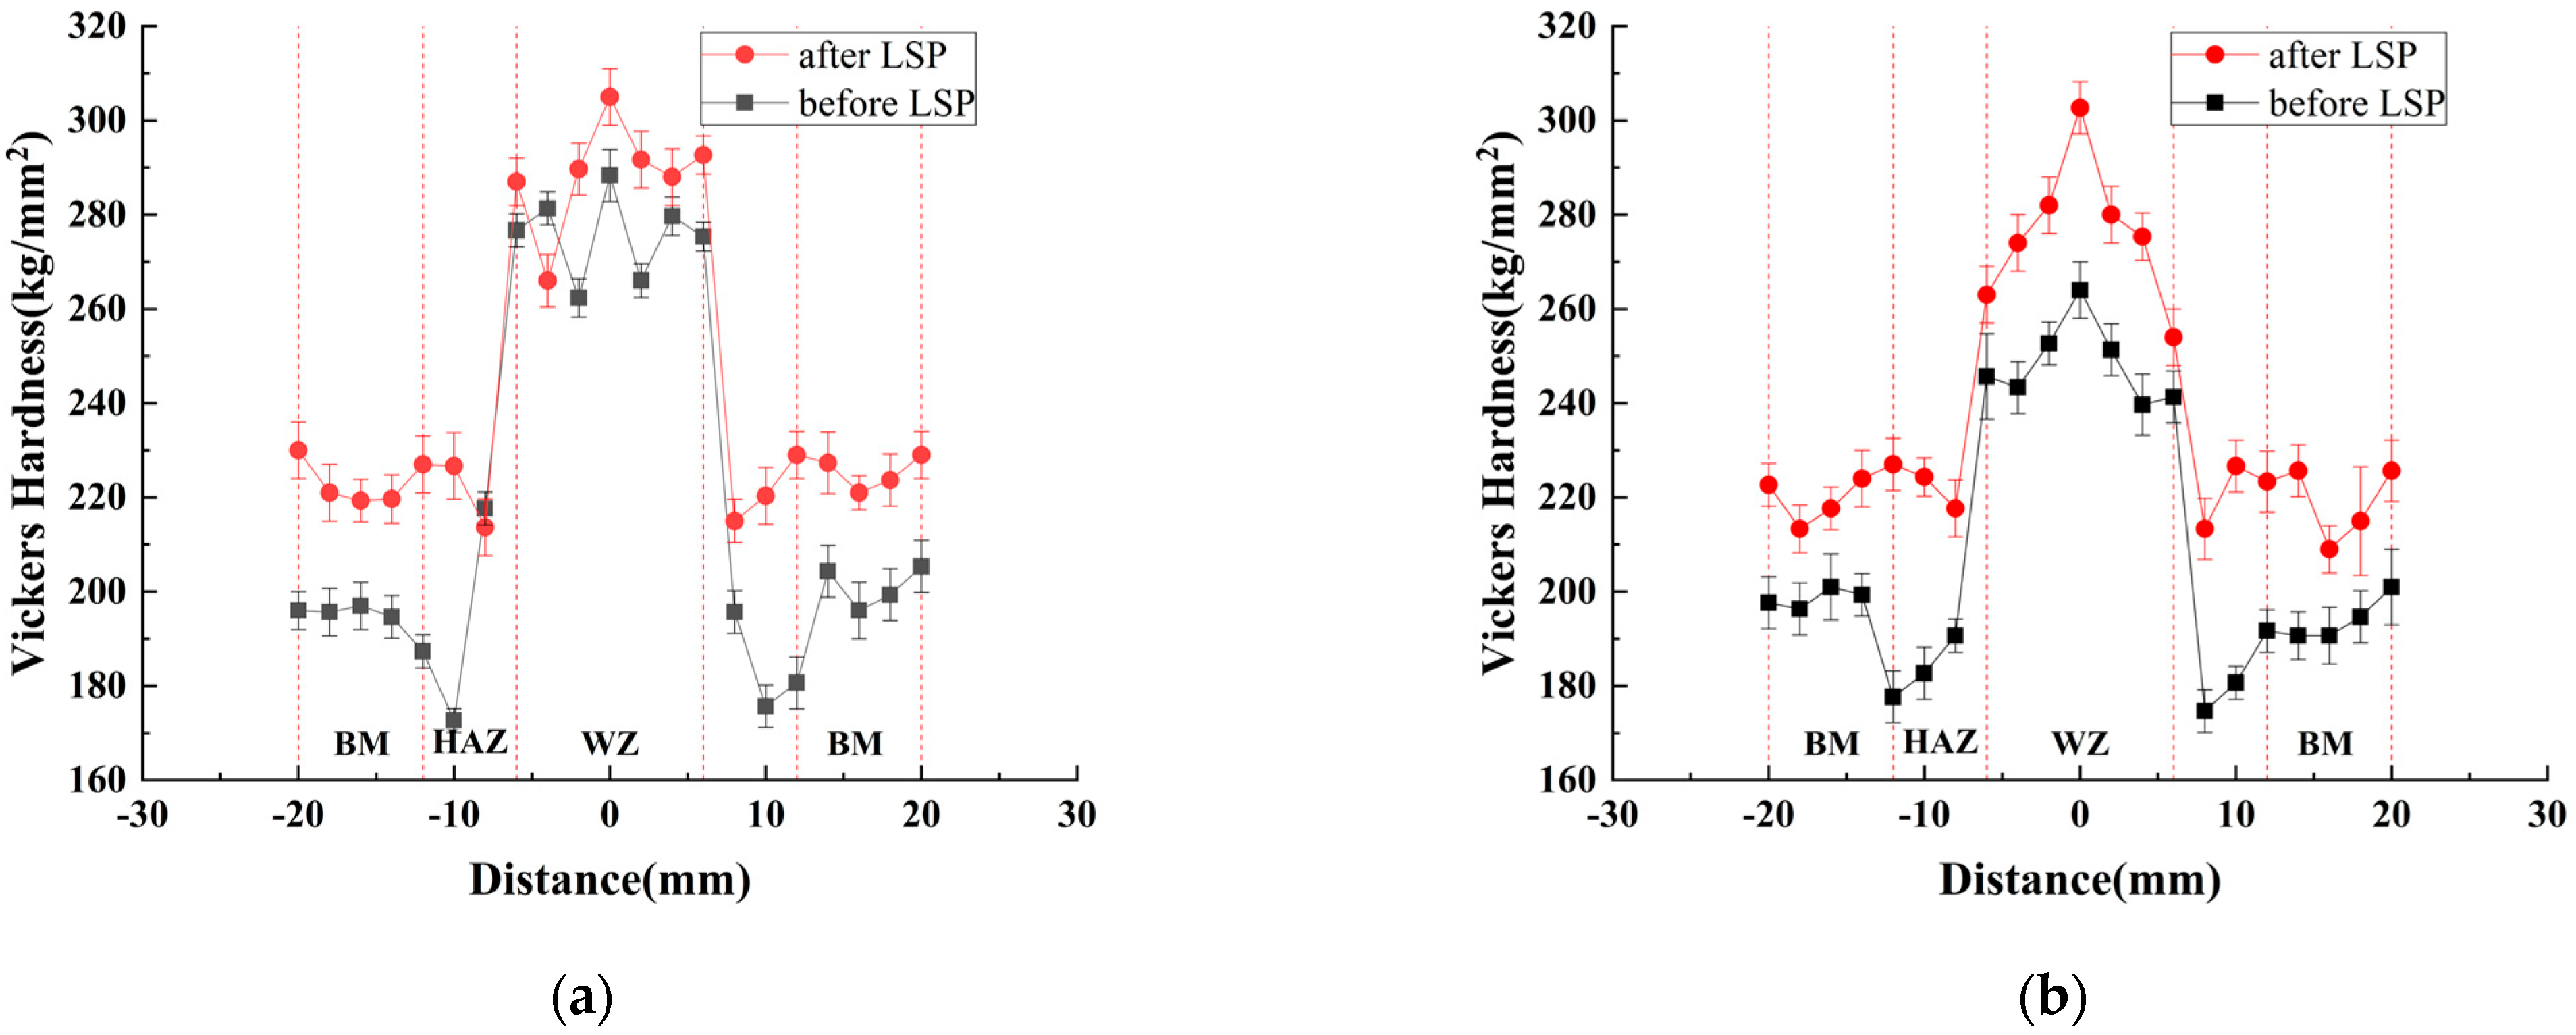
In metal welding, increasing the number of weld passes leads to higher microhardness [54]. Since the upper and lower surfaces of this specimen had different numbers of weld passes, their microhardness also differed slightly. Figure 10a,b displays the microhardness distributions along the transverse direction (perpendicular to the weld) on the upper and lower surfaces, respectively. The weld zone (WZ) exhibited the highest hardness, while the heat-affected zone (HAZ) showed a distinct hardness gradient, with near-weld regions significantly harder than near-base metal regions. After LSP treatment, hardness increased in all zones. Average hardness values and strengthening amplitudes for different zones and surfaces are detailed in Table 5.
Data in Table 5 indicate significant variations in LSP strengthening effects across different joint zones. The HAZ (especially the upper surface) showed the greatest increase (up to 22.8%), likely due to its original microstructural heterogeneity (e.g., gradients between coarse-grained and fine-grained zones). Softer regions within HAZ were more sensitive to LSP shock wave energy [26], resulting in more pronounced plastic deformation and dislocation multiplication. The base metal (BM) zone achieved a stable increase of 11.5–12.1% through laser-induced dislocation strengthening [55]. In contrast, the relatively lower increase in the WZ primarily stems from the constraining effect of its unique microstructure on LSP-induced plastic deformation. The rapidly solidified WZ predominantly consists of high-hardness α ' -acicular martensite [56]. This hard–brittle phase inherently exhibits limited plastic deformability [53], restricting further dislocation multiplication and accumulation during LSP. Secondarily, solidification of the molten pool leads to significant grain structure changes within the WZ, forming fine equiaxed grains [57] that diminish the accumulation efficiency of dislocation strengthening effects. Furthermore, the asymmetric strengthening—higher at the lower surface than the upper surface of the WZ—can be attributed to differences in weld pass count. In this study, the lower surface underwent single-pass welding, featuring relatively coarser microstructure and residual stress states potentially more conducive to plastic deformation [58]. Conversely, the upper surface experienced multi-pass thermal cycles, causing slight tempering of martensite and higher initial dislocation density [53,59]. Collectively, these factors reduce the upper surface’s responsiveness to subsequent LSP strengthening.
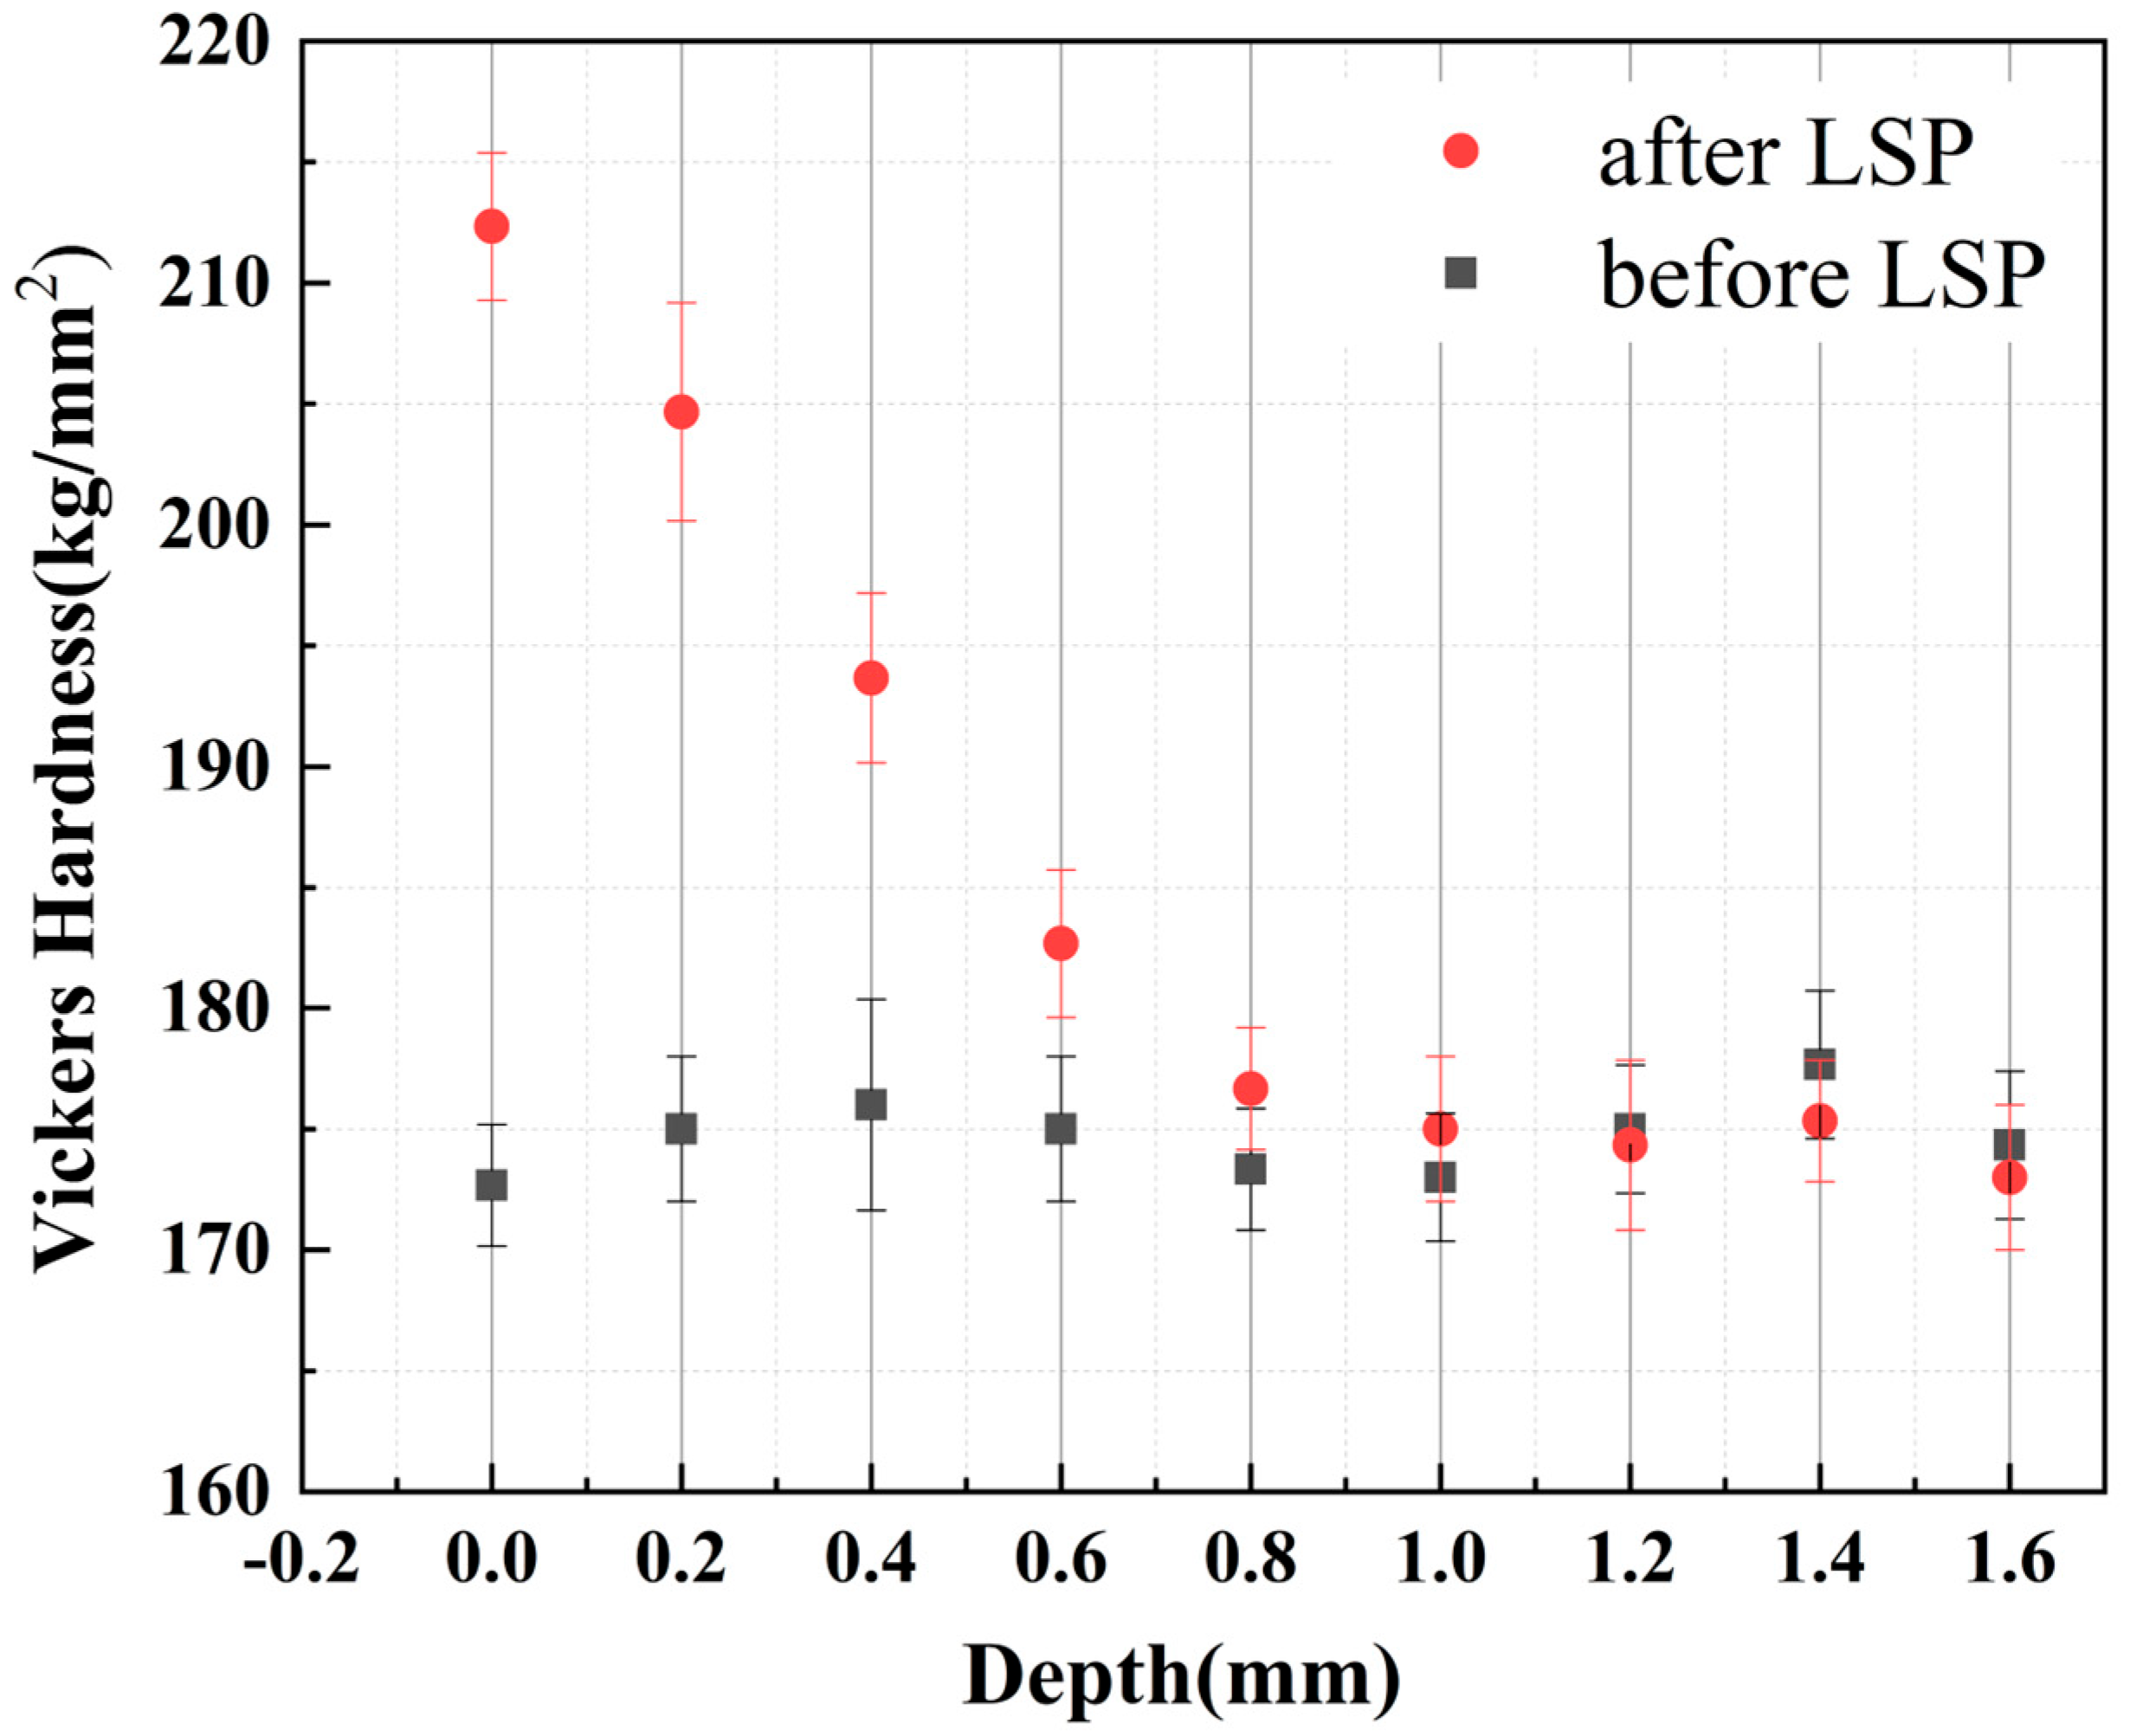
Laser-induced plasma pressure causes plastic deformation on the material surface, generating work-hardening effects in the near-surface region. The mechanical effect of shock waves diminishes with increasing distance from the surface, resulting in microhardness gradually approaching the base metal level as LSP depth increases [60]. To investigate LSP’s subsurface effects, depth-dependent microhardness distribution was tested at 10 mm from the weld center (within HAZ, Figure 11). Results reveal a continuous decreasing trend from the surface to ~700 μ m depth: hardness gradually declined from a peak of 215 HV at the surface to ~173 HV at ~1.6 mm depth (approaching original HAZ hardness). This clearly demonstrates that LSP-induced plastic deformation and residual compressive stress formed a typical gradient strengthening layer in the depth direction, with an effective depth of ~700 μ m. This strengthening layer depth is primarily controlled by parameters such as laser energy density and overlap rate [35], and is closely correlated with the material’s strain-hardening exponent, residual stress, and dislocation density [61,62]. Materials with high strain-hardening capacity can delay hardness attenuation through dislocation multiplication and grain boundary pinning effects, thereby extending the effective strengthening zone.
In summary, LSP’s strengthening effect on welded joints exhibits significant region dependence and surface dependence. HAZ responded most sensitively to LSP due to its original microstructural heterogeneity, yielding the most substantial strengthening. WZ strengthening was relatively limited by its initial martensitic structure. BM achieved stable improvement via dislocation strengthening. This surface/region-dependent strengthening mechanism, combined with the subsurface gradient strengthening layer formed by LSP, constitutes one of the key factors for improving the fatigue performance of welded joints.

3.3. Fatigue Results

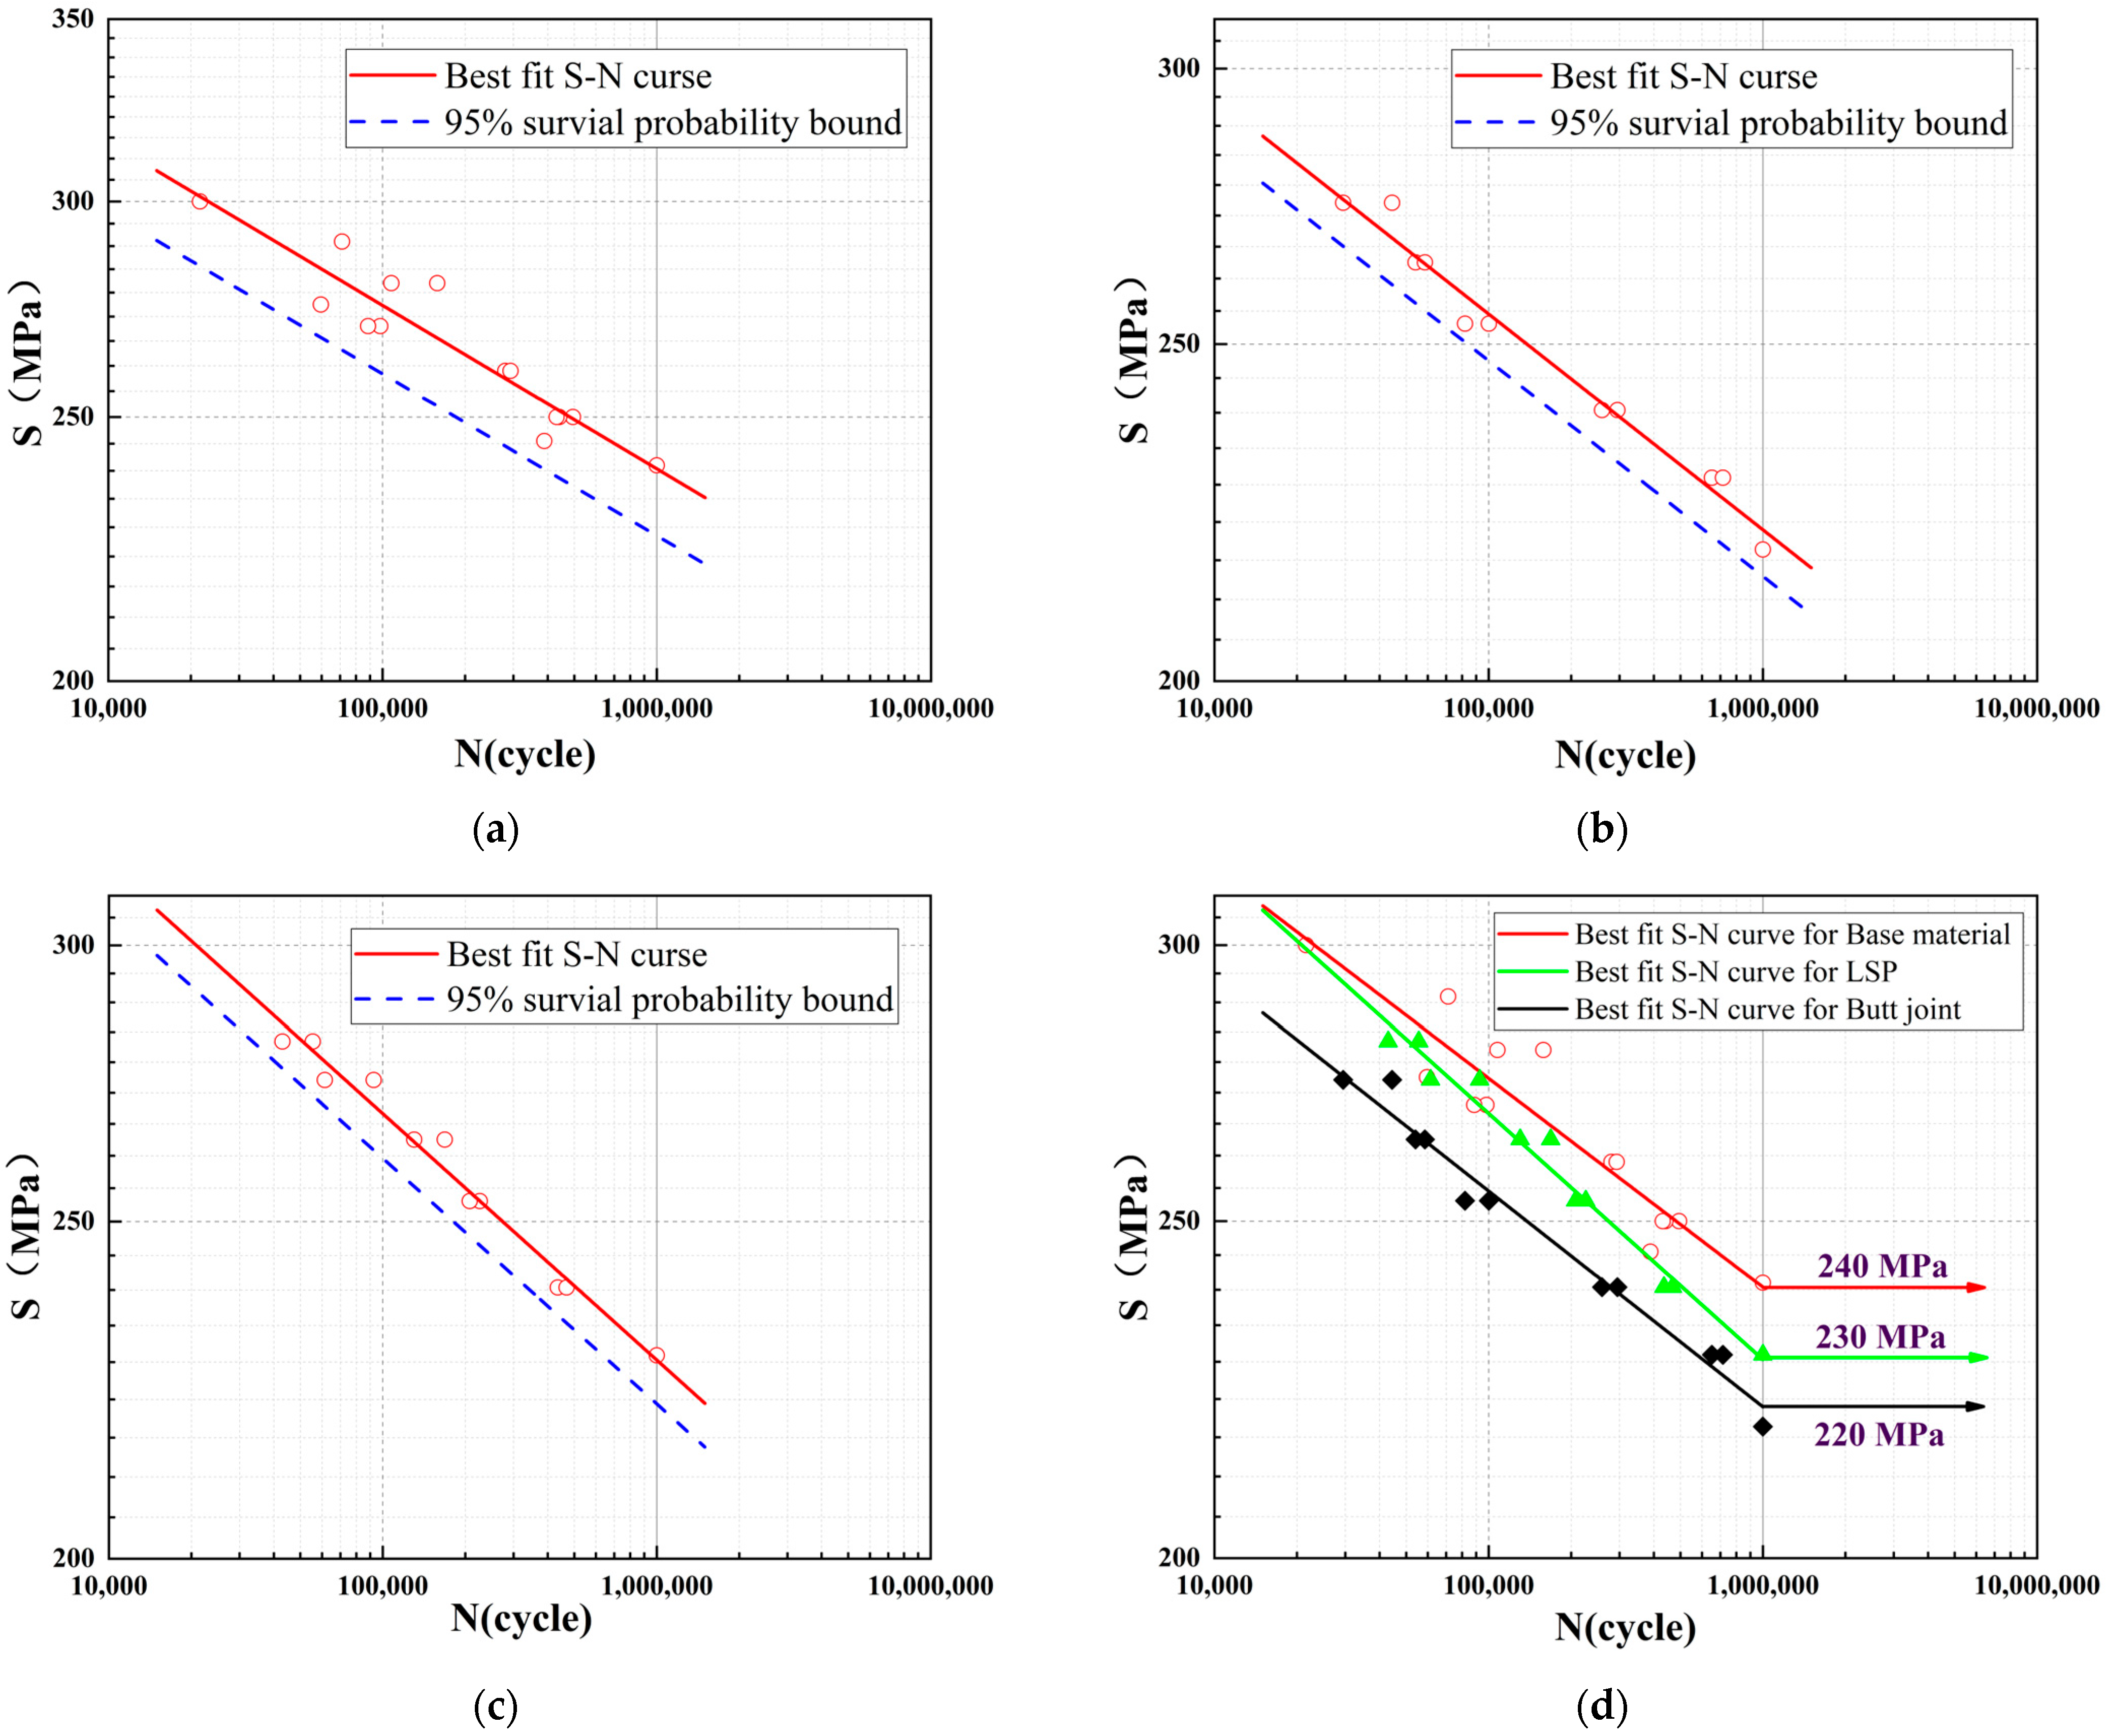
Fatigue tests were conducted on 42 Q355D specimens, yielding 36 valid data points. Test records are presented in Table 6. Base metal fractures occurred near the arc transition zone, while welded specimens fractured adjacent to welded joints. Valid experimental data are shown in Figure 12.
Figure 12 displays the relationship between stress amplitude and cycles to failure (S-N curves) for Q355D steel base metal, butt-welded joints, and laser shock peened (LSP) specimens. Stress levels are given as absolute values representing maximum stresses in sinusoidal waves. Results were statistically analyzed using log-normal distribution, excluding specimens surviving beyond 2 × 10⁶ cycles (indicated by arrows in Figure 12). The mean curve depicts survival probability at N = 1 × 10⁶ cycles as a solid line, with scatter bands bounded by dashed lines representing 90% survival probability. Identical scatter band definitions apply to all three specimen types between 1 × 10⁴ and 1 × 10⁶ cycles.
LSP-treated specimens exhibited longer fatigue lives at identical stress levels. Data distribution indicates greater LSP effectiveness at higher stresses. As shown in Figure 12, in the high-stress region (250–270 MPa), LSP increased fatigue life by 113–165%. At 274 MPa, welded joint average life was 36,959.5 cycles, increasing to 78,783.5 cycles after LSP treatment (113% improvement). At 250 MPa, LSP specimen life (216,823 cycles) exceeded welded joints (91,084 cycles) by 138%. In the medium-low-stress region (230–240 MPa), improvements decreased to 46%~63%. Nevertheless, at 230 MPa, LSP specimens exceeded 1 × 10⁵ cycles, far surpassing welded joints (683,184 cycles). LSP preferentially suppresses crack initiation in high-stress zones through surface compressive stress and dislocation strengthening, yielding greater improvements in low-cycle fatigue (high-stress) regions. In high-cycle fatigue (low-stress) regions where crack propagation dominates, improvements moderate. This characteristic makes LSP particularly suitable for heavy-load welded structures.
Similar fatigue strength improvements in LSP-treated metal welded joints have been reported. Su, et al. [48] observed a 37.5% fatigue life increase in TIG-welded AA6061-T6 aluminum joints after LSP. Wen, et al. [49] noted an upward shift of the entire S-N curve in LSP-treated laser-welded 2A60 aluminum joints, indicating fatigue life improvement across stress levels. Kashaev, et al. [63] reported 43–50% fatigue strength improvement in AA6056-T6 aluminum joints with LSP treatment.

3.4. Fatigue Damage

Fatigue life prediction is a crucial aspect of fatigue performance evaluation. Fatigue damage models can assess remaining safe service life based on usage conditions. If fatigue life N f is known, the residual safe service life can be calculated using a fatigue damage model. The high-cycle fatigue damage model [64] adopted in this study is as follows:
N f = β + 1 S m a x β + 1 S m i n β + 1 1 2 B β + 2
D = 1 1 N N f 1 / β + 2
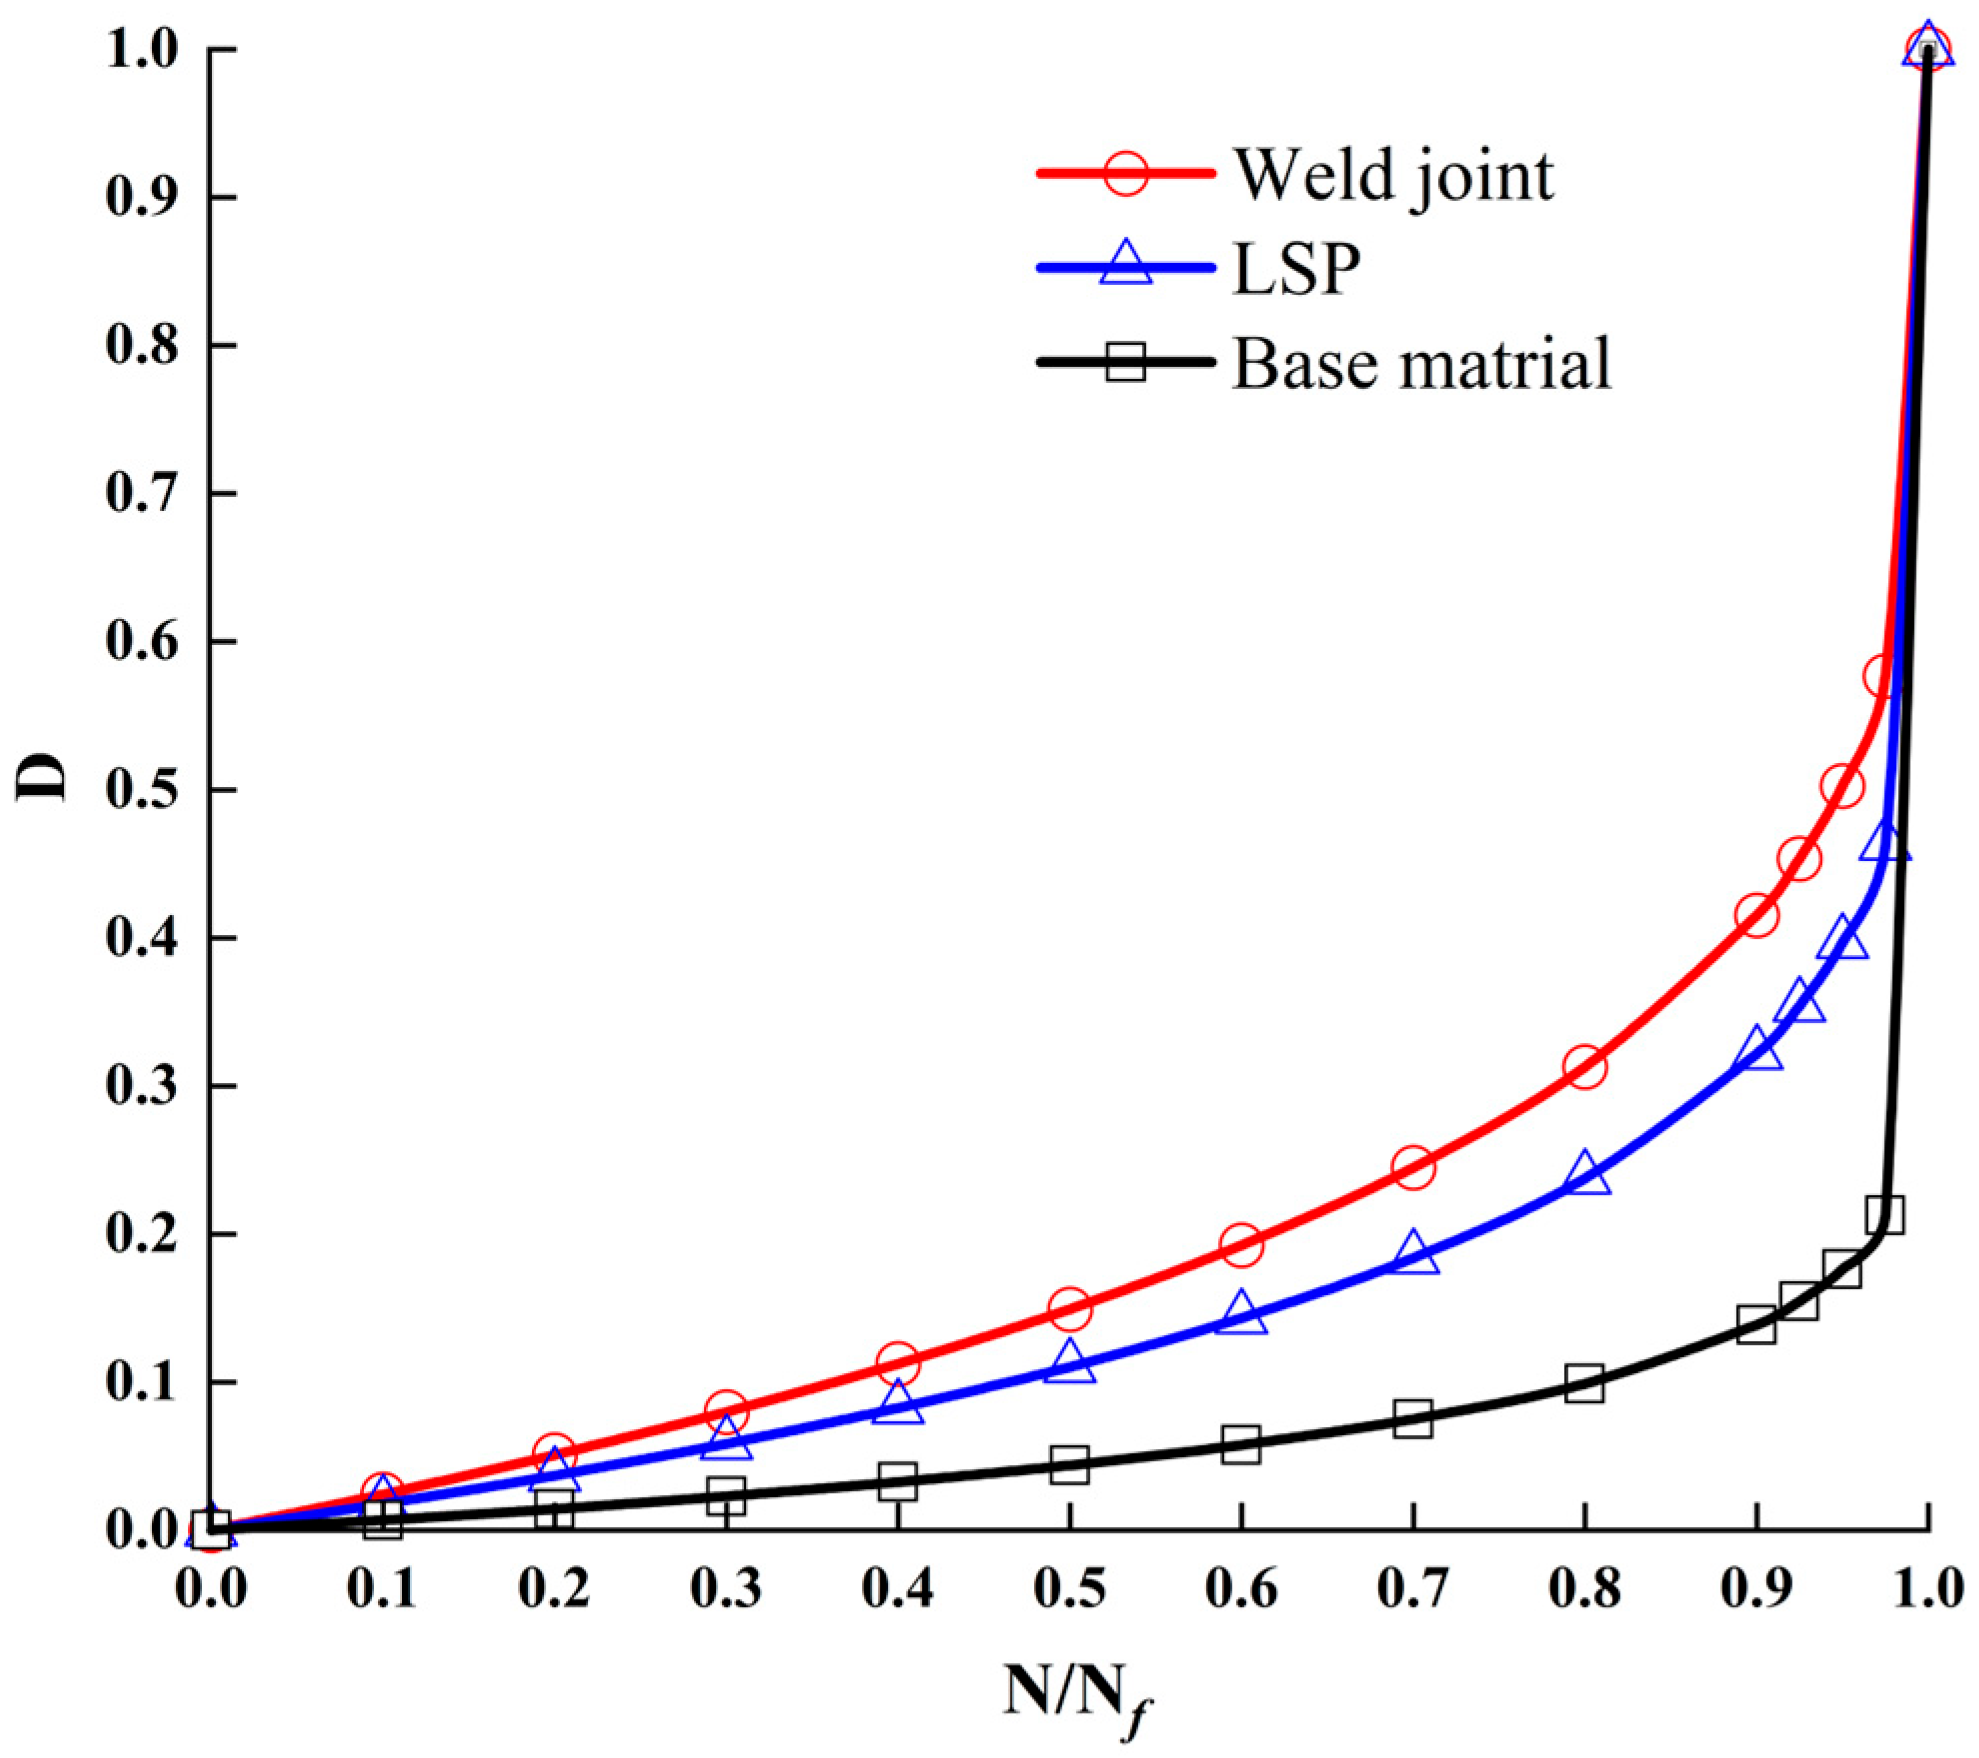
where B and β are material constants determined experimentally. S m a x and S m i n are maximum and minimum stresses, respectively. N is the number of fatigue cycles, N f is the corresponding fatigue life, and D is cumulative fatigue damage. β was obtained by regression of test data, but by incorporating separated terms for S m a x and S m i n , the model inherently possesses the capability to characterize variable-amplitude loading. A smaller β value indicates greater sensitivity of material life to R-ratio variations. For base metal, butt joints, and LSP-treated specimens, the β values were 13.44, 2.29, and 3.93, respectively.
As shown in Figure 13, under fatigue loading, cumulative damage D and its corresponding curve slope increased with cycle count for all three specimen types. During the fatigue crack initiation phase (N/ N f   < 0.5), butt-welded joints and LSP-treated specimens exhibited faster damage evolution rates than base metal. When entering the crack propagation phase (N/ N f   > 0.5), damage behaviors diverged significantly. Butt-welded joints showed the most pronounced damage acceleration due to microstructural degradation in the heat-affected zone. In contrast, LSP-treated specimens effectively suppressed microcrack propagation rates through surface compressive stress and grain refinement. At the failure critical interval (N/ N f   = 0.9−1), damage accumulation rates surged to maximum values in all specimens. Comparative analysis demonstrated that although damage accumulation in LSP-treated specimens exceeded base metal, their damage rate was significantly lower than untreated butt welds, demonstrating LSP’s effectiveness in delaying damage accumulation.

3.5. Fracture Morphological Analysis

Fatigue fracture zones of specimens were observed using a scanning electron microscope. The fracture morphology is shown in Figure 14. Based on fracture mechanisms, the fracture morphology was categorized into the fatigue crack initiation zone, fatigue crack propagation zone, and final fracture zone. The overall morphology exhibited a progressive transition from initial smooth features to final rough characteristics, with significant differences in zonal features among specimens.
As shown in Figure 15a, Figure 16a and Figure 17a, crack initiation universally originated at surface stress concentration points. In welded joint specimens, grain coarsening in the heat-affected zone (HAZ) and fusion line weakening led to multiple secondary crack sources initiating from microstructural heterogeneous regions along propagation paths. Notably, initiation zones in welded specimens were frequently located in the previously identified high-residual-tensile-stress region (18 mm from weld), exhibiting high microcrack density—closely related to microstructural weakening and residual tensile stress concentration. After LSP treatment, microcrack density in the initiation zone significantly decreased. Residual stress analysis (Figure 8) and cyclic strain distribution (Figure 9d) confirm that the surface compressive stress introduced by LSP effectively suppressed crack initiation propensity in the original high-tensile-stress zone.
As shown in Figure 15b, Figure 16b and Fugure 17b, the propagation zone was characterized by fatigue striations and stepped fractures. Welded specimens exhibited numerous irregular voids, enlarged striation spacing, and disordered orientations, indicating higher crack propagation rates. This aligns with Section 3.4 findings showing the most pronounced damage acceleration in welded specimens during propagation phase (N/ N f > 0.5). LSP-treated specimens displayed unique propagation behavior: markedly reduced fatigue striation spacing, significantly fewer voids, and more tortuous crack paths. This primarily stems from the “crack closure effect” induced by LSP’s residual compressive stress, which reduces the effective stress intensity factor range ( K e f f ) at crack tips. Simultaneously, LSP-induced surface hardening (particularly 23.3% hardness increase in HAZ) and microstructural refinement (dislocation multiplication/grain refinement) collectively hinder plastic deformation and propagation paths at crack tips. This correlates with LSP’s significant fatigue life improvement in medium-low-stress regions (46–63%) and delayed damage rates during propagation.
As shown in Figure 15c, Figure 16c and Figure 17c, final fracture zones of all specimens predominantly exhibited dimple morphology. Welded specimens showed clear regional differences in dimple distribution due to HAZ inclusion segregation and microstructural gradients, with overall weaker plastic deformation capacity. LSP-treated specimens displayed extensive plastic deformation traces at dimple edges and localized tear ridge structures, indicating that LSP not only optimizes stress states, but also enhances microstructure through high-strain-rate plastic deformation. This improves material toughness and resistance to unstable fracture, supporting its substantial lifetime improvement (113–165%) in high-stress regions.

4. Conclusions

This study systematically investigated the regulatory mechanism of laser shock peening (LSP) on the fatigue performance of Q355D steel butt-welded joints, yielding the following conclusions:
  • LSP significantly increased microhardness across all joint zones (22.9% improvement in upper-surface HAZ, 11.3% in lower-surface WZ), forming a hardness gradient decaying within approximately 700 μ m depth from the surface. This gradient hardening establishes a microstructural foundation for enhanced fatigue resistance.
  • LSP substantially extended joint fatigue life: by 113–165% in the high-stress region (250–270 MPa) and 46–63% in the medium-low-stress region (230–240 MPa). This indicates exceptional effectiveness in suppressing crack initiation and early propagation under high stresses.
  • Finite element analysis revealed significant residual tensile stress concentration (S11 peak ~484 MPa) beyond 11 mm on both sides of the weld. LSP effectively induced surface residual compressive stress, markedly reducing residual tensile stress levels (e.g., S22 peak decreased from ~488 MPa to −397 MPa), effectively lowering tensile stress in critical zones to inhibit crack initiation.
  • Fractographic analysis confirmed reduced microcrack density and smaller fatigue striation spacing in LSP-treated specimens. This originates from the synergistic effect of surface residual compressive stress (inducing crack closure) and microstructural refinement/strengthening, collectively retarding crack propagation rates.
  • These results validate LSP’s efficacy in enhancing fatigue performance of Q355D welded joints. Future work should evaluate its robustness in engineering applications by increasing sample sizes and optimizing process parameters.

Author Contributions

Conceptualization, D.Y.; funding acquisition, S.Q. writing—original draft preparation, Y.L.; writing—review and editing, Y.L., P.S. and Y.H.; methodology, F.L.; resources, J.W. All authors have read and agreed to the published version of the manuscript.

Funding

This research was funded by the 2024 Special Project on Marine Economic Development of Guangdong Province, grant number GDNRC [2024]30 and Guangdong Basic and Applied Basic Research Foundation, project number 2024A1515240068.

Institutional Review Board Statement

Not applicable.

Data Availability Statement

The raw data supporting the conclusions of this article will be made available by the authors on request.

Acknowledgments

The authors acknowledge the National Engineering Research Center of Near Net-Shape Forming for Metallic Materials for material preparation and the mechanical property test.

Conflicts of Interest

Jianhua Wang is affiliated with Guangzhou Shipyard International Corporation Limited. The authors declare no conflicts of interest.

References

  1. Tong, L.; Niu, L.; Ren, Z.; Zhao, X.-L. Experimental research on fatigue performance of high-strength structural steel series. J. Constr. Steel Res. 2021, 183, 106743. [Google Scholar] [CrossRef]
  2. Corigliano, P.; Crupi, V. Review of Fatigue Assessment Approaches for Welded Marine Joints and Structures. Metals 2022, 12, 1010. [Google Scholar] [CrossRef]
  3. Wei, S.; Shi, X.; Wei, S.; Xia, H.; Zhou, G.; Masoudi Nejad, R.; Berto, F. Fatigue performance assessment of thick TIG-Dressing cruciform welded joints made by Q355D structural steel. J. Mater. Res. Technol. 2023, 27, 5977–5993. [Google Scholar] [CrossRef]
  4. Knysh, V.V.; Mordyuk, B.N.; Solovei, S.O.; Savitsky, V.V.; Mikhodui, O.L.; Lesyk, D.A.; Motrunich, S.I. HFMI-induced fatigue strength improvement of S355 steel transverse non-load-carrying attachments with lack of fusion in the weld root. Int. J. Fatigue 2024, 181, 108147. [Google Scholar] [CrossRef]
  5. Qutaba, S.; Asmelash, M.; Saptaji, K.; Azhari, A. A review on peening processes and its effect on surfaces. Int. J. Adv. Manuf. Technol. 2022, 120, 4233–4270. [Google Scholar] [CrossRef]
  6. Yin, D.; Wang, D.; Jing, H.; Huo, L. The effects of ultrasonic peening treatment on the ultra-long life fatigue behavior of welded joints. Mater. Des. 2010, 31, 3299–3307. [Google Scholar] [CrossRef]
  7. Braun, M.; Wang, X. A review of fatigue test data on weld toe grinding and weld profiling. Int. J. Fatigue 2021, 145, 106073. [Google Scholar] [CrossRef]
  8. Wang, C.; Lai, Y.; Wang, L.; Wang, C. Dislocation-based study on the influences of shot peening on fatigue resistance. Surf. Coat. Technol. 2020, 383, 125247. [Google Scholar] [CrossRef]
  9. Deng, W.; Wang, C.; Lu, H.; Meng, X.; Wang, Z.; Lv, J.; Luo, K.; Lu, J. Progressive developments, challenges and future trends in laser shock peening of metallic materials and alloys: A comprehensive review. Int. J. Mach. Tools Manuf. 2023, 191, 104061. [Google Scholar] [CrossRef]
  10. Thangamani, G.; Anand, P.I.; Sahu, A.; Singh, I.; Gianchandani, P.K.; Tamang, S.K. Enhance the microstructure and mechanical properties of directed energy deposition-Arc (DED-Arc) stainless steel 308L using laser shock peening process. Prog. Addit. Manuf. 2025, 1–19. [Google Scholar] [CrossRef]
  11. Thangamani, G.; Tamang, S.K.; Badhai, J.; Karthik, S.; Narayanan, J.A.; Thangaraj, M.; Thirugnanasambandam, A.; Sonawane, A.; Anand, P.I. Elucidating the impact of laser shock peening on the biocompatibility and corrosion behaviour of wire arc additive manufactured SS316L bone staples. Appl. Phys. A-Mater. Sci. Process. 2025, 131, 126. [Google Scholar] [CrossRef]
  12. Thangamani, G.; Tamang, S.K.; Patel, M.S.; Narayanan, J.A.; Pallagani, J.; Rose, P.; Gianchandani, P.K.; Thirugnanasambandam, A.; Anand, P.I. Post-processing treatment of Wire Arc Additive Manufactured NiTi shape memory alloy using laser shock peening process: A study on tensile behavior and fractography analysis. Int. J. Adv. Manuf. Technol. 2025, 136, 3315–3327. [Google Scholar] [CrossRef]
  13. Thangamani, G.; Tamang, S.K.; Badhai, J.; Karthik, S.; Narayanan, J.A.; Thirugnanasambandam, A.; Sonawane, A.; Anand, P.I. Post-processing of wire-arc additive manufactured stainless steel 316 l bone staples using laser shock peening: A mechanical and antibacterial study. Prog. Addit. Manuf. 2024, 10, 5525–5540. [Google Scholar] [CrossRef]
  14. Zhou, L.; Zhao, T.; Yu, Y.; Liu, P.; Pan, X. Effect of Laser Shock Peening on High-Cycle Fatigue Performance of 1Cr18Ni9Ti/GH1140 Weld. Metals 2022, 12, 1495. [Google Scholar] [CrossRef]
  15. Li, X.; Ma, R.; Liu, X.; Lv, Q.; Wang, X.; Tian, Z. Effect of laser shock peening on fatigue properties of U75VG rail flash-butt welding joints. Opt. Laser Technol. 2022, 149, 107889. [Google Scholar] [CrossRef]
  16. Thangamani, G.; Kumar Tamang, S.; Patel, M.S.; Arackal Narayanan, J.; Thangaraj, M.; Zhang, J.; Kumar Gianchandani, P.; Iyamperumal Anand, P. Studies on the effect of laser shock peening intensity on the mechanical properties of wire arc additive manufactured SS316L. J. Manuf. Mater. Process. 2024, 9, 8. [Google Scholar] [CrossRef]
  17. Geethapriyan, T.; Palani, I.; Singh, M.K.; Rai, D.K.; Shanmuga Priyan, V.; Subbu, S.K. Post-processing of wire arc additive manufactured stainless steel 308L to enhance compression and corrosion behavior using laser shock peening process. J. Mater. Eng. Perform. 2024, 33, 9267–9281. [Google Scholar] [CrossRef]
  18. Jin, D.; Liu, Z.; Li, Z.; Guo, C.; Sun, M. Experiments and numerical simulations on fatigue properties of laser shock peening for FV520B steel. Opt. Laser Technol. 2025, 182, 112198. [Google Scholar] [CrossRef]
  19. Zhang, C.; Dong, Y.; Ye, C. Recent Developments and Novel Applications of Laser Shock Peening: A Review. Adv. Eng. Mater. 2021, 23, 2001216. [Google Scholar] [CrossRef]
  20. Huang, J.; Xu, J.; Wu, X.; Wang, C.; Jin, C.; Ji, X.; Han, T. Effects of different forging ratios on microstructure, mechanical properties and friction and wear behaviour of Q355D steel. Can. Metall. Q. 2024, 64, 927–942. [Google Scholar] [CrossRef]
  21. Zhang, Y.Q.; Yin, Y.; Qin, W.J.; Wang, X.F.; Li, F.K. Characterization of Mechanical Properties of Welds of Q355D Steel by DSI Technique. J. Mater. Civ. Eng. 2024, 36, 04023617. [Google Scholar] [CrossRef]
  22. Lu, Y.; Wang, R.; Han, Q.; Yu, X.; Yu, Z. Experimental investigation on the corrosion and corrosion fatigue behavior of butt weld with G20Mn5QT cast steel and Q355D steel under dry–wet cycle. Eng. Fail. Anal. 2022, 134, 105977. [Google Scholar] [CrossRef]
  23. Atabaki, M.M.; Nikodinovski, M.; Chenier, P.; Ma, J.; Harooni, M.; Kovacevic, R. Welding of aluminum alloys to steels: An overview. J. Manuf. Sci. Prod. 2014, 14, 59–78. [Google Scholar] [CrossRef]
  24. Wang, D.Q.Q.; Yao, D.D.; Gao, Z.B.; Wang, Q.; Zhang, Z.F.; Li, X.W. Fatigue mechanism of medium-carbon steel welded joint: Competitive impacts of various defects. Int. J. Fatigue 2021, 151, 106363. [Google Scholar] [CrossRef]
  25. Zhang, Y.Q.; Yin, Y.; Qin, W.J.; Bai, J.H. Thermal Simulation and Fracture Resistance Evaluation of Coarse-Grain Heat-Affected Zone in Welds of Q355D Steel. J. Mater. Civ. Eng. 2023, 35, 04023370. [Google Scholar] [CrossRef]
  26. Dhakal, B.; Swaroop, S. Review: Laser shock peening as post welding treatment technique. J. Manuf. Process. 2018, 32, 721–733. [Google Scholar] [CrossRef]
  27. Liu, W.J.; Sun, Y.F.; Yu, X.F.; Su, Y.; Li, C.G. Effect of the Absorption Layer on the Microstructure and Mechanical Properties of M50 Steel by Laser Shock Peening. JOM 2024, 76, 7247–7258. [Google Scholar] [CrossRef]
  28. Yella, P.; Venkateswarlu, P.; Buddu, R.K.; Vidyasagar, D.V.; Rao, K.B.S.; Kiran, P.P.; Rajulapati, K.V. Laser shock peening studies on SS316LN plate with various sacrificial layers. Appl. Surf. Sci. 2018, 435, 271–280. [Google Scholar] [CrossRef]
  29. Johnson, J.; Rohde, R. Dynamic deformation twinning in shock-loaded iron. J. Appl. Phys. 1971, 42, 4171–4182. [Google Scholar] [CrossRef]
  30. Ding, K.; Ye, L. Simulation of multiple laser shock peening of a 35CD4 steel alloy. J. Mater. Process. Technol. 2006, 178, 162–169. [Google Scholar] [CrossRef]
  31. Li, W.; Chen, H. Tensile performance of normal and high-strength structural steels at high strain rates. Thin-Walled Struct. 2023, 184, 110457. [Google Scholar] [CrossRef]
  32. Peyre, P.; Berthe, L.; Scherpereel, X.; Fabbro, R. Laser-shock processing of aluminium-coated 55C1 steel in water-confinement regime, characterization and application to high-cycle fatigue behaviour. J. Mater. Sci. 1998, 33, 1421–1429. [Google Scholar] [CrossRef]
  33. Wang, M.; Chen, X.; Dai, F.; Siddiquee, A.N.; Konovalov, S. Effects of different laser shock processes on the surface morphology and roughness of TC4 titanium alloy. J. Mater. Process. Technol. 2024, 325, 118301. [Google Scholar] [CrossRef]
  34. Shang, D.; Duan, C.; Luo, X.; Cao, X.; Hao, X. Numerical and Experimental Study on the Fatigue Behavior of X80 Steel Treated by Biomimetic Laser Shock Peening. J. Mater. Eng. Perform. 2024, 33, 13709–13720. [Google Scholar] [CrossRef]
  35. Yang, S.; Zhang, M.; Yu, P.H.; Sun, Y.F.; Su, Y.; Yu, X.F. Effect of laser shock peening overlap rate on microstructure and wear resistance of M50 steel. Opt. Laser Technol. 2025, 184, 112548. [Google Scholar] [CrossRef]
  36. Mamundi Azaath, L.; Mohan, E.; Natarajan, U. Effect of rake angle and tool geometry during machining process of AISI 4340 steel in finite element approach. Mater. Today Proc. 2021, 37, 3731–3736. [Google Scholar] [CrossRef]
  37. Milani, A.S.; Dabboussi, W.; Nemes, J.A.; Abeyaratne, R.C. An improved multi-objective identification of Johnson-Cook material parameters. Int. J. Impact Eng. 2009, 36, 294–302. [Google Scholar] [CrossRef]
  38. Sirigiri, V.K.R.; Gudiga, V.Y.; Gattu, U.S.; Suneesh, G.; Buddaraju, K.M. A review on Johnson Cook material model. Mater. Today-Proc. 2022, 62, 3450–3456. [Google Scholar] [CrossRef]
  39. Murugesan, M.; Jung, D.W. Johnson Cook Material and Failure Model Parameters Estimation of AISI-1045 Medium Carbon Steel for Metal Forming Applications. Materials 2019, 12, 609. [Google Scholar] [CrossRef]
  40. Hfaiedh, N.; Peyre, P.; Song, H.; Popa, I.; Ji, V.; Vignal, V. Finite element analysis of laser shock peening of 2050-T8 aluminum alloy. Int. J. Fatigue 2015, 70, 480–489. [Google Scholar] [CrossRef]
  41. Knoedel, P.; Gkatzogiannis, S.; Ummenhofer, T. Practical aspects of welding residual stress simulation. J. Constr. Steel Res. 2017, 132, 83–96. [Google Scholar] [CrossRef]
  42. Zhang, K.Y.; Dong, W.C.; Lu, S.P. Finite element and experiment analysis of welding residual stress in S355J2 steel considering the bainite transformation. J. Manuf. Process. 2021, 62, 80–89. [Google Scholar] [CrossRef]
  43. Zhang, Y.; Su, W.X.; Dong, H.; Li, T.; Cao, H.Y. Effect of Welding Sequence and Constraint on the Residual Stress and Deformation of Thick Welded Butt Joint Made of Q345qD Steel. Adv. Civ. Eng. 2022, 2022, 5966274. [Google Scholar] [CrossRef]
  44. Wang, B.; Zhou, L.; Du, J.G.; Cao, Y.S. Analysis of residual stresses in electron beam welding with filler wire of Ti62A alloy. J. Mater. Res. Technol. 2023, 23, 985–997. [Google Scholar] [CrossRef]
  45. Deng, D. Influence of deposition sequence on welding residual stress and deformation in an austenitic stainless steel J-groove welded joint. Mater. Des. 2013, 49, 1022–1033. [Google Scholar] [CrossRef]
  46. Darcis, P.H.P.; Katsumoto, H.; Payares-Asprino, M.C.; Liu, S.; Siewert, T.A. Cruciform fillet welded joint fatigue strength improvements by weld metal phase transformations. Fatigue Fract. Eng. Mater. Struct. 2008, 31, 125–136. [Google Scholar] [CrossRef]
  47. Lu, J.Z.; Luo, K.Y.; Zhang, Y.K.; Cui, C.Y.; Sun, G.F.; Zhou, J.Z.; Zhang, L.; You, J.; Chen, K.M.; Zhong, J.W. Grain refinement of LY2 aluminum alloy induced by ultra-high plastic strain during multiple laser shock processing impacts. Acta Mater. 2010, 58, 3984–3994. [Google Scholar] [CrossRef]
  48. Su, C.; Zhou, J.; Meng, X.; Huang, S. Improvement in Fatigue Performance of Aluminium Alloy Welded Joints by Laser Shock Peening in a Dynamic Strain Aging Temperature Regime. Materials 2016, 9, 799. [Google Scholar] [CrossRef]
  49. Wen, F.; Long, Z.; Xing, Z.; Liu, X.; Huang, X.; Zhou, L. The effect of laser shock peening on very high cycle fatigue properties of laser welded 2A60 aluminum alloy joints. Eng. Fract. Mech. 2023, 290, 109537. [Google Scholar] [CrossRef]
  50. Feng, X.; Pan, X.; He, W.; Liu, P.; An, Z.; Zhou, L. Improving high cycle fatigue performance of gas tungsten arc welded Ti6Al4V titanium alloy by warm laser shock peening. Int. J. Fatigue 2021, 149, 106270. [Google Scholar] [CrossRef]
  51. Sadeh, S.; Malik, A. Investigation into the effects of laser shock peening as a post treatment to laser impact welding. Mater. Des. 2021, 205, 109701. [Google Scholar] [CrossRef]
  52. Sheng, Y.Q.; Feng, A.X.; Cao, X.G.; Lin, G.H.; Ronaldo, C.N. Effects of laser non-uniform shock peening on the microstructure and fatigue performance of SUS 304 stainless steel welded joints. Mater. Sci. Eng. A-Struct. 2024, 914, 147186. [Google Scholar] [CrossRef]
  53. Wan, Z.D.; Guo, W.; Jia, Q.; Chen, G.X.; Chi, J.X.; Zhang, H.Q.; Wu, S.H.; Peng, C.; Peng, P. Effects of laser shock peening on microstructure and mechanical properties of TIG welded alloy 600 joints. Mat. Sci. Eng. A-Struct. 2021, 808, 140914. [Google Scholar] [CrossRef]
  54. Singh, T. Nanoparticles reinforced joints produced using friction stir welding: A review. Eng. Res. Express 2023, 5, 022001. [Google Scholar] [CrossRef]
  55. Cao, Z.; Cui, L.; Luo, S.; Su, H.; Pang, Z.; Zhao, W.; Zhang, L.; He, W.; Liang, X. Superior fretting wear resistance of titanium alloys from stable gradient nanostructures induced by laser shock peening. Int. J. Plast. 2025, 188, 104293. [Google Scholar] [CrossRef]
  56. Chattopadhyay, A.; Muvvala, G.; Sarkar, S.; Racherla, V.; Nath, A.K. Effect of laser shock peening on microstructural, mechanical and corrosion properties of laser beam welded commercially pure titanium. Opt. Laser Technol. 2021, 133, 106527. [Google Scholar] [CrossRef]
  57. Hatamleh, O.; DeWald, A. An investigation of the peening effects on the residual stresses in friction stir welded 2195 and 7075 aluminum alloy joints. J. Mater. Process. Technol. 2009, 209, 4822–4829. [Google Scholar] [CrossRef]
  58. An, J.; Meng, F.Y.; Lv, X.X.; Liu, H.Y.; Gao, X.X.; Wang, Y.B.; Lu, Y. Improvement of mechanical properties of stainless maraging steel laser weldments by post-weld ageing treatments. Mater. Des. 2012, 40, 276–284. [Google Scholar] [CrossRef]
  59. Cheng, X.H.; Fisher, J.W.; Prask, H.J.; Gnäupel-Herold, T.; Yen, B.T.; Roy, S. Residual stress modification by post-weld treatment and its beneficial effect on fatigue strength of welded structures. Int. J. Fatigue 2003, 25, 1259–1269. [Google Scholar] [CrossRef]
  60. Gong, Z.Y.; Zhang, T.M.; Chen, Y.H.; Lu, J.Z.; Ding, X.Y.; Zhang, S.Y.; Lan, M.; Shen, Y.; Wang, S.L. Effect of laser shock peening on stress corrosion cracking of TC4/2A14 dissimilar metal friction stir welding joints. J. Mater. Res. Technol. 2024, 30, 1716–1725. [Google Scholar] [CrossRef]
  61. Chu, J.P.; Rigsbee, J.M.; Banas, G.; Elsayed-Ali, H.E. Laser-shock processing effects on surface microstructure and mechanical properties of low carbon steel. Mat. Sci. Eng. A-Struct. 1999, 260, 260–268. [Google Scholar] [CrossRef]
  62. Fu, W.J.; Huang, Y.J.; Sun, J.F.; Ngan, A.H.W. Strengthening CrFeCoNiMnCu high entropy alloy via laser shock peening. Int. J. Plast. 2022, 154, 103296. [Google Scholar] [CrossRef]
  63. Kashaev, N.; Ushmaev, D.; Ventzke, V.; Klusemann, B.; Fomin, F. On the application of laser shock peening for retardation of surface fatigue cracks in laser beam-welded AA6056. Fatigue Fract. Eng. Mater. Struct. 2020, 43, 1500–1513. [Google Scholar] [CrossRef]
  64. Guo, H.; Wan, J.; Liu, Y.; Hao, J. Experimental study on fatigue performance of high strength steel welded joints. Thin-Walled Struct. 2018, 131, 45–54. [Google Scholar] [CrossRef]
Figure 1. Specimen geometry. (a) Sampling location; (b) dimensions.
Jmmp 09 00273 g001aJmmp 09 00273 g001b
Figure 2. Schematic of laser shock peening (LSP) principle. (a) Apparatus setup; (b) working mechanism.
Jmmp 09 00273 g002
Figure 3. Schematic of LSP processing. (a) Treatment zone; (b) scanning path.
Jmmp 09 00273 g003
Figure 4. Local mesh refinement.
Jmmp 09 00273 g004
Figure 5. 3D model and treatment region.
Jmmp 09 00273 g005
Figure 6. Welding residual stress distribution. (a) S11 stress distribution;(b) S22 stress distribution.
Jmmp 09 00273 g006
Figure 7. Welding residual stress.
Jmmp 09 00273 g007
Figure 8. Residual stress distribution after LSP treatment. (a) S11 stress distribution; (b) S22 stress distribution.
Jmmp 09 00273 g008
Figure 9. LSP-treated joint residual stress: (a) for S11 stress trends in X-direction; (b) for S22 stress trends in X-direction; (c) for S11 stress trends in depth direction (x = 11 mm); and (d) for S22 stress trends in depth direction (x = 11 mm).
Jmmp 09 00273 g009
Figure 10. Surface hardness. (a) Upper surface; (b) lower surface.
Jmmp 09 00273 g010
Figure 11. Hardness distribution in the depth direction of the upper surface (d = 10 mm).
Jmmp 09 00273 g011
Figure 12. Fatigue test results. (a) Base material; (b) butt weld specimen; (c) LSP-treated joint specimen; and (d) comparison of three specimens.
Jmmp 09 00273 g012
Figure 13. Fatigue damage curves.
Jmmp 09 00273 g013
Figure 14. Fracture morphology diagram.
Jmmp 09 00273 g014
Figure 15. Fracture morphology of base metal specimen.
Jmmp 09 00273 g015
Figure 16. Fracture morphology of a butt weld joint.
Jmmp 09 00273 g016
Figure 17. Fracture morphology of LSP.
Jmmp 09 00273 g017
Table 1. Sample categories.
Steel GradeGroup TypeSpecimen TypeSpecimen TypeNumber
Q355DABase material 16
BButt jointER100S-G13
CLSP-treatedER100S-G13
Table 2. Chemical composition of base metal and electrode.
Chemical CompositionCMnSiPSNiCrMoV
Q355D0.1721.360.2210.020.0030.0150.2120.010.01
ER100S-G 0.12 2 0.6 0.035 0.035 0.5 0.5 0.3 0.3
Table 3. Laser processing parameters.
Laser Wavelength
(nm)
Laser Energy
(J)
Pulse Width
(ns)
Repetition Frequency
(Hz)
Spot Overlapping Rate
(%)
1064520550
Table 4. Johnson–Cook’s coefficients.
Material TypeA (MPa)B (MPa)nCm
Q355D304.1771.680.4520.0391.108
ER100S-G7206000.30.0221.10
Table 5. Comparison of hardness before and after LSP strengthening.
ZoneSurfaceBefore LSP (HV)After LSP (HV)Increase (%)
WZUpper2752905.45
Lower24827611.3
HAZUpper17521522.9
Lower17120620.5
BMUpper20022311.5
Lower19722112.1
Table 6. Fatigue test parameters and data.
Specimen Number S m a x (MPa)N (Cycle)Specimen Number S m a x (MPa)N (Cycle)
BM-130021,605BJ-5250100,213
BM-229071,149BJ-625081,955
BM-3290107,722BJ-7240294,705
BM-4280158,440BJ-8240259,075
BM-527559,549BJ-9230651,384
BM-627098,182BJ-10230714,985
BM-727088,613BJ-112201,000,000
BM-8260293,146LSP-128055,555
BM-9260280,333LSP-228043,008
BM-10250431,595LSP-327092,684
BM-11250441,313LSP-427064,883
BM-12250494,486LSP-5260130,271
BM-13245388,979LSP-6260168,359
BM-142401,000,000LSP-7250226,085
BJ-127044,434LSP-8250207,562
BJ-227029,485LSP-9240468,575
BJ-326054,116LSP-10240435,489
BJ-426058,553LSP-112301,000,000
Note: Where BM is the base material, BJ is the butt-welded specimen, and LSP is the LSP-treated joint specimen.
Disclaimer/Publisher’s Note: The statements, opinions and data contained in all publications are solely those of the individual author(s) and contributor(s) and not of MDPI and/or the editor(s). MDPI and/or the editor(s) disclaim responsibility for any injury to people or property resulting from any ideas, methods, instructions or products referred to in the content.