Abstract
This paper addresses the mechanical characterization of dissimilar overlap joints made by autogenous laser welding between thin sheets of low-carbon steel (CS) and austenitic stainless steel (SS) with an optimized welding technology able to produce sound overlap joints. This involved applying the laser beam from the CS-side to reduce the SS overheating. The research is focused on the analysis of combined tensile-shear behavior of the weld and of the heat-affected zones. During testing, the applied tensile-shear load rotates the weld connecting the CS and SS plates. The rotation angle transmitted to the free ends of the plates, together with relevant strain fields, were measured by using a digital image correlation system, VIC-2D. Thus, it was found that the weld acts as a non-linear hinge which experiences a sudden loss of stiffness when strain concentrations develop from the weld ligament edges towards the loaded sides of the plates. The welded joint fails by yielding localization and necking in the CS plate, far from the weld. This mode of failure is a consequence of the weld and heat-affected zone strength mismatches of 1.09 and 1.33, respectively. These values are consistent with the hardness profile and the documented microstructural heterogeneities.
1. Introduction
Autogenous laser welding, an efficient and productive method based on a high degree of automation, is employed for joining similar and dissimilar materials, such as magnesium and aluminum alloys, and steels, without additional filler metal. Due to the significant advantages, in terms of high productivity, high-quality, narrow weld seams, small width of the heat-affected zone (HAZ), and low deformations and distortions, this joining method is used in the automotive, railway, aerospace, oil and gas, and shipbuilding industries [1,2,3,4,5,6].
Despite continuous development of welding technologies, dissimilar material welding is still considered a challenge and requires close attention with regard to the technology design because of different chemical compositions and thermo-physical properties of base materials (BMs) that further determine a distinct mechanical and metallurgical response of materials to a fusion welding process [7,8,9,10,11,12]. For instance, research on laser welding of similar and dissimilar steels [13] has shown that low heat input and a high cooling rate promote the formation of a hard and brittle martensite phase within the weld and HAZ. Pakmanesh and Shamanian studied the influence of pulsed Nd: YAG laser welding parameters—peak power, pulse-duration, and frequency—on the lap-joint of a 316L stainless steel foil, aiming to reduce the potential defects that could be developed during laser welding. The results showed that the greatest influence on the occurrence of defects, such as the underfill and undercut in the case of welded lap joints made from stainless steel, is due to the laser power [14]. Hence, adequate welding technologies are required to avoid in-service damage and failure of weldments.
Mechanical and metallurgical behavior of laser-welded lap joints of steels was reported in [15,16,17,18,19,20,21], though the information is still insufficient to fully understand the process effects in the BMs, especially when dissimilar metals are joined. Moreover, the failure mode, determined by the degradation level of materials during welding, is an important phenomenon with major consequences for the behavior of in-service welded structures. Kim et al. [22] studied the mechanical properties of a laser-welded lap joint and observed that the shear strength of the respective joint was 86.8% of that of the BM. Other authors [23] showed that the strength of the laser-welded lap joints made of temper-rolled austenitic stainless steel are slightly lower than the BM yield strength.
Benasciutti et al. [24] proposed a simplified mechanical model to derive theoretical formulae for the mechanical characterization of laser-welded overlap joints as a function of BM properties and of the weld-bead geometry. A theoretical, mechanical model to estimate the stress field in laser-welded lap joints under a tensile-shear load capable of predicting the bearing load capacity of the joint was developed by Miyazaki and Furusako [25]. Jaewon Lee et al. researched the shear failure mechanism of laser welds in lap-shear specimens of high-strength, low-alloy steel initiated close to the BM, at the HAZ boundary [26]. Ha and Huh [27] proposed a novel failure criterion for the description of failure behavior of laser-welded overlap joints under combined normal and shear loading conditions. This new failure criterion is useful to accurately predict the failure of laser welds and the subsequent deformation mode of an auto-body in the crash analysis. Sinha et al. [28] examined the relationship between the variation in weld seam and tensile-shear strength in the laser welding of galvanized steel in a lap-joint configuration. Guo X. et al. [29] conducted research on fatigue resistance and failure behavior of penetration and non-penetration laser-welded overlap joints of 301L plates. The weld bead microstructure consisted of an austenite matrix with δ ferrite dendrites solidified as primary ferrite. In both studied cases, the fatigue crack initiated at the fusion boundary on the lap-joint interface.
This present study addresses the mechanical characterization of dissimilar overlap joints made by autogenous laser welding between 0.5 mm thin sheets of low-carbon steel (CS) and austenitic stainless steel (SS) with an optimized welding technology able to produce sound and defect-free joints. The research is purely experimental, based on testing in tension flat, transverse-welded specimens, and involves the use of VIC-2D (a digital image correlation technique) in an original way, so that one of the lateral speckle-painted surfaces of the specimens can be examined, despite the low thicknesses of the welded joint and the two base metals. The purpose of the research is twofold: to obtain new insights related to the progressive increase in the angle of rotation of the weld until the specimen fails and to determine the local tensile-shear characteristics of the weld and of the joint HAZs. These data are discussed with respect to the results of the microstructural analysis and of microhardness measurements performed on the CS-SS joint prior to mechanical testing.
2. Materials and Methods
2.1. Materials and Welding Procedure
The dissimilar overlap joints analyzed in this present study were made by autogenous laser welding between thin plates of a low-carbon steel (CS), EN 1.0330 grade, and an austenitic stainless steel (SS), EN 1.4307 grade, with dimensions of 150 mm × 300 mm and a thickness of 0.5 mm. The nominal chemical composition of the two plates, (the aforementioned BMs), is given in Table 1.

Table 1.
Nominal chemical composition of the two base metal plates [wt %].
Figure 1a illustrates the sketch of the autogenous laser welding process performed with the Nd: YAG DY033—3300 W (Rofin Sinair, model DY 033, Hamburg, Germany) equipment at the Laser Center at the Polytechnic University of Madrid. This was used in a continuous wave, keyhole welding mode by tilting the laser beam 5 degrees towards one of the weld sides. The upper plate for the overlap welding was the CS plate because of higher thermal conductivity [4,7] when compared with the SS one. Several preliminary tests had been previously performed to obtain the optimum welding parameters based on defect absence and full penetration as a necessary, but not sufficient, condition for sound joint manufacturing. These parameters, given in Table 2, were further employed for the single-pass overlap laser welding of the CS–SS plates. The welding area was Ar gas-protected at a constant flow rate of 15 L/min from the SS plate joint backside. Figure 1b provides a general view of the welding process, meanwhile Figure 1c shows the welding jig fixture of the CS–SS plates used to prevent any unwanted movement and control the deformation.
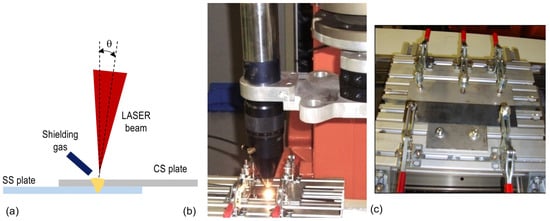
Figure 1.
(a) Sketch of the autogenous laser welding process; (b) general view of the welding area; (c) detail showing the welding jig fixture of the CS–SS plates.

Table 2.
Autogenous laser welding parameters.
2.2. Testing Methods
Figure 2a shows the sketch of the three flat tensile specimens used to determine the mechanical characteristics of the CS and SS plates given in Table 3. These were instrumented with two virtual extensometers of VIC-2D (from Correlated Solutions, Inc., Irmo, SC, USA) [30], mounted, respectively, on the specimen frontal and lateral faces which had been previously fine speckle-painted. According to previous research experience of the authors [31], the digital image correlation system, VIC-2D, provided good measurements of in-plane displacements. However, in this case, it was considered necessary to verify the accuracy of the system for acquiring data from the lateral face of specimen, which had a thickness of only 0.5 mm. Accordingly, a third, but conventional extensometer of 12.5 mm gauge length was employed to compare the acquired data with those measured by VIC-2D.
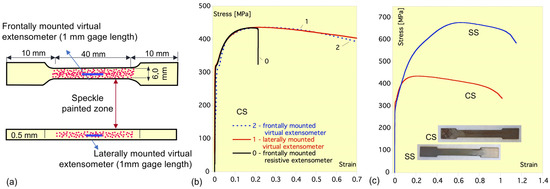
Figure 2.
(a) Sketch of the flat-tensile, transverse-welded specimen indicating the virtual extensometer positions on the respective speckle-painted, frontal and lateral faces; (b) stress–strain curves of the CS plates resulting from measurements with virtual extensometers frontally and laterally mounted and with a resistive extensometer; (c) stress–strain curves of the CS and SS plates and corresponding images of tensile specimens.

Table 3.
Chemical composition of the CS and SS plates [wt.%].
Figure 2b shows the agreement of the strain–stress curves resulting from the measurements made on the CS specimen taken with the three extensometers. The only notable differences were due to the location of the resistive extensometer, which stopped detecting strain changes beyond maximum load because necking developed outside its strain gauge [32]. Figure 2c contains the stress–strain curves of CS and SS tensile-flat specimens obtained from the laterally mounted virtual extensometers, together with their corresponding images.
These pure tensile tests, as well as the further combined tensile-shear tests performed to characterize the mechanical performance of the CS–SS dissimilar overlap joints, were performed with an Instron 8501 servo-hydraulic testing machine (Instron, 825 University Ave., Norwood, MA, USA), equipped with a static load cell of 5 kN. The two types of tests were carried out at a constant crosshead speed of 0.05 mm/min. The geometric configuration of the three specimens used for tensile-shear testing (Figure 3a) resulted from cutting the laser-welded CS-SS plates with an electrical discharge machine (EDM). Figure 3b shows two of these specimens. The test setup, also shown in Figure 3a, requires two compensation spacers, with each of them being mounted at the clamping ends of the specimen, to ensure that the load consists of two equal, opposite, and collinear forces lying on the loading axis of the testing gripping device. The presence of the spacers made the loading axis coincide with the longitudinal axis of symmetry shared by the faces of both plates in mutual contact. The coincidence holds throughout the loading process for the respective loaded sides of the welded plates, since the unloaded ones, from the weld to their free ends, progressively rotate as rigid bodies. Lastly, a sufficiently large area of one of the lateral faces of the specimen was fine speckle-painted. This area, with the joint included, allowed the VIC-2D virtual extensometers to operate in the image sequence captured during testing. A general view of the tensile-shear test initiation is illustrated in Figure 3c, whereas Figure 3d shows a detail capturing of the CS-SS joint at the beginning of the test.
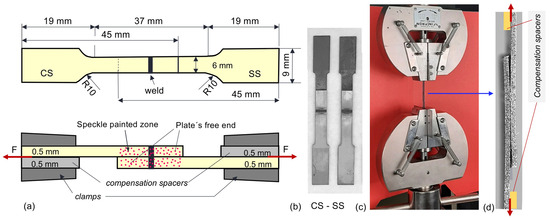
Figure 3.
(a) Sketch of the tested specimens and of the gripping device; (b) CS–SS specimens before testing; (c) testing initiation; (d) detail capturing the CS-SS joint at the beginning of the test.
In addition, to characterize the CS–SS overlap joint, metallographic samples prepared according to ASTM E3 [33] were examined by scanning electron microscopy (SEM) combined with energy dispersive X-ray analysis (EDX). This allowed the joint main chemical elements, such as Cr, Ni and Fe, to be identified. In addition, the samples were subjected to microhardness analysis, as a classical alternative and effective means for detecting changes in the mechanical properties of the dissimilar CS–SS joint. The microhardness measurements were performed according to EN ISO 6507 [34], with a testing force of 0.1 kgf (0.98 N) and a holding time of 10 s. Lastly, the microstructural characterization of the joint required the selective etching of the samples as per ASTM E407 [35], with Beraha II and Nital 2% solutions in the respective SS and CS sides of the joint.
3. Results and Discussion
3.1. Microstructural Features of the CS–SS Overlap Welded Joint
The macrostructure of the dissimilar CS–SS joint, presented in Figure 4a, shows the typical features determined by an autogenous welding process made in the keyhole mode from the CS side, by tilting the laser beam 5 degrees with respect to normal incidence. Due to the differences in the thermo-physical properties of the joined steels, particularly of thermal conductivity, a slight asymmetry, consisting of a considerably greater HAZ in CS, and a higher participation of the SS material to the weld formation were found in the microstructural analysis. Thus, the lower thermal conductivity of SS (16 W/m·K) when compared to that of CS (45 W/m·K) leads to heat concentrations that increase the dilution of SS by approximately 5% above that of CS [4,7,36,37]. Then, the slower heat dissipation in the SS side explains the smaller formed HAZ. In addition, two minor imperfections can be observed at the extremities of the weld ligament attaching the CS-SS plates. These imperfections separate the plates and are probably due to the SS higher coefficient of thermal expansion which increases the likelihood of thermal distortion (Figure 4a).
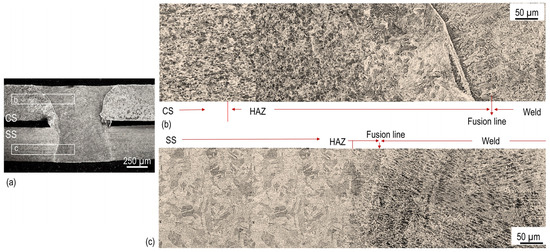
Figure 4.
Optical microscope micrographs showing typical features of the laser welded CS–SS overlap joint microstructure: (a) macroscopic image of the joint with the positions of gradual microstructural changes in the joint (b) upper side, and (c) lower side.
Figure 4b shows the gradual microstructural changes in the upper part of the joint, starting from the CS plate in as-received condition, characterized by slightly deformed fine ferrite-pearlitic grains indicating the rolling direction. This is followed by CS-HAZ, a coarse-grain region of Widmanstätten structure, which occurs by partial transformation in the solid-state of austenite to ferrite, illustrated at higher magnification in the SEM image (in lens mode) given in Figure 5a. Next, the fusion zone that depicts a narrow band at the HAZ-end indicates the solidification front boundary of the welding pool. This consists of ferrite and martensite platelets nucleated and grown in austenitic matrix from the fusion line by fast cooling (Figure 5a).

Figure 5.
SEM micrographs detailing the HAZ, fusion line, and the welded joint on: (a) CS-side; (b) SS-side.
The lower side of the joint (Figure 4c) reveals the overall microstructural changes from SS-BM towards the weld. The typical SS microstructure, consisting of equiaxed grains and annealing austenite twins, is followed by a very small SS-HAZ (Figure 5b). This extends from the fusion band up to SS-BM and is formed by fine elongated ferrite contained into austenitic matrix. The high cooling rate and the low thickness of the SS plate determine that the weld-metal started solidifying from the narrow fusion band in the ferritic-austenitic (FA) mode, a dual-phase microstructure where primary ferrite is surrounded by interdendritic austenite [38,39,40,41]. Figure 5b reveals these two phases, oriented in the direction of the solidification heat flow. This observation fully agrees with Inoue and Koseki’s [38] research on the peculiarities of FA solidification in austenitic stainless steels based on welding processes, with the main benefit being the reduction in hot cracking initiation during welding.
Figure 6a illustrates the EDX overall map indicating the Ka peaks of Cr, Ni, and Fe in the CS-SS overlap joint. It also contains two horizontal lines across the joint cross-section, with the first line being positioned in the middle of the joint upper part, and the latter in the middle of the joint lower part. The corresponding results of the quantitative analysis of Cr Ka, Ni Ka, and Fe Ka obtained on these two lines are shown in Figure 6b,c. The elemental variation results, detected along Line 1, reveal the main changes related to the elemental composition of the weld, consisting of Fe reduction and Cr and Ni uptake, because of higher estimated participation of SS to the weld formation. On the contrary, the line scan analysis along Line 2 indicates the uptake of Fe and the reduction of Cr and Ni into the lower part of the weld, with respect to the SS chemical composition, with the phenomenon being explained by the process of reciprocal diffusion of chemical elements from one material to another. These results are consistent with the overall elemental mapping (Figure 6a) present in the SEM image of the joint (Figure 6d), though the distribution of Fe, Cr, and Ni into the welded joint is better reflected in the single-element maps from Figure 6e, Figure 6f, and Figure 6g, respectively.
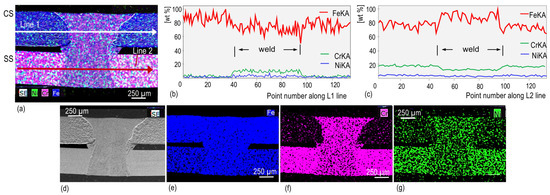
Figure 6.
EDX maps and line analysis of Cr, Ni, and Fe in the laser-welded CS-SS overlap joint: (a) EDX overall elemental mapping; (b) EDX analysis along Line 1; (c) EDX analysis along Line 2; (d) SEM image of the joint; and elemental mapping of: (e) Fe; (f) Cr; and (g) Ni.
The averages of Cr and Ni, resulting from the EDX analysis, of 10.86% and 4.95%, respectively, are consistent with the corresponding results of 10.69% and 4.72% estimated from the chemical composition of the two BMs (Table 1) for 55% participation of SS in the weld formation. Then, the respective computed values of the Cr- and Ni-equivalents of 11.57% and 9.02% indicate the formation of an austenitic–martensitic stainless steel in the weld [42,43].
3.2. Microhardness Analysis of the CS-SS Overlap Welded Joint
Figure 7 shows the results of the microhardness measurements performed along four indentation lines evenly spaced across the joint thickness, two of them in the CS upper side and the other two in the SS lower side of the joint, as depicted on the weld macrostructure. To ensure highly accurate measurement along each line, the distance between the applied indentations was set to 200 µm. Two distinct hardness profiles were obtained, one for the CS side and another for the SS side of the welded joint, plotted in the graph given in Figure 7, in blue and red, respectively. Each value of these profiles resulted from averaging two hardness measurements made on the CS and SS lines at positions equidistant from the weld center. The average hardness of CS (150 ± 7 HV0.1) was 25% lower than that of SS (200 ± 10 HV0.1) and the measurements performed in the weld zone showed an average value of 435 ± 10 HV0.1, which is three and two times higher than the values found in CS and SS, respectively. Then, because the width of SS-HAZ was less than 100 µm, its average hardness was estimated to be close to that of the weld bead. In contrast, the measured average hardness of CS-HAZ was 180 ± 7 HV0.1. Hence, the welded joint regions have not only distinct metallurgical properties but also distinct mechanical characteristics.
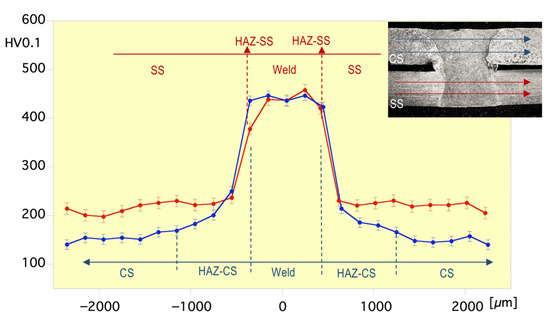
Figure 7.
Microhardness profiles in the upper and lower sides of the joint, as resulted from the measurements made on the imprint lines indicated on the joint macrostructure.
3.3. Combined Tensile-Shear Performance of the CS-SS Overlap Welded Joint
Figure 8a illustrates a set of five representative images containing the speckle-painted lateral face of the tensile-shear specimen captured during testing, by using the VIC-2D system. These prove that, throughout the test, the loading axis lies on the tensile-loaded sides of the welded plates. In contrast, the two unloaded sides of the plates, namely the CS and SS free ends, experience equal continuous rigid body rotations with respect to the loading axis. The rotation angles were measured with the VIC-2D v5 software through the in-plane displacements of two points defining the straight line L1 (1 mm length), virtually mounted on the unloaded free end of the CS plate (Figure 8a) during specimen testing. The bending deformation of the plates led to rotations of the free ends differing from one to another, as CS-HAZ slightly bends before the weld and the SS one beyond it. Despite this, both free ends rotate by the same angle around the loading axis and remain parallel. This suggests that during testing the overlap welded joint behaves as an internally resistant hinge connecting the loaded sides of the plates. It rotates as the tensile load increases, with the free ends acting as rigid attachments that make the rotation visible. Thus, the tensile load–rotation curve characterizes the internal resistance of the hinge.
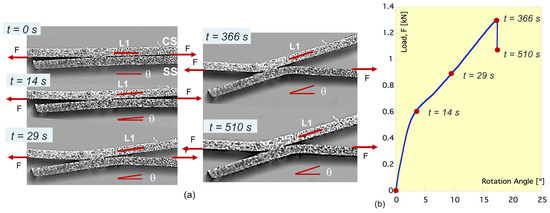
Figure 8.
Rotation of the free ends of the CS-SS joint: (a) images captured during the tensile-shear test of the CS-SS specimen; (b) load vs. rotation angle plot (the red dots indicate the times corresponding to the image sequence captured during testing).
The graph provided in Figure 8b shows the applied tensile load vs. the rotation angle of the joint in which the red dots indicate the time corresponding to the image sequence captured during testing and briefly presented in Figure 8a. According to this graph for a rotation angle of 5°, at a load value slightly less than half of the maximum one, the rotation rate in relation to load increases from 4.52 to 20.65°/kN. For the equivalent hinge, this change, if irreversible, entails a loss of internal resistance comparable to the yielding process of a metallic material with linear strain-hardening. The specimen failure occurred far from the weld for a rotation angle of 17° and appears in the graph given in Figure 8b as a sudden unloading without rotation increase, since the specimen fails due to the plastic collapse and necking of the CS plate under pure tensile loading. This is the behavior expected from a canonical welded joint, which prevents the bearing capacity of the equivalent hinge from being determined, although a lower limit is provided by the maximum load.
Figure 9a shows the CS-SS joint geometry whereas Figure 9b illustrates the five strain field maps corresponding to the testing progress obtained with the VIC-2D software. The testing sequence to which these images correspond are the following: initiation, change in the rotation speed with load, intermediary stage, maximum load, and failure load (Figure 9b). The first image, namely the test initiation, indicates the positions of four virtual extensometers (Ext. 1 to Ext. 4) used in the present analysis. All of them, of 1 mm gauge length, were mounted and located parallel to loading direction as follows: Ext. 1 in the weld ligament joining the two plates, Ext. 2 in the CS-HAZ, Ext. 3 in the CS plate, and Ext. 4 in the SS plate. Thus, the percent elongations of the four extensometers as a function of the applied load could be obtained with the VIC-2D software too. The successive strain fields produced on the loaded sides of the plates as the loading process progresses reveal that strain concentrations occur at the ends of the transition from the laminae to the connecting weld ligament (the third strain map in Figure 9b). When non-optimized welding technologies are used these two strain concentrations are the cause of the joint cracking in the HAZ long before the BM breakup. However, in the performed tests, the local increases in strain with the applied load only produces the loss of rotational stiffness of the joint (Figure 9b). This process competes with the uniform deformation experienced by the loaded sides of both plates in areas far from the weld. At maximum load, plastic instability begins to initiate in CS and causes its collapse in simple tension.
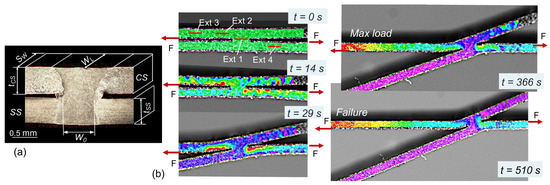
Figure 9.
(a) CS-SS joint geometry (tCS and tSS are the respective thickness of the CS and SS plates, SW is the width of specimen, WL is the weld length, and W0 is the weld ligament joining the two plates); (b) VIC-2D strain maps for distinct instants of the tensile-shear test and the location of the four virtual extensometers (Ext. 1–Ext. 4).
The quasi-equality in the elastic limit of CS and SS (Table 1) explains why the extension of the strain concentration is simultaneous in both plates. Accordingly, the higher strain hardening capacity of SS justifies the collapse in CS in simple tension, with the subsequent welded joint unloading.
The optimized design and execution of the welding process were key factors in preventing the joint cracking when strain concentrations began to expand. To highlight the contributions of the essential factors influencing the joint behavior, a series of tensile load-elongation curves are plotted in Figure 10. The strain gauge for all the elongations was 1 mm long and the cross-sections on which tensile load was applied are those of the welded plates, namely 0.5 × 6 mm2 (Figure 9a). Thus, Curve 1 to Curve 4 in Figure 10 were obtained from the tensile–shear test performed with the overlap joint specimen whereas the Curve 5 and Curve 6 resulted from the initial tensile testing of the CS and SS plates, respectively. The loads of Curve 1 to Curve 4 are those applied to the tensile–shear specimen and the elongations are the measured ones with the four VIC-2D extensometers shown in Figure 9b. The failure of the specimen caused by the plastic tensile collapse of the CS plate explains why the four curves appear to be truncated. Ext. 3 and Ext. 4 (Figure 9a) were, respectively, mounted on the CS and SS plates at some distance from the weld and the observation that each of the corresponding curves does not separate from the dashed ones (Curve 5 and Curve 6) means that the stress state at these locations is pure tension because they are well beyond the weld influence. The elongation of CS-HAZ (Curve 2) and of the welding ligament (Curve 1) could indicate hardening and loss of ductility regarding the base metal, which is of greater magnitude in the second case. This direct comparison is only indicative since the stress triaxialities in the weld and CS-HAZ were not considered.
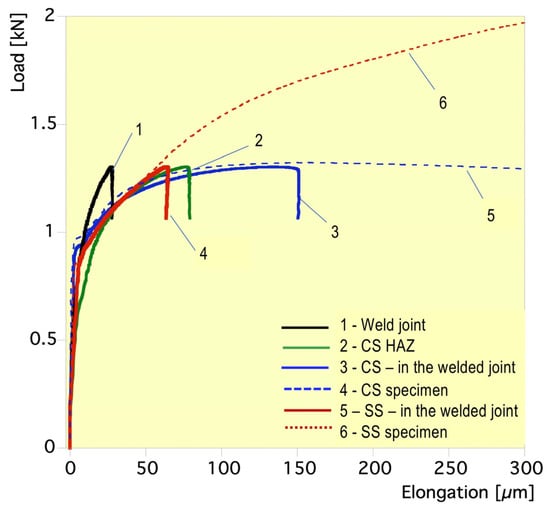
Figure 10.
Tensile load–elongation curves of distinct areas from the laser-welded joint of CS-SS thin plates (1–4) and of the CS (5) and SS plates (6) for a 1 mm strain gauge.
The relevant value ranges that determine the mechanical performance of the laser- welded-overlap CS-SS joint are given in Table 4 as derived for the three tested specimens from the curves analogous to those plotted in Figure 10. According to Table 4, the yield stress values measured in the weld and in CS-HAZ are, respectively, 32% and 9% higher than those measured in the CS base metal. These results agree with the micro-hardness profiles (Figure 7) and are entirely consistent with the nature of the heterogeneities present in the welded joint microstructure.

Table 4.
Mechanical performance of the tested laser-welded CS-SS overlap joint.
The average strength mismatches M (Table 4) were calculated as the ratio of the yield strength values determined from the curves of Figure 10 and the analogous ones for each welded area to that of the CS base metal (M = Rp0.2 weld zones/Rp0.2 CS). These weld mismatch values are 8% higher than those obtained for 1 mm thick butt-welded dissimilar plates [7]. The reason could be the differences in the heating flow and temperature gradients experienced by the base metals in the overlap joint configuration with respect to the butt one, when employing autogenous laser welding.
3.4. Fracture Features of the CS-SS Overlap Joint
Figure 11a illustrates the rotation of the joint free ends as well as the tensile fracture of the CS plate, which takes place far from the CS-SS overlap joint. As shown in Figure 11b, this occurred by necking along a line inclined towards the loading direction, with a thickness loss of 80% at fracture. The presence of numerous dimples of various sizes shown in Figure 11c supports the ductile fracture morphology of CS.

Figure 11.
(a) Fracture in tension of the CS-SS-overlap-welded specimen; (b) macroscopic image of the broken CS plate; (c) micro-fractographic detail showing the ductile CS fracture.
4. Conclusions
The present research addressed the performances of a dissimilar overlap-welded joint subjected to a combined tensile-shear action representative of service loading.
The joint microstructure and the EDX analysis indicated that the weld resulted in between CS and SS plates was a mixture, forming an austenitic-martensitic stainless steel, with a complex morphology because of the differences in thermophysical properties of the base metals. The finding was also supported by microhardness test results.
The use of a digital image correlation system, VIC-2D, proved to be an efficient tool for obtaining new insights related to the strain fields that developed during tensile–shear testing and the consequent rotation angle of the weld transmitted to the free ends of the plates. Thus, it was found that the weld behaved as a non-linear hinge which experienced a sudden loss of stiffness once the strain concentrations developed from the edges of the weld ligament toward the loaded sides of the plates. As a consequence, when non-optimized welding technologies are used, this might cause the HAZ to crack long before the tensile strength of the weaker BM is reached.
In the performed tests, the failure in tension of the dissimilar welded joints occurred far from the weld by yielding localization and necking in the CS plates, as expected from a canonical welded joint. This mode of failure is consistent with the strength mismatches of the weld and CS-HAZ, of 1.09 and 1.33, respectively. The obtained results provide a good reference for improving the design of dissimilar overlap joints, as well as estimated values of material properties for finite element simulations.
Author Contributions
Conceptualization, M.I. and A.V.; methodology, P.S., M.D.A. and A.V.; validation, M.I., M.D.A., E.S. and P.S.; formal analysis, P.S. and M.D.A.; investigation, P.S., M.I., M.D.A., E.S. and A.V.; resources, M.I., M.D.A. and A.V.; writing—original draft preparation, M.I., E.S. and P.S.; writing—review and editing, M.I., E.S. and A.V. All authors have read and agreed to the published version of the manuscript.
Funding
The authors gratefully acknowledge the RTI-2018-097221-B-I00 grant funded by MCIN/AEI/10.13039/501100011033 and the “ERDF A Way of Making Europe”, as well as the pRE-2019-088263 grant funded by MCIN/AEI/10.13039/501100011033 and the “ESF Investing in Your Future”.
Data Availability Statement
The data presented in this study are available at the request of the corresponding author for privacy and ethical reasons.
Conflicts of Interest
The authors declare no conflicts of interest. The funders had no role in the design of the study; in the collection, analyses, or interpretation of data; in the writing of the manuscript; or in the decision to publish the results.
References
- Aqeel, M.; Gautam, J.P.; Shariff, S.M. Comparative study on autogenous diode laser, CO2 laser-MIG hybrid and multi-pass TIG welding of 10-mm thick Inconel 617 superalloy. Mater. Sci. Eng. A 2022, 856, 143967. [Google Scholar] [CrossRef]
- Goyal, R.; El-zein, M. Influence of laser weld shape on mechanical and fatigue behavior of single lap laser welded joints. J. Adv. Join. Process 2020, 1, 100018. [Google Scholar] [CrossRef]
- Derakhshan, E.D.; Yazdian, N.; Craft, B.; Smith, S.; Kovacevic, R. Numerical simulation and experimental validation of residual stress and welding distortion induced by laser-based welding processes of thin structural steel plates in butt joint configuration. Opt. Laser Technol. 2018, 104, 170–182. [Google Scholar] [CrossRef]
- Iordachescu, D.; Scutelnicu, E.; Iordachescu, M.; Valiente, A.; Ruiz-Hervias, J.; Ocaña, J.L. Specific properties of ferritic/austenitic dissimilar metals welded joints. Weld. World 2011, 55, 2–11. [Google Scholar] [CrossRef]
- Rominiyi, A.L.; Mashinini, P.M. A critical review of microstructure and mechanical properties of laser welded similar and dissimilar titanium alloy joints. J. Adv. Join. Process. 2024, 9, 100191. [Google Scholar] [CrossRef]
- Hamada, A.; Khosravifard, A.; Ali, M.; Ghosh, S.; Jaskari, M.; Hietala, M.; Jarvenp, A.; Newishy, M. Micromechanical analysis and finite element modelling of laser-welded 5-mm-thick dissimilar joints between 316L stainless steel and low-alloyed ultra-high-strength steel. Mater. Sci. Eng. A 2024, 882, 145442. [Google Scholar] [CrossRef]
- Scutelnicu, E.; Iordachescu, M.; Rusu, C.C.; Mihailescu, D.; Ocaña, J.L. Metallurgical and mechanical characterization of low carbon steel-stainless steel dissimilar joints made by laser autogenous welding. Metals 2021, 11, 810. [Google Scholar] [CrossRef]
- Iordachescu, M.; Iordachescu, D.; Scutelnicu, E.; Ruiz-Hervias, J.; Valiente, A.; Caballero, L. Influence of heating source position and dilution rate in achieving overmatched dissimilar welded joints. Sci. Technol. Weld. Join. 2010, 15, 378–385. [Google Scholar] [CrossRef]
- Kenda, M.; Klobčar, D.; Nagode, A.; Bračun, D. Analysis and prevention of weld crater cracking in circumferential laser micro welding of automotive pressure sensors. Eng. Fail. Anal. 2021, 128, 105579. [Google Scholar] [CrossRef]
- Li, Z.; Rostam, K.; Panjehpour, A.; Akbari, M.; Karimipour, A.; Rostami, S. Experimental and numerical study of temperature field and molten pool dimensions in dissimilar thickness laser welding of Ti6Al4V alloy. J. Manuf. Process. 2020, 49, 438–446. [Google Scholar] [CrossRef]
- Biswas, A.R.; Banerjee, N.; Sen, A.; Maity, S.R.; Bains, P.S.; Sharma, S.; Kalyani, T.; Abbas, M. Advancements in laser beam welding for dissimilar material joining exploring weldability assessment, challenges, parametric influences on the mechanical–microstructural properties in steel-alloyed metal combination. Steel Res. Int. 2025, 96, 2400485. [Google Scholar] [CrossRef]
- Iordachescu, D.; Blasco, M.; Lopez, R.; Cuesta, A.; Iordachescu, M.; Ocaña, J.L. Recent achievements and trends in laser welding of thin plates. J. Optoelectron. Adv. Mater. 2011, 13, 981–985. [Google Scholar]
- Jayanthi, A.; Venkataramanan, K.; Kumar, K.S. An overview of the experimental techniques for characterization of laser-welded metal joints. Mater. Today Proc. 2021, 39, 572–581. [Google Scholar] [CrossRef]
- Pakmanesh, M.R.; Shamanian, M. Optimization of pulsed laser welding process parameters in order to attain minimum underfill and undercut defects in thin 316L stainless steel foils. Opt. Laser Technol. 2018, 99, 30–38. [Google Scholar] [CrossRef]
- Hietala, M.; Ali, M.; Khosravifard, A.; Keskitalo, M.; Järvenpää, A.; Hamada, A. Optimization of the tensile-shear strength of laser-welded lap joints of ultra-high strength abrasion resistance steel. J. Mater. Res. Technol. 2021, 11, 1434–1442. [Google Scholar] [CrossRef]
- Gua, X.; Zhua, K.; Wua, S.; Duanb, Z.; Zhua, L. Effect of welding parameters on weld formation quality and tensile-shear property of laser welded SUS301L stainless steel lap filet weld. J. Mater. Res. Technol. 2020, 9, 4840–4854. [Google Scholar] [CrossRef]
- Hietala, M.; Hamada, A.; Keskitalo, M.; Jaskari, M.; Järvenpää, A. Mechanical characterization of laser-welded double-lap joints in ultra-high and low strength steels for sandwich panel applications. Mater. Today Proc. 2020, 28, 455–460. [Google Scholar] [CrossRef]
- Keskitalo, M.; Hietala, M.; Mäntyjärvi, K. The normal and shear strength properties of laser lap weld. Procedia Manuf. 2019, 36, 224–231. [Google Scholar] [CrossRef]
- Horváth, G.; Körmöczi, A.; Szörényi, T.; Geretovszky, Z. Improvement of electrical and mechanical properties of laser welded lap joints via dimensional optimization. Int. J. Adv. Manuf. Technol. 2024, 130, 1843–1854. [Google Scholar] [CrossRef]
- Heydari, H.; Akbari, M. Investigating the effect of process parameters on the temperature field and mechanical properties in pulsed laser welding of Ti6Al4V alloy sheet using response surface methodology. Infrared Phys. Technol. 2020, 106, 103267. [Google Scholar] [CrossRef]
- Califano, A.; Giannella, V.; Caiazzo, F.; Berto, F.; Sepe, R. Mechanical behavior of Ti6Al4V laser welded single lap joints. Procedia Struct. Integr. 2023, 47, 842–848. [Google Scholar] [CrossRef]
- Kim, J.; Kim, Y.; Kim, J.; Kim, Y.; Kim, D.; Kang, S.; Pyo, C.A. A Study on lap joint welding of thin plate ASTM F1684 using fiber laser welding. Processes 2021, 9, 428. [Google Scholar] [CrossRef]
- Hietala, M.; Järvenpää, A.; Keskitalo, M.; Jaskari, M.; Mantyjarvi, K. Tensile and fatigue properties of laser-welded ultra-high-strength stainless spring steel lap joints. Procedia Manuf. 2019, 36, 131–137. [Google Scholar] [CrossRef]
- Benasciutti, D.; Lanzutti, A.; Rupil, G.; Fraenkel Haeberle, E. Microstructural and mechanical characterization of laser-welded lap joints with linear and circular beads in thin low carbon steel sheets. Mater. Des. 2014, 62, 205–216. [Google Scholar] [CrossRef]
- Miyazaki, Y.; Furusako, S. Tensile shear strength of laser welded lap joints. Nippon Steel Tech. Rep. 2007, 95, 28–34. [Google Scholar]
- Lee, J.; Asim, K.; Pan, J. Modeling of failure mode of laser welds in lap-shear specimens of HSLA steel sheets. Eng. Fract. Mech. 2011, 78, 374–396. [Google Scholar] [CrossRef]
- Ha, J.; Huh, H. Failure characterization of laser welds under combined loading conditions. Int. J. Mech. Sci. 2013, 69, 40–58. [Google Scholar] [CrossRef]
- Sinha, A.K.; Kim, D.Y.; Ceglare, D. Correlation analysis of the variation of weld seam and tensile strength in laser welding of galvanized steel. Opt. Lasers Eng. 2013, 51, 1143–1152. [Google Scholar] [CrossRef]
- Guo, X.; Liu, W.; Li, X.; Shi, H.; Song, Z. Fatigue resistance and failure behavior of penetration and non-penetration laser welded lap joints. Chin. J. Mech. Eng. 2021, 34, 39. [Google Scholar] [CrossRef]
- VIC-2D Measure with Confidence, Correlated Solutions. Available online: https://www.correlatedsolutions.com/vic-2d (accessed on 1 October 2022).
- Valiente, A.; Guerrero, M.P.; Iordachescu, M. New testing method for assessing the cracking sensibility of stressed tendon rods in aggressive environments. Eng. Fail. Anal. 2016, 68, 244–253. [Google Scholar] [CrossRef]
- Valiente, A.; Iordachescu, M.; De Abreu, M.; Aznar, A. Damage tolerance of the prestressing steel in a bridge stay-cable after thirty years of service in a graded, extremely adverse environment. Constr. Build. Mater. 2021, 285, 122945. [Google Scholar] [CrossRef]
- ASTM E3-11; Standard Guide for Preparation of Metallographic Specimens. ASTM: West Conshohocken, PA, USA, 2017.
- ISO 6507-1:2018; Metallic Materials—Vickers Hardness Test—Part 1: Test Method. ISO: Geneva, Switzerland, 2018.
- ASTM E407-07; Standard Practice for Microetching Metals and Alloys. ASTM: West Conshohocken, PA, USA, 2015.
- Giudice, F.; Missori, S.; Scolaro, C.; Sili, A. A review on fusion welding of dissimilar ferritic/austenitic steels: Processing and weld zone metallurgy. J. Manuf. Mater. Process. 2024, 8, 96. [Google Scholar] [CrossRef]
- Giudice, F.; Missori, S.; Sili, A. Dissimilar welding of thick ferritic/austenitic steels plates using two simultaneous laser beams in a single pass. J. Manuf. Mater. Process. 2024, 8, 134. [Google Scholar] [CrossRef]
- Inoue, H.; Koseki, T. Classification of Solidification Behaviors in Austenitic Stainless Steels Based on Welding Process. Nippon Steel Tech. Rep. 2007, 95, 62–70. [Google Scholar]
- Suutala, N.; Takalo, T.; Moisio, T. Ferritic-austenitic solidification mode in austenitic stainless steel welds. Metall. Trans. A 1980, 11, 717–725. [Google Scholar] [CrossRef]
- Giudice, F.; Sili, A. Weld Metal Microstructure Prediction in Laser Beam Welding of Austenitic Stainless Steel. Appl. Sci. 2021, 11, 1463. [Google Scholar] [CrossRef]
- Aberkane, S.; Mehdi, B.; Badji, R.; Merabti, H.; Khereddine, A.Y. Microstructure and Mechanical Properties of Delta Ferrite Morphologies in Wire Arc Additive Manufacturing 316LSi Austenitic Stainless Steel. Metallogr. Microstruct. Anal. 2025, 14, 297–311. [Google Scholar] [CrossRef]
- Delong, W.T. Ferrite in Austenitic Stainless Steel Weld Metal. Indian Weld. J. 1975, 7, 75–83. [Google Scholar]
- Voiculescu, I.; Geanta, V.; Stefanescu, E.V.; Simion, G.; Scutelnicu, E. Effect of diffusion on dissimilar welded joint between Al0.8CoCrFeNi high-entropy alloy and S235JR structural steel. Metals 2022, 12, 548. [Google Scholar] [CrossRef]
Disclaimer/Publisher’s Note: The statements, opinions and data contained in all publications are solely those of the individual author(s) and contributor(s) and not of MDPI and/or the editor(s). MDPI and/or the editor(s) disclaim responsibility for any injury to people or property resulting from any ideas, methods, instructions or products referred to in the content. |
© 2025 by the authors. Licensee MDPI, Basel, Switzerland. This article is an open access article distributed under the terms and conditions of the Creative Commons Attribution (CC BY) license (https://creativecommons.org/licenses/by/4.0/).