Article

Effect of Processing-Induced Oxides on the Fatigue Life Variability of 6082 Al-Mg-Si Alloy Extruded Components

by
Viththagan Vivekanandam
,
Shubham Sanjay Joshi
*,
Jaime Lazaro-Nebreda
and
Zhongyun Fan
Brunel Centre of Advanced Solidification Technology (BCAST), Brunel University of London, Uxbridge, Middlesex UB8 3PH, UK
*
Author to whom correspondence should be addressed.
J. Manuf. Mater. Process. 2025, 9(7), 247; https://doi.org/10.3390/jmmp9070247
Submission received: 20 June 2025 / Revised: 16 July 2025 / Accepted: 18 July 2025 / Published: 21 July 2025

Abstract

Aluminium alloy 6082 is widely used in the automotive and aerospace industries due to its high strength-to-weight ratio. However, its structural integrity can sometimes be affected by an early fatigue failure. This study investigates the fatigue performance of extruded 6082-T6 samples through a series of fatigue tests conducted at varying stress levels. The material showed significant variability under identical fatigue conditions, suggesting the presence of microstructural defects. Scanning electron microscopy with energy-dispersive spectroscopy (SEM/EDS) and scanning transmission electron microscopy (S/TEM) were used to identify the nature and location of the defects and evaluate the underlying mechanisms influencing the fatigue performance. Computer tomography (CT) also confirmed the presence of oxide inclusions on the fracture surface and near the edges of the samples. These oxide inclusions are distributed throughout the material heterogeneously and in the form of broken oxide films, suggesting that they might have originated during the material’s early processing stages. These oxides acted as stress concentrators, initiating microcracks that led to catastrophic and unpredictable early failure, ultimately reducing the fatigue life of micro-oxide-containing samples. These results highlight the need for better casting control and improved post-processing techniques to minimise the effect of oxide presence in the final components, thus enhancing their fatigue life.

1. Introduction

Aluminium alloys have been widely used in the construction of load-bearing structures due to their excellent mechanical properties such as a relatively high strength-to-weight ratio and their resistance to corrosion [1,2,3,4]. These properties make them suitable for various engineering applications in the automobile and aerospace industries, where weight reduction is crucial for improving overall performance [2]. Among aluminium alloys, 6xxx series alloys gained significant attention in the automotive sector, where they are widely used for the fabrication of automobile components like engines, bodies, chassis, and wheels to increase efficiency without compromising safety [1,3].
However, aluminium structures have a limited lifetime due to the nature of the loading they experience. Fatigue failure plays an important role during the failure modes, significantly affecting the lifespan of the aluminium components [5,6,7]. Cyclic loading initiates the cracks microscopically at low stress levels, which can potentially lead to catastrophic failures [5,7]. Therefore, monitoring the deformation of these materials at an early stage is essential to prolonging the lifetime of aluminium structures.
Aluminium 6xxx series alloys are heat-treatable alloys, and these treatments include solution heat treatment, age hardening, and quenching [8,9]. The alloying elements (magnesium and silicon) and the heat treatment parameters have a significant influence on the mechanical properties of aluminium 6xxx series alloys [10]. Among the 6xxx series, 6082 alloy has been widely used for the fabrication of automobile components due to its exceptional combination of material and mechanical properties, with excellent formability and machinability enabling the production of complex shapes required for automobiles [1].
However, the presence of oxides and non-metallic inclusions, which are entrapped during material casting and then deformed during the extrusion process, has a significant impact on the overall performance of the material [11,12]. Ideally, they should be removed or prevented during the melt stage [13], because once in the solid billet, they are challenging to deal with. Secondary intermetallic phases can be modified or eliminated by thermomechanical treatments [14], but the oxide films can only be deformed and fragmented, always remaining in the final microstructure and leading to possible inhomogeneities in their distribution in the sample. Several studies indicate that the post-processing method significantly influences the mechanical and material properties. Kumar et al. observed that the samples produced by cryorolling and annealing showed the highest fatigue life [15]. Nanninga et al. investigated the influence of the surface finish of hollow extruded 6082 alloy and reported that the direction of the extrusion die lines plays a significant role in the fatigue failure of the material [16].
These inclusions not only affect the fatigue life of the material but also play a crucial role in reducing its mechanical properties, surface quality, and machinability [15,16]. The presence of such defects creates a stress concentration that acts as an initiation site for cracks. The cracks typically nucleate on the larger inclusions near the surface and subsequently propagate along the paths with a high stress concentration of smaller inclusions, ultimately leading to premature failure under cyclic loading [15,17].
Wang et al. investigated the effects of different inclusion types on the fatigue properties of the material and observed that fatigue cracks originated from the interface between the matrix and the oxide inclusions [17]. Similarly, Liu et al. analysed the effects of different types of inclusions on the tensile properties of the aluminium cast alloy and reported that the oxide inclusions have a greater effect on the mechanical properties compared to other inclusions [12]. Di Sabatino et al. studied the fluidity of the recycled aluminium alloys and reported that oxide inclusion in the material significantly decreases the fluidity of the material during casting [11]. Gopalan et al. reported that the presence of oxide bi-films acts as crack initiation sites in cast alloys [18]. Similarly, Wang et al. stated that oxide films and pores have a dominant effect on the fatigue life of the material of aluminium cast alloys [19]. From the studies, it can be noted that addressing these processing defects is essential to enhancing the material and mechanical properties of aluminium alloys [20].
This study investigates the presence of inclusions in aluminium alloy 6082 and analyses the fatigue behaviour of the alloy. For this purpose, several high-cycle-fatigue tests were performed to determine the fatigue life of the material. SEM and EDS analyses were used to understand the microscopic behaviour of the material. Additionally, computer tomography and 3D image analysis were used to investigate the distribution of the inclusions in the material and their potential impact on fatigue performance.

2. Materials and Methods

The aluminium 6082 alloy used in this study was commercially obtained from Aalco Metals Ltd., Aylesbury, UK, in the form of extruded T6-treated (peak-aged) cylindrical bars with a diameter of 40 mm. The chemical composition of the alloy was determined through spark spectroscopy, and verified if it is in the appropriate range from the manufacturer this is presented in Table 1. The achieved composition confirms the chemical nature of the material.

2.1. Microstructural Characterisation

Samples were examined metallographically using the Zeiss optical microscope (OM) and scanning electron microscopes (SEM) such as Zeiss Crossbeam 340 (Oberkochen, Germany) and Thermo Fisher Apreo 2 S HiVac SEM (Waltham, MA, USA). The SEM is equipped with energy-dispersive spectroscopy (EDS) and electron backscatter diffraction (EBSD) detectors. The scanning transmission electron microscope (S/TEM), the Thermo Fisher Talos F200i S-FEG TEM equipped with an EDS detector (along with conventional TEM imaging capabilities with bright field TEM mode (BF-TEM)), was also employed. The STEM detector used in this investigation is a high-angle annular dark field (HAADF) with a camera length of 410 mm, with an acceleration voltage of 200 kV.
For SEM and OM analysis, the samples were initially cut both perpendicular and parallel with respect to the extrusion direction. Cold-mounted samples were ground using silicon carbide abrasive paper from grades P320 to P4000 and polished with oxide polishing suspension (OPS) solution using automatic polishing equipment to observe the initial and fatigued microstructure. Electron backscatter diffraction (EBSD) analysis was performed with a step size of 1 µm, an acceleration voltage of 20 kV, an aperture size of 120 µm, and a working distance of 15 mm.
For STEM analysis, samples were cut into 250 µm slices using a precision cutting machine and were mechanically ground using SiC paper up to a grit size of 4000 until a thickness of 100 µm was obtained. Then, thin discs of 3 mm in diameter were extracted using a hole-punching device, followed by electropolishing at 15 V and −30 °C using Struers TenuPol-5 (a jet polishing system, Ballerup, Denmark) with a 25% nitric acid and 75% methanol electrolyte. This step induces a hole formation in these thin discs, ensuring electron transparency.

2.2. Surface Roughness Measurements

The surface roughness of the machined samples was measured using a Mitutoyo SJ-210 surface roughness unit (Kawasaki, Japan), as surface roughness significantly influences the crack initiation and, consequently, the fatigue life of the material [5,6,21]. The measurements were taken within the gauge length of the sample. Six readings were taken for each sample, and they were categorised based on the average surface roughness values.
The average surface roughness values (Ra) varied from 0.5 µm to 0.9 µm. Samples with an average surface roughness of 0.5 µm were selected for this study to ensure consistency in the results. Rodopoulos et al. considered the aerospace standard with surface roughness values of less than 0.8 µm for 2024-T351 aluminium alloys [22], whereas [23] considered surface roughness values of less than 0.7 µm by polishing with a diamond metallography emulsion in the gauge area to investigate fatigue properties [23]. The considered value of surface roughness in this study is homogeneous and in line with that in the literature.

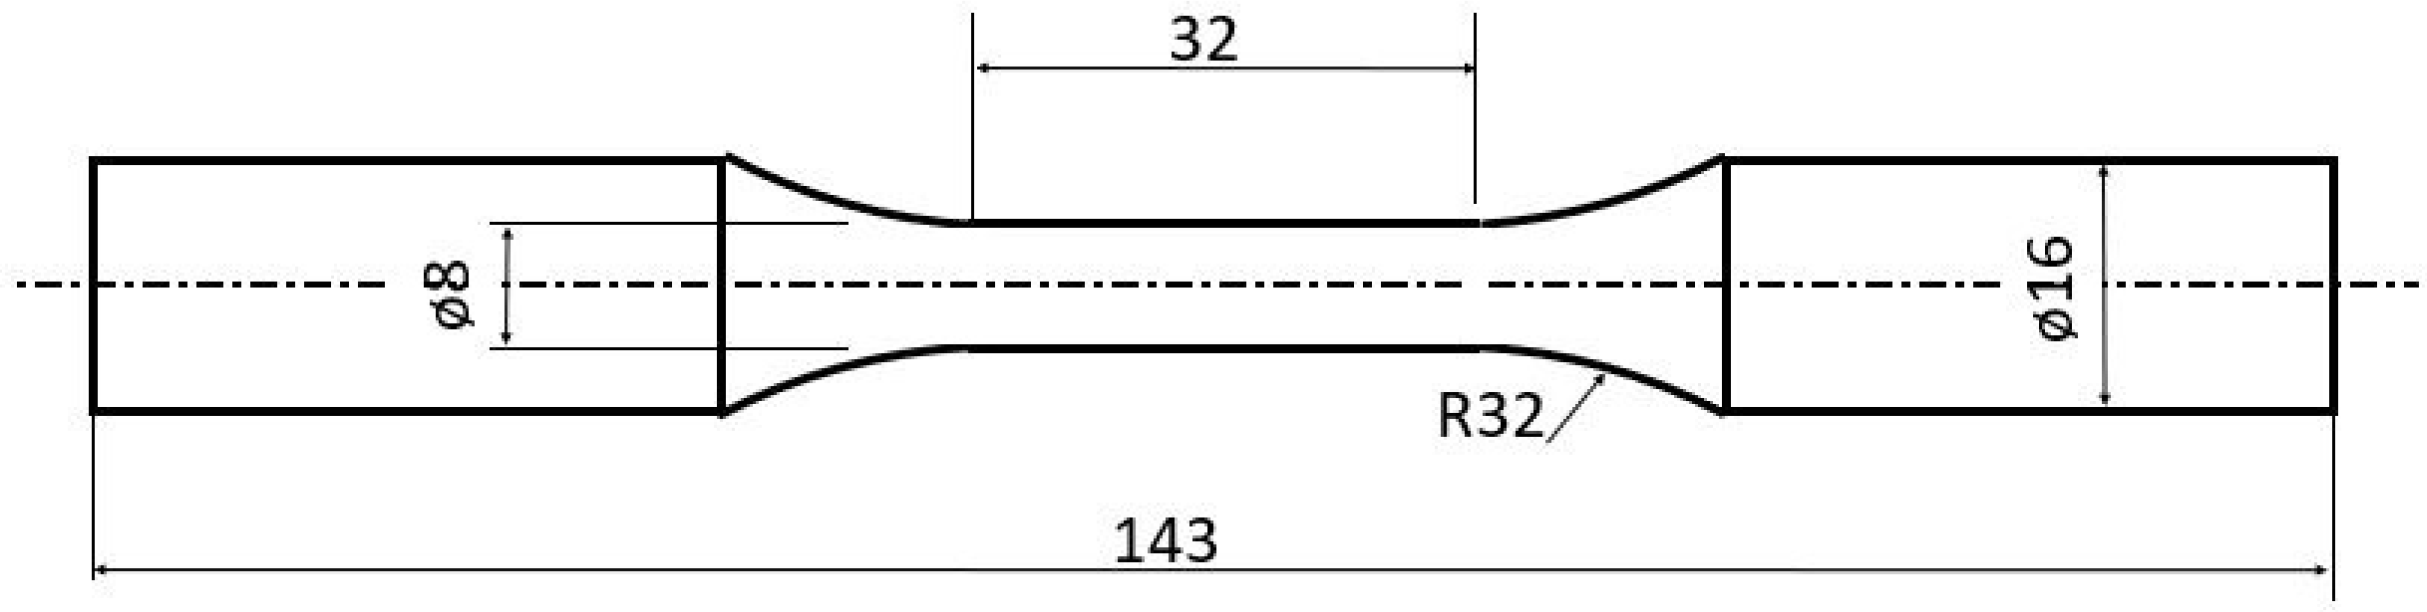
2.3. Mechanical Tests

Samples with an 8 mm gauge diameter and a 32 mm gauge length were machined from the 40 mm extruded bars for mechanical tests. The dog bone specimens have circular cross-sections, and they were machined in accordance with ASTM standard E466-15 [24] for fatigue tests. The dimensions of the samples are presented in Figure 1. Two tensile tests were performed to determine the yield and ultimate tensile strength of the material. All the tests were displacement-controlled, with a constant displacement of 1 mm/min, using the Instron tensile machine in accordance with ASTM standard E8/E8M-09 [25].
For fatigue tests, samples from the same surface roughness category were selected to maintain comparable conditions for fatigue deformation. The samples were tested using the Instron 8801 machine, with a load capacity of 100 kN at various fatigue conditions ranging from 315 MPa to 140 MPa, to determine fatigue life and to identify the high-cycle-fatigue (HCF) and low-cycle-fatigue (LCF) regimes. All the fatigue tests were conducted in a stress-controlled environment.

2.4. Computer Tomography (CT) and 3D Image Analysis

Selected samples were scanned using Zeiss Xradia 410 Versa X-ray computed microtomography equipment. The scans were performed at a source voltage of 80 kV and a power of 10 W, with a filter to reduce low-energy X-rays, minimising beam hardening and enhancing image contrast. Reconstruction was achieved using integrated software (Scout and Scan V16.0, Zeiss) to obtain 2D image stacks representative of the whole 3D volume of the region under investigation. A voxel size of 17 µm was obtained, which is sufficient to easily identify defects larger than 50 µm from the background noise. Image post-processing and 3D visualisation and analysis were carried out using the VGSTUDIO MAX 3.2 software suite (Volume Graphics GmbH, Heidelberg, Germany).

3. Results

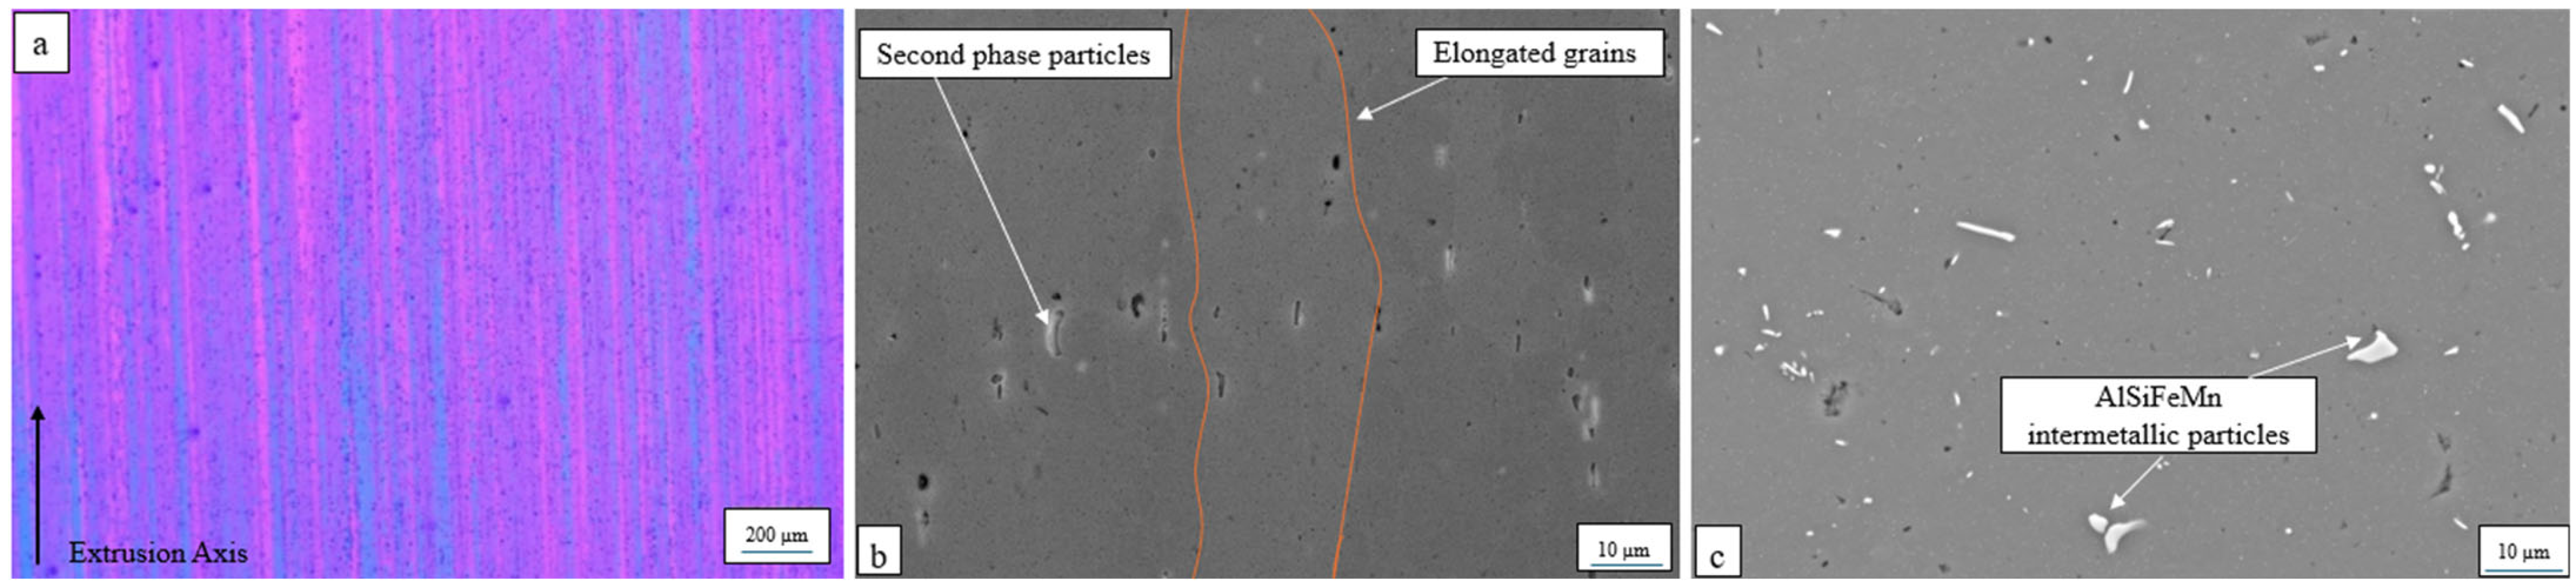
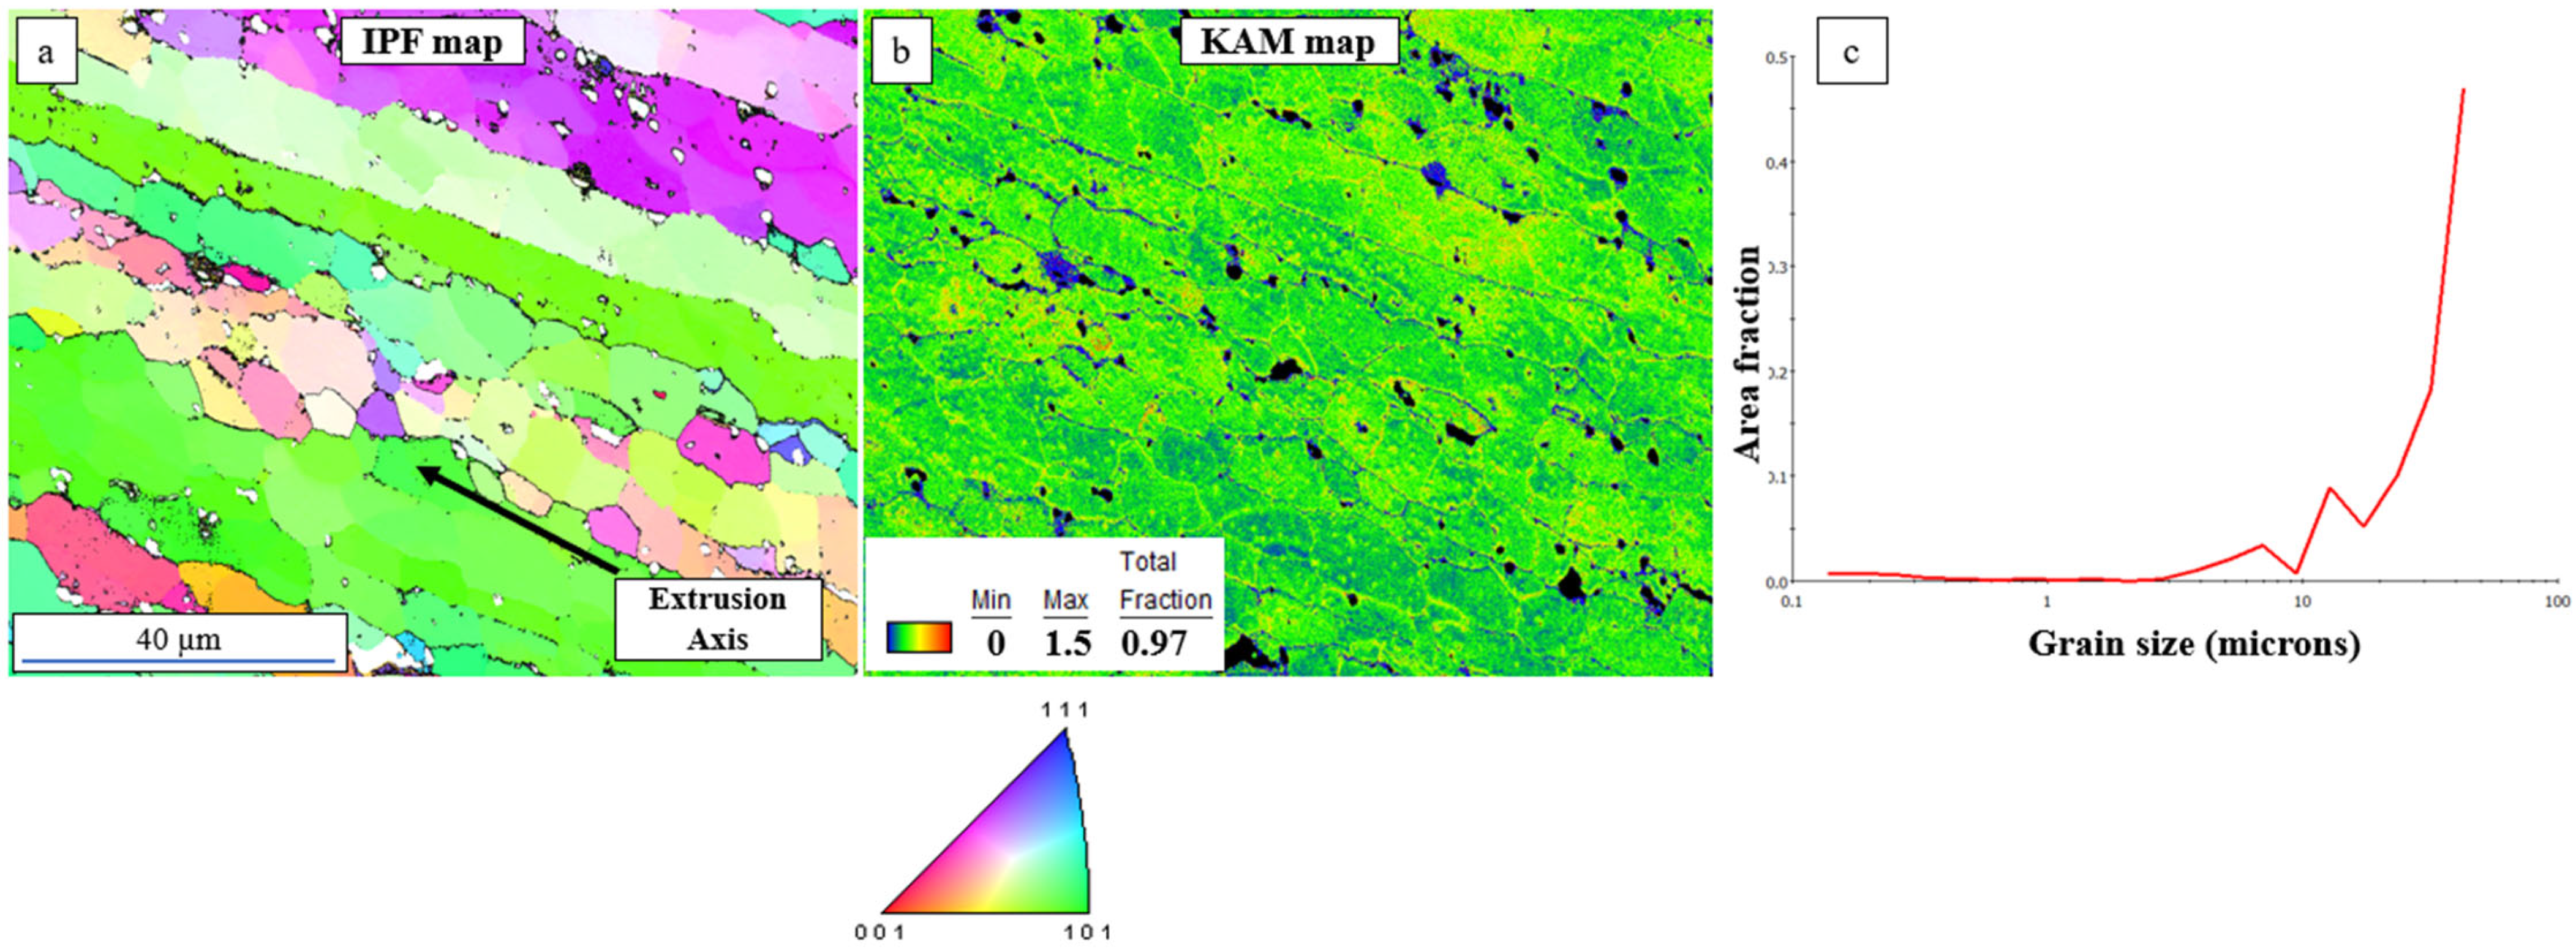
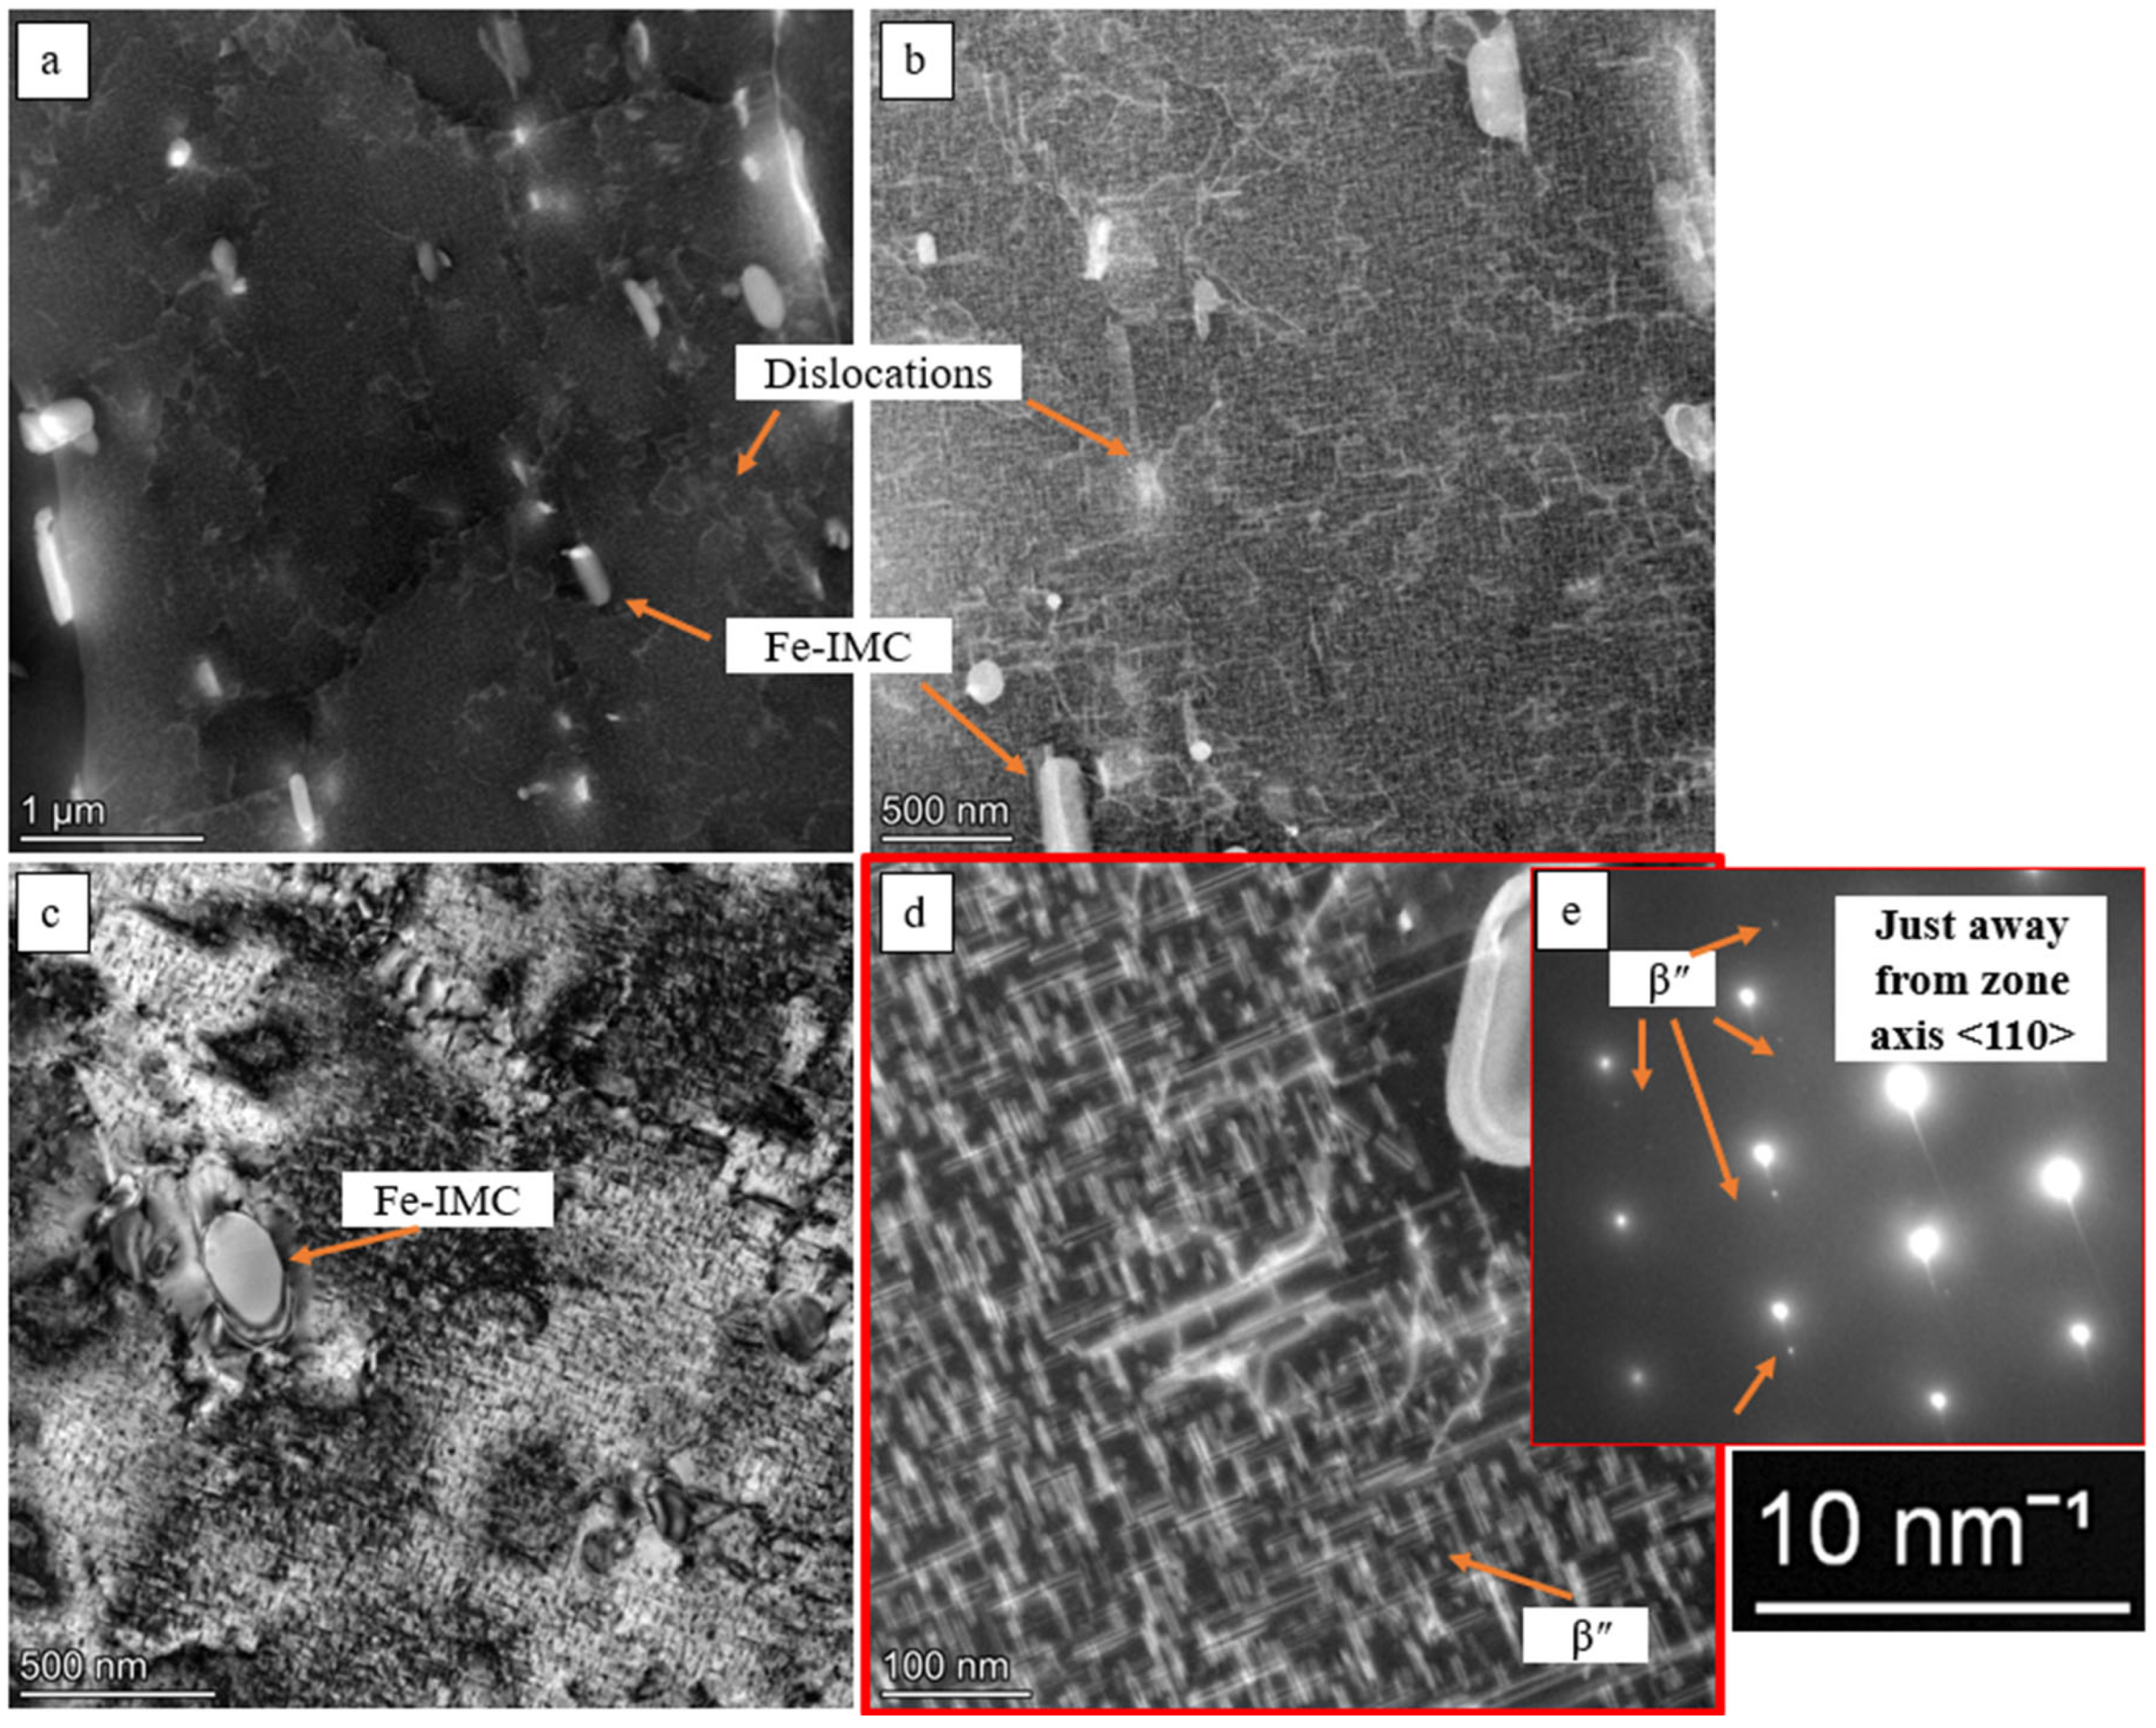
3.1. Initial Microstructural Characterisation of the As-Received Rod Material

The optical microscope image of the alloy in the longitudinal direction is shown in Figure 2. The grains of the aluminium matrix possess a fibrous microstructure with long, elongated grains in the extrusion direction (Figure 2a), as seen in several studies [26,27]. The microstructural characterisation, along with an EBSD analysis of the as-extruded sample, was carried out (the viewing plane is parallel to the extrusion axis). The SEM micrographs reveal elongated grains and the presence of other homogeneously distributed particles (AlSiFeMn intermetallic particles) in the aluminium matrix (Figure 2b,c). The average Feret diameter of the intermetallic particles in the extruded condition is 3.7 µm ± 1.9 µm.
Figure 3a–c show an inverse pole figure (IPF) map indicating the orientation of grains, a kernel average misorientation (KAM) map, and a grain size distribution graph, respectively. The KAM map gives detailed information on strain accumulation as a function of crystal orientation [28]. In this case, it specifically indicates strain induced because of extrusion processing and precipitation hardening. Figure 3c shows that strain accumulation is homogeneous. Grain size distribution demonstrates that the average size of the grains is around 23 μm (±12.5 μm); similar values are also observed in the literature [29].
Figure 4 shows the HAADF-STEM micrographs of the as-extruded 6082 specimen. Figure 4a shows the overview with the grain oriented in the [110] zone axis. This indicates the presence of AlFeMnSi intermetallic particles and dispersoids, which have been characterised in detail in several studies [4,14]. Dislocations can be observed in Figure 4b, and their formation is associated with the extrusion process [14]. Figure 4c is a conventional BF-TEM image confirming the presence of AlFeMnSi phases and process-induced dislocation tangles. This is confirmed by the STEM-EDS analysis shown in Figure 4h–i. Figure 4d shows another type of secondary particles, which are present in the 6082-T6 material system and are β″ precipitates (Mg2Si-based phase) [14,15,30]. Several authors have published research on the role of β″ precipitates after peak aging via T6 heat treatment to enhance the mechanical performance of 6082 samples by optimising their size for optimum interaction with the dislocations [1,31,32]. This imaging was conducted in a condition just away from the [110] zone axis, as shown in Figure 4e.

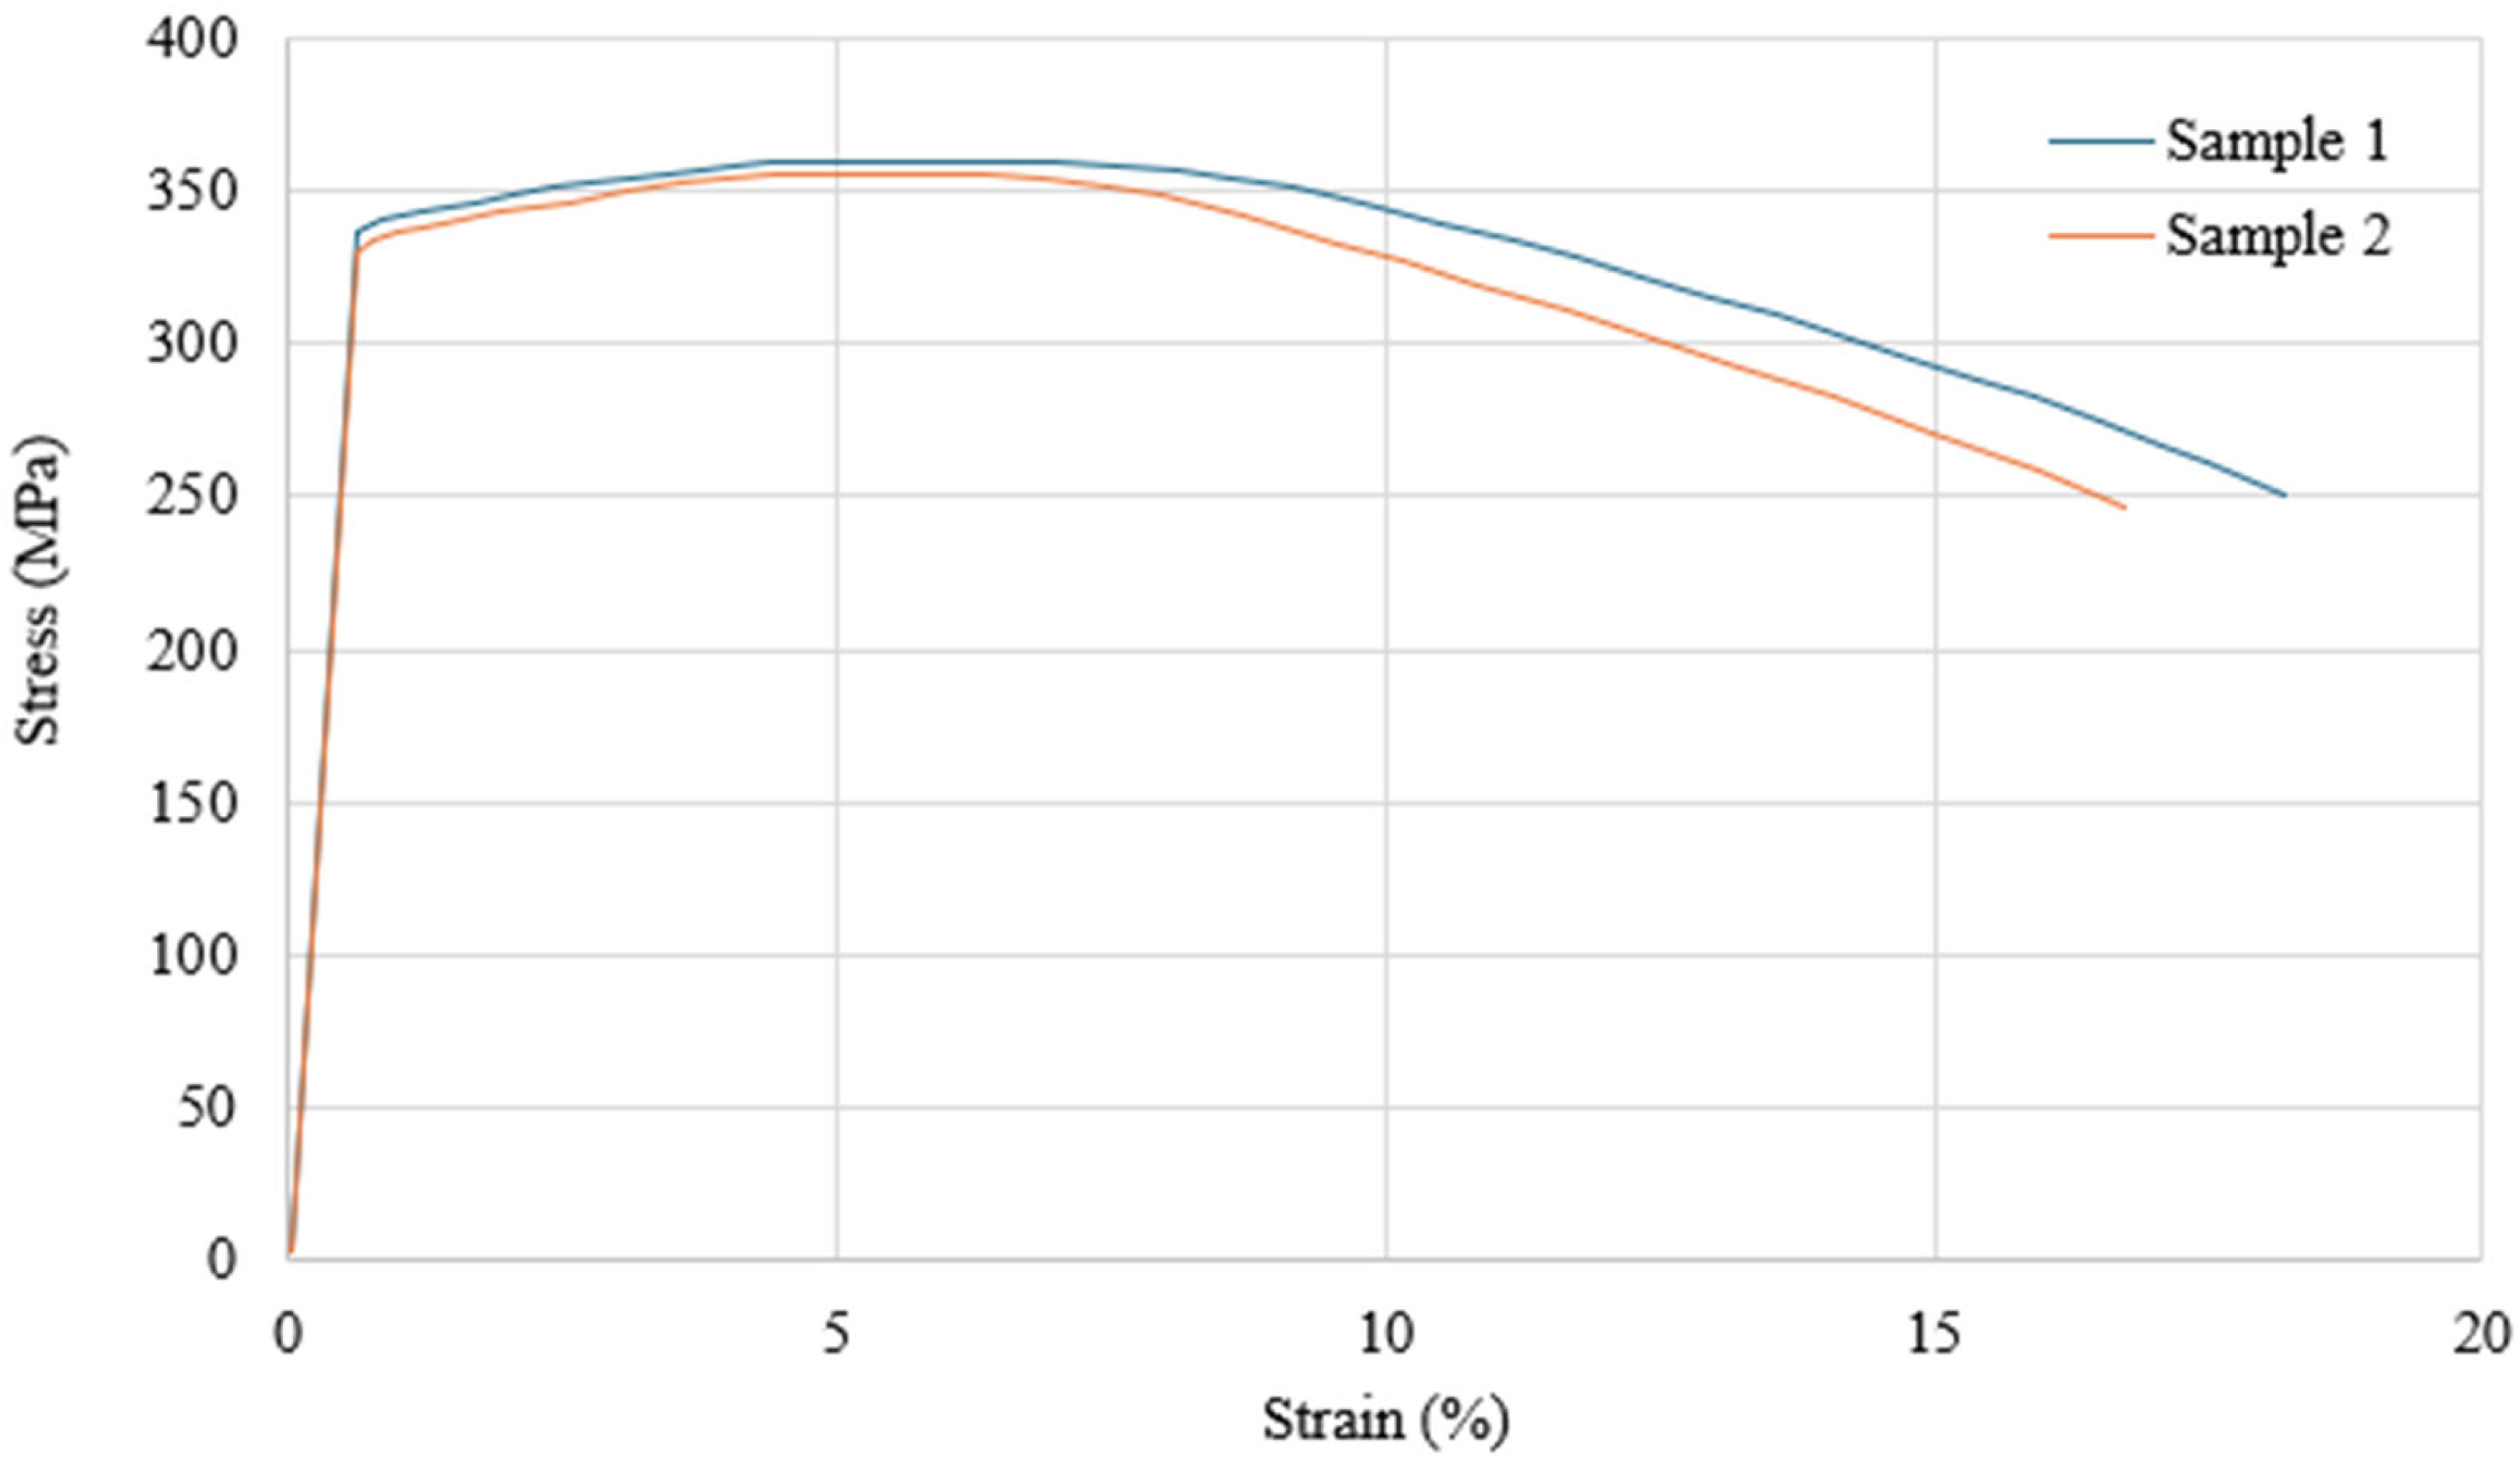
3.2. Tensile Behaviour of Machined Bars

The results of two tensile tests of the alloy are presented in Figure 5, and the tensile properties are shown in Table 2.
The achieved values for the tensile properties are within the range found in the literature [4,33]. Based on the tensile values, fatigue stress parameters were selected for this study.

3.3. Fatigue Behaviour

Multiple fatigue tests were performed under varying fatigue conditions, including different stress levels, loading frequencies, and stress ratios, to investigate the fatigue behaviour of the alloys. Figure 6 shows the stress amplitude against the fatigue life of the samples, and Table 3 presents the average fatigue life of the samples under different fatigue conditions. The detailed fatigue data are given in the Supplementary Materials.
The fatigue test results presented in Table 3 show a significant difference in the fatigue life of the samples subjected to the 150 MPa stress level. Specifically, the samples failed after 0.4 million and 4.4 million cycles in tests 3 and 4, respectively, under similar fatigue conditions.

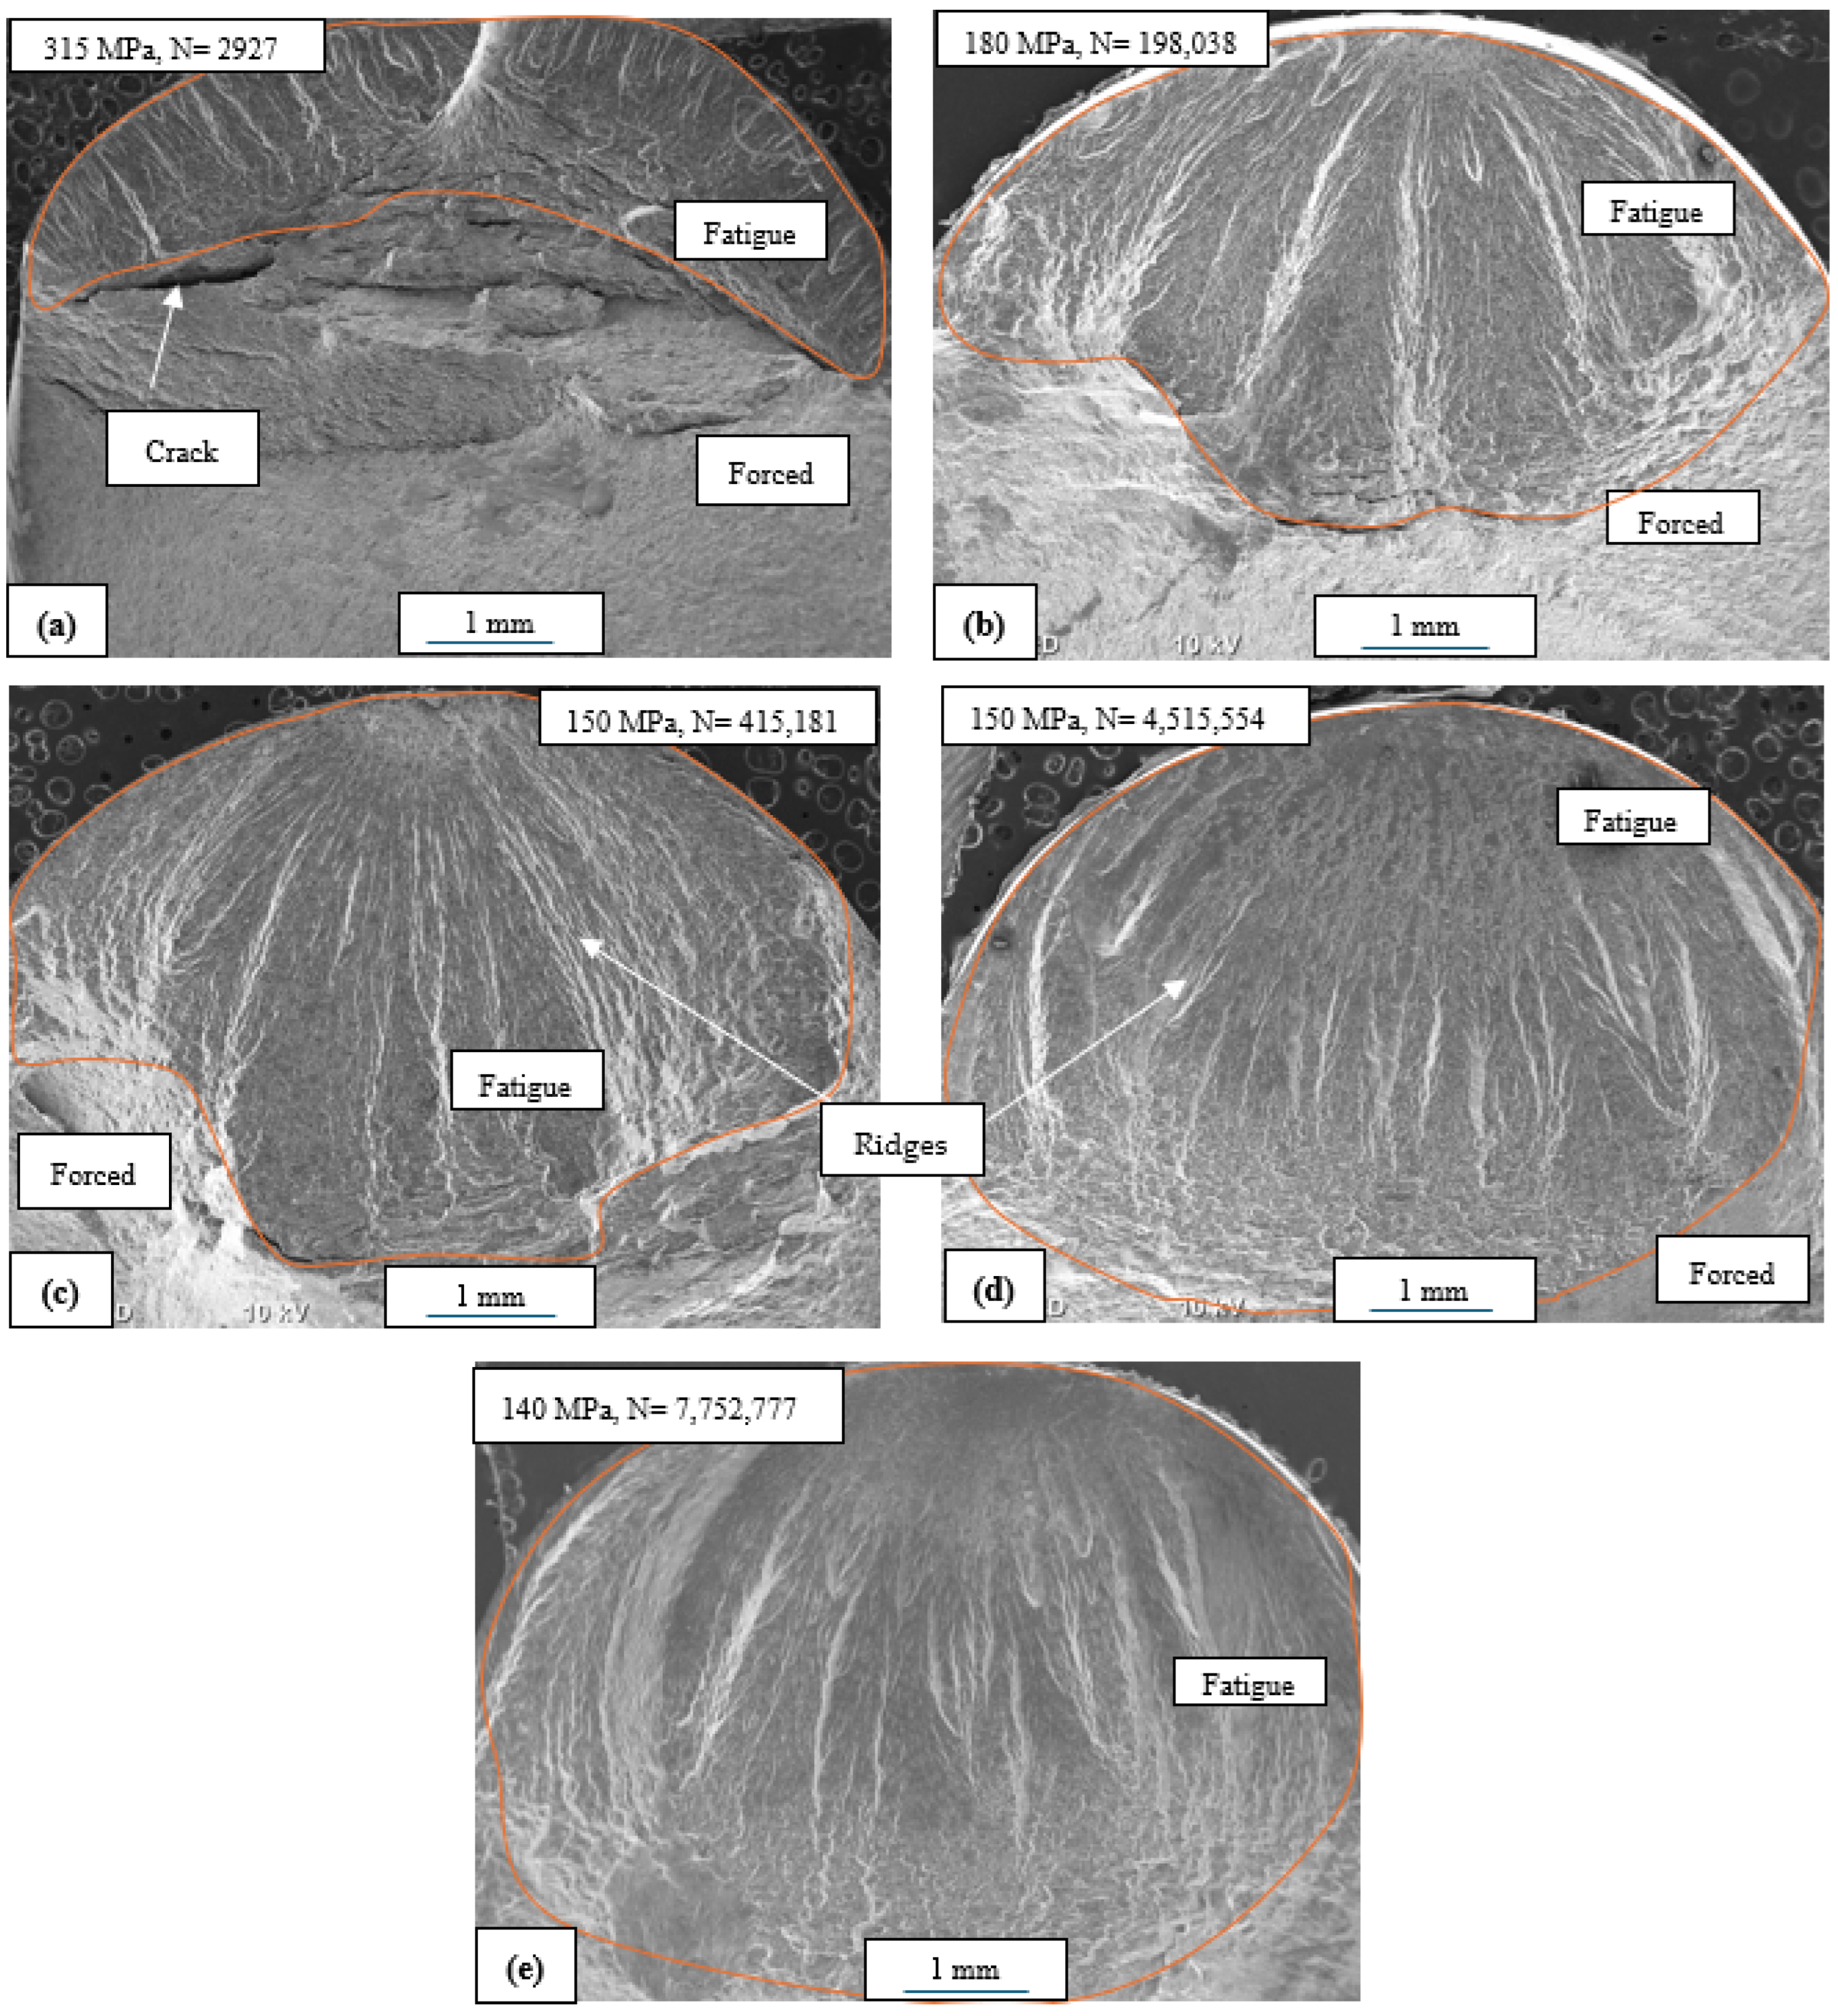
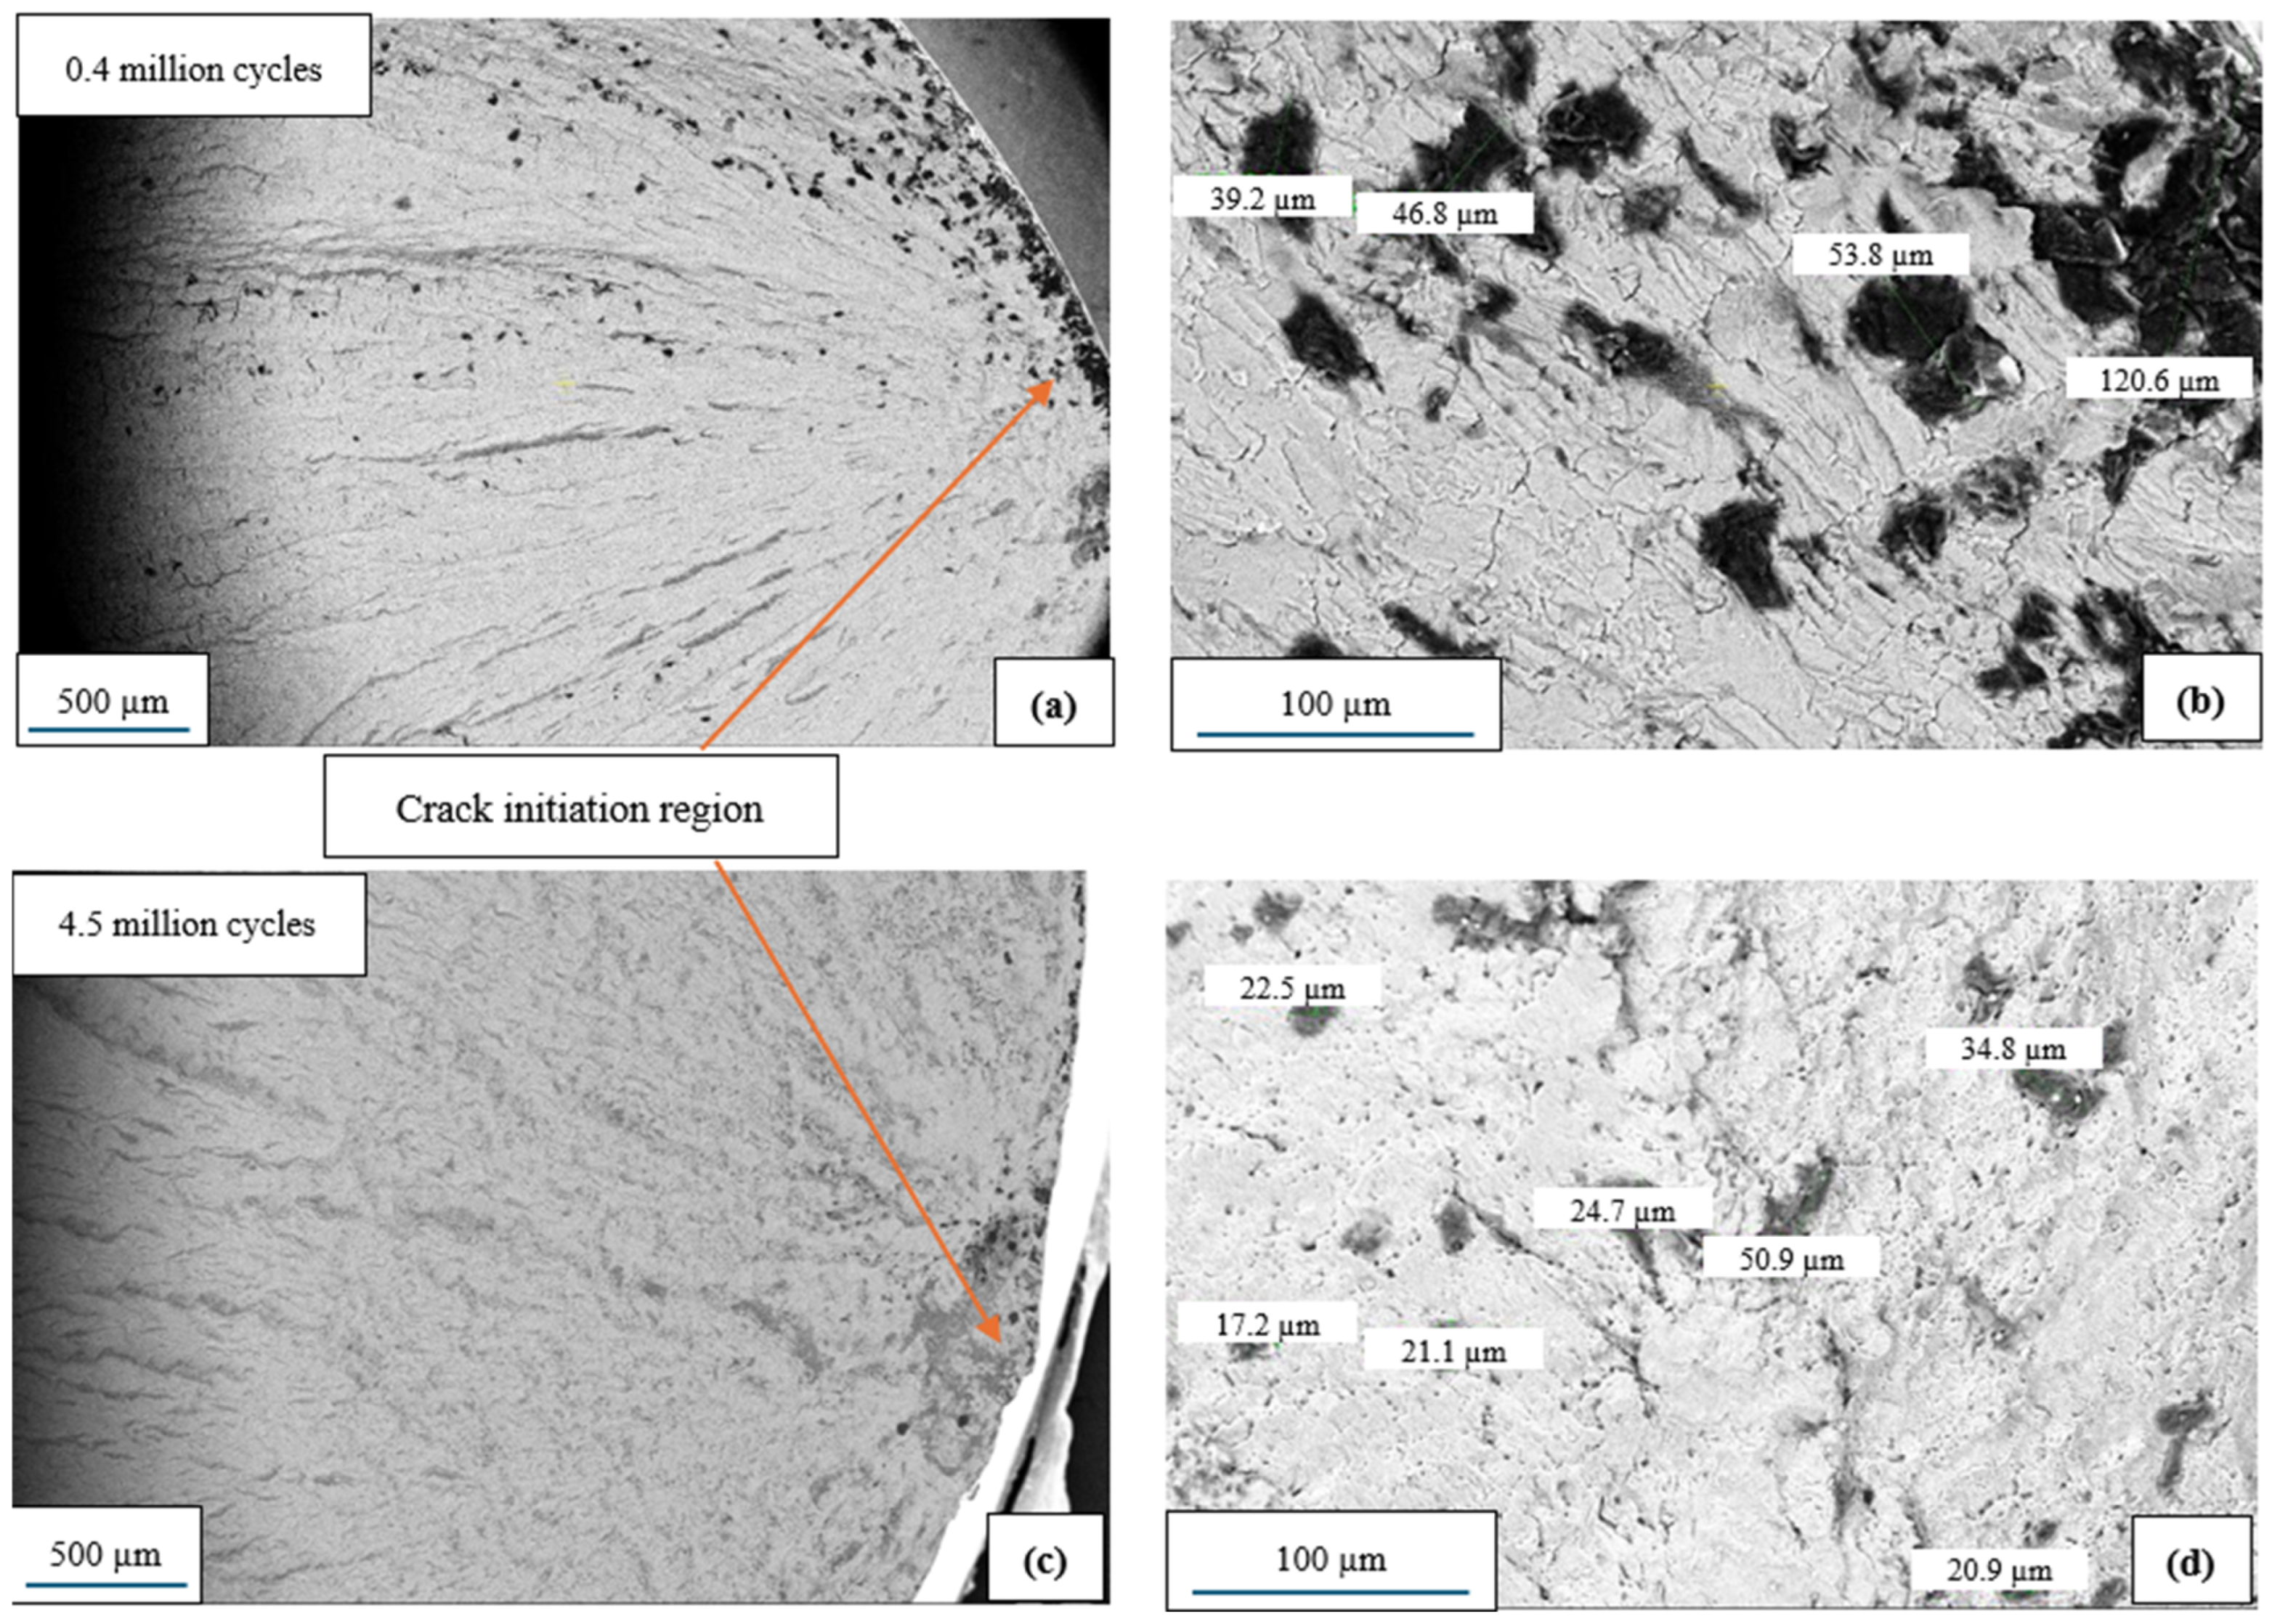
3.4. Fractography of Fatigue Samples

The fractography of the fractured samples (representative from each stress condition) was investigated using benchtop SEM, and the corresponding images are presented in Figure 7. The number of cycles to failure is indicated in each micrograph. The fractography analysis revealed that the fatigue cracks were mainly perpendicular to the loading direction and followed the typical behaviour [4]. The cracks initiated on the specimen surface and then propagated inward in a stable manner, forming ridges that were visible on the fracture surface. Once the crack propagated to a certain critical size, the remaining cross-sectional area of the material could no longer sustain the applied load, and the sample fractured in an unstable way.
Despite the significant difference in fatigue life, there is no considerable difference in the area of the stable propagation region of the failed samples under a 150 MPa stress level. This highlights that the sample failing at a lower number of cycles must have had a much faster crack growth rate. Table 4 shows the area of this region and its percentage relative to the total surface area for the different stress levels applied. The average stable propagation area of all the samples subjected to a 150 MPa stress amplitude was calculated. The average stable propagation areas of the samples with 0.4 million cycles and 4 million cycles were 27.8 ± 1.9 mm2 and 24.4 ± 3.0 mm2, respectively.

3.5. Variability in the High-Cycle-Fatigue Behaviour

The high-cycle-fatigue behaviour of the samples under 150 MPa was of particular interest in this study due to the considerable variation in fatigue life (Table 3).
Figure 8a–d show the IPF maps and KAM maps of fatigue samples failed at 0.4 and 4.4 million cycles at the stress amplitude of 150 MPa. Comparable strain can be observed in the KAM maps of both fatigued samples that failed at 0.4 and 4.4 million cycles (as seen in Figure 8c,d). This can be attributed to the uniform plastic deformation that both the fatigued samples underwent before catastrophic failure.
Figure 9a,b show the EBSD-based analysis of grain size distribution and misorientation angle distribution for the fatigued samples that failed at 4.4 and 0.4 million cycles, as well as a comparison with the as-extruded T6 6082 sample. This indicates that the area fraction of the grain size is comparable to the pre-fatigue and post-fatigue conditions. In terms of grain size determination, lower-magnification EBSD analyses were performed to achieve greater statistical significance, and this was confirmed by the average grain size suggested by higher-magnification IPF maps, which are presented in the manuscript because they are representative of the overall grain size. Misorientation angle analysis shows the number fraction of high angle grain boundaries (HAGBs) for values of 45–60°. The difference seems more significant at around 60°. On the contrary, the number fraction of low angle grain boundaries (LAGBs < 15°) is observed to increase for both of the fatigued samples compared to their pre-fatigued counterpart. This phenomenon is expected, as an increase in plastic deformation promotes the formation of low-angle grain boundaries (LAGBs) through the accumulation and rearrangement of dislocations [34]. However, there is no significant difference between the two fatigued samples.
Aforementioned analyses imply that microstructural features like strain evolution, grain size evolution, grain boundary misorientation, etc., are comparable for the two fatigued samples that failed at very different points. Hence, other microstructural features must be investigated to understand such a huge difference in the fatigue lives.
The fracture surfaces of the failed samples under 150 MPa were further investigated using the SEM to analyse the cause of the significant difference in fatigue life between the samples. The SEM images comparing the fracture surfaces of the samples that failed at 0.4 million and 4 million cycles are presented in Figure 10.
The analysis of SEM images revealed the presence of inclusions in both the fractured samples near the crack initiation point. In the first sample, which failed at 0.4 million cycles (Figure 10a), the inclusions are dense and large, with lengths ranging from 39 µm to 120 µm and an average value of 65 ± 32 mm. In the second sample, which failed at 4.4 million cycles (Figure 10b), the inclusions are scattered and smaller, with sizes ranging from 17 µm to 50 µm and an average value of 27 ± 11 mm. It is evident that the presence of larger and denser inclusions caused the early failure in the first sample (Figure 10a), leading to a significant reduction in fatigue life compared to other samples tested under similar fatigue conditions. It is important to note that, regardless of the size and distribution of inclusions, the cracks initiate where the inclusions are more concentrated, indicating their critical role in fatigue failure.
Energy-dispersive spectroscopy (EDS) analysis was conducted to examine the chemical nature of the inclusions observed on the fracture surface (Figure 11). EDS point analyses confirmed that the inclusions consist of oxides (adjoining tables in Figure 11). The oxides seem to be Al-Mg-rich with comparable compositions.
We considered ten different oxide particles for point analysis on multiple fracture surfaces, and the average composition was found to be Al = 48.8 ± 9.2%, Mg = 10.2 ± 2.5%, and O = 37.6 ± 8.2%. This implies the presence of Al-Mg oxides, which are distributed across the fracture surfaces, and they seem to be nucleating cracks for catastrophic fatigue failure. Niu et al. reported the presence of MgAl2O4 as oxide films, which is a common defect formed during casting of the Al-Mg-Si alloys during melt treatment [35].

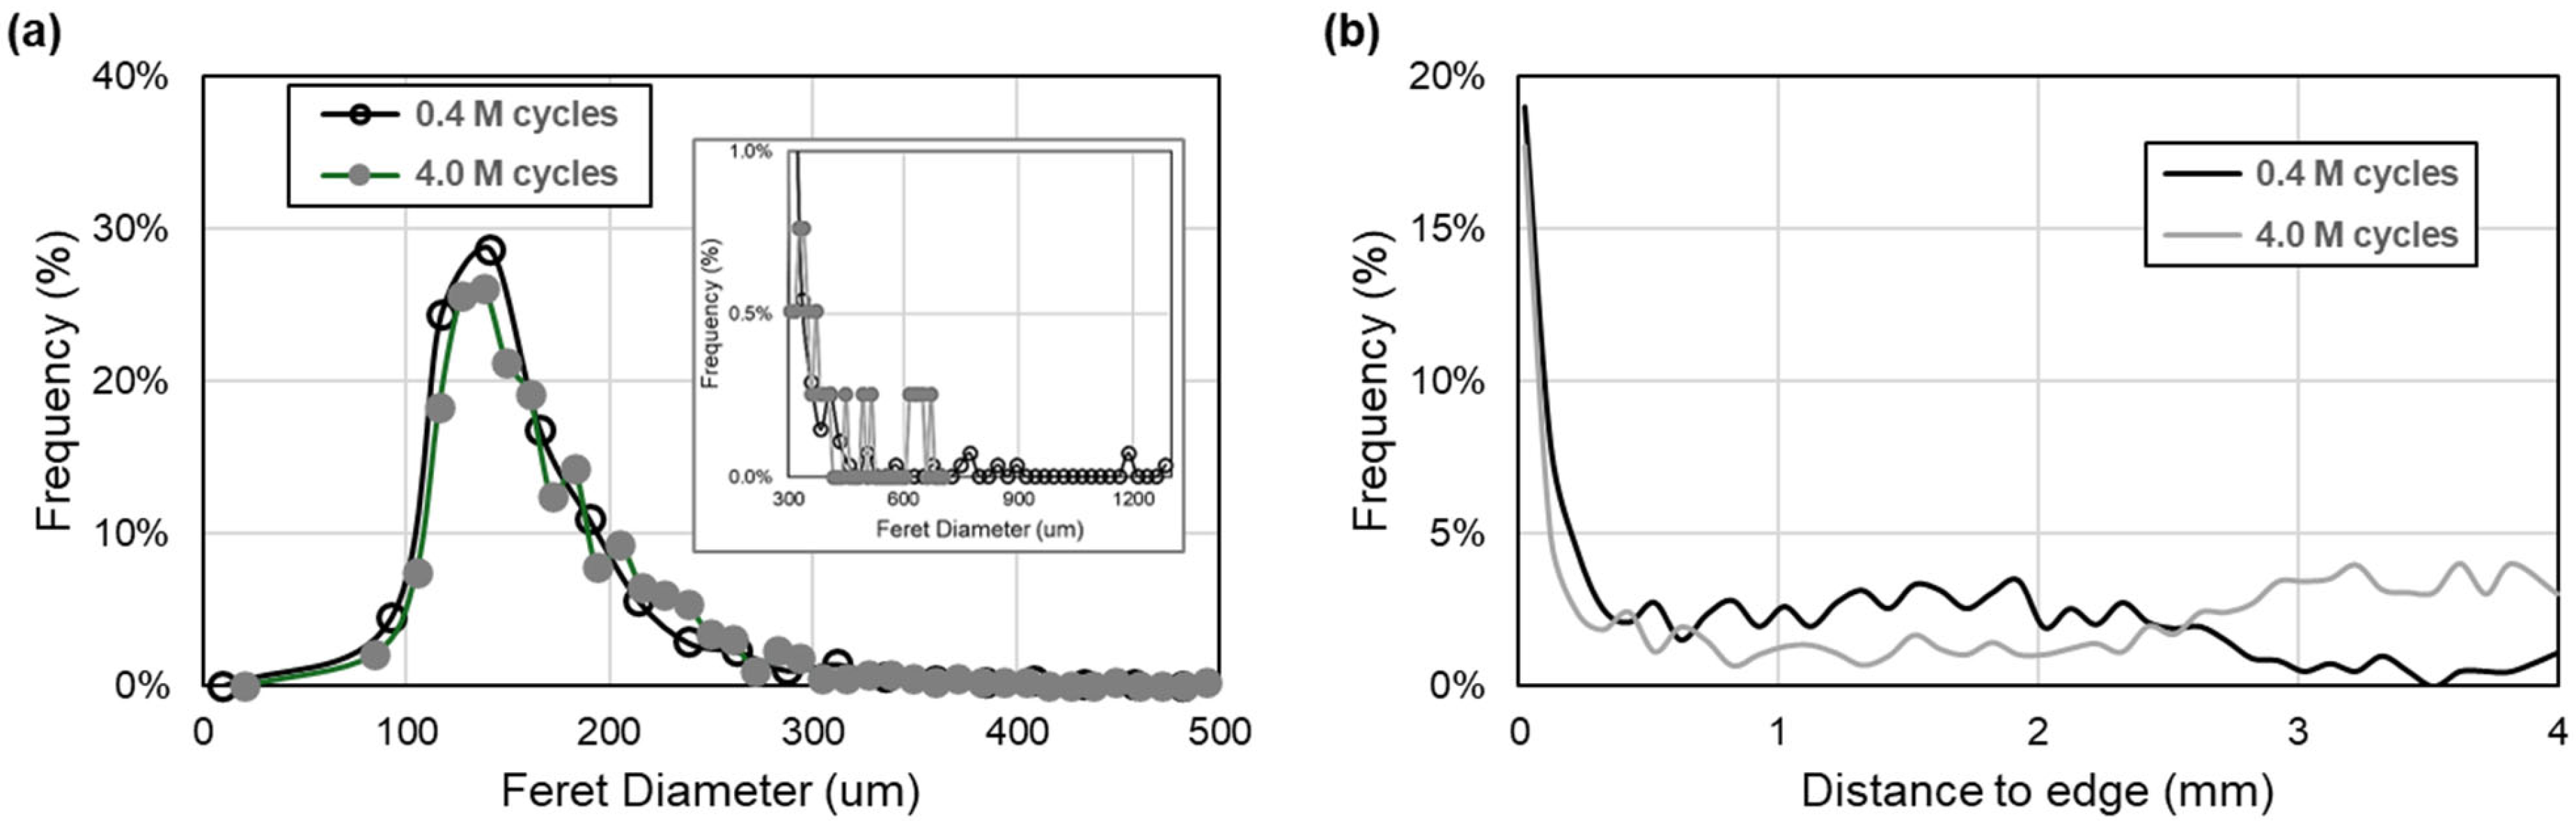
3.6. Distribution of Inclusions on the Fractured Samples

Figure 12a,b present the 3D views from Computed Tomography around the fracture zones for the two samples tested at 150 MPa, but which failed at different numbers of cycles. The crack initiation, stable propagation region, and final unstable failure region are highlighted in the image. Figure 12c,d show a representation of the 3D view of the internal oxides identified in the samples in the volumes shown (up to 2 mm below the fracture surface). A colour scale is included to represent the Feret diameter (max length) of each defect.
The sample with lower fatigue life (Figure 12a–c) exhibits an oxide volume fraction of 0.35% with a particle density of 10/mm3, while the sample with higher fatigue life (Figure 12b–d) presents an oxide fraction of 0.22% and particle density of only 6/mm3.
Feret size histograms for particles in Figure 12c,d are included in Figure 13a. Both samples exhibit similar distributions, with peaks around 120 µm, differing only in the presence of larger oxides. The high-fatigue-life sample has a maximum Feret diameter of 700 µm, while the low-fatigue-life sample shows some larger oxides, up to 1300 µm.
In both cases, the larger oxides are located near or inside the region where the unstable propagation starts, which could also explain the lower resistance of the unstable region to hold the stress during the fatigue test as the stable zone increases [36]. This could be associated with the differences and variability observed in the %stable area on the fracture surfaces as presented in Figure 7 and Table 4.
Figure 13b represents the radial distribution, from the edge to the centre of the samples, of the oxide defects near the fracture surface. Both samples present most of the oxides near the edge, explaining the origin of the crack initiation (as shown in Figure 10). However, the sample exhibiting low fatigue life presents more defects closer to the surface, which would explain a faster crack propagation rate at early stages. Moreover, particle density is also higher in the mid-radius zone, helping to propagate the cracks faster.
On the other hand, the sample with high fatigue life presents a lower fraction of oxides near the edge, a relatively low fraction in the intermediate zone, and a greater fraction towards the centre of the sample.
The results based on the fractography of the two representative samples of different fatigue life regimes (Figure 10), combined with the EDS analysis of particles observed on the fracture surface (Figure 11), and finally with the CT results (Figure 12), indicate the presence of micro-oxides. Such micro-oxides seem to be responsible for hampering fatigue life by a magnitude of ten. The following sections deal with the origin of such oxides to understand the fatigue behaviour of the AA6082 alloy.

4. Discussion

As observed in the previous section, oxides contribute to early fatigue failure, which has been extensively investigated for the high-cycle-fatigue regime in this study. Hence, it becomes integral to understand the entrance step of such oxides to design the components to achieve the desired mechanical properties, especially fatigue performance.

4.1. Origin of Oxides: Influence of Machining

The machining process can influence the surface of components due to friction, leading to high-temperature conditions [37,38]. Owing to the affinity of aluminium to oxidation, the surface of the samples can be easily oxidised, and furthermore, this reaction can be accelerated in the presence of high temperatures [39]. For a further investigation of the presence of oxide particles, samples were prepared from unfatigued machined specimens. This investigation was conducted on three different random sets of machined samples to ensure consistent behaviour. The samples were cut from the gauge section of the specimen along the line A–B, as shown in Figure 14. The observation was made on multiple samples, indicating that this is representative of all the samples.
The cross-section of the mirror-polished sample was analysed using SEM, and the SEM image shows a bright layer along the edge of the sample (Figure 14a). EDS map analysis was conducted on such edges of the sample (Figure 14b). The results confirm the presence of oxide particles in the as-machined unfatigued samples. The deformed surface layer formed on aluminium alloys after machining ranges from 0.2 µm to 2 µm in thickness, depending on the machining parameters, and the layers can contain oxide inclusions, voids, and entrapped lubricants [39,40]. According to Figure 14, the thickness of the oxide layer has an average value of 0.7 µm ± 0.2 µm, which aligns with the findings reported in the literature review. Polishing the machined samples before the fatigue test can help reduce the experimental errors [41,42]; however, the oxide layers induced by machining are not the cause of fatigue failure and remain well within the allowable limit. It is worth noting that the machined samples had similar surface roughness and showed no surface cracks.

4.2. Origin of Oxides: Influence of Processing

To trace the origin of oxides in the pre-machined condition, we investigated the procured extruded rod of a 40 mm diameter in the T6 condition. Several slices were cut from different regions of the rod and investigated under SEM to better characterise such oxides. Figure 15a shows a schematic diagram of the extruded rod, and a few zones were identified in the cross-section, indicating oxide films. Figure 15b,c show a magnified image of the oxide particles.
To assess the chemical composition of these particles, we conducted an EDS analysis as shown in Figure 15d, which clearly indicates the oxygen-rich nature of such particles. EDS point analysis inside an oxide particle showed the presence of Mg, which was similar to the observation on the fracture surfaces of the fatigued samples.
Multiple 3 mm discs were prepared from the extruded rod to characterise these oxide particles via STEM-EDS. Figure 16 shows one such sample presenting the FeMnSi dispersoid, β″ precipitates, and Mg-Si-rich oxides. However, the size of these oxides is approximately 60–70 nm. Niu et al. reported the presence of such nanoscale oxide particles [35]. These oxide particles, despite having a similar chemical nature to the one characterised previously by SEM, do not seem to have similar oxide film morphologies and might not be contributing significantly to stress concentration leading to fatigue failure.
Despite extensive STEM characterisation on multiple thin discs, such oxide films were not observed, as it is clearly shown in Figure 15 that they are heterogeneously distributed, and it was simply not coincidental that the thin discs consisted of these particles; hence, sample preparation for STEM characterisation needs to be achieved via focused ion beam milling to extract a chunk consisting of an oxide particle from a specific site, but this is out of scope for this study, meaning that this is a perspective analysis. Atom probe analysis using a needle could be interesting too, but the large size of these oxide particles could be an obstacle; however, an interface between the matrix and the particle could be studied to investigate the site for stress concentration and debonding leading to crack initiation and unstable growth for final catastrophic fatigue failure. However, this too constitutes a perspective investigation and is out of scope for this analysis.
Given the limitations of STEM characterisation in elucidating the properties of these oxides, CT analysis was employed as an alternative approach. Figure 17a shows a 3D visualisation of the oxides in the as-received extruded rod of 40 mm in the T6 condition, where each colour represents the length of the particles (scale bar included). The oxides are distributed inside the rod, not only near the surface but also more towards the mid and central regions. A volume fraction of 0.9% ± 0.2% was identified by CT, with sizes ranging from 50 µm up to 1200 µm in length.
Figure 17b shows a vertical cross-section parallel to the extrusion direction (red plane highlighted in Figure 17a). The oxides are mainly located towards the centre of the rod, from which the fatigue specimens were machined out. Two vertical dotted lines were included in the image to highlight this region.
The distribution of oxides is not homogeneous along the rod, either vertically or horizontally, with some regions presenting more oxides (Figure 17c) than others (Figure 17d).
When machining test bars from these heterogeneous rods, it is possible that some of them obtain more oxides than others, as shown in Figure 10, explaining the variability in properties like fatigue life.

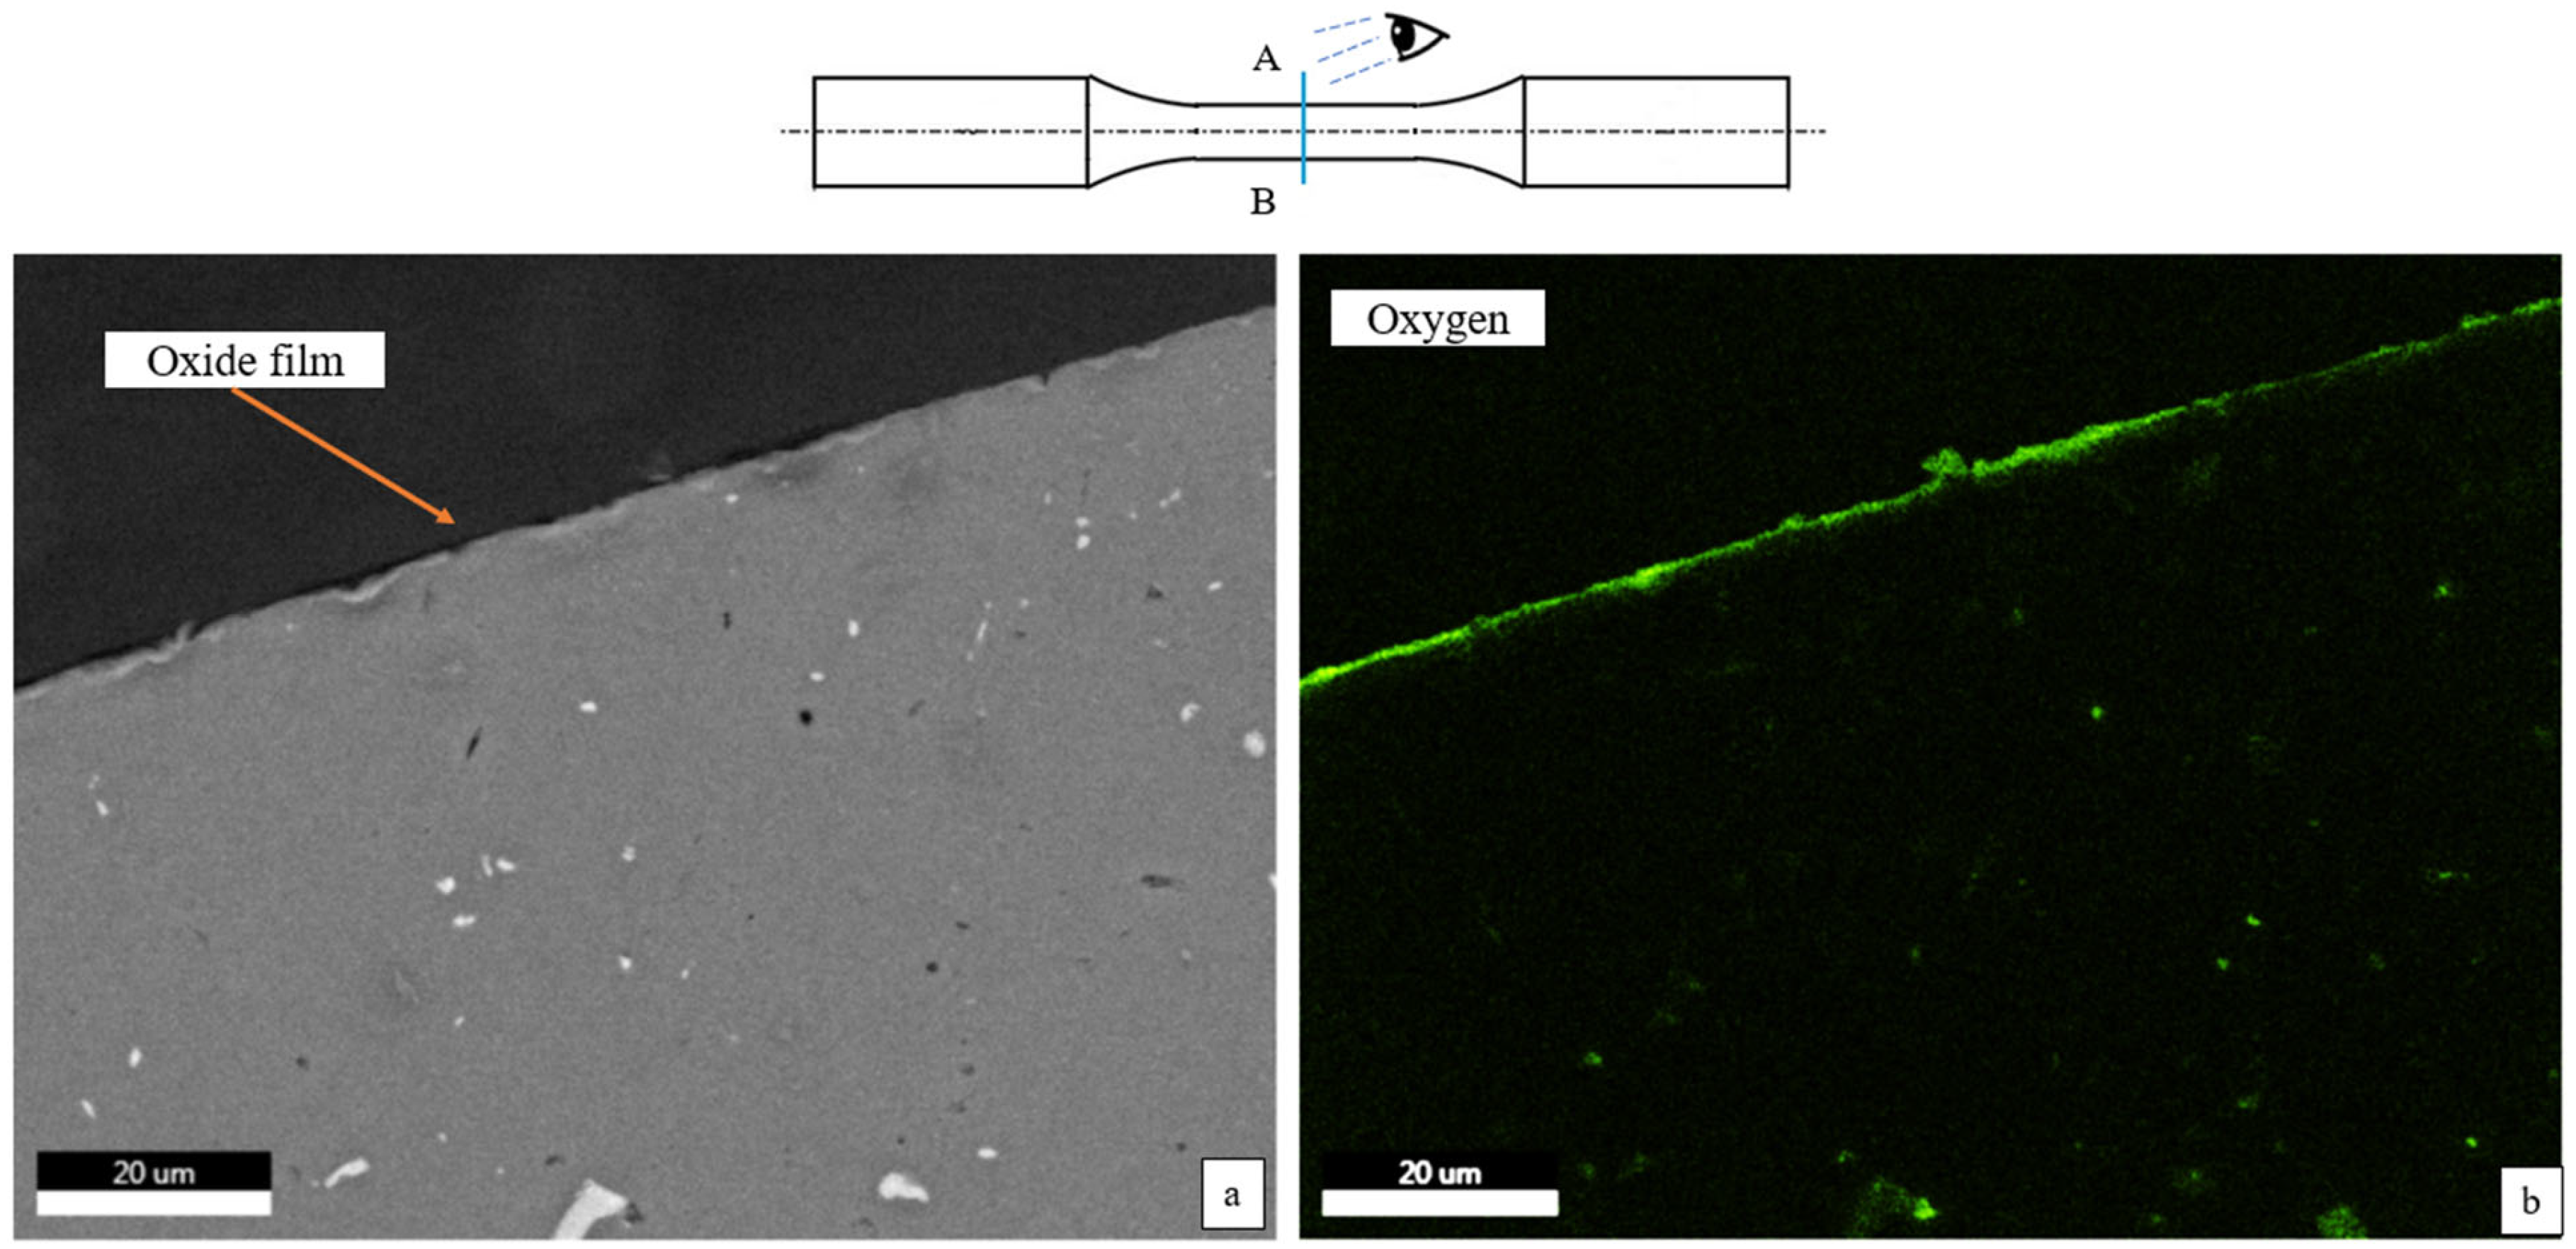
4.3. Mechanism of Oxide Formation

An oxide layer forms on the metal surface when molten aluminium is exposed to the atmosphere. This surface oxide film can become entrained within the billet if the metal flow is not properly controlled [18,43,44,45,46,47]. Niu et al. reported the presence of three kinds of oxide films in Al-Mg alloys: young films, old films, and bi-films [35]. Young films are associated with oxidation on the freshly exposed melt surface for a short period of time during the melt’s preparation and handling, resulting in nanoscale oxides, whereas old films consist of larger MgAl2O4 particles (size in hundreds of microns) [35]. The entrainment of this surface film leads to the formation of bi-films, which are double-layered oxide defects trapped within the metals [18]. They mainly consist of individual MgAl2O4 particles within the aluminium matrix [35]. Bi-films are a major source of casting defects, and they significantly reduce the mechanical properties of the aluminium alloys [18,48,49,50]. These oxide films are subjected to high deformation and shear forces during extrusion. As the billet is plastically deformed, the brittle oxide films tend to break due to their poor ductility compared to the surrounding aluminium matrix [43]. These broken oxides realign along the extrusion direction and fold into the matrix, potentially acting as crack initiation sites [43,48].
Several techniques have been reported to control the formation of oxides and deactivate bi-films. Li et al. investigated the top-gated and bottom-gated filling during metal casting and reported that bottom-gated filling reduces surface turbulence, eventually controlling the entrainment of oxide films into the molten metal [51,52]. Another approach is to hold the liquid metal at high temperatures for a longer time, which could lead to oxide films floating to the surface, where they can be removed easily [12]. Nyahumwa et al. investigated the effect of hot isostatic pressing (HIP) on aluminium alloy castings and noted that the treatment deactivates the entrained double oxide film defects, eventually improving the fatigue life of the alloy [53].
High shear melt conditioning (HSMC) is a novel technology that has been studied extensively. It effectively breaks up entrapped inclusions, making them discontinuous and well-dispersed in the melt [35]. This allows for a faster and more efficient removal of large and small inclusions from the melt during the degassing process [54,55], thus leading to cleaner melts, oxide-free billets, and finally, extrusions of higher quality.

5. Conclusions

This study investigated the fatigue behaviour of extruded AA6082 aluminium alloy and identified the significant impact of oxide inclusions on its fatigue life.
  • Fatigue tests at similar fatigue conditions (150 MPa, 15 Hz, and R = −1) showed a wide variation in fatigue life, ranging from 0.4 to 4 million cycles, indicating the presence of microstructural defects.
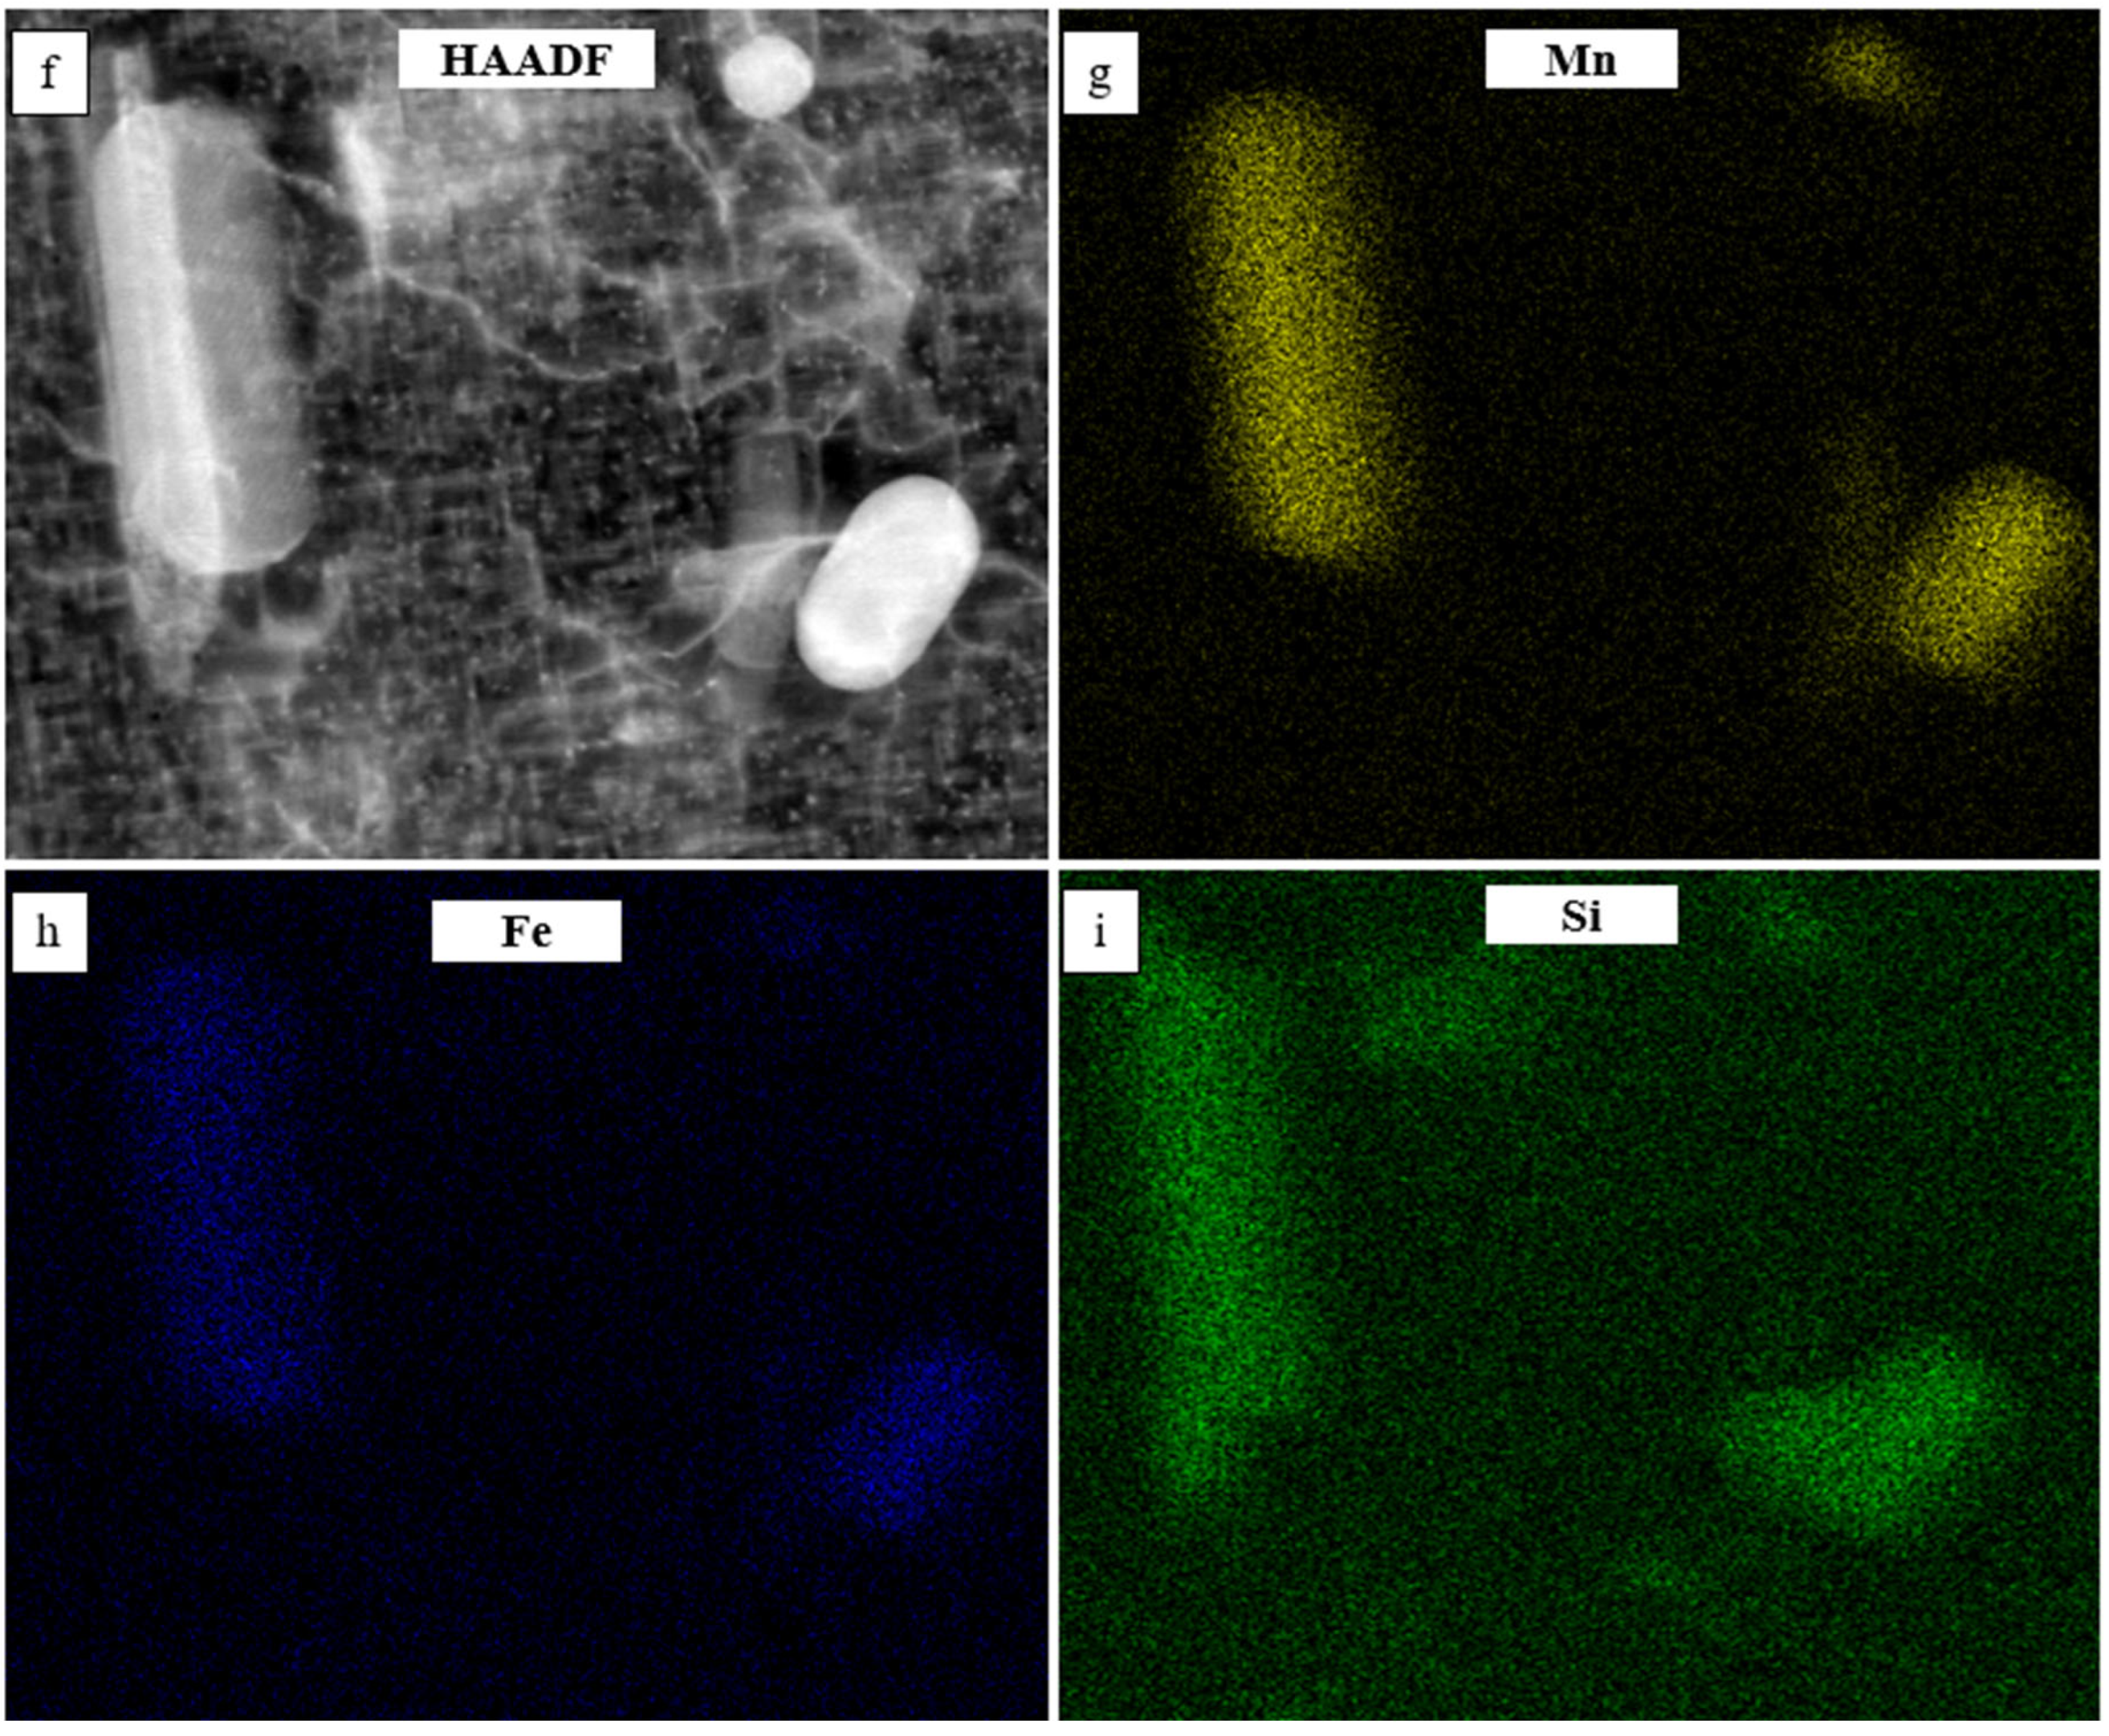
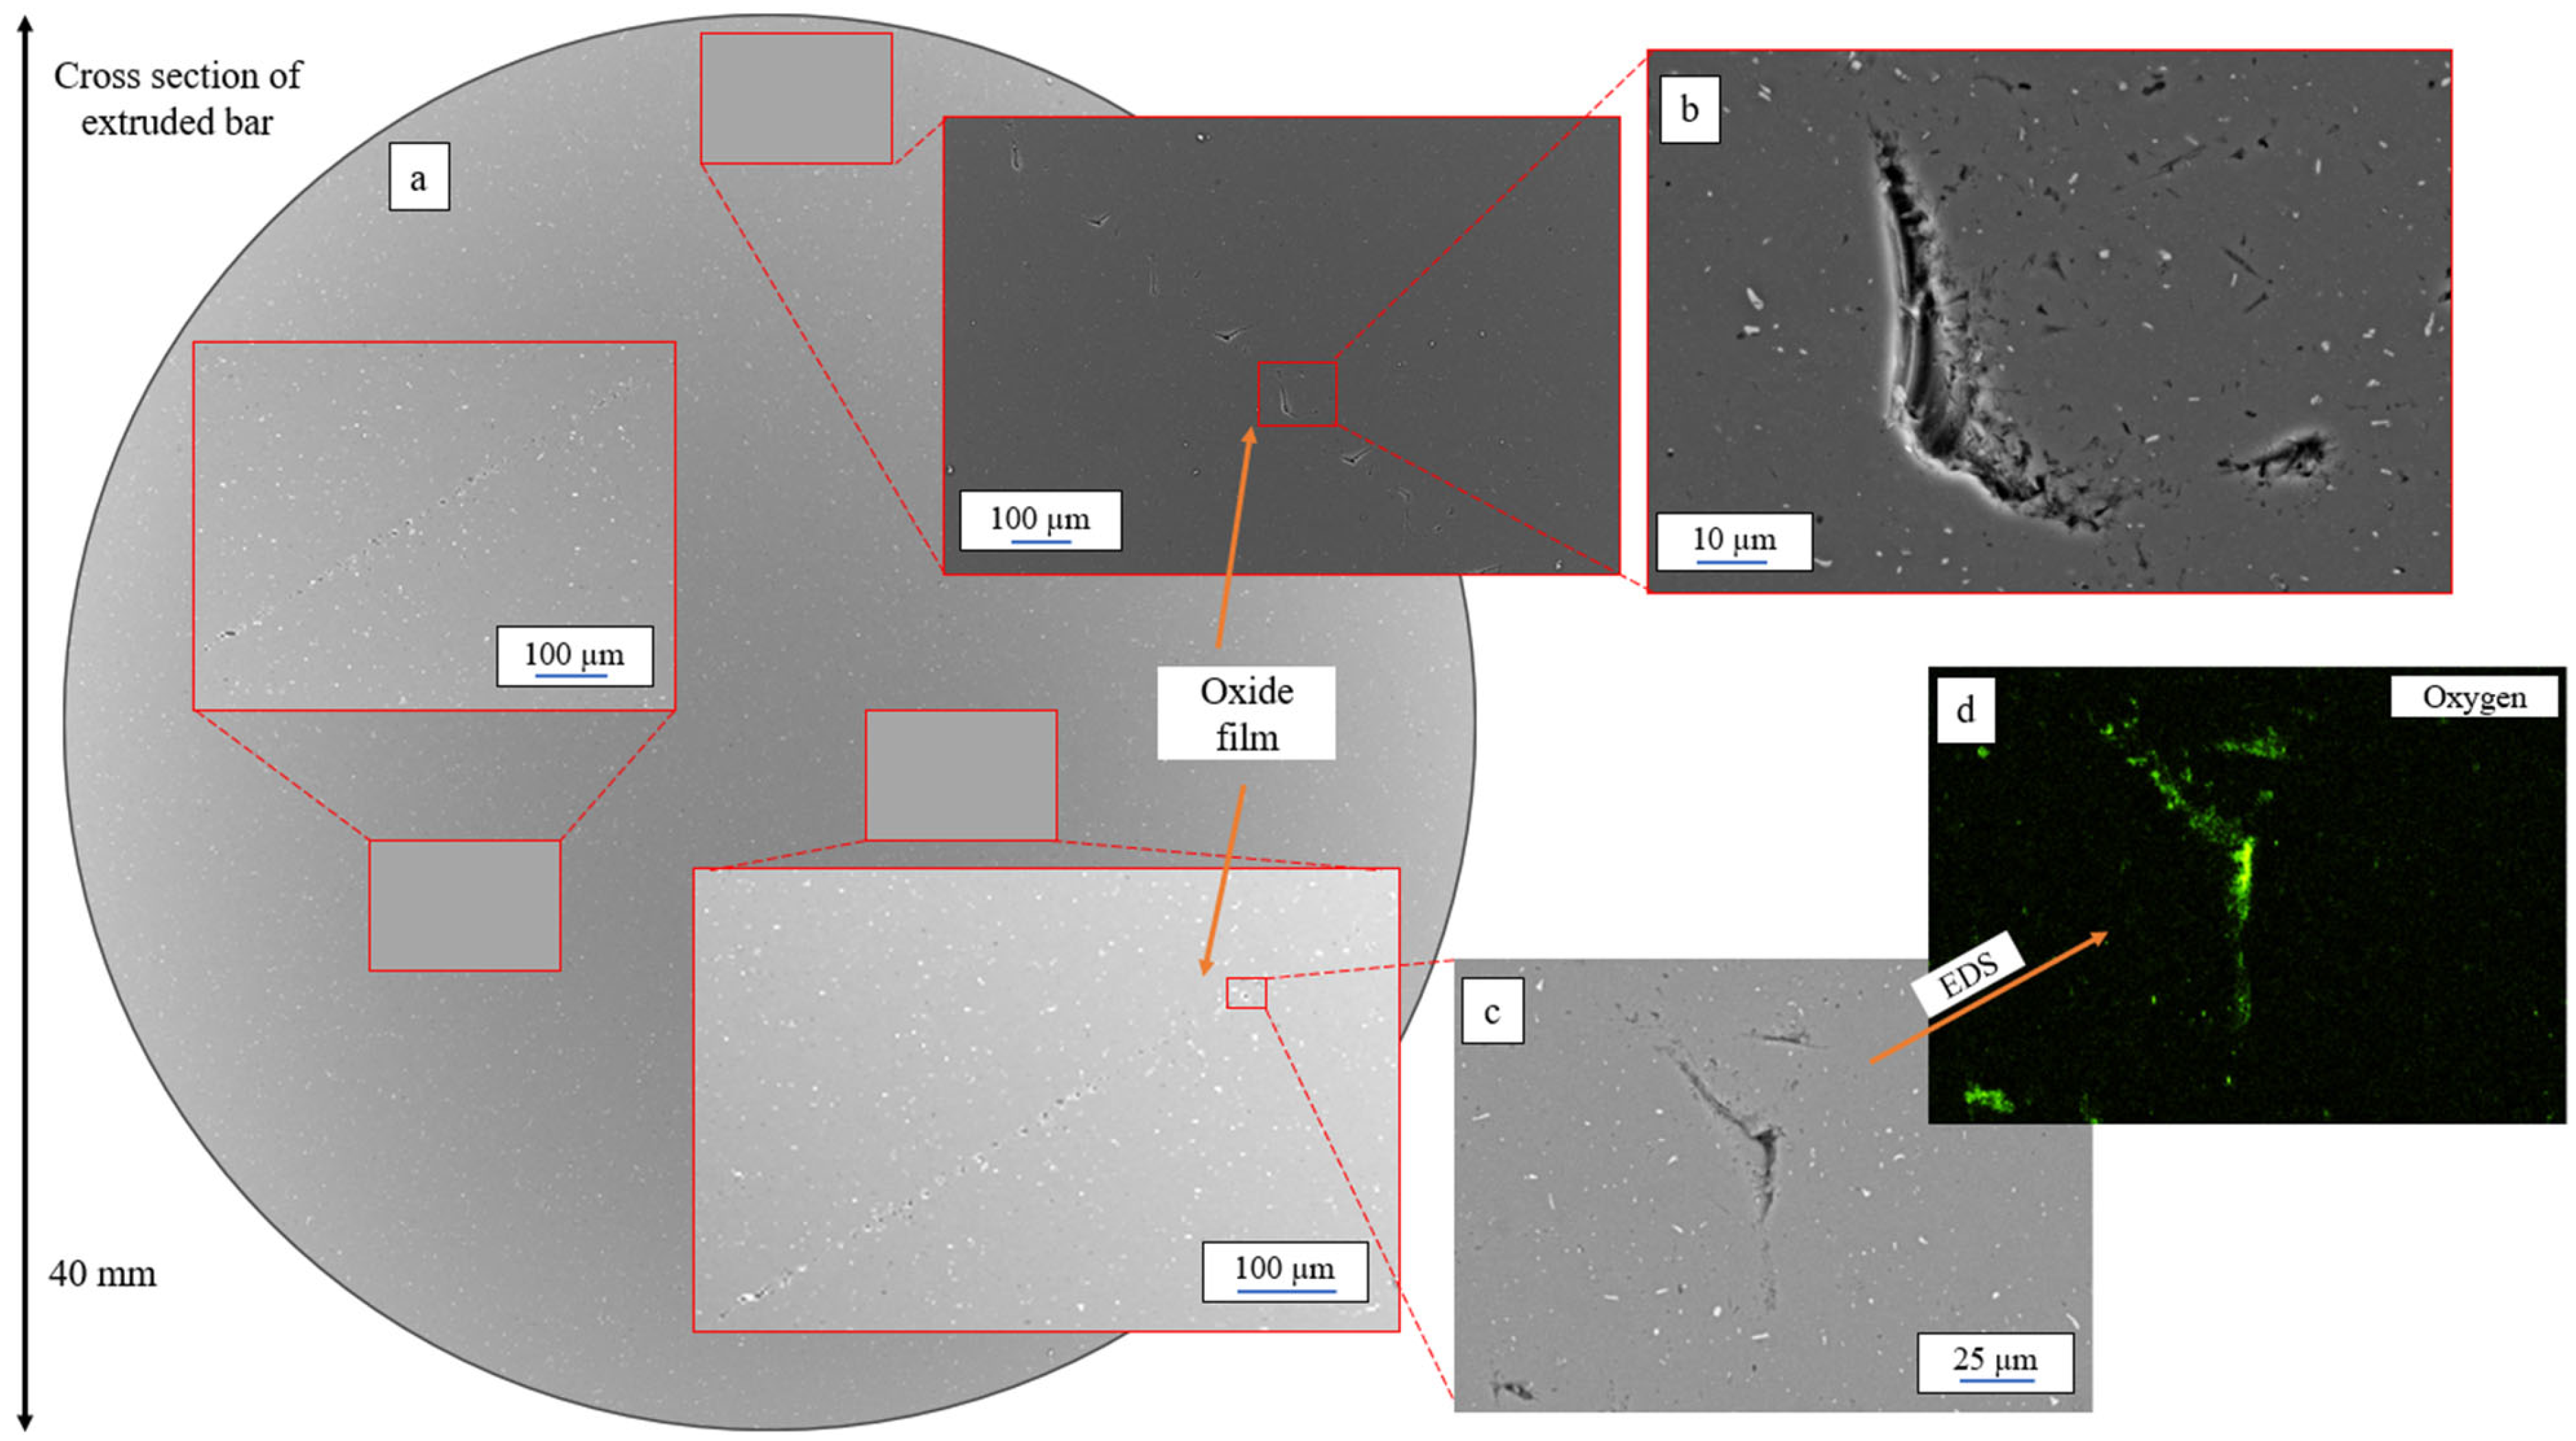
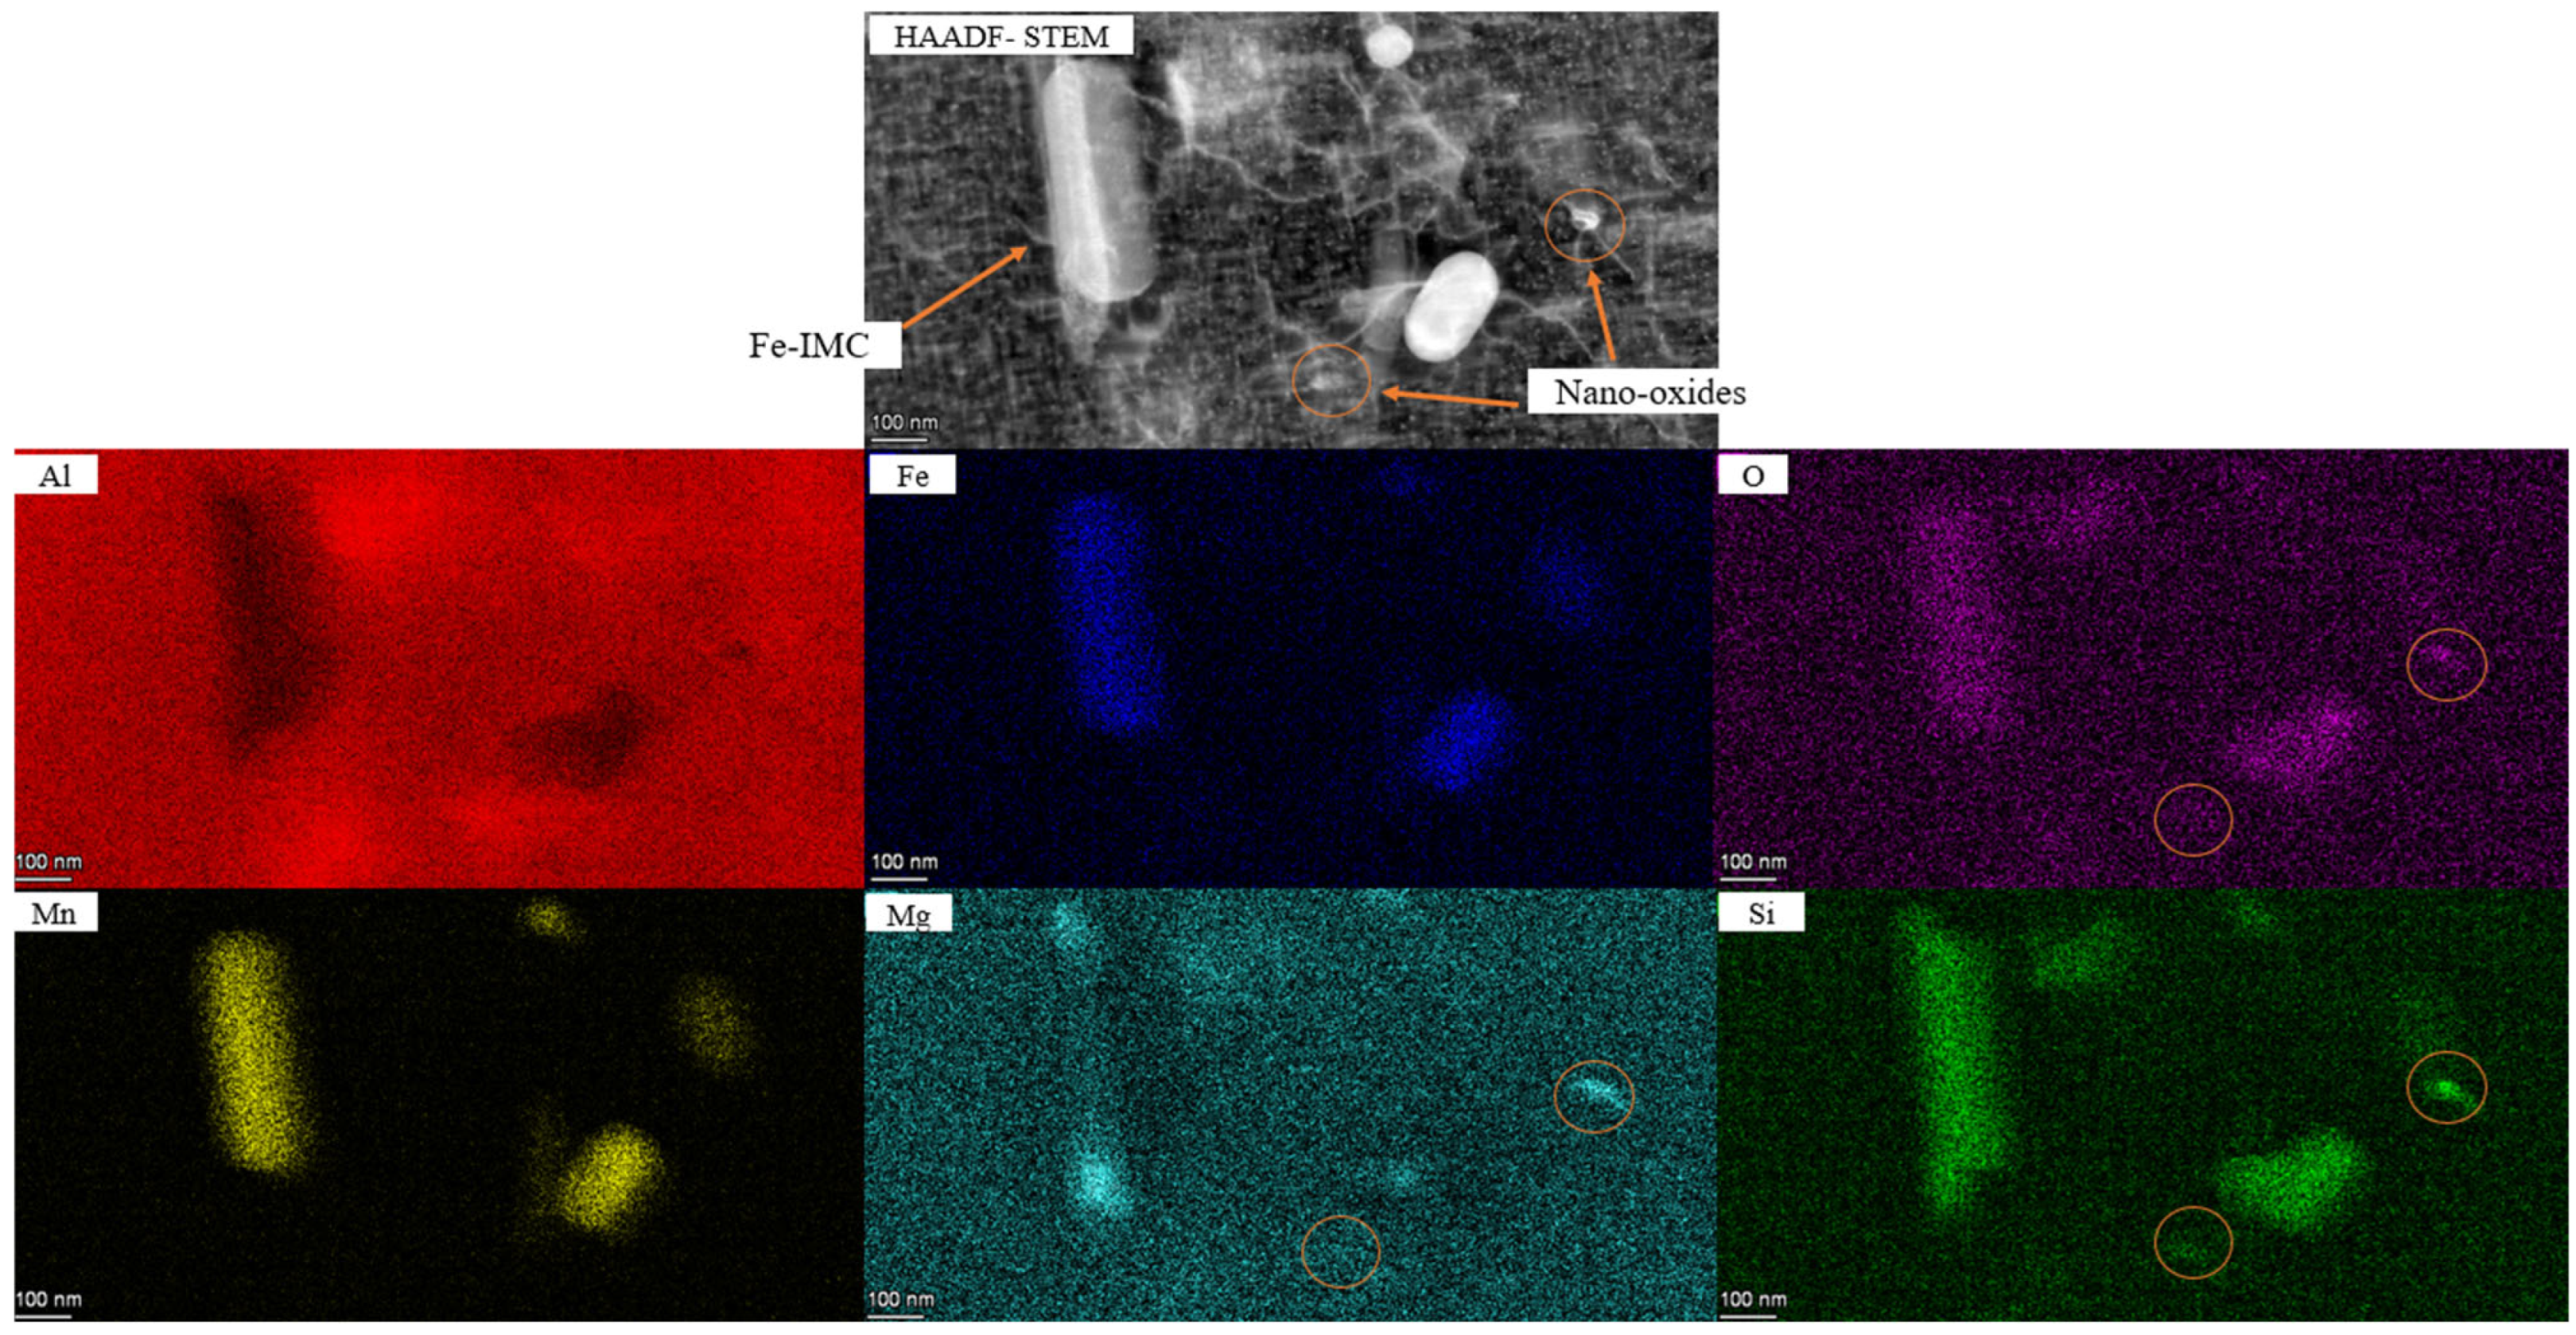
  • SEM and EDS analysis confirmed the existence of oxide inclusions on the fracture surface and edges of the material.
  • Larger oxide particles ranging from 39 µm to 120 µm in thickness, and up to 1300 µm in length, were present in the samples with a shorter fatigue life.
  • The sample with lower fatigue life exhibited an oxide volume fraction of 0.35% with a particle of 10/mm3, whereas the sample with higher fatigue life presented an oxide fraction of 0.22% and a particle density of only 6/mm3.
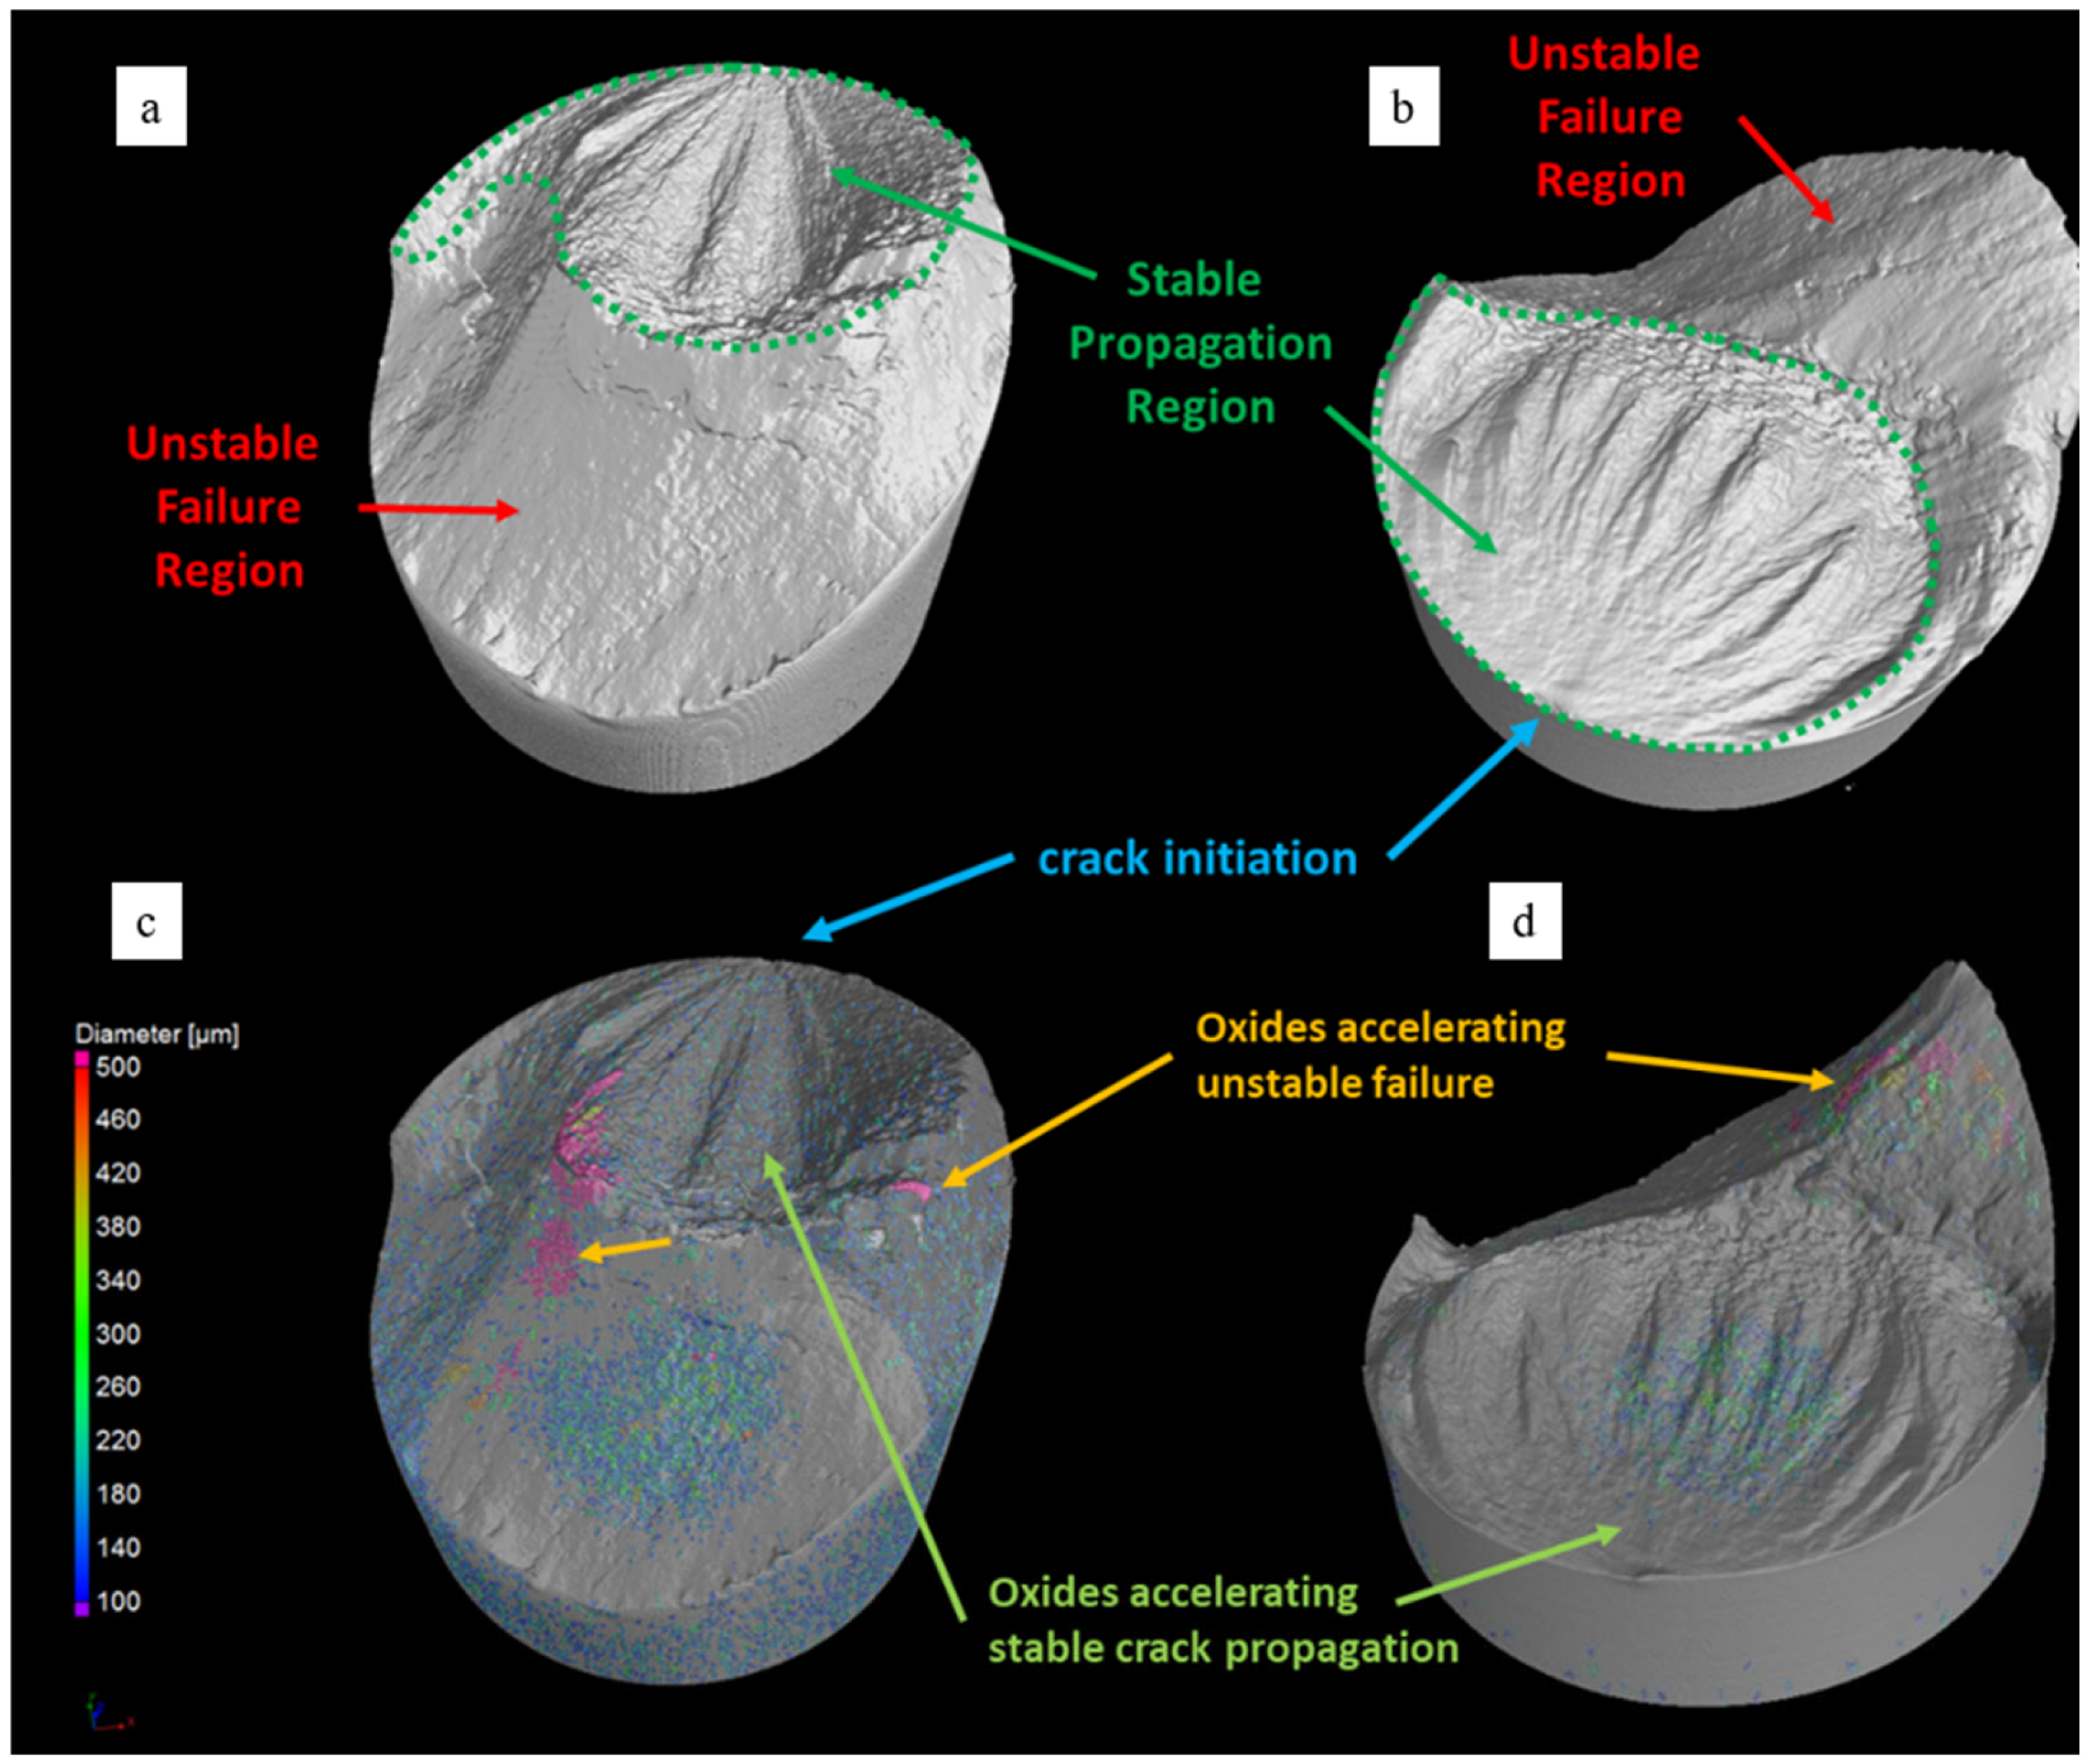
  • The presence of oxides acted as stress concentrators and contributed to faster crack growth and premature fatigue failure.
  • A sample exhibiting low fatigue life presented more defects closer to the surface, leading to a higher crack propagation rate at early stages.
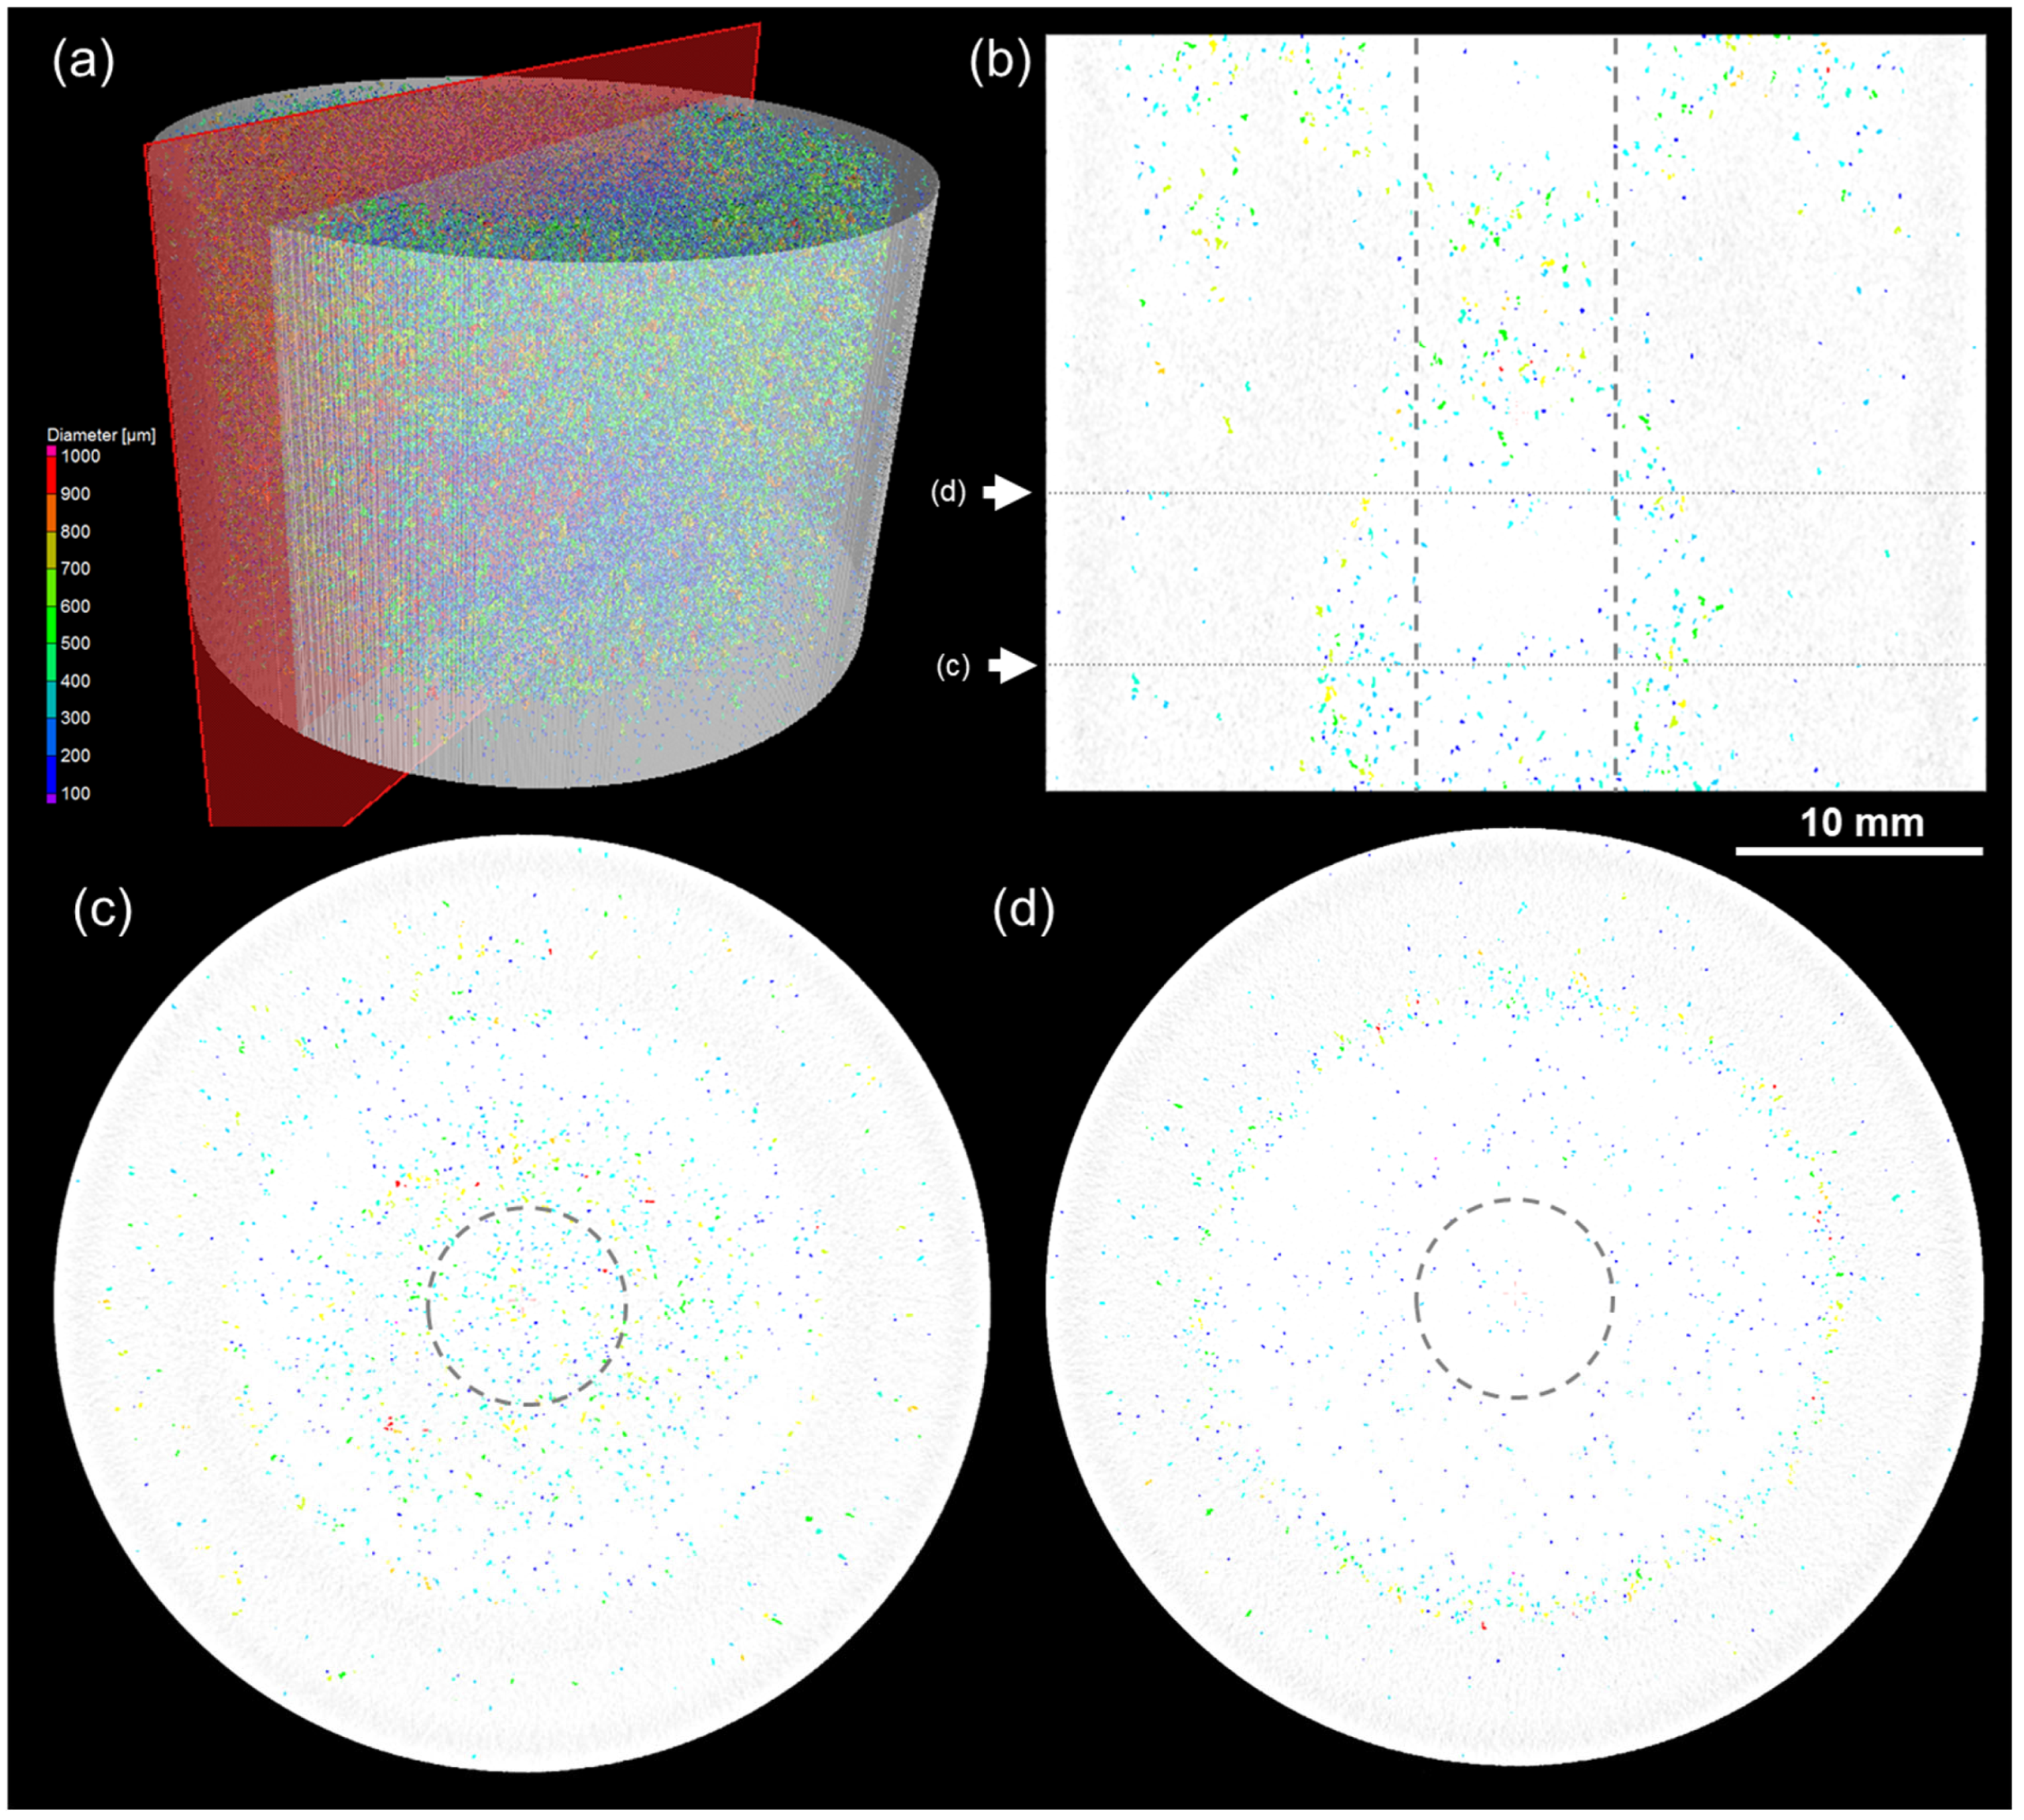
  • CT scanning revealed that the internal distribution and size of the oxides play an important role in the crack propagation and final unstable failure. It also confirms that these defects are heterogeneously distributed in the as-received extruded rod, suggesting that they originated during the material processing stage.
Hence, it is essential to optimise manufacturing casting processes to minimise the formation of oxides to enhance the fatigue performance of aluminium alloys.

Supplementary Materials

The supporting information mentioned in the Section 3.3 can be downloaded at: https://www.mdpi.com/article/10.3390/jmmp9070247/s1, Table S1: Fatigue Test Results.

Author Contributions

Conceptualisation, S.S.J. and Z.F.; formal analysis, V.V., S.S.J. and J.L.N.; funding acquisition, Z.F.; investigation, V.V., S.S.J. and J.L.N.; methodology, V.V. and S.S.J.; project administration, S.S.J. and Z.F.; supervision, S.S.J. and Z.F.; validation, V.V., S.S.J. and J.L.N.; writing—original draft, V.V., S.S.J. and J.L.N.; writing—review and editing, V.V., S.S.J. and J.L.N. All authors have read and agreed to the published version of the manuscript.

Funding

This research was funded by EPSRC (UK) for Circular Metals Project and grant number EP/V011804/1.

Data Availability Statement

Data will be made available on request.

Acknowledgments

The authors would like to thank the support from the Brunel Centre for Advanced Solidification Technology (BCAST), at Brunel University London, where this work was accomplished.

Conflicts of Interest

The authors declare no conflicts of interest.

References

  1. Jiang, J.; Cui, J.; Wang, Y.; Huang, M.; Dong, J.; Yan, J. Effect of T6 heat treatment on microstructure and mechanical properties of 6082 aluminum alloy automotive flange components formed by squeeze casting. Mater. Sci. Eng. A 2024, 912, 146974. [Google Scholar] [CrossRef]
  2. Klemenc, J.; Glodež, S.; Steinacher, M.; Zupanič, F. LCF behaviour of high strength aluminium alloys AA 6110A and AA 6086. Int. J. Fatigue 2023, 177, 107971. [Google Scholar] [CrossRef]
  3. Stojanovic, B.; Bukvic, M.; Epler, I. Application of Aluminum and Aluminum Alloys in Engineering. Appl. Eng. Lett. 2018, 3, 52–62. [Google Scholar] [CrossRef]
  4. Zupanič, F.; Klemenc, J.; Steinacher, M.; Glodež, S. Microstructure, mechanical properties and fatigue behaviour of a new high-strength aluminium alloy AA 6086. J. Alloys Compd. 2023, 941, 168976. [Google Scholar] [CrossRef]
  5. Bannantine, J.A.; Comer, J.J.; Handrock, J.L. Fundamentals of Metal Fatigue Analysis; Prentice Hall: Englewood Cliffs, NJ, USA, 1990. [Google Scholar]
  6. Schijve, J. Fatigue of Structures and Materials, 2nd ed.; [Nachdr.]; Springer: Dordrecht, The Netherlands, 2010. [Google Scholar]
  7. Suresh, S. Fatigue of Materials, 2nd ed.; Cambridge University Press: Cambridge, MA, USA; New York, NY, USA, 1998. [Google Scholar]
  8. Avner, S.H. Introduction to Physical Metallurgy, 2nd ed.; McGraw-Hill Book Co: New York, NY, USA, 1974. [Google Scholar]
  9. Siddesh Kumar, N.M.; Dhruthi; Pramod, G.K.; Samrat, P.; Sadashiva, M. A Critical Review on Heat Treatment of Aluminium Alloys. Mater. Today Proc. 2022, 58, 71–79. [Google Scholar] [CrossRef]
  10. Chauhan, K. Influence of Heat Treatment on the Mechanical Properties of Aluminium Alloys (6xxx Series): A Literature Review. Int. J. Eng. Res. 2017, 6, IJERTV6IS030301. Available online: https://www.ijert.org/research/influence-of-heat-treatment-on-the-mechanical-properties-of-aluminium-alloys-6xxx-series-a-literature-review-IJERTV6IS030301.pdf (accessed on 17 July 2025).
  11. Di Sabatino, M.; Arnberg, L.; Rørvik, S.; Prestmo, A. The influence of oxide inclusions on the fluidity of Al–7wt.%Si alloy. Mater. Sci. Eng. A 2005, 413–414, 272–276. [Google Scholar] [CrossRef]
  12. Liu, L.; Samuel, F.H. Effect of inclusions on the tensile properties of Al–7% Si–0.35% Mg (A356.2) aluminium casting alloy. J. Mater. Sci. 1998, 33, 2269–2281. [Google Scholar] [CrossRef]
  13. Zhang, L.; Lv, X.; Torgerson, A.T.; Long, M. Removal of Impurity Elements from Molten Aluminum: A Review. Miner. Process. Extr. Metall. Rev. 2011, 32, 150–228. [Google Scholar] [CrossRef]
  14. Poletti, C.; Bureau, R.; Loidolt, P.; Simon, P.; Mitsche, S.; Spuller, M. Microstructure Evolution in a 6082 Aluminium Alloy during Thermomechanical Treatment. Materials 2018, 11, 1319. [Google Scholar] [CrossRef]
  15. Kumar, N.; Goel, S.; Jayaganthan, R.; Owolabi, G.M. The influence of metallurgical factors on low cycle fatigue behavior of ultra-fine grained 6082 Al alloy. Int. J. Fatigue 2018, 110, 130–143. [Google Scholar] [CrossRef]
  16. Nanninga, N.; White, C. The relationship between extrusion die line roughness and high cycle fatigue life of an AA6082 alloy. Int. J. Fatigue 2009, 31, 1215–1224. [Google Scholar] [CrossRef]
  17. Wang, P.; Wang, B.; Liu, Y.; Zhang, P.; Luan, Y.K.; Li, D.Z.; Zhang, Z.F. Effects of inclusion types on the high-cycle fatigue properties of high-strength steel. Scr. Mater. 2022, 206, 114232. [Google Scholar] [CrossRef]
  18. Gopalan, R.; Prabhu, N.K. Oxide bifilms in aluminium alloy castings—A review. Mater. Sci. Technol. 2011, 27, 1757–1769. [Google Scholar] [CrossRef]
  19. Wang, Q.S.; Crepeau, P.N.; Davidson, C.J.; Griffiths, J.R. Oxide films, pores and the fatigue lives of cast aluminum alloys. Metall. Mater. Trans. B 2006, 37, 887–895. [Google Scholar] [CrossRef]
  20. Tahmasbi, K.; Yaghoobi, M.; Shao, S.; Shamsaei, N.; Haghshenas, M. Simulated effect of defect volume and location on very high cycle fatigue of laser beam powder bed fused AlSi10Mg. Int. J. Fatigue 2025, 197, 108926. [Google Scholar] [CrossRef]
  21. Sanaei, N.; Fatemi, A. Analysis of the effect of surface roughness on fatigue performance of powder bed fusion additive manufactured metals. Theor. Appl. Fract. Mech. 2020, 108, 102638. [Google Scholar] [CrossRef]
  22. Rodopoulos, C. Optimisation of the fatigue resistance of 2024-T351 aluminium alloys by controlled shot peening—Methodology, results and analysis. Int. J. Fatigue 2004, 26, 849–856. [Google Scholar] [CrossRef]
  23. Trško, L.; Fintová, S.; Nový, F.; Bokůvka, O.; Jambor, M.; Pastorek, F.; Florková, Z.; Oravcová, M. Study of Relation between Shot Peening Parameters and Fatigue Fracture Surface Character of an AW 7075 Aluminium Alloy. Metals 2018, 8, 111. [Google Scholar] [CrossRef]
  24. ASTM E466-15; Practice for Conducting Force Controlled Constant Amplitude Axial Fatigue Tests of Metallic Materials. ASTM International: West Conshohocken, PA, USA, 2015. [CrossRef]
  25. ASTM E8/E8M-09; Test Methods for Tension Testing of Metallic Materials. ASTM International: West Conshohocken, PA, USA, 2009. [CrossRef]
  26. Negendank, M.; Taparli, U.A.; Gall, S.; Müller, S.; Reimers, W. Microstructural evolution of indirectly extruded seamless 6xxx aluminum tubes with axial variable wall thickness. J. Mater. Process. Technol. 2016, 230, 187–197. [Google Scholar] [CrossRef]
  27. Qiu, S.; Xia, E.; Liu, L.; Ye, T.; Liu, J.; Tang, J.; Liu, W.; Wu, Y. Tensile Behavior and Microstructure Evolution of an Extruded 6082 Aluminum Alloy Sheet at High Temperatures. Metals 2023, 14, 7. [Google Scholar] [CrossRef]
  28. Serrano-Munoz, I.; Fernández, R.; Saliwan-Neumann, R.; González-Doncel, G.; Bruno, G. Dislocation substructures in pure aluminium after creep deformation as studied by electron backscatter diffraction. J. Appl. Crystallogr. 2022, 55, 860–869. [Google Scholar] [CrossRef]
  29. Bouquerel, J.; Diawara, B.; Dubois, A.; Dubar, M.; Vogt, J.-B.; Najjar, D. Investigations of the microstructural response to a cold forging process of the 6082-T6 alloy. Mater. Des. 2015, 68, 245–258. [Google Scholar] [CrossRef]
  30. Borrego, L.P.; Abreu, L.M.; Costa, J.M.; Ferreira, J.M. Analysis of low cycle fatigue in AlMgSi aluminium alloys. Eng. Fail. Anal. 2004, 11, 715–725. [Google Scholar] [CrossRef]
  31. Hua, L.; Yuan, P.; Zhao, N.; Hu, Z.; Ma, H. Microstructure and mechanical properties of 6082 aluminum alloy processed by preaging and hot forging. Trans. Nonferrous Met. Soc. China 2022, 32, 790–800. [Google Scholar] [CrossRef]
  32. Xu, X.; Zhu, W.; Guo, X.; Liang, C.; Deng, Y. Effect of ageing treatment process on the microstructure development and mechanical properties of 6082 Al alloy. J. Alloys Compd. 2023, 935, 167892. [Google Scholar] [CrossRef]
  33. Hamada, A.S.; Järvenpää, A.; Ahmed, M.M.Z.; Jaskari, M.; Wynne, B.P.; Porter, D.A.; Karjalainen, L.P. The microstructural evolution of friction stir welded AA6082-T6 aluminum alloy during cyclic deformation. Mater. Sci. Eng. A 2015, 642, 366–376. [Google Scholar] [CrossRef]
  34. Joshi, S.S.; Lefebvre, W.; Duval, Y.; Folton, C.; Hug, E.; Fazzini, M.; Keller, C. Impact of laser powder bed fusion processing on the cyclic and fatigue properties of Ni20Cr alloy. Mater. Sci. Eng. A 2024, 890, 145915. [Google Scholar] [CrossRef]
  35. Niu, Z.; Que, Z.; Patel, J.B.; Fan, Z. Assessment and Improvement of Melt Quality of Recycled Secondary A357 Alloy by Application of the High Shear Melt Conditioning (HSMC) Technology. Crystals 2024, 14, 1044. [Google Scholar] [CrossRef]
  36. Kim, D.; Jiang, R.; Reed, P.A.S. Microstructural and oxidation effects on fatigue crack initiation mechanisms in a turbine disc alloy. J. Mater. Sci. 2023, 58, 1869–1885. [Google Scholar] [CrossRef]
  37. Gerhard, N.; Göttlich, T.; Schraknepper, D.; Bergs, T. Experimental investigation on friction under machining conditions with cutting fluid supply. Procedia CIRP 2022, 108, 378–383. [Google Scholar] [CrossRef]
  38. Grzesik, W.; Nieslony, P. Prediction of friction and heat flow in machining incorporating thermophysical properties of the coating–chip interface. Wear 2004, 256, 108–117. [Google Scholar] [CrossRef]
  39. Scamans, G.M.; Frolish, M.F.; Rainforth, W.M.; Zhou, Z.; Liu, Y.; Zhou, X.; Thompson, G.E. The ubiquitous Beilby layer on aluminium surfaces. Surf. Interface Anal. 2010, 42, 175–179. [Google Scholar] [CrossRef]
  40. Liu, B.; Zhou, X.; Zhang, X. Orthogonal machining introduced microstructure modification in AA7150-T651 aluminium alloy. Mater. Charact. 2017, 123, 91–98. [Google Scholar] [CrossRef]
  41. Li, X.; Huang, C.; Yang, J.; Liu, D.; Li, T.; Tan, C.; Jia, W.; Wan, M. Effect of multilevel lamellar microstructures on notch high cycle fatigue damage micromechanism of TC21 alloy. Int. J. Fatigue 2025, 199, 109013. [Google Scholar] [CrossRef]
  42. Tan, C.; Sun, Q.; Xiao, L.; Zhao, Y.; Sun, J. Cyclic deformation and microcrack initiation during stress controlled high cycle fatigue of a titanium alloy. Mater. Sci. Eng. A 2018, 711, 212–222. [Google Scholar] [CrossRef]
  43. Campbell, J. Complete Casting Handbook: Metal Casting Processes, Metallurgy, Techniques and Design, 1st ed.; Elsevier Butterworth-Heinemann: Oxford, UK; Waltham, MA, USA, 2011. [Google Scholar]
  44. Cao, X.; Campbell, J. Effect of melt superheating on convection-free precipitation and sedimentation of primary α-Fe phase in liquid Al-11.5Si-0.4Mg alloy. Int. J. Cast Met. Res. 2003, 15, 595–608. [Google Scholar] [CrossRef]
  45. El-Sayed, M.A.; Essa, K.; Hassanin, H. Influence of Bifilm Defects Generated during Mould Filling on the Tensile Properties of Al–Si–Mg Cast Alloys. Metals 2022, 12, 160. [Google Scholar] [CrossRef]
  46. Osoba, L.O.; Owolabi, O.B.; Talabi, S.I.; Adeosun, S.O. Review on Oxide Formation and Aluminum Recovery Mechanism during Secondary Smelting. Mater. Eng. 2018, 2, 45–51. [Google Scholar]
  47. Song, H.; Zhang, L.; Cao, F.; Gu, X.; Sun, J. Oxide bifilm defects in aluminum alloy castings. Mater. Lett. 2021, 285, 129089. [Google Scholar] [CrossRef]
  48. Akaberi, N.; Taghiabadi, R.; Razaghian, A. Effect of Bifilm Oxides on the Dry Sliding Wear Behavior of Fe-Rich Al–Si Alloys. J. Tribol. 2017, 139, 051602. [Google Scholar] [CrossRef]
  49. El-Sayed, M.A.; Salem, H.A.G.; Kandeil, A.Y.; Griffiths, W.D. Effect of Holding Time Before Solidification on Double-Oxide Film Defects and Mechanical Properties of Aluminum Alloys. Metall. Mater. Trans. B 2011, 42, 1104–1109. [Google Scholar] [CrossRef]
  50. Uludağ, M.; Çetin, R.; Gemi, L.; Dispinar, D. Change in Porosity of A356 by Holding Time and Its Effect on Mechanical Properties. J. Mater. Eng. Perform. 2018, 27, 5141–5151. [Google Scholar] [CrossRef]
  51. Li, D.Z.; Campbell, J.; Li, Y.Y. Filling system for investment cast Ni-base turbine blades. J. Mater. Process. Technol. 2004, 148, 310–316. [Google Scholar] [CrossRef]
  52. Raza, M.H.; Wasim, A.; Sajid, M.; Hussain, S. Investigating the effects of gating design on mechanical properties of aluminum alloy in sand casting process. J. King Saud Univ. Eng. Sci. 2021, 33, 201–212. [Google Scholar] [CrossRef]
  53. Nayhumwa, C.; Green, N.R.; Campbell, J. Influence of casting technique and hot isostatic pressing on the fatigue of an Al-7Si-Mg alloy. Metall. Mater. Trans. A 2001, 32, 349–358. [Google Scholar] [CrossRef]
  54. Lazaro-Nebreda, J.; Patel, J.B.; Fan, Z. Improved degassing efficiency and mechanical properties of A356 aluminium alloy castings by high shear melt conditioning (HSMC) technology. J. Mater. Process. Technol. 2021, 294, 117146. [Google Scholar] [CrossRef]
  55. Lazaro-Nebreda, J.; Patel, J.B.; Lordan, E.; Zhang, Y.; Karakulak, E.; Al-Helal, K.; Scamans, G.M.; Fan, Z. Degassing of Aluminum Alloy Melts by High Shear Melt Conditioning Technology: An Overview. Metals 2022, 12, 1772. [Google Scholar] [CrossRef]
Figure 1. Geometry and dimensions of the cylindrical sample.
Jmmp 09 00247 g001
Figure 2. (a) OM image of the grain structure of the as-extruded sample in the longitudinal direction (the viewing plane is parallel to the extrusion axis); (b,c) SEM micrographs of AA6082 in the as-extruded T6 condition.
Jmmp 09 00247 g002
Figure 3. EBSD-based micrographs of as-extruded 6082 aluminium alloy in T6 condition (viewing plane is parallel to extrusion axis): (a) inverse pole figure (IPF) map, (b) kernel average misorientation (KAM) map with corresponding distribution of KAM angle, and (c) grain size distribution graph.
Jmmp 09 00247 g003
Figure 4. (a,b) HAADF-STEM micrographs of 6082 (perpendicular to the extrusion axis) in the [110] zone axis showing dispersoids and extrusion-induced dislocations; (c) conventional BF-TEM micrograph indicating dispersoids and dislocations; (d) HAADF-STEM micrograph showing β″ precipitates; (e) selected area diffraction pattern (SADP) in conditions just away from the [110] zone axis, indicating weak spots confirming the presence of β″ precipitates; and (fi) HAADF images of dispersoids with the EDS maps.
Jmmp 09 00247 g004aJmmp 09 00247 g004b
Figure 5. Engineering stress–strain curve of the as-extruded 6082 samples in the T6 condition.
Jmmp 09 00247 g005
Figure 6. Fatigue life of the alloy at various fatigue conditions.
Jmmp 09 00247 g006
Figure 7. SEM micrographs of the fracture surfaces under different fatigue conditions.
Jmmp 09 00247 g007
Figure 8. (a,b) IPF map- and (c,d) KAM map-based micrographs of samples failed at 0.4 and 4.4 million cycles, respectively.
Jmmp 09 00247 g008
Figure 9. (a) Grain size distribution against area fraction and (b) misorientation distribution against number fraction for fatigued samples failed at 4.4 and 0.4 million cycles and as-extruded T6 samples.
Jmmp 09 00247 g009
Figure 10. SEM micrographs of samples failed at (a,b) 0.4 million cycles and (c,d) 4.4 million cycles.
Jmmp 09 00247 g010
Figure 11. EDS point analyses of fracture surface indicating oxide particles. Spectra curve and quantified elemental analysis is shown for the point close to the right surface indicated by the arrow.
Jmmp 09 00247 g011
Figure 12. 3D views via X-ray CT of two fractured samples tested under 150MPa: (a) and (c) sample with low fatigue life (0.4 million cycles); (b) and (d) sample with high fatigue life (4.4 million cycles).
Jmmp 09 00247 g012
Figure 13. 3D analysis of the oxide particles identified up to 2 mm under the fractured surface for the 2 samples tested at 150 MPa, showing different fatigue lives. (a) Feret size histograms. (b) Distribution from the edge to the centre.
Jmmp 09 00247 g013
Figure 14. (a) SEM image of a cross-sectional slice of the machined sample; (b) EDS map of the sample in the gauge area.
Jmmp 09 00247 g014
Figure 15. (a) Schematic image of an extruded rod 40 mm in diameter in the T6 condition (perpendicular to the extrusion axis) with multiple zones indicating broken oxide films; (b) magnified SEM image of an oxide particle; (c) magnified SEM image of an oxide from another region; and (d) EDS analysis confirms the presence of oxygen as shown in the elemental map.
Jmmp 09 00247 g015
Figure 16. STEM-EDS map of extruded rod (in [110] zone axis) with elemental maps indicating nano-oxides.
Jmmp 09 00247 g016
Figure 17. Visualisation and analysis via CT of the oxides in the extruded rod before machining: (a) 3D view; (b) vertical section, along extrusion direction; (c,d) horizontal sections at different positions, highlighting the heterogeneous distribution of the oxides.
Jmmp 09 00247 g017
Table 1. Chemical composition of extruded aluminium alloy (weight %).
ElementMgSiMnFeCrAl
Measured0.611.020.420.180.01Balance
From manufacturer (Aalco)0.6–1.200.7–1.300.4–1.000.0–0.500.0–0.25Balance
Table 2. Tensile properties of the as-extruded samples in the T6 condition.
PropertiesValues
Yield strength (MPa)334 ± 2
Ultimate tensile strength (MPa)360 ± 3
Young’s modulus (GPa)72
Elongation (%)18.1 ± 0.6
Table 3. Average fatigue life of the samples under different fatigue conditions.
TestsStress (MPa)Frequency (Hz)Stress Ratio (R)No. of TestsAverage Life (Cycles)Standard Deviation
13155−0.5334461257
218015−13196,2174595
315015−16468,404184,647
415015−144,541,861608,998
514015−125,701,0532,051,723
Table 4. Area of the stable propagation region from the samples shown in Figure 7.
No.Stress (MPa)Frequency (Hz)Stress Ratio (R)Fatigue Life (Cycles)Area of the Stable Propagation (mm2)Percentage of the Total Area
13155−0.522979.919.7
218015−1198,03817.434.6
315015−1415,18124.248.1
415015−14,515,55426.753.3
514015−17,752,77730.159.9
Disclaimer/Publisher’s Note: The statements, opinions and data contained in all publications are solely those of the individual author(s) and contributor(s) and not of MDPI and/or the editor(s). MDPI and/or the editor(s) disclaim responsibility for any injury to people or property resulting from any ideas, methods, instructions or products referred to in the content.

