Article

Assessment of Causes of Precision and Accuracy Loss in Metal Binder Jetting Additive Manufacturing Technology

1
Department of Industrial Engineering, University of Trento, Via Sommarive 9, 38123 Trento, Italy
2
Mimest S.r.l., Via del Lavoro 30, 38063 Avio, Italy
*
Author to whom correspondence should be addressed.
J. Manuf. Mater. Process. 2025, 9(11), 363; https://doi.org/10.3390/jmmp9110363
Submission received: 1 October 2025 / Revised: 28 October 2025 / Accepted: 29 October 2025 / Published: 4 November 2025
(This article belongs to the Special Issue Large-Scale Metal Additive Manufacturing)

Abstract

Metal binder jetting (MBJ) is an additive manufacturing technology of increasing interest due to its potential competitiveness in medium- and large-scale production, especially from a sustainability perspective. However, challenges in controlling the product accuracy and precision significantly limit the widespread adoption of this technology. This work investigates the achievable accuracy, precision, and spatial repeatability of parts produced using the MBJ process. Additionally, the paper aims to identify the causes of inaccuracy and suggest countermeasures to improve the product quality. The study was conducted experimentally by designing a benchmark geometry with various basic features. This geometry was scaled to three sizes—10–20 mm (small), 20–30 mm (intermediate), and 30–50 mm (large)—and produced using two different stainless-steel powders: AISI 316L and 17-4PH. In the green state, the dimensional tolerances ranged from IT8 to IT12 for features parallel to the build direction (heights) and from IT9 to IT13 for features parallel to the build plane (lengths). In the sintered state, the tolerances ranged from IT10 to IT16. This study reveals the challenges in scaling geometries to compensate for accuracy loss originating from the printing and sintering stages. In the green state, accuracy issues are likely due to non-uniform binder application and drying operations. In the sintered state, the accuracy loss is related to variable shrinkage based on the feature size, anisotropic shrinkage depending on the print direction, and differing densification mechanisms influenced by the material type. This study offers novel insights for improving MBJ process precision, supporting wider adoption in the manufacturing industry.

1. Introduction

Additive manufacturing (AM) is a disruptive technology, and it is considered one of the pillars of Industry 4.0 [1]. The ISO/ASTM 52900 standard classifies seven groups of AM technologies, which have reached different levels of technology readiness (TRL) and industrial applications [2]. Laser powder bed fusion (L-PBF), selective laser sintering (SLM), and electron beam melting (EBM) have been extensively studied and are widely used in the production of metal products. In contrast, other technologies, such as binder jetting (BJ), are currently attracting increasing interest due to their potential competitiveness in medium- and large-scale production. However, BJ application is currently much more limited for several reasons, among them the difficulty in controlling the product accuracy and precision, which significantly limits the widespread adoption of this technology.
Binder jetting 3D printing is a layer-by-layer building technology. The building process proceeds as follows: powders are initially spread in the building box, and the layer is leveled by a roller or a blade. Successively, a binder agent is injected by a printhead over the powder bed to selectively bond the powder material. A heating source can be employed to dry the aqueous fraction of the binder just after its deposition. By repeating these steps, the so-called green product is fabricated. After the 3D printing process, a series of post-process operations is needed to obtain the final product. These include drying and curing, de-powdering, de-binding, and sintering. Other operations such as surface finishing, infiltration, and thermal treatment are not strictly necessary, but are employed to improve the geometrical, mechanical, and material properties.
The widespread adoption of BJ is currently limited by the achievable product quality, especially dimensional accuracy and precision. Sintering plays an important role in limiting process capability since large volume shrinkage occurs during thermal treatment. The dimensional shrinkage is anisotropic, and large distortions may occur. Ideally, anisotropic dimensional shrinkage can be mitigated by precisely tuning the scaling factors for green products. However, literature reviews reported that volume shrinkage and anisotropic dimensional changes depend on the printing parameters [3,4], material, particle size [5,6], and sintering cycle [7,8,9,10,11]. Zago et al. experimentally investigated the sources of geometrical inaccuracy and found a high influence of part location in the printing chamber on the volumetric shrinkage. Additionally, shape distortion was observed due to both gravity and friction between the product and sintering tray surfaces [12]. Shape distortion can be compensated for modifying the product shape in the green state. Sadeghi et al. proposed a compensation framework that employed Skorokhod and Olevsky’s viscous sintering model (SOVS) for reshaping the product geometry [13]. Other works also showed promising results in predicting shape deformation using the SOVS model [14,15,16]. Recently, Jamalkhani et al. proposed a modified SOVS model including anisotropic shrinkage in the XYZ direction, overcoming the assumption of isotropic linear shrinkage [17].
Despite these promising results, most studies are limited to single case studies and do not provide a comprehensive overview of the achievement of dimensional and geometrical quality of BJ. For this reason, in this work, a benchmark geometry was defined, including different features scaled to different sizes and produced in two different materials.
Benchmarking is a conventional testbed used to evaluate the capability, performance, and limitations of a process technology. Generally, benchmark artifacts can be designed to assess product characteristics like the geometrical and dimensional accuracies (geometrical benchmark) [18,19]. Other benchmarks are specifically designed to test the mechanical performance and optimize the process parameters using a Design of Experiment approach [7,20,21]. Rebaioli and Fassi reviewed literature to provide an overview of the geometrical benchmarks for AM. Their review focused on artifacts designed to evaluate accuracy, precision, tolerances, and surface finishing. Moreover, spatial repeatability was evaluated by studying the same sample in different places within the building box [22]. Similarly, Pastre et al. reviewed artefact design methodologies for AM, highlighting the need to integrate metrology and verification during the design stage [23].
The geometrical benchmarking of AM products has been investigated in many works. Minetola et al. compared the achievable dimensional grade tolerances (IT) of the same artefacts printed by L-PBF (EOSINT 270 machine) and EBM (A2X machine) [24]. Piscopo et al. measured the dimensional accuracy of 316L artifacts produced by Direct Energy Deposition (DED), finding lower accuracy than laser-based AM technologies [25]. Gruber et al. compared the achievable accuracy of several features printed by L-PBF, EBM, and DED using different metal powders [26].
Nevertheless, geometrical benchmarks of binder jetting green products are scarcely reported in literature. The results are outdated compared with the manufacturing evolution of the last 10 years. Moreover, 3D-printed products (green parts) have been mostly studied, disregarding the product state after sintering. Finally, most studies focused on results achieved by Z-corp machines, while other machine providers are scarcely investigated. In 2006, Dimitrov and Wijck measured the accuracy and precision of a benchmark fabricated in a Z400 (Z-corp USA) machine using different materials. Their measurements highlighted different accuracies at different nominal dimensions and in different XYZ directions [27]. Additionally, they found an IT grade between IT9 and IT15 for the green product, with an average value of IT14. In 2008, Kim and Oh measured the geometric and dimensional accuracy of a benchmark fabricated by plaster using a Z510 Spectrum (Z Corp. USA). In this study, a wide distribution of errors, not fitting a normal distribution, was obtained [28]. Recently, Dahmen et al. characterized the accuracy of 2 mm holes having axes inclined at different angles with respect to the building direction. They also compared the achievable tolerance grade using two BJ systems, finding IT grades between IT13 and IT16, with the median being IT14 [29]. In 2020, Modi and Sahu investigated the dimensional capability of bone scaffolds made of calcium sulphate hemihydrate powders printed by ZPrinter 450 (Z-Corp USA). In their experiments, they achieved IT grades between IT4 and IT10, with the median being IT7 [30]. Other works limited the analysis to specific case studies [31,32,33]. Islam and Sacks measured ITs between IT13 and IT15 on a part having multiple concentric cylinders printed with Z450 and calcium sulphate hemihydrate [34].
This paper aims to systematically investigate the dimensional accuracy and precision of products printed via binder jetting technologies, both in the green and in the sintered states. The work seeks to expand the current understanding of the causes of dimensional deviations. The study was experimentally conducted by designing a benchmark artefact that includes several features. The artifact was scaled to three different sizes to verify any influence of product size. Several samples were replicated in the building volume to assess the spatial repeatability. Additionally, parts were printed using two different powders, namely, 316L and 17-4PH stainless steels, to check for any influence of the material. Moreover, the study of densification and microstructural evolution aims at highlighting the physical mechanisms, which act together to determine the anisotropic shrinkage in the materials investigated.

2. Materials and Methods

2.1. Sample Geometry

An artifact was designed, as shown in Figure 1. Several features were included on a base, such as cylinders, holes, a prismatic feature, a chamfer, a fillet, and a freeform profile. The geometry was scaled to three sizes to investigate dimensional ranges of 10–20 (small), 20–30 (intermediate), and 30–50 (large).
Table 1, Table 2, Table 3, Table 4, Table 5 and Table 6 report the nominal dimensions in the sintered state of the three samples, distinguishing the different features.

2.2. Printing and Sintering

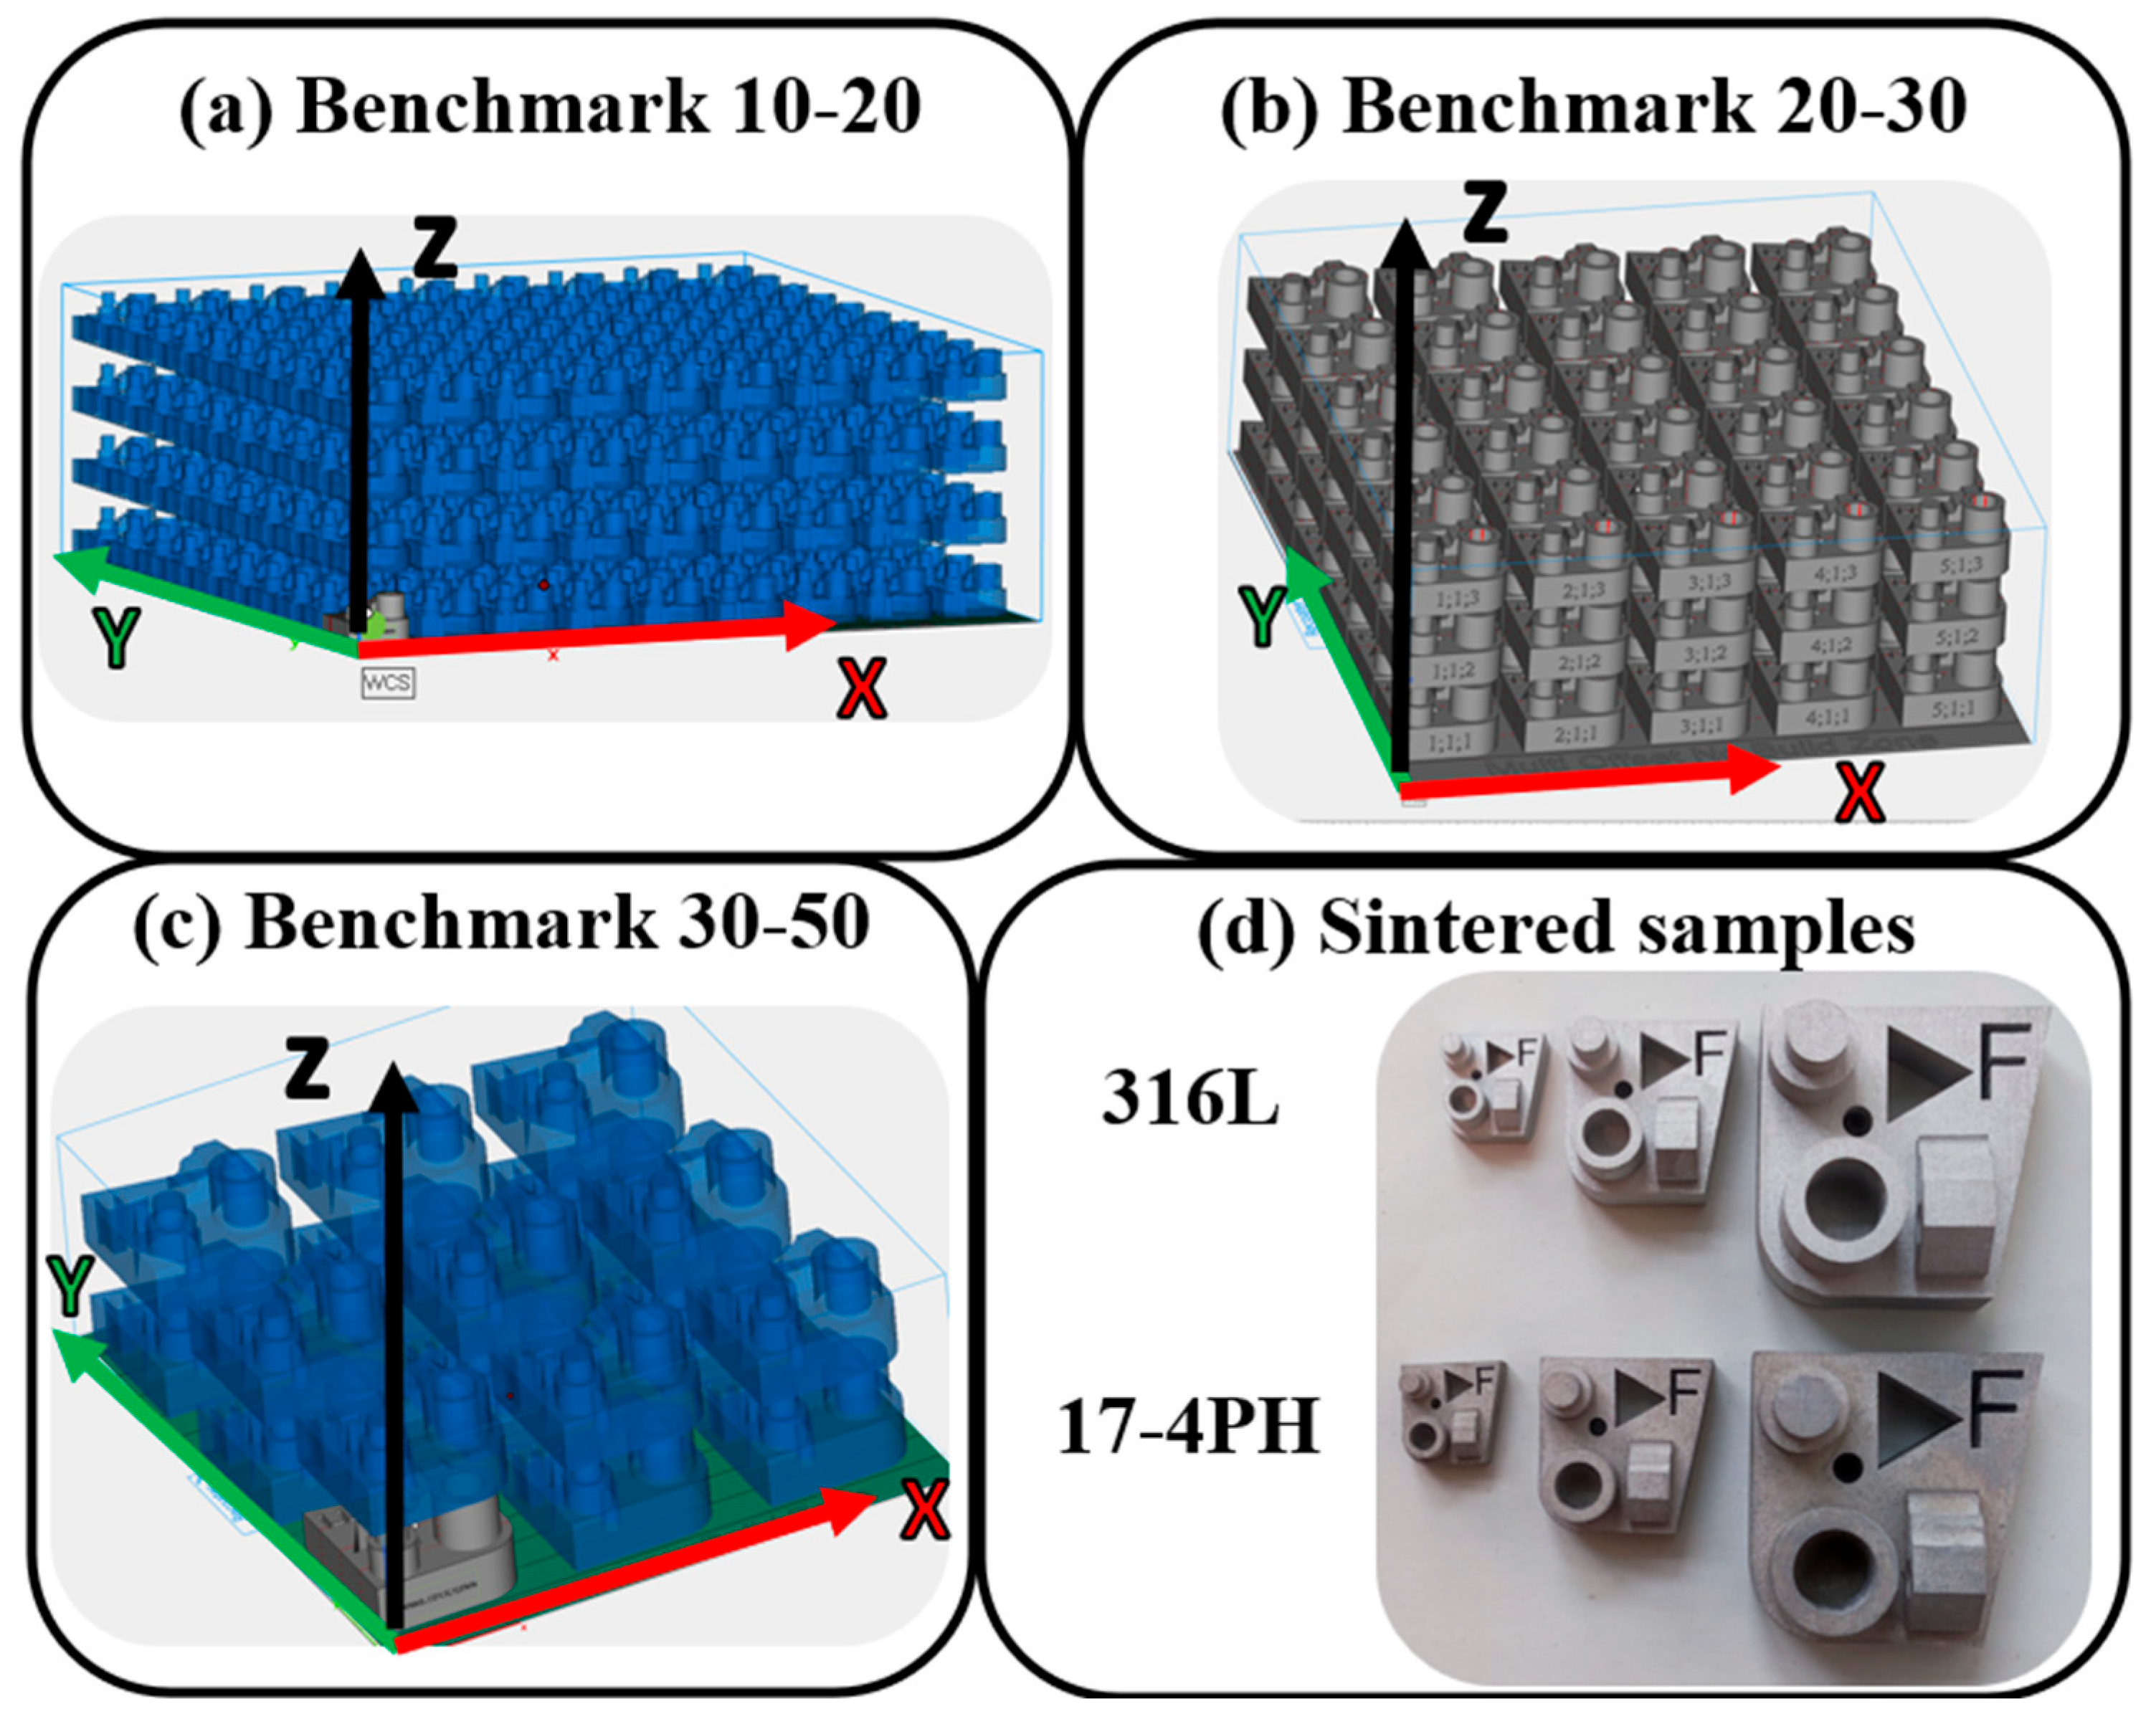
The geometry was imported into the Materialise Magic software v25 suite to position the samples in the printing volume. As shown in Figure 2, three building boxes were designed for the three benchmark geometries.
A total of 360 samples were replicated for the smaller benchmark geometries in four building planes (1 ÷ 4) at different distances from the building platform. For the intermediate size, 90 samples were distributed over three planes (1 ÷ 3), and for the larger benchmark, 18 samples were fabricated in two planes (1 ÷ 2). The distribution in the Z direction allows for studying the effect of the printing position as influenced by the building level, which corresponds to the distance between the bottom surface of the sample and the building platform.
All the samples were oriented in the same direction with respect to the printing reference system, as shown in Figure 1. The convention for the reference system used in this work is defined below:
  • The X direction corresponds to the movement direction of the printhead.
  • The Y direction corresponds to the movement direction of the blade for spreading the powder.
  • The Z direction corresponds to the building direction.
A numeric marker was also designed on the surface to recognize the positions of samples in the building box after de-powdering. Additionally, samples were scaled to compensate for the anisotropic dimensional change from sintering. Anisotropic scaling factors were applied along the XYZ directions according to the values suggested by the machine supplier to determine the nominal dimensions in the green state.
A DMP 2000 (Digital Metal®-Hoganas, Sweden, now Markforged) printer was used for fabricating the parts. The printing parameters are reported in Table 7.
The binder saturation is controlled by the dark body coefficient, which controls the number of pixels saturated by the binder. For example, a dark body equal to 3 indicates that 69% of the pixels are saturated [35].
Two different gas-atomized steel powders were investigated in this work: 316L austenitic stainless steel and 17-4PH steel. Both powders were provided by the machine supplier. After fabrication, the printing boxes were moved into a furnace for heat treatment to remove the aqueous component of the binder (drying) and to cure the polymeric component (curing). After de-powdering, samples were sintered in a continuous furnace at 1370 °C for 3 h under a fluxed hydrogen atmosphere.

2.3. Dimensions Measurement and Tolerance Evaluation

Both in the green and sintered states, nine green samples for each construction plane were measured by a Coordinate-Measuring Machine (CMM) to reconstruct the features reported in Table 1, Table 2, Table 3, Table 4, Table 5 and Table 6. Additionally, features LX and H4 were measured by a micrometer and height gauge (altimeter) for the whole sample to evaluate the spatial repeatability of the process. A Mitutoyo 293-521-30 micrometer, Mitutoyo Corporation, Kawasaki, Japan (precision of 0.001 mm) and a height gauge Hite Plus M400 Tesa Technology model (precision lower than 0.002 mm) were used.
A Hexagon Tigo SF 05.06.05 CMM machine (Hexagon AB, Stockholm, Sweden) was employed for measurement. It was equipped with a continuous scanning head, providing a maximum permissible error (MPE) of 2.2+L/300 μm according to ISO 10360-5 [36]; a 1 mm diameter tip was used for the 10–20 benchmark samples, whereas a 3 mm diameter tip was used for other benchmarks. The surfaces were inspected in continuous scanning mode. The datum reference frame is defined as follows: The upper plane of the base is selected as the first datum (orientation). The vertical plane parallel to the X–Z plane is chosen for defining the Y-axis orientation (location). Finally, the axis of the bulk cylinder (De2) was used for defining the third datum (block). Following this datum definition, planes and other features were reconstructed using the best-fit least squares method.
The dimensional inaccuracy was evaluated through the measured dimension (LMeas) and the nominal dimension (LNom) using Equation (1):
I n a c c u r a c y   I n d e x = L M e a s L N o m L N o m
The IT grade was evaluated according to the ISO 286-1 [37] and 286-2 [38] standards. The standard tolerance unit (nj) was calculated for each dimension replica using Equation (2), following the procedure reported in [24,30]:
n j = 1000 L M e a s L N o m i
where i is the standard tolerance factor defined by Equation (3):
i = 0.45 D 3 + 0.001 D
where D corresponds to the geometric mean of the upper (Lupper) and lower (Llower) limits of the dimension interval in which the measured dimensions lie.
Table 8 reports the dimensional interval according to [24,30] and the relative i standard tolerance factor computed using Equation (3).
The maximum dimensional error is determined by the 95th percentile of the distribution of n values. This value is used to determine the IT via the classification of IT grades according to ISO 286-1 [37], as reported in Table 9.

2.4. Density Measurement and Microstructural Analysis

In the green state, density (ρg) was estimated by the geometrical method due to the complexity of the sample shape. The sample volume of the three-benchmark size was derived from the CAD model; then, the density was calculated as the ratio of the weight to the volume. Six samples for each building plane were measured.
The density in the sintered state (ρs) was measured by the Archimedes method while employing a KERN ALJ 314-4A balance (Kern & Sohn GmbH, Balingen, Germany). The relative density was calculated assuming theoretical densities (ρth) of 7.95 g/cm3 and 7.8 g/cm3 for 316L and 17-4PH, respectively. Finally, the densification parameter (Γ) was computed by Equation (4):
Γ = ρ s ρ g ρ t h ρ g
Sintered samples were cut in the X–Z plane to highlight the porosity and microstructure. After polishing, panoramic photos were taken by an Olympus DSX1000 microscope (Olympus Corporation, Tokyo, Japan) to evaluate the porosity distribution in the entire sample surface. Subsequently, polished surface was etched by aqua regia. Pictures were acquired at a higher magnification by a Zeiss axiophot microscope (Zeiss AG, Oberkochen, Germany) equipped with a Leica DFC295 camera to quantify the microstructural phases and constituents.

3. Results and Discussion

3.1. Accuracy and Spatial Repeatability—Green State

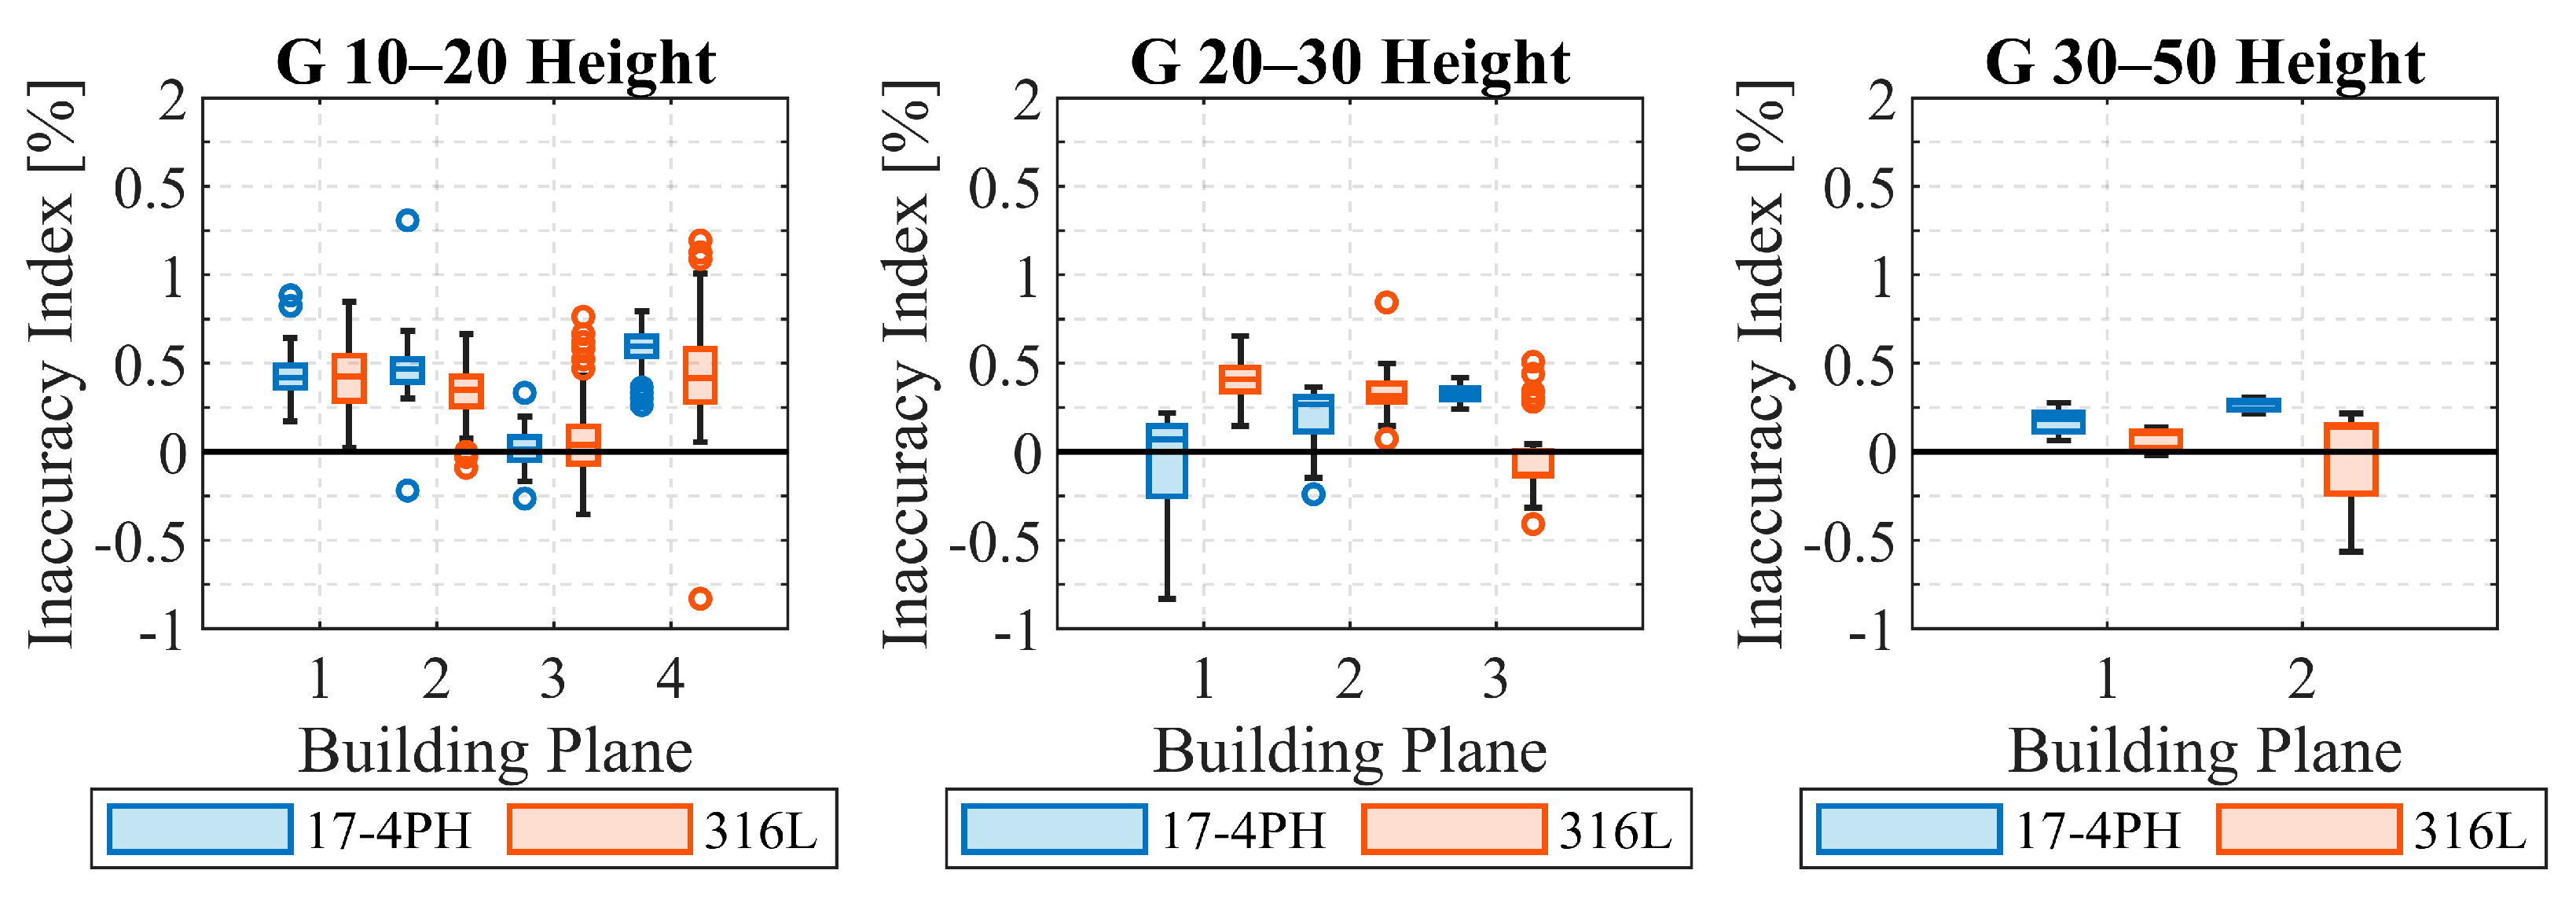
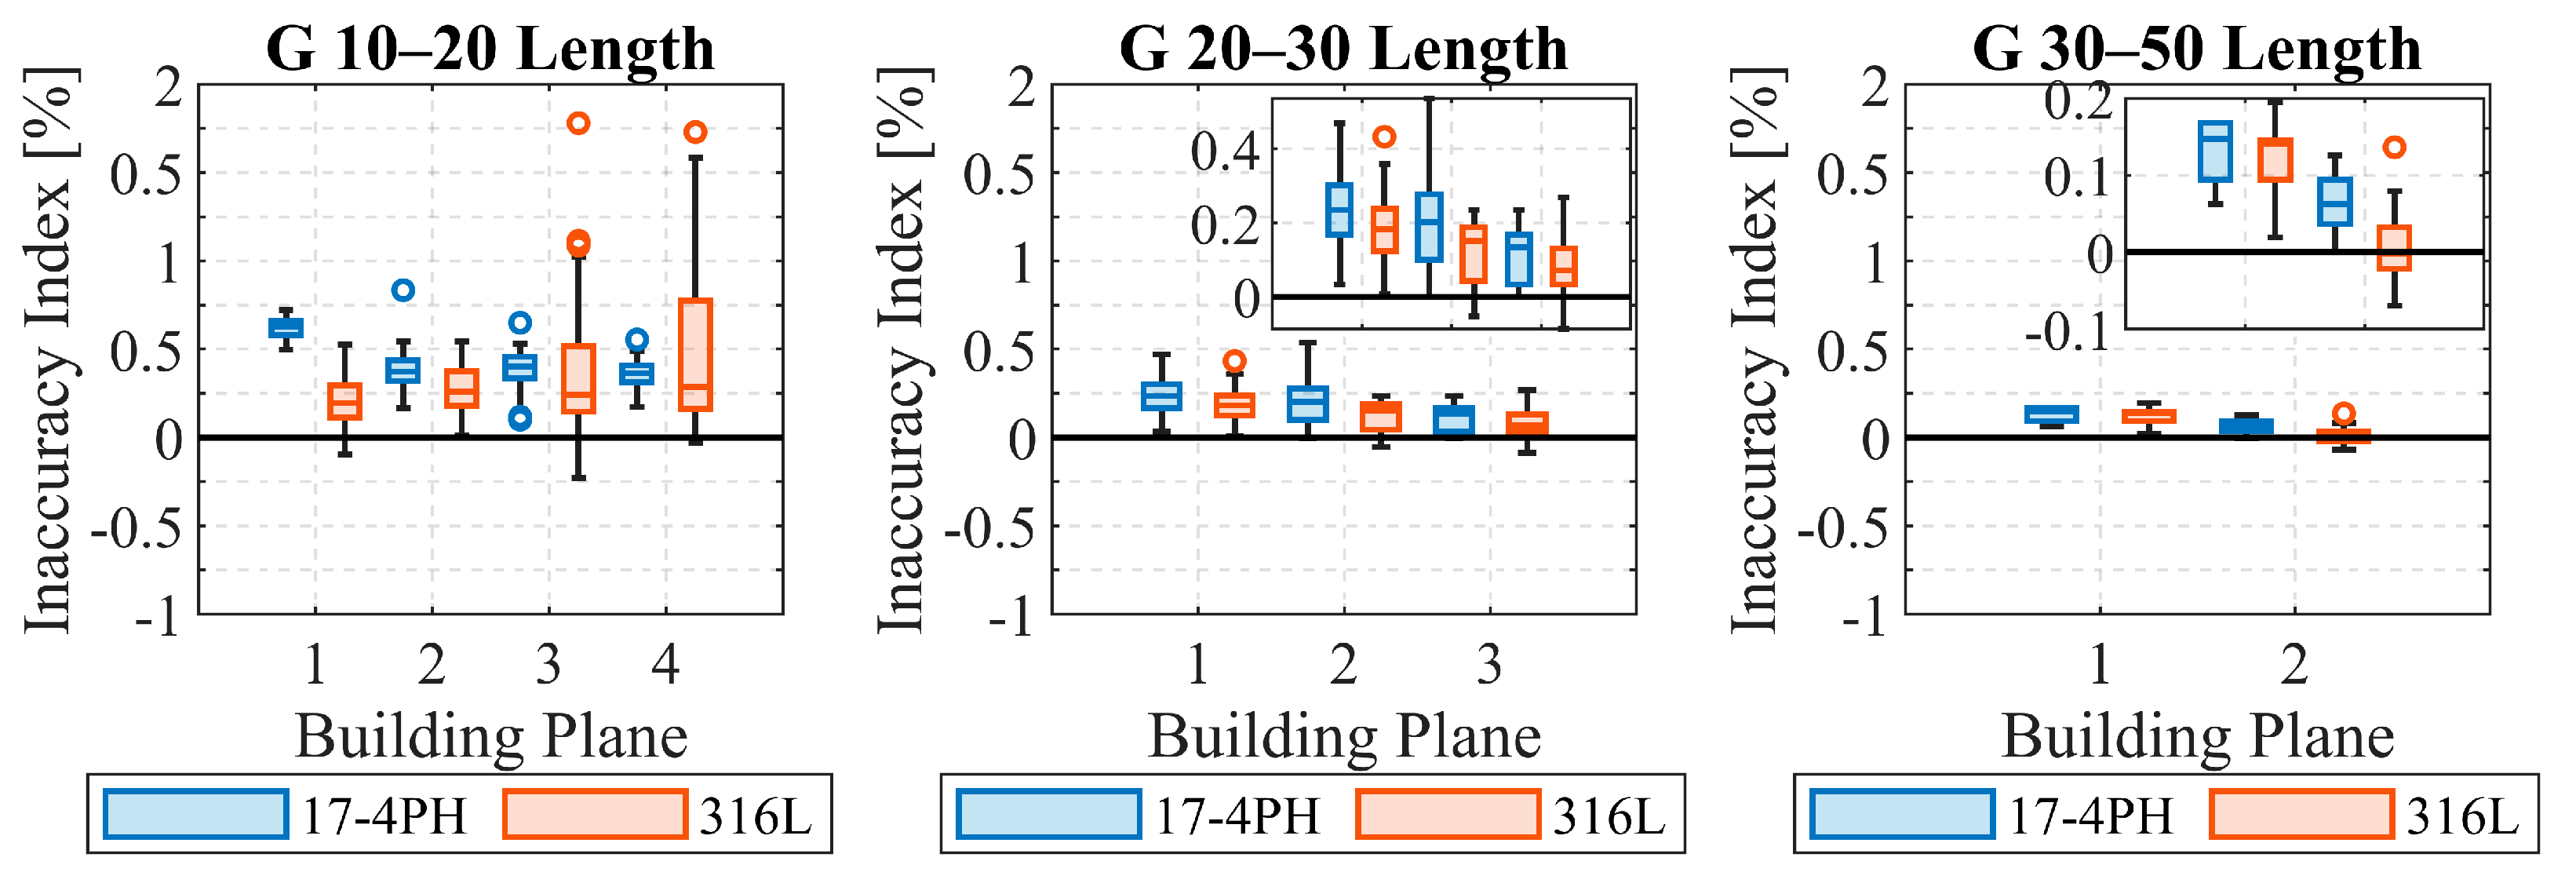
Considering the features defining the boundary of the artifacts, Figure 3 and Figure 4 show the inaccuracy indices of the height (H4) and length (LX) dimensions, respectively. The figures compare the results obtained for 17-4PH and 316L. Data is displayed using box plots that distinguish the building plane, which refers to the printing distance of the sample with respect to the building platform, as shown in Figure 2. The rectangular box indicates the 25th and 75th percentiles, and the line inside the box represents the median of the data. The line connects the maximum and minimum values considered, while the circle dots represent the values differing by more than 1.5 times the interquartile range from the top or bottom of the box.
Generally, the inaccuracy index decreases with increasing feature size. This trend is recognized in both materials. The median is always positive, indicating a positive deviation of measurements from the nominal size, consistent with other works, reporting bigger dimensions than expected ones [3,39,40]. The origin of larger dimensions is not clarified in the literature. The results can be attributed to the binder–powder interaction, maybe due to an excess of binder saturation. It is well known that excess binder saturation results in the extra bonding of powders, leading to larger dimensions and poorer surface finishing [20,41,42,43]. This assumption is supported by the decrease in the inaccuracy index with larger feature sizes, suggesting that the dimensional error is likely a constant value independent of size, and its influence is greater on small dimensions than on large ones. Comparing Figure 3 and Figure 4, the length has a lower inaccuracy index than the height. This was attributed to the different resolutions along the building direction (Z) and in the plane (X–Y). The resolution along Z is defined by the layer thickness of 42 μm, while the resolution in the X–Y plane was set to 1200 dpi, which approximately corresponds to 21 μm/pixel.
In most cases, the inaccuracy index is significantly affected by the building plane, showing a non-constant spatial repeatability, but no clear trend was recognized. In 316L, the accuracy increased moving from the first building plane (close to the building platform) to the last one. In 17-4PH, the inaccuracy index of the length also decreased, while the inaccuracy of the height increased when moving from the first plane to the last printed plane. Both benchmark 10–20 samples fabricated by 17-4PH and 316L showed an anomaly at plane 3 for the height dimension. It is supposed that one layer was not printed due to the position of the samples, or due to the sectioning performed by the software. Failing to print a layer could produce an inaccuracy error of about 0.3%, which aligns with the difference found compared with other planes. Disregarding this particular case, the increasing accuracy from the first to last plane was also observed by Dorula et al. in CoCrMo powders, and it was attributed to the gravitational force and the compaction force applied by the roller [40]. Another possible explanation for the increasing accuracy with building planes is related to non-homogeneous drying and curing. After printing, the building box is moved into a furnace to dry the aqueous content and to crosslink the polymeric component of the binder mixture. The evaporation of aqueous content can produce a slight shrinkage in parts due to powder rearrangement. Charnnarong reported a shrinkage of 0.5% in linear dimensions after a heat treatment at 900 °C for ceramic powders printed by BJ, with half of the shrinkage occurring during the binder drying [44]. Similarly, Crane measured an increasing mass with the increase in binder saturation, following a linear trend [41]. Cheny et al. verified a positive deviation from nominal dimensions and also observed that dimensional deviation decreases with the increase in drying [45]. The evaporation might not be uniform across the building box. Intuitively, the binder placed in the upper section of the building box is largely exposed to furnace atmosphere, leading to faster and more complete moisture evaporation. In contrast, the moisture in the bottom levels needs a longer path to reach the furnace atmosphere. Lower drying means lower shrinkage and higher measured dimensions, as actually observed. The accuracy gradient is more evident in intermediate and large benchmarks, supporting this hypothesis. The different behavior in benchmark 10–20 is attributed to the influence of other phenomena, such as gravitational force, which can also affect the deviation of data from nominal values. Future studies will simulate the drying and curing process to verify the influence of the building position and moisture diffusion.

3.2. IT Tolerance Grades—Green State

Table 10 and Table 11 report the IT tolerance grades calculated for the height (H4) and length (LX), respectively, for the two materials and the three benchmark sizes.
Generally, the obtained results are consistent with other studies [27,30]. The IT grades vary between IT08 and IT13, with median values IT10/IT11. The precision is slightly higher for 17-4PH than for 316L. Optimization studies might be required to tune the printing parameters, aiming at maximizing the dimensional accuracy and precision, and other properties, such as the green density and mechanical properties. For instance, Modi and Sahu reduced the IT grades from IT9 to IT7 by optimizing the scaling factor [30].
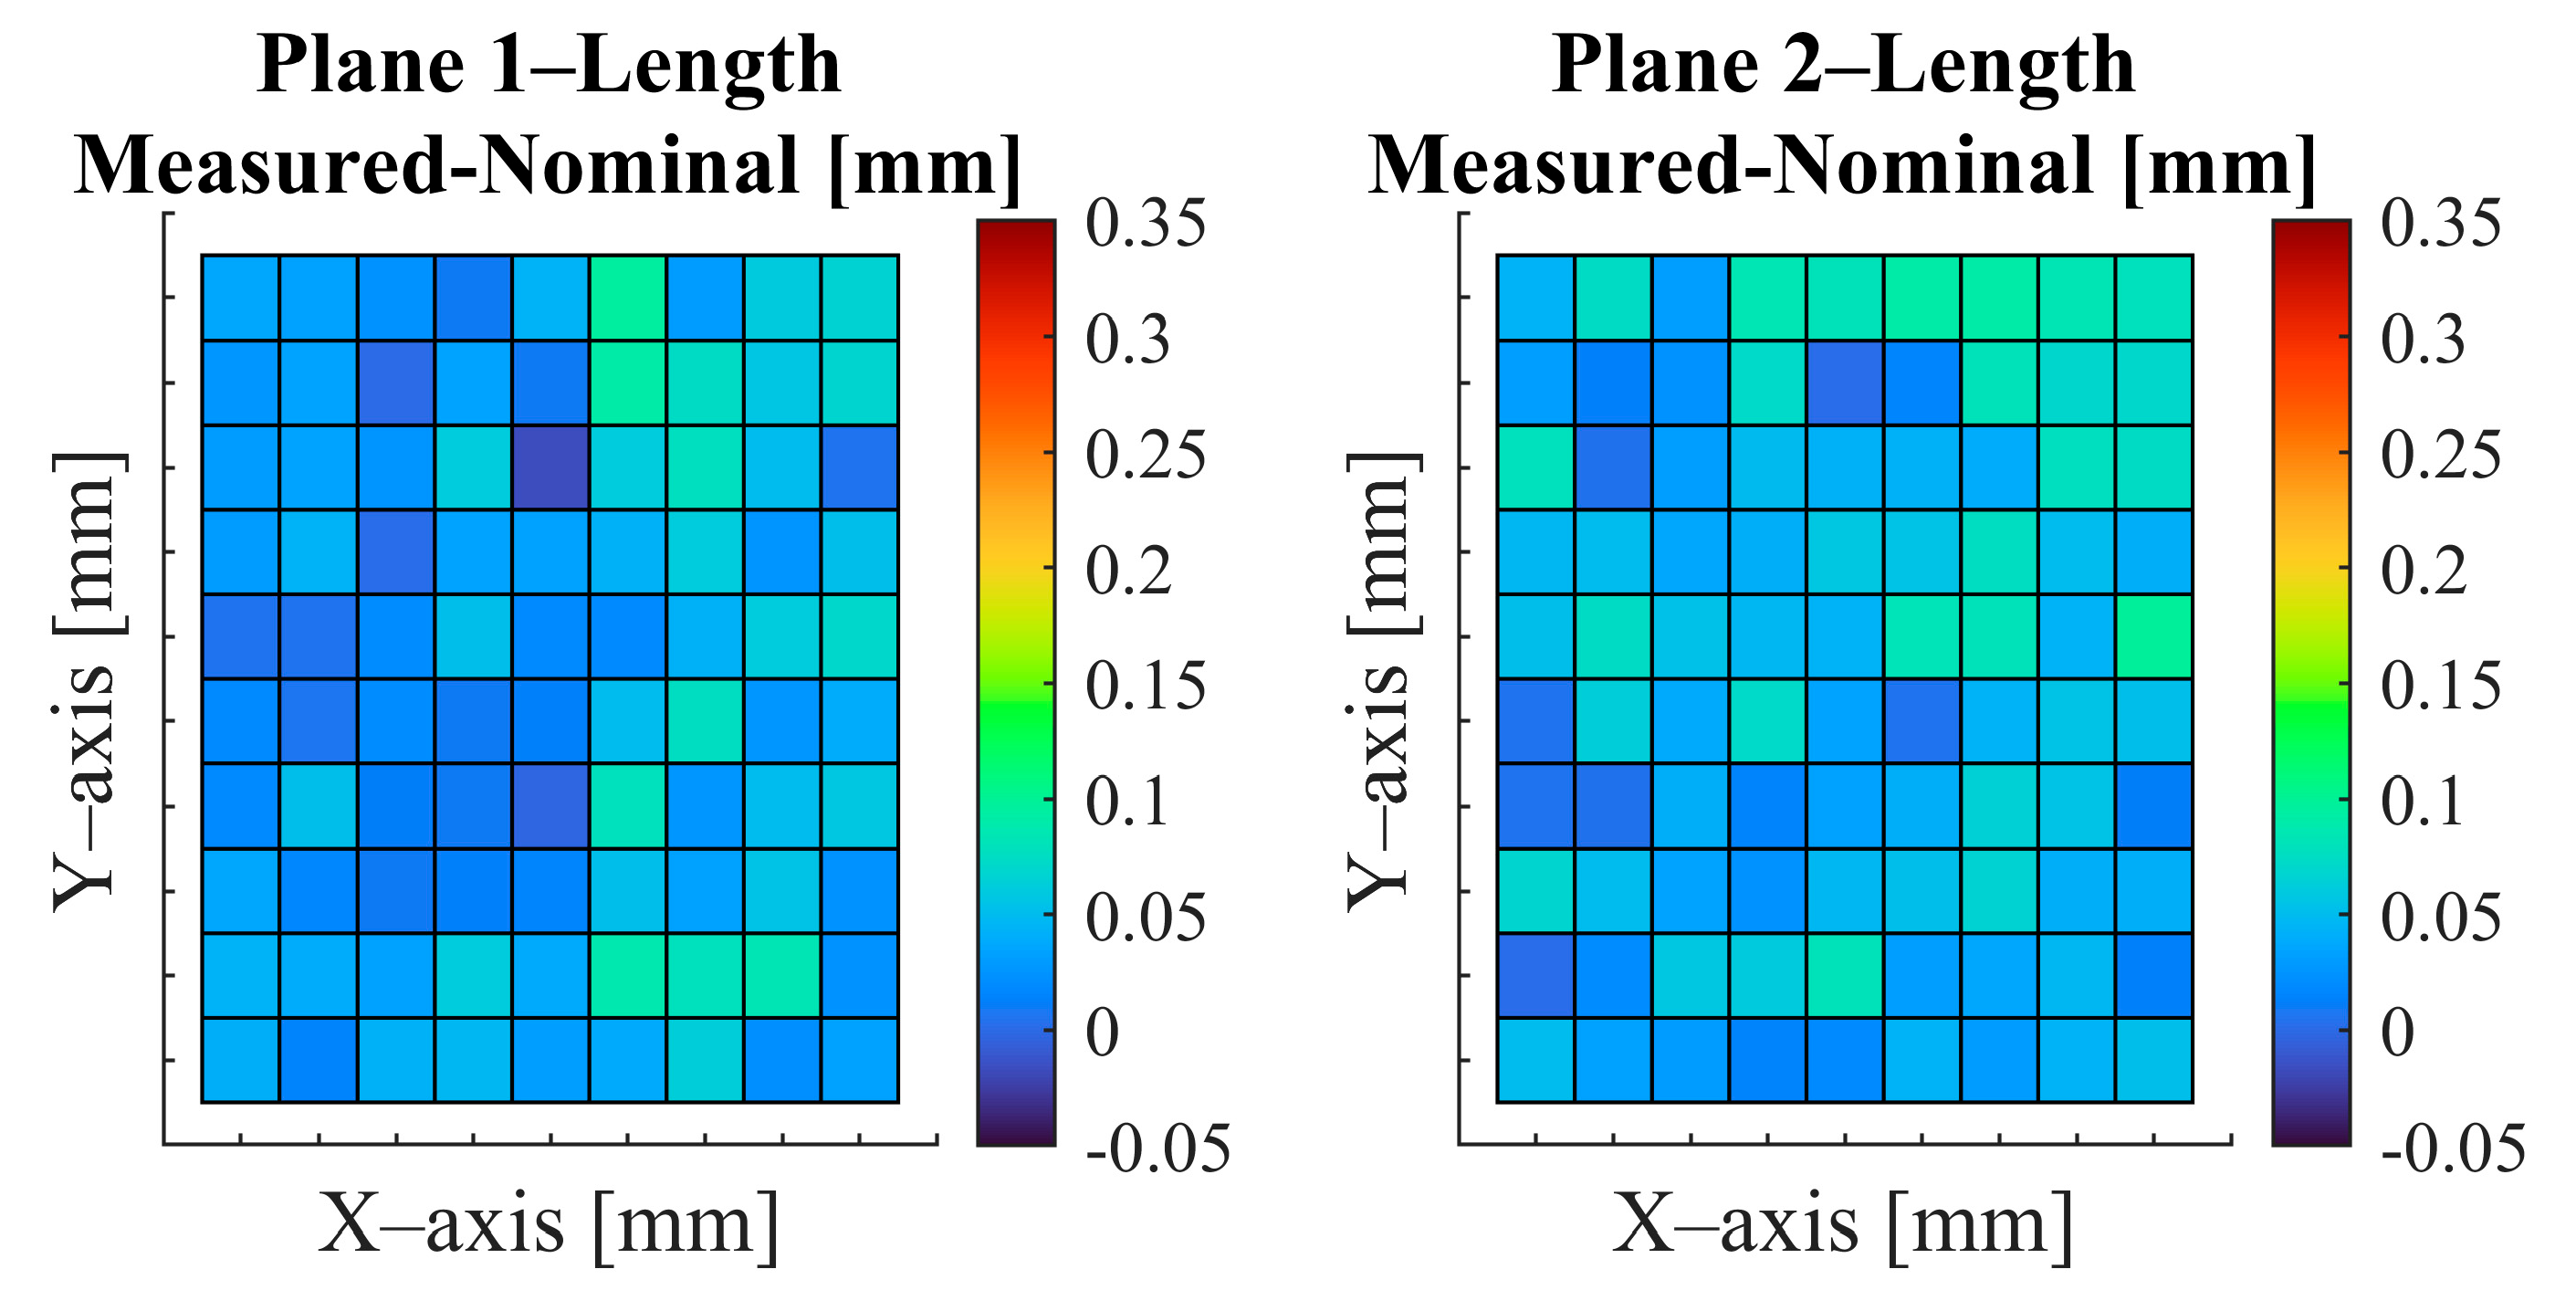
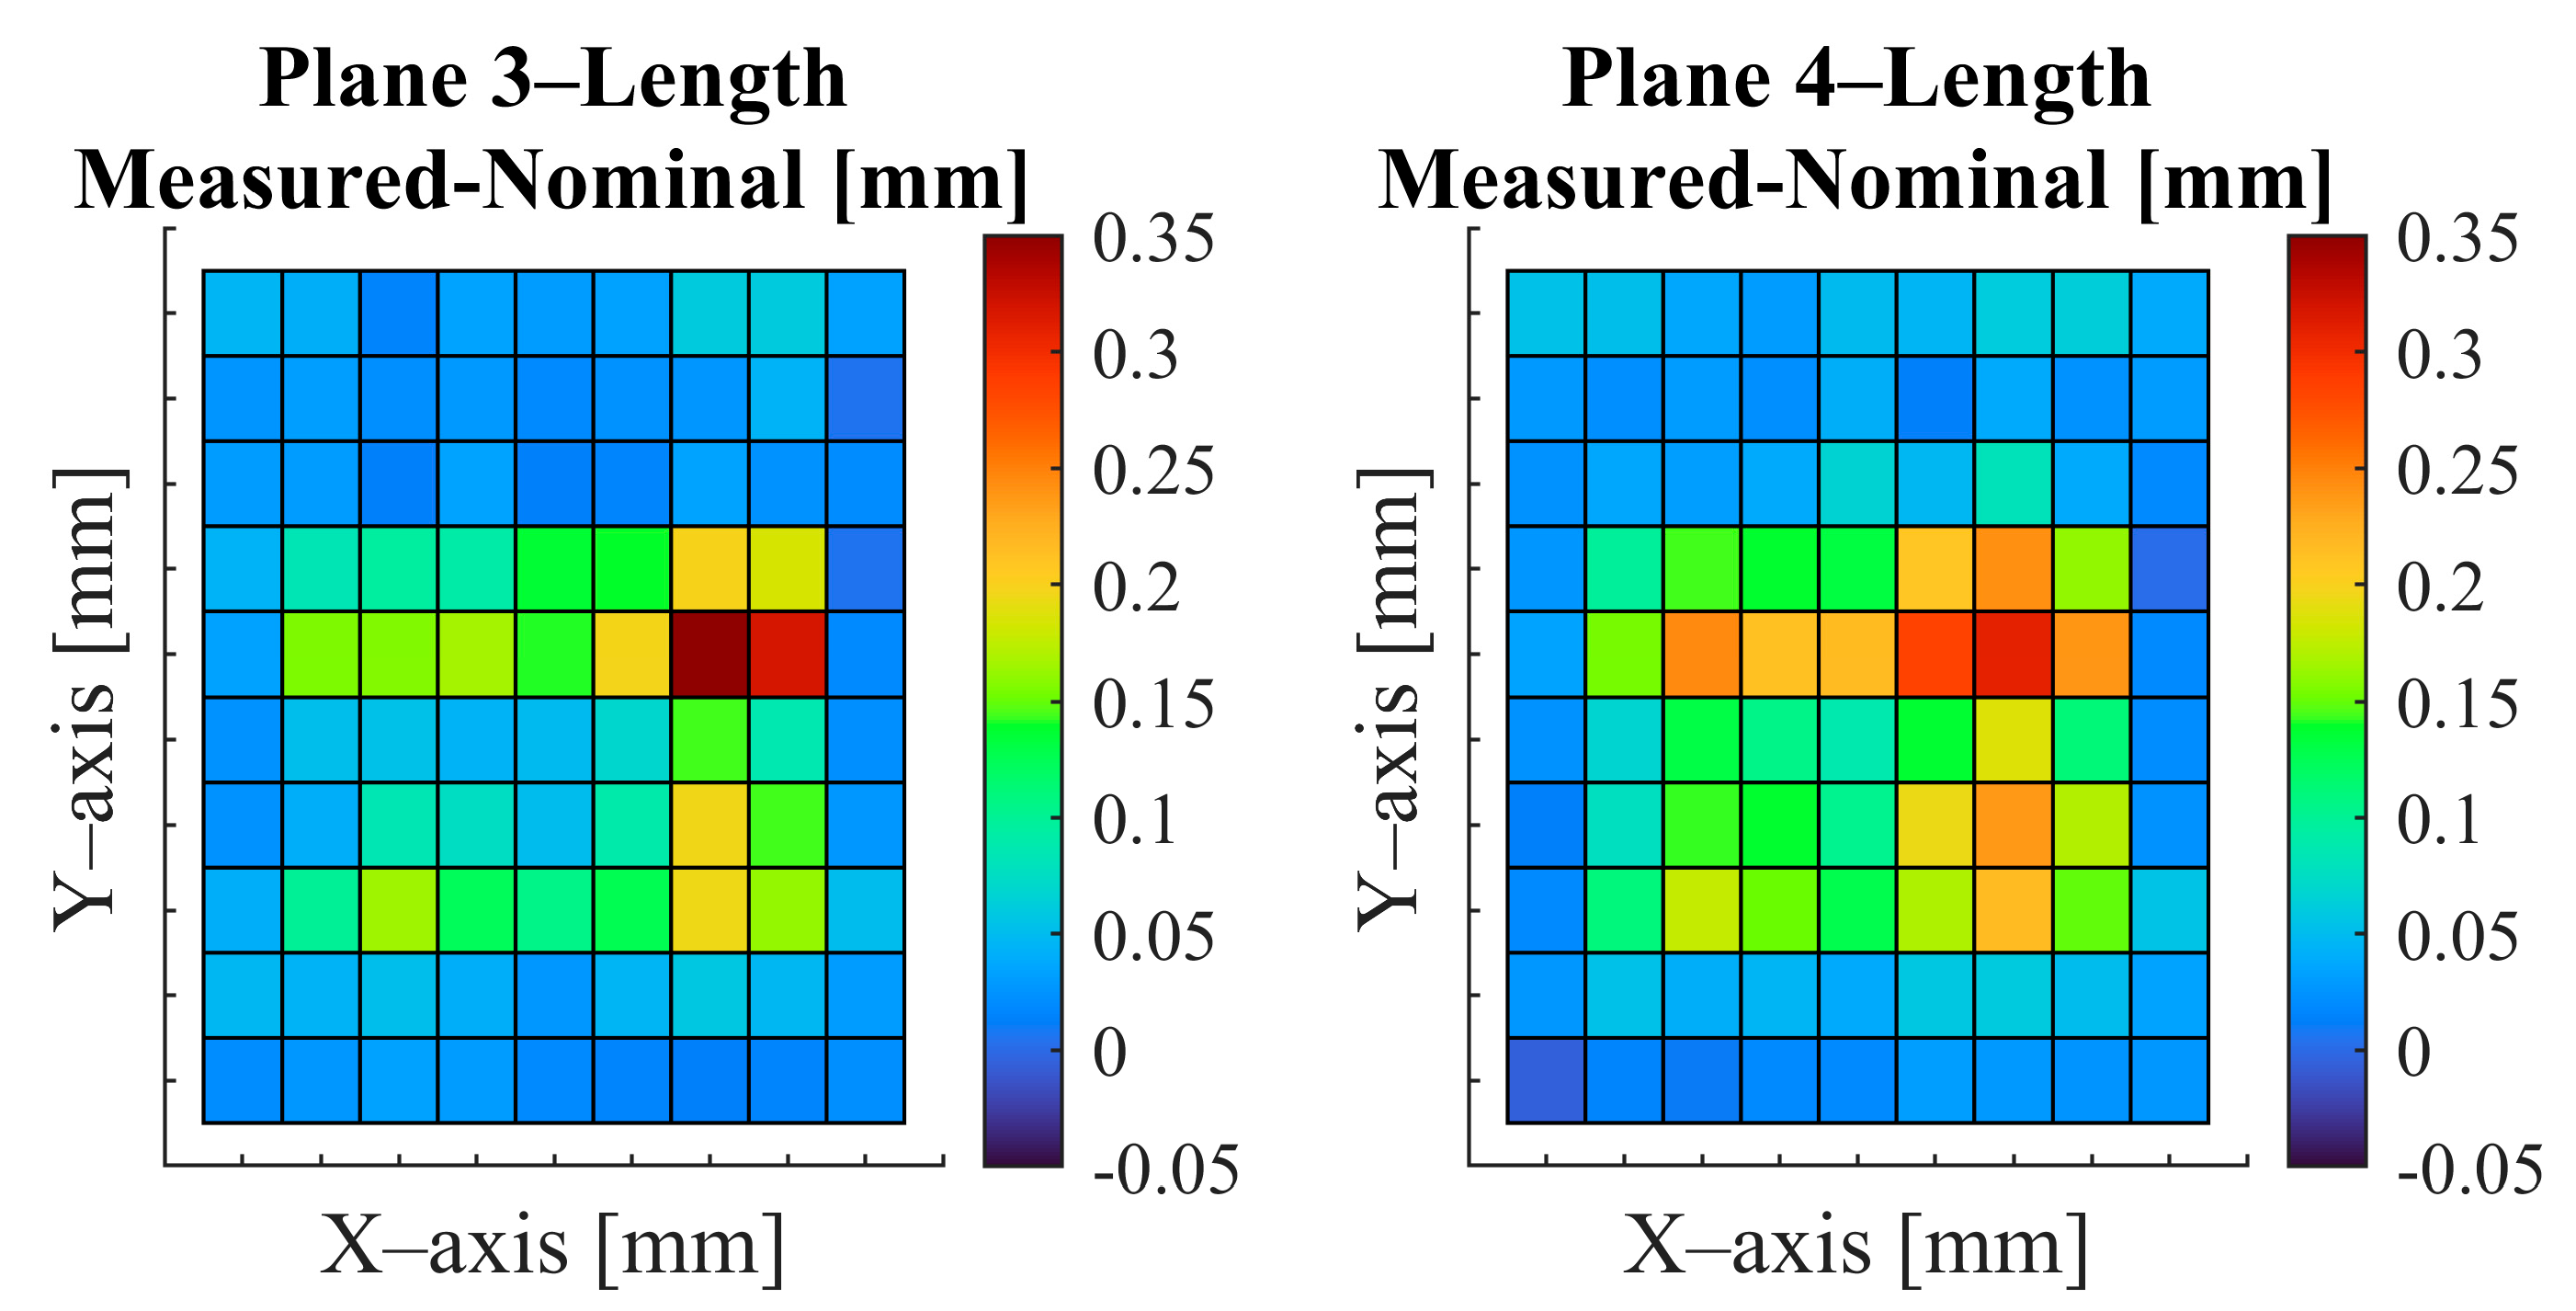
The heights are slightly more precise than the length dimensions, confirming that the quality of the green product is mostly affected by the powder–binder interaction. Considering the length, the precision seems to increase with the product size, while no clear trend is recognized for height. As observed for the accuracy, the most critical aspect is the non-homogeneous spatial repeatability as a function of the building plane. Figure 5 shows an example of the deviation of the length dimension from the nominal size in the 10–20 benchmark (green state, 316L); each square represents the deviation of a single sample according to its position in the building box.
Repeatability is ensured in planes 1 and 2, whereas dimensions significantly deviate from nominal values in building planes 3 and 4. In these planes, the deviation is largely scattered in the central positions. The literature reports some examples of density and dimensional variation. Several authors reported inhomogeneity in green density depending on the X–Y position in the building plane [12,40,46,47,48]. This variation causes a scattering of dimensional variation and limits dimensional precision in sintered parts [12,48]. Lee et al. used discrete element modeling (DEM) to simulate the influence of powder spreading on the resulting packing density and particle segregation, demonstrating that a non-uniform initial packing density can lead to distortion during sintering [49,50]. Other authors attributed the inhomogeneous green density to variations in the binder saturation [12,48].
In this study, the authors supposed that the deviations in measurements were caused by an excess of binder injected in the central region. It is assumed that overheating occurred on the printhead, causing excess binder deposition. The effect is concentrated in the central part of the X–Y plane, as this is the position between the stop and go during the printhead printing movement.
In conclusion, the results highlight the significant contribution of the printing process to the loss of dimensional accuracy and precision of BJ products. Future research should be directed towards optimizing the printing process to ensure a higher product accuracy and precision in the final product.

3.3. IT Tolerance Grades—Sintered State

Table 12 and Table 13 show the IT grades in the sintered state for height (H4) and length (LX), respectively, for the two materials and the three benchmark sizes.
Generally, the sintering process caused a worsening of the dimensional precision. The IT grades increased by 2–3 IT intervals compared with the green state, with peaks of 5 and 6 IT grades. The decrease in the precision during sintering is expected and has been reported for other powder metallurgy processes [51]. In BJ, the scatter of sintered dimensions can be attributed to both printing and sintering. For example, a variation in green density results in different dimensional changes during sintering. Some authors reported that dimensional change during sintering increases as the green density decreases [52]. Stevens et al. experimentally verified the density variation as a function of sample shape [53]. Sadeghi et al. numerically modeled, using FEM, the shape deformation and distortion induced by an inhomogeneous green density [14]. Therefore, green density inhomogeneity would cause a broadening of the normal distribution of sintered dimensions. Additionally, residual carbon content due to incomplete de-binding can lead to different sintering mechanisms and, consequently, different amounts of densification [54,55]. During sintering, BJ samples can also encounter distortion due to external factors such as gravity and frictional forces with sintering trays [12,48].
Table 14 compares the IT grades reported in the literature for BJ and other additive manufacturing techniques.
The results achieved in this work are in line with other investigations on BJ. According to the literature, L-PBF and EBM can achieve slightly higher precision than BJ, while DED presents a lower performance. Generally, in additive manufacturing, the precision is lower than in other powder technologies, such as metal injection molding. German reported a standard deviation of 0.1% in linear dimensions, which can be decreased to 0.05% in large and complex parts [58]. The European Powder Metallurgy Association reported tolerance ranges as a function of the dimension range, process capability level (Cpk), and process condition (standard and best practices). Table 15 summarizes these according to the standard condition [59].

3.4. Accuracy and Spatial Repeatability—Sintered State

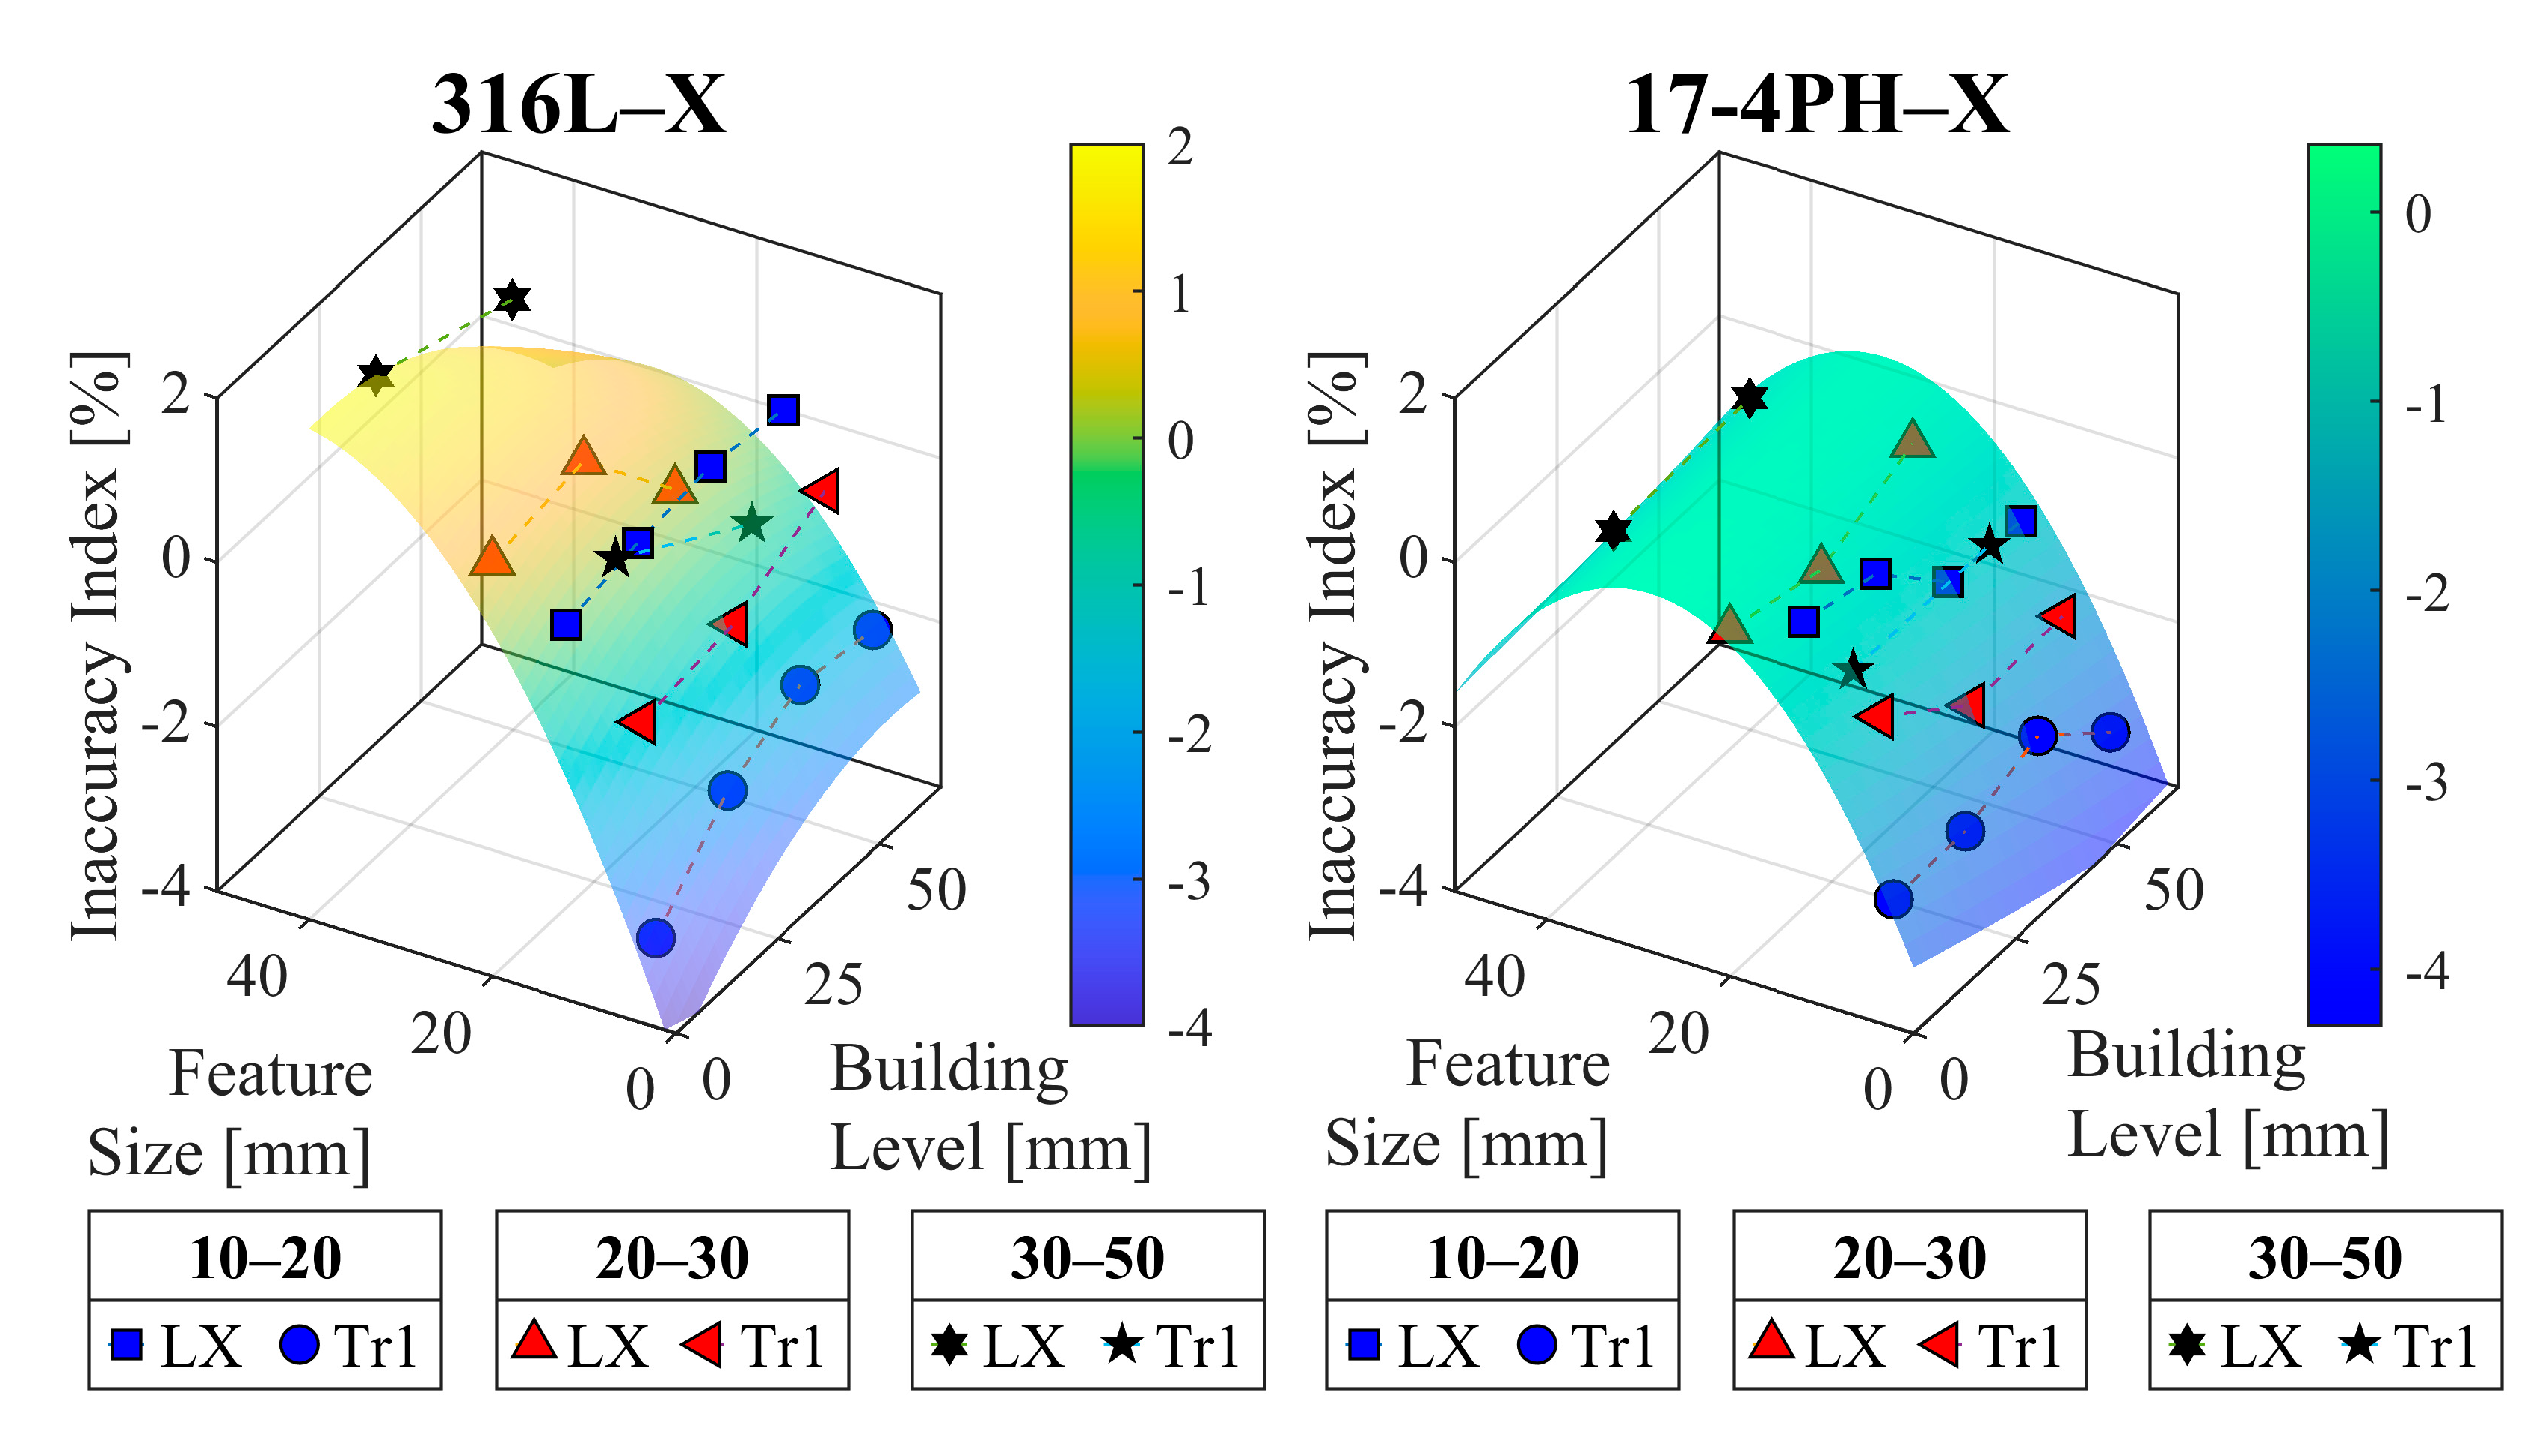
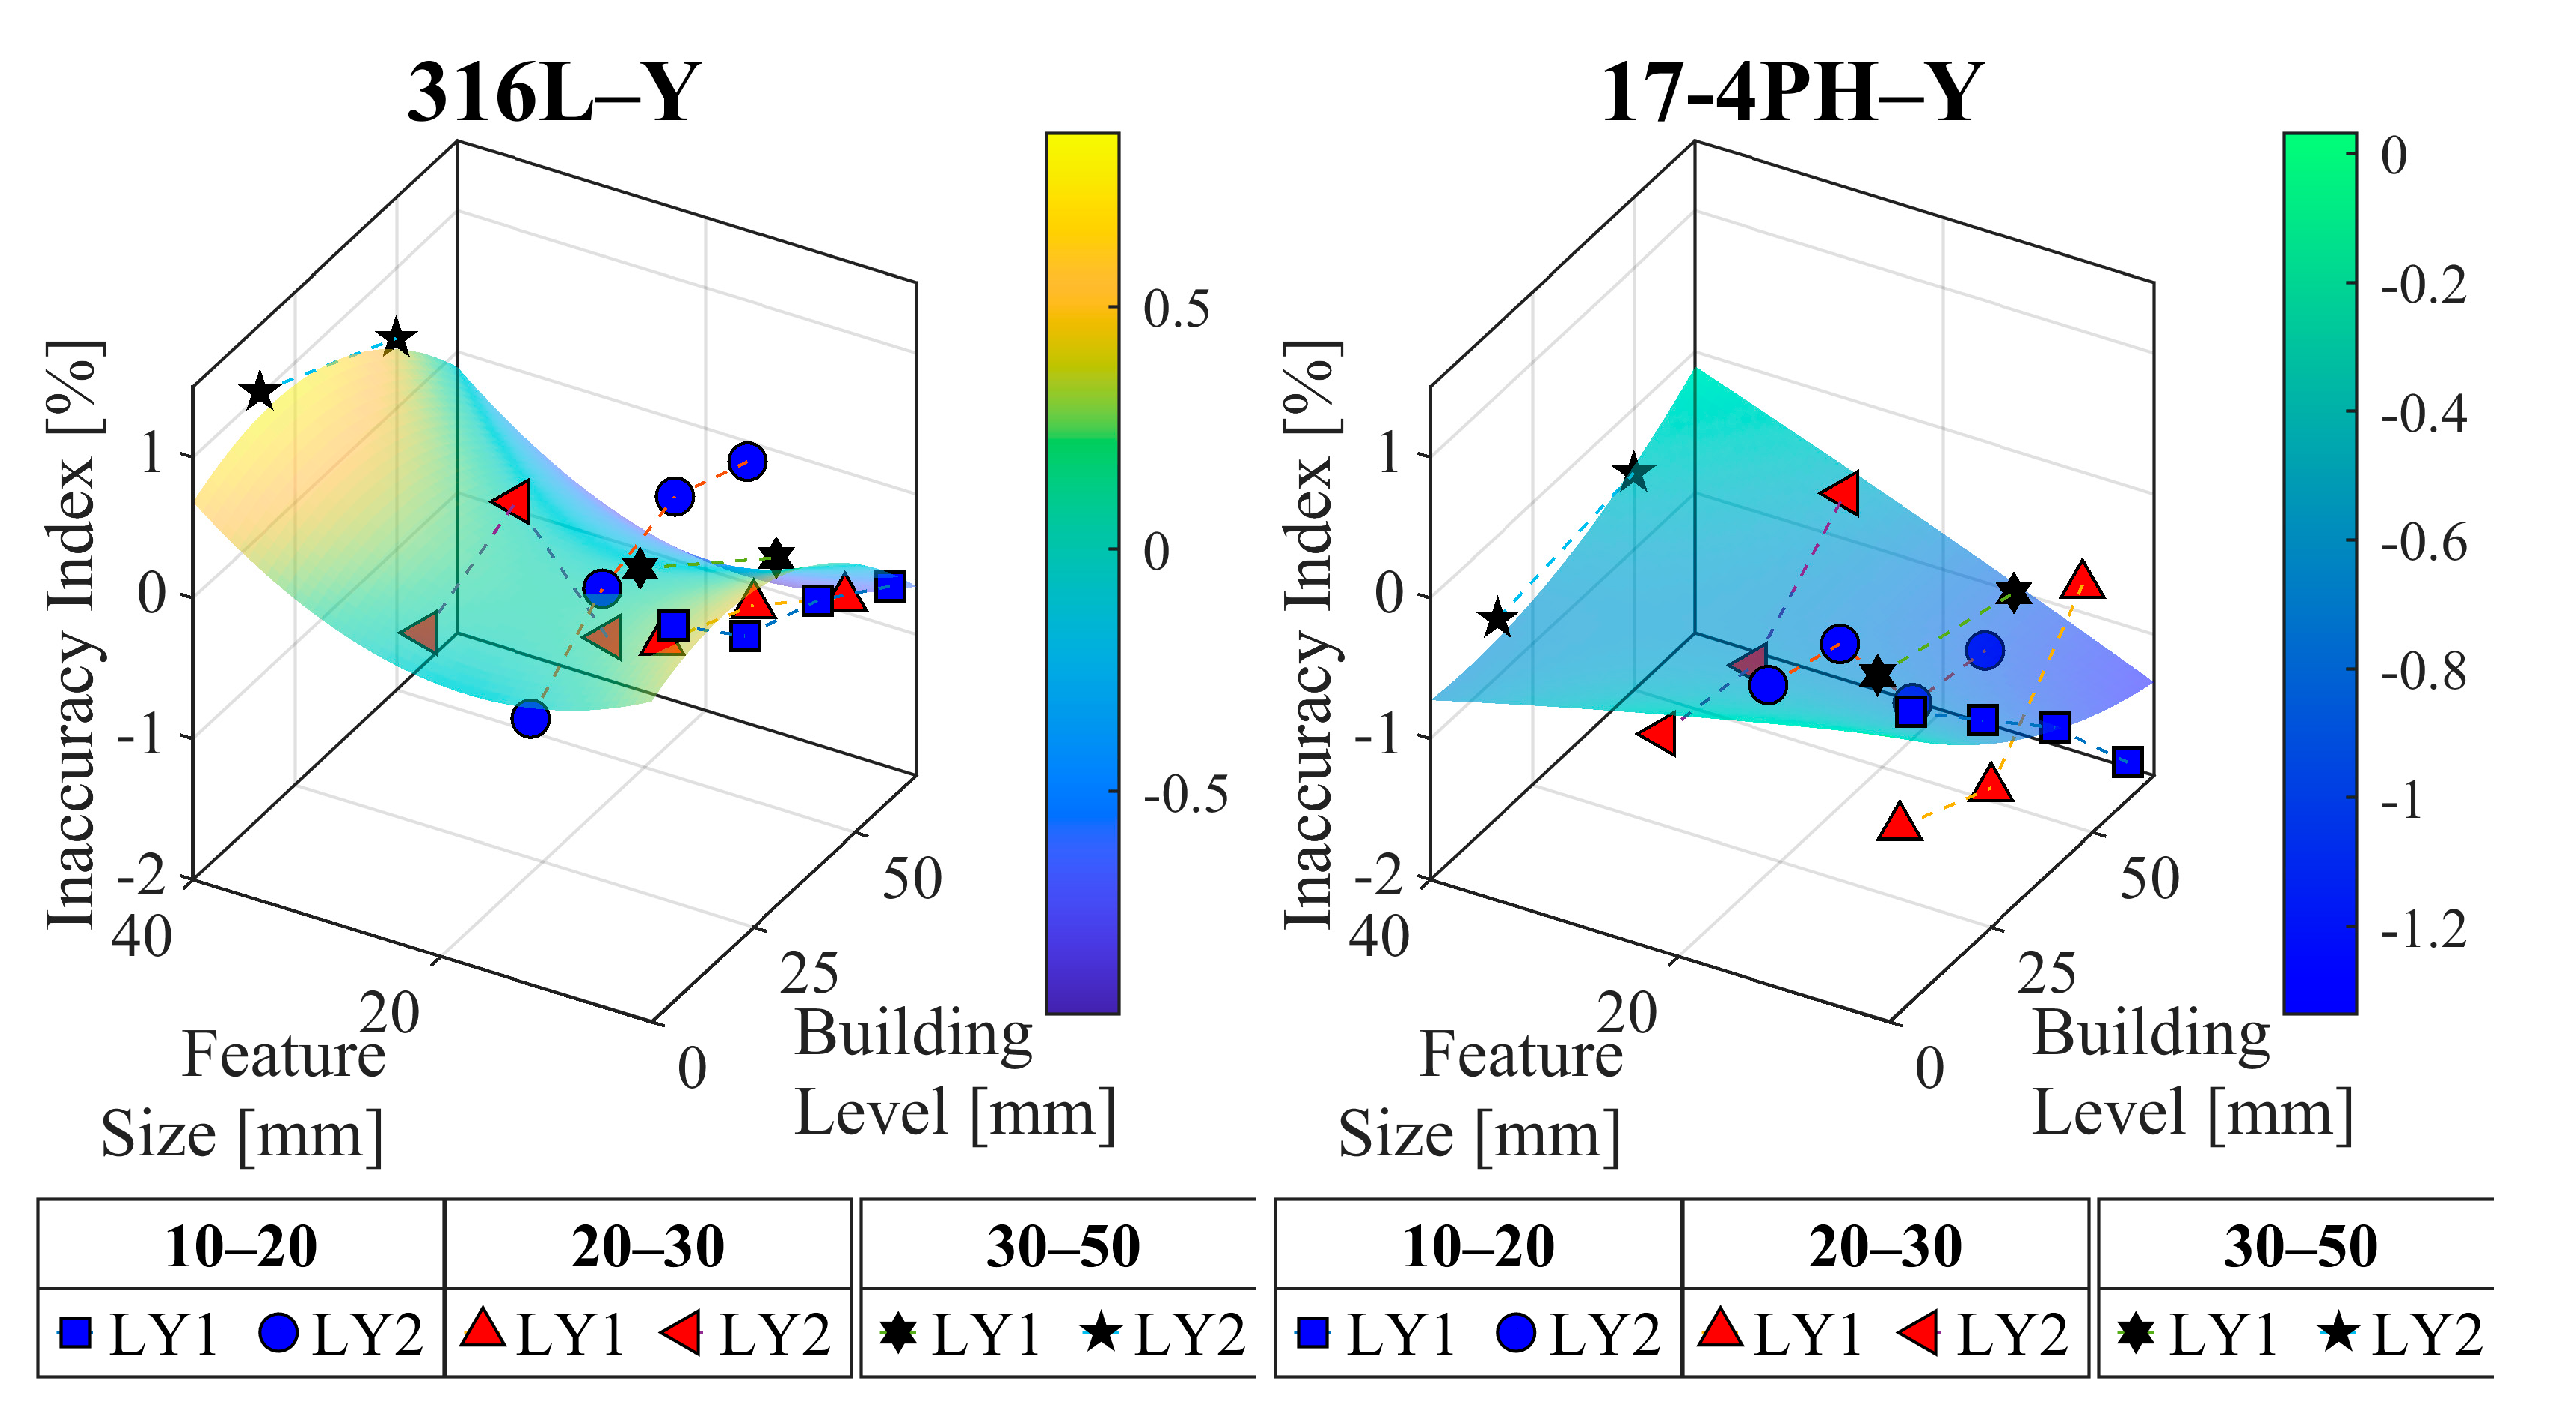
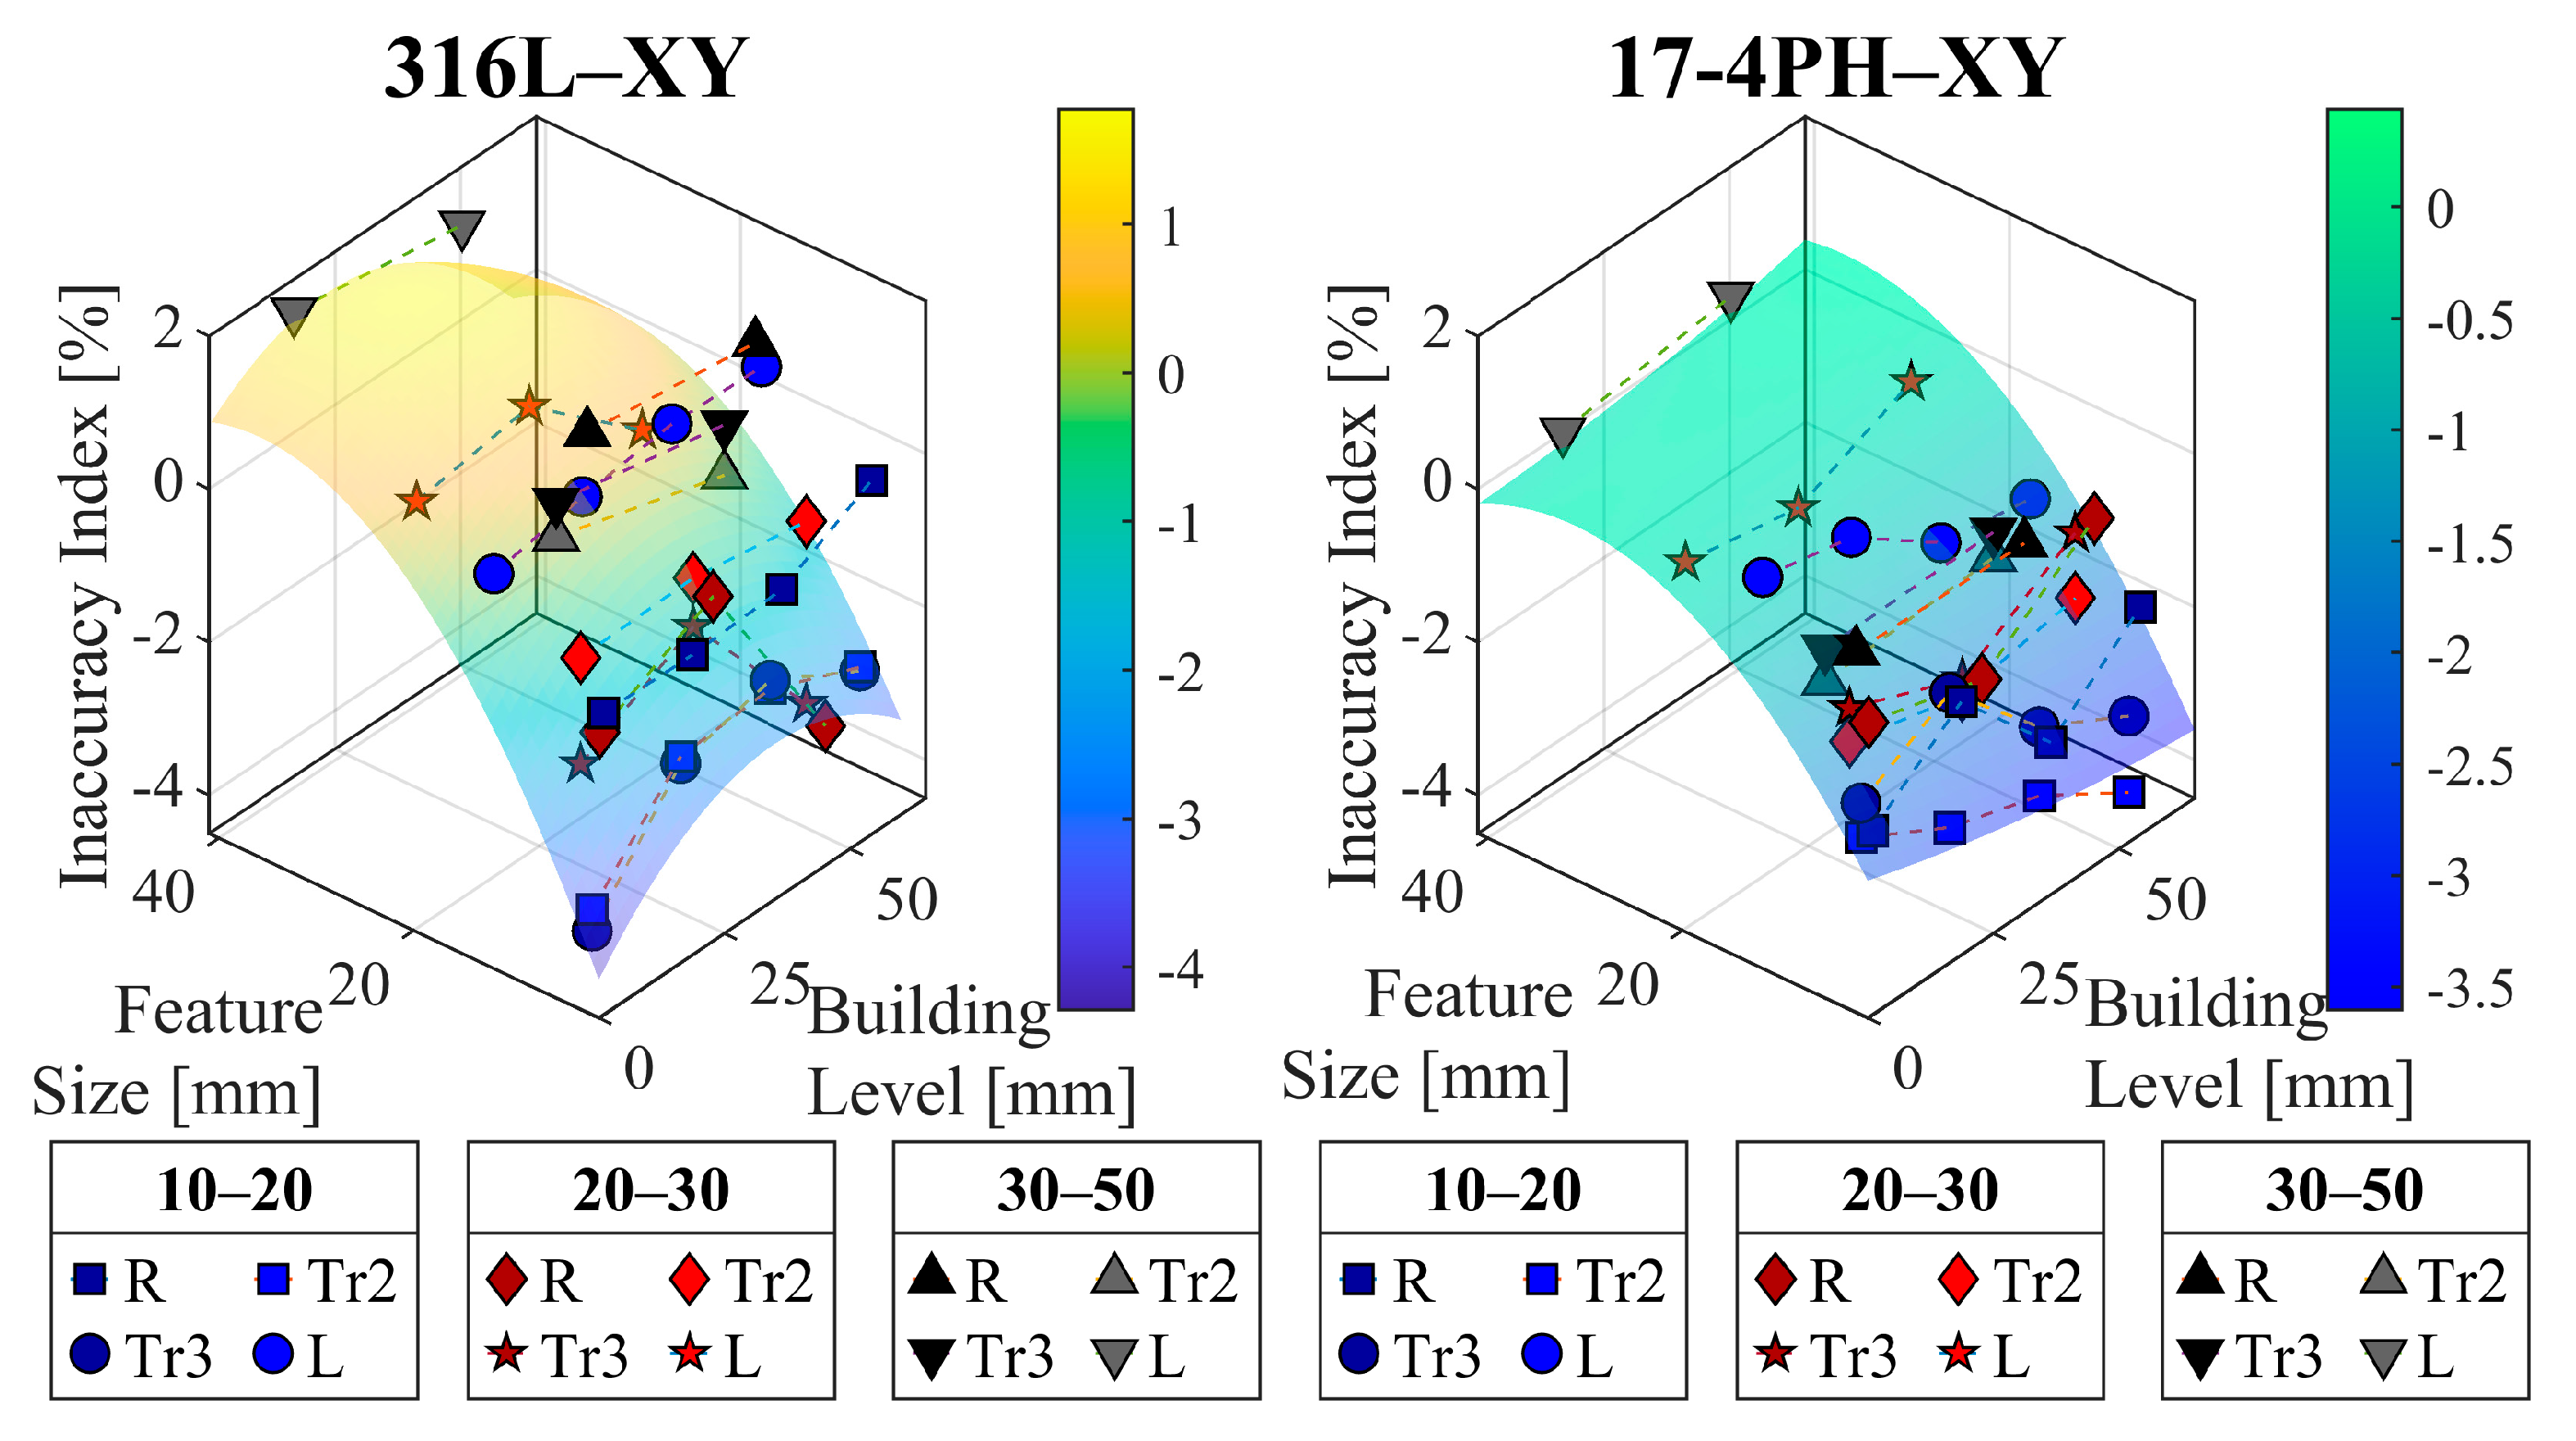
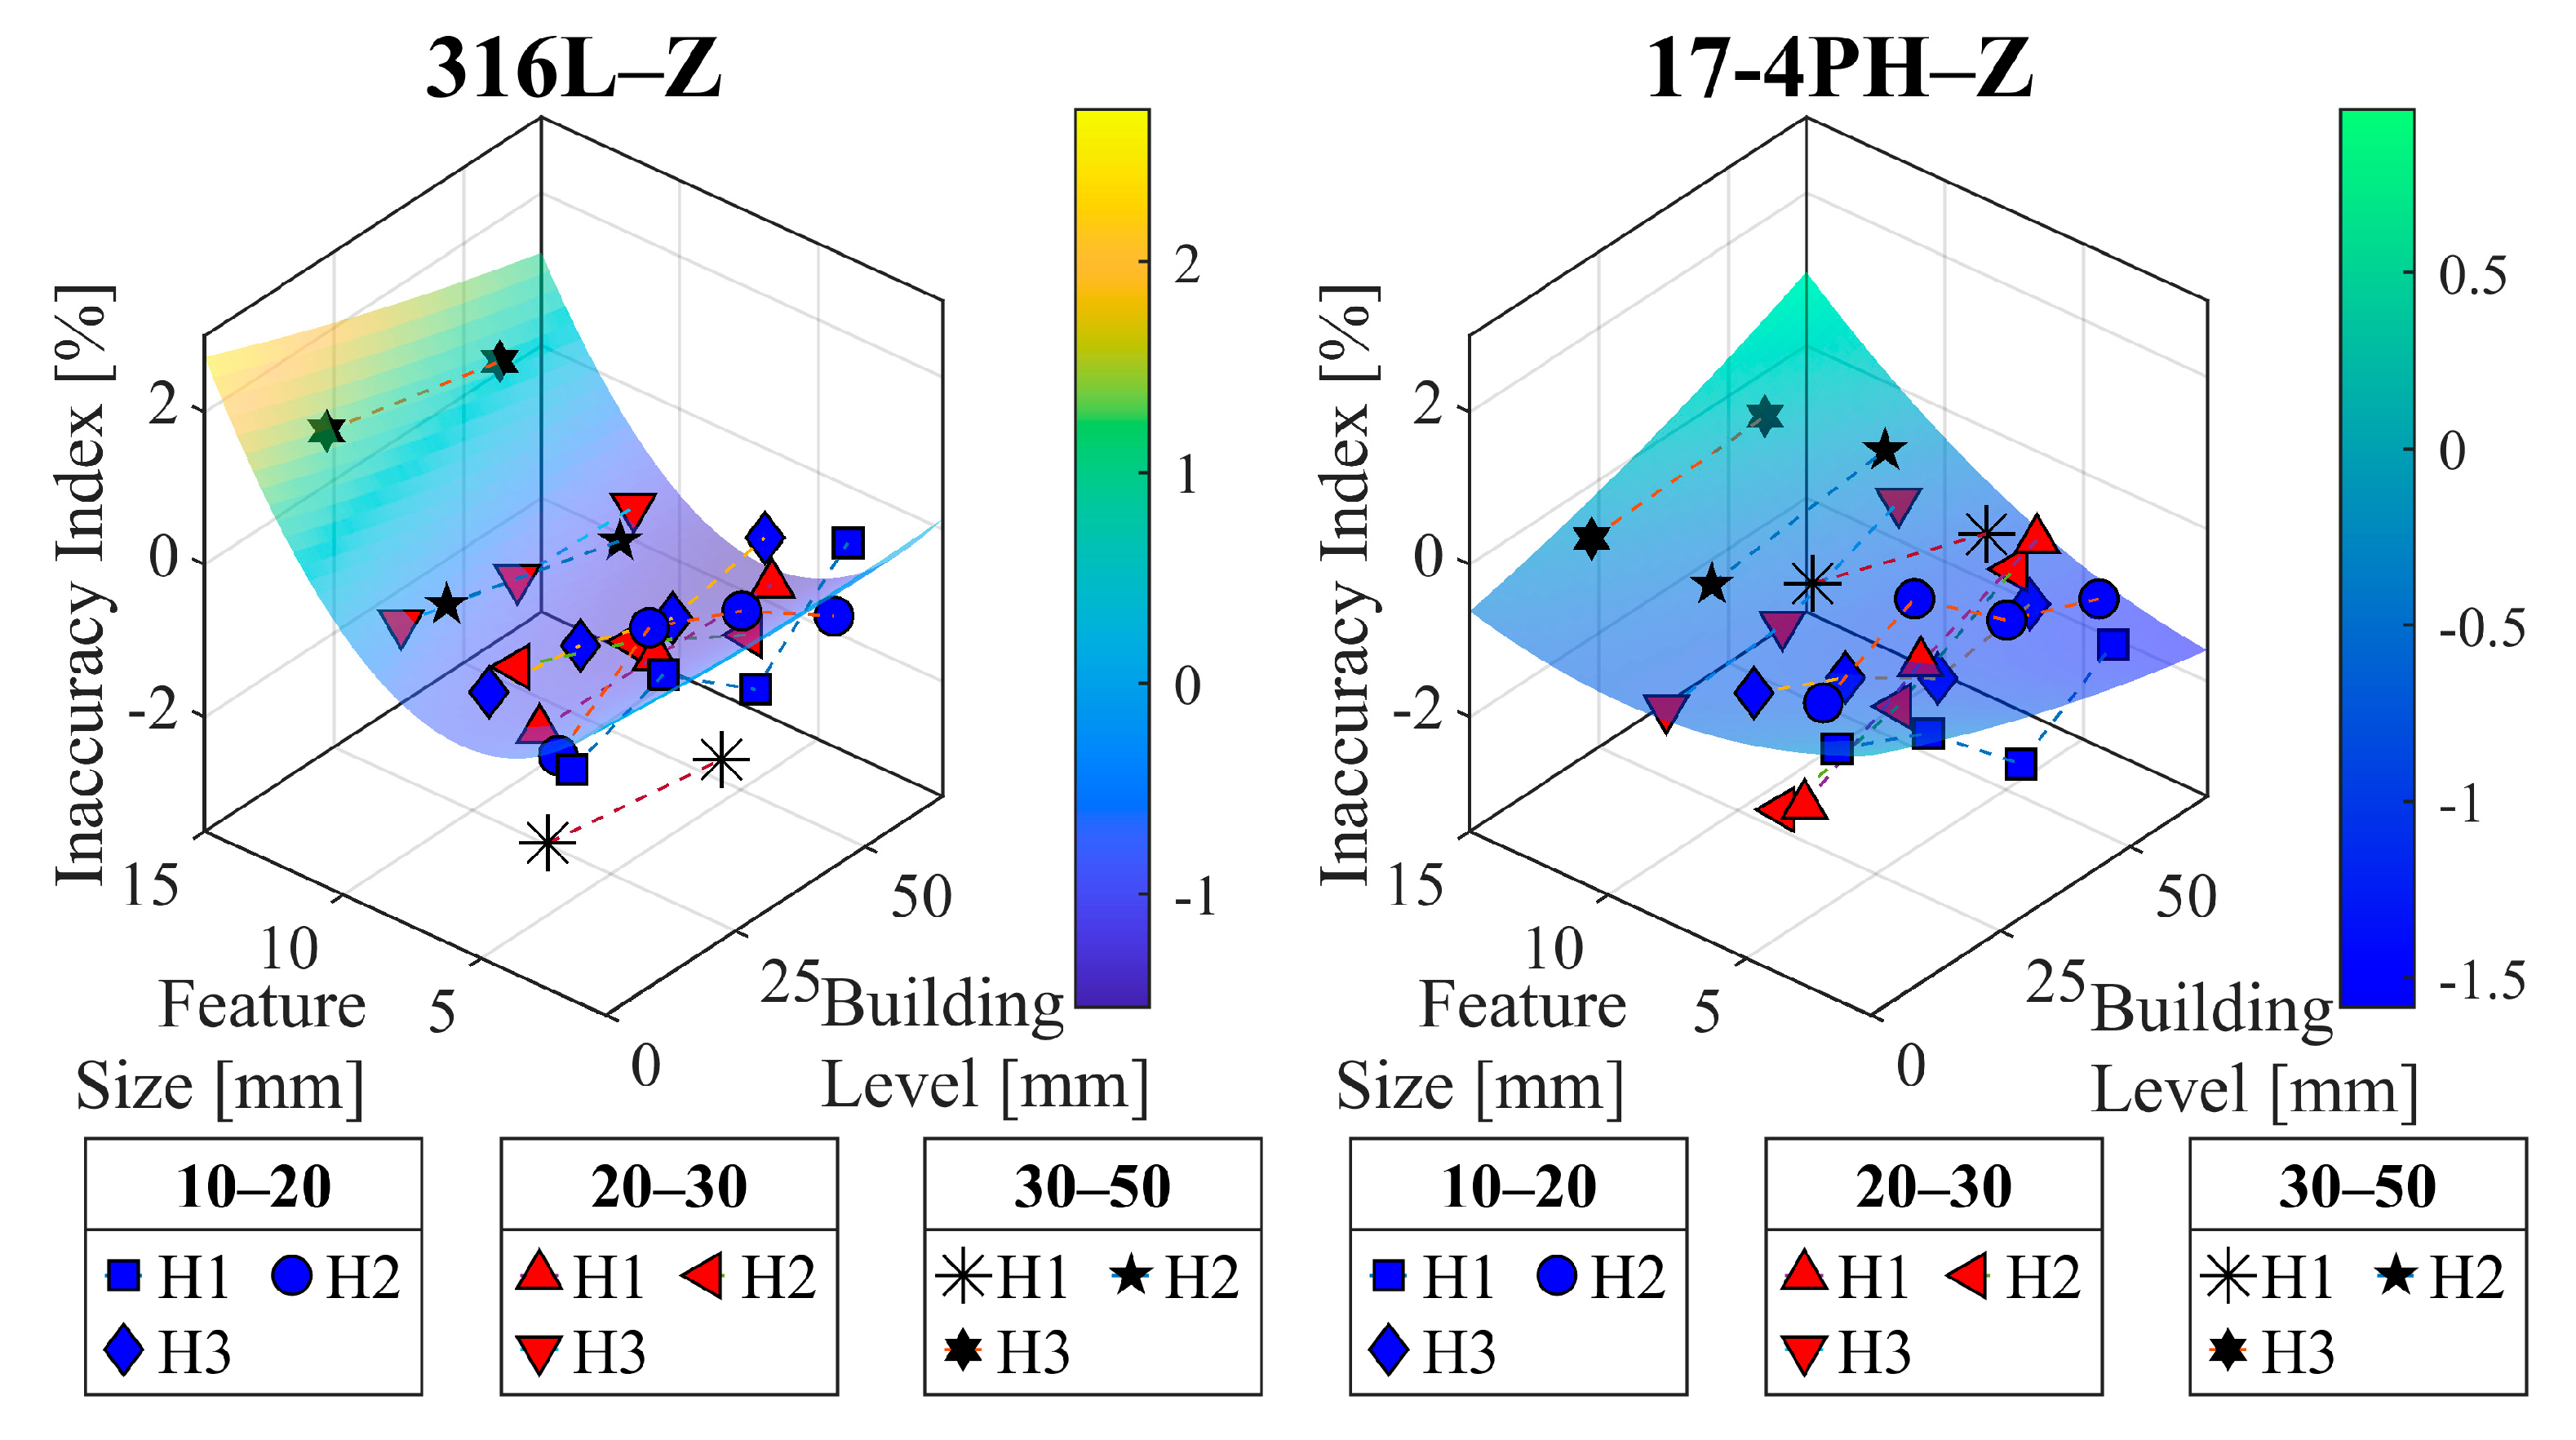
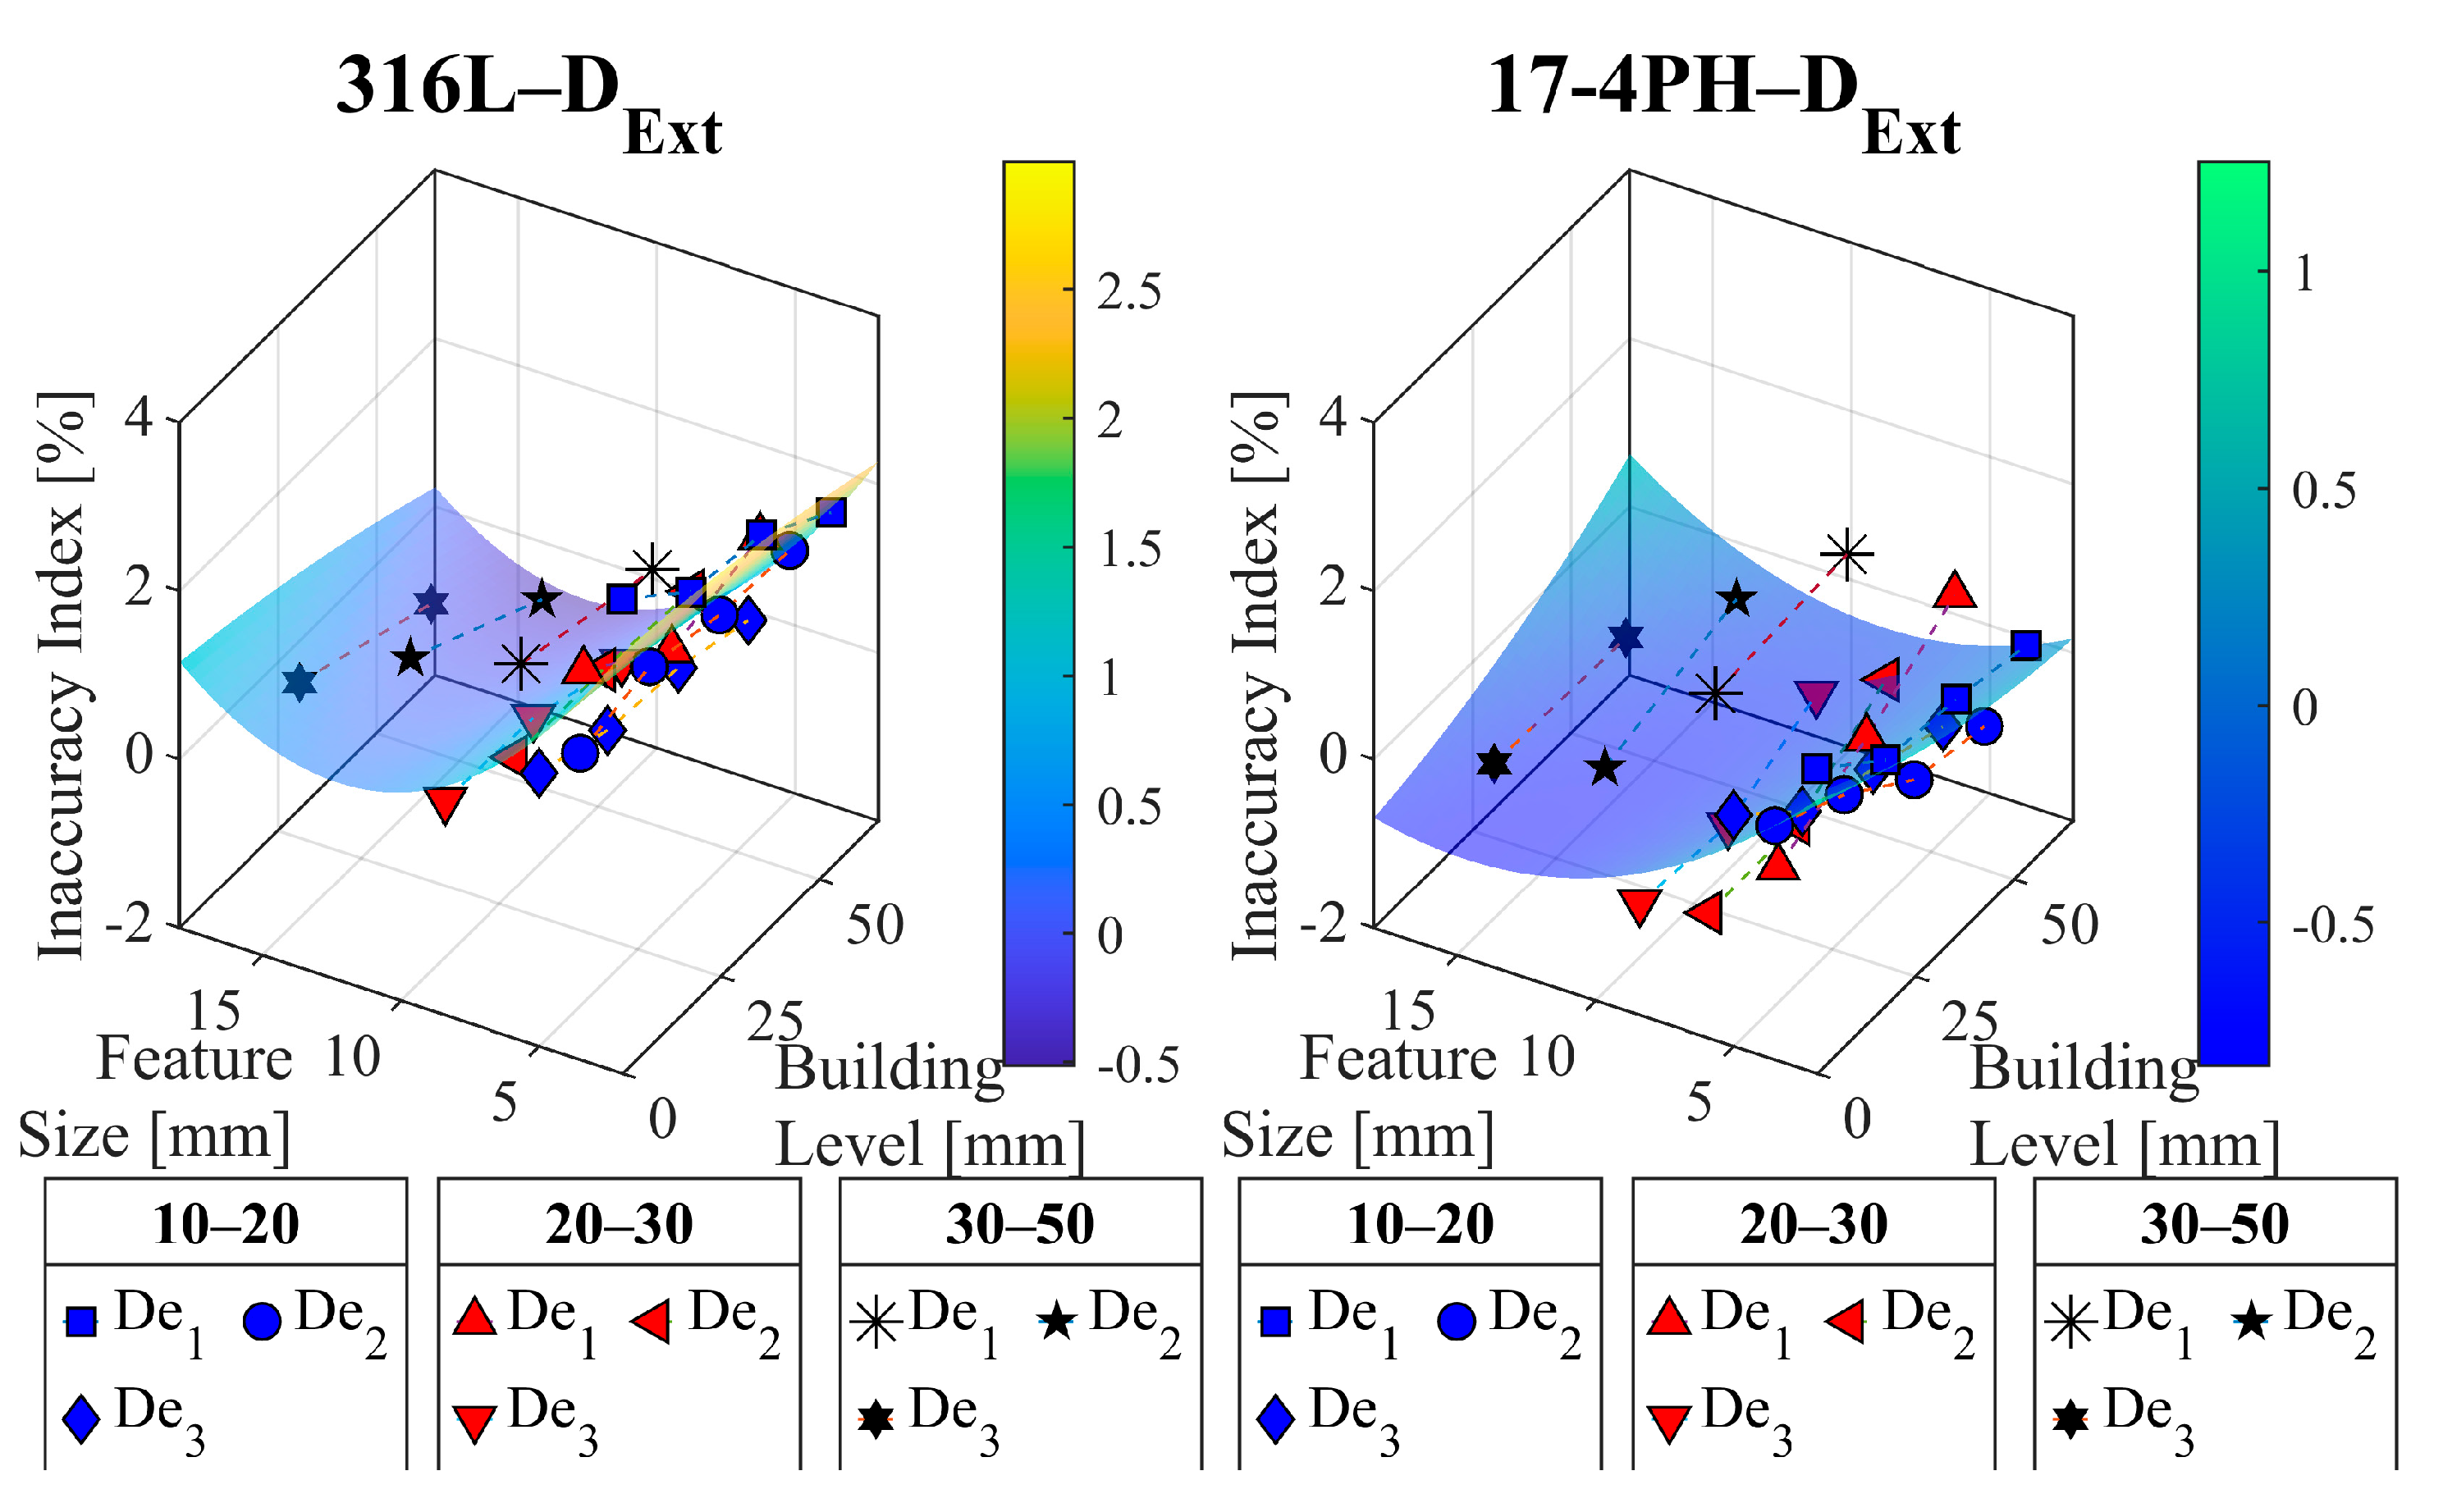
Figure 6, Figure 7, Figure 8, Figure 9, Figure 10 and Figure 11 show the inaccuracy index of all the investigated features measured by CMM in the sintered state for both steel grades. The inaccuracy index is expressed as a function of the building level and feature size, considering the three benchmark sizes. Features are classified according to the XYZ printing orientations, as reported in Table 1, Table 2, Table 3 and Table 4. Additionally, external cylindrical features (Table 5) are distinguished from internal ones (Table 6), as shown in Figure 10 and Figure 11, respectively. Experimental data was fitted by a quadratic surface (second-order polynomial equation in both variables) to provide a graphical representation of the main trends.
Generally, similar trends are recognized for both materials when analyzing different printing directions. Again, slightly better results were achieved for 17-4PH than 316L. As shown in Figure 7, a lower inaccuracy index was achieved on features aligned with the Y direction (powder spreading). Along this direction, the inaccuracy is influenced by the building level more than by the feature size. By contrast, the feature size is the prevailing factor affecting accuracy along other directions. In most cases, a poor accuracy was achieved in small features, showing negative index values. This is attributed to sintering shrinkage, which is higher in smaller features.
Figure 10 and Figure 11 show the accuracy indices of external and internal cylindrical features.
As shown in these figures, a better accuracy was achieved in the external cylindrical features than the internal ones. In general, internal features might be more sensitive to the negative effects such as layering and defects induced by de-powdering. For example, the lowest inaccuracy was found in Di1 in benchmark 10–20. The hole is smaller than the nominal dimension of 2 mm, probably due to the presence of excess binder, which increases the bonded powders within the cavity. These extra powders, along with the large sphere of the tip (1 mm), could have influenced the point acquisition and the subsequent reconstruction. Layer shifting might also affect the hole accuracy. In [32], it was shown that layer shifting occurred in the centers of circles reconstructed at different hole depths. This printing defect could also negatively impact the hole accuracy in the sintered state. Finally, feature Di2 exhibited a poor accuracy in benchmark 10–20. In addition to the previous explanations, it is important to note that this feature is located in the XZ plane. Therefore, anisotropic shrinkage can cause a worsening of the feature shape, as exhaustively discussed in [12,32,48,60].

3.5. Green and Sintered Density

Feature size and building level also affect the green and sintered densities, as reported in Table 16 for 316L and Table 17 for 17-4PH.
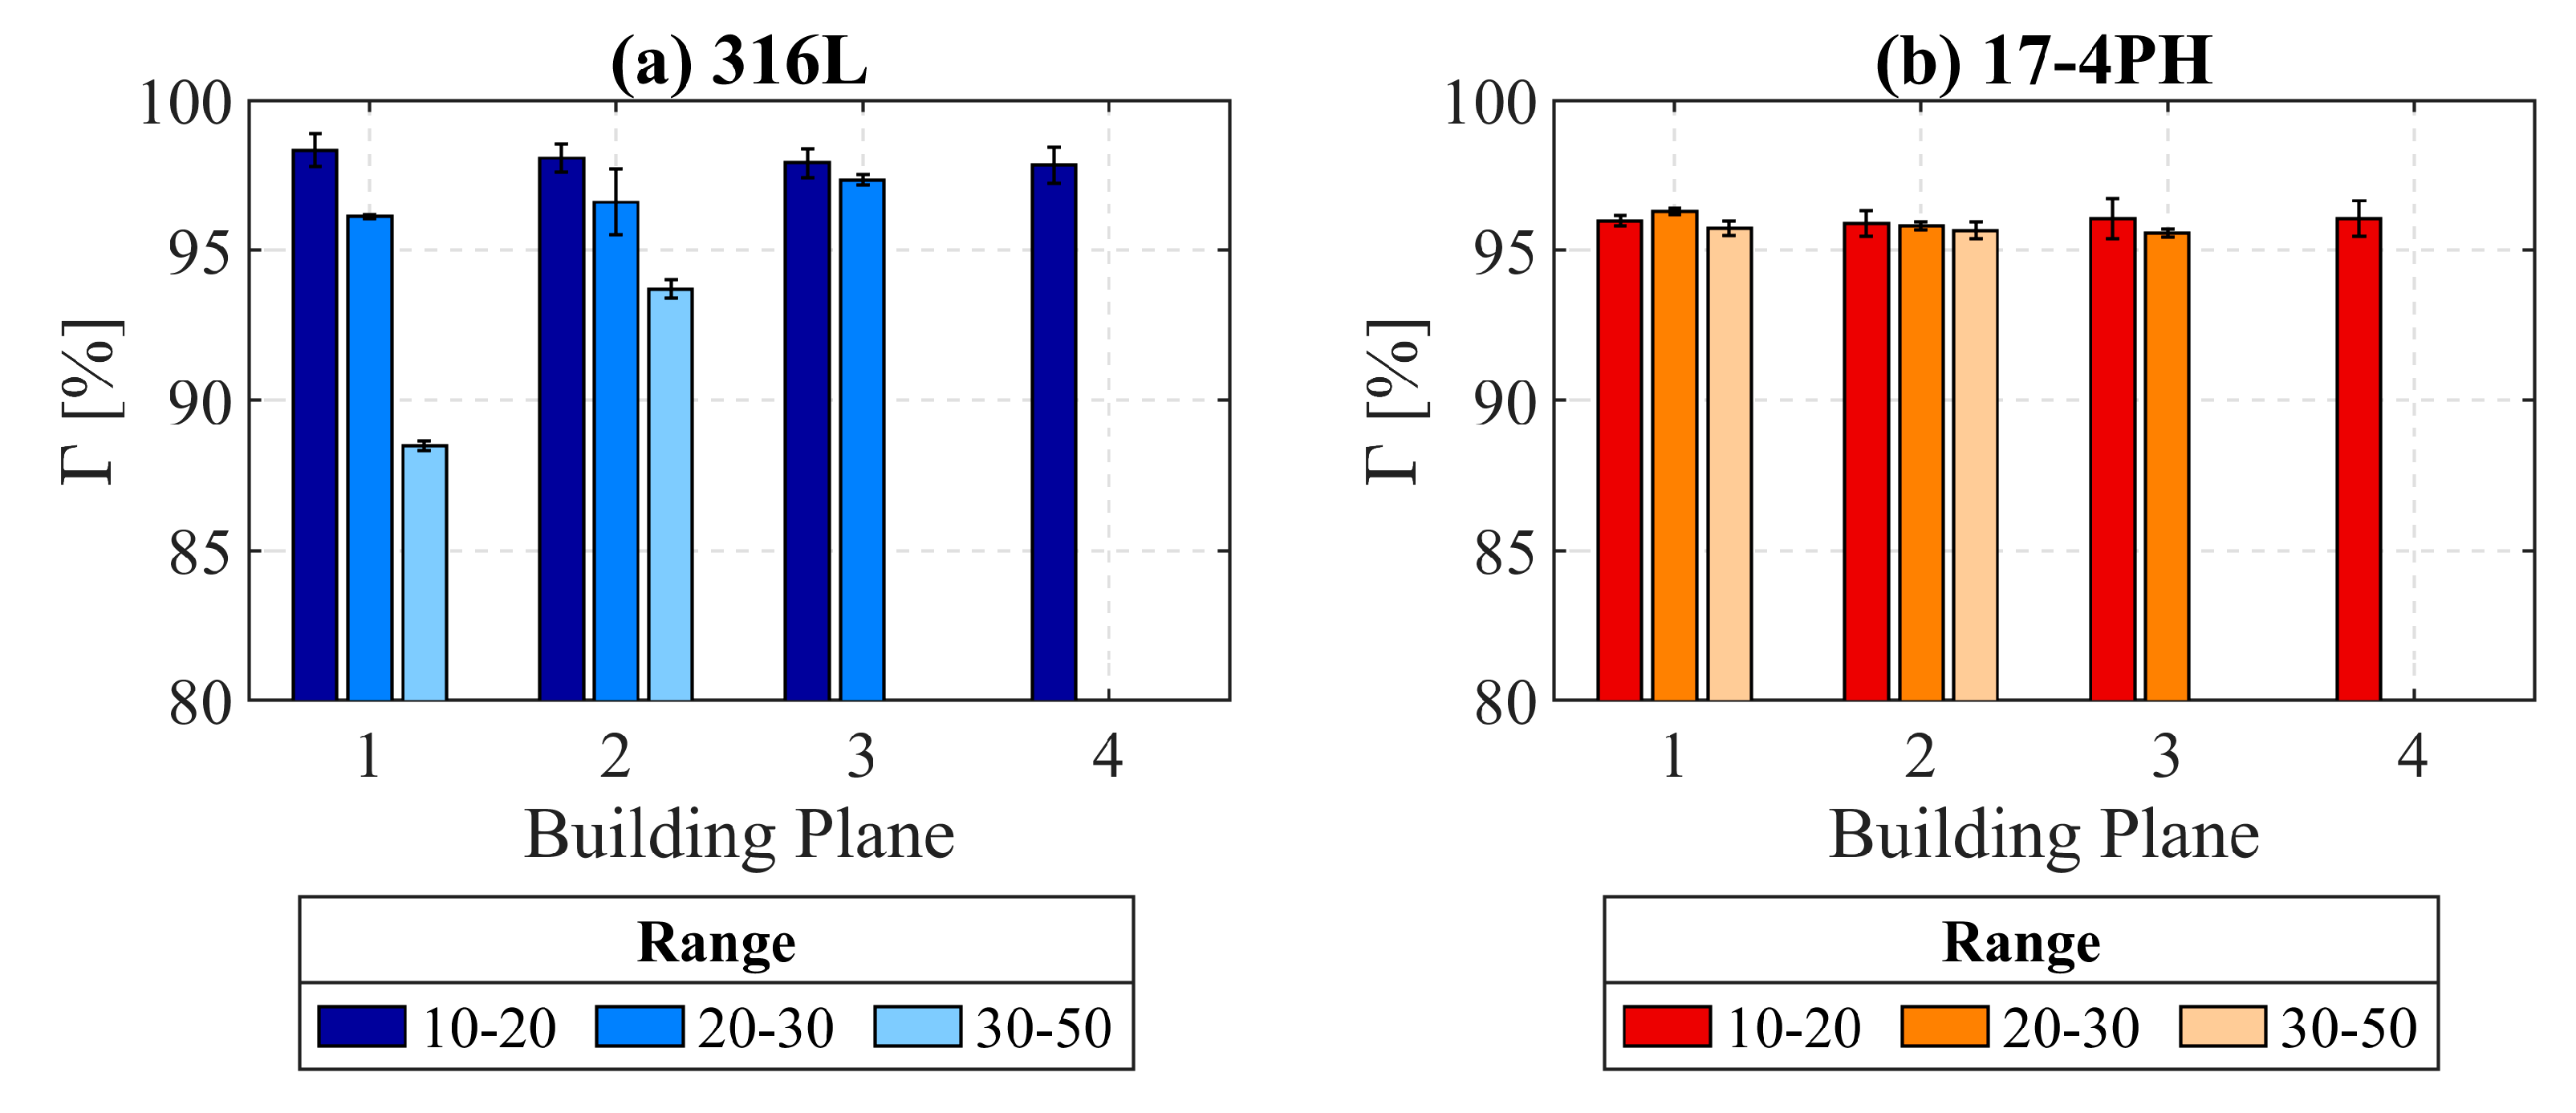
The green density is slightly higher for 316L than for 17-4 PH; however, after sintering, the 17-4 PH samples show the same sintered density for any size, while a strong influence of size on the sintered density is observed in the 316L samples. Figure 12 shows the densification parameter as a function of the building plane and benchmark range.
In 316L, the densification decreases as the benchmark size increases, which corresponds to a decrease in the shrinkage in large features. This is confirmed by the positive inaccuracy index obtained for larger features in the previous analysis. Conversely, almost the same density was achieved after sintering in 17-4PH. This confirms the better accuracy in 17-4PH, especially for large features, shown in Figure 6, Figure 7, Figure 8 and Figure 9.

3.6. Microstructural Analysis

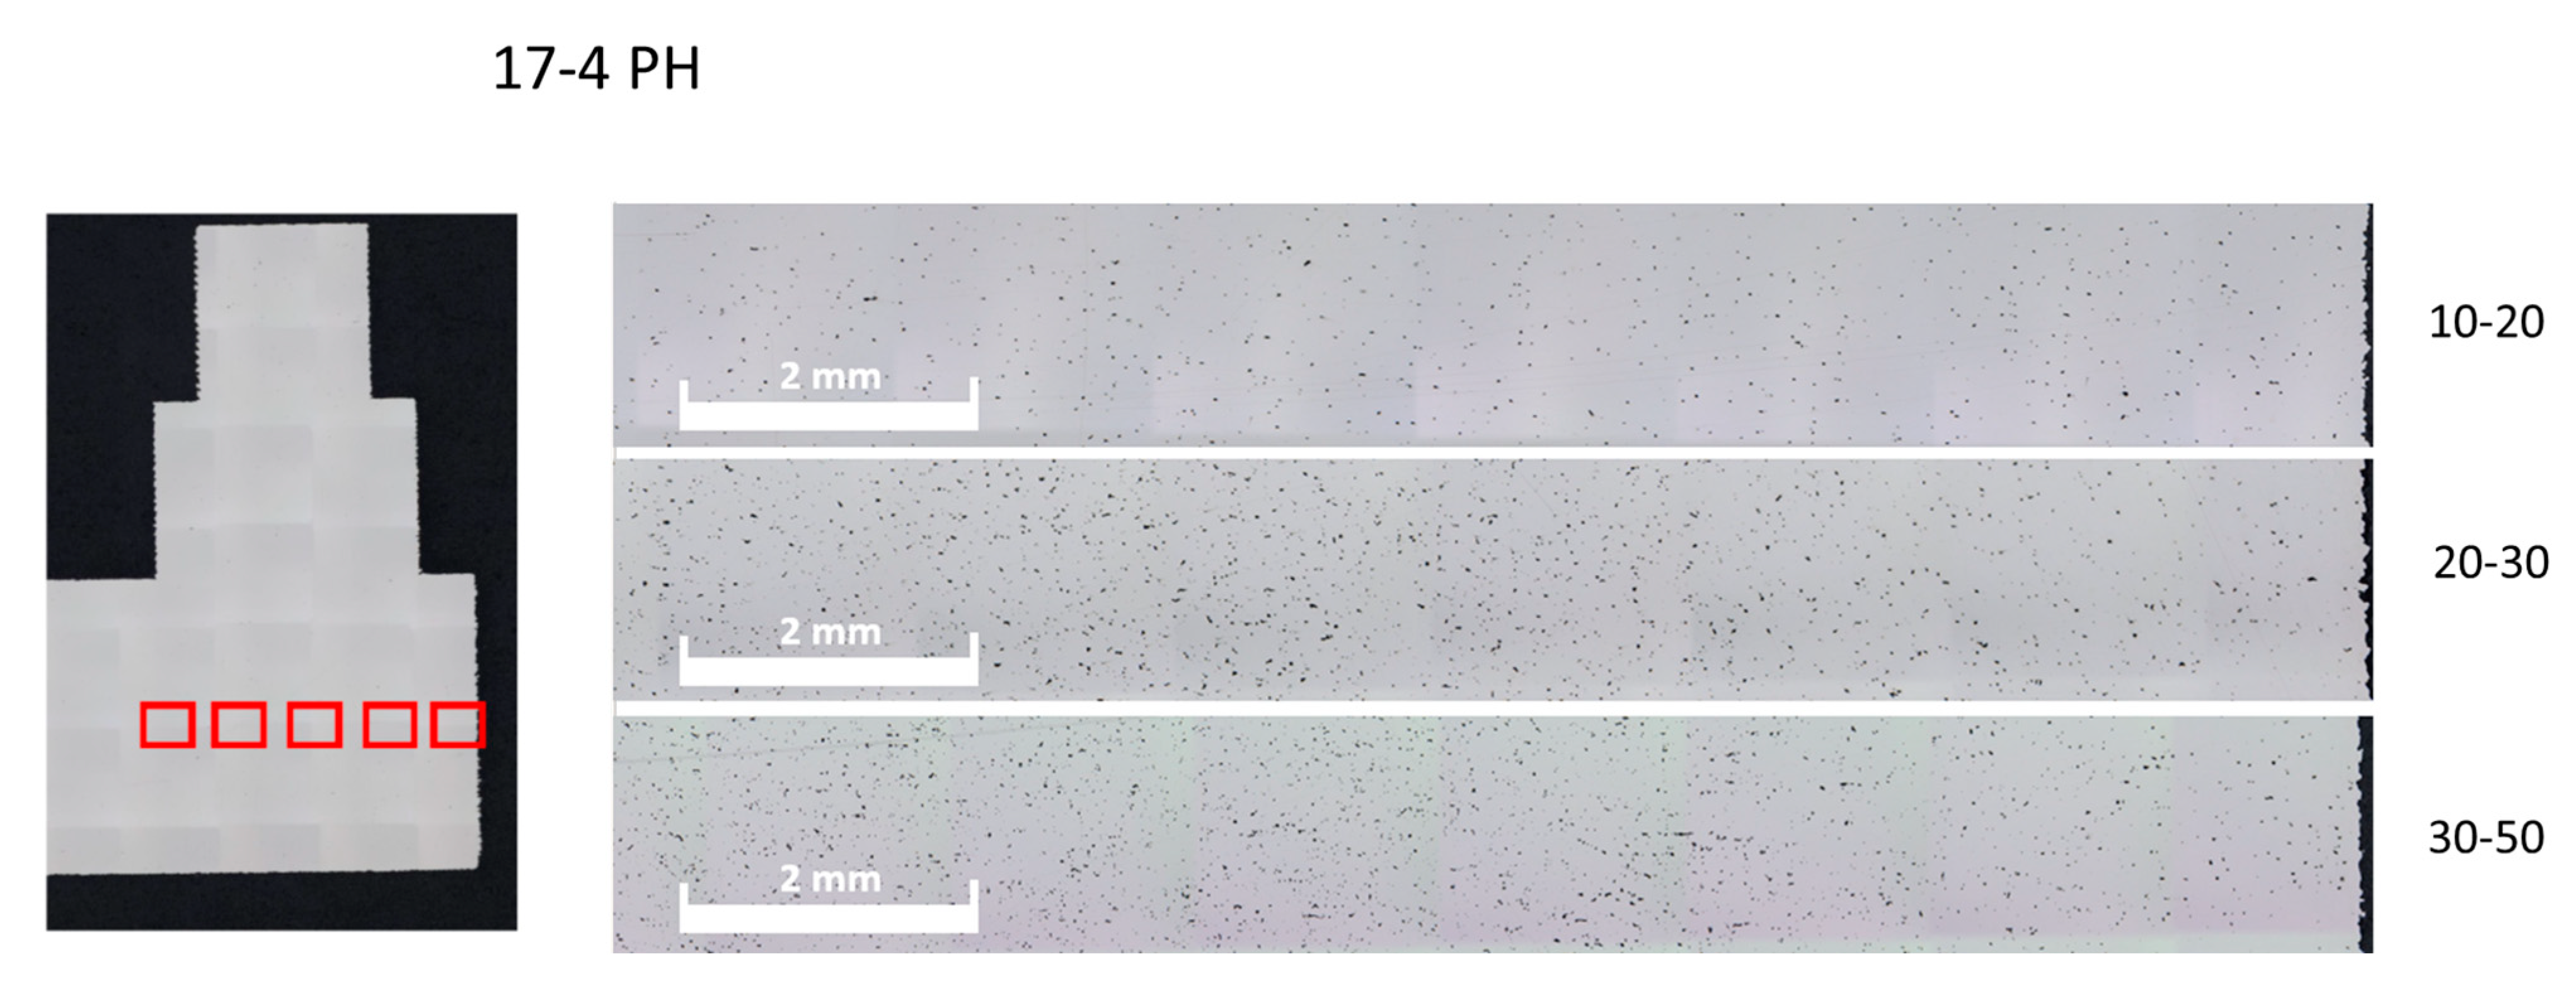
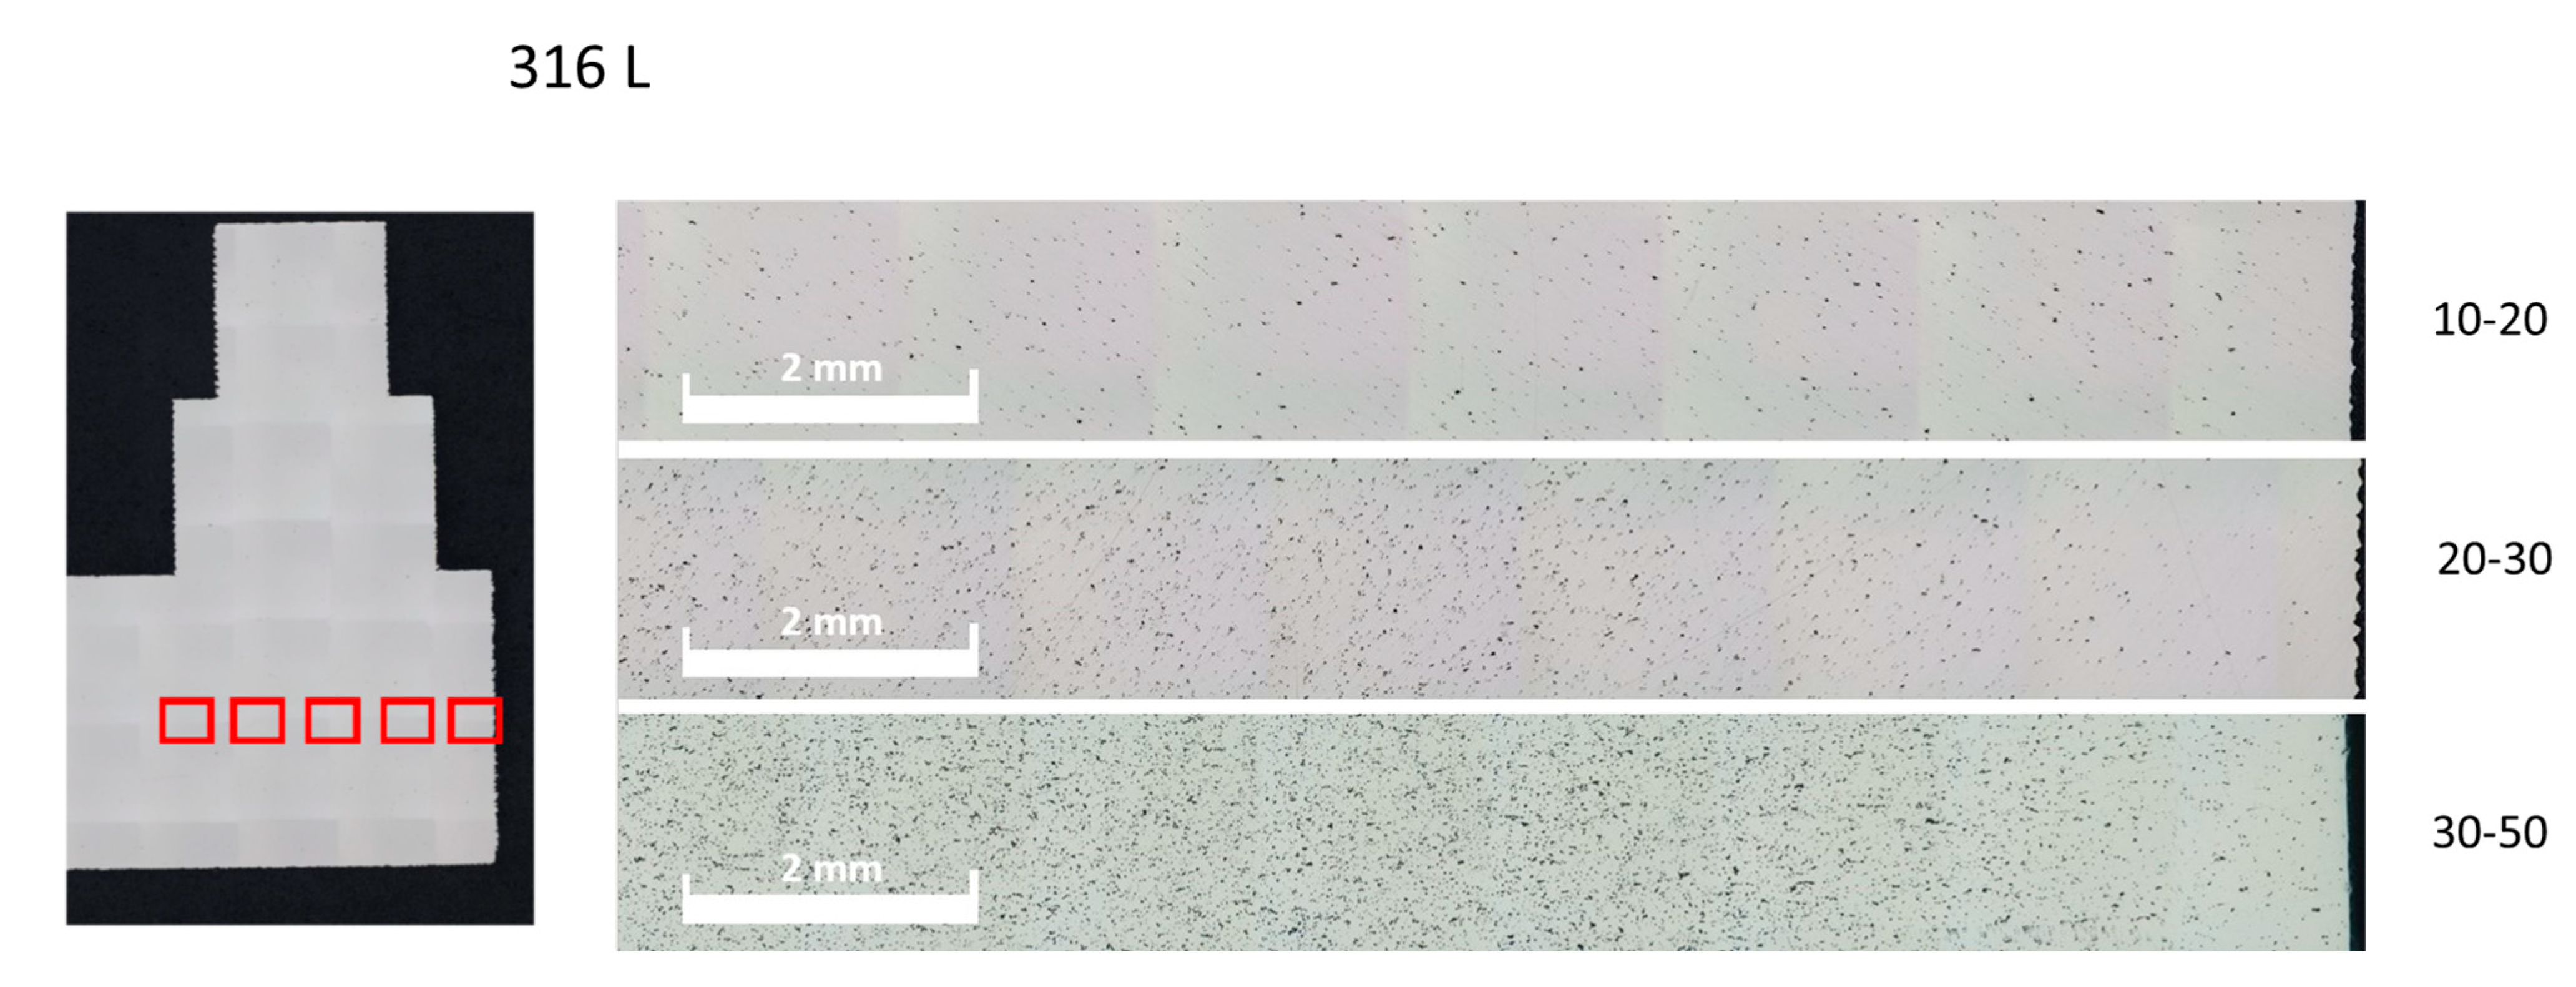
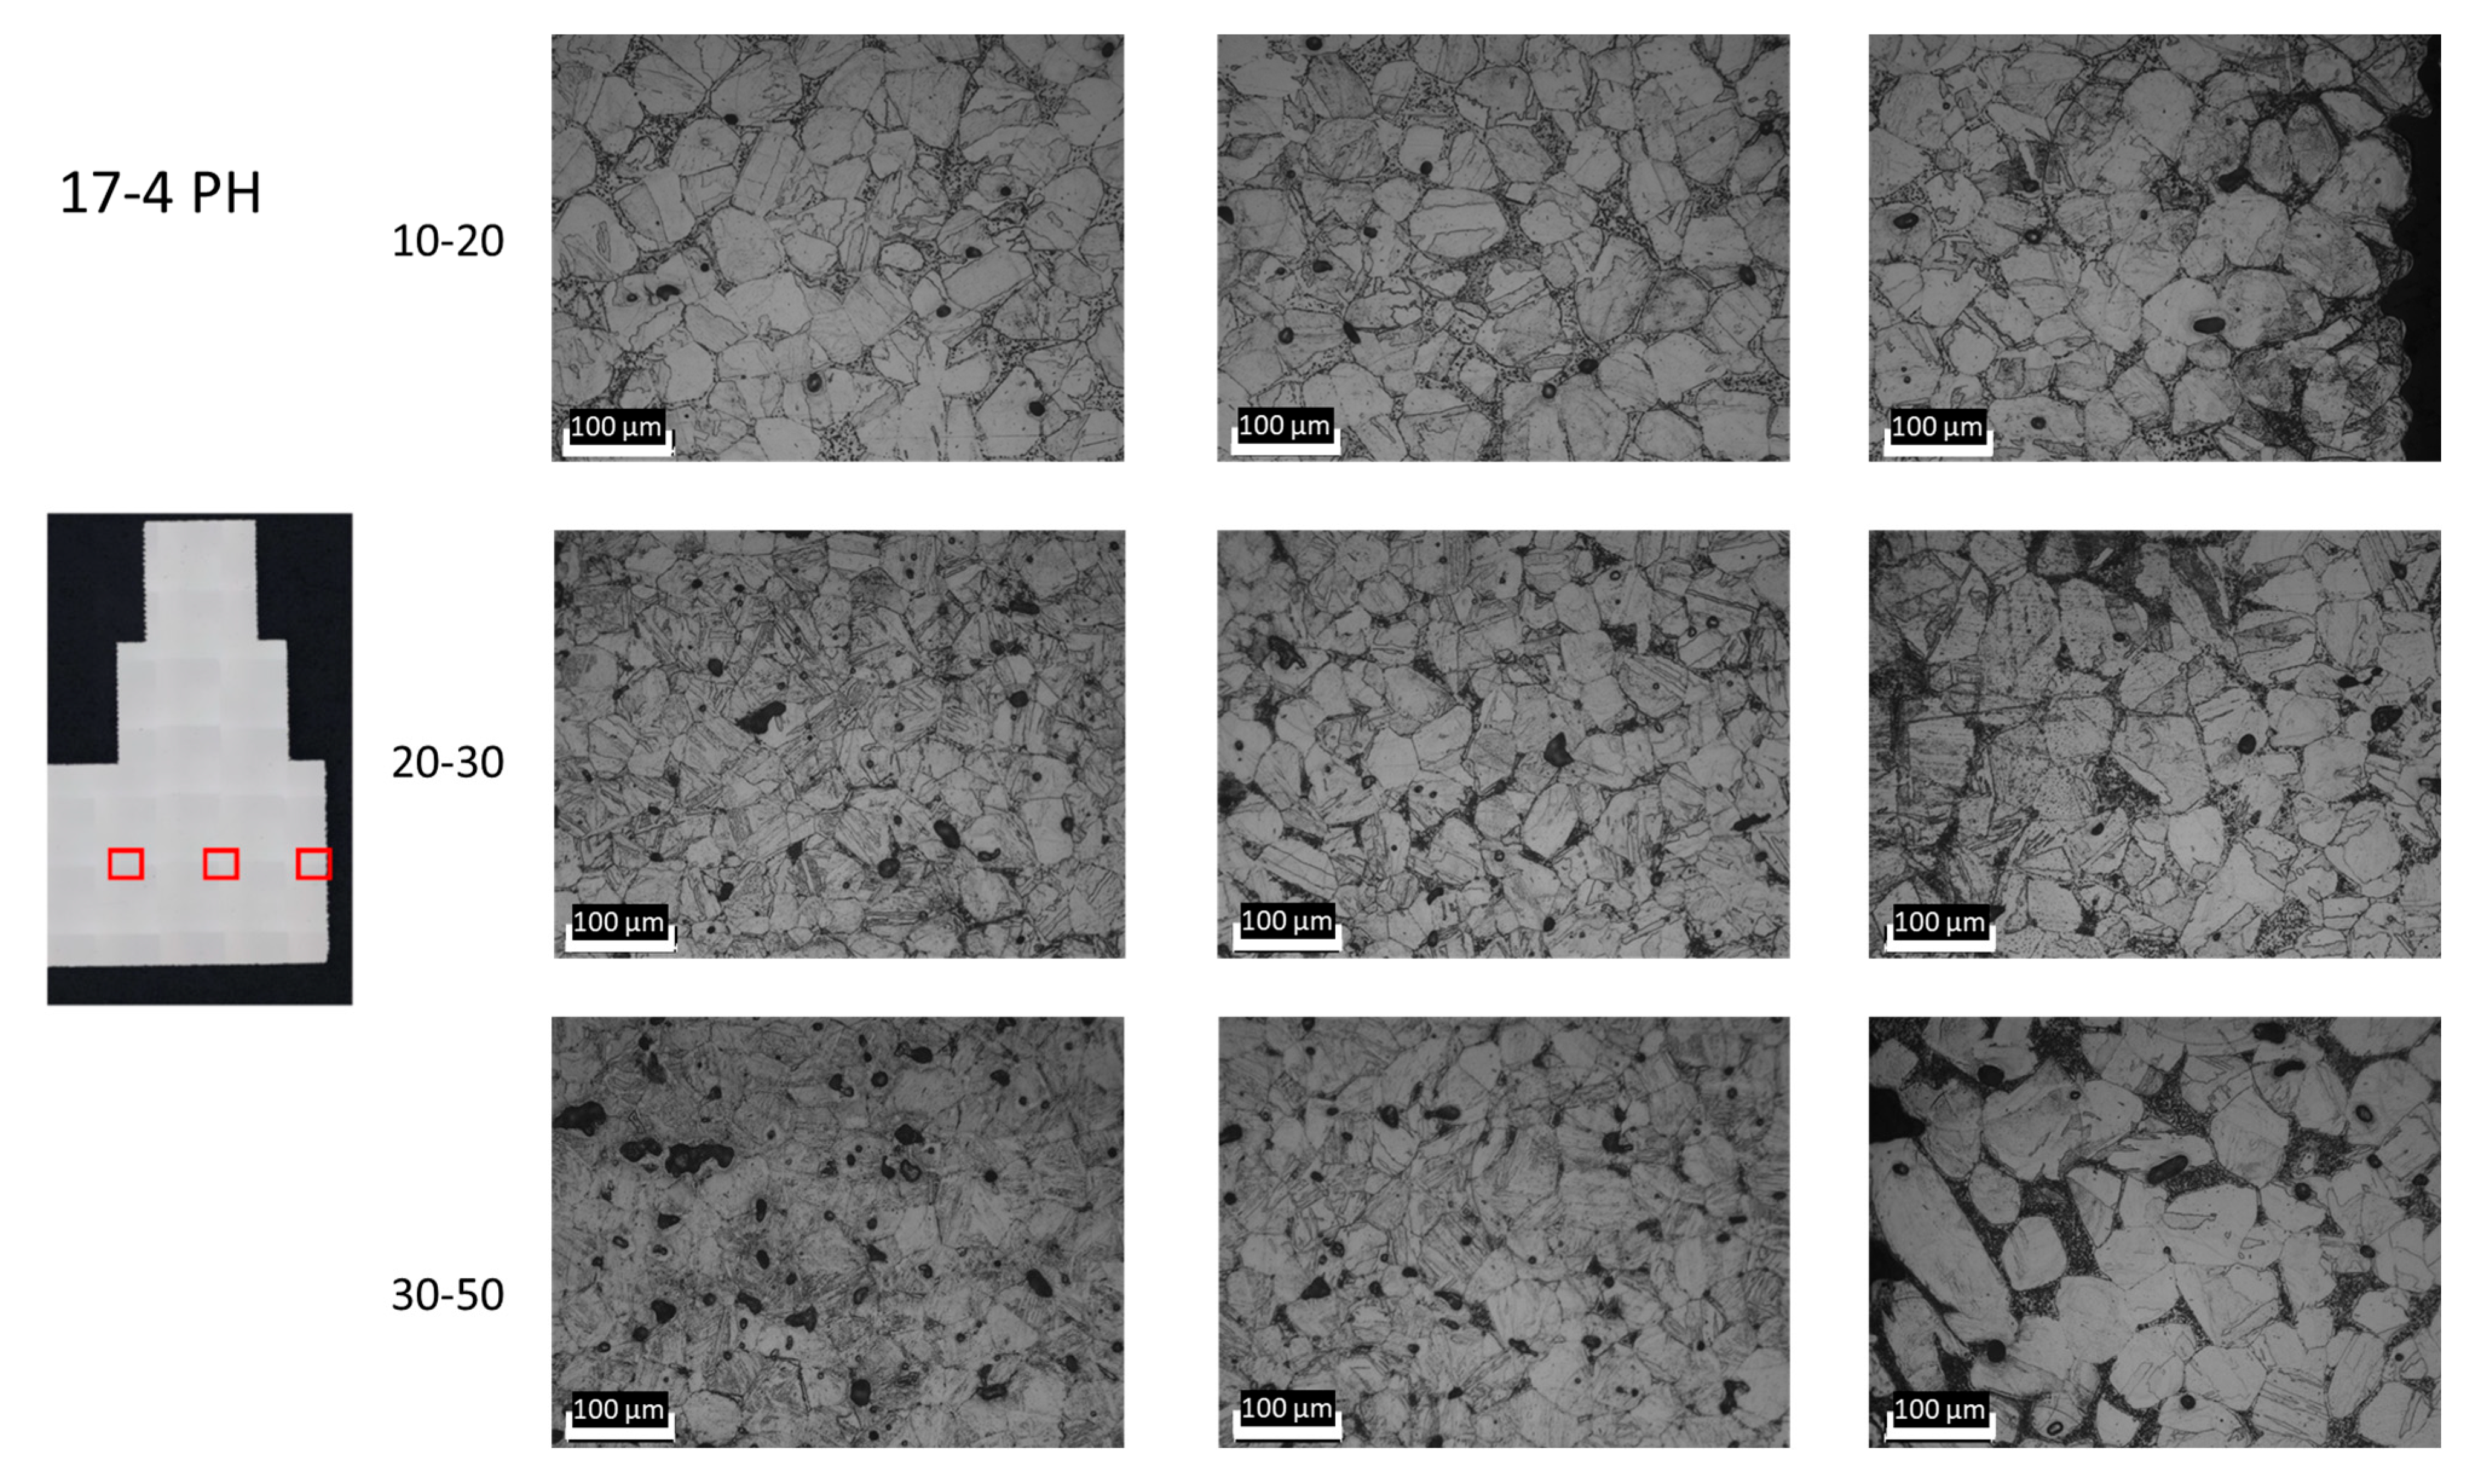
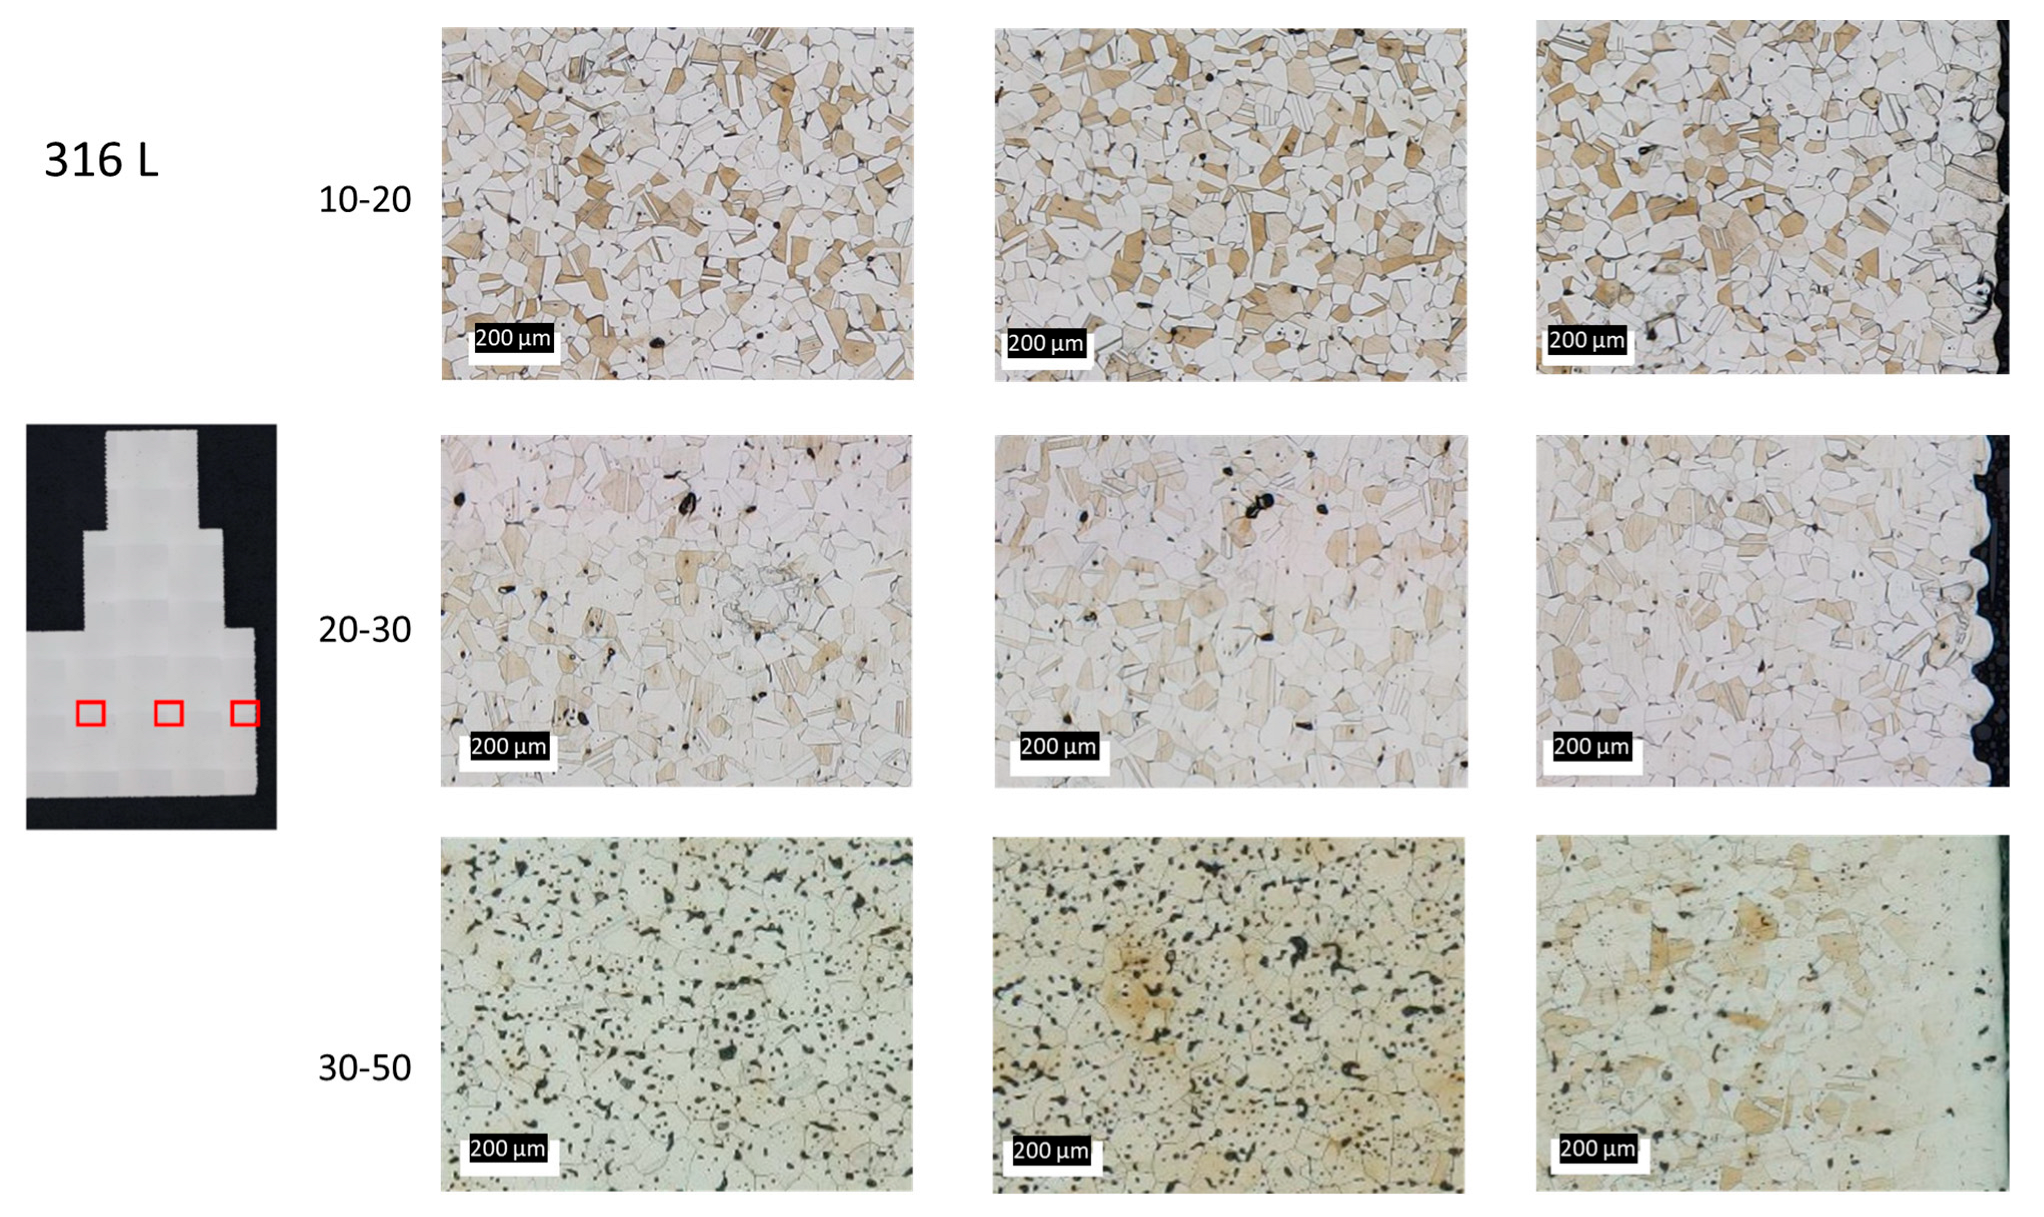
Aiming at understanding the relationship between size and sintered density, a microstructural analysis was performed by cutting the sample along the X–Z plane shown in Figure 1. Pictures were acquired by an optical microscope at the same level (height) at different depths (lengths), considering the different benchmark size. The height was the same for the different sizes, while the length varied, covering the whole area below the cylindrical features. Figure 13 shows the results for 17-4 PH samples and Figure 14 for the 316L samples.
Figure 14 shows the homogeneous distribution of porosity at different depths in the different samples, irrespective of the benchmark size, which can be related to the same sintered density measured in the 17-4 PH samples. Conversely, the 316L samples shown in Figure 15 highlight quite a homogeneous porosity distribution at different depths in small samples (10–20); when increasing the size, a denser microstructure is observed close to the external surface and a higher porosity is observed in depth. The result is coherent with the lower sintered density measured in larger samples and might be ascribed to the sintering mechanisms. Powder particles close to the surface, in close contact with sintering atmosphere, densify earlier than bulk particles. The surface layer reaches the condition of close porosity, and the denser microstructure hinders the exit of gases from inner pores and, in turn, the densification of the bulk. This phenomenon is not observed in small parts, where no temperature gradient is expected. However, from a thermodynamical perspective, the same phenomenon could occur in 17-4 PH as well. The microstructure after etching shown in Figure 15 and Figure 16 clarifies this last point.
Figure 15 clearly shows the presence of the delta phase in 17-4 PH (dark areas), which determined the liquid phase sintering mechanism in the whole part, thus obtaining the same sintered density irrespective of size. The temperature gradient hypothesized to explain the density gradient in 316L is highlighted here by the larger grain size observed close to the surface with increasing size; however, liquid phase mechanisms prevail, determining the sintered density. Solid state sintering conversely occurs in 316L, and the temperature gradient determines the density gradient. Slightly larger grain size close to the boundary in large samples is also observed in 316L.

4. Conclusions

This study systematically investigated the dimensional accuracy, precision, and spatial repeatability achievable in metal binder jetting (MBJ) technology. An extensive experimental campaign was conducted using benchmark artifacts printed in 316L and 17-4PH stainless steels. The findings highlight how the feature size, building level, and material type influence the MBJ dimensional accuracy and precision.
The main findings are summarized as follows:
  • In the green state, the inaccuracy index varied between −0.5% and 1%. It tends to decrease with feature size, and spatial repeatability is not constant but depends on the building plane. The loss of accuracy was attributed to the particle–binder interaction. Binder saturation and drying operations should be optimized, mainly when printing a large number of samples. Other sources of inaccuracy can be ascribed to gravitational and compaction forces acting on the powder bed.
  • In the green state, the IT tolerance grades varied between IT08 and IT13. The result was attributed to the non-uniform spatial repeatability function of the XYZ position in the building box. Specifically, a broadening of dimensional scatter was observed in the last building planes.
  • In the sintered state, the accuracy is significantly affected by the printing direction feature size, and slightly by the building level. Small features showed a high negative deviation from nominal values, likely due to shrinkage affected by the feature size, according to the density and microstructure analysis. Small features reached a higher density and, consequently, a higher dimensional change.
  • In the sintered state, IT tolerance grades between IT10 and IT16 were found. Sintering generally produced a broadening of scatter of dimensions, as is generally observed in powder metallurgy technologies.
  • A homogeneous sintered density was observed in the 17-4 PH samples, while it was influenced by the size in 316L (higher density in small samples). This is attributed to the different sintering mechanisms (solid state sintering in 316L, liquid phase sintering in 17-4 PH).
This study is the first to identify the challenges of defining scaling factors to compensate for accuracy loss in metal binder jetting (MBJ). The findings reveal that accuracy loss is affected not only by the printing direction but also by feature size and building level. These results provide novel insights for optimizing manufacturing processes and improving the design know-how of complex geometries. From a designer’s perspective, such knowledge allows for identifying the best orientation and positioning in the building chamber for complex parts, aiming at obtaining strict tolerances for the most critical features. Such advancements are essential for expanding MBJ’s applications in industrial applications.

Author Contributions

Conceptualization, M.Z. and I.C.; methodology, M.Z. and I.C.; software, M.Z. and G.S.; validation, M.Z. and G.S.; formal analysis, M.Z.; investigation, M.Z. and G.S.; resources, M.P.; data curation, M.Z.; writing—original draft preparation, M.Z.; writing—review and editing, I.C.; supervision, I.C.; project administration, M.P.; funding acquisition, M.P. All authors have read and agreed to the published version of the manuscript.

Funding

The project is financed by Provincia Autonoma di Trento, L.P. 13/12/1999, n. 6, Art. 5: Aiuti per la promozione della ricerca e sviluppo–Aid for promoting research and development.

Data Availability Statement

Data is unavailable due to confidentiality restrictions.

Acknowledgments

Authors are grateful to the whole staff of Mimest S.r.l. for producing the samples and fruitfully cooperating.

Conflicts of Interest

The authors declare no conflicts of interest. The funders had no role in the design of the study; in the collection, analyses, or interpretation of data; in the writing of the manuscript; or in the decision to publish the results.

References

  1. Prashar, G.; Vasudev, H.; Bhuddhi, D. Additive manufacturing: Expanding 3D printing horizon in industry 4.0. Int. J. Interact Des. Manuf. 2023, 17, 2221–2235. [Google Scholar] [CrossRef]
  2. ISO/ASTM 52900:2021; Additive Manufacturing—General principles—Fundamentals and Vocabulary. ISO: Geneva, Switzerland, 2021.
  3. Chen, L.; Chen, W.; Fu, Z.; Ding, G.; Chen, Z.; Zhu, D. Binder Jet 3D Printing of 316L Stainless Steel: Orthogonal Printing and Sintering Process Optimization. Adv. Eng. Mater. 2023, 25, 2200641. [Google Scholar] [CrossRef]
  4. Chen, W.; Chen, Z.; Chen, L.; Zhu, D.; Fu, Z. Optimization of Printing Parameters to Achieve High-Density 316L Stainless Steel Manufactured by Binder Jet 3D Printing. J. Mater. Eng. Perform. 2023, 32, 3602–3616. [Google Scholar] [CrossRef]
  5. Bai, Y.; Wagner, G.; Williams, C.B. Effect of particle size distribution on powder packing and sintering in binder jetting additive manufacturing of metals. J. Manuf. Sci. Eng. Trans. ASME 2017, 139, 081019. [Google Scholar] [CrossRef]
  6. Mostafaei, A.; Rodriguez De Vecchis, P.; Nettleship, I.; Chmielus, M. Effect of powder size distribution on densification and microstructural evolution of binder-jet 3D-printed alloy 625. Mater. Des. 2019, 162, 375–383. [Google Scholar] [CrossRef]
  7. Wang, Y.; Zhao, Y.F. Investigation of Sintering Shrinkage in Binder Jetting Additive Manufacturing Process. Procedia Manuf. 2017, 10, 779–790. [Google Scholar] [CrossRef]
  8. Do, T.; Kwon, P.; Shin, C.S. Process development toward full-density stainless steel parts with binder jetting printing. Int. J. Mach. Tools Manuf. 2017, 121, 50–60. [Google Scholar] [CrossRef]
  9. Mao, Y.; Cai, C.; Zhang, J.; Heng, Y.; Feng, K.; Cai, D.; Wei, Q. Effect of sintering temperature on binder jetting additively manufactured stainless steel 316L: Densification, microstructure evolution and mechanical properties. J. Mater. Res. Technol. 2023, 22, 2720–2735. [Google Scholar] [CrossRef]
  10. Huber, D.; Vogel, L.; Fischer, A. The effects of sintering temperature and hold time on densification, mechanical properties and microstructural characteristics of binder jet 3D printed 17-4 PH stainless steel. Addit. Manuf. 2021, 46, 102114. [Google Scholar] [CrossRef]
  11. Mirzababaei, S.; Pasebani, S. A review on binder jet additive manufacturing of 316L stainless steel. J. Manuf. Mater. Process. 2019, 3, 82. [Google Scholar] [CrossRef]
  12. Zago, M.; Lecis, N.; Mariani, M.; Cristofolini, I. Analysis of the causes determining dimensional and geometrical errors in 316L and 17-4PH stainless steel parts fabricated by metal binder jetting. Int. J. Adv. Manuf. Technol. 2024, 132, 835–851. [Google Scholar] [CrossRef]
  13. Sadeghi Borujeni, S.; Saluja, G.S.; Ploshikhin, V. Compensation of sintering deformation for components manufactured by metal binder jetting using numerical simulations. Rapid Prototyp. J. 2023, 29, 612–625. [Google Scholar] [CrossRef]
  14. Sadeghi Borujeni, S.; Shad, A.; Abburi Venkata, K.; Günther, N.; Ploshikhin, V. Numerical simulation of shrinkage and deformation during sintering in metal binder jetting with experimental validation. Mater. Des. 2022, 216, 110490. [Google Scholar] [CrossRef]
  15. Zhang, K.; Zhang, W.; Brune, R.; Herderick, E.; Zhang, X.; Cornell, J.; Forsmark, J. Numerical simulation and experimental measurement of pressureless sintering of stainless steel part printed by Binder Jetting Additive Manufacturing. Addit. Manuf. 2021, 47, 102330. [Google Scholar] [CrossRef]
  16. Paudel, B.J.; Conover, D.; Lee, J.K.; To, A.C. A computational framework for modeling distortion during sintering of binder jet printed parts. J. Micromech. Mol. Phys. 2021, 6, 95–102. [Google Scholar] [CrossRef]
  17. Jamalkhani, M.; Deng, Z.; Sossong, D.; Dashtgerd, I.; Martiska, G.; Mostafaei, A. In-situ monitoring of sintering and analytical modeling of densification and shrinkage in binder jetted 316L stainless steel. Materialia 2024, 36, 102131. [Google Scholar] [CrossRef]
  18. Sajgalik, M.; Matus, M.; Spuro, P.; Joch, R.; Czan, A.; Beranek, L. Analysis of the Suitability of Additive Technologies for the Production of Stainless Steel Components. J. Manuf. Mater. Process. 2025, 9, 283. [Google Scholar] [CrossRef]
  19. Yap, Y.L.; Wang, C.; Sing, S.L.; Dikshit, V.; Yeong, W.Y.; Wei, J. Material jetting additive manufacturing: An experimental study using designed metrological benchmarks. Precis. Eng. 2017, 50, 275–285. [Google Scholar] [CrossRef]
  20. Chen, H.; Zhao, Y.F. Process parameters optimization for improving surface quality and manufacturing accuracy of binder jetting additive manufacturing process. Rapid Prototyp. J. 2016, 22, 527–538. [Google Scholar] [CrossRef]
  21. Sahu, K.K.; Modi, Y.K. Multi response optimization for compressive strength, porosity and dimensional accuracy of binder jetting 3D printed ceramic bone scaffolds. Ceram. Int. 2022, 48, 26772–26783. [Google Scholar] [CrossRef]
  22. Rebaioli, L.; Fassi, I. A review on benchmark artifacts for evaluating the geometrical performance of additive manufacturing processes. Int. J. Adv. Manuf. Technol. 2017, 93, 2571–2598. [Google Scholar] [CrossRef]
  23. de Pastre, M.A.; Toguem Tagne, S.C.; Anwer, N. Test artefacts for additive manufacturing: A design methodology review. CIRP J. Manuf. Sci. Technol. 2020, 31, 14–24. [Google Scholar] [CrossRef]
  24. Minetola, P.; Galati, M.; Calignano, F.; Iuliano, L.; Rizza, G.; Fontana, L. Comparison of dimensional tolerance grades for metal AM processes. Procedia CIRP 2020, 88, 399–404. [Google Scholar] [CrossRef]
  25. Piscopo, G.; Salmi, A.; Atzeni, E. Investigation of dimensional and geometrical tolerances of laser powder directed energy deposition process. Precis. Eng. 2024, 85, 217–225. [Google Scholar] [CrossRef]
  26. Gruber, S.; Grunert, C.; Riede, M.; López, E.; Marquardt, A.; Brueckner, F.; Leyens, C. Comparison of dimensional accuracy and tolerances of powder bed based and nozzle based additive manufacturing processes. J. Laser Appl. 2020, 32, 032016. [Google Scholar] [CrossRef]
  27. Dimitrov, D.; Van Wijck, W.; Schreve, K.; De Beer, N. Investigating the achievable accuracy of three dimensional printing. Rapid Prototyp. J. 2006, 12, 42–52. [Google Scholar] [CrossRef]
  28. Kim, G.D.; Oh, Y.T. A benchmark study on rapid prototyping processes and machines: Quantitative comparisons of mechanical properties, accuracy, roughness, speed, and material cost. Proc. Inst. Mech. Eng. Part B J. Eng. Manuf. 2008, 222, 201–215. [Google Scholar] [CrossRef]
  29. Dahmen, T.; Klingaa, C.G.; Baier-Stegmaier, S.; Lapina, A.; Pedersen, D.B.; Hattel, J.H. Characterization of channels made by laser powder bed fusion and binder jetting using X-ray CT and image analysis. Addit. Manuf. 2020, 36, 101445. [Google Scholar] [CrossRef]
  30. Modi, Y.K.; Sahu, K.K. Process capability analysis of binder jetting 3D printing process for fabrication of calcium sulphate based porous bone scaffolds. Aust. J. Mech. Eng. 2023, 21, 270–278. [Google Scholar] [CrossRef]
  31. Ollison, T.; Berisso, K. Three-dimensional printing build variables that impact cylindricity. J. Ind. Technol. 2010, 26, 1–10. [Google Scholar]
  32. Zago, M.; Lecis, N.F.M.; Vedani, M.; Cristofolini, I. Dimensional and geometrical precision of parts produced by Binder Jetting process as affected by the anisotropic shrinkage on sintering. Addit. Manuf. 2021, 43, 102007. [Google Scholar] [CrossRef]
  33. Yang, M.; Keshavarz, M.K.; Vlasea, M.; Molavi-Kakhki, A. Towards full-dense high geometric fidelity parts via binder jetting and controlled sintering. J. Manuf. Process. 2024, 115, 180–191. [Google Scholar] [CrossRef]
  34. Islam, M.N.; Sacks, S. An experimental investigation into the dimensional error of powder-binder three-dimensional printing. Int. J. Adv. Manuf. Technol. 2016, 82, 1371–1380. [Google Scholar] [CrossRef]
  35. Dahmen, T.; Henriksen, N.G.; Dahl, K.V.; Lapina, A.; Pedersen, D.B.; Hattel, J.H.; Christiansen, T.; Somers, M. Densification, microstructure, and mechanical properties of heat-treated MAR-M247 fabricated by Binder Jetting. Addit. Manuf. 2021, 39, 101912. [Google Scholar] [CrossRef]
  36. ISO 10360-5:2020; Geometrical Product Specifications (GPS)—Acceptance and Reverification Tests for Coordinate Measuring Systems (CMS) Part 5: Coordinate Measuring Machines (CMMs) Using Single and Multiple Stylus Contacting Probing Systems Using Discrete Point and/or Scanning Measuring Mode. ISO: Geneva, Switzerland, 2020.
  37. ISO 286-1:2010; Geometrical Product Specifications (GPS)—ISO Code System for Tolerances on Linear Sizes Part 1: Basis of Tolerances, Deviations and Fits. ISO: Geneva, Switzerland, 2010.
  38. ISO 286-2:2010; Geometrical Product Specifications (GPS)—ISO Code System for Tolerances on LINEAR sizes Part 2: Tables of Standard Tolerance Classes and Limit Deviations for Holes and Shafts. ISO: Geneva, Switzerland, 2010.
  39. Liang, X.; Meng, X.; Ni, P.; Zhao, Z.; Deng, X.; Chen, G.; Chen, Y.; Li, S.; Wu, S.; Liu, J.; et al. Effect of feedstock bimodal powder mixture and infiltration process on mechanical behaviour of binder jetting processed 316L stainless steel. Powder Metall. 2023, 66, 387–402. [Google Scholar] [CrossRef]
  40. Dorula, M.; Khademitab, M.; Jamalkhani, M.; Mostafaei, A. Location dependency of green density and dimension variation in binder jetted parts. Int. J. Adv. Manuf. Technol. 2024, 132, 2853–2861. [Google Scholar] [CrossRef]
  41. Crane, N.B. Impact of part thickness and drying conditions on saturation limits in binder jet additive manufacturing. Addit. Manuf. 2020, 33, 101127. [Google Scholar] [CrossRef]
  42. Colton, T.; Inkley, C.; Berry, A.; Crane, N.B. Impact of inkjet printing parameters and environmental conditions on formation of 2D and 3D binder jetting geometries. J. Manuf. Process. 2021, 71, 187–196. [Google Scholar] [CrossRef]
  43. Miyanaji, H.; Zhang, S.; Yang, L. A new physics-based model for equilibrium saturation determination in binder jetting additive manufacturing process. Int. J. Mach. Tools Manuf. 2018, 124, 1–11. [Google Scholar] [CrossRef]
  44. Charnnarong, J. The Drying Shrinkage in Three-Dimensional Printing and Its Dependence on the Properties of the Powder and the Binder. Ph.D. Thesis, Massachusetts Institute of Technology, Cambridge, MA, USA, 1996. [Google Scholar]
  45. Cheny, T.; Colin, C.; Verquin, B. Experimental evaluation of binder infiltration depth and axial overlap to control properties of green parts produced by Binder Jetting. Addit. Manuf. 2024, 87, 104231. [Google Scholar] [CrossRef]
  46. Lores, A.; Azurmendi, N.; Agote, I.; Andrés, U. A Step towards A Robust Binder Jetting Technology: Process Parameter Optimization for 17-4PH Steel to Increase Powder Bed Homogeneity. In Proceedings of the Euro PM2020 Congress Exhibition, Online, 5–7 October 2020; p. 4849277. Available online: https://www.publications.epma.com/product/euro-pm2020-proceedings/ (accessed on 28 October 2025).
  47. Do, T.; Shin, C.S.; Stetsko, D.; Vanconant, G.; Vartanian, A.; Pei, S.; Kwon, P. Improving Structural Integrity with Boron-Based Additives for 3D printed 420 Stainless Steel. Procedia Manuf. 2015, 1, 263–272. [Google Scholar] [CrossRef]
  48. Zago, M.; Lecis, N.; Mariani, M.; Uçak, O.U.; Cristofolini, I. Influence of shape distortion on the precision of holes in parts fabricated by metal binder jetting. Int. J. Interact. Des. Manuf. 2024, 18, 5789–5800. [Google Scholar] [CrossRef]
  49. Lee, Y.; Gurnon, A.K.; Bodner, D.; Simunovic, S. Effect of Particle Spreading Dynamics on Powder Bed Quality in Metal Additive Manufacturing. Integr. Mater. Manuf. Innov. 2020, 9, 410–422. [Google Scholar] [CrossRef]
  50. Lee, Y.; Nandwana, P.; Simunovic, S. Powder spreading, densification, and part deformation in binder jetting additive manufacturing. Prog. Addit. Manuf. 2021, 7, 111–125. [Google Scholar] [CrossRef]
  51. Cristofolini, I.; Molinari, A.; Zago, M.; Amirabdollahian, S.; Coube, O.; Dougan, M.J.; Larsson, M.; Schneider, M.; Valler, P.; Voglhuber, J.; et al. Design for Powder Metallurgy: Predicting Anisotropic Dimensional Change on Sintering of Real Parts. Int. J. Precis. Eng. Manuf. 2019, 20, 619–630. [Google Scholar] [CrossRef]
  52. Barthel, B.; Janas, F.; Wieland, S. Powder condition and spreading parameter impact on green and sintered density in metal binder jetting. Powder Metall. 2021, 64, 378–386. [Google Scholar] [CrossRef]
  53. Stevens, E.; Schloder, S.; Bono, E.; Schmidt, D.; Chmielus, M. Density variation in binder jetting 3D-printed and sintered Ti-6Al-4V. Addit. Manuf. 2018, 22, 746–752. [Google Scholar] [CrossRef]
  54. Lecis, N.; Mariani, M.; Beltrami, R.; Emanuelli, L.; Casati, R.; Vedani, M.; Molinari, A. Effects of process parameters, debinding and sintering on the microstructure of 316L stainless steel produced by binder jetting. Mater. Sci. Eng. A 2021, 828, 142108. [Google Scholar] [CrossRef]
  55. Cabo Rios, A.; Persson, M.; Hryha, E.; Olevsky, E. Phenomenological sintering model and experimental validation of gravity-induced distortions in binder-jetted stainless steel components. Ceram. Int. 2024, 50, 37268–37281. [Google Scholar] [CrossRef]
  56. Atzeni, E.; Salmi, A. Study on unsupported overhangs of AlSi10Mg parts processed by Direct Metal Laser Sintering (DMLS). J. Manuf. Process. 2015, 20, 500–506. [Google Scholar] [CrossRef]
  57. ISO 2768-1:1989; General Tolerances Part 1: Tolerances for Linear and Angular Dimensions Without Individual Tolerance Indications. ISO: Geneva, Switzerland, 1989.
  58. German, R.M.; Bose, A. Injection Molding of Metals and Ceramics; Metal Powder Industries Federation: Princeton, NJ, USA, 1997. [Google Scholar]
  59. EPMA. Introduction to Metal Injection Moulding. A Manufacturing Process for Precision Engineering Components. 2018. Available online: https://www.publications.epma.com/product/introduction-to-metal-injection-moulding/ (accessed on 1 October 2025).
  60. Zago, M.; Lecis, N.F.M.; Vedani, M.; Cristofolini, I. Geometrical Issues in Design for Binder Jetting—The Effect of Anisotropic Dimensional Change on Sintering. In Design Tools and Methods in Industrial Engineering II; Rizzi, C., Campana, F., Bici, M., Gherardini, F., Ingrassia, T., Cicconi, P., Eds.; Springer International Publishing: Cham, Switzerland, 2022; pp. 410–421. [Google Scholar] [CrossRef]
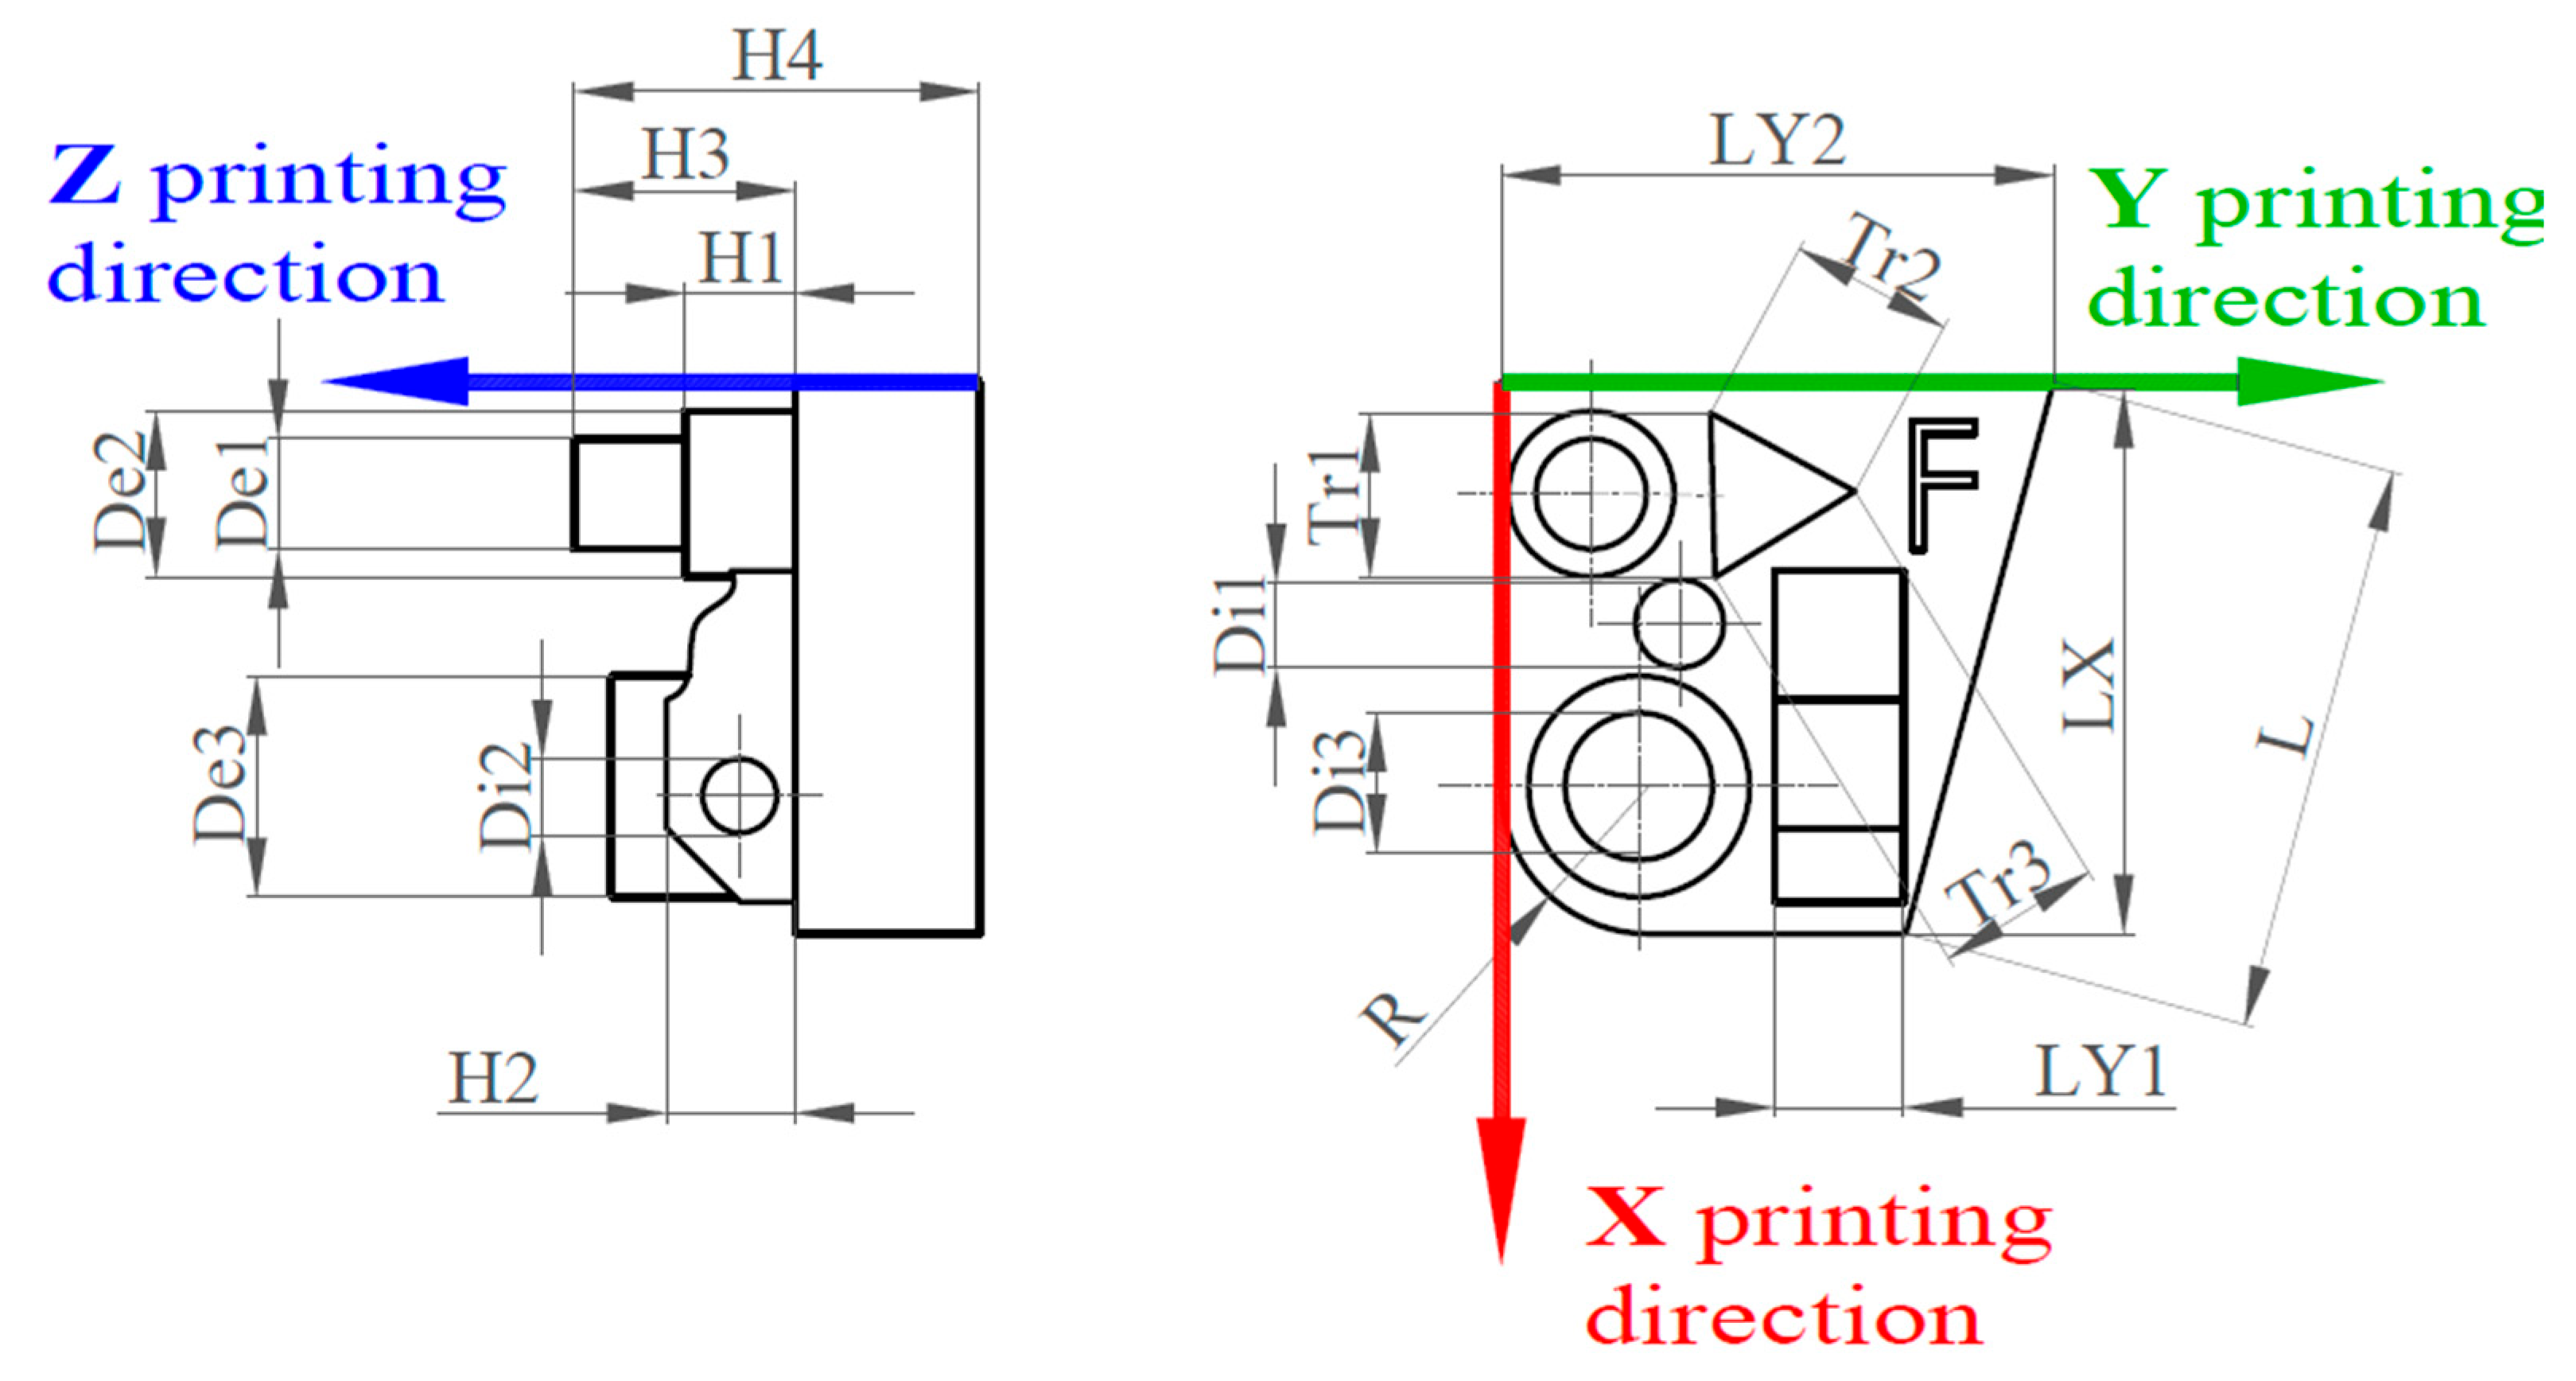
Figure 1. Benchmark geometry and features annotation.
Jmmp 09 00363 g001
Figure 2. Building boxes of benchmark 10–20 (a), benchmark 20–30 (b), and benchmark 30–50 (c), along with a picture of sintered samples of 316L and 17-4PH in the three size ranges (d).
Jmmp 09 00363 g002
Figure 3. Inaccuracy index of the height (H4) dimension function at different building planes. Data displayed for the small (10–20), intermediate (20–30), and large (30–50) benchmarks printed using 17-4PH and 316L in the green state.
Jmmp 09 00363 g003
Figure 4. Inaccuracy index of the length (LX) dimension calculated function of the building plane. Data displayed for the small (10–20), intermediate (20–30), and large (30–50) benchmarks made of 17-4PH and 316L in the green state.
Jmmp 09 00363 g004
Figure 5. Example of dispersion of data on the measurement of length (LX) on benchmark 10–20—316L—green state in plane 1, plane 2, plane 3, and plane 4.
Jmmp 09 00363 g005aJmmp 09 00363 g005b
Figure 6. Inaccuracy index of features aligned with X printing direction of 316L and 17-4PH. Experimental data and surface fitting function of nominal feature sizes and building level.
Jmmp 09 00363 g006
Figure 7. Inaccuracy index of features aligned with Y printing direction of 316L and 17-4PH. Experimental data and surface fitting function of nominal feature sizes and building level.
Jmmp 09 00363 g007
Figure 8. Inaccuracy index of features aligned with XY printing plane of 316L and 17-4PH. Experimental data and surface fitting function of nominal feature sizes and building level.
Jmmp 09 00363 g008
Figure 9. Inaccuracy index of features aligned with Z printing direction of 316L and 17-4PH. Experimental data and surface fitting function of nominal feature sizes and building level.
Jmmp 09 00363 g009
Figure 10. Inaccuracy index of external cylindrical features of 316L and 17-4PH. Experimental data and surface fitting function of nominal feature sizes and building level.
Jmmp 09 00363 g010
Figure 11. Inaccuracy index of internal cylindrical features of 316L and 17-4PH. Experimental data and surface fitting function of nominal feature sizes and building level.
Jmmp 09 00363 g011
Figure 12. Densification parameter for (a) 316L and (b) 17-4PH.
Jmmp 09 00363 g012
Figure 13. Microstructural analysis showing the distribution of porosity in the 17-4 PH samples at different depths for the different sizes–red squares qualitatively correspond to the different depth of the micrographs, joined to show the porosity distribution.
Jmmp 09 00363 g013
Figure 14. Microstructural analysis showing the distribution of porosity in the 316L samples at different depths for the different sizes–red squares qualitatively correspond to the different depth of the micrographs, joined to show the porosity distribution.
Jmmp 09 00363 g014
Figure 15. Microstructural analysis showing the microstructures in 17-4 PH samples at different depths for the different sizes–red squares qualitatively show the position of the micrographs.
Jmmp 09 00363 g015
Figure 16. Microstructural analysis showing the microstructures in 316L samples at different depths for the different sizes–red squares qualitatively show the position of the micrographs.
Jmmp 09 00363 g016
Table 1. Nominal dimensions of linear features aligned with X direction (binder injection direction).
FeatureBenchmark
10–2020–3030–50
LX [mm]152540
Tr1 [mm]5.28.6613.86
Table 2. Nominal dimensions of linear features aligned with Y direction (powder spreading direction).
FeatureBenchmark
10–2020–3030–50
LY1 [mm]3.55.839.33
LY2 [mm]152540
Table 3. Nominal dimensions of features aligned with Z direction (building direction).
FeatureBenchmark
10–2020–3030–50
H1 [mm]355.67
H2 [mm]3.55.839.33
H3 [mm]61013.67
H4 [mm]1118.3327
Table 4. Nominal dimensions of other features not aligned with X–Y directions.
FeatureBenchmark
10–2020–3030–50
R [mm]46.6710.67
Tr2 [mm]5.28.6613.86
Tr3 [mm]5.28.6613.86
L [mm]15.325.540.79
Table 5. Nominal dimensions of external cylindrical features.
FeatureBenchmark
10–2020–3030–50
De1 [mm]358
De2 [mm]4.57.512
De3 [mm]61016
Table 6. Nominal dimensions of internal cylindrical features.
FeatureBenchmark
10–2020–3030–50
Di1 [mm]1.62.674.26
Di2 [mm]23.335.33
Di3 [mm]46.6710.67
Table 7. Printing parameters.
Layer ThicknessDark BodyPrinthead SpeedPowder
Applicator Speed
Bed TemperatureResolution
42 μm3200 mm/s30 mm/s80 °C 1200 dpi
Table 8. Basic size interval and standard tolerance factor.
Basic Size
Lower limit
(Lupper) [mm]
136101830
Upper Limit
(Llower) [mm]
3610183050
Standard tolerance factor i [-]0.5420.7330.8981.0831.3071.561
Table 9. Standard tolerance grades for dimensions above 1 mm and up to 500 mm.
IT5IT6IT7IT8IT9IT10IT11IT12IT13IT14IT15IT16IT17IT18
7i10i16i25i40i64i100i160i250i400i640i1000i1600i2500i
Table 10. IT grades of height (H4) measured in the green state for the different benchmarking printed using 17-4PH and 316L.
RangeMaterialPlane 1Plane 2Plane 3Plane 4
10–2017-4PHIT11IT11IT08IT11
10–20316LIT11IT10IT10IT12
20–3017-4PHIT12IT10IT11/
20–30316LIT12IT11IT11/
30–5017-4PHIT10IT10//
30–50316LIT09IT12//
Table 11. IT grades of length (LX) measured in the green state for the different benchmarking printed using 17-4PH and 316L.
RangeMaterialPlane 1Plane 2Plane 3Plane 4
10–2017-4PHIT12IT11IT11IT11
10–20316LIT11IT11IT13IT13
20–3017-4PHIT11IT12IT10/
20–30316LIT11IT10IT10/
30–5017-4PHIT10IT09//
30–50316LIT10IT10//
Table 12. IT grades of height (H4) measured in the sintered state for the different benchmarks printed using 17-4PH and 316L.
RangeMaterialPlane 1Plane 2Plane 3Plane 4
10–2017-4PHIT10 (−1)IT10 (−1)IT13 (+5)IT13 (+2)
10–20316LIT10 (−1)IT15 (+5)IT14 (+4)IT13 (+1)
20–3017-4PHIT14 (+2)IT12 (+2)IT12 (+1)/
20–30316LIT11 (−1)IT12 (+1)IT14 (+3)/
30–5017-4PHIT13 (+3)IT13 (+3)//
30–50316LIT15 (+6)IT14 (+2)//
Table 13. IT grades of length (LX) measured in the sintered state for the different benchmarks printed using 17-4PH and 316L.
RangeMaterialPlane 1Plane 2Plane 3Plane 4
10–2017-4PHIT13 (+1)IT12 (+1)IT13 (+2)IT13 (+2)
10–20316LIT13 (+2)IT15 (+4)IT16 (+3)IT15 (+3)
20–3017-4PHIT11 (0)IT12 (0)IT12 (+2)/
20–30316LIT12 (+1)IT14 (+4)IT12 (+2)/
30–5017-4PHIT12 (+2)IT14 (+5)//
30–50316LIT13 (+3)IT15 (+5)//
Table 14. IT tolerance grades reported in the literature as a function of AM processes, materials, and feature size.
AM ProcessMachine
Manufacturer
MachineMaterialDimensional Interval [mm]Reference
<1010–2020–3030–50
BJ (green)Z-CorpZ400ZP14 (starch-based powder)/IT14-IT15IT14IT09-IT14[27]
Z-CorpZ400ZP100 (plaster-based powder)/IT14-IT15IT13-IT14IT09-IT14[27]
BJ (sintered)ExOneInnovent+17-4PHIT14-IT16///[29]
Digital MetalDM P250017-4PHIT13-IT14///[29]
L-PBFEOSEOSINT
M270
Ti6AlV4IT12-IT13IT12-IT13IT12-IT13IT12-IT13[24]
RenishawAM250IN728Medium-coarse 1Medium-coarse//[26]
SLM250HLTi6Al4VFine///[26]
SLM SolutionsSLM280 2.0 Twin17-4PHIT14-IT16///[29]
EOSM29017-4PHIT14-IT17///[29]
EBMArcam ABA2XTi6Al4VIT15IT13-IT14IT13-IT14IT14-IT15[24]
ArcamA2XTi-5553Coarse///[26]
LMDLasertecLasertec 65IN728Coarse///[26]
DLMSEOSINTM270AlSi10MgIT10-IT14///[56]
DEDPrima
Additive
Laserdyne
430 system
316L/IT16IT16/[25]
1. According to ISO 2768-1 [57].
Table 15. Tolerance range function of dimensional interval and process capability level (Cpk) in MIM.
Dimension Range [mm]Tolerance Range for
No CpkCpk = 1.33Cpk = 2.00
3–61.7%2.9%4.1%
6–501.6%2.8%4.0%
Table 16. Relative density of 316L in the green and sintered states.
Building
Plane
RD Green [%]RD Sintered [%]
Range 10–20Range 20–30Range 30–50Range 10–20Range 20–30Range 30–50
157.89 ± 0.6558.49 ± 0.3058.90 ± 0.5299.30 ± 0.0998.39 ± 0.2295.27 ± 0.68
257.89 ± 0.5758.43 ± 0.4858.67 ± 0.4799.19 ± 0.0998.59 ± 0.3997.40 ± 0.79
357.40 ± 0.5855.88 ± 0.50/99.11 ± 0.1098.83 ± 0.34/
457.05 ± 0.67//99.07 ± 0.06//
Table 17. Relative density of 17-4PH in the green and sintered states.
Building
Plane
RD Green [%]RD Sintered [%]
Range 10–20Range 20–30Range 30–50Range 10–20Range 20–30Range 30–50
156.94 ± 0.3755.25 ± 0.2156.43 ± 0.4298.27 ± 0.2198.34 ± 0.1098.14 ± 0.18
256.38 ± 0.5855.22 ± 0.3256.63 ± 0.6098.21 ± 0.1698.13 ± 0.1998.12 ± 0.32
354.82 ± 0.7956.04 ± 0.25/98.22 ± 0.1298.06 ± 0.12/
454.59 ± 0.71//98.21 ± 0.13//
Disclaimer/Publisher’s Note: The statements, opinions and data contained in all publications are solely those of the individual author(s) and contributor(s) and not of MDPI and/or the editor(s). MDPI and/or the editor(s) disclaim responsibility for any injury to people or property resulting from any ideas, methods, instructions or products referred to in the content.