Article

Effect of Electrically Assisted Heat Treatment on Crack Arrest and Healing in Laser-Cladded Ni–Based Coatings

1
School of Mechanical Engineering, Xinjiang University, Urumqi 830017, China
2
School of Materials Science and Engineering, Xinjiang University, Urumqi 830017, China
*
Author to whom correspondence should be addressed.
J. Manuf. Mater. Process. 2025, 9(11), 348; https://doi.org/10.3390/jmmp9110348
Submission received: 11 September 2025 / Revised: 5 October 2025 / Accepted: 17 October 2025 / Published: 23 October 2025

Abstract

Cracks in laser-cladded coatings represent a critical challenge that severely limits their industrial deployment. In this study, high-frequency pulsed direct current-assisted electrically assisted heat treatment (EAHT) was applied to repair cracks in laser-cladded Ni60/WC coatings deposited on 45# medium carbon steel. The influence of current density and treatment duration on crack arrest and healing behavior was systematically investigated. Dye penetrant testing and scanning electron microscopy (SEM) were employed to characterize the morphology and evolution of cracks before and after EAHT, while hardness, fracture toughness, and wear resistance tests were conducted to evaluate the mechanical properties. The results revealed that the crack repair process proceeds through three distinct stages: internal filling, nucleation and growth of healing points, and complete crack closure. The combined effects of Joule heating and current crowding induced by EAHT significantly facilitated progressive crack healing from the bottom upward. Optimal crack arrest and healing were achieved at a current density of 6.25 A/mm2, resulting in a maximum fracture toughness of 10.74 MPa·m1/2 and a transition of the wear mechanism from spalling to abrasive wear. This study demonstrates that EAHT promotes selective crack-tip heating and microstructural regulation through thermo-electro-mechanical coupling, thereby markedly enhancing the comprehensive performance of Ni-based WC coatings.

1. Introduction

Laser cladding technology, as an advanced surface modification technique, has demonstrated remarkable advantages in enhancing surface properties of substrate materials while simultaneously reducing production costs [1,2,3]. However, this process is frequently accompanied by the formation of various defects, particularly porosity and cracking within the coating layer. Among these issues, coating cracking represents a critical challenge that significantly impedes the further development and practical application of laser cladding technology in industrial settings [4,5,6].
Extensive research efforts have been devoted to addressing crack formation in laser cladding coatings, primarily focusing on four strategic approaches: crack mechanism analysis, process parameter optimization, cladding material modification, and external field assistance [7,8,9,10]. Significant progress has been demonstrated through various experimental studies. Ali et al. [11] conducted a systematic investigation into the correlation between laser processing parameters and crack formation mechanisms in cladding coatings. In a separate study, Sadhu et al. [12] achieved crack-free coatings by implementing preheating strategies and precise temperature gradient control, which effectively reduced the cooling rate during the cladding process. Qi et al. [13] successfully developed high-performance coatings with significantly reduced crack susceptibility through the innovative incorporation of ZrW2O8 additives into the cladding material. Furthermore, Wang et al. [14] demonstrated substantial improvements in coating quality by introducing an electromagnetic composite field during the laser cladding process, resulting in enhanced mechanical properties and markedly reduced crack density. Shen et al. [15] employed a combined process of in situ temperature field assistance and post-laser remelting, which effectively suppressed cracks and elucidated the dominant role of fine carbides on hardness; Hu et al. [16] utilized high-speed laser cladding technology to alleviate WC decomposition and segregation, systematically studying the effect of WC content on microstructure and wear resistance. However, these advanced techniques primarily focus on “preventing” crack formation from the process source.
Recent investigations into crack arrest and healing mechanisms have predominantly concentrated on single plate cracks, employing various methodologies including pulsed current application, dynamic loading, and thermal treatment in heating ovens [17,18,19,20]. Notably, Xin et al. [21] conducted a comprehensive study involving artificially induced internal cracks in steel samples, demonstrating successful crack healing through thermal treatment in a box-type resistance furnace, which subsequently enhanced the ultimate tensile strength of the crack-healing zone. In a parallel investigation, Wang et al. [22] achieved significant crack healing in surface cracks of Ni-based alloy GH4169 through the synergistic application of compressive load and pulsed current. These studies collectively indicate that effective crack arrest can be accomplished through both pulsed current treatment and resistance furnace heating. However, studies on the application of this method to crack arrest in laser cladding coatings are relatively rare.
In conclusion, this study focuses on the cracking of laser cladding coatings after laser cladding. The electrically assisted heat treatment (EAHT) of Ni-based WC coatings for a fixed duration with different current densities, as well as with a fixed current density for different durations, was conducted via high-frequency pulsed direct current. The effect of crack arrest was analyzed by combining the results of the dye penetration test with the crack arrest and healing laws and their influences on the mechanical properties of the coatings after EAHT.

2. Materials and Methods

2.1. Materials and Laser Cladding

This study focused on the fabrication of Ni60/WC composite coatings only on the longitudinal centerline region (dimension: 10 mm × 30 mm) of 45# medium carbon steel substrates (160 mm × 40 mm × 8 mm) through laser cladding technology. The chemical compositions of the substrate material (45# medium carbon steel) and Ni60 powder are presented in Table 1 and Table 2, respectively. The Ni60/WC composite powder was prepared with a weight ratio of 8.5:1.5. Prior to the laser cladding process, the powder mixture underwent homogenization using a planetary ball mill (KQM–Z/B, Xianyang Jinhong General Machinery Co., Xianyang, China) operated at 300 rad/min for 4 h, followed by thermal treatment in an electric thermostatic (101–3EBS, Changge Mingtu Mechanical Equipment Co., Changge, China) drying oven at 200 °C for 3 h to ensure optimal powder characteristics. The coatings were deposited using a fiber laser (ZKZM–2000, Xi’an Zhongkezhongmei Laser Technology Co., Xi’an, China) with a coaxial synchronous powder feeding system. The laser beam performed reciprocating scanning along the substrate’s width direction (40 mm dimension) for multi-track overlapping deposition, with the entire cladding area strictly aligned to the substrate’s transverse centerline. The optimized process parameters were as follows: under the following optimized parameters: laser power of 1000 W, scanning speed of 4 mm∙s−1, powder feeding rate of 3.0 g∙min−1, and an overlapping rate of 40%. Throughout the process, high-purity argon (99%) was employed as the protective gas to prevent oxidation and ensure coating quality.

2.2. EAHT Experiments

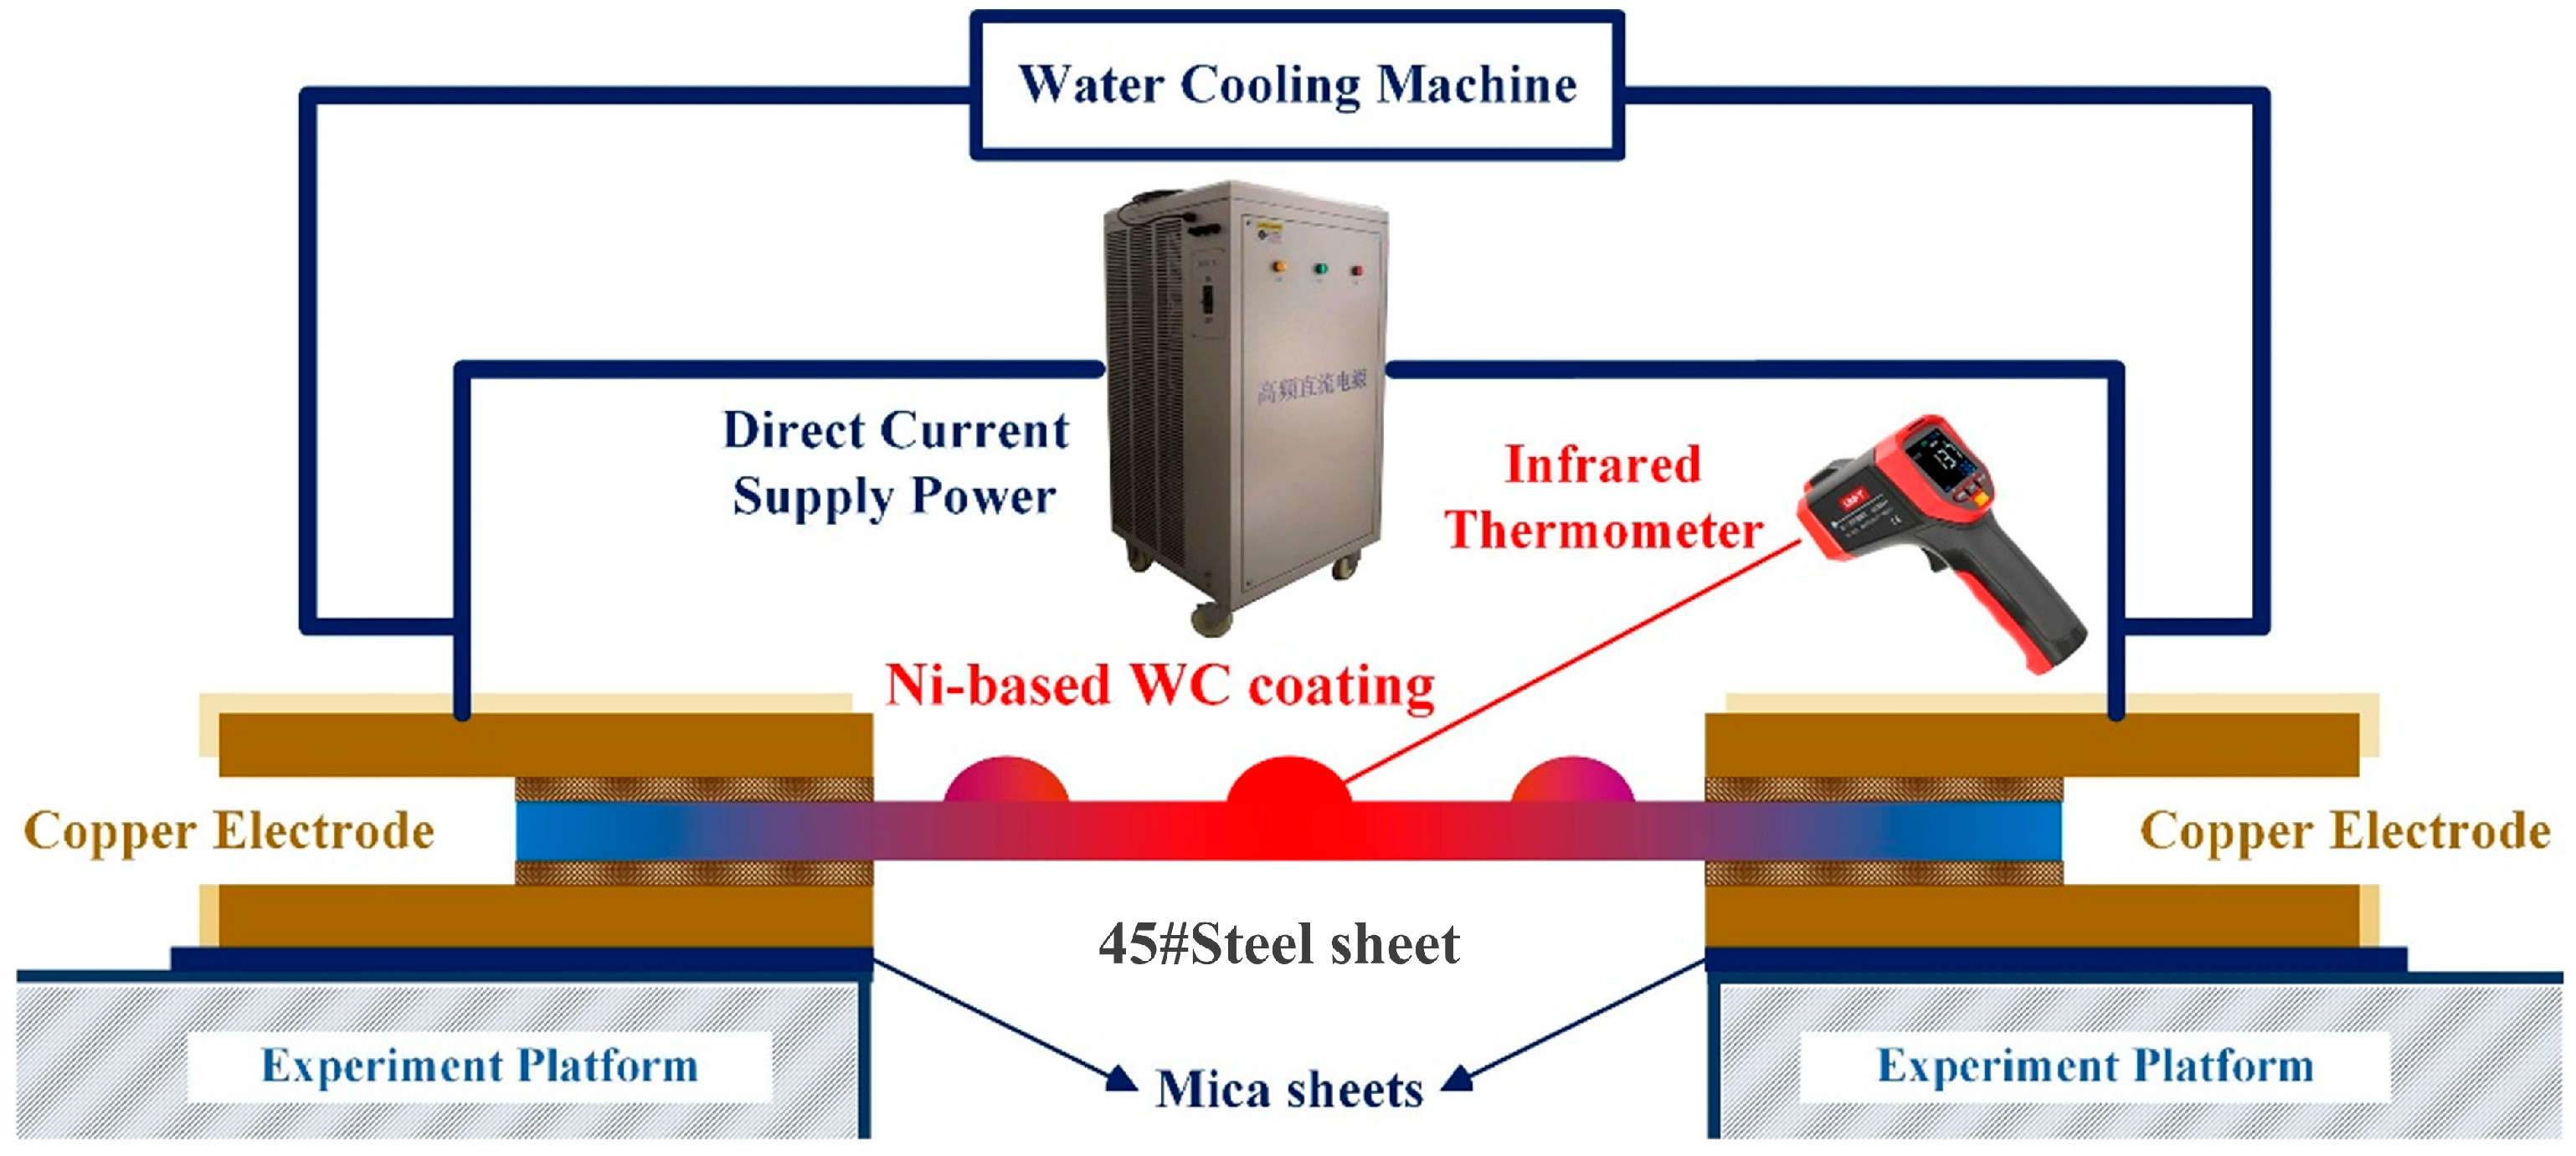
The Ni60/WC coatings on the 45# medium carbon steel substrates used in this EAHT experiment had been previously fabricated via the laser cladding process described in Section 2.1. Figure 1 illustrates the schematic diagram of the experimental setup for electro-thermal healing treatment (EAHT, TS–FGZD–10000A12V, Tianshun Electromechanical Equipment Co., Dongguan, China), incorporating a power supply operating at a fixed frequency of 30 kHz. Seven EAHT parameter sets were designed, each of which was applied to a separate one of seven independent Ni60/WC-coated specimens; the specific parameters are detailed in Table 3. The experimental procedure was conducted as follows: Initially, the 45# medium carbon steel substrate with Ni60/WC coating was securely mounted using a specialized fixture, as shown in Figure 1. Subsequently, the predetermined electric current density was applied according to the parameters specified in Table 3. Following a 5 min stabilization period after reaching the target current density, the EAHT duration commenced. Upon completion of the treatment, the power supply was disconnected, and the sample was allowed to cool naturally to ambient temperature under atmospheric conditions.

2.3. Coating Characterization

The surface cracks of the laser-clad coatings before and after heat treatment were examined using a dye penetrant inspection (DPI, DPT–5, Shanghai Xinmeida NDT Equipment Co., Shanghai, China). A total of 8 specimens were used, including 1 original specimen (control group, no EAHT) and 7 EAHT-treated specimens (each corresponding to one parameter set in Table 3, grouped by EAHT variables). Each group (one specimen) was evaluated in triplicate by testing three typical regions on the specimen surface; the crack area fraction was then quantified by Image J software (Version 1.53e), and the mean value was taken as the effective crack density. After heat treatment, the samples were sectioned into test blocks of 10 mm × 10 mm × 8 mm using an electrical discharge machine (XKG–2008, Suzhou Baoma CNC Equipment Co., Suzhou, China). Cross-sectional surfaces were progressively ground with 400~2000 grit sandpaper, polished with diamond paste (particle sizes: 1 μm~0.25 μm) and a 0.04 μm silica suspension to achieve a mirror finish. Subsequently, the samples were ultrasonically cleaned in alcohol using an ultrasonic cleaner (CR–100S, Shenzhen Chunlin Cleaning Equipment Co., Shenzhen, China) to remove any residual abrasives. Finally, the specimen cross-section was etched with aqua regia (HNO3:HCl = 1:3 by volume). Phase composition was analyzed by X–ray diffraction (XRD, SmartLab, Rigaku Corporation, Tokyo, Japan) using Cu–Kα radiation (λ = 1.5406 Å) operated at 40 kV and 40 mA, with data collected over a 2θ range of 20°~80° at a step size of 0.01° and a scanning rate of 4° min−1. The cross-sectional microstructure, crack-healing zones, and elemental distribution of post-treated coatings were characterized using field-emission scanning electron microscopy (SEM, ZEISS Sigma 300, Carl Zeiss AG, Jena, Germany) coupled with energy-dispersive spectroscopy (EDS). Additionally, electron backscatter diffraction (EBSD) was used to analyze the crystal orientation and phase distribution of the coatings.
The microhardness distribution near the crack was measured using a Vickers microhardness tester (HV–1000Z, Shanghai Bangyi Precision Instruments Co., Shanghai, China) with a test load of 200 g (1.96 N) and a dwell time of 10 s. For each selected crack, three parallel measurement lines were placed on each side along the crack direction at 0.1 mm intervals. Indentations were made at 0.1 mm intervals from the crack tip, with three indentations per line, resulting in a total of six lines and eighteen indentations (18 data points). The maximum (Hmax) and average hardness (Hav) were taken as the maximum and average values of the 18 measurement points, respectively. The hardness concentration coefficient, Kh, was then calculated according to Equation (1).
K h = H m a x H a v
The surface fracture toughness of the coatings before and after EAHT was evaluated using an micro-scratch tester (MST3–30, Anton Paar, Graz, Austria). The tests were performed on the polished surface using the progressive load method, with a constant load of 20 N, a scratch speed of 2 mm·min−1, and a scratch length of 1 mm. For each coating type, three independent scratch tests were conducted, and the fracture toughness was calculated according to Equation (2) [23]:
K IC = F T ( 2 pA ) 1 2
where FT is the tangential friction force of the indenter; p is the projected perimeter of contact area in the sliding direction; A is the projected area of the indenter on the scratch surface; 2pA is the shape function of the indenter.
The wear resistance of the coatings was assessed using a multifunctional tribometer (MFT–5000, Rtec Instruments, San Jose, CA, USA) in a reciprocating ball-on-disk configuration, with a 6 mm diameter Si3N4 ceramic ball as the counterface. The tests were conducted on polished and cleaned coatings under the following conditions: applied load of 60 N, frequency of 2 Hz (sliding speed of 40 mm·s−1), stroke length of 10 mm, and duration of 20 min, resulting in a total sliding distance of 48 m. Each condition was repeated three times. The wear resistance (expressed as the reciprocal of the wear rate, ω−1) was analyzed in conjunction with wear track morphology, Vickers hardness, and fracture toughness. The wear rate, ω, was defined as the ratio of weight loss to the total sliding distance.

3. Results and Discussion

3.1. Temperature Distribution of the EAHT

To clarify EAHT temperature variation and specimens’ thermal response under different current densities, Figure 2 provides a schematic of the EAHT process and thermal images for various current densities. The yellow zone in Figure 2e is the temperature measurement point. Figure 2 shows that when the EAHT is carried out, the temperature of the sample changes with the passage of electricity. The white part in the thermal image is the highest temperature point, i.e., the Ni60/WC coating part that was pre-fabricated only on the central region (10 mm × 30 mm) of the steel plate (consistent with the coating location specified in Section 2.1). The reason for this is that the coating includes defects such as covalent bonding compounds, cracks and holes, which result in a higher electrical resistance than that in the nondefective zones, resulting in a higher electrical resistance of the coated material compared to the substrate, and at the same time, a higher temperature.
To elucidate the temperature distribution and crack arrest mechanism inside the coating during EAHT, finite element analysis was performed using ANSYS (Version 2021 R1) based on experimental conditions and relevant literature [24,25]. A 45# medium carbon steel model with dimensions of 80 mm × 40 mm × 3 mm (mesh size: 1 mm) was established, as shown in Figure 3. The crack morphology was simplified, based on preliminary experiments: post-laser cladding Ni60/WC coating characterizations showed cracks have regular features (through-thickness, adjacent pores, bifurcated tips), as shown in Figure 3a, and these features were retained in the simulation.
A current of 1000 A was applied at one end of the model, with the opposite end grounded (0 A). Convective heat transfer boundary conditions were set (film coefficient: 0.0001 W/(mm2·°C), emissivity: 0.93), as illustrated in Figure 3b. Due to the current crowding effect, the electric current forms high-density accumulations at the crack tips (Figure 3d), thereby generating significant Joule heating. This further leads to localized high-temperature zones at the crack tips (Figure 3c), which is consistent with the high-temperature distribution patterns observed in the coating region during experiments (Figure 2a–d).

3.2. Surface Cracking of the Coatings Before and After EAHT

Figure 4 presents the dye penetrant test results for coatings treated with different electric current densities for a fixed duration of 2.0 h (corresponding to specimens EH–1, EH–2, EH–3, and EH–7 from Table 3), allowing for the analysis of current density influence. The specimen EH–3 (2.0 h, 6.25 A/mm2), a common reference point in both figures, showed the most significant decrease in crack rate in Figure 4. The dye penetrant test results were calculated by ImageJ software (Version 1.53e), which revealed that the cracking rate decreased by 2.27% for EH–1, 5.27% for EH–2, and 8.63% for EH–3. However, melting of the coating occurred during the EAHT of EH–7, and the length of the coating was shortened to approximately 1/2 that of the original sample after the EAHT was completed. The reason is that with increasing time, the heat that has accumulated inside the coating causes its internal temperature to approach its melting point, which leads to the melting of the coating. Since the coating had lost its original structural integrity due to melting, dye penetrant testing (DPI) for crack detection was no longer meaningful—thus, no post-EAHT crack rate data was provided for EH–7 in Figure 4e.
Figure 5 presents the results for coatings treated at a fixed current density of 6.25 A/mm2 for varying durations (corresponding to specimens EH–3, EH–4, EH–5, and EH–6 from Table 3), allowing for the analysis of treatment time influence. Figure 5 shows that the crack rate of EH–5 is reduced most significantly. Using ImageJ software to calculate the dye penetrant test results, the EH–3 crack rate decreased by 8.63%, the EH–4 crack rate decreased by 19.793%, the EH–5 crack rate decreased by 36.32%, and the EH–6 crack rate decreased by 26.273%.

3.3. Crack Arrest and Healing Micromorphology and Analysis

The effects of current-assisted heat treatment on crack arrest and healing need further investigation. Thus, SEM observations were conducted to analyze the processes of crack healing and internal crack filling and the effectiveness of crack arrest. The EH–4 sample (Table 3) treated with current-assisted heat treatment demonstrated the most prominent characteristics of crack healing. Therefore, subsequent analysis of crack healing was performed on this sample.

3.3.1. Coating and Microstructure near the Cracks

Figure 6a presents a backscattered electron (BSE) image of the crack healing zone of the EH–4 sample. Although the coating has good densification, its black dot-like pores are concentrated around the cracks. These pores are likely caused by gas entrapment during the solidification of the melt pool. Furthermore, although these pores reduced the EBSD resolution, the key phase distributions are clearly identifiable. The XRD pattern (Figure 6) reveals that the coating is primarily composed of γ–(Ni, Fe), W2C, WC, and Cr3C2 phases. The presence of secondary carbide phases such as W2C and Cr3C2 is attributed to the decarburization reaction of WC (2WC → W2C + C) and elemental diffusion induced by the local high temperature during EAHT [15,16]. The γ–(Ni, Fe) phase acts as the matrix and provides toughness to arrest crack propagation, and the WC/W2C hard phases act as “pins” to hinder crack penetration. EDS mapping (Figure 6c,d) reveals that Ni and Fe are primarily concentrated in the γ–(Ni, Fe) phase and are uniformly distributed in the crack healing zone. This configuration ensures the toughness and energy absorption capacity of the bonding phase. In particular, under impact loading, this distribution helps absorb and dissipate energy to effectively buffer the external stress and hinder crack propagation. This phenomenon contributes to crack arrest while preventing crack regeneration. The EBSD phase distribution map is shown in Figure 6e, and the inverse pole figure (IPF) is shown in Figure 6f. The γ–(Ni, Fe) phase forms a continuous network, with hard phases dispersed within it. Near the cracks, the γ–(Ni, Fe) grains are coarse and have high or randomly orientated dispersion. During crack propagation, the crack encounters high-angle grain boundaries, which causes it to either bifurcate or arrest. The dispersed WC/W2C hard phases act as crystallographic pinning sites that branch the crack path and dissipate energy during crack propagation. Furthermore, current-assisted heat treatment accelerated Cr diffusion, and Cr3C2 carbides formed at the grain boundaries. These Cr-rich carbides pin the grain boundaries and suppress intergranular crack propagation, which can block potential crack regeneration paths.
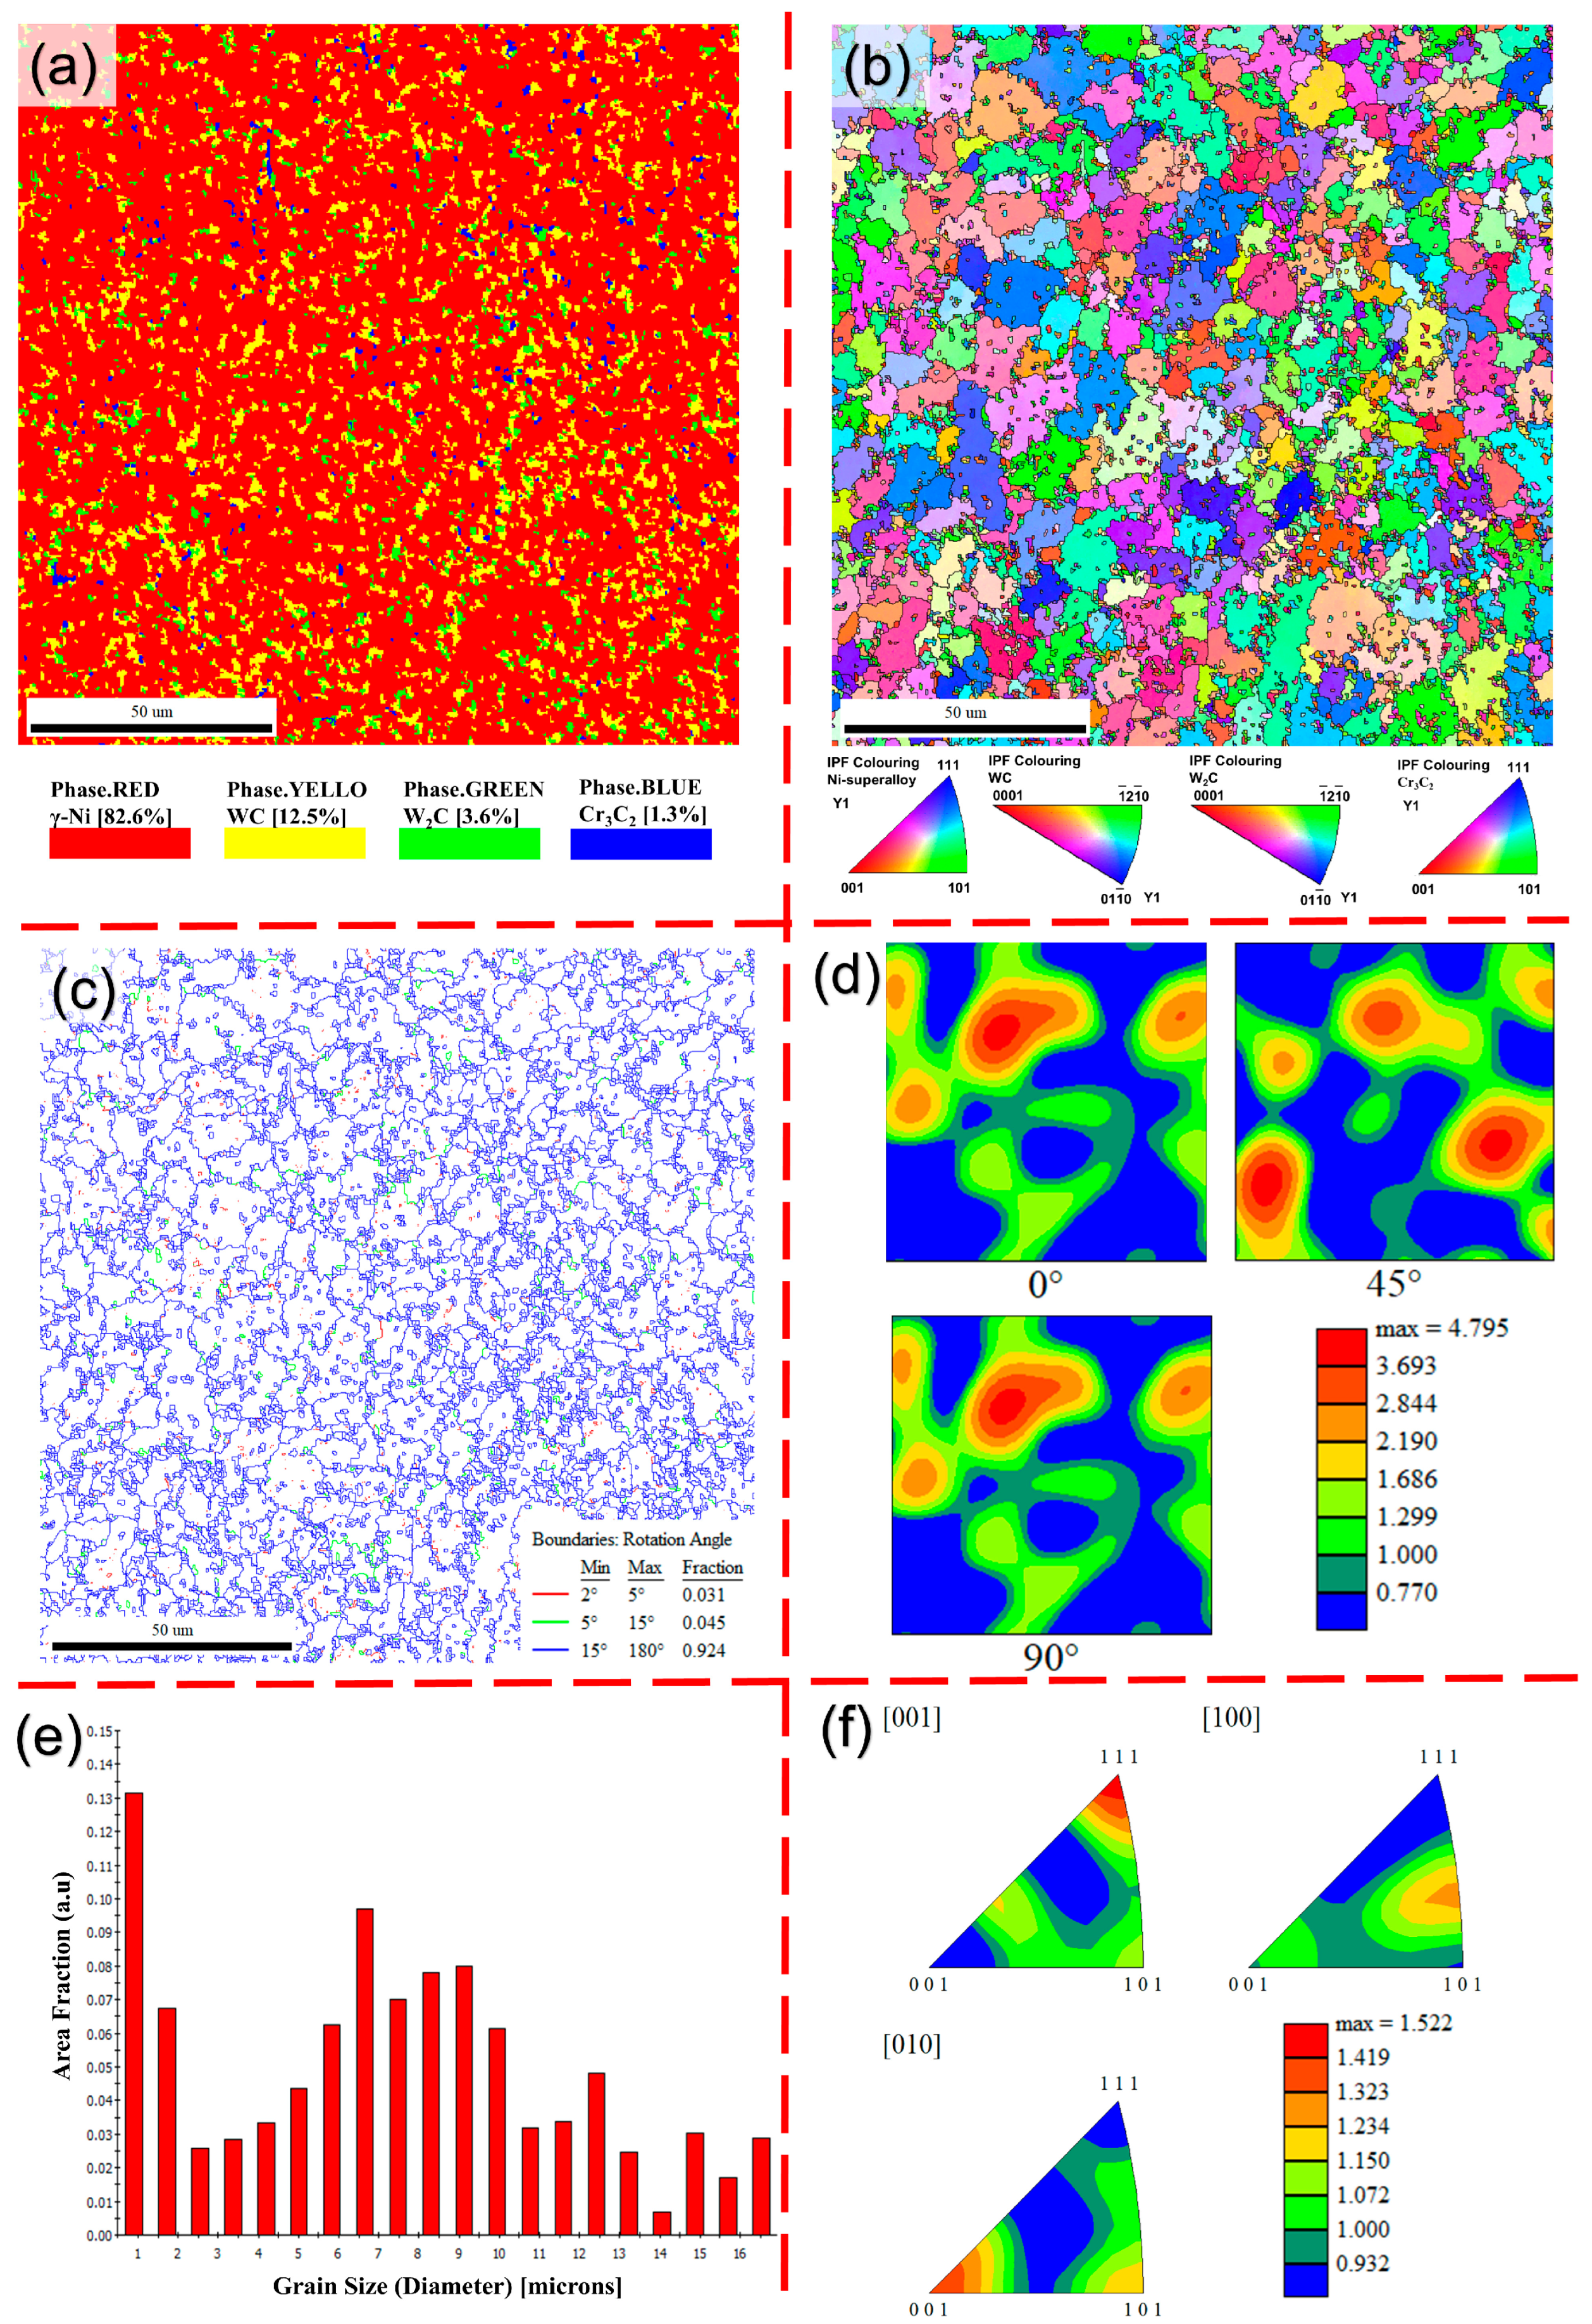
EBSD analysis was subsequently performed on the area far from the cracks to further explore the regulatory effects of the current-assisted heat treatment on the defect-free regions (Figure 7). The phase distribution map is shown in Figure 7a. In the crack-free region, the γ–(Ni, Fe) phase is continuously distributed, and the WC, W2C, and Cr3C2 hard phases are uniformly dispersed. The interparticle distance of the WC phases is reduced, and this uniform distribution provides an effective “pinning field” for grain refinement. The results of the grain boundary misorientation analysis are shown in Figure 7c. The proportion of high-angle grain boundaries at 15–180° is 92.4% at the maximum, and the grain boundary network tends to be configured toward “high resistance,” which is a result of the synergistic effect of hard phases inhibiting grain growth and Cr3C2 carbides pinning the boundaries. The grain size distribution shown in Figure 7e further confirms this refinement effect. The average grain size in the defect-free region is relatively small (5.96 μm), and fine grains (<5 μm) accounting for 25% of the area. The results of the texture analysis are shown in Figure 7d,f. The γ–(Ni, Fe) phase has high orientation dispersion. The combination of high-angle grain boundaries and random orientations increases the crack propagation resistance. These results suggest that current-assisted heat treatment not only significantly improves crack arrest in cracked regions (Figure 6), but also enhances the crack resistance of the coating in defect-free regions via grain refinement and a weak texture configuration induced by the uniform dispersion of hard phases.
These characterizations demonstrate that current-assisted heat treatment facilitates crack arrest via three synergistic mechanisms: (a) the toughness of the γ–(Ni, Fe) matrix absorbs crack propagation energy; (b) decarburization products, such as W2C and Cr3C2, form a hard crack-resistant barrier; and (c) high-angle grain boundaries at the crystallographic level increase the crack propagation path or surface area (Equation (3)). The microstructural characterization results of the coatings near and far from the cracks (Figure 6 and Figure 7) confirm the significant effect of the current-assisted heat treatment on crack arrest.

3.3.2. The Crack Healing Zone and Microstructure Around the Crack

Some studies [26,27] have reported that thermoelastic compressive stress helps achieve crack healing. Owing to the presence of cracks, EAHT generates local high temperatures at the crack tip accompanied by uneven thermal expansion, leaving the crack zone in compression. In addition, owing to the irregularity of the crack shape, the narrower part of the crack preferentially generates a healing point. To observe the crack healing of the coating after EAHT, secondary–electrons SEM was used to characterize the crack healing in EH–4. Figure 8 shows that several healing points were created between the cracks and the cracks, and the healing points were enlarged by the continuous EAHT to finally develop a healing zone.
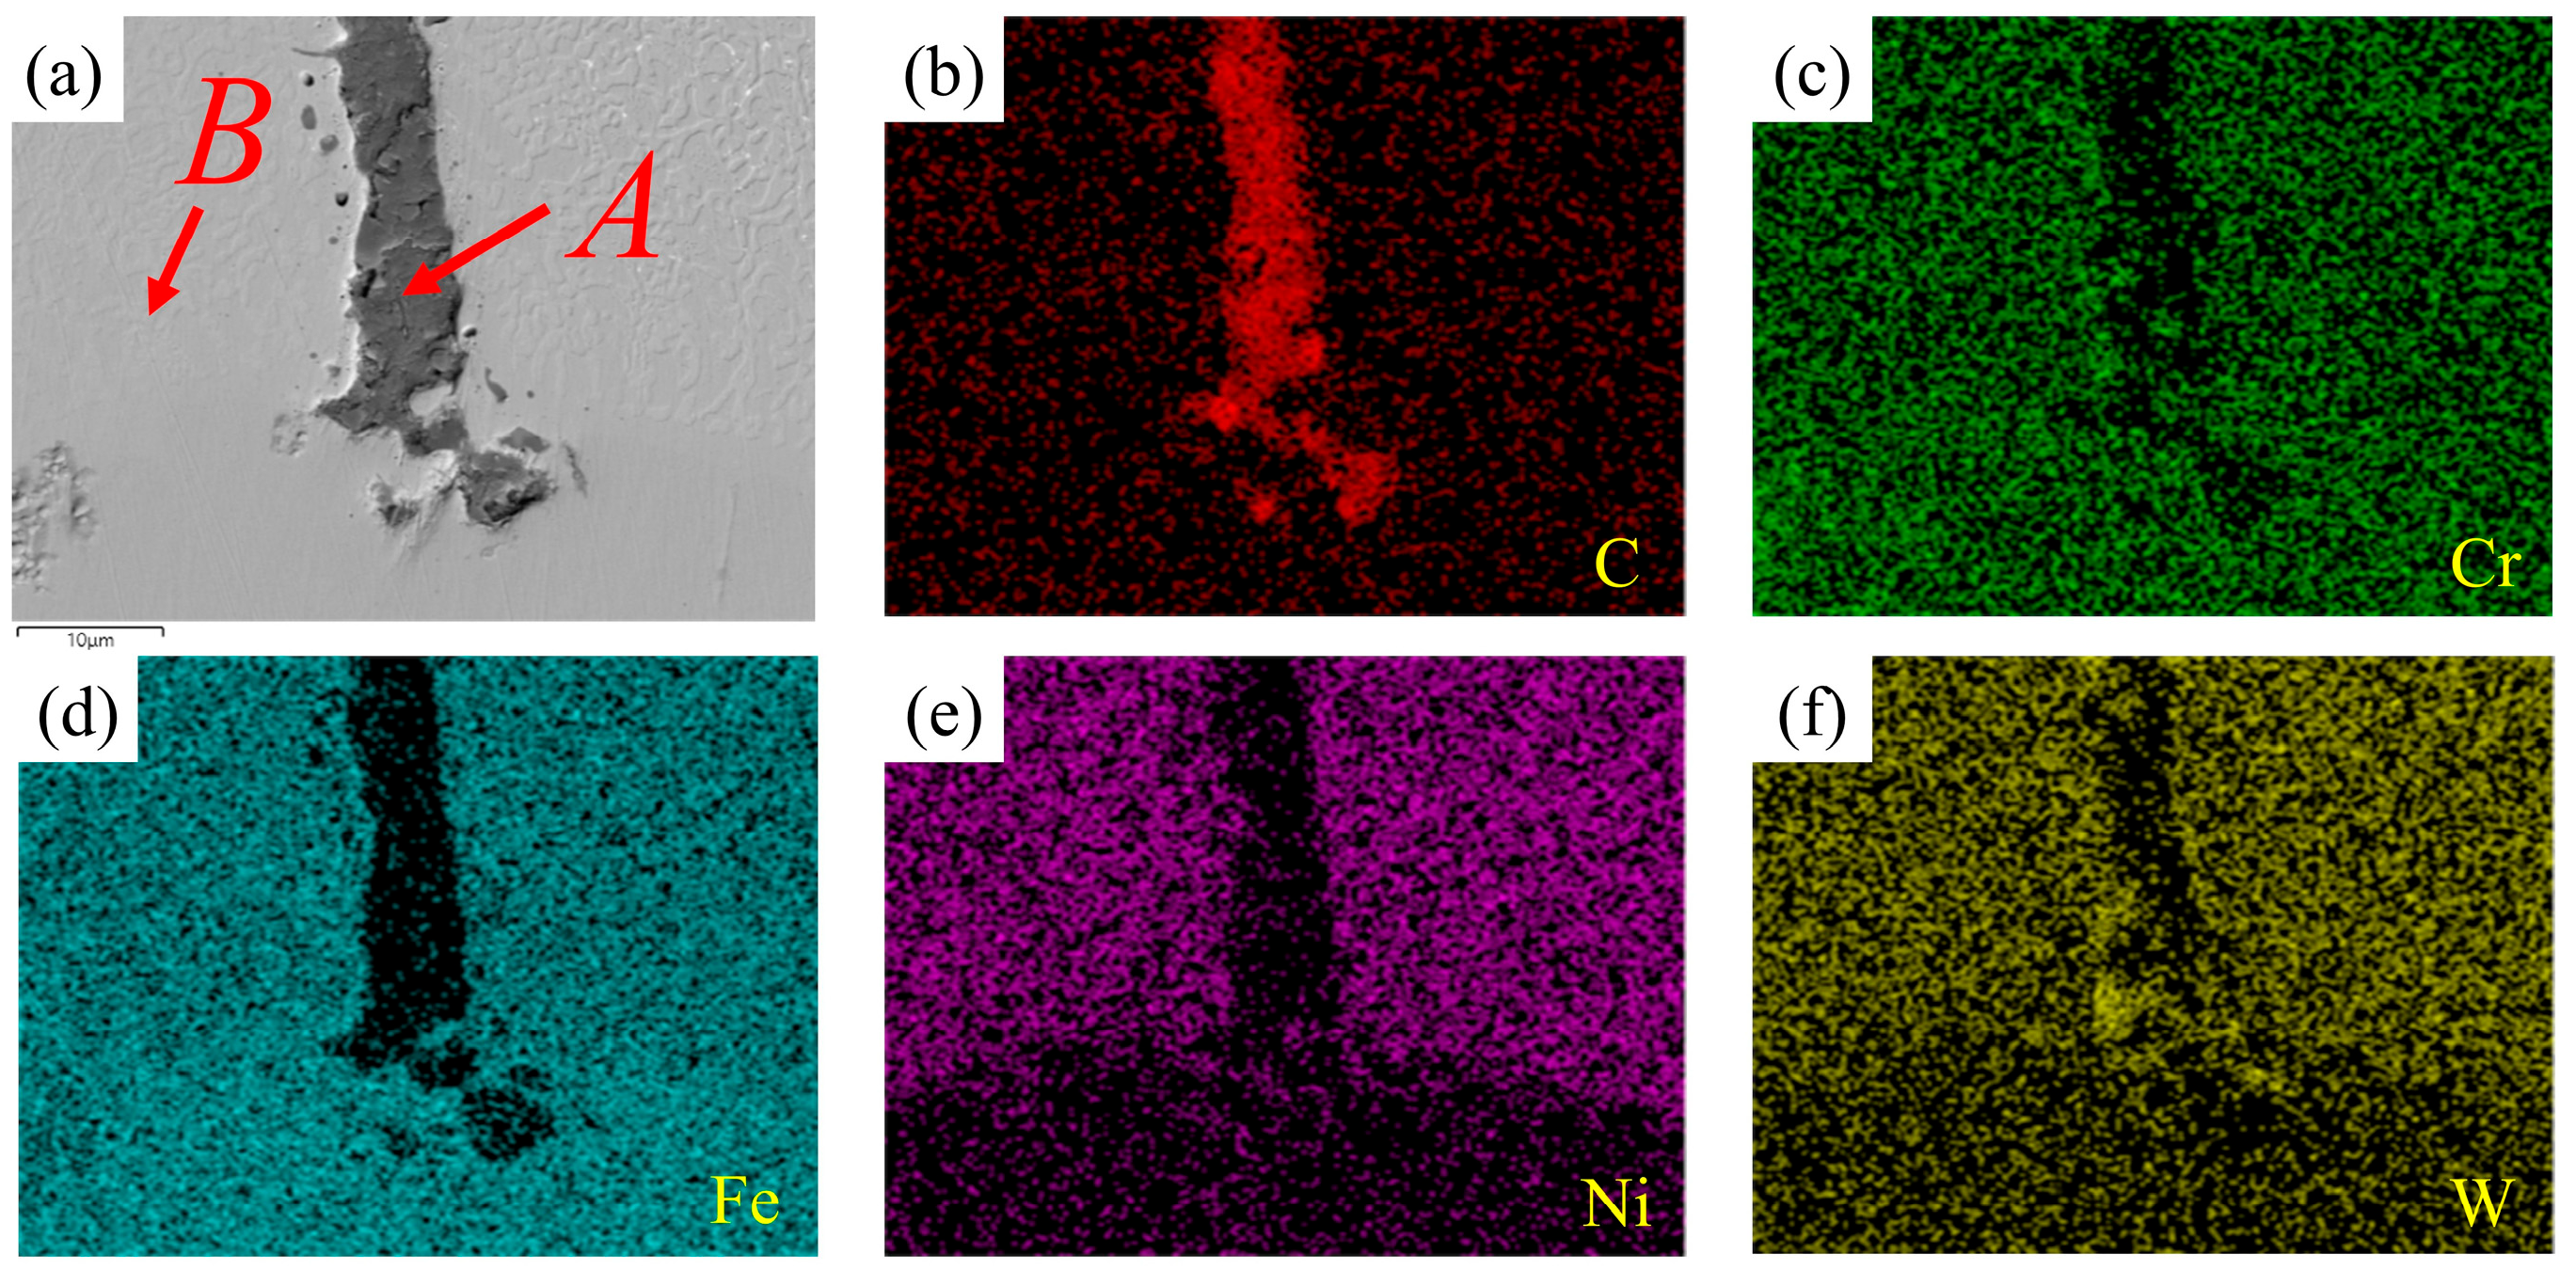
Figure 9 shows the results of the EDS surface scanning that was carried out on the cracked zone of the coating in Figure 8d, and Table 4 shows the scanning results of each point in Figure 9a. According to Figure 9 and Table 4, the dark gray phase A has a more complex chemical composition because of its proximity to the crack healing zone. This phase mainly composed of C and W atoms and small amounts of Ni, Fe and Cr atoms. The XRD results suggest that the dark gray phase A is a mixture of large amounts of carbides and small amounts of γ–(Ni, Fe). The continuous deposition of tungsten (W) at the crack tip forms a hard carbide barrier, a phenomenon closely related to the local high temperature induced by the electric current. When the current bypasses and causes a rapid temperature increase at the crack tip, the WC undergoes a decarburization reaction. The newly formed W2C phase is deposited at the crack front, and the precipitated free carbon diffuses into the crack, filling it and collectively forming a barrier that hinders crack propagation. Light gray phase B is mainly composed of Ni and Fe atoms, but it also contains a C atoms, likely due to the secondary diffusion of C atoms. The XRD results suggest that light gray phase B is mainly γ–(Ni, Fe). The bright white phase C is located between the two cracks, which affects the diffusion of the atoms, so W atoms accumulation occurs. In Table 4, the content of W atoms is as high as 35.9%, and with the XRD results, it is inferred that white phase C is a mixture of W2C and γ–(Ni, Fe). The flocculent structure D is mainly composed of three elements: Cr, Fe, and Ni. The Cr element is significantly enriched in this structure, so it is inferred to be a Ni–Cr–Fe (Cr-rich) phase. The high-temperature strength of Ni–Cr–Fe is conducive to the stability of the crack boundary region.
In conclusion, the coating cracks generate significant healing zones after EAHT. This is due to the local high temperature and thermoelastic compressive stress caused by the Joule heat effect. SEM revealed that the EAHT refined the coating microstructure. The constitutive phase in the crack–healing zones is almost the same as that in the crack–free zones, but the newly generated phase in the healing zones is larger than that in the crack–free zones. The XRD and EDS results revealed that the coating was mainly composed of γ–(Ni, Fe), Ni–Cr–Fe and W2C after EAHT.

3.3.3. Crack Filling

Figure 10 shows the laser cladding coatings with the same process parameters, Figure 10a shows the cracks without EAHT and Figure 10b shows the cracks after EAHT. A comparison of Figure 10a,b reveals that the cracks after EAHT were filled with gray substance, whereas the cracks without EAHT were hollow. A review of the literature [28,29,30] revealed that for cracks to heal and recrystallize, effective atoms must enter and fill the cracks. However, there are three main mechanisms for the effective atoms to enter the cracks as a result of Joule heat: press–fit, dislocation filling and diffusion filling. Press fit is achieved mainly by thermoelastic compressive stress.
On the other hand, the pulsed current enhances the mobility of dislocations and the diffusion of atoms. EDS surface scans and point scans were carried out at and near the crack after EAHT, and Figure 11 and Table 5 show the EDS results of the crack in Figure 10b. Figure 11 and Table 5, show that the fillers inside the crack are mainly carbides with different C contents. Gray filler A consists of two elements, a large amount of C and a small amount of Fe; the C atomic ratio is 98.2%. The gray–white phase B in the molten pool part is mainly composed of Fe and C. Furthermore, EDS point scanning analysis was performed on cracks with different degrees of healing (Figure 12 and Table 6). Under the influence of the current-assisted heat treatment, as crack healing progressed, the atomic percentage of C in the healed region decreased progressively. In the initial crack-filling region (Area A), the atomic percentage of C reached 98.2%, whereas in the fully healed crack region (Area D), the C atomic percentage was only 10.5%. This difference clearly demonstrates the correlation between the degree of healing and the atomic percentage of C. The more extensive the healing process is, the lower the atomic percentage of C. This phenomenon reflects the regular diffusion of the crack composition during the healing process.
In conclusion, in the process of EAHT, the electricity provides the energy to allow the C atoms to escape, and the free electrons continue diffusing under the action of the electric field force. The effective atoms enter the crack, while the microstructure around the crack experiences dislocation slip with the pulsed current, and with diffusion and dislocation, the crack interior is filled. The thermoelastic compressive stress narrows the crack and preferentially generates a healing point, which provides the conditions for electricity through the crack. Moreover, crack filling has a high concentration of C, which results in a great concentration difference with the C in the phase around the crack. The selective heating effect of the current generated local high temperature to provide enough thermal energy for the diffusion of C. Under the combined effect of Gibbs free energy (G) and pulsed electric current, the C element undergoes secondary diffusion at the crack healing point and solidifies in the microstructure around the crack, so the greater the degree of crack healing is the lower the content of C element at the crack.

3.3.4. Crack Tip Profile

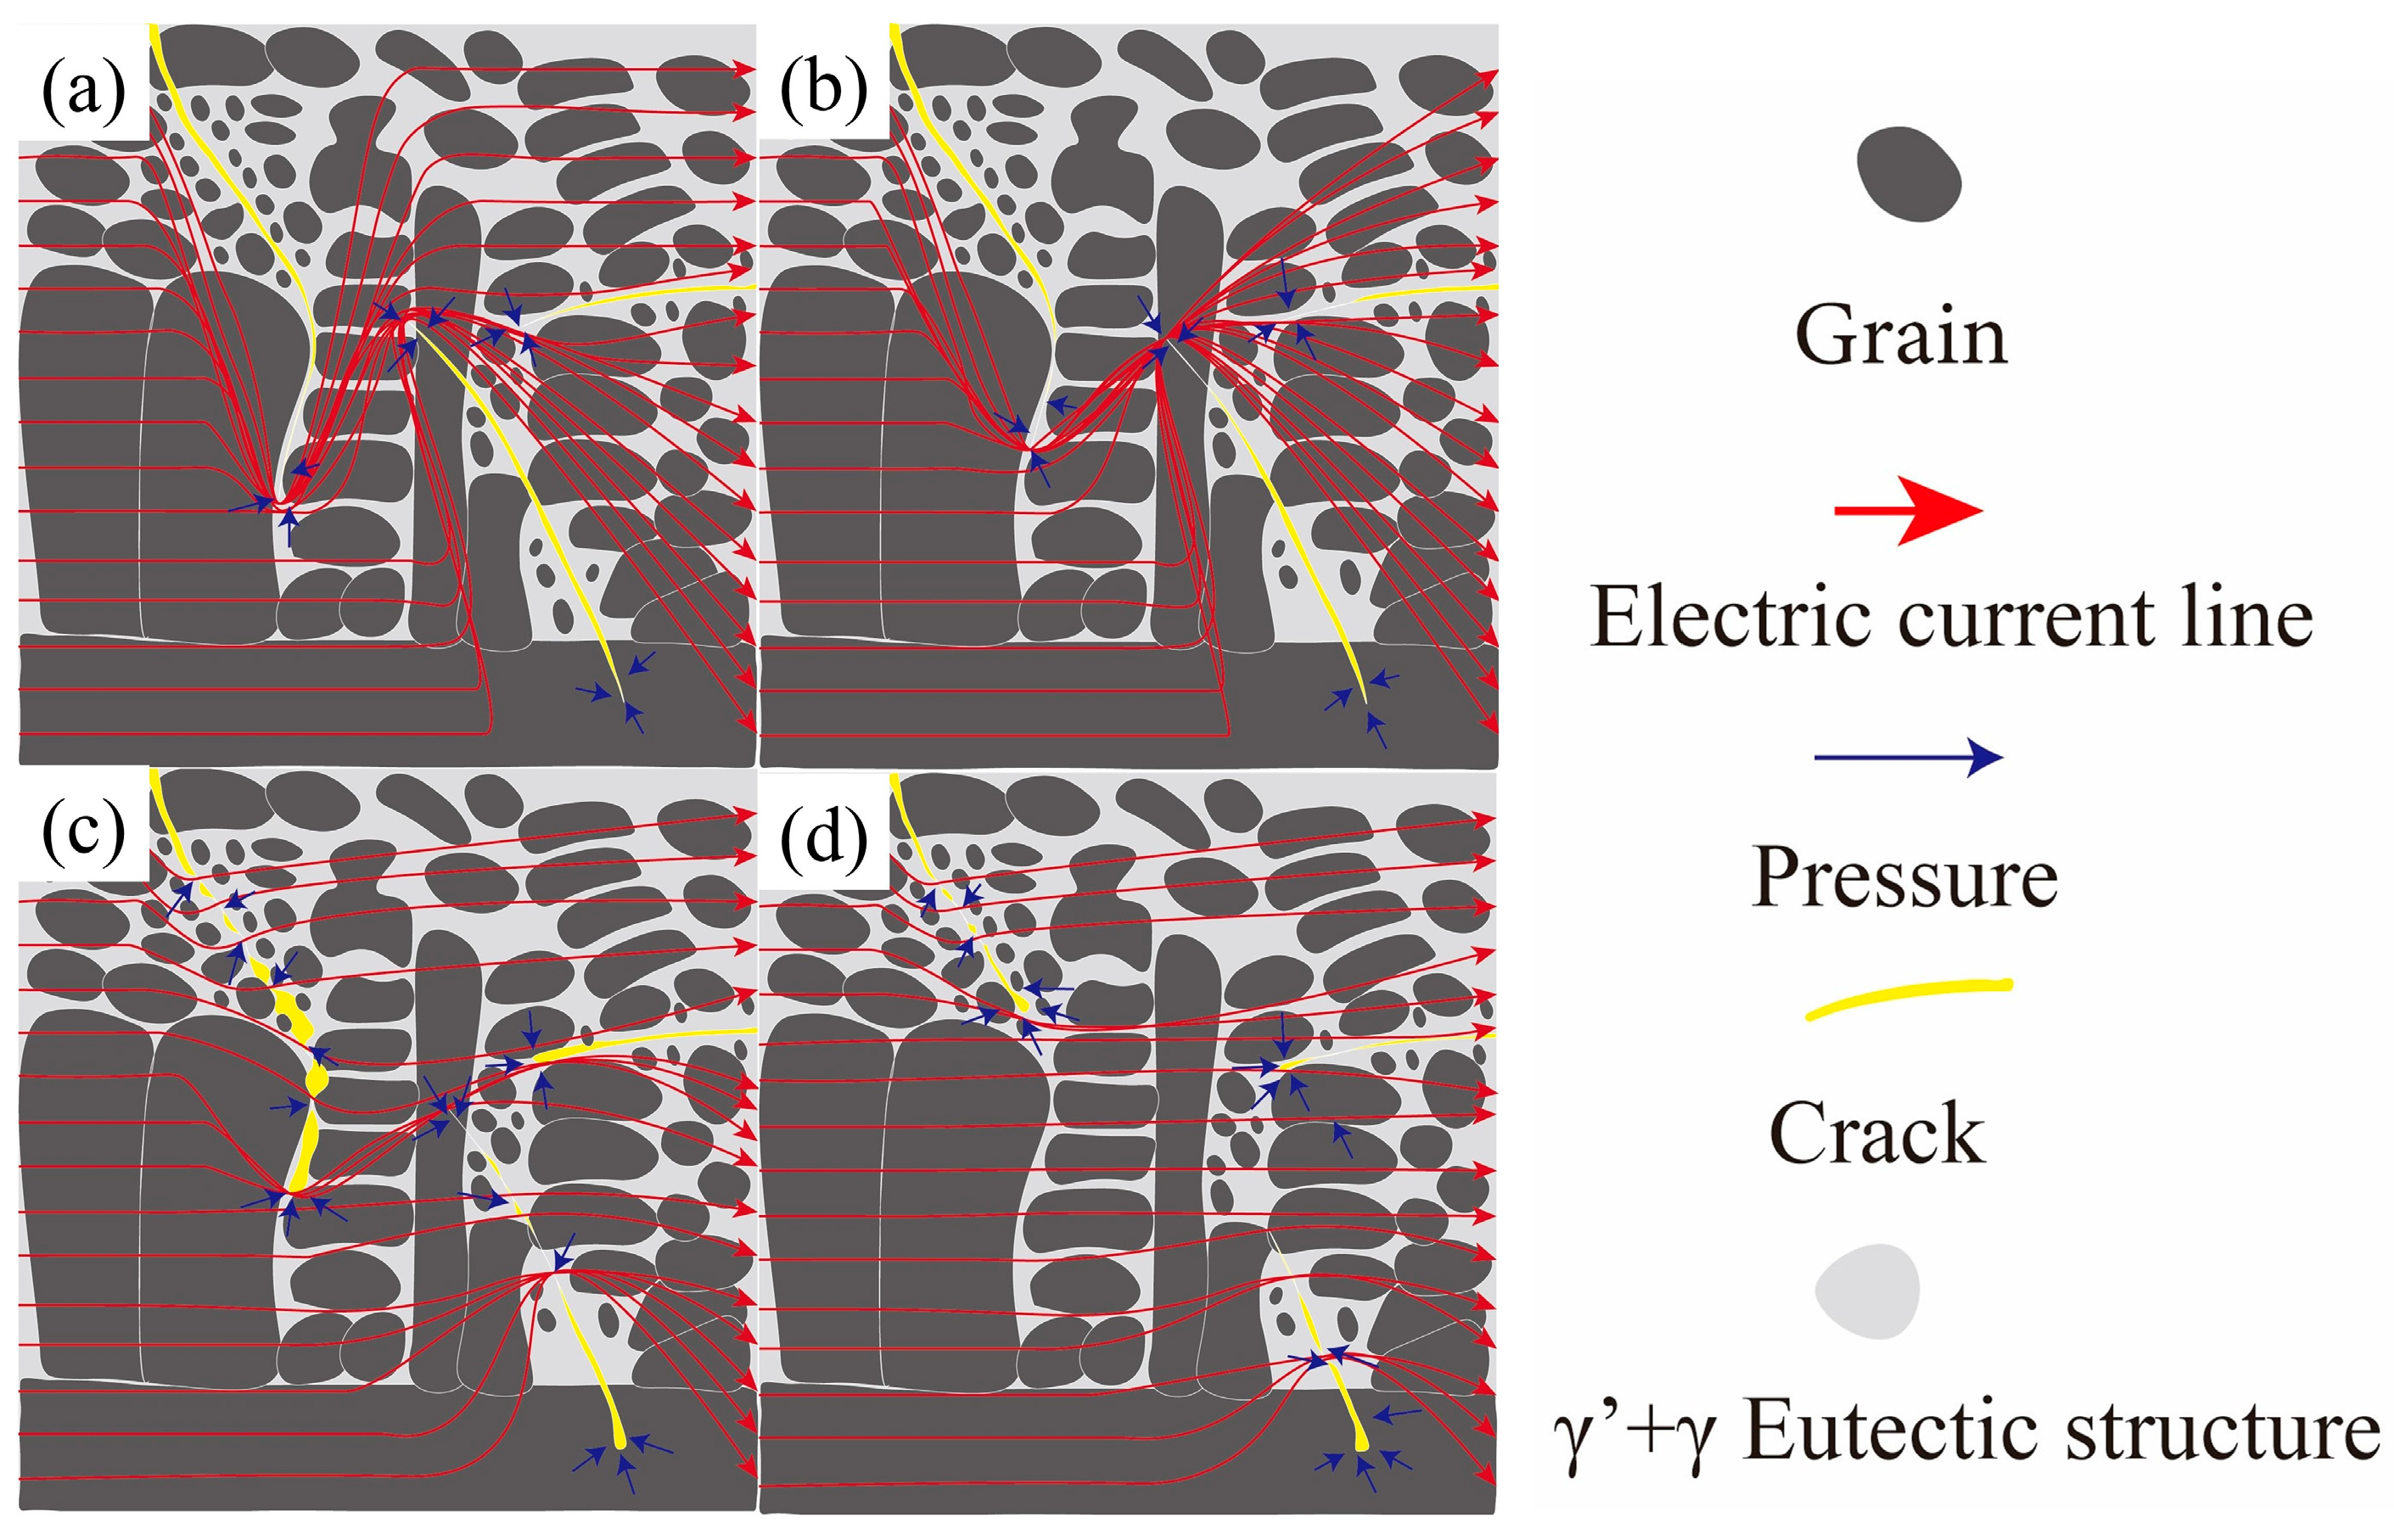
A schematic illustration of the crack arrest process of the EAHT is shown in Figure 13. Figure 13a shows the original crack profile, and Figure 13b,c show the crack profile with different levels of crack healing. The radius of curvature of the crack tip tends to approach zero before the EAHT. After the EAHT, the crack tip melted to form a weld, and passivation occurred. Compared with that before the EAHT, the crack tip radius of curvature increased by 2~3 orders of magnitude, and the stress concentration at the crack tip was eliminated. With the action of the EAHT, thermoelastic compressive stress is generated at the crack tip [31,32].
The effect of EAHT on crack arrest in coatings was investigated, and the crack arrest effect was analyzed. This experiment uses the Griffith–Orowan modified model of the relationship between critical stress and crack size for crack propagation in metallic materials:
σ c = 2 E γ p π a
where σc is the critical stress for crack propagation, E is the elastic modulus, γp is the surface energy of the material, and α is the crack width. Since laser cladding cracks were randomly generated and the crack morphology was most irregular in this study, α is represented by the radius of curvature of the crack tip.
Figure 14 shows the crack tip morphology after three EAHTs. For this experiment, Image J software was used to calculate the radius of curvature of the crack tip. The calculation results are shown in Table 7, which compares the radius of curvature of the crack tip, and the results are shown in Equation (3):
a p r e < a a f t
where αpre is the radius of curvature of the crack tip before the EAHT and αaft is the radius of curvature of the crack tip after the EAHT.
Equation (4) is combined with Equation (3) to calculate the critical stress of crack propagation. This experiment calculates the radius of curvature of three groups of cracks before and after EAHT. The relationship equation for the critical stress of crack propagation before and after EAHT was obtained:
σ p r e = 2 E γ p π a p r e < σ a f t = 2 E γ p π a a f t
where σpre is the critical stress for crack propagation before the EAHT and where σaft is the critical stress for crack propagation after the EAHT.
According to Equation (5), the critical stress required for crack propagation after EAHT is greater than that before EAHT. Thus, this enhances the ability of the coating to arrest crack propagation with increasing σc.

3.4. Analysis of the Mechanical Properties of the Coating Before and After Crack Arrest

To analyze the mechanical properties of the coating after crack arrest, tests were conducted on the coating’s hardness, fracture toughness, and wear resistance. The relationship between coating hardness, fracture toughness, and friction and wear performance was discussed in conjunction with the crack arrest and test results. The results of fracture toughness of the coating surface before and after EAHT are shown in Table 8. The fracture toughness of the original coating was 0.14 MPa·m1/2, while the maximum fracture toughness of the coating surface after EAHT reached 10.74 MPa·m1/2, an increase of approximately 25.57 times compared to the original coating. The minimum fracture toughness was 0.42 MPa·m1/2, an increase of approximately 3 times compared to the original coating. Figure 15a and Table 8 show that the coating hardness decreases as the fracture toughness increases. The average hardness on both sides of the original coating crack was 761.62 HV, while the lowest average hardness on both sides of the coating crack after EAHT was 515.41 HV, representing a decrease of approximately 32.33% compared to the original coating.
However, the wear resistance (expressed as the reciprocal of the wear rate, ω-1) of the coating surface after EAHT increases with the increase in fracture toughness. The rate of wear particle formation is related to the effective deformation degree εdeff during friction and the critical deformation degree εceff for crack extension by Hornberg’s hypothesis. When εceffεdeff, the material toughness is larger, and the coating wear is independent of the fracture toughness; when εdeffεceff, cracks are more likely to expand and wear cracks are more likely to appear; when εdeff > εceff, the wear rate ω is formulae [33]:
ω = K P H · ρ = K 0 ε d e f f ε c e f f · P H · ρ = K 0 α P 1 2 n 2 E σ s P β H 1 2 K I C 2 H · ρ
where ρ is the coating density; P is the compressive stress, H is the hardness, n is the work-hardening index, E is the modulus of elasticity, and σs is the yield stress (α/β) = C is an empirical constant under the condition εdeff = εceff.
Figure 15b shows the friction coefficient curve of the coating. Combined with the crack healing effect, cracks that heal well have a relatively smooth friction coefficient curve, while cracks that do not heal well have obvious noise peaks. Noise peaks are related to cracks in the coating and precipitation phases after EAHT. Figure 15(b1–b6) shows that the crack healing effect of EH–1, EH–2, and EH–6 coatings is relatively poor, and there is a dense precipitation phase at the crack edges. When the friction pair comes into contact with the coating surface and relative motion occurs, the presence of cracks and precipitation phases causes plastic and non-plastic zones to form on the coating surface. Therefore, during the friction and wear process, there is a significant difference between static and dynamic friction forces, leading to persistent stick–slip phenomena. The larger the value difference between static and dynamic friction forces, the more pronounced the fluctuations in the friction coefficient curve [34]. Notably, in Figure 15b, the coating’s friction coefficient curve remains generally stable (fluctuating between 0.41 and 0.55), while the wear rate fluctuates significantly. This phenomenon arises from their distinct physical meanings: the friction coefficient is primarily governed by the stable friction film on the coating surface, whereas the wear rate is more strongly affected by post-EAHT microstructural inhomogeneity—e.g., uneven crack healing or local hardness variations. Uneven healing and microstructural states across the coating lead to accelerated local material spallation during wear, ultimately inducing wear rate fluctuations.
Figure 16 compares the wear morphologies of the Ni60/WC coatings before and after EAHT. Figure 16(a2–g2) present magnified micrographs of the wear tracks, (a3–g3) show the corresponding three-dimensional wear profile maps, and (a4–g4) analyze the Energy Dispersive Spectroscopy (EDS) spectra of the worn surfaces (corresponding to different treated samples) to reveal the compositional changes in the worn surfaces and their influence on the differences in tribological properties.
The initial coating (Figure 16(a2,a3)) displays numerous pits and peripheral spalling traces. Furthermore, delamination is observed along the crack edges. These features indicate that the predominant wear mechanism is adhesive wear accompanied by spalling wear. The EDS results (Figure 16(a4)) show that the concentrations of carbide-related elements (W,C) at the wear tracks are relatively low, implying insufficient support from hard phases (including Cr-containing carbides), thus leading to adhesive and spalling wear. After the EH–1 treatment (Figure 16(b2)) and EH–2 treatment (Figure 16(c2)), the spalling phenomenon is exacerbated, and the pits caused by material detachment persist. Consequently, the wear mode evolves from predominantly adhesive wear to a mixed regime of spalling and abrasive wear. This transition is attributed to the precipitation of hard phases on the coating surface. EDS analysis shows that the intensities of peaks related to W and Cr increase, confirming the precipitation of hard carbides (including Cr-containing carbides). During the frictional wear process, dislocations accumulate at the hard-phase/matrix interface, which causes material fracture and separation and further leads to spalling. The appearance of distinct plough grooves after EH–2 (Figure 16(c3)) further confirms the activation of abrasive wear. For the coatings subjected to EH–3, EH–4, EH–5, and EH–6 (Figure 16(d2–g2)), the worn surfaces are dominated by shallow plough grooves and minor pits, and spalling is significantly reduced. The EDS spectra of these samples show that the intensities of W, C, and Cr peaks are more uniform and enhanced, indicating that uniform and well-distributed carbides (including Cr-containing carbides) are formed through EAHT, which effectively improves the abrasive wear resistance of the coating. As the treatment time increased, the depth of the plough grooves gradually decreased, and the surface became smooth. This improvement originates from EAHT-induced carbon precipitation, which preferentially fills cracks. The increased carbide content enhances the coating hardness and reduces the wear volume. Comparative analysis of images (Figure 16(d1–g1)) reveals that, after EAHT, regions adjacent to cracks exhibit relatively smooth worn surfaces, whereas crack-free areas show more pronounced plastic deformation and ploughing. Additionally, the width of the wear track gradually increases with increasing treatment temperature, indicating alleviated stress concentration around cracks and a reduced crack-affected zone. When the temperature reaches 950 °C (Figure 16(e1)), the wear mechanism is predominantly abrasive wear. Adhesive wear persists at a low level, and spalling wear is virtually suppressed. The corresponding EDS results show that the distribution of W, C, and Cr is the most optimized, and the O content is the lowest, which confirms the excellent tribological properties (of the coating) by minimizing adhesive wear, spalling wear, and oxidative damage.
The observed evolution of the wear mechanism is directly correlated with the increase in fracture toughness. In coatings with low toughness and preexisting cracks, external stresses drive crack propagation and the formation of subsurface microcracks. Sustained sliding promotes the coalescence of microcracks in the subsurface, and the cracks propagate toward the surface, which ultimately results in material removal in the form of wear debris. These debris particles then plough characteristic grooves into the surface under the action of the counterface. As a result, abrasive wear becomes the dominant mechanism, adhesive wear remains marginal, and spalling wear is effectively suppressed. The study shows that there is a critical load Pc inside the coating. When the applied load P > Pc, both plow grooves and crack propagation leading to material spalling occur. When P < Pc, crack propagation and material spalling caused by external loads do not occur. The expression for the Pc value with material properties and wear conditions is shown in Equation (7) [35]:
P c 0.12 λ K I C 2 s i n 2 α D 2 μ 2 H
where KIC is fracture toughness; H is material hardness; D is abrasive particle size; µ is friction coefficient; 2α is the plow angle; λ is crack spacing.
After EAHT, the fracture toughness KIC value and crack spacing λ (i.e., crack tip curvature radius) increase, the hardness H value decreases, and the friction coefficient µ is less than 1. Figure 16(a1–c4) and Table 8 show that the original coating, EH–1, and EH–2 coatings have low fracture toughness, with the critical load Pc inside the coating being less than the applied load P, resulting in severe surface peeling of the coating. However, after EAHT, the fracture toughness of the EH–3, EH–4, EH–5, and EH–6 coatings significantly improved compared to the original coating. The internal critical load Pc of the coatings is greater than the applied load P, resulting in only plow marks on the coating surface.
Figure 16(a3–g3) shows that the width of the surface scratches on the coating increases after EAHT, and that the wear resistance of the coating is also related to its hardness. The higher the hardness, the better the wear resistance. However, when cracks are present in the coating, the fracture toughness of the coating must also be considered. Table 8 shows that the fracture toughness of the coating increases after EAHT. Furthermore, the hardness concentration coefficient Kh near the cracks in the original coating was 1.10, while the hardness concentration coefficient Kh near the cracks in the EH–5 coating after EAHT was as low as 1.06. The closer the hardness concentration coefficient is to 1, the more uniform the hardness distribution. Figure 8 shows that crack healing zones have microstructure generation and are consistent with crack-free zones. Therefore, crack arresting improves coating continuity and hardness uniformity. When the material hardness is low and the toughness is high, the plasticity of the material also increases. Therefore, when the friction pair is pressed into the coating, the surface of the coating treated with EAHT undergoes obvious plastic deformation, and the width of the grinding marks increases with the increase in heat treatment time and temperature.
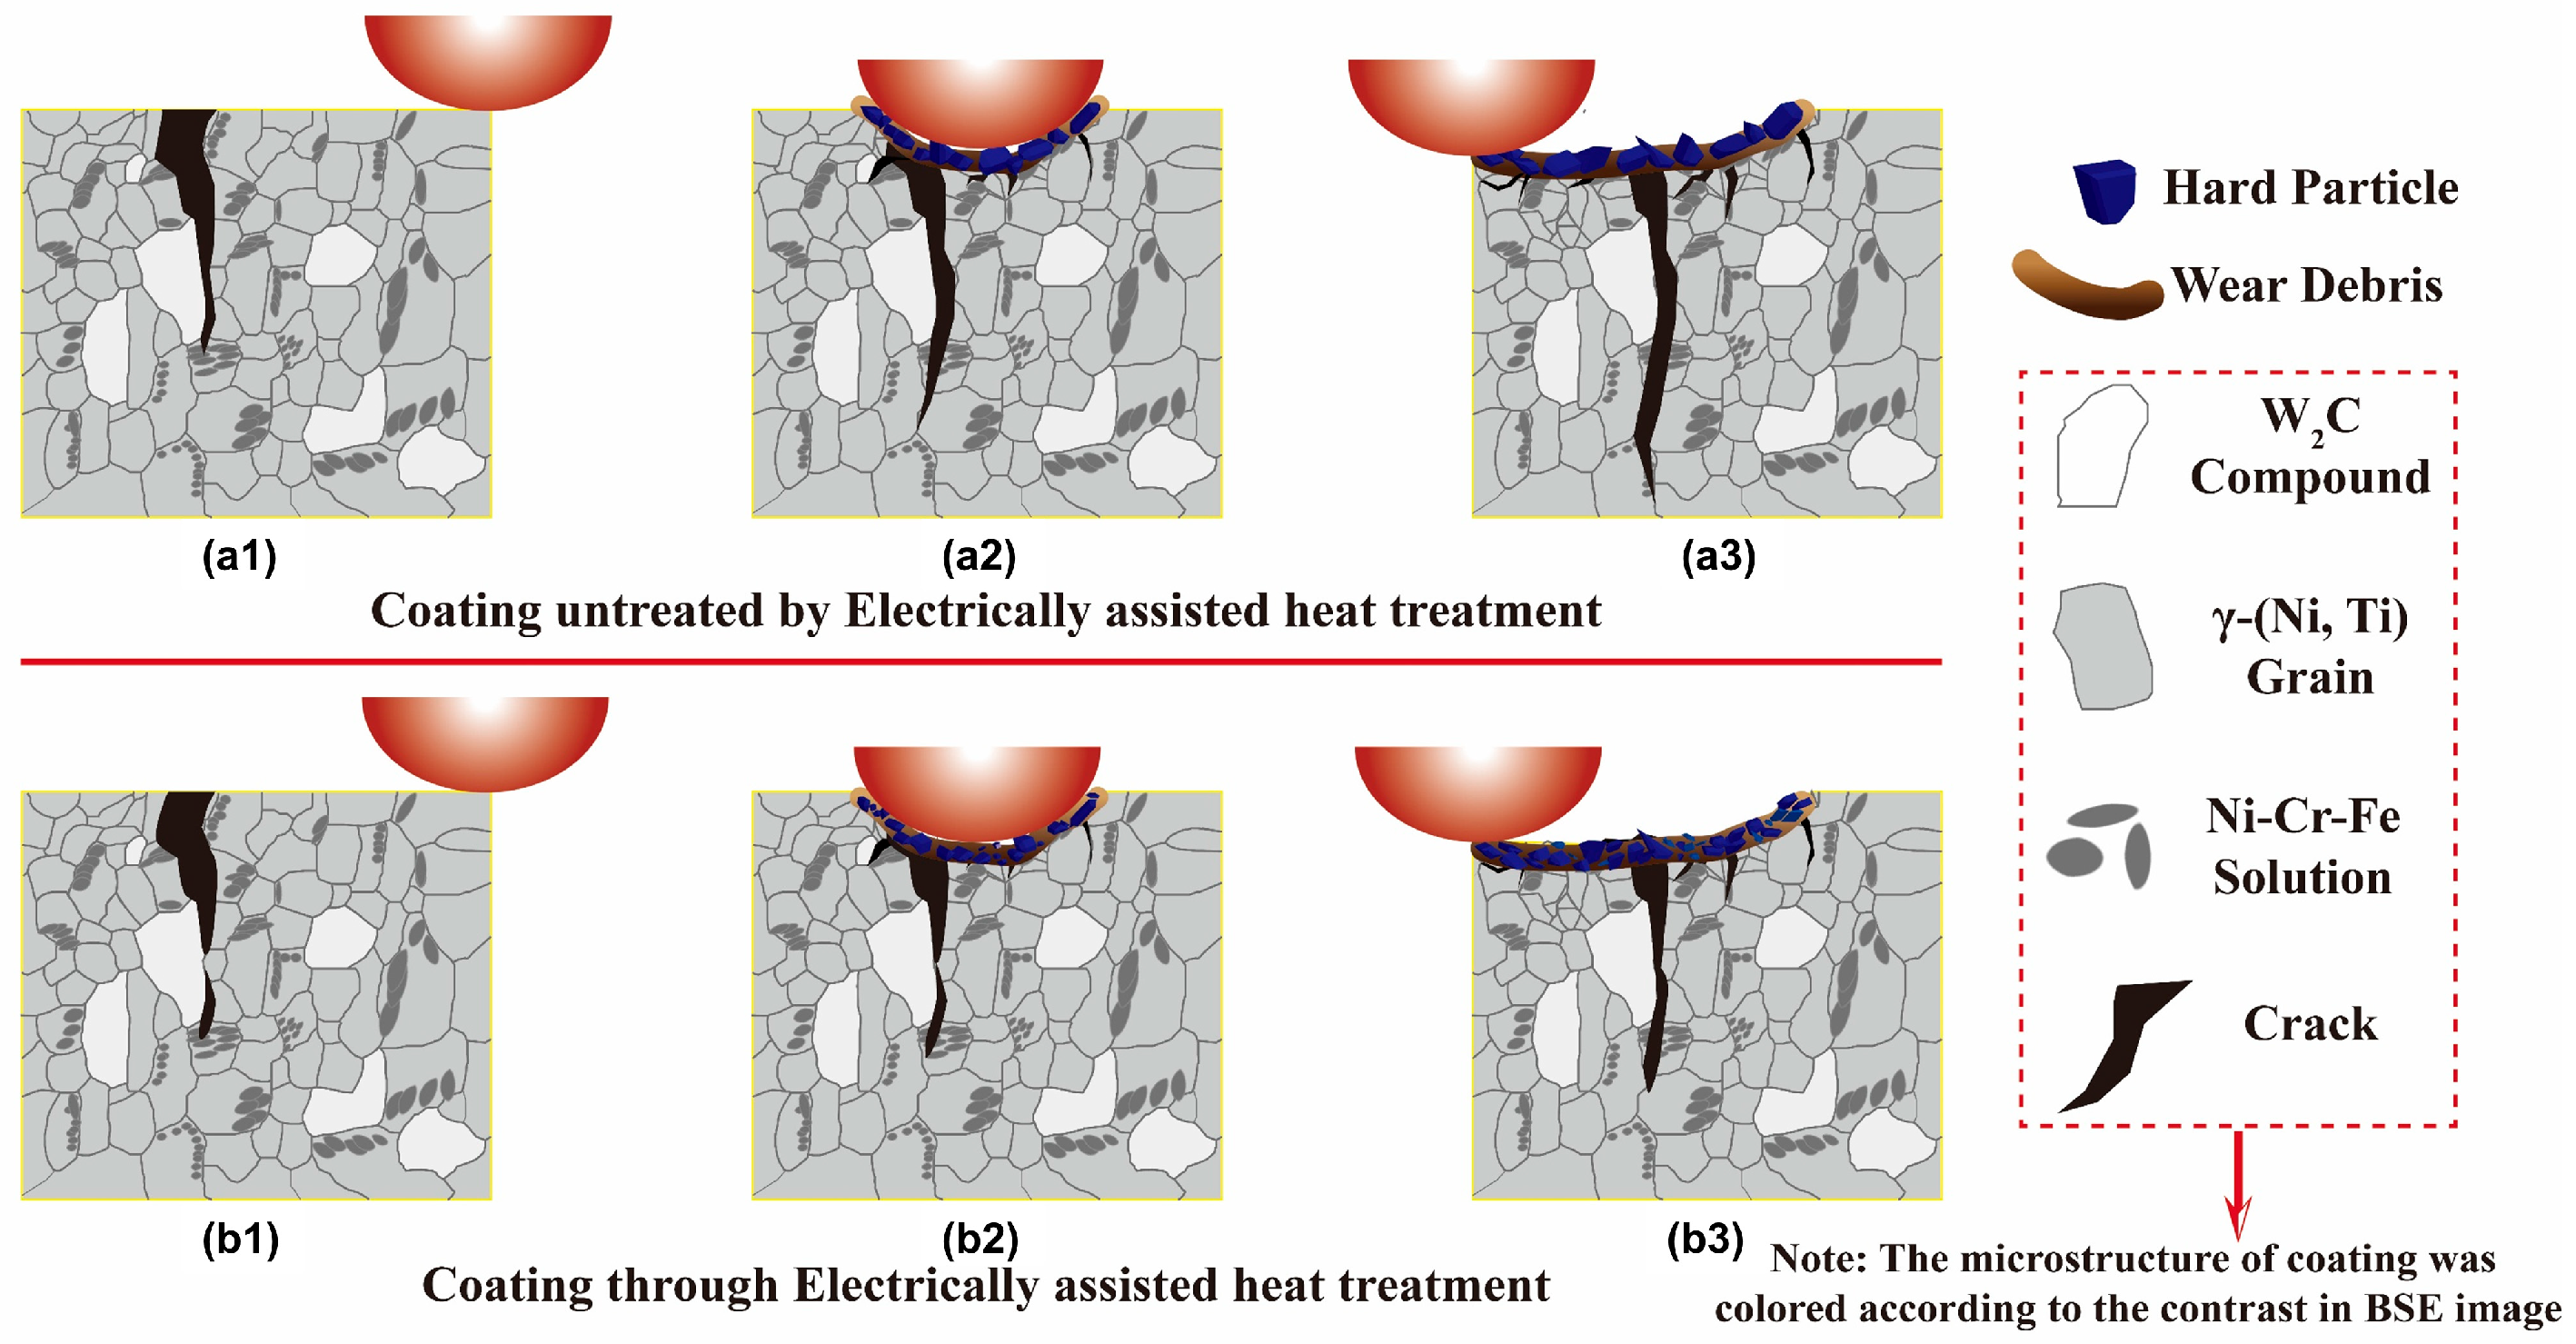
Figure 17 shows that when the friction pair slides over the original coating surface, microcracks are generated and material spalling occurs as friction continues, and the original cracks extend along the grains toward the base material. After EAHT, the cracks in the coating were arrested, the curvature radius at the crack tip increased, and the cracks partially healed. During friction and wear testing, microcracks also formed on the coating surface. Although the original cracks in the coating propagated to some extent after being arrested, the crack propagation rate was significantly lower than that of the original coating cracks under the same external load. Furthermore, once microcracks form on the coating surface, the microcracks will continue to propagate and merge as friction progresses, finally turning toward the surface and separating to form abrasive particles and spalling. The original coating untreated by EAHT has high hardness but poor toughness and plasticity, leading to severe material spalling and crack propagation during friction and wear. During this process, the wear particles are primarily large spalled materials. After EAHT, the coating’s toughness improves while its hardness decreases, resulting in enhanced coating microstructure continuity and performance uniformity. The wear particles are relatively fine in this case.
4. Conclusions

By discussion and analysis above, are concluded as follows:
(1)
Cracks are healed after EAHT. The current circulation effect and Joule heating effect generate thermoelastic compressive stress, which creates healing points at the narrowest parts of the cracks. With the progress of EAHT, these healing points grow into healing zones. The healing zones are microstructurally generated and are identical to the microstructure of the crack-free zones.
(2)
Cracks are filled after EAHT. Pulsed current results in diffusion filling and dislocation filling within the coating, with the filling material being carbides. However, as the degree of crack healing increases, the atomic ratio of carbon (C) in the filling material decreases, with the highest value reaching 98.2% and the lowest at 10.5%.
(3)
Crack propagation is arrested after EAHT. By using the Griffith-Orowan model, which describes the relationship between the critical stress for crack propagation in metals and crack size, it was found that the critical stress for crack propagation after EAHT (σaft), is greater than that before EAHT (σpre), indicating an enhanced ability to resist unstable crack propagation.
(4)
EAHT optimizes the comprehensive mechanical properties of the coating. After treatment, the coating hardness decreases moderately, while its fracture toughness and wear resistance increase. This is primarily attributed to the composite microstructure of “ductile γ-(Ni, Fe) matrix + in situ precipitated W2C hard phases” formed during EAHT, which achieves favorable synergy between matrix toughness and hard-phase wear resistance [33,34]. Consequently, the coating’s wear mechanism transitions from severe spalling wear to mild abrasive wear; additionally, the friction coefficient curve becomes smoother, and the stick–slip phenomenon during friction is alleviated.
(5)
This study innovatively employs EAHT as a post-treatment repair technology for laser-cladded coatings. By proactively achieving crack arrest and healing, EAHT forms an effective complement to the current mainstream approach focusing on “in-process crack suppression”. It not only significantly improves the structural integrity and service reliability of the coating but also provides a new technical approach for the remanufacturing and repair of high-value components.

Author Contributions

X.S.: conceptualization, investigation, experimental plan design, original paper writing, paper modification, organization and completion of experiments; X.L.: Provided theoretical support, experimental guidance and paper editing; W.W.: Assisted in sample preparation, data collection and support experiments; Z.Z.: Guided testing methods and data analysis. All authors have read and agreed to the published version of the manuscript.

Funding

This research was funded by Tianchi Doctor of Philosophy Program, grant number 610221023.

Data Availability Statement

The datasets presented in this article are not readily available because they are part of an ongoing study and due to technical/time limitations. Requests to access the datasets should be directed to the corresponding author.

Conflicts of Interest

The authors declare no conflicts of interest. The funders had no role in the design of the study; in the collection, analyses, or interpretation of data; in the writing of the manuscript; or in the decision to publish the results.

References

  1. Zhang, Z.; Yang, F.; Zhang, H.; Zhang, T.; Wang, H.; Xu, Y.; Ma, Q. Influence of CeO2 addition on forming quality and microstructure of TiCx-reinforced CrTi4-based laser cladding composite coating. Mater. Charact. 2021, 171, 110732. [Google Scholar] [CrossRef]
  2. Siddiqui, A.; Dubey, A. Recent trends in laser cladding and surface alloying. Opt. Laser Technol. 2021, 134, 106619. [Google Scholar] [CrossRef]
  3. Yuan, W.; Li, R.; Chen, Z.; Gu, J.; Tian, Y. A comparative study on microstructure and properties of traditional laser cladding and high–speed laser cladding of Ni45 alloy coatings. Surf. Coat. Technol. 2021, 405, 126582. [Google Scholar] [CrossRef]
  4. Zhu, L.; Xue, P.; Lan, Q.; Meng, G.; Ren, Y.; Yang, Z.; Xu, P.; Liu, Z. Recent Research and Development Status of Laser Cladding: A Review. Opt. Laser Technol. 2021, 138, 106915. [Google Scholar] [CrossRef]
  5. He, Z.; Zhan, D.; Yan, X.; Liu, W.; Tong, Y.; Liu, H.; Wang, K. Effect of oscillating laser cladding on microstructure and properties of stainless-steel cladding layers. Mater. Today Commun. 2024, 41, 110254. [Google Scholar] [CrossRef]
  6. He, B.; Zhang, L.; Zhu, Q.; Wang, J.; Yun, X.; Luo, J.; Chen, Z. Effect of Solution Treated 316L Layer Fabricated by Laser Cladding on Wear and Corrosive Wear Resistance. Opt. Laser Technol. 2020, 121, 105788. [Google Scholar] [CrossRef]
  7. Hu, X.; Guo, C.; Huang, Y.; Xu, Z.; Shi, Z.; Zhou, F.; Li, G.; Zhou, Y.; Li, Y.; Li, Z.; et al. Liquid-induced healing of cracks in nickel-based superalloy fabricated by laser powder bed fusion. Acta Mater. 2024, 267, 119731. [Google Scholar] [CrossRef]
  8. Meng, L.; Sheng, P.; Zeng, X. Comparative studies on the Ni60 coatings deposited by conventional and induction heating assisted extreme-high-speed laser cladding technology: Formability, microstructure and hardness. J. Mater. Res. Technol. 2022, 16, 1732–1746. [Google Scholar] [CrossRef]
  9. Zhang, Q.; Zhang, P.; Yan, H.; Yu, Z.; Wu, D.; Shi, H.; Li, S.; Tian, Y. Magnetic-field-assisted laser cladding in the preparation of a crack-free Fe-Cr-Mo-CYB amorphous coating on steel. Philos. Mag. Lett. 2020, 100, 86–93. [Google Scholar] [CrossRef]
  10. Qi, K.; Yang, Y.; Sun, R.; Hu, G.; Lu, X.; Li, J.; Liang, W.; Jin, K.; Xiong, L. Effect of magnetic field on crack control of Co-based alloy laser cladding. Opt. Laser Technol. 2021, 141, 107129. [Google Scholar] [CrossRef]
  11. Khorram, A.; Jamaloei, A.; Sepehrnia, R. Analysis of solidification crack behavior for Amdry 997 coating on Inconel 713 LC superalloy by laser cladding process. Optik 2022, 264, 169407. [Google Scholar] [CrossRef]
  12. Sadhu, A.; Choudhary, A.; Sarkar, S.; Nair, A.M.; Nayak, P.; Pawar, S.D.; Muvvala, G.; Pal, S.K.; Nath, A.K. A study on the influence of substrate pre-heating on mitigation of cracks in direct metal laser deposition of NiCrSiBC-60%WC ceramic coating on Inconel 718. Surf. Coat. Technol. 2020, 389, 14. [Google Scholar] [CrossRef]
  13. Qi, K.; Yang, Y.; Hu, G.; Lu, X.; Li, J. Thermal expansion control of composite coatings on 42CrMo by laser cladding. Surf. Coat. Technol. 2020, 397, 125983. [Google Scholar] [CrossRef]
  14. Wang, Q.; Chen, F.; Li, Q.; Zhang, L.; Jin, H.; Zhang, J.W. Microstructure and properties of Ni60 alloy coating prepared by electromagnetic compound field assisted laser cladding. Mater. Chem. Phys. 2022, 291, 126678. [Google Scholar] [CrossRef]
  15. Shen, X.; Ma, S.; He, X.; Zhang, J.; Ma, X.; Yin, Y.; Pan, S.; Wei, F. Quality enhancement of crack-free laser-cladded NiCrSiBC-WC coating by in-situ temperature field assistance (ITFA) and post-laser remelting (PLR). Surf. Coat. Technol. 2024, 484, 130873. [Google Scholar] [CrossRef]
  16. Hu, Z.; Li, Y.; Lu, B.; Tan, N.; Cai, L.; Yong, Q. Effect of WC content on microstructure and properties of high-speed laser cladding Ni-based coating. Opt. Laser Technol. 2022, 155, 108449. [Google Scholar] [CrossRef]
  17. Li, S.; Wang, J.; He, J.; Xue, R.; Wang, R.; Niu, D.; Chen, R.; Tang, Y.; Bai, S. Crack healing phenomenon of TiZrNbV high-entropy alloy during dynamic load. Intermetallics 2023, 159, 107912. [Google Scholar] [CrossRef]
  18. Guo, D.; Zheng, Z.; He, M.; Yu, J.; Shi, F.; Li, S. Morphology evolution and mechanisms of crack healing in a low-carbon steel during isothermal heat treatment. Metall. Mater. Trans. A 2021, 52, 2926–2935. [Google Scholar] [CrossRef]
  19. Alam, M.; Yamamoto, T.; Odette, G. Crack self-healing by high–temperature annealing of a 90W7Ni3Fe tungsten heavy alloy. J. Nucl. Mater. 2024, 598, 7. [Google Scholar] [CrossRef]
  20. Guo, S.; Lu, J.; Song, Y.; Xie, L.; Yu, Y.; Wang, Z.; Lu, S. Near-in-situ investigation of surface crack healing and strengthening mechanism of Ti-43.5 Al-4Nb-1Mo-0.1 B alloy by novel electroshock treatment. Eng. Fail. Anal. 2024, 159, 108120. [Google Scholar] [CrossRef]
  21. Xin, R.; Ma, Q.; Li, W. Microstructure and mechanical properties of internal crack healing in a low carbon steel. Mater. Sci. Eng. A 2016, 662, 65–71. [Google Scholar] [CrossRef]
  22. Wang, L.; Quan, M.; Tan, Z.; Liu, M.; Wang, D.; Yang, X.; Liu, Y.; Mao, Y.; Liang, Z.; Yang, F. Pulsing-induced healing of a surface crack of a nickel-based alloy. J. Mater. Res. Technol. 2024, 31, 733–738. [Google Scholar] [CrossRef]
  23. Akono, A.T.; Randall, N.X.; Ulm, F.J. Experimental determination of the fracture toughness via microscratch tests: Application to polymers, ceramics, and metals. J. Mater. Res. 2012, 27, 485–493. [Google Scholar] [CrossRef]
  24. Nakayama, S.; Sugeno, Y.; Kambayashi, T.; Hosoi, A.; Furukawa, Y.; Tomita, T.; Kawada, H. Mechanism of Fatigue Crack Closure in Steel Under High-Density Pulsed Current. Fatigue Fract. Eng. Mater. Struct. 2025, 48, 1879–1892. [Google Scholar] [CrossRef]
  25. Gallo, F.; Satapathy, S.; Ravi-Chandar, K. Melting and crack growth in electrical conductors subjected to short-duration current pulses. Int. J. Fract. 2011, 167, 183–193. [Google Scholar] [CrossRef]
  26. Zhang, X.; Wang, Q. Thermoelastic contact of layered materials with interfacial imperfection. Int. J. Mech. Sci. 2020, 186, 105904. [Google Scholar] [CrossRef]
  27. Hui, S.; Wang, Z. Effect of electropulsing on dislocation mobility of titanium sheet. Trans. Nonferrous Met. Soc. China 2012, 22, 1599–1605. [Google Scholar] [CrossRef]
  28. Xiang, S.; Zhang, X. Residual stress removal under pulsed electric current. Acta Metall. Sin. (Engl. Lett.) 2020, 33, 281–289. [Google Scholar] [CrossRef]
  29. Li, X.; Wang, X.; Yu, Y. The electromagnetic effect on microscopic features of Co-6 coatings on U71Mn by pulse current–assisted laser cladding. Mater. Lett. 2024, 375, 137212. [Google Scholar] [CrossRef]
  30. Liu, Z.; Liu, P.; Zhou, L.; Wang, L. Effects of Pulsed Current on the Microstructure and Properties of Laser Cladded TC17 Titanium Alloy. Materials 2024, 17, 91. [Google Scholar] [CrossRef]
  31. Fu, Y.; Tian, Z.; Zheng, L.; Li, W. Temperature field at time of pulse current discharge in metal structure with elliptical embedding crack. Appl. Math. Mech. 2008, 29, 961–966. [Google Scholar] [CrossRef]
  32. Fu, Y.M.; Bai, X.Z.; Zheng, L.J. Numerical simulation and experimental research on crack arresting using electromagnetic heat effects. Int. J. Nonlinear Sci. Numer. Simul. 2001, 2, 375–378. [Google Scholar] [CrossRef]
  33. Hornbogen, E. The role of fracture toughness in the wear of metals. Wear 1975, 33, 251–259. [Google Scholar] [CrossRef]
  34. Rosenhek, G.I.; Kampf, N.; Yeredor, A.; Klein, J. On the question of whether lubricants fluidize in stick-slip friction. Proc. Natl. Acad. Sci. USA 2015, 112, 7117–7122. [Google Scholar] [CrossRef] [PubMed]
  35. Gahr, K.H.Z. How microstructure affects abrasive wear resistance. Met. Prog. 1979, 116, 46–52. [Google Scholar]
Figure 1. Schematic diagram of the experimental setup for EAHT.
Jmmp 09 00348 g001
Figure 2. Schematic illustration of the EAHT process and thermal images for different electric current densities: (a) EH–1, (b) EH–2, (c) EH–3, (d) EH–7 and (e) schematic illustration of the EAHT process.
Jmmp 09 00348 g002
Figure 3. ANSYS finite element analysis of EAHT: (a) Microscopic feature-based model geometry, (b) boundary condition schematic, (c) temperature field contour, and (d) electric field contour.
Jmmp 09 00348 g003
Figure 4. Dye penetrant test results before and after 2 h of EAHT with different electric current densities: (a,a1) EH–1, (b,b1) EH–2, (c,c1) EH–3, (d,d1) EH–7 and (e) crack rate before and after EAHT.
Jmmp 09 00348 g004
Figure 5. Dye penetrant test results before and after EAHT for different heating times of 6.25 A/mm2: (a,a1) EH–3, (b,b1) EH–4, (c,c1) EH–5, (d,d1) EH–6 and (e) crack rate before and after EAHT.
Jmmp 09 00348 g005
Figure 6. Microstructural characterization near the crack-healed region of the coating after EH–4 current-assisted heat treatment: (a) Back scattered electron (BSE) image; (b) X–ray diffraction (XRD) pattern; (c) EDS mapping image; (d) EDS full-spectrum image; (e) electron back scatter diffraction (EBSD) phase distribution map; (f) EBSD grain orientation mapping (Y).
Jmmp 09 00348 g006
Figure 7. EBSD characterization of the nondefective region of the coating after EAHT: (a) Phase distribution map, (b) grain orientation mapping, (c) grain boundary misorientation map, (d) ODF sections (0°, 45°and 90°), (e) grain size distribution, and (f) inverse pole image.
Jmmp 09 00348 g007
Figure 8. SEM secondary electron images of cracks in the coating of EH–4: (a) Full view of cracks, (b,c) crack 1 and (df) crack 2.
Jmmp 09 00348 g008
Figure 9. EDS mapping near cracks in EH–4 coating: (a) Scanning zone with marked regions A (dark gray phase), B (light gray phase), C (bright white phase), and D (flocculent structure), (b) C, (c) Cr, (d) Fe, (e) Ni and (f) W.
Jmmp 09 00348 g009
Figure 10. SEM images of crack filling before and after EAHT: (a) Before EAHT and (b) after EAHT.
Jmmp 09 00348 g010
Figure 11. EDS mapping of crack filling after EAHT: (a) SEM image with marked regions A (gray filler) and B (gray-white phase in the molten pool part), and distribution of elements of Figure 10: (b) C, (c) Cr, (d) Fe, (e) Ni and (f) W.
Jmmp 09 00348 g011
Figure 12. EDS results of crack filling at different levels after EAHT: (a) Initial filling area A; (b) partial healing area B; (c) higher healing area C; (d) full healing area D.
Jmmp 09 00348 g012
Figure 13. Illustration of crack arrest process in EAHT: (a) Initial stage; (b) early interaction stage; (c) crack arrest initiation stage; (d) final crack arrest stage.
Jmmp 09 00348 g013
Figure 14. Curvature of crack tips of after EAHT: (a) EH–1, (b) EH–2 and (c) EH–3.
Jmmp 09 00348 g014
Figure 15. Correlations between the mechanical properties of the coatings after crack arrest: (a) Relationships among fracture toughness, coating hardness, and wear resistance; (b) friction coefficient curves before and after EAHT; (b1b6) wear morphology after EAHT (SE images).
Jmmp 09 00348 g015
Figure 16. Multi-technique characterization of wear behavior for Ni60/WC coatings under different EAHTs: (a1g1) SEM images of regions near cracks; (a2g2) magnified wear track morphologies; (a3g3) 3D wear-profile distributions; and (a4g4) corresponding EDS spectra (for element composition and distribution analysis).
Jmmp 09 00348 g016
Figure 17. Schematic diagram of crack evolution in Ni-based WC coatings during friction-wear: (a1a3) Initial coating and (b1b3) coating after EAHT.
Jmmp 09 00348 g017
Table 1. Chemical composition of 45# medium carbon steel (wt.%).
CSiMnNiCrCuFe
0.460.210.570.010.030.02Bal.
Table 2. Chemical composition of Ni60 powder (wt.%).
CrFeCSiBNi
25.03.01.03.03.0Bal.
Table 3. Parameters of EAHT process.
No. *EH–1EH–2EH–3EH–4EH–5EH–6EH–7
Time (h)2.02.02.01.51.00.52.0
Electric current density (A·mm−2)5.595.926.256.256.256.256.58
Maximum coating temperature (°C)750 °C850 °C950 °C950 °C950 °C950 °C1050 °C
* Note: The 7 parameter sets correspond to 7 independent 45# medium carbon steel specimens, each pre-coated with Ni60/WC via laser cladding, and each set is applied to the corresponding specimen only once.
Table 4. EDS results in Figure 9a (at%).
ElementCCrFeNiW
A55.20.78.512.423.3
B11.65.828.952.61.2
C11.27.124.121.735.9
D0.348.835.013.82.2
Table 5. EDS results in Figure 11 (at%).
ElementCCrFeNiW
A98.201.700
B26.87.458.94.92.4
Table 6. EDS results in Figure 12 (at%).
ElementCCrFeNiW
A98.201.700
B55.20.78.512.423.3
C47.73.039.19.70.4
D10.55.025.159.40.1
Table 7. Radius of curvature of crack tips before and after EAHT (µm).
SampleEH–1EH–2EH–3
Pre–EAHT0.0560.0870.080
After–EAHT1.4431.8692.375
Table 8. Mechanical and tribological properties of Ni60/WC coatings before and after EAHT: hardness, fracture toughness, and friction coefficient.
SampleInitialEH–1EH–2EH–3EH–4EH–5EH–6
KIC (MPa·m1/2)0.140.420.540.820.8710.745.57
Hav761.62740.29714.4515.41535.84545.83550.93
Kh1.101.181.141.091.071.061.12
Friction Coefficient0.410.530.550.470.440.460.46
Disclaimer/Publisher’s Note: The statements, opinions and data contained in all publications are solely those of the individual author(s) and contributor(s) and not of MDPI and/or the editor(s). MDPI and/or the editor(s) disclaim responsibility for any injury to people or property resulting from any ideas, methods, instructions or products referred to in the content.