3.1. Microstructure, Chemical Composition, Roughness, and Thickness of the Coatings
The photos taken with SEM (
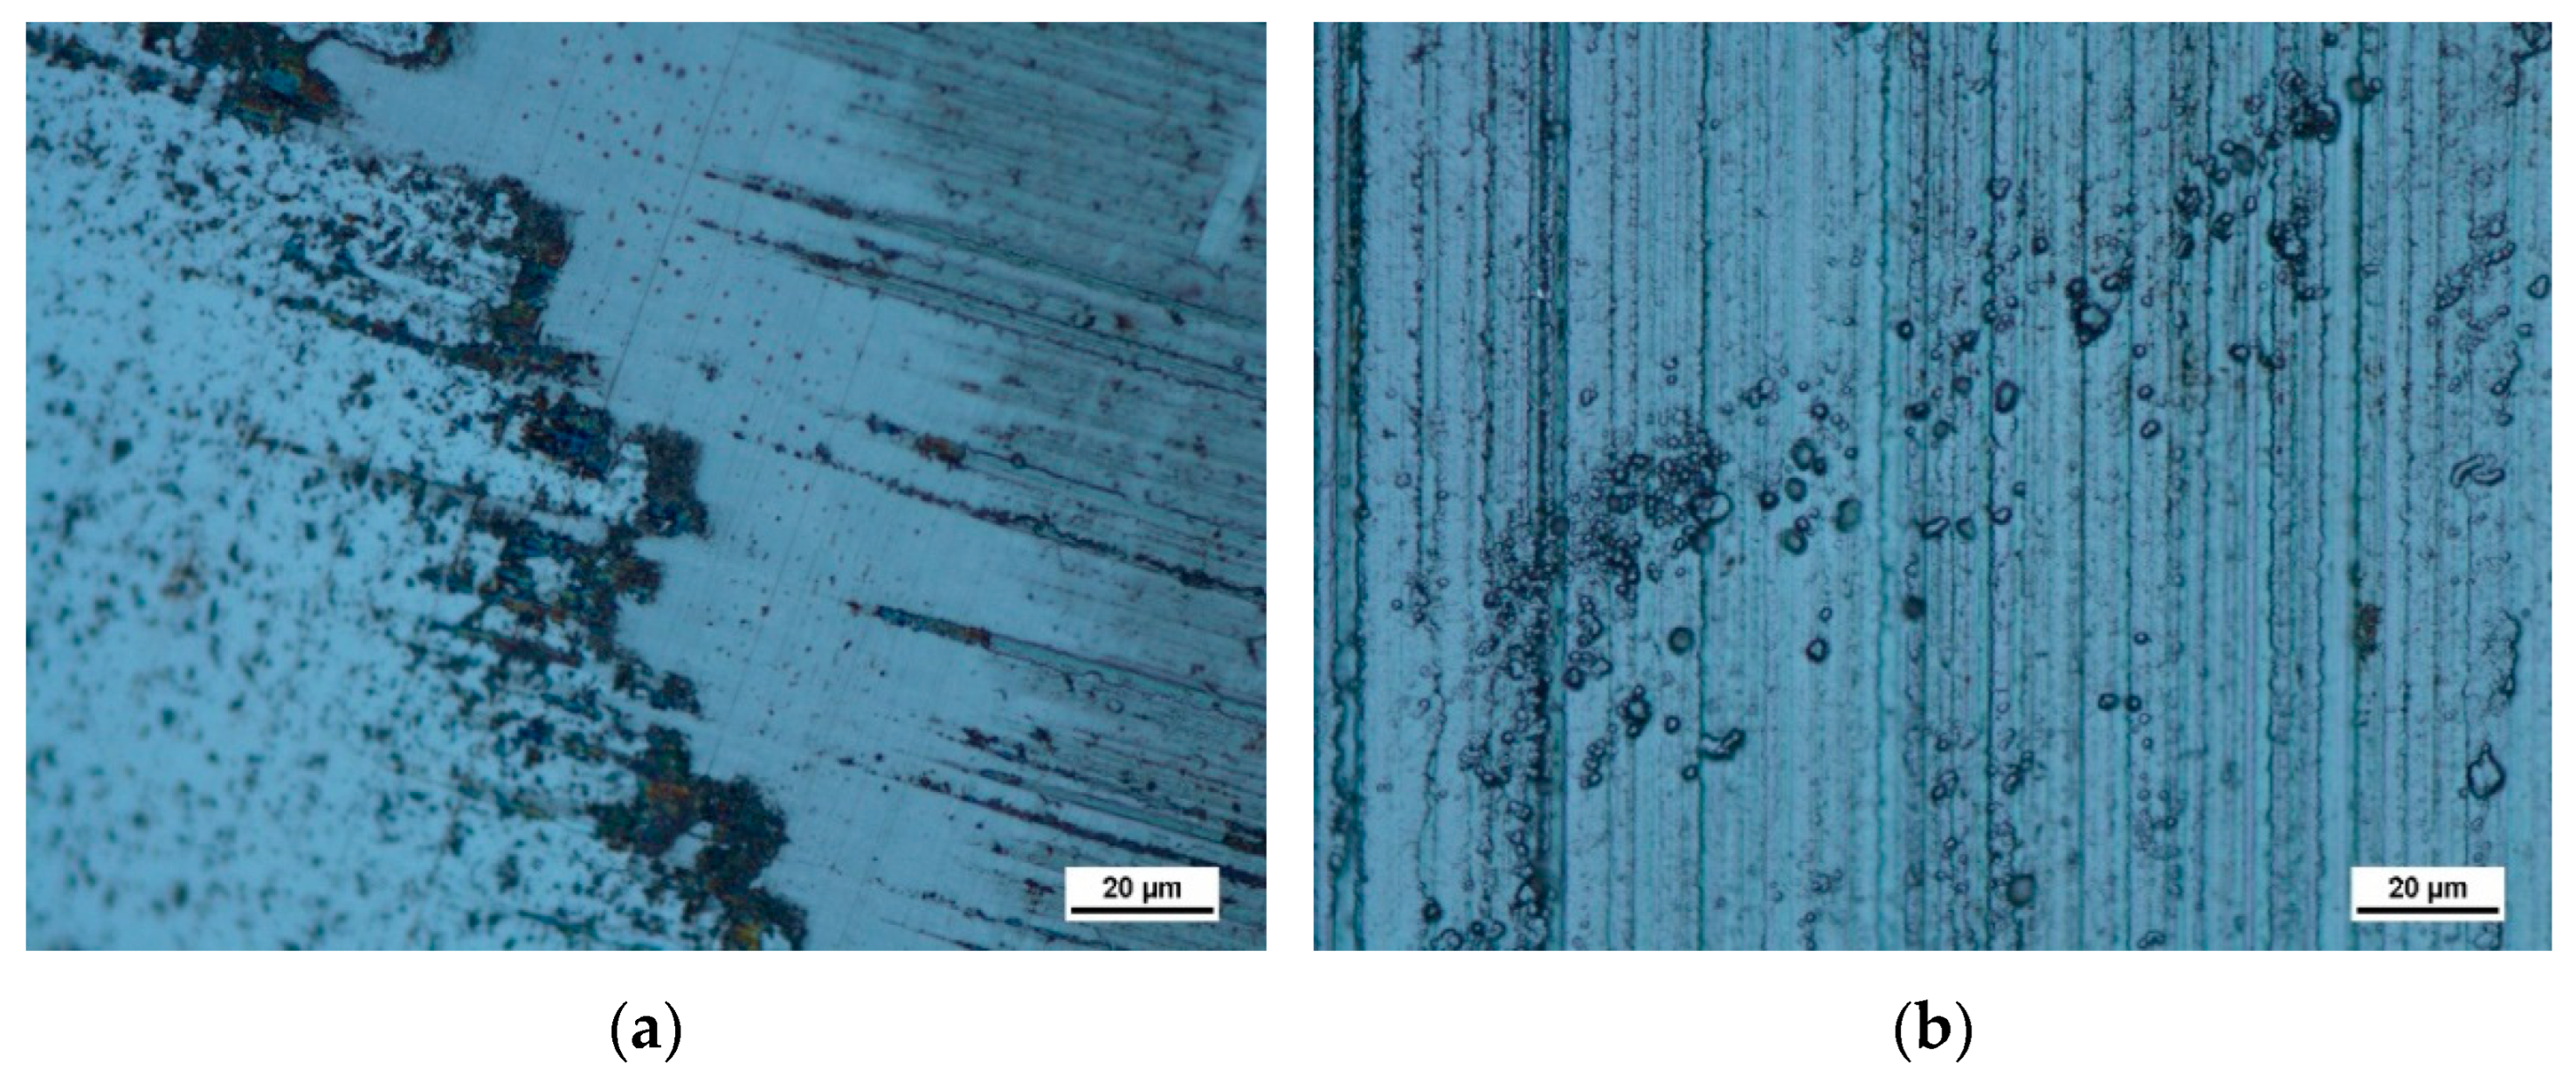
Figure 6a–c) showed clear differences in the morphology of the coating surface depending on the substrate structure, including direction of grinding during the process in their manufacturing and preparation for work. In addition, the coatings applied to the U-type (submicron) cutting knives show a discontinuous structure with visible grooves and craters at the bottom of which the substrate is visible. Craters and grooves are caused by the preparation of the substrate, which was subjected to the same pretreatment. Each type of substrate exhibits deeper or smaller grooves depending on its hardness. This type of defect may be dangerous due to the risk of coating delamination during machining, thus leading to the so-called Catastrophic Blade Failure (CBF) in extreme cases. This condition of the tool requires its withdrawal from further use. On S (ultra-fine nano) and T (micro) substrates, only single blisters are visible; however, in both cases, the coating seems to be more homogeneous and has a relatively uniform thickness.
On the basis of the EDX analysis carried out at 5 kV, both the mass and the atomic share of individual elements in the coating were determined, given in
Table 3. The summary given in
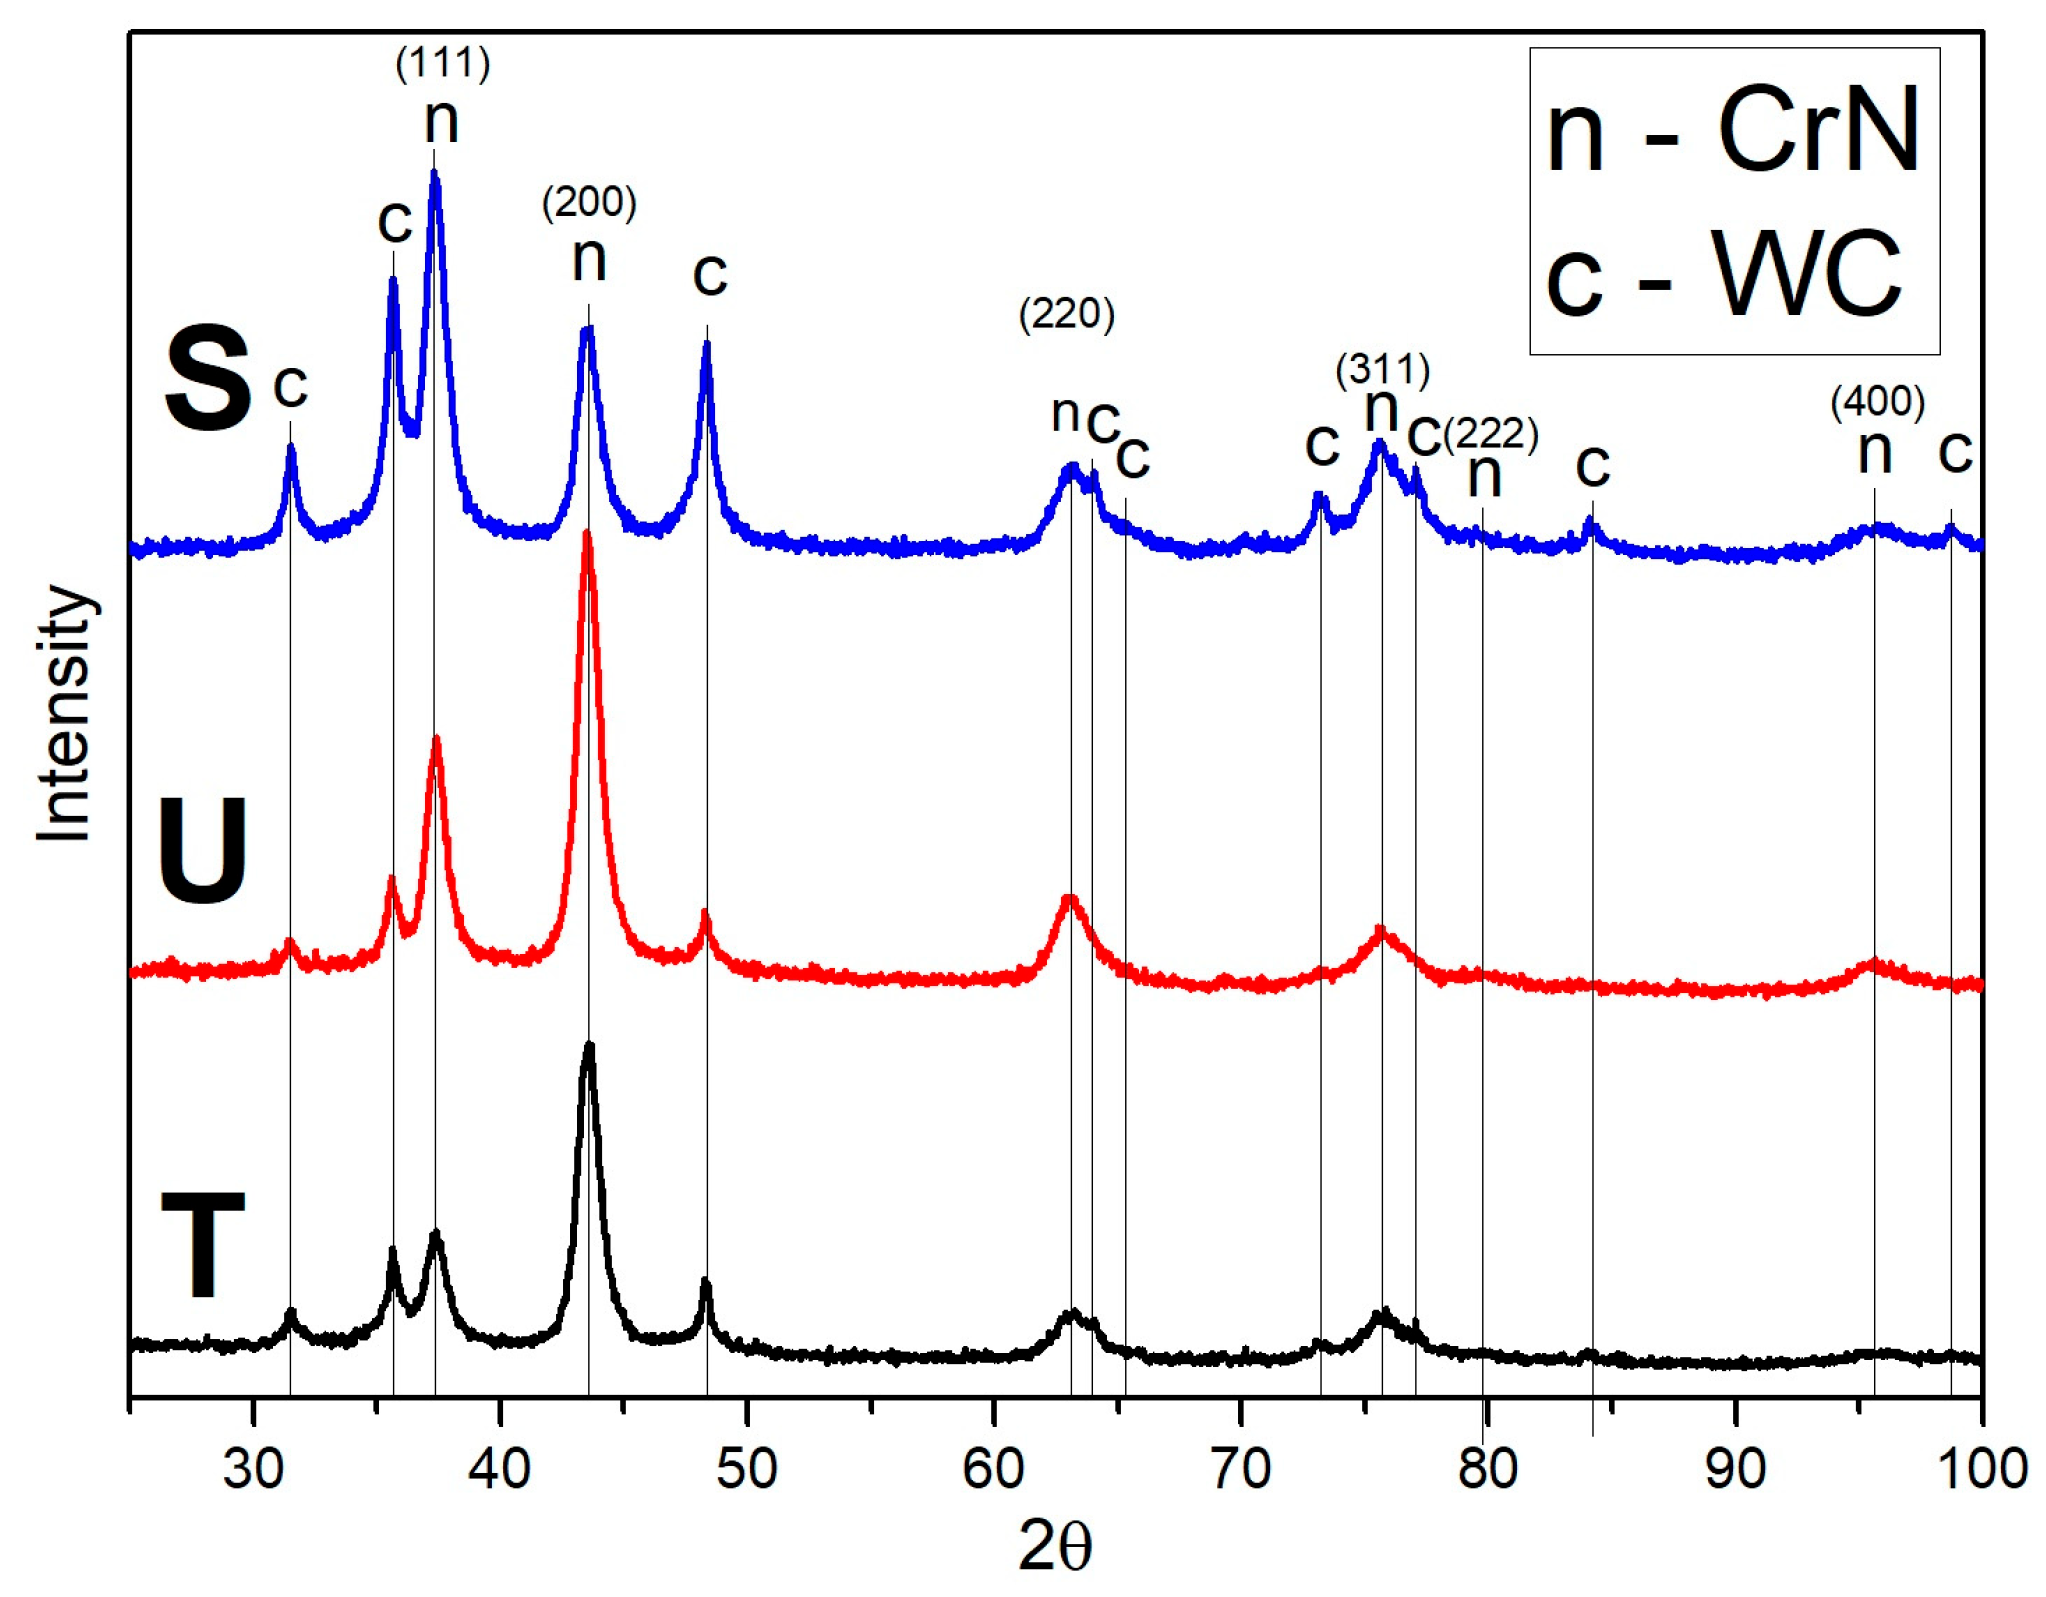
Table 5 indicates that the chemical composition of the coating is practically almost identical regardless of the type of substrate. The atomic fraction of Al is in the range of 6.3–6.9%. The primary component of the coating is intended to be chromium with an atomic fraction of around 45%.
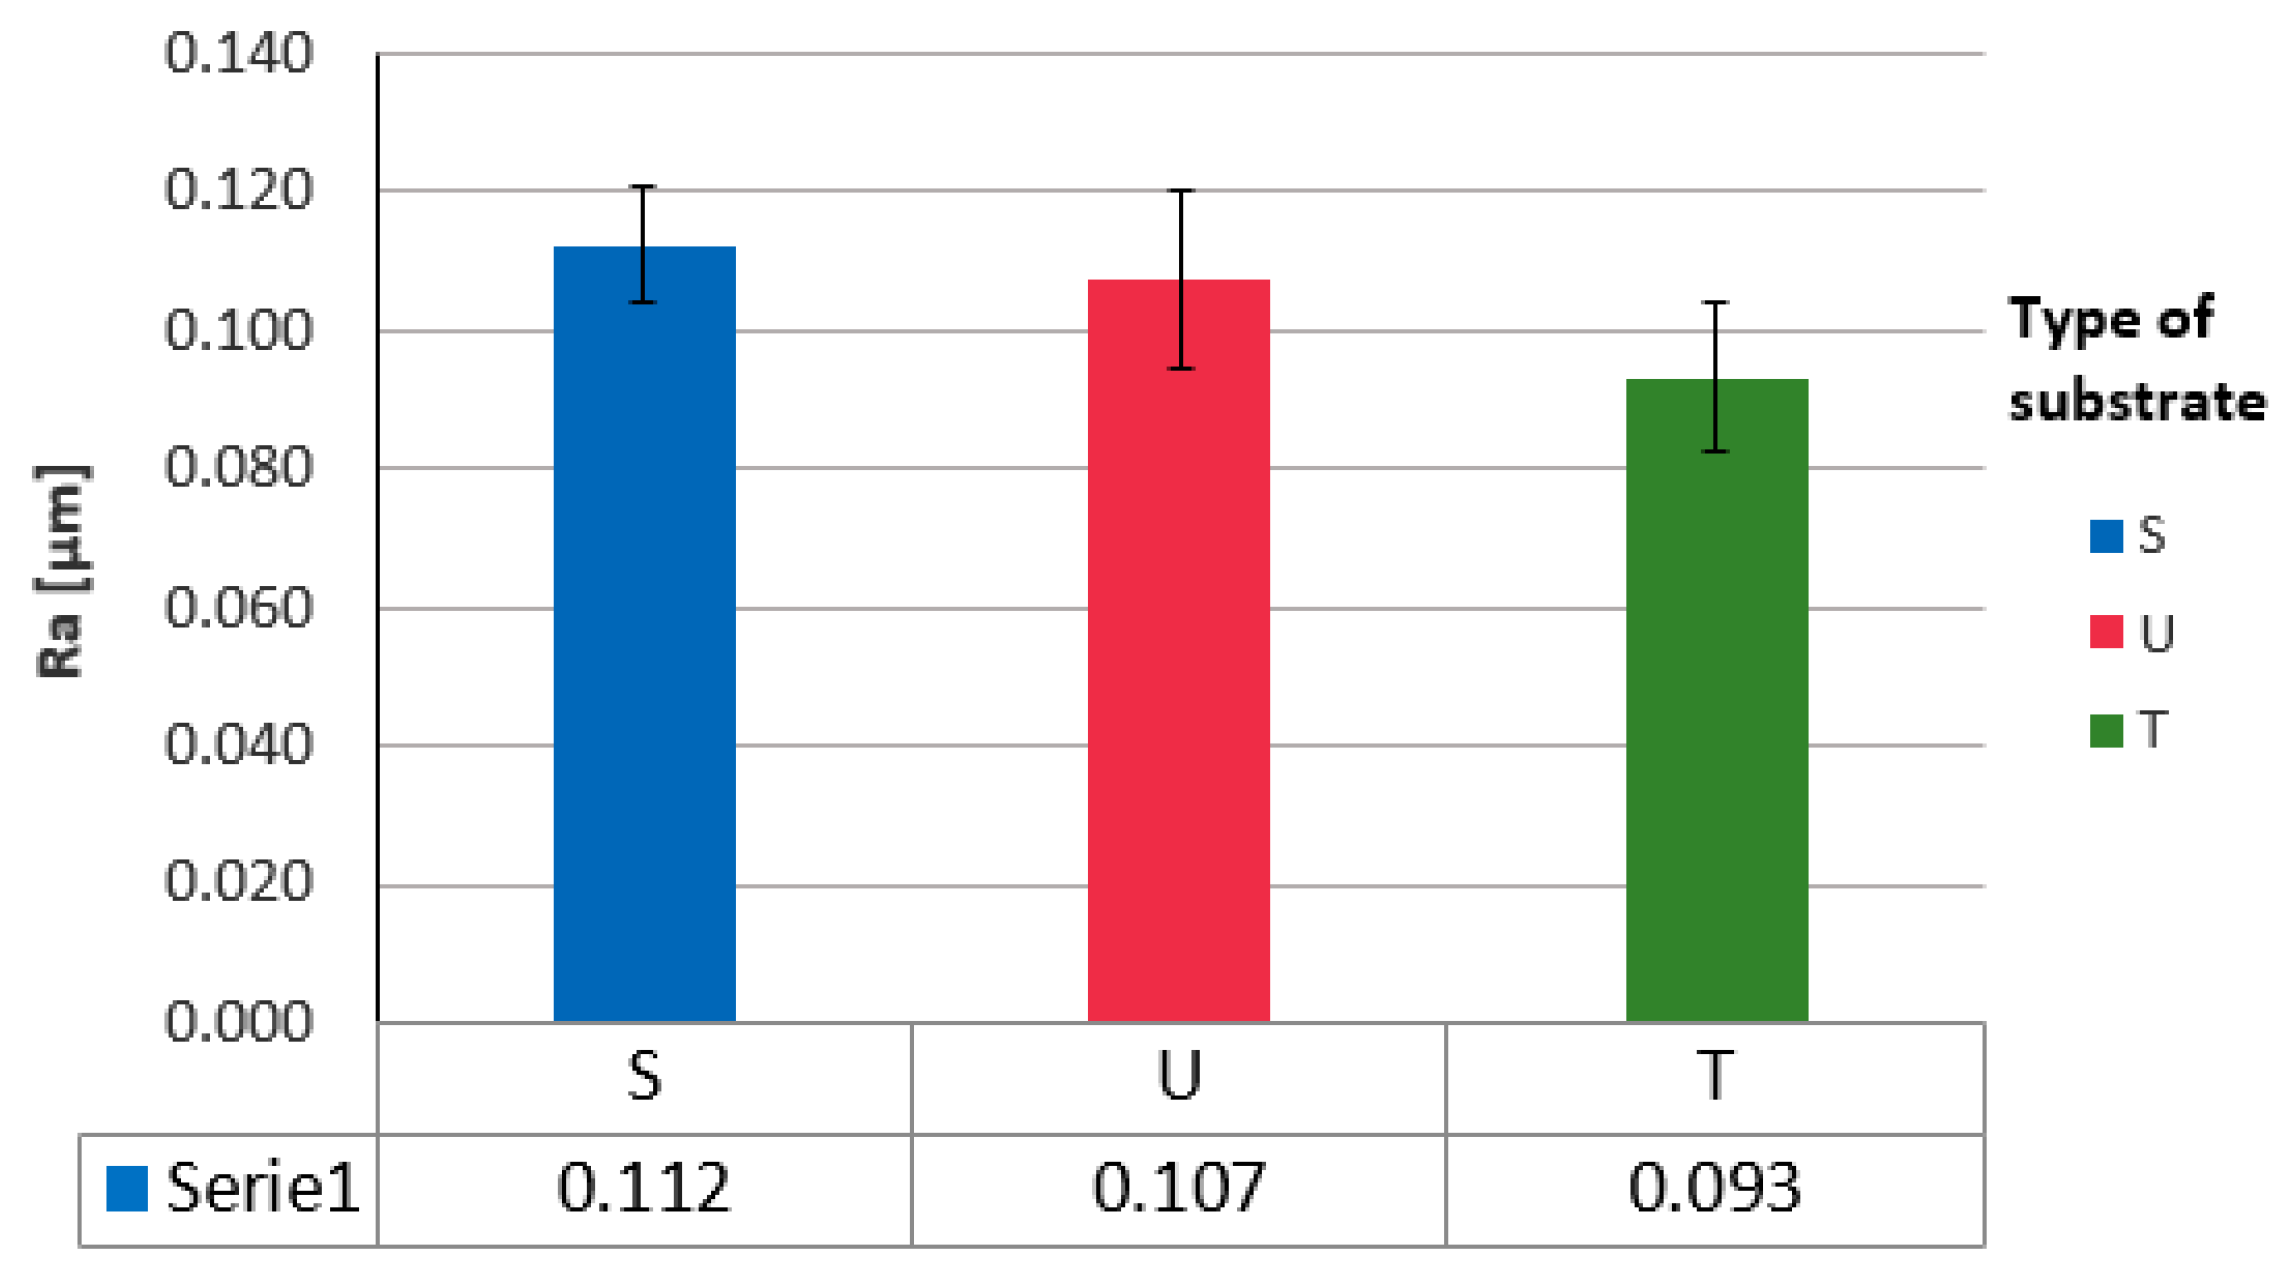
The surface roughness of CrN/CrAlN coatings deposited on S, U, and T substrates is shown in
Figure 7. No influence of the substrate on the roughness parameters of the coatings was observed. Since the roughness of the tools was measured along the grooves, no significant differences in roughness were found, which is not exactly consistent with the coating topography observed in the SEM images (
Figure 6a–c).
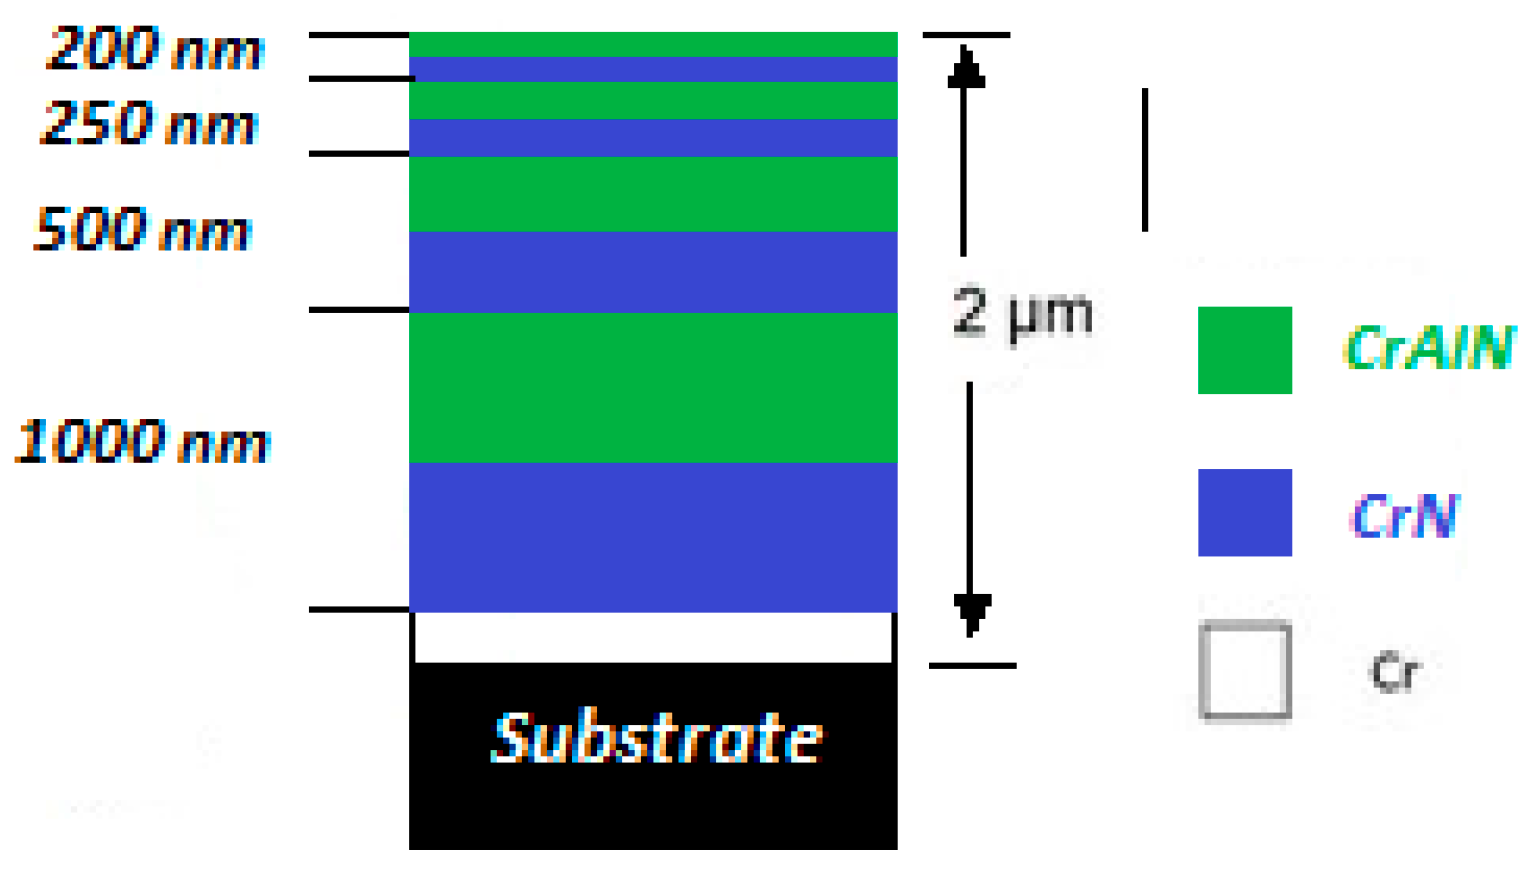
Further studies focused on determining and verifying the thickness of the applied coatings. Observation of the craters formed during the ball test revealed a high degree of surface inhomogeneity. The surface is characterized by numerous scratches after grinding, and jagged edges at the transition from the sample surface to the crater formed due to the abrasion process. Abrasions were performed on the sample marked as T, which revealed a coating with a thickness of 1–1.09 µm. The resulting spherical microsections show that the coating fills the unevenness of the substrate, which may indicate its good adhesion. The average measurement from all abrasions was 1.25 µm ± 0.23 µm
3.8. Microgeometry Results
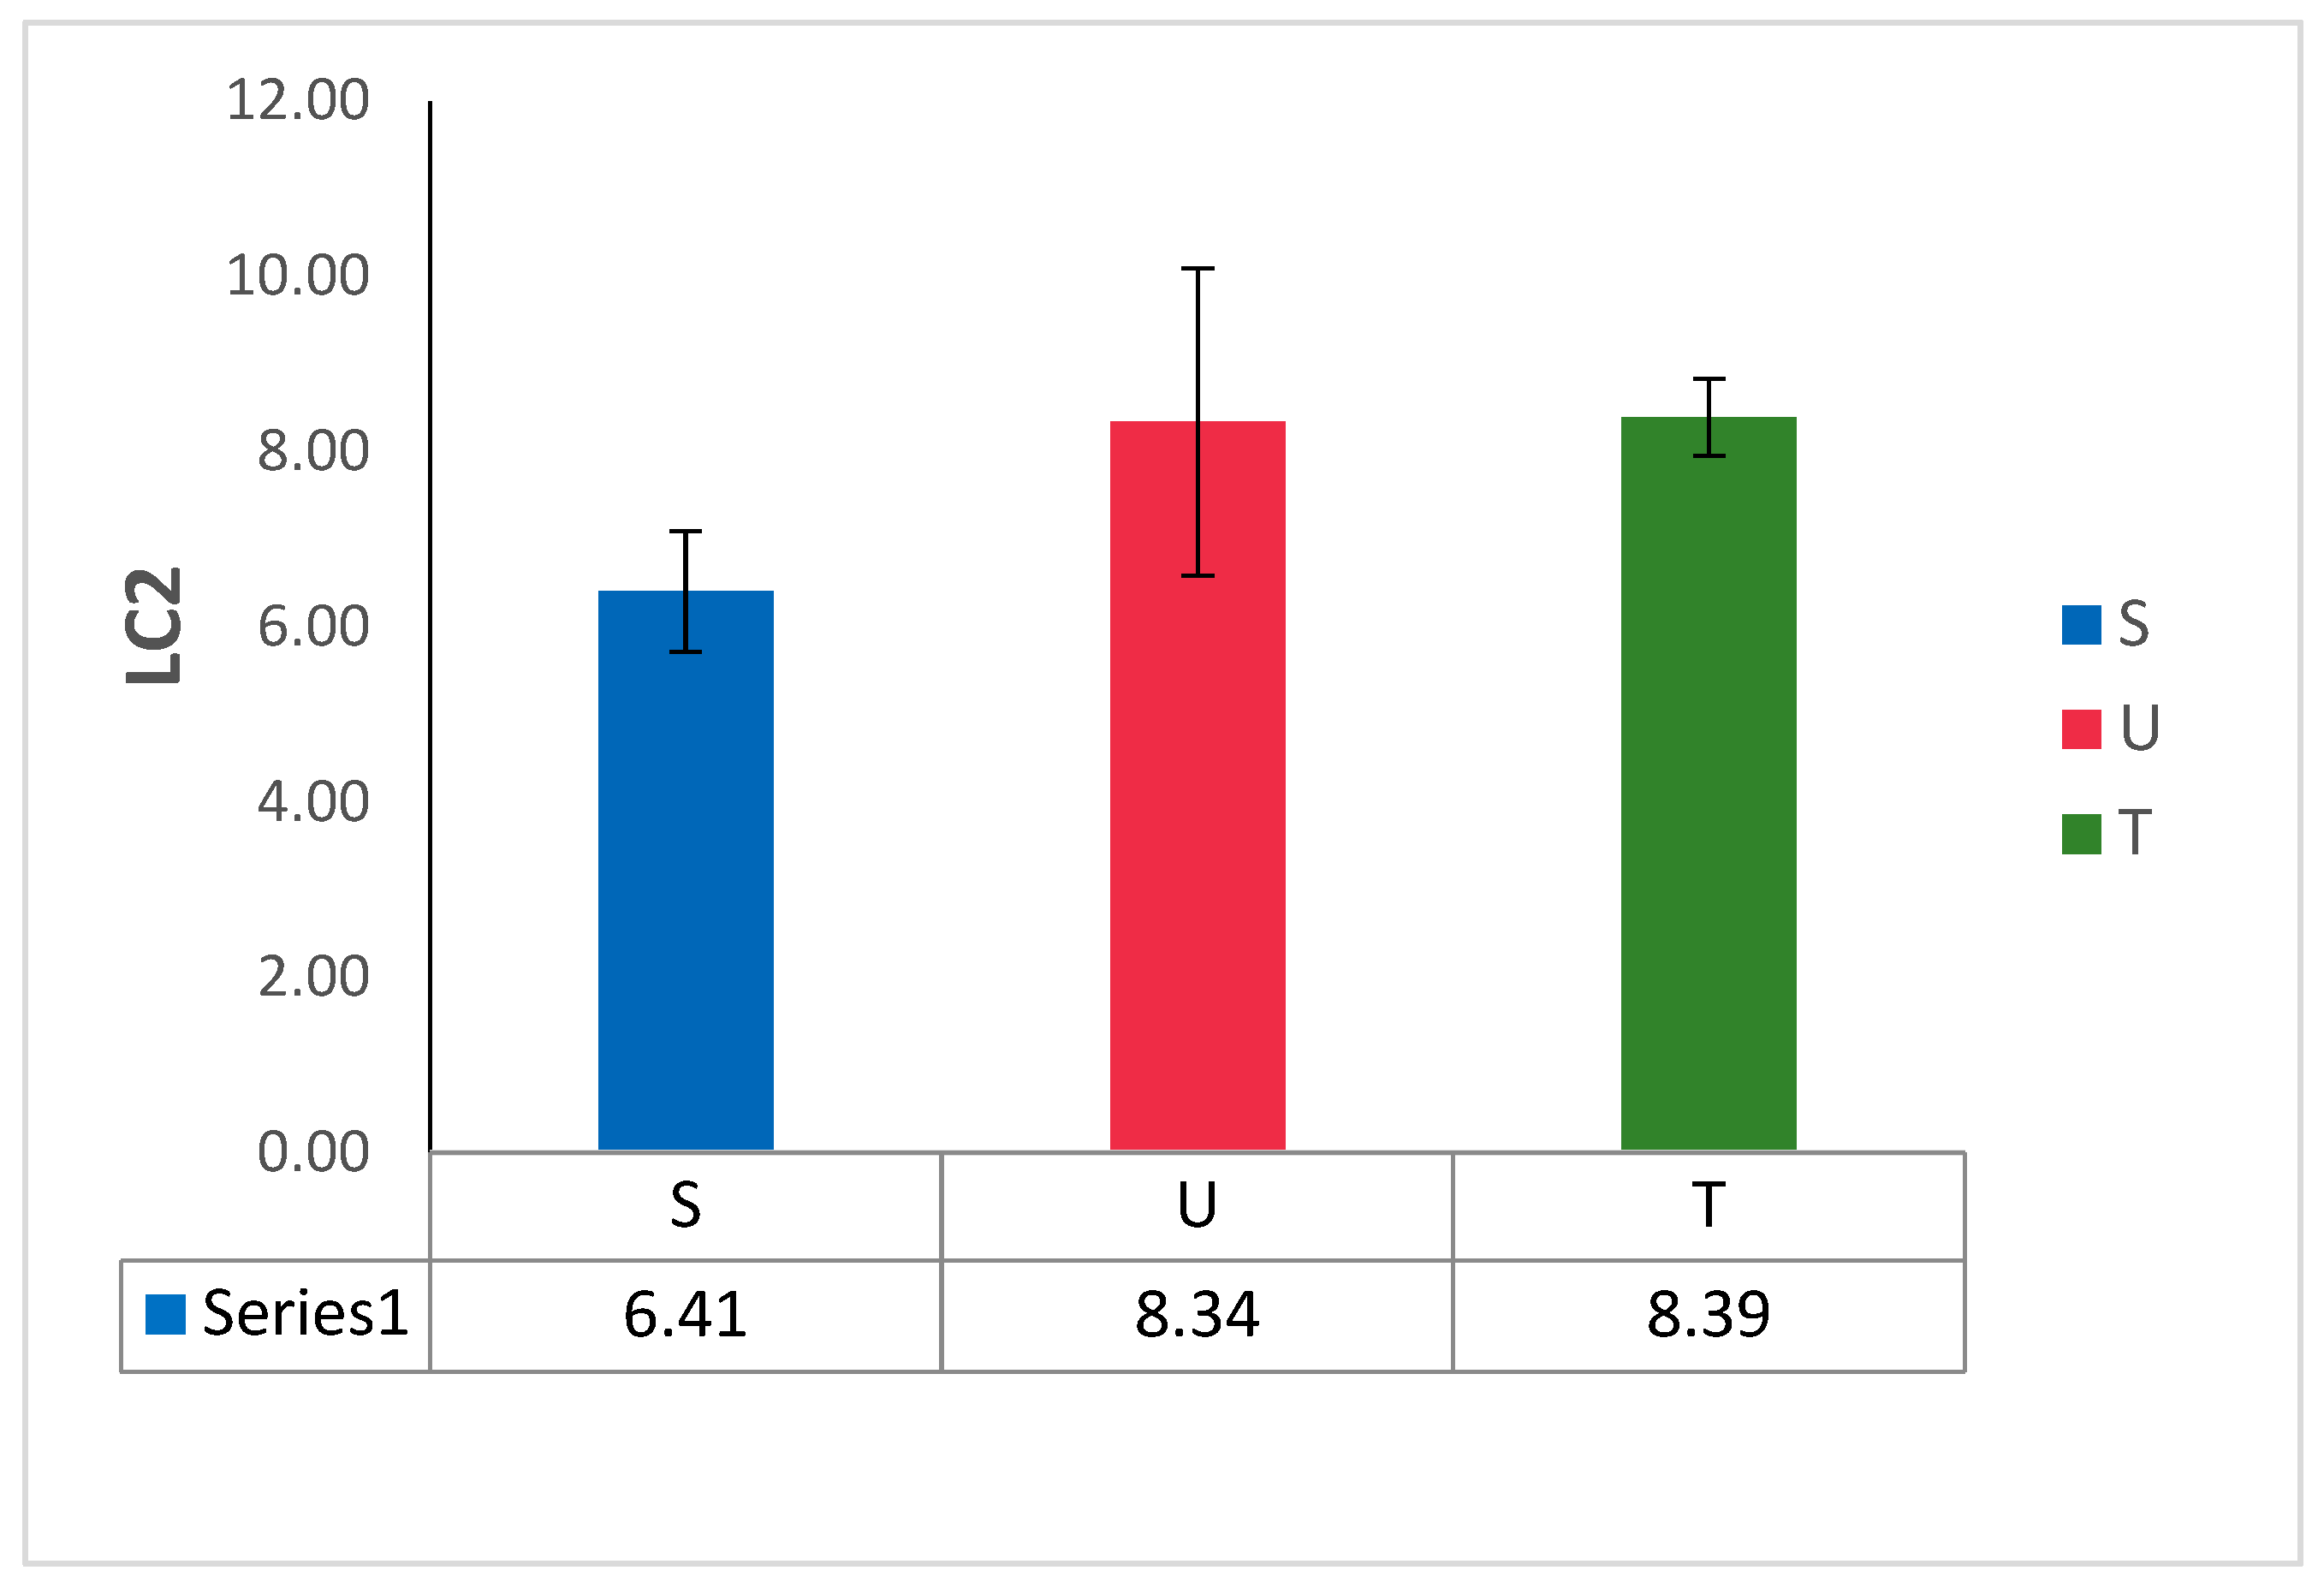
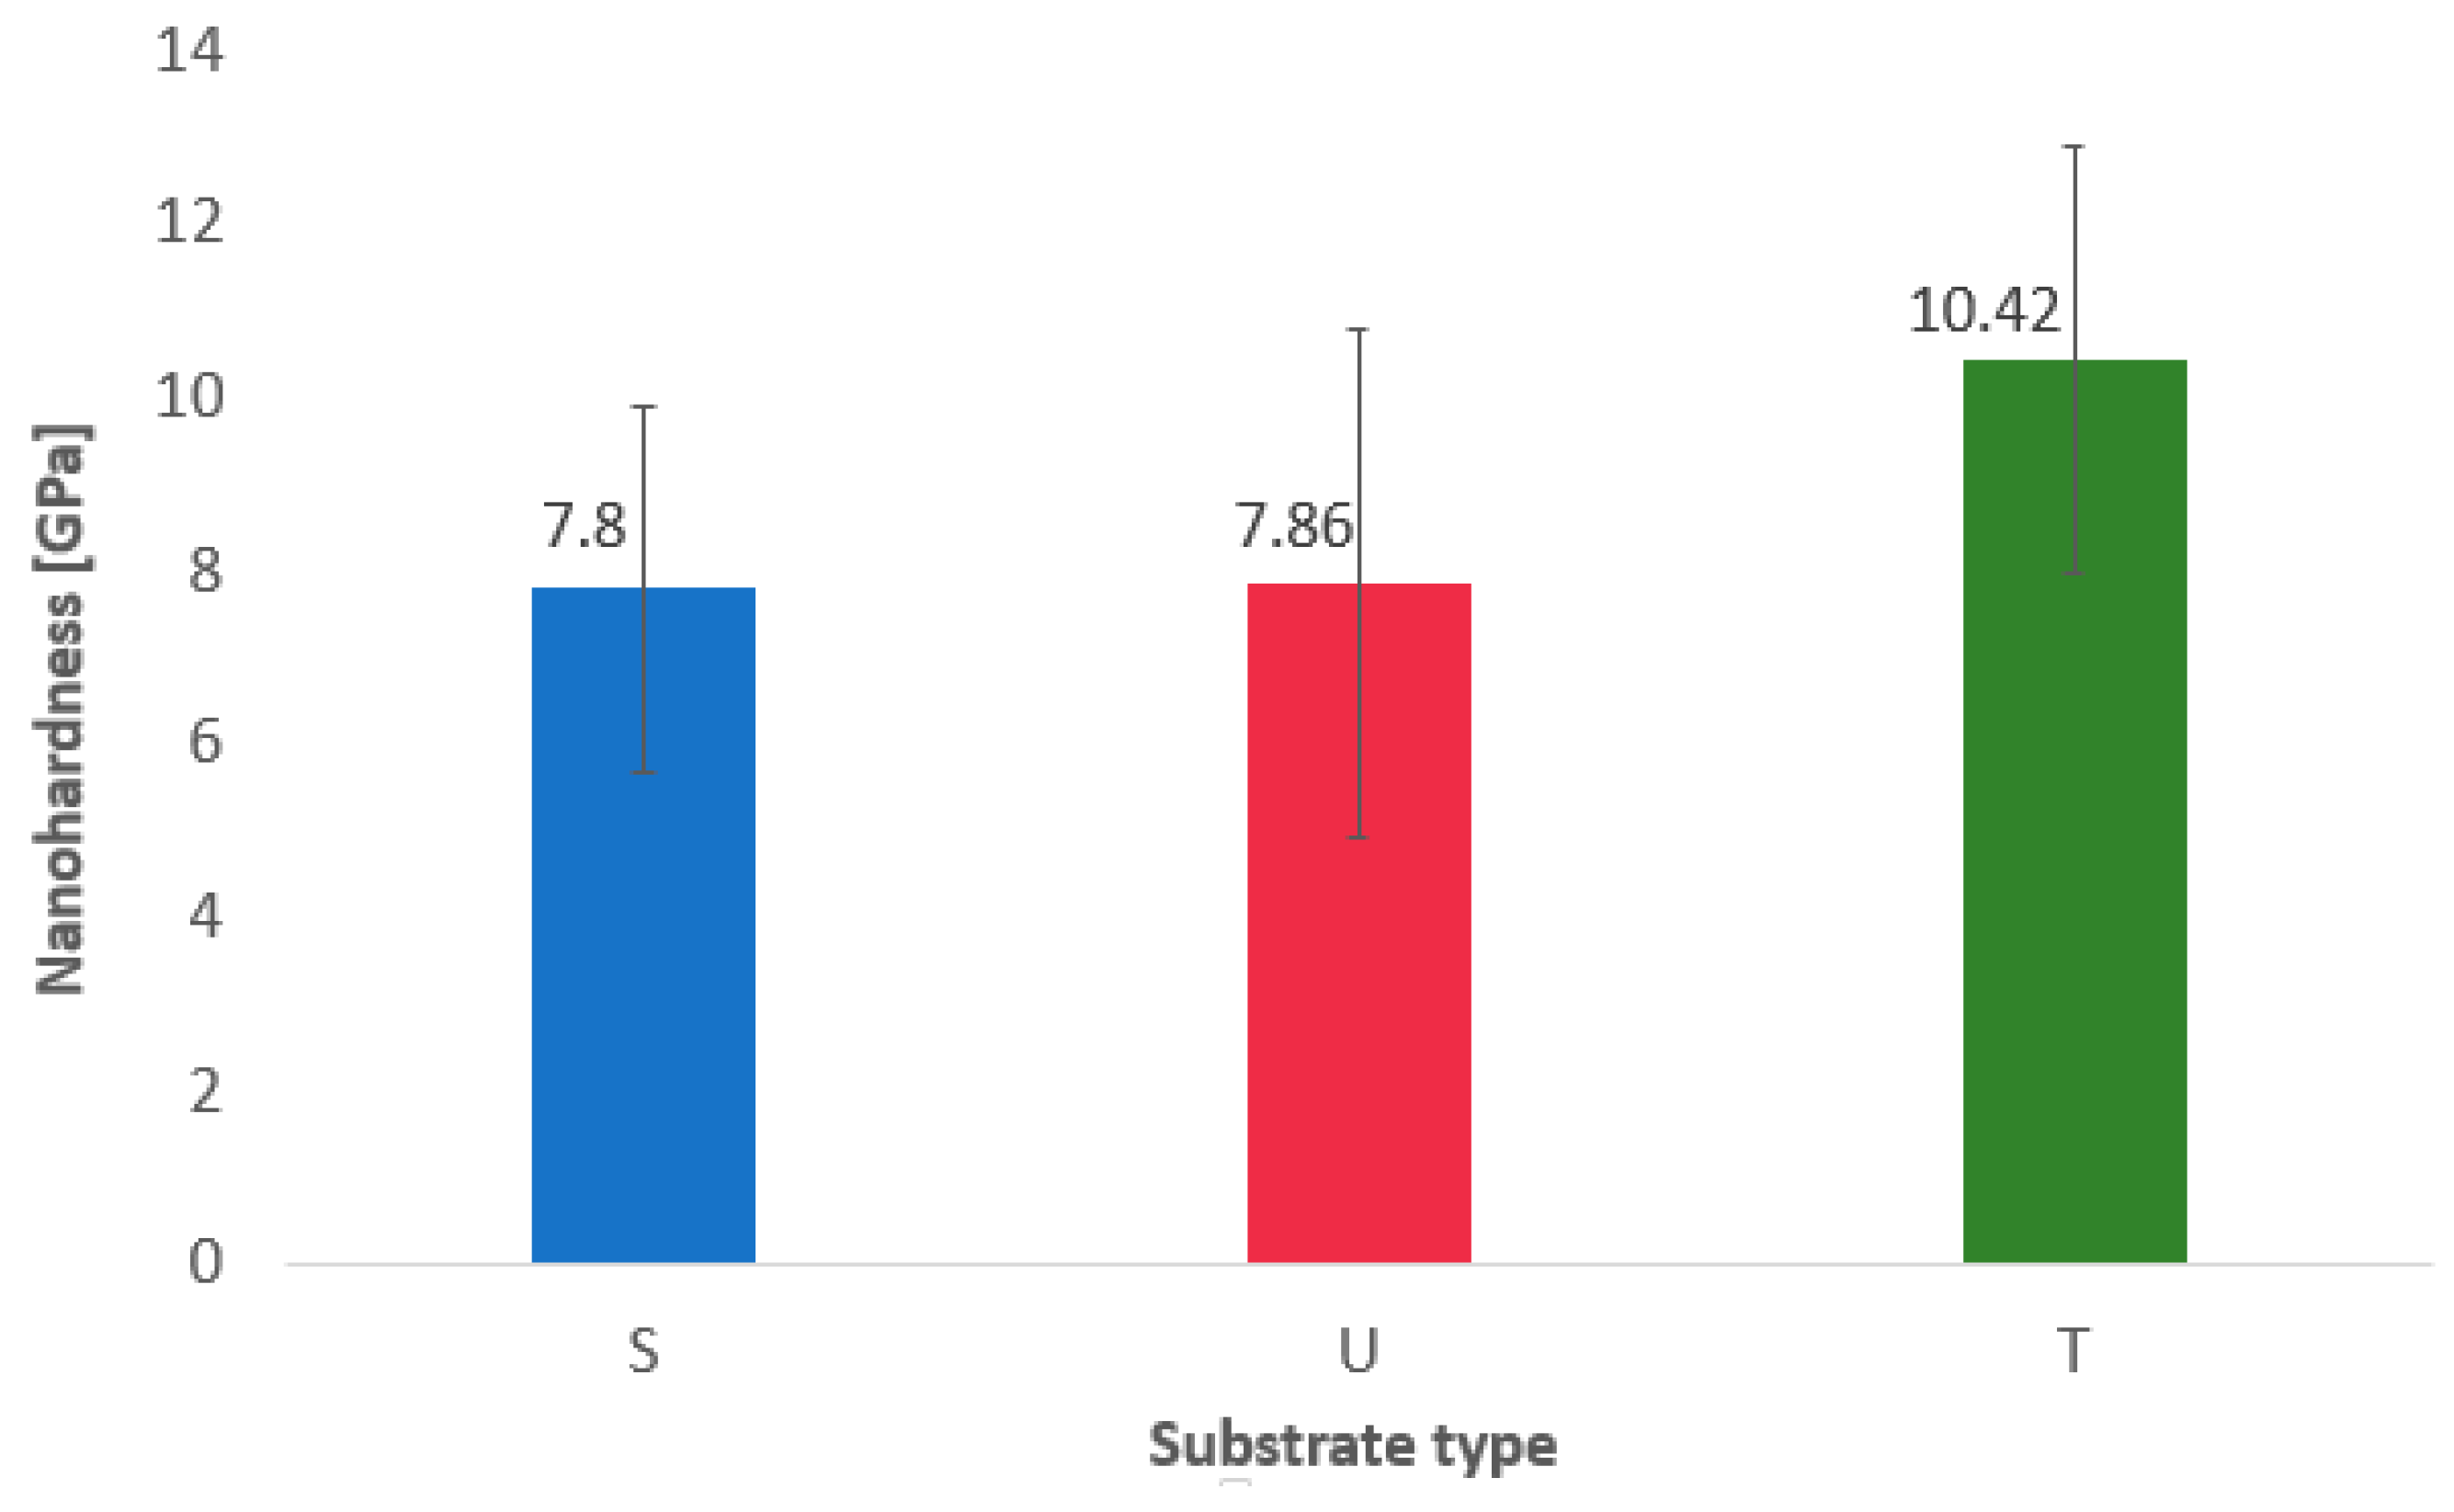
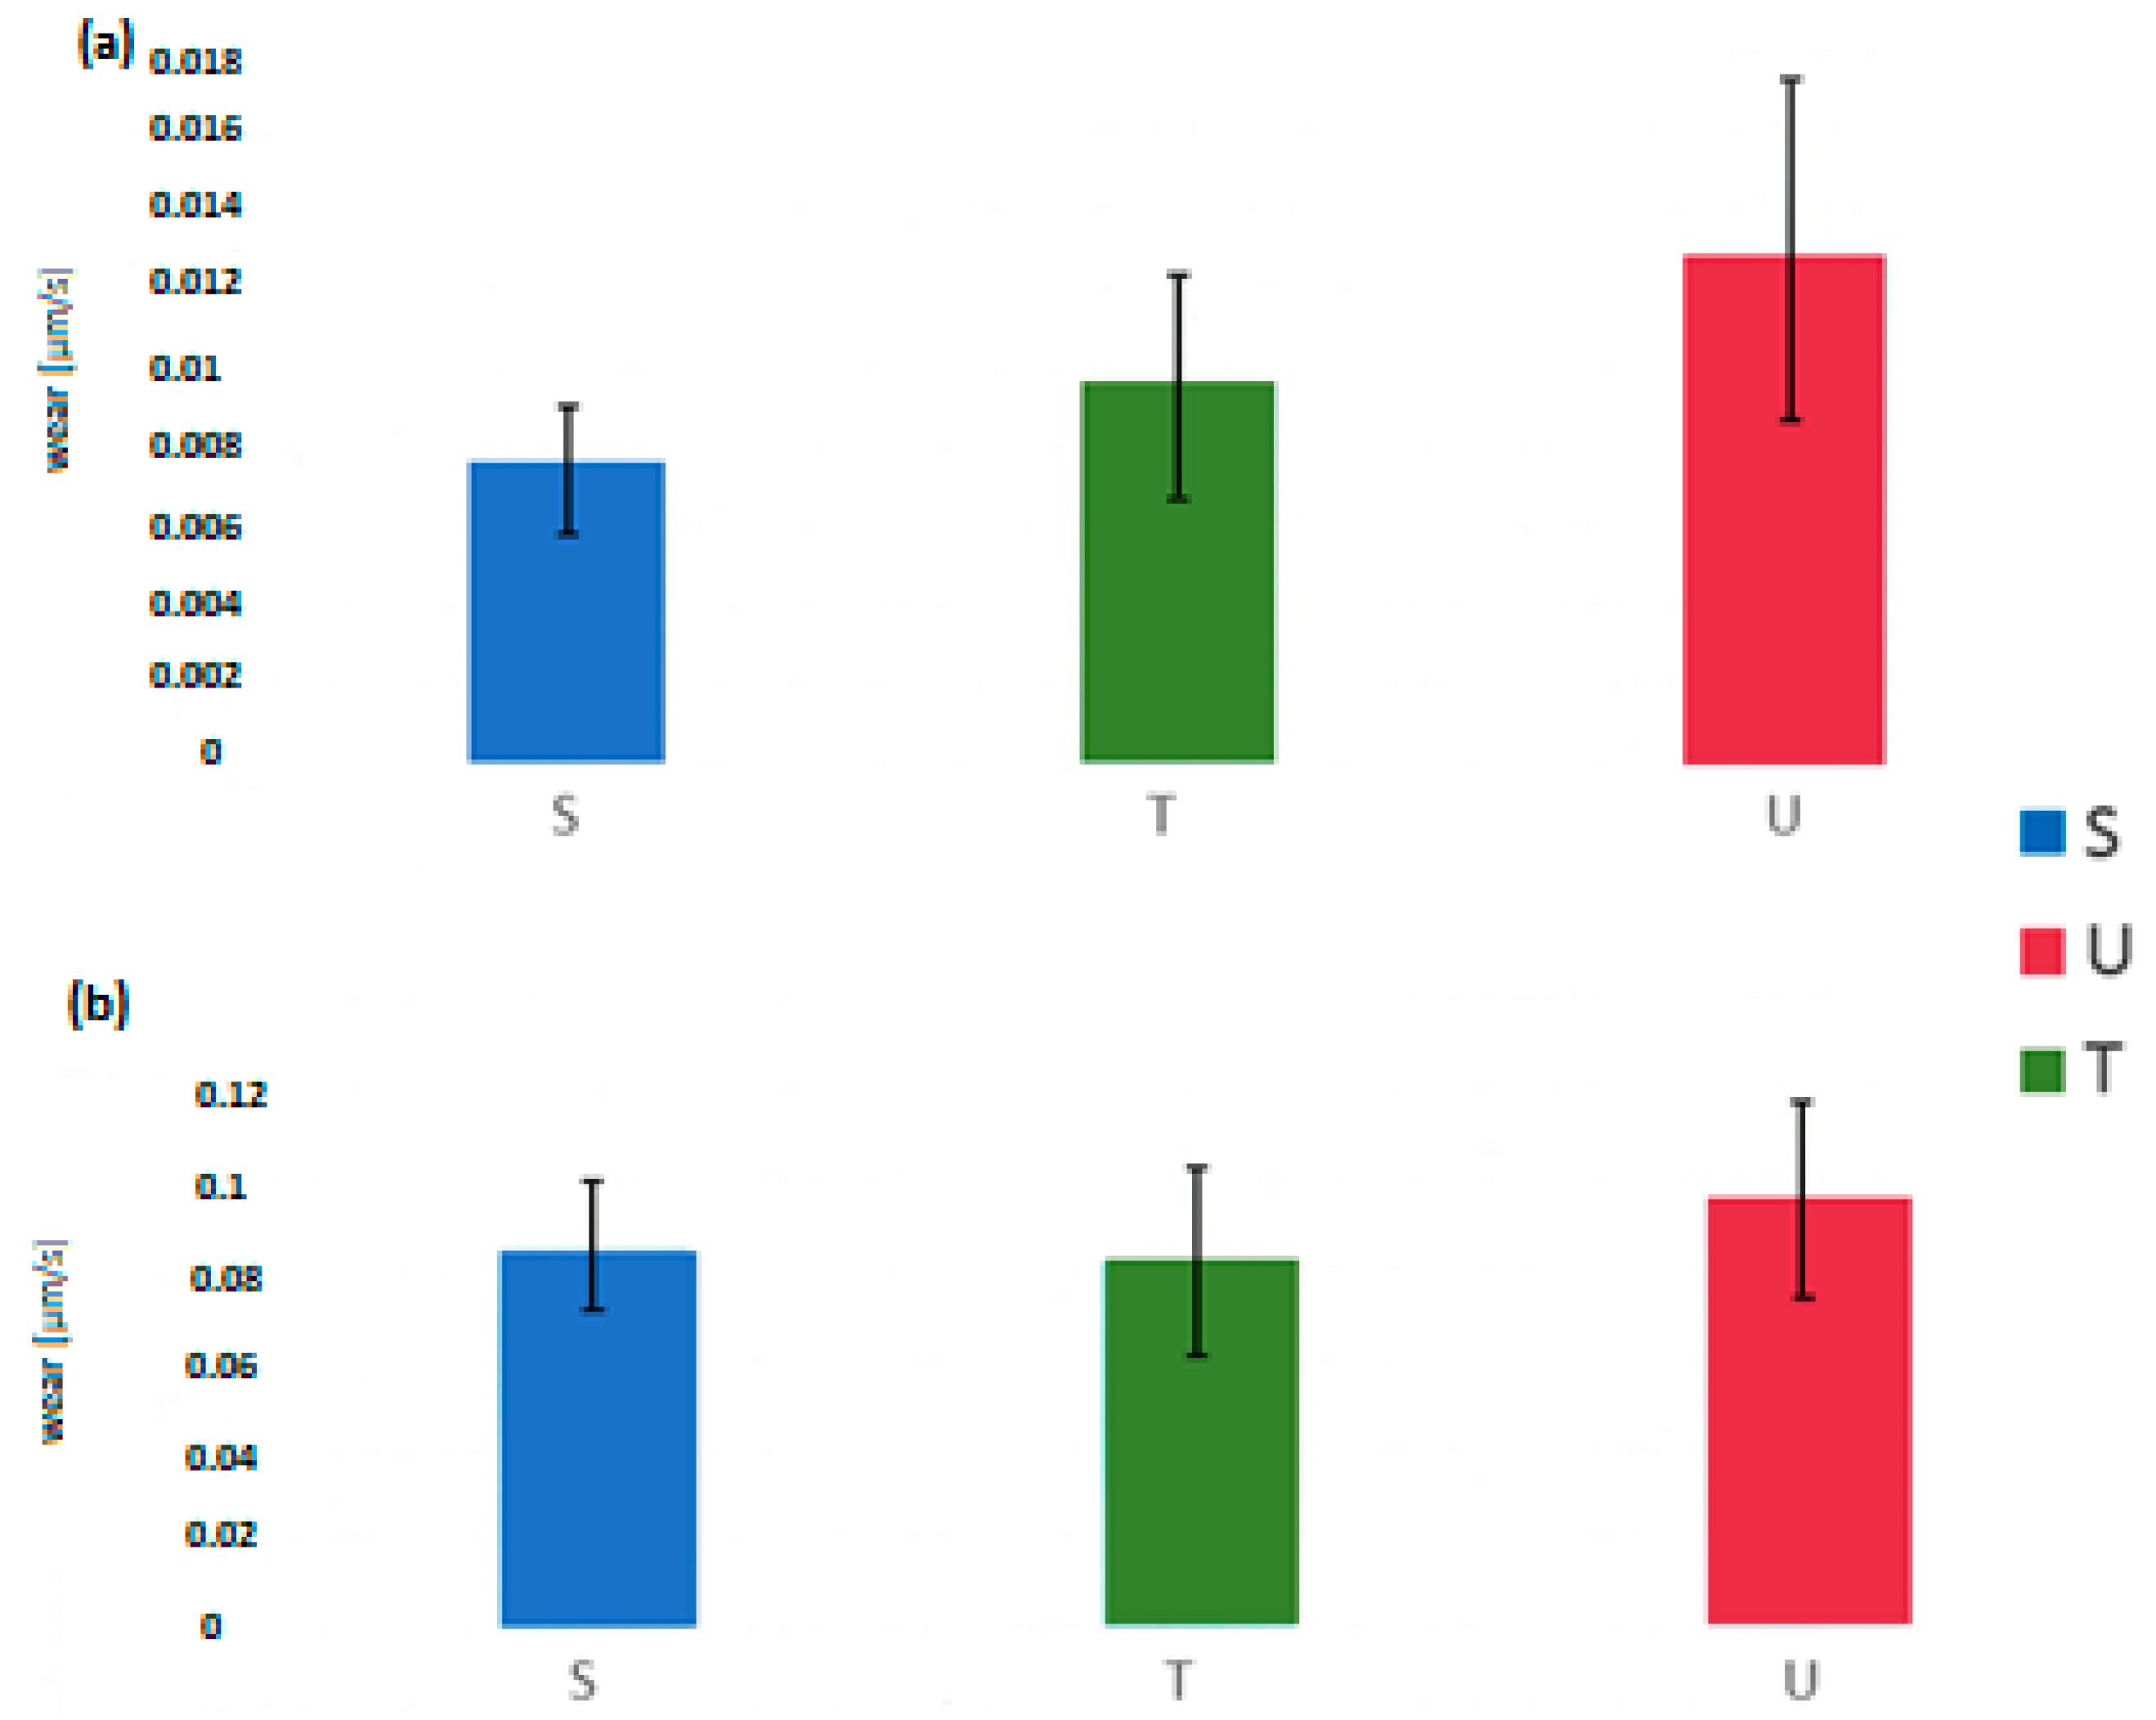
Due to the fact that the surface morphology studies and nanohardness analysis did not clearly explain the source of problems related to the durability of the coating applied to substrate U, detailed studies of the microgeometry of the rounding were carried out. Therefore, the preliminary procedure before the appropriate analysis of variance (ANOVA) was carried out. The first step was to verify whether the variances in the individual variable groups (S, U, T) differ statistically significantly, i.e., whether they are homogeneous (Loeven’s test). The results of the analysis conducted using Statistica software (TIBCO Software Inc, version 13.00.0) showed that they are heterogeneous for the indicators considered. Therefore, the proper ANOVA analysis was abandoned. To obtain information about which variant was responsible for rejecting the null hypothesis of homogeneity of variance, post hoc tests, also known as multiple-comparison tests, were used. The NIR test was chosen.
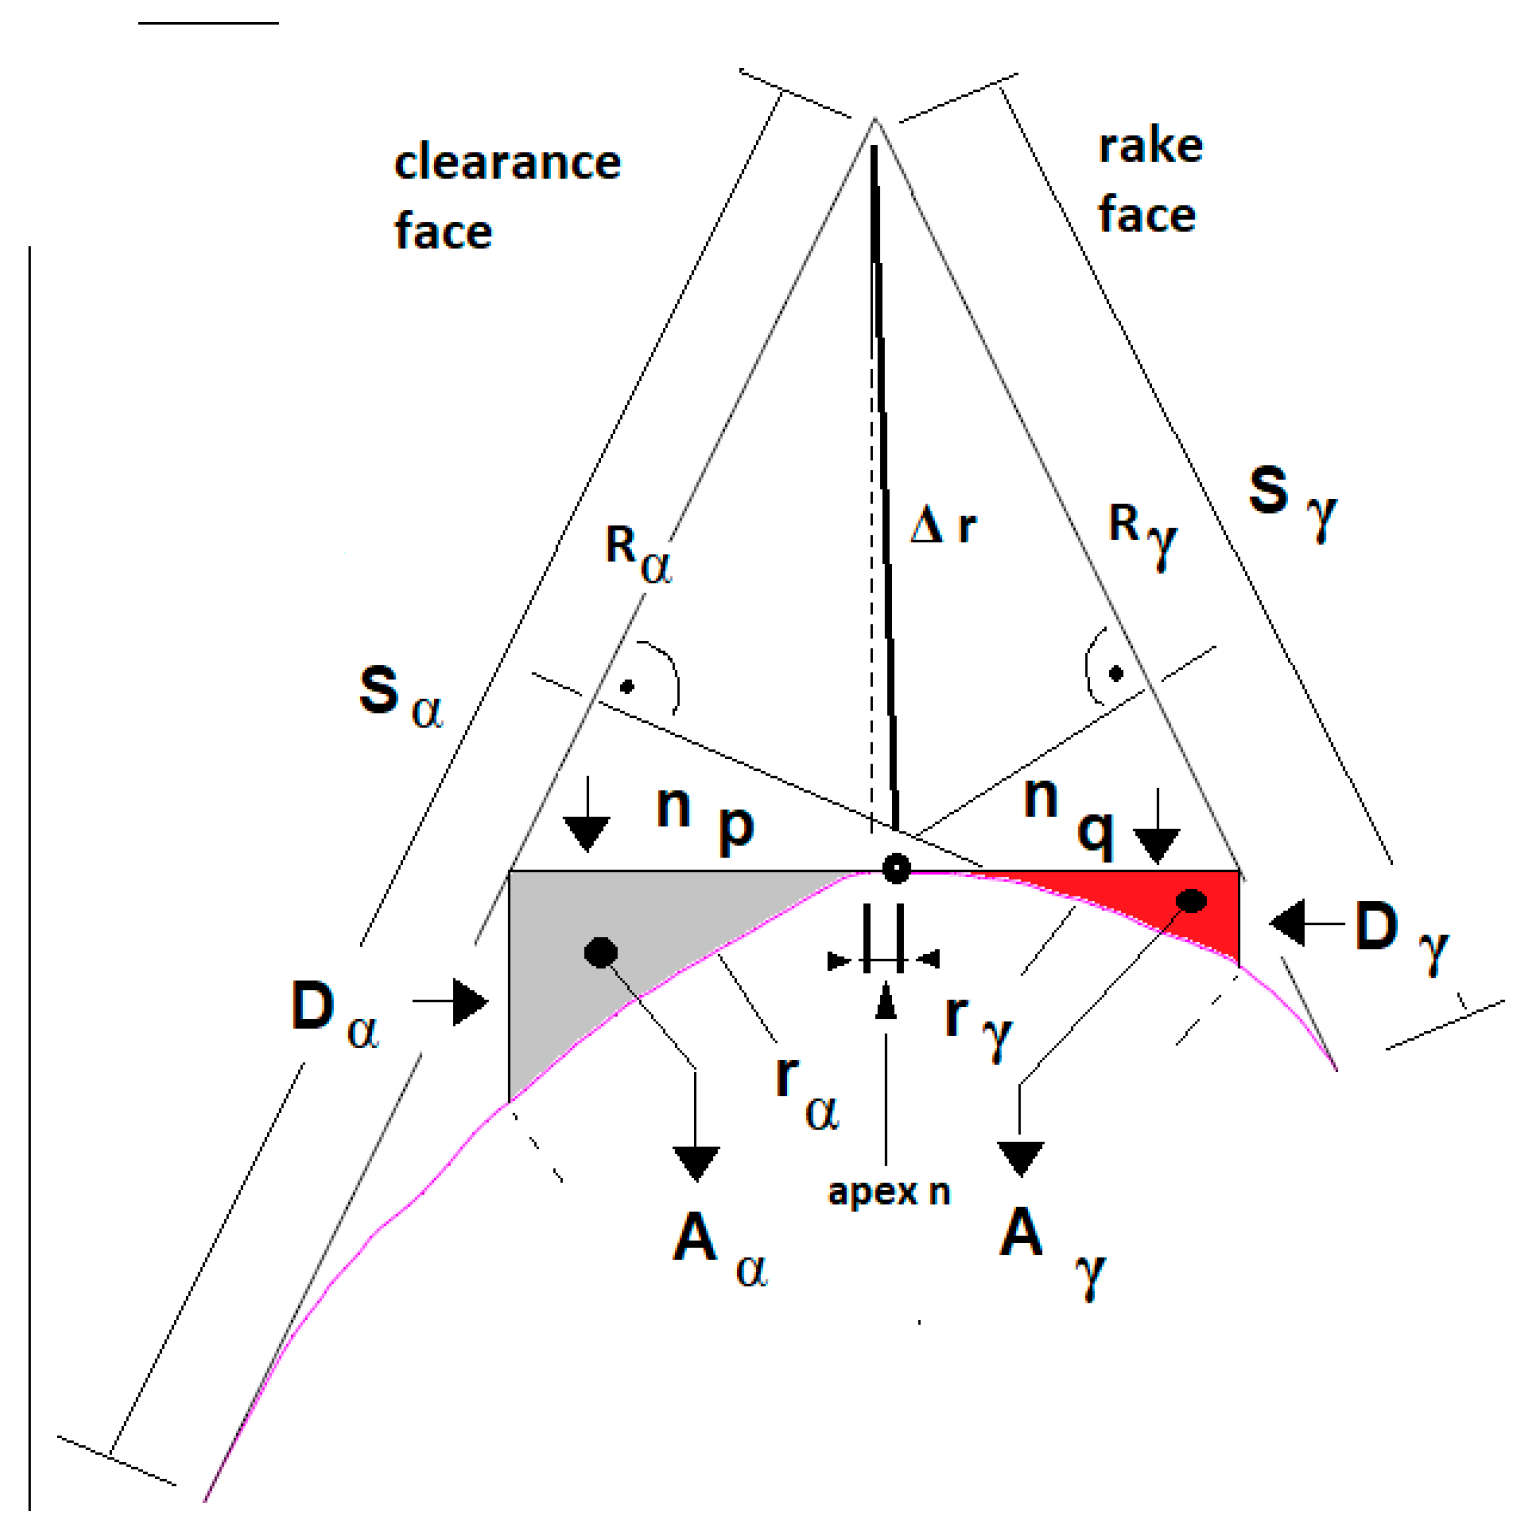
The first group of analyzed variables included the wear indicators S
α,γ, R
α,γ, and r
α, shown in
Figure 2. A summary of the mean values for the individual variables is presented in
Table 6, while the NIR test results are presented in
Table 7. The results show that for each of the variables considered, there is a statistically significant difference between the S and U-type substrates. In the comparison of the S and T cutters, the difference is statistically significant only for the S
α and R
α wear indicators. Comparing the mean values for the U and T cutters, the differences between the above-mentioned variants are even less pronounced, as they are only noticeable in the case of the rounding radius r
α determined from the clearance surface. In summary, it can be seen that a brand-new U-type blade shows initial signs of wear, indicating problems that may have occurred during tool preparation.
The second group of analyzed variables included indicators defining the asymmetry of the tip radius: D
α, A
α, nq, and apex n. The mean values for individual variables are presented in
Table 8, while the NIR test results are presented in
Table 9. As was the case with the analysis of wear indicators, statistically significant differences between S and U were observed for all variables considered. However, with the exception of the Aα indicator, no statistically significant difference was observed between substrates S and T. The data indicate that in the case of substrate U, there was a very significant shift of the fillet apex toward the flank, as evidenced by the change in the apex n value from approximately 0.5 μm (S) to approximately 1.7 μm (U). This was also accompanied by statistically significant changes in the remaining indicators presented in
Table 8.
The third group of analyzed variables included indicators describing the operating conditions of the cutting edge. The mean values for each variable are presented in
Table 10, and the NIR test results are presented in
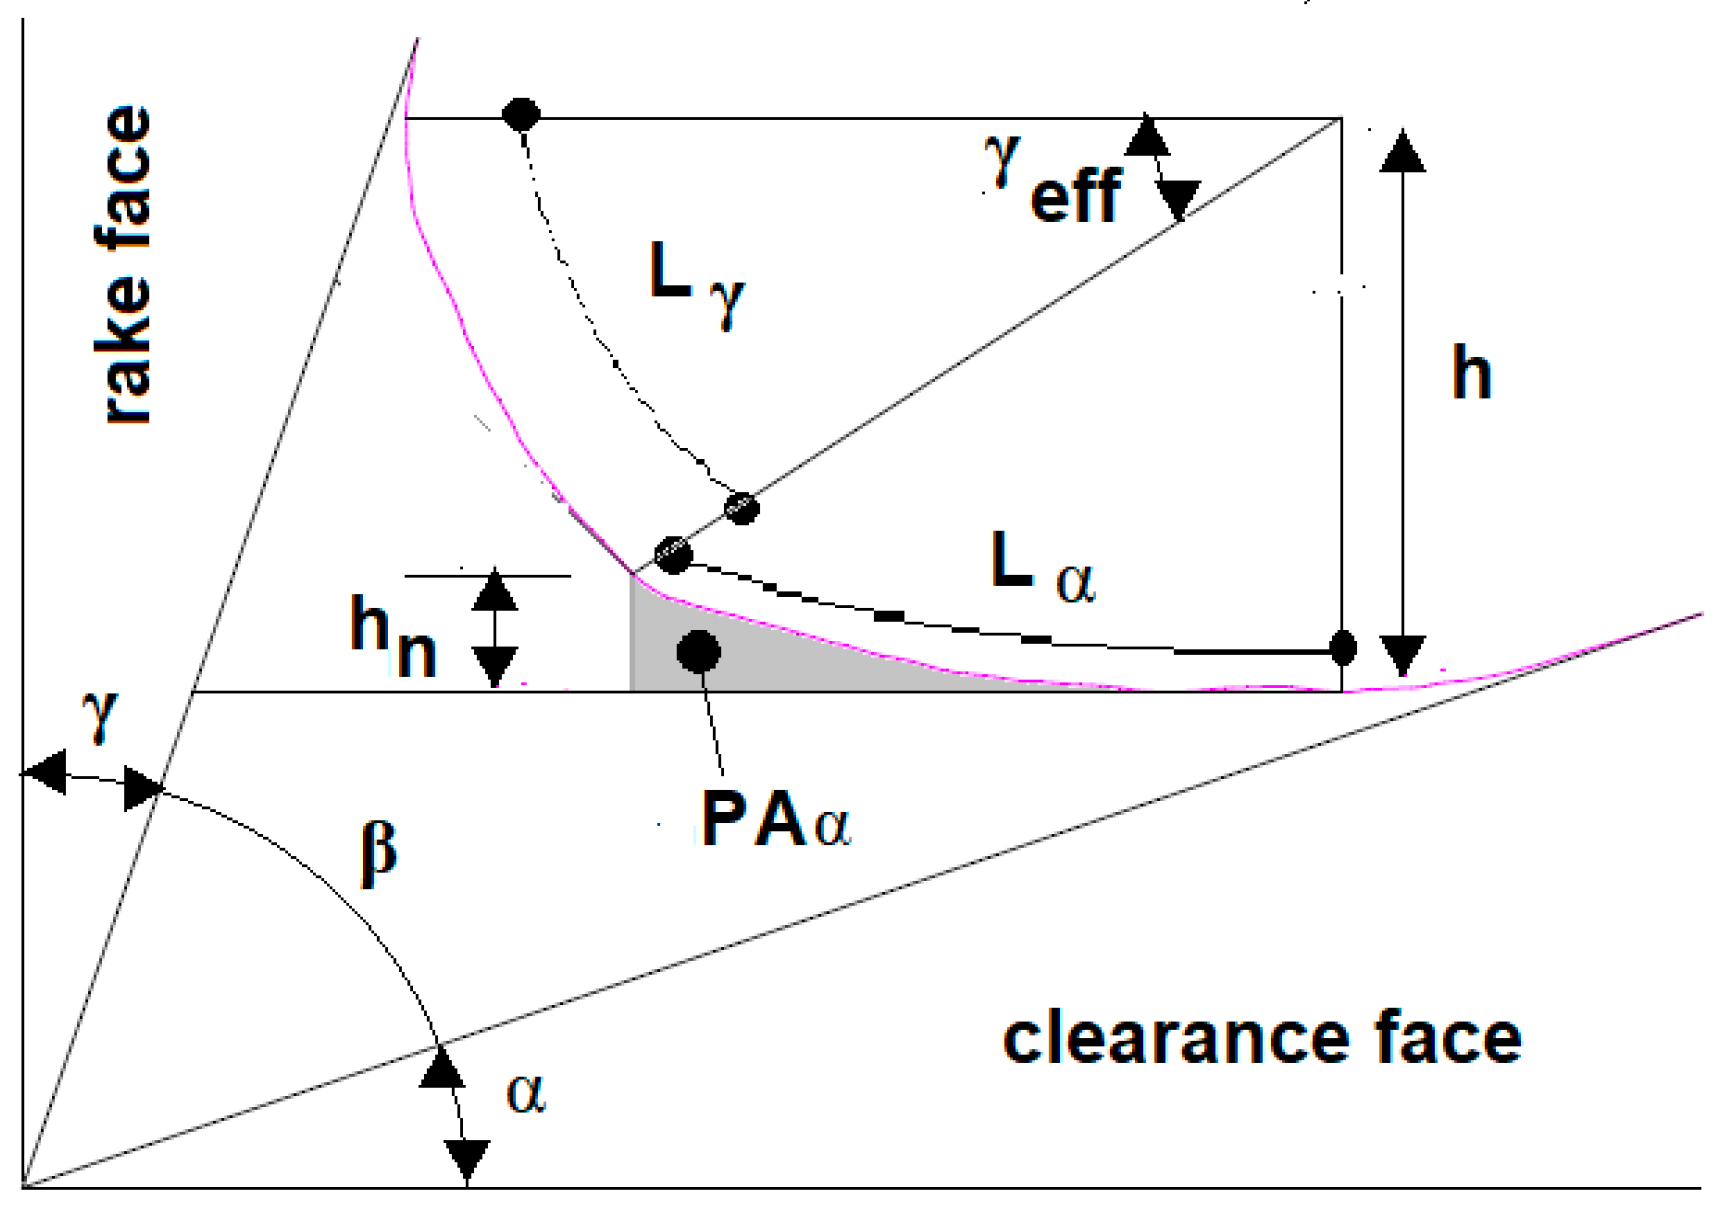
Table 11. Statistically significant differences were observed in the contact length of the cutting edge with the material on the flank side, L
α, and the volume of material crushed during machining between variants S and U. For example, L
α for the S blade was approximately 2 μm, while for the U blade it was as much as 11 μm. Such significant differences in this respect could have contributed to the deterioration of the operational properties of the coating applied to the U substrate.
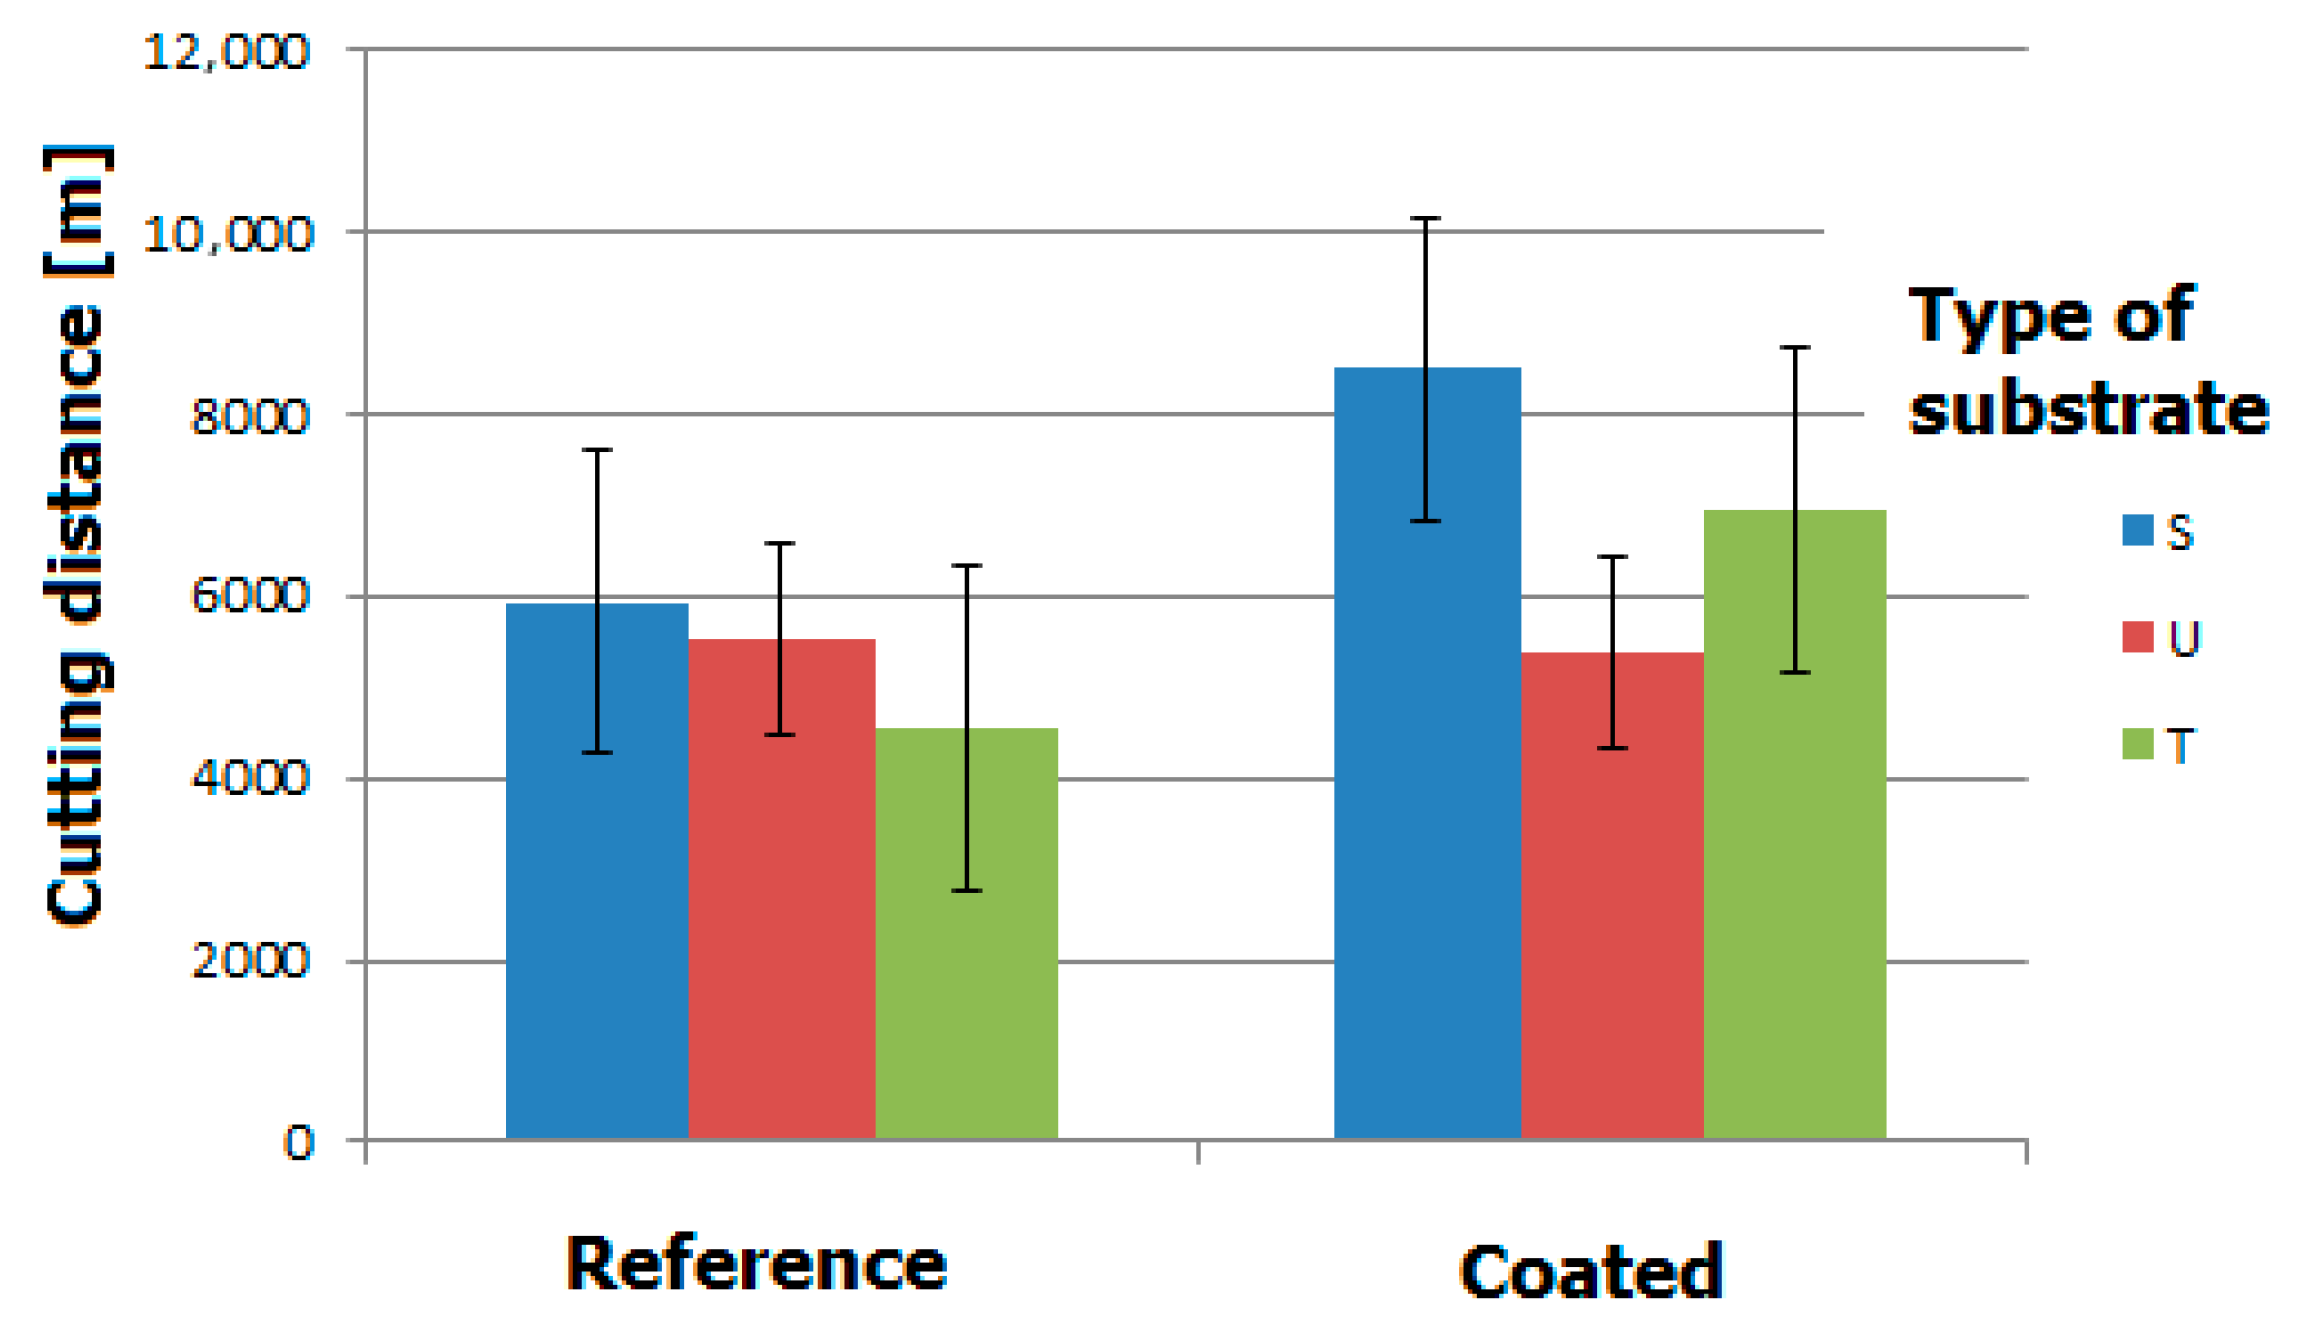
In summary, both the differences in the initial tool wear indicators recorded for a brand-new tool and the less favorable operating conditions resulting from the change in the Lα parameter value could have caused the significantly poorer performance of the tool based on the U substrate compared to the others in the durability tests. Furthermore, the significant changes in the rounding asymmetry in the case of the mentioned variant (U) compared to variant S could have additionally led to an unfavorable stress distribution in the coating, thus causing its premature failure.
According to the authors, the key factors that caused the largest differences between the S and U substrates were disruptions in the manufacturing process. These can have a much greater impact on the operational properties of the tools than the microstructure of the tool material itself. In mass production conditions, such as the production of replaceable inserts for milling cutters, maintaining perfect repeatability of the cutting edge rounding is practically impossible. This is influenced, among other things, by the microstructure of the cemented carbide itself, where there is a very high risk of chipping and grain loss at the tip during the production process, for example, during finishing.
The difficulties associated with ensuring optimal cutting edge shape are evidenced by the high standard deviation values for individual indicators describing its microgeometry, clearly visible in the case of the U-type substrate. Consequently, a coating applied to this type of substrate will not fully fulfill its intended purpose. It should be noted that an attempt to explain the causes of this phenomenon based on microstructure and surface morphology studies was undertaken in this article. Unfortunately, it did not provide a fully satisfactory answer.
