3.1. Temperature Distribution of the EAHT
To clarify EAHT temperature variation and specimens’ thermal response under different current densities,
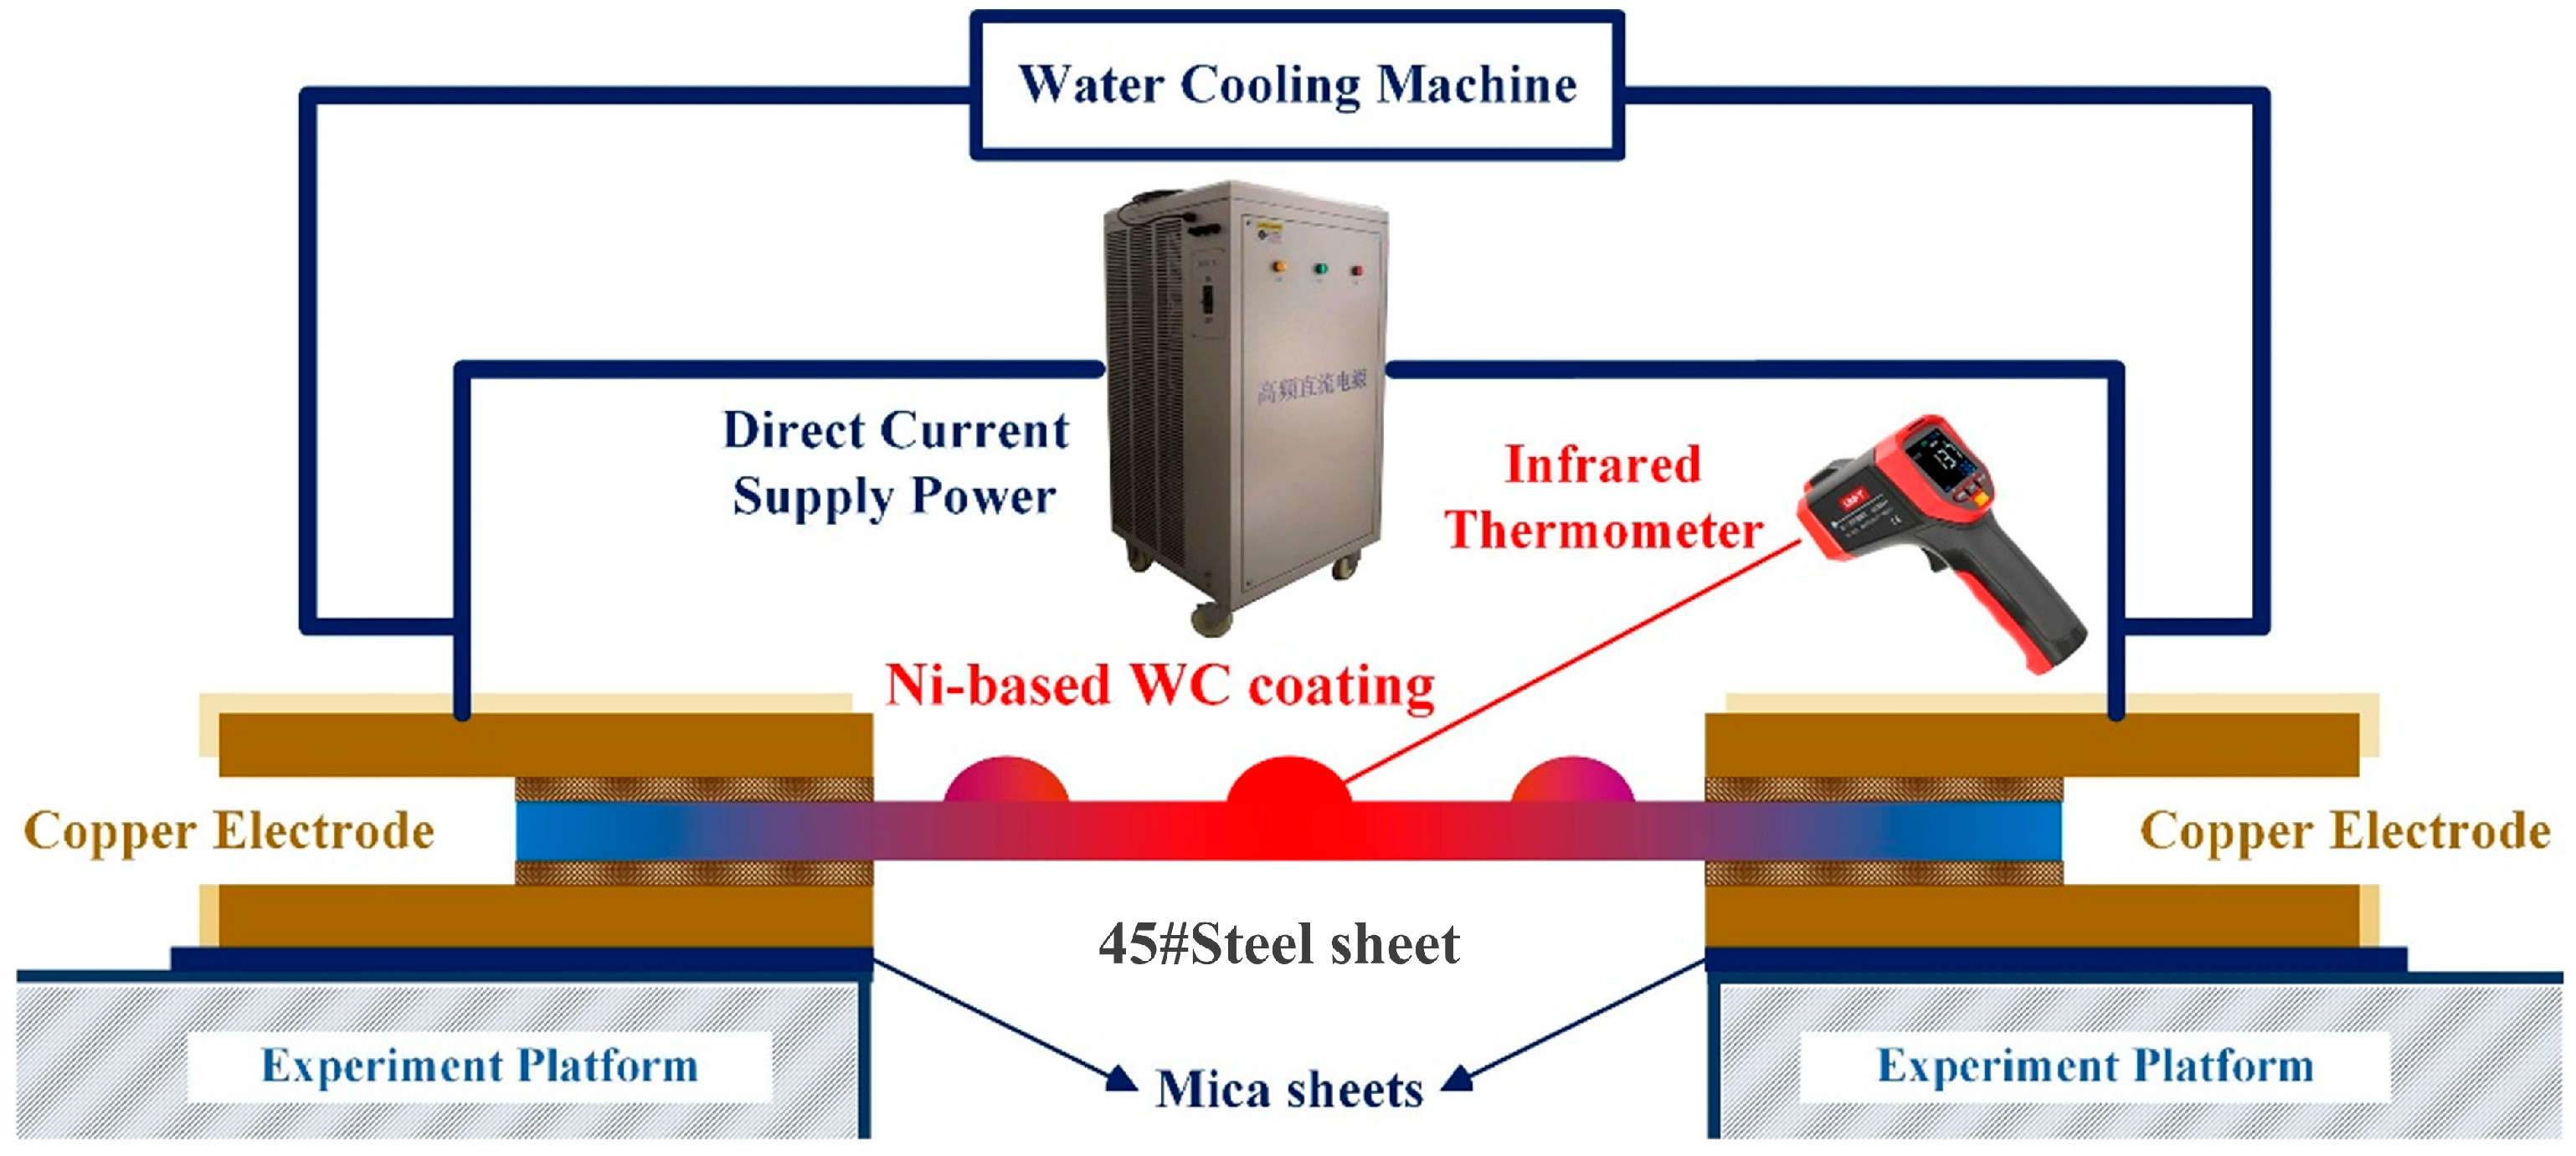
Figure 2 provides a schematic of the EAHT process and thermal images for various current densities. The yellow zone in
Figure 2e is the temperature measurement point.
Figure 2 shows that when the EAHT is carried out, the temperature of the sample changes with the passage of electricity. The white part in the thermal image is the highest temperature point, i.e., the Ni60/WC coating part that was pre-fabricated only on the central region (10 mm × 30 mm) of the steel plate (consistent with the coating location specified in
Section 2.1). The reason for this is that the coating includes defects such as covalent bonding compounds, cracks and holes, which result in a higher electrical resistance than that in the nondefective zones, resulting in a higher electrical resistance of the coated material compared to the substrate, and at the same time, a higher temperature.
To elucidate the temperature distribution and crack arrest mechanism inside the coating during EAHT, finite element analysis was performed using ANSYS (Version 2021 R1) based on experimental conditions and relevant literature [
24,
25]. A 45# medium carbon steel model with dimensions of 80 mm × 40 mm × 3 mm (mesh size: 1 mm) was established, as shown in
Figure 3. The crack morphology was simplified, based on preliminary experiments: post-laser cladding Ni60/WC coating characterizations showed cracks have regular features (through-thickness, adjacent pores, bifurcated tips), as shown in
Figure 3a, and these features were retained in the simulation.
A current of 1000 A was applied at one end of the model, with the opposite end grounded (0 A). Convective heat transfer boundary conditions were set (film coefficient: 0.0001 W/(mm
2·°C), emissivity: 0.93), as illustrated in
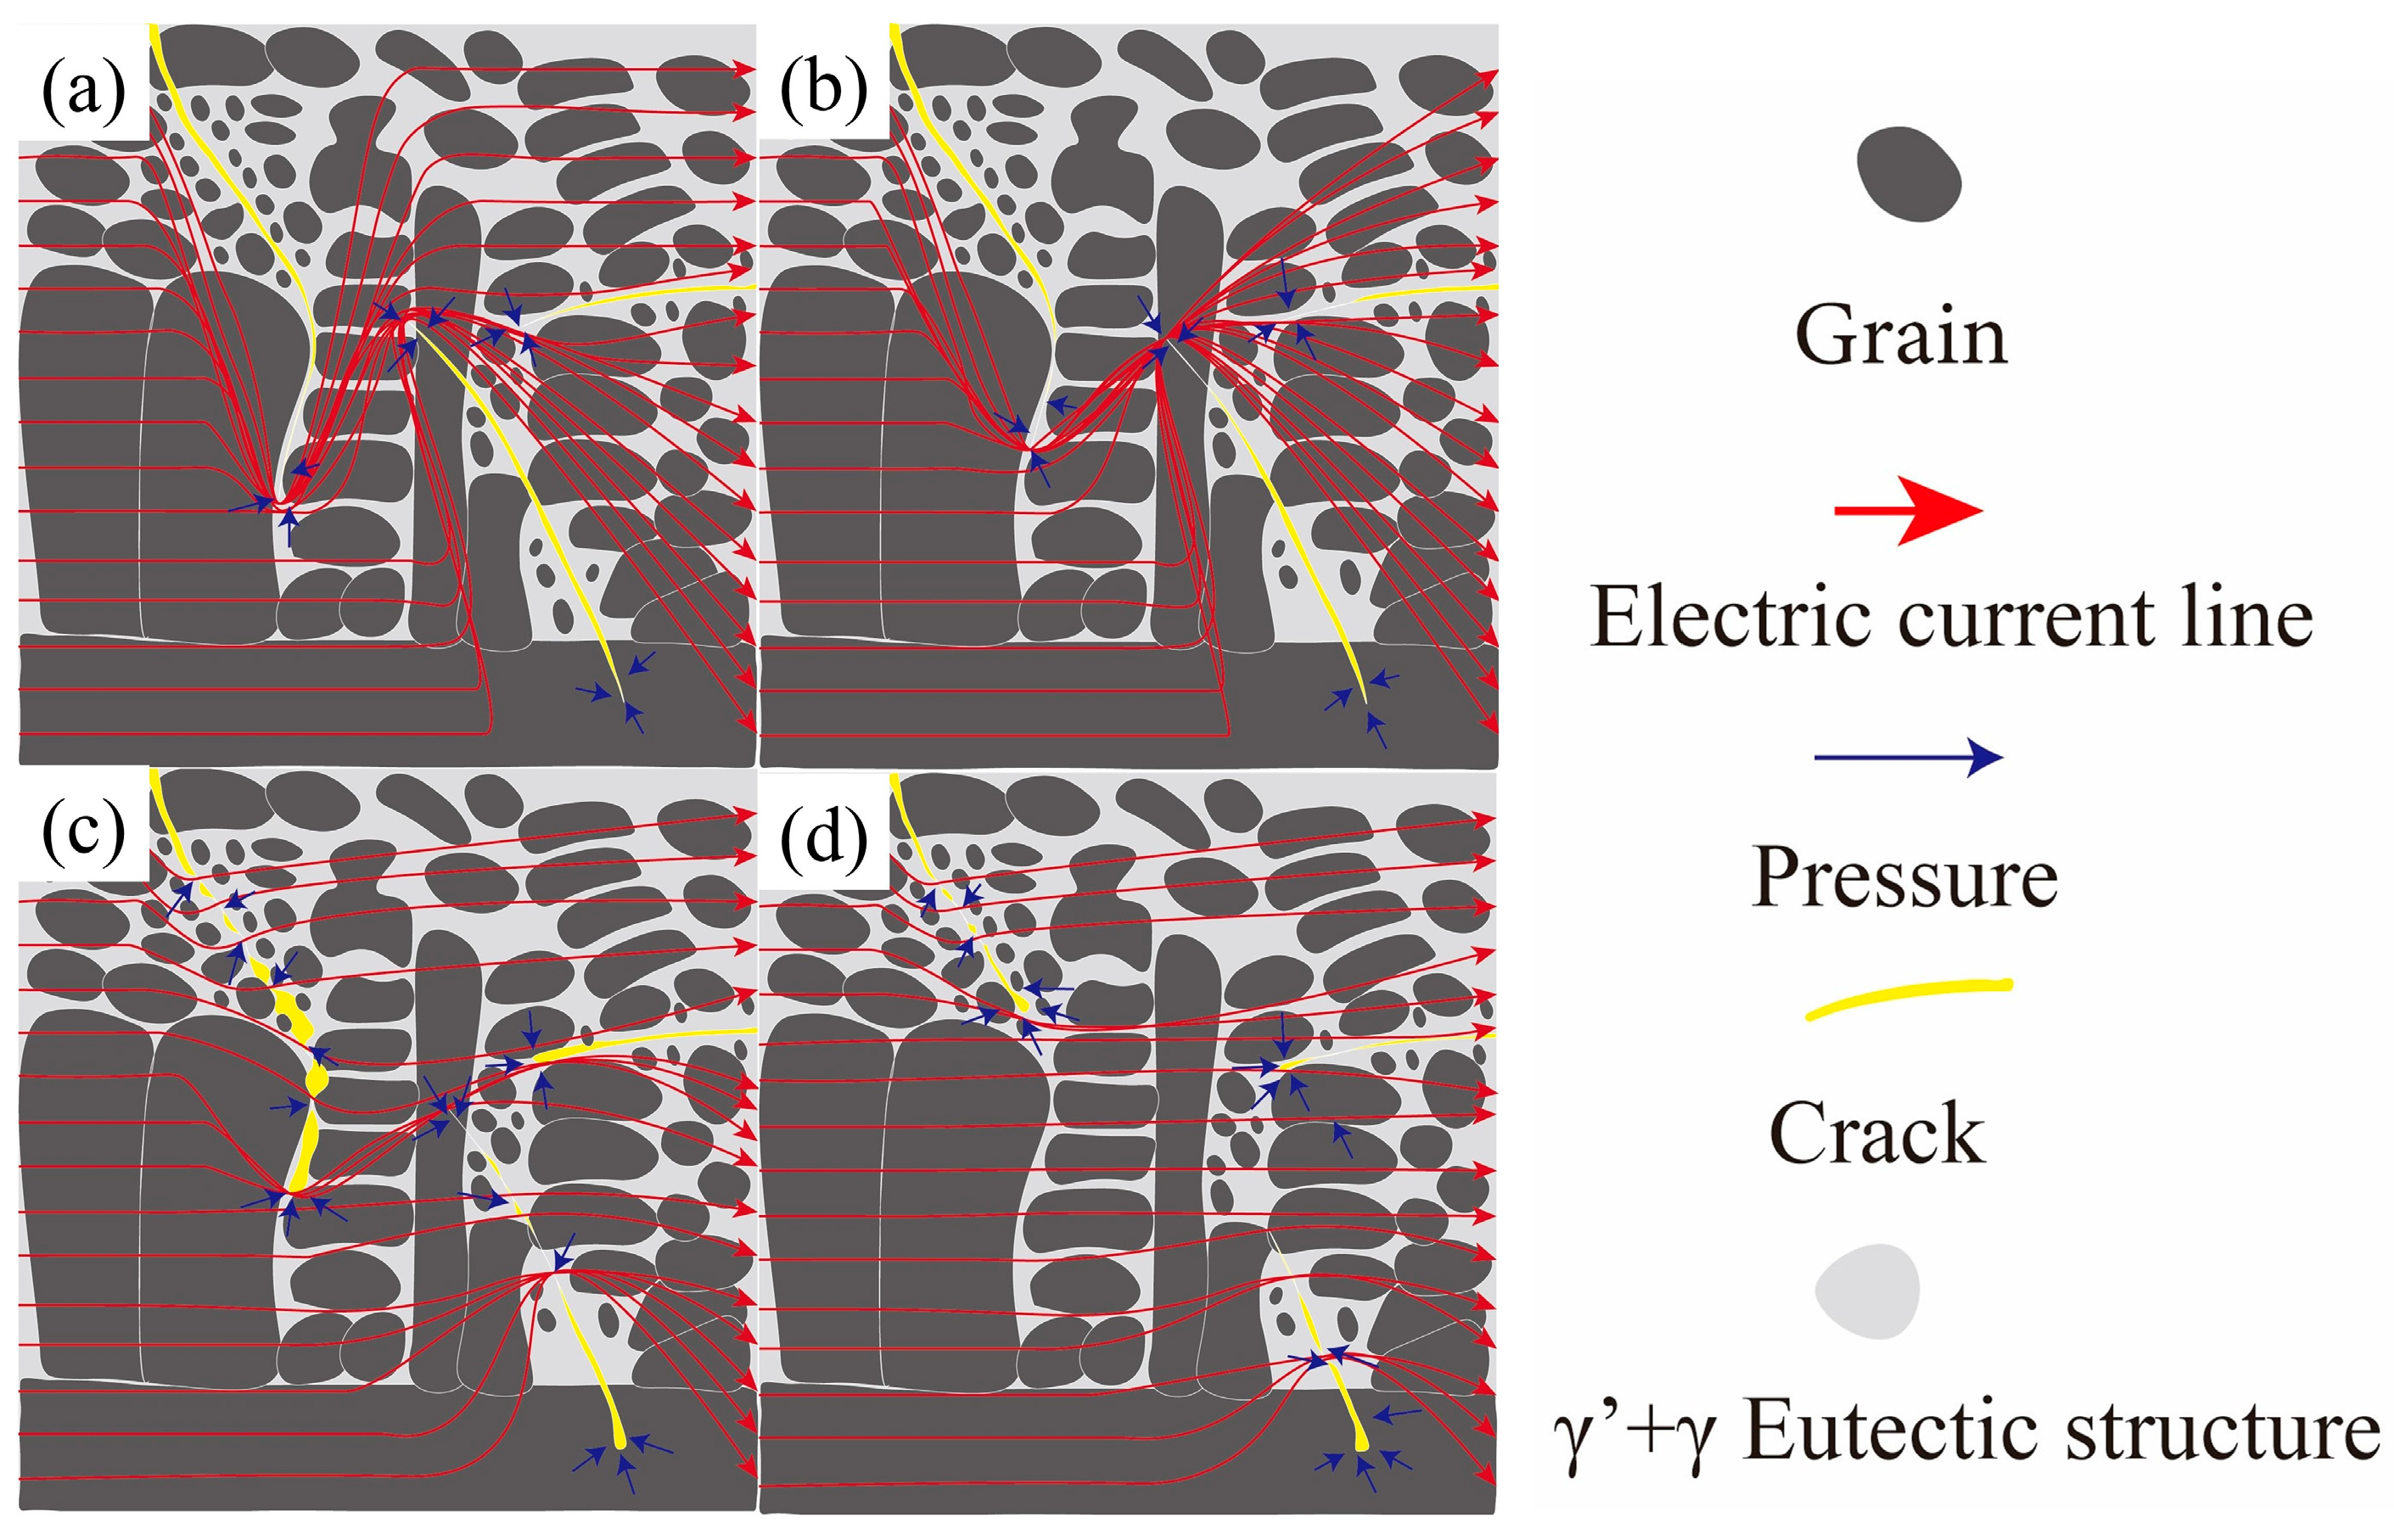
Figure 3b. Due to the current crowding effect, the electric current forms high-density accumulations at the crack tips (
Figure 3d), thereby generating significant Joule heating. This further leads to localized high-temperature zones at the crack tips (
Figure 3c), which is consistent with the high-temperature distribution patterns observed in the coating region during experiments (
Figure 2a–d).
3.4. Analysis of the Mechanical Properties of the Coating Before and After Crack Arrest
To analyze the mechanical properties of the coating after crack arrest, tests were conducted on the coating’s hardness, fracture toughness, and wear resistance. The relationship between coating hardness, fracture toughness, and friction and wear performance was discussed in conjunction with the crack arrest and test results. The results of fracture toughness of the coating surface before and after EAHT are shown in
Table 8. The fracture toughness of the original coating was 0.14 MPa·m
1/2, while the maximum fracture toughness of the coating surface after EAHT reached 10.74 MPa·m
1/2, an increase of approximately 25.57 times compared to the original coating. The minimum fracture toughness was 0.42 MPa·m
1/2, an increase of approximately 3 times compared to the original coating.
Figure 15a and
Table 8 show that the coating hardness decreases as the fracture toughness increases. The average hardness on both sides of the original coating crack was 761.62 HV, while the lowest average hardness on both sides of the coating crack after EAHT was 515.41 HV, representing a decrease of approximately 32.33% compared to the original coating.
However, the wear resistance (expressed as the reciprocal of the wear rate, ω-1) of the coating surface after EAHT increases with the increase in fracture toughness. The rate of wear particle formation is related to the effective deformation degree
εdeff during friction and the critical deformation degree
εceff for crack extension by Hornberg’s hypothesis. When
εceff ≥
εdeff, the material toughness is larger, and the coating wear is independent of the fracture toughness; when
εdeff ≥
εceff, cracks are more likely to expand and wear cracks are more likely to appear; when
εdeff >
εceff, the wear rate ω is formulae [
33]:
where
ρ is the coating density;
P is the compressive stress,
H is the hardness, n is the work-hardening index,
E is the modulus of elasticity, and
σs is the yield stress (
α/
β) =
C is an empirical constant under the condition
εdeff =
εceff.
Figure 15b shows the friction coefficient curve of the coating. Combined with the crack healing effect, cracks that heal well have a relatively smooth friction coefficient curve, while cracks that do not heal well have obvious noise peaks. Noise peaks are related to cracks in the coating and precipitation phases after EAHT.
Figure 15(b1–b6) shows that the crack healing effect of EH–1, EH–2, and EH–6 coatings is relatively poor, and there is a dense precipitation phase at the crack edges. When the friction pair comes into contact with the coating surface and relative motion occurs, the presence of cracks and precipitation phases causes plastic and non-plastic zones to form on the coating surface. Therefore, during the friction and wear process, there is a significant difference between static and dynamic friction forces, leading to persistent stick–slip phenomena. The larger the value difference between static and dynamic friction forces, the more pronounced the fluctuations in the friction coefficient curve [
34]. Notably, in
Figure 15b, the coating’s friction coefficient curve remains generally stable (fluctuating between 0.41 and 0.55), while the wear rate fluctuates significantly. This phenomenon arises from their distinct physical meanings: the friction coefficient is primarily governed by the stable friction film on the coating surface, whereas the wear rate is more strongly affected by post-EAHT microstructural inhomogeneity—e.g., uneven crack healing or local hardness variations. Uneven healing and microstructural states across the coating lead to accelerated local material spallation during wear, ultimately inducing wear rate fluctuations.
Figure 16 compares the wear morphologies of the Ni60/WC coatings before and after EAHT.
Figure 16(a2–g2) present magnified micrographs of the wear tracks, (a3–g3) show the corresponding three-dimensional wear profile maps, and (a4–g4) analyze the Energy Dispersive Spectroscopy (EDS) spectra of the worn surfaces (corresponding to different treated samples) to reveal the compositional changes in the worn surfaces and their influence on the differences in tribological properties.
The initial coating (
Figure 16(a2,a3)) displays numerous pits and peripheral spalling traces. Furthermore, delamination is observed along the crack edges. These features indicate that the predominant wear mechanism is adhesive wear accompanied by spalling wear. The EDS results (
Figure 16(a4)) show that the concentrations of carbide-related elements (W,C) at the wear tracks are relatively low, implying insufficient support from hard phases (including Cr-containing carbides), thus leading to adhesive and spalling wear. After the EH–1 treatment (
Figure 16(b2)) and EH–2 treatment (
Figure 16(c2)), the spalling phenomenon is exacerbated, and the pits caused by material detachment persist. Consequently, the wear mode evolves from predominantly adhesive wear to a mixed regime of spalling and abrasive wear. This transition is attributed to the precipitation of hard phases on the coating surface. EDS analysis shows that the intensities of peaks related to W and Cr increase, confirming the precipitation of hard carbides (including Cr-containing carbides). During the frictional wear process, dislocations accumulate at the hard-phase/matrix interface, which causes material fracture and separation and further leads to spalling. The appearance of distinct plough grooves after EH–2 (
Figure 16(c3)) further confirms the activation of abrasive wear. For the coatings subjected to EH–3, EH–4, EH–5, and EH–6 (
Figure 16(d2–g2)), the worn surfaces are dominated by shallow plough grooves and minor pits, and spalling is significantly reduced. The EDS spectra of these samples show that the intensities of W, C, and Cr peaks are more uniform and enhanced, indicating that uniform and well-distributed carbides (including Cr-containing carbides) are formed through EAHT, which effectively improves the abrasive wear resistance of the coating. As the treatment time increased, the depth of the plough grooves gradually decreased, and the surface became smooth. This improvement originates from EAHT-induced carbon precipitation, which preferentially fills cracks. The increased carbide content enhances the coating hardness and reduces the wear volume. Comparative analysis of images (
Figure 16(d1–g1)) reveals that, after EAHT, regions adjacent to cracks exhibit relatively smooth worn surfaces, whereas crack-free areas show more pronounced plastic deformation and ploughing. Additionally, the width of the wear track gradually increases with increasing treatment temperature, indicating alleviated stress concentration around cracks and a reduced crack-affected zone. When the temperature reaches 950 °C (
Figure 16(e1)), the wear mechanism is predominantly abrasive wear. Adhesive wear persists at a low level, and spalling wear is virtually suppressed. The corresponding EDS results show that the distribution of W, C, and Cr is the most optimized, and the O content is the lowest, which confirms the excellent tribological properties (of the coating) by minimizing adhesive wear, spalling wear, and oxidative damage.
The observed evolution of the wear mechanism is directly correlated with the increase in fracture toughness. In coatings with low toughness and preexisting cracks, external stresses drive crack propagation and the formation of subsurface microcracks. Sustained sliding promotes the coalescence of microcracks in the subsurface, and the cracks propagate toward the surface, which ultimately results in material removal in the form of wear debris. These debris particles then plough characteristic grooves into the surface under the action of the counterface. As a result, abrasive wear becomes the dominant mechanism, adhesive wear remains marginal, and spalling wear is effectively suppressed. The study shows that there is a critical load
Pc inside the coating. When the applied load
P >
Pc, both plow grooves and crack propagation leading to material spalling occur. When
P <
Pc, crack propagation and material spalling caused by external loads do not occur. The expression for the
Pc value with material properties and wear conditions is shown in Equation (7) [
35]:
where
KIC is fracture toughness;
H is material hardness;
D is abrasive particle size;
µ is friction coefficient; 2
α is the plow angle;
λ is crack spacing.
After EAHT, the fracture toughness
KIC value and crack spacing
λ (i.e., crack tip curvature radius) increase, the hardness
H value decreases, and the friction coefficient µ is less than 1.
Figure 16(a1–c4) and
Table 8 show that the original coating, EH–1, and EH–2 coatings have low fracture toughness, with the critical load
Pc inside the coating being less than the applied load
P, resulting in severe surface peeling of the coating. However, after EAHT, the fracture toughness of the EH–3, EH–4, EH–5, and EH–6 coatings significantly improved compared to the original coating. The internal critical load
Pc of the coatings is greater than the applied load
P, resulting in only plow marks on the coating surface.
Figure 16(a3–g3) shows that the width of the surface scratches on the coating increases after EAHT, and that the wear resistance of the coating is also related to its hardness. The higher the hardness, the better the wear resistance. However, when cracks are present in the coating, the fracture toughness of the coating must also be considered.
Table 8 shows that the fracture toughness of the coating increases after EAHT. Furthermore, the hardness concentration coefficient
Kh near the cracks in the original coating was 1.10, while the hardness concentration coefficient
Kh near the cracks in the EH–5 coating after EAHT was as low as 1.06. The closer the hardness concentration coefficient is to 1, the more uniform the hardness distribution.
Figure 8 shows that crack healing zones have microstructure generation and are consistent with crack-free zones. Therefore, crack arresting improves coating continuity and hardness uniformity. When the material hardness is low and the toughness is high, the plasticity of the material also increases. Therefore, when the friction pair is pressed into the coating, the surface of the coating treated with EAHT undergoes obvious plastic deformation, and the width of the grinding marks increases with the increase in heat treatment time and temperature.
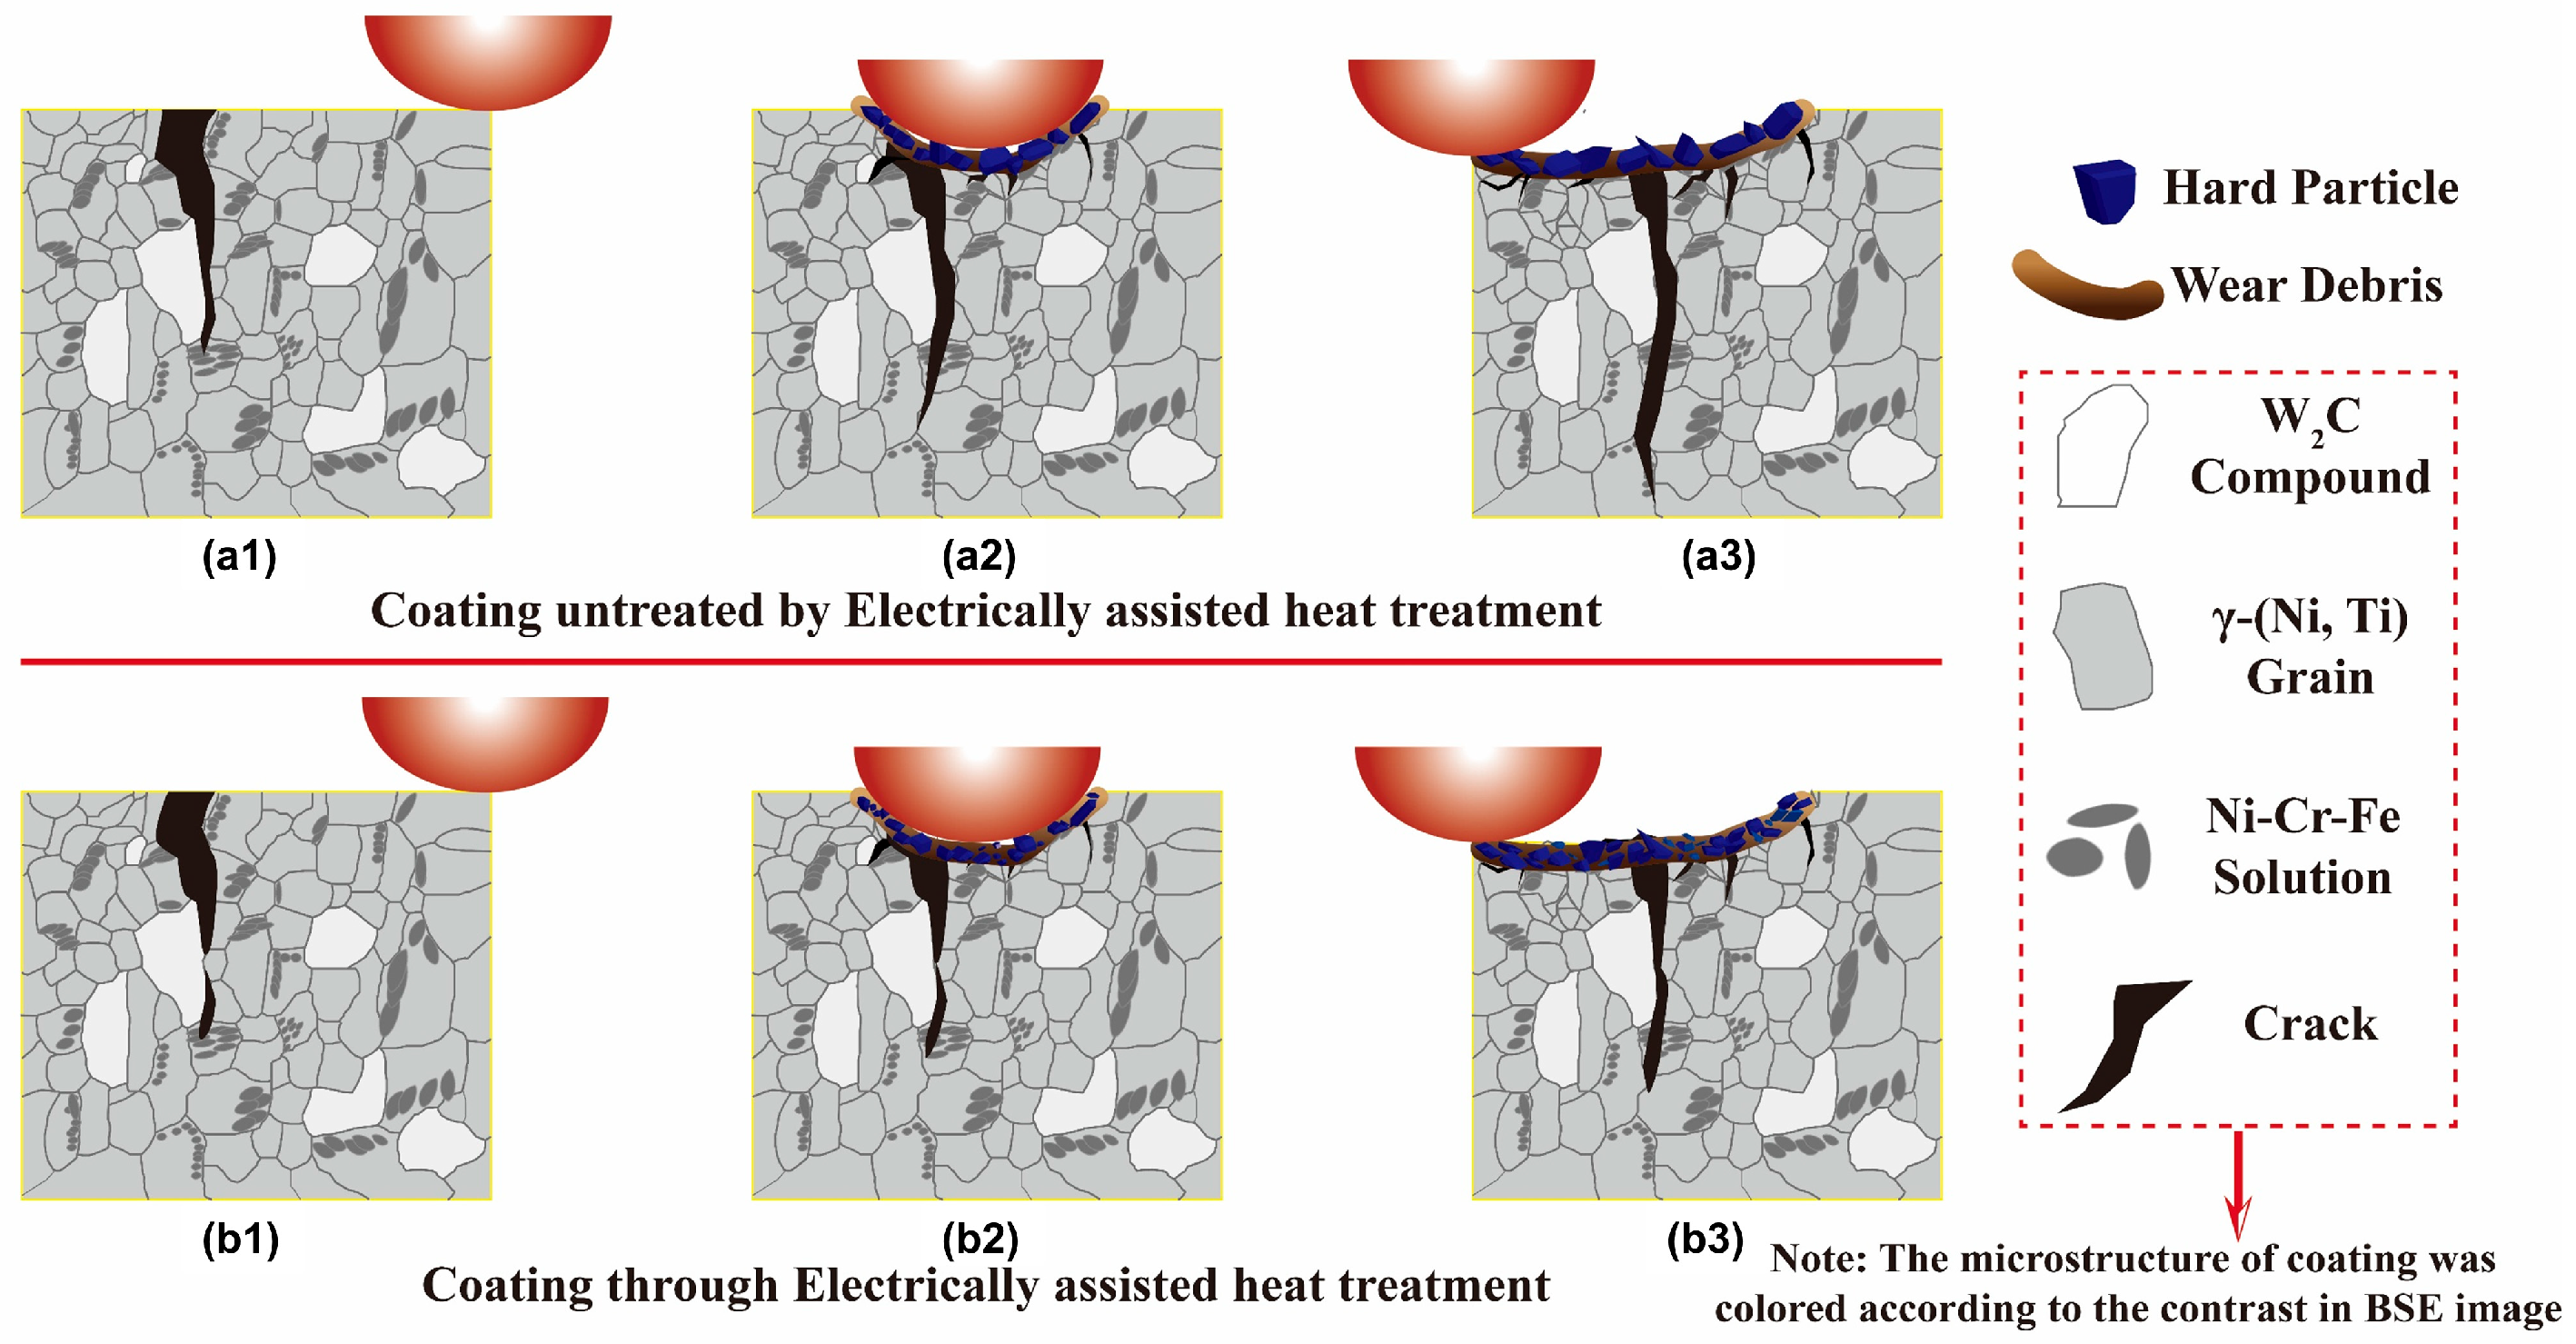
Figure 17 shows that when the friction pair slides over the original coating surface, microcracks are generated and material spalling occurs as friction continues, and the original cracks extend along the grains toward the base material. After EAHT, the cracks in the coating were arrested, the curvature radius at the crack tip increased, and the cracks partially healed. During friction and wear testing, microcracks also formed on the coating surface. Although the original cracks in the coating propagated to some extent after being arrested, the crack propagation rate was significantly lower than that of the original coating cracks under the same external load. Furthermore, once microcracks form on the coating surface, the microcracks will continue to propagate and merge as friction progresses, finally turning toward the surface and separating to form abrasive particles and spalling. The original coating untreated by EAHT has high hardness but poor toughness and plasticity, leading to severe material spalling and crack propagation during friction and wear. During this process, the wear particles are primarily large spalled materials. After EAHT, the coating’s toughness improves while its hardness decreases, resulting in enhanced coating microstructure continuity and performance uniformity. The wear particles are relatively fine in this case.
