Article

Investigating the Impact of 3D Printing Parameters on Hexagonal Structured PLA+ Samples and Analyzing the Incorporation of Sawdust and Soybean Oil as Post-Print Fillers

by
Yeswanth Teja Ramisetty
*,
Jens Schuster
and
Yousuf Pasha Shaik
Department of Applied Logistics and Polymer Sciences, University of Applied Sciences Kaiserslautern, Carl-Schurz-Strasse 10-16, 66953 Pirmasens, Germany
*
Author to whom correspondence should be addressed.
J. Manuf. Mater. Process. 2024, 8(5), 193; https://doi.org/10.3390/jmmp8050193
Submission received: 3 August 2024 / Revised: 29 August 2024 / Accepted: 1 September 2024 / Published: 3 September 2024

Abstract

:
Today, around the world, there is huge demand for natural materials that are biodegradable and possess suitable properties. Natural fibers reveal distinct aspects like the combination of good mechanical and thermal properties that allow these types of materials to be used for different applications. However, fibers alone cannot meet the required expectations; design modifications and a wide variety of combinations must be synthesized and evaluated. It is of great importance to research and develop materials that are bio-degradable and widely available. The combination of PLA+, a bio-based polymer, with natural fillers like sawdust and soybean oil offers a novel way to create sustainable composites. It reduces the reliance on petrochemical-based plastics while enhancing the material’s properties using renewable resources. This study explores the creation of continuous hexagonal-shaped 3D-printed PLA+ samples and the application of post-print fillers, specifically sawdust and soybean oil. PLA+ is recognized for its eco-friendliness and low carbon footprint, and incorporating a hexagonal pattern into the 3D-printed PLA+ enhances its structural strength while maintaining its density. The addition of fillers is crucial for reducing shrinkage and improving binding capabilities, addressing some of PLA+’s inherent challenges and enhancing its load-bearing capacity and performance at elevated temperatures. Additionally, this study examines the impact of varying filler percentages and pattern orientations on the mechanical properties of the samples, which were printed with an infill design.

1. Introduction

Globally, 3D printing technology has rapidly advanced, and the materials used in this process have also evolved. Among these materials, PLA+ has gained significant popularity as an improved variant of the commonly used PLA (Polylactic Acid) filament. PLA+ offers enhanced strength, durability, and heat resistance, making it a superior choice for a variety of applications [1,2]. 3D printing technology is increasingly used for mass customization and in the production of different types of open-source designs in the field of agriculture, in healthcare, and in the automotive, locomotive, and aviation industries [3]. Earlier research works investigated the effects of variables including layer thickness, printing temperature, infill density, and printing speed on the mechanical properties of materials that are 3D printed. For instance, research on the mechanical properties of FDM-made PLA structures identified the optimal process factors to enhance mechanical performance [4,5]. Similarly, studies have investigated the tensile strength of various commercial polymers used in FDM printing, shedding light on material selection and the effects of post-consolidation pressure on properties for specific applications [6,7]. For example, research has examined how different FDM process parameters influence the mechanical properties of 3D-printed parts, offering valuable insights into optimizing printing conditions for improved performance [8]. Additionally, the use of biomaterials in fused deposition modeling (FDM) enables the creation of biocompatible and bioresorbable structures, which have applications in healthcare and other fields [9]. Furthermore, the integration of bio-waste fillers into PLA composites has been explored, revealing their effects on mechanical, thermal, and rheological properties and advancing sustainable material development [10].
One prominent aspect of 3D-printed PLA+ samples is the incorporation of a hexagonal pattern, which not only adds aesthetic appeal but also enhances the structural integrity of the printed objects. The hexagonal pattern in 3D-printed PLA+ samples serves both functional and visual purposes. Structurally, the hexagonal lattice provides increased strength and stiffness compared to traditional infill patterns. The honeycomb structure significantly reduces the weight of the material while maintaining its strength and stiffness, making it ideal for lightweight applications such as packaging and automotive or aerospace components; this design not only optimizes material usage but also imparts a unique, visually appealing texture to the finished prints [11]. The hexagonal infill is particularly advantageous for items that require a balance of strength and lightweight characteristics. Even though 3D-printed PLA+ samples offer numerous advantages, they also come with some drawbacks. PLA+ has a glass transition temperature of around 60–65 °C; like all polymers, it will soften or distort at high temperatures, restricting its use in environments with heat exposure. PLA also exhibits a degree of brittleness, making it prone to breaking under stress, especially in thin or intricate structures [12].
In general, soybean oil acts as a bio-based plasticizer, increasing the flexibility and impact resistance of PLA+, which tends to be rigid [13]. This treatment mitigates PLA+‘s inherent brittleness, making the prints less vulnerable to breakage under stress. Additionally, soy-bean oil treatment enhances the heat resistance of PLA+, allowing the prints to withstand higher temperatures before deformation occurs. Furthermore, the inclusion of sawdust into the 3D-printed parts was to act as a medium for the printed parts to be able to absorb the oil [14,15]. Both sawdust and soybean oil are biodegradable, and their inclusion in the PLA+ matrix could improve the overall biodegradation rate of the material, particularly in soil environments where the organic fillers can degrade more rapidly, leaving the PLA matrix more exposed to environmental factors. This research focuses on producing PLA+ 3D-printed samples with distinguished 3D-print parameters and analyzing their influence if sawdust and soybean oil are used as post-print fillers to enhance the 3D print in terms of ductility and strength. Analysis of the effect of parameters like the orientation of the hexagonal pattern and infill percentage was carried out.

2. Materials

2.1. 3D Printer and PLA+ Filament

A Creality Ender 5S1 3D printer (Creality 3D Technology Co, Ltd., Shenzhen, China) with dimensions (W × H × D) of 425 × 460 × 570 mm was used, as shown in Figure 1 [16]. Featuring a cubic frame design and a print space of 220 × 220 × 280 mm, it is a sturdy and dependable 3D printer. It has a magnetic PEI-coated spring steel build plate for greater adhesion, a direct drive extruder for better filament control, and CR Touch auto-leveling for accurate bed calibration. The PLA+ filament (green) bought from Sunlu (Sunlu International Holdings Limited, Hong Kong) has a diameter of 1.75 mm with ±0.02 mm tolerance, and the print temperature ranges from 190 °C–210 °C. These features ensure precise pattern printing without complications. The primary function of a print bed is to provide a stable, level surface that allows the bottom layer of the print to adhere effectively. To prevent the sculpture from shifting during printing and causing issues, the print bed must securely anchor the first layer of extruded filament.

2.2. Soybean Oil and Sawdust

To optimize the absorption of soybean oil into PLA+ 3D prints, several critical properties must be considered. Firstly, selecting a soybean oil with low viscosity is essential to ensure efficient penetration into the PLA+ matrix. The oil should also possess excellent thermal stability to endure the elevated temperatures of the 3D printing process without degrading. Additionally, a high degree of unsaturation in the soybean oil promotes effective plasticization, enhancing the mechanical properties of PLA+ prints. The flash point of soybean oil, which is utilized as a plasticizer in PLA+, is a crucial measure of its heat stability. While the oil used in this study had a 230 °C flash point and the viscosity was 42 cP (centipoise), the ideal value is above 200 °C, and viscosities below 50 cP (centipoise) at room temperature are seen to be appropriate for post-printing treatments that are simple to apply and integrate.
The hardwood sawdust used in this study was sourced from oak trees provided by Räucherspan.de (Stuttgart, Germany). The particles have an average diameter of 0.4 mm, with a tolerance of ±0.05 mm, and exhibit greater porosity compared to softwood sawdust, facilitating improved absorption of soybean oil. Additionally, hardwood sawdust typically has higher lignin content, which enhances its binding capability with both soybean oil and the sawdust itself. Consequently, hardwood sawdust is well suited for optimizing soybean oil absorption in PLA+ 3D prints. With a porosity of approximately 55% and a particle size of 200 microns, this sawdust effectively absorbs soybean oil during treatment while maintaining a lightweight and strong profile.
These attributes together facilitate successful soybean oil treatment, leading to improved flexibility, impact resistance, and overall print quality. In this study, refined organic soybean oil from Sala (Sala GMBH, Hochspeyer, Germany) was utilized.

2.3. Bed Adhesive Spray and Isopropanol

The bed adhesive spray may vary depending on the type of 3D print bed. Here, a 3DLAC (3DLAC, Zamora, Spain) glass adhesive spray was used, which was designed for the glass printing beds. To ensure that the adhesive did not encounter any problems, the printing bed was cleaned of any impurities using Isopropyl Alcohol (IPA).

3. 3D Printing and Post-Treatment

3.1. Sample Preparation

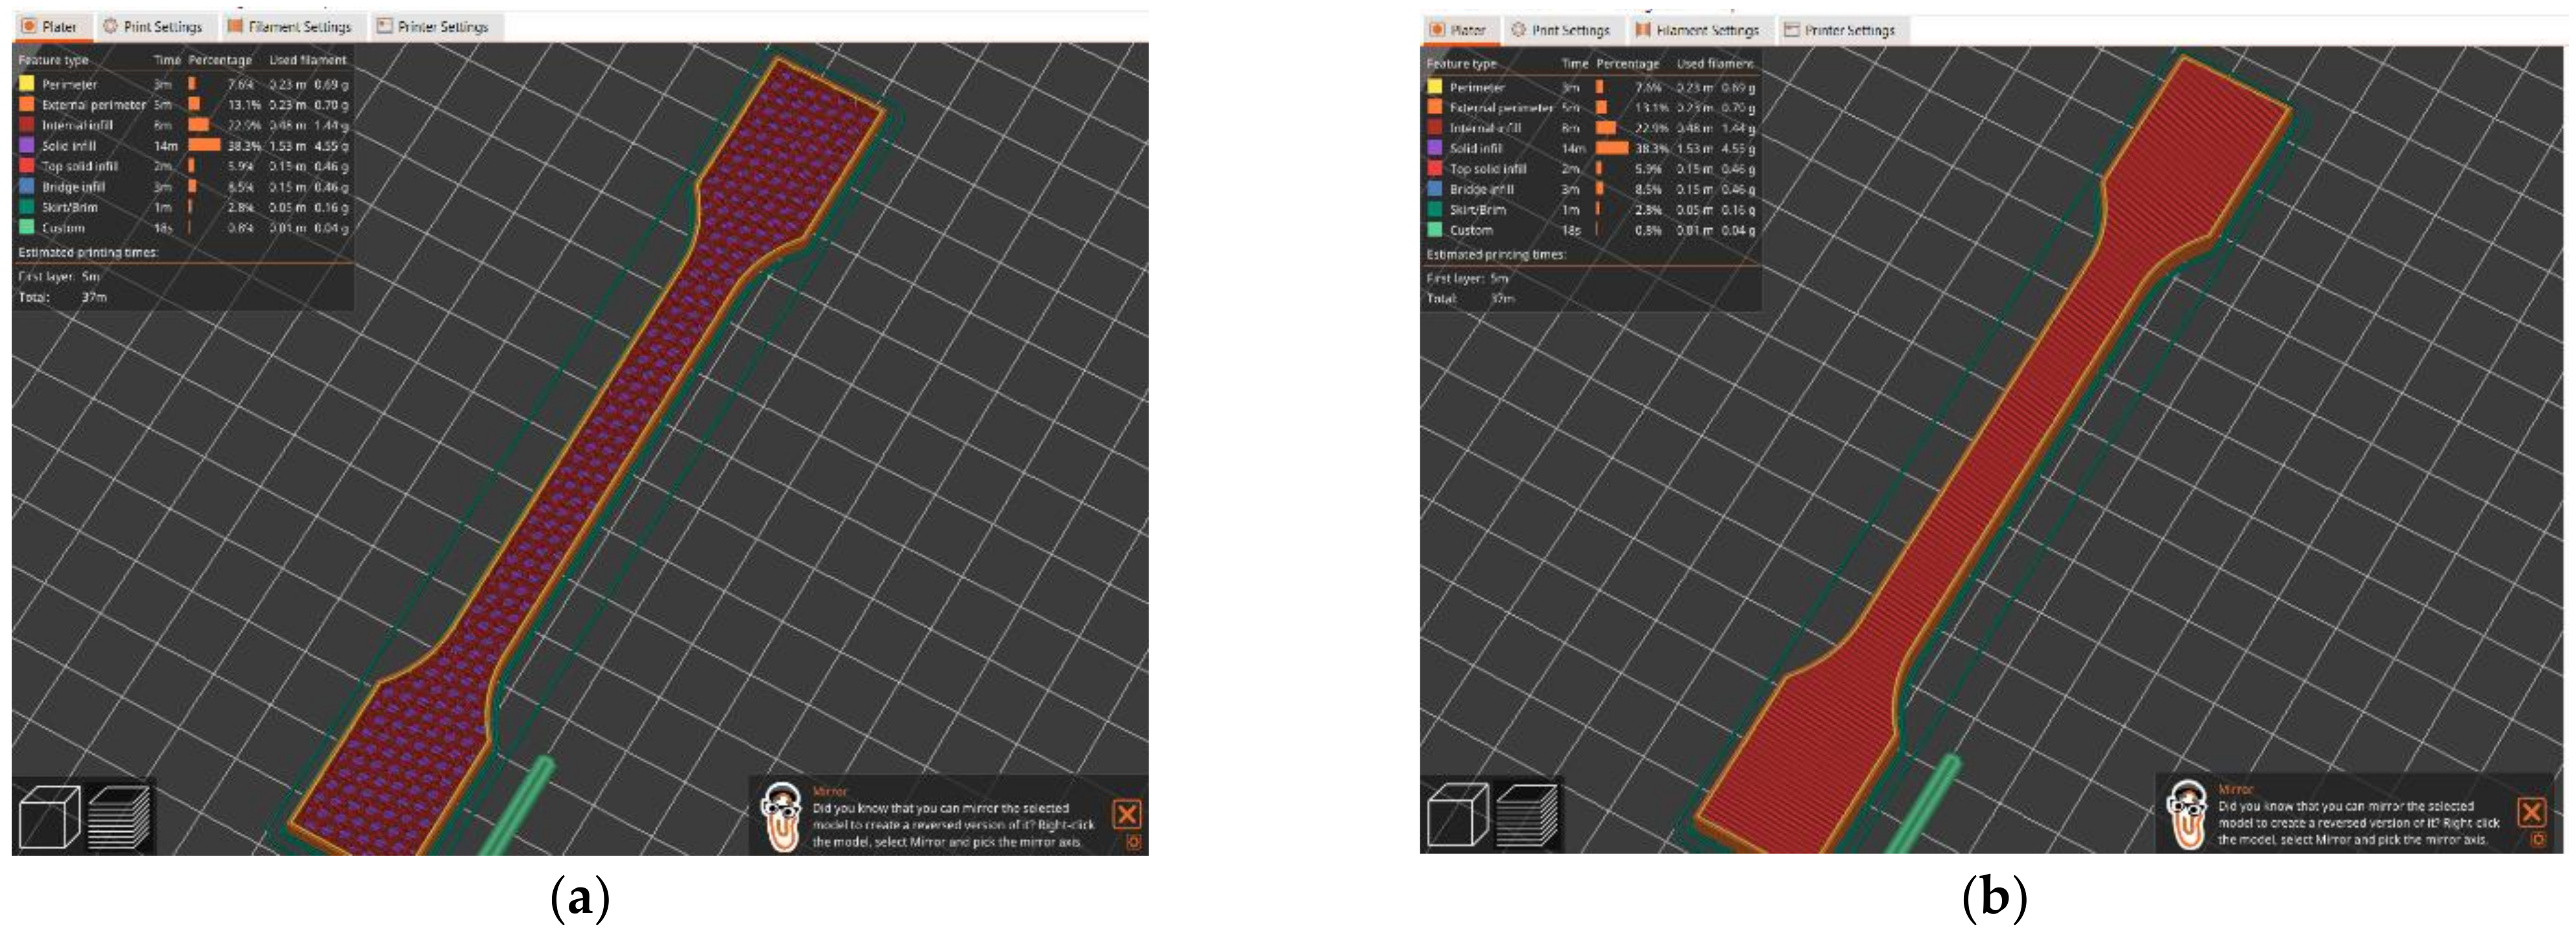
The specimen was first modeled using NX (version 12) CAD/CAM software. After finalizing the design, it was exported as an STL file and imported into Prusa (V2.8.0) slicing software, where key print parameters were adjusted, as shown in Figure 2a,b. Initial samples were printed to identify the optimal combination of design features and parameters [17]. Based on the careful examination of these preliminary samples, the most suitable infill percentage and orientation were selected. The final print parameters used are outlined below.
The bottom layer has a height of approximately 1 mm.
The layer thickness for the bottom portion of the sample is 0.25 mm.
The layer printed immediately after the hollow pattern has a thickness of 0.15 mm to ensure complete coverage of the design.
The top layer section has a height of 0.75 mm.
The total height of the pattern section is 2.35 mm, with a thickness of 0.2 mm.
The remaining top layers have a thickness of 0.35 mm each.
The printing speed was reduced to 80% for the pattern layers to improve quality.
For the bottom and top layers, the printing speed was set to 100%.
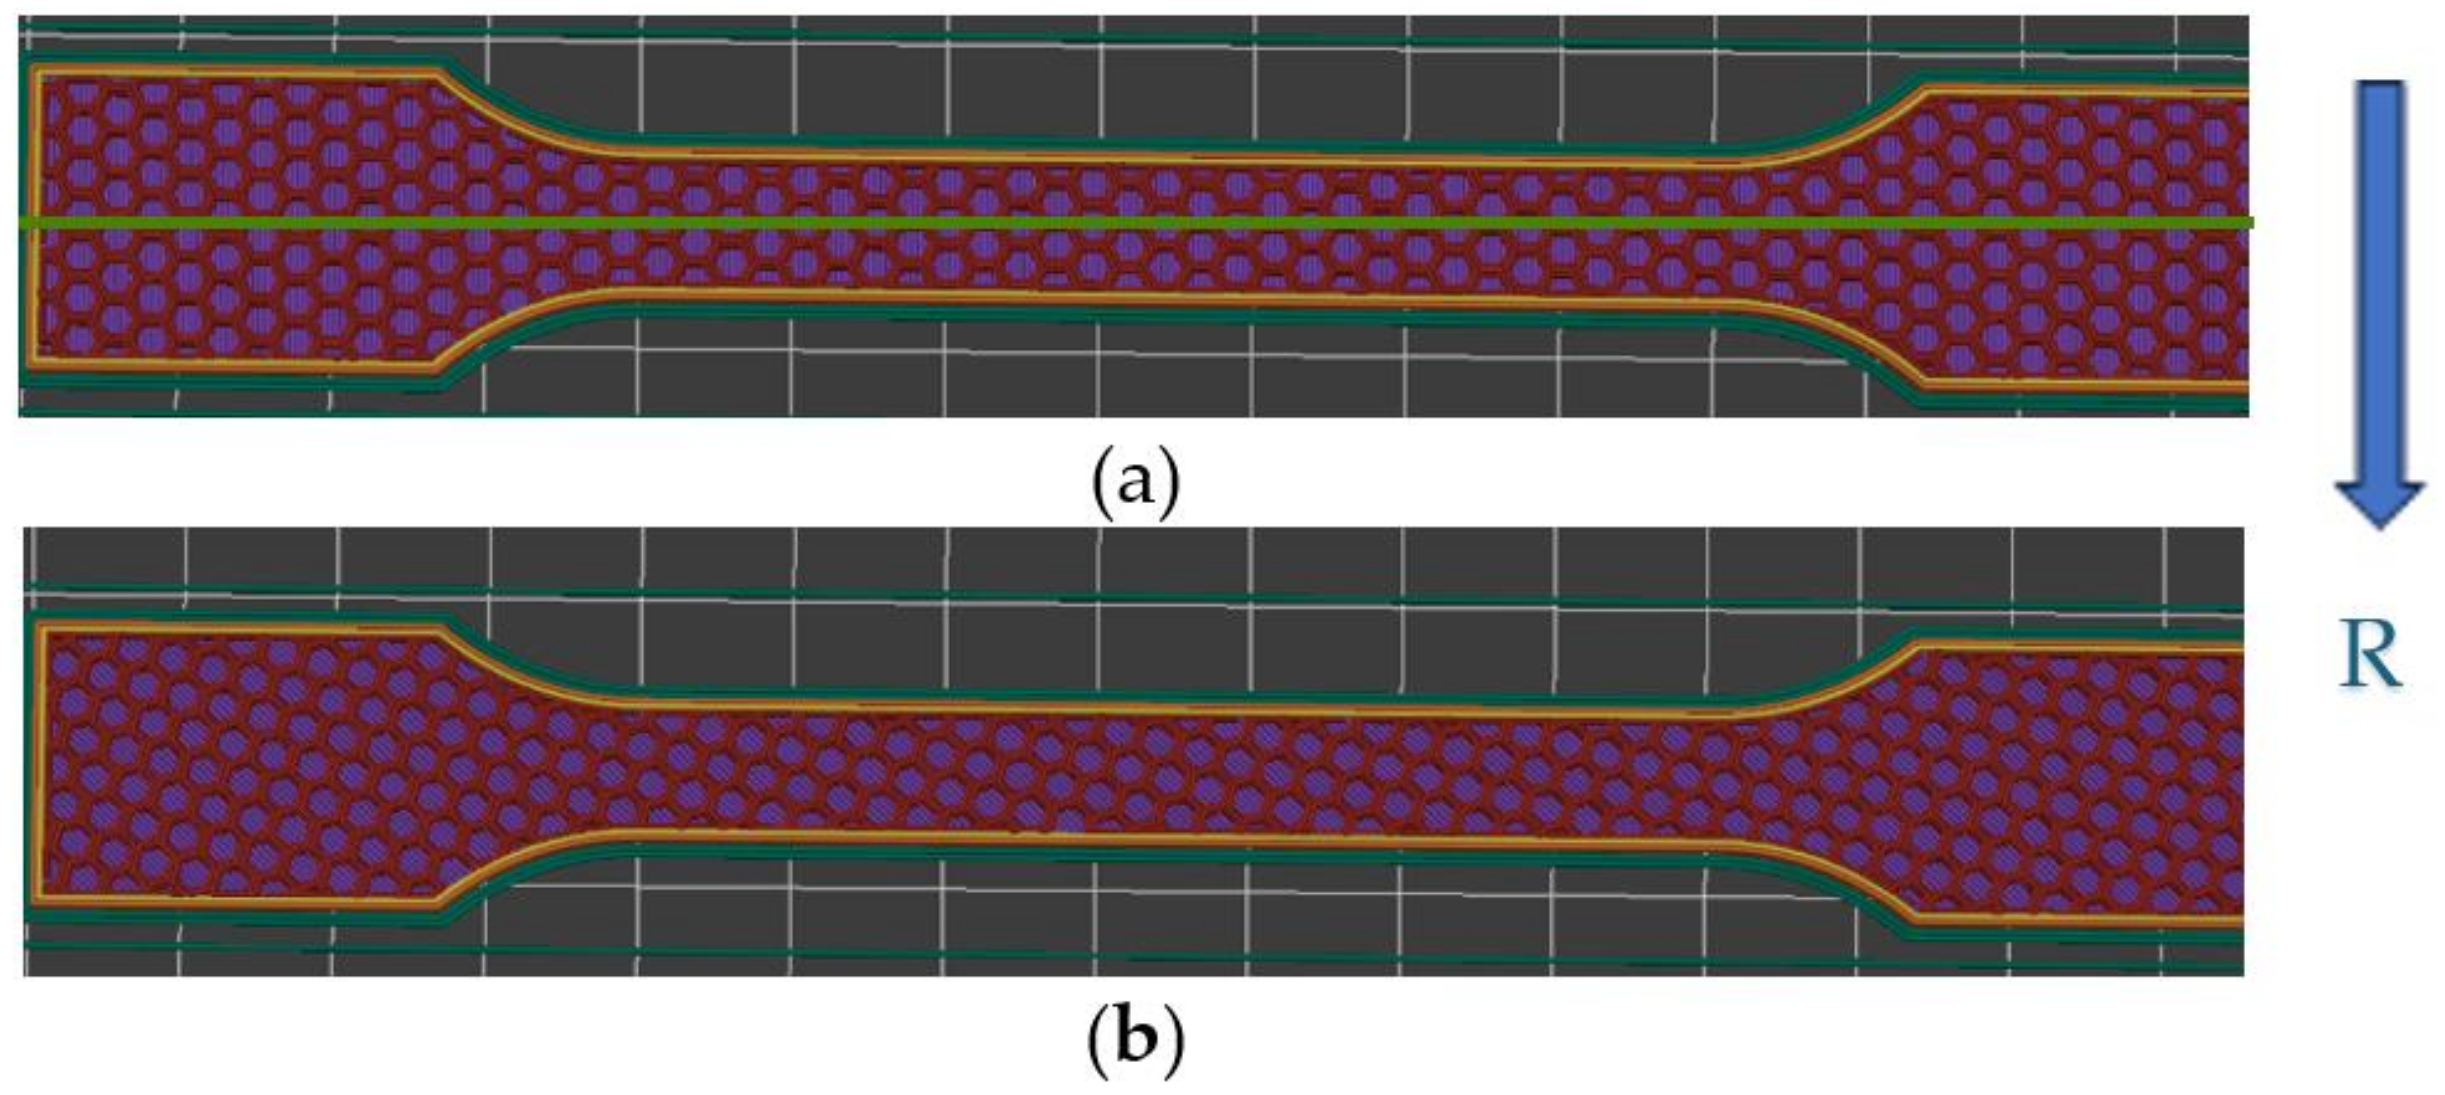
The slicing software was configured with infill percentages of 30% and 40% and orientations of 0° and 45° for each infill percentage.
The orientations of the samples in Figure 3a,b were with the reference axis R, which is basically the breadth side of the sample. The pattern for the samples with 0° orientation was exactly parallel to the breadth side of the sample.
In Figure 2a,b, the tensile test specimens are illustrated. Adjustments were performed by utilizing the slicing software’s settings, such as layer thickness and printing speed, to guarantee the design result and allow the fillers to be placed more accurately. It is crucial to remember that the sample’s bottom and pattern temperatures should be kept at the same level as the bed temperature. The print is paused at a specific layer height where the hexagonal pattern is still open, and a fixed amount (5 g) of treated sawdust is manually placed inside the open cells. After adding the filler, the printer resumes to finish the top layers, sealing the hexagonal structure with the fillers trapped inside.
Before immersing the samples in the oil, care was taken to ensure that the top layers were not ironed, since this could facilitate the infiltration of soybean oil. Using a measured cup and brush, the dry sawdust was uniformly applied to the 3D print pattern as shown in Figure 4a. Here, the behavior of the printed components at room temperature was measured using the oil absorption test. These samples were removed from the tray, and extra oil was blown out with a blower; nevertheless, it was also crucial to ensure that the samples were oil free on the exterior. Then, the samples were washed with wet tissues and left at room temperature for around twelve hours.

3.2. Post-Treatment

The 3D-printed components were annealed at 50 °C prior to the oil absorption test to reduce internal tensions in the printed material [18]. Annealing was carried out in a vacuum furnace; hence, the relative humidity is typically extremely low, approaching 2% to 0%. This is because the vacuum environment removes not only air but also most of the water vapor that would contribute to humidity. This enhanced the parts’ rigidity and dimensional stability. The weight of the sawdust was recorded after it had been filtered using a sieve. In addition, the sawdust was heated to 30 °C for 40 min to eliminate moisture, and its weight was recorded. The period was extended, and further weighing was performed to ensure that there was no moisture present. Finally, it was noted that the sawdust’s weights before and after heating differed very little at 30 °C for 40 min. The sawdust was scattered onto paper towels and any moisture was eliminated to ensure that there were no residues left.

4. Design of Experiments

Initially, samples with 10% to 60% infill were printed, and after performing trials that involved inducing sawdust and oil absorption, it was found that due to the low volume of the hexagonal pattern for 50% infill and above samples, there was neither proper induction nor absorption. In the case of 10% and 20% infill samples, as there was less density when we attempted to immerse them in soybean oil, the holding capacity became negligible and was not suitable for this design. In the case of samples with 0° and 45° orientations, the print quality was high because of the printer’s compatibility with these orientations. Therefore, the following infill and orientations were chosen, as shown in Table 1.

5. Measurements

5.1. Oil Absorption Test Parameters

The oil absorption test was conducted with and without fillers according to the experimental design. After printing, the samples underwent a pre-treatment process before being immersed in soybean oil. The percentage of oil absorption was calculated. Initially, trials were performed in ascending order to determine the saturation time and absorption levels. Once saturation data were obtained, the immersed samples from both categories were kept at room temperature for 36 h. Excess oil was then removed and the samples were cleaned. Subsequent tests followed the same procedure to ensure consistent saturation readings.

5.2. Tensile Test Parameters

A Zwick Universal testing device was used to perform tensile tests according to the standard DIN EN ISO 527-2:2012 (Models 1B) [19]. These specimens were subjected to the following test conditions: 0.1 N preload, 1 mm/min tensile modulus was the test speed, and 10 mm/min was the maximum permissible test speed for these samples. In this case, samples with orientations of 0° and 45° and infill percentages of 30% and 40% were printed, respectively, and tensile loading was applied.

5.3. Flexural Test Parameters

The flexural modulus is a measure of a material’s stiffness in bending. Using the same universal testing apparatus, the samples’ flexural strength was evaluated in accordance with the EN ISO 178:2019 protocol [20]. The specimens depicted in Figure 5a,b were measured, and the following test settings were used: For these samples, the test speed was 1 mm/min flexural modulus with a 1 N preload, and the maximum allowable test speed was 10 mm/min. This test provides valuable information about a material’s ability to withstand bending loads and its resistance to failure under bending conditions, making it essential for assessing the structural integrity of various materials, including plastics, metals, and composites [21].

5.4. Charpy Impact Test Parameters

The EN ISO 179 test standard was followed and a RayRan advanced universal pendulum was utilized to carry out the Charpy impact test [22]. A pendulum hammer with the following specifications was used in the test to ascertain the impact resistance of the material: hammer weight of 1.0390 kg, impact energy of 7.50 joules, and speed of 3.8 m/s. The amount of force required to shatter a material when it is struck by a swinging pendulum can be used to determine the material’s toughness. Horizontally held, the specimen had both ends unclamped. The determination of the impact strength was in kJ/m2.

5.5. Heat Deflection Temperature Test Parameters

The DIN EN ISO 306:2014 testing standard was utilized [23]. The test parameters included a temperature gradient of 120 k/h and a holding time of 5 min. The apparatus generates high-resolution thermal images that enable precise measurement of the temperature distribution across the material. As the applied force increases, temperature-induced deformation of the specimen occurs. Accurate detection of the specimen’s deflection or deformation is achieved using appropriate sensors or displacement transducers.

6. Results

6.1. Oil Absorption Test

It was discovered that samples with fillers had higher absorption percentages in the oil absorption test than those without fillers. This is because the hardwood sawdust from oak trees is porous and has the capacity to function as an absorption medium. In addition. From Table 2a,b, the samples with 30% infill showed higher results when compared with 40% infill samples due to the pattern design because the higher the infill %, the smaller the pattern area and therefore, the tendency to absorb the oil decreases with an increase in the infill percentage. It was also observed that although the absorption percentage for the 45° and 0° orientation samples was the same, the increased weight of the samples was the reason for the difference in the values.
O i l   A b s o r p t i o n   % = W f W i   W i   × 100
Using the above equation, the oil absorption percentage was calculated for both cases, i.e., with and without fillers.

6.2. Tensile Test

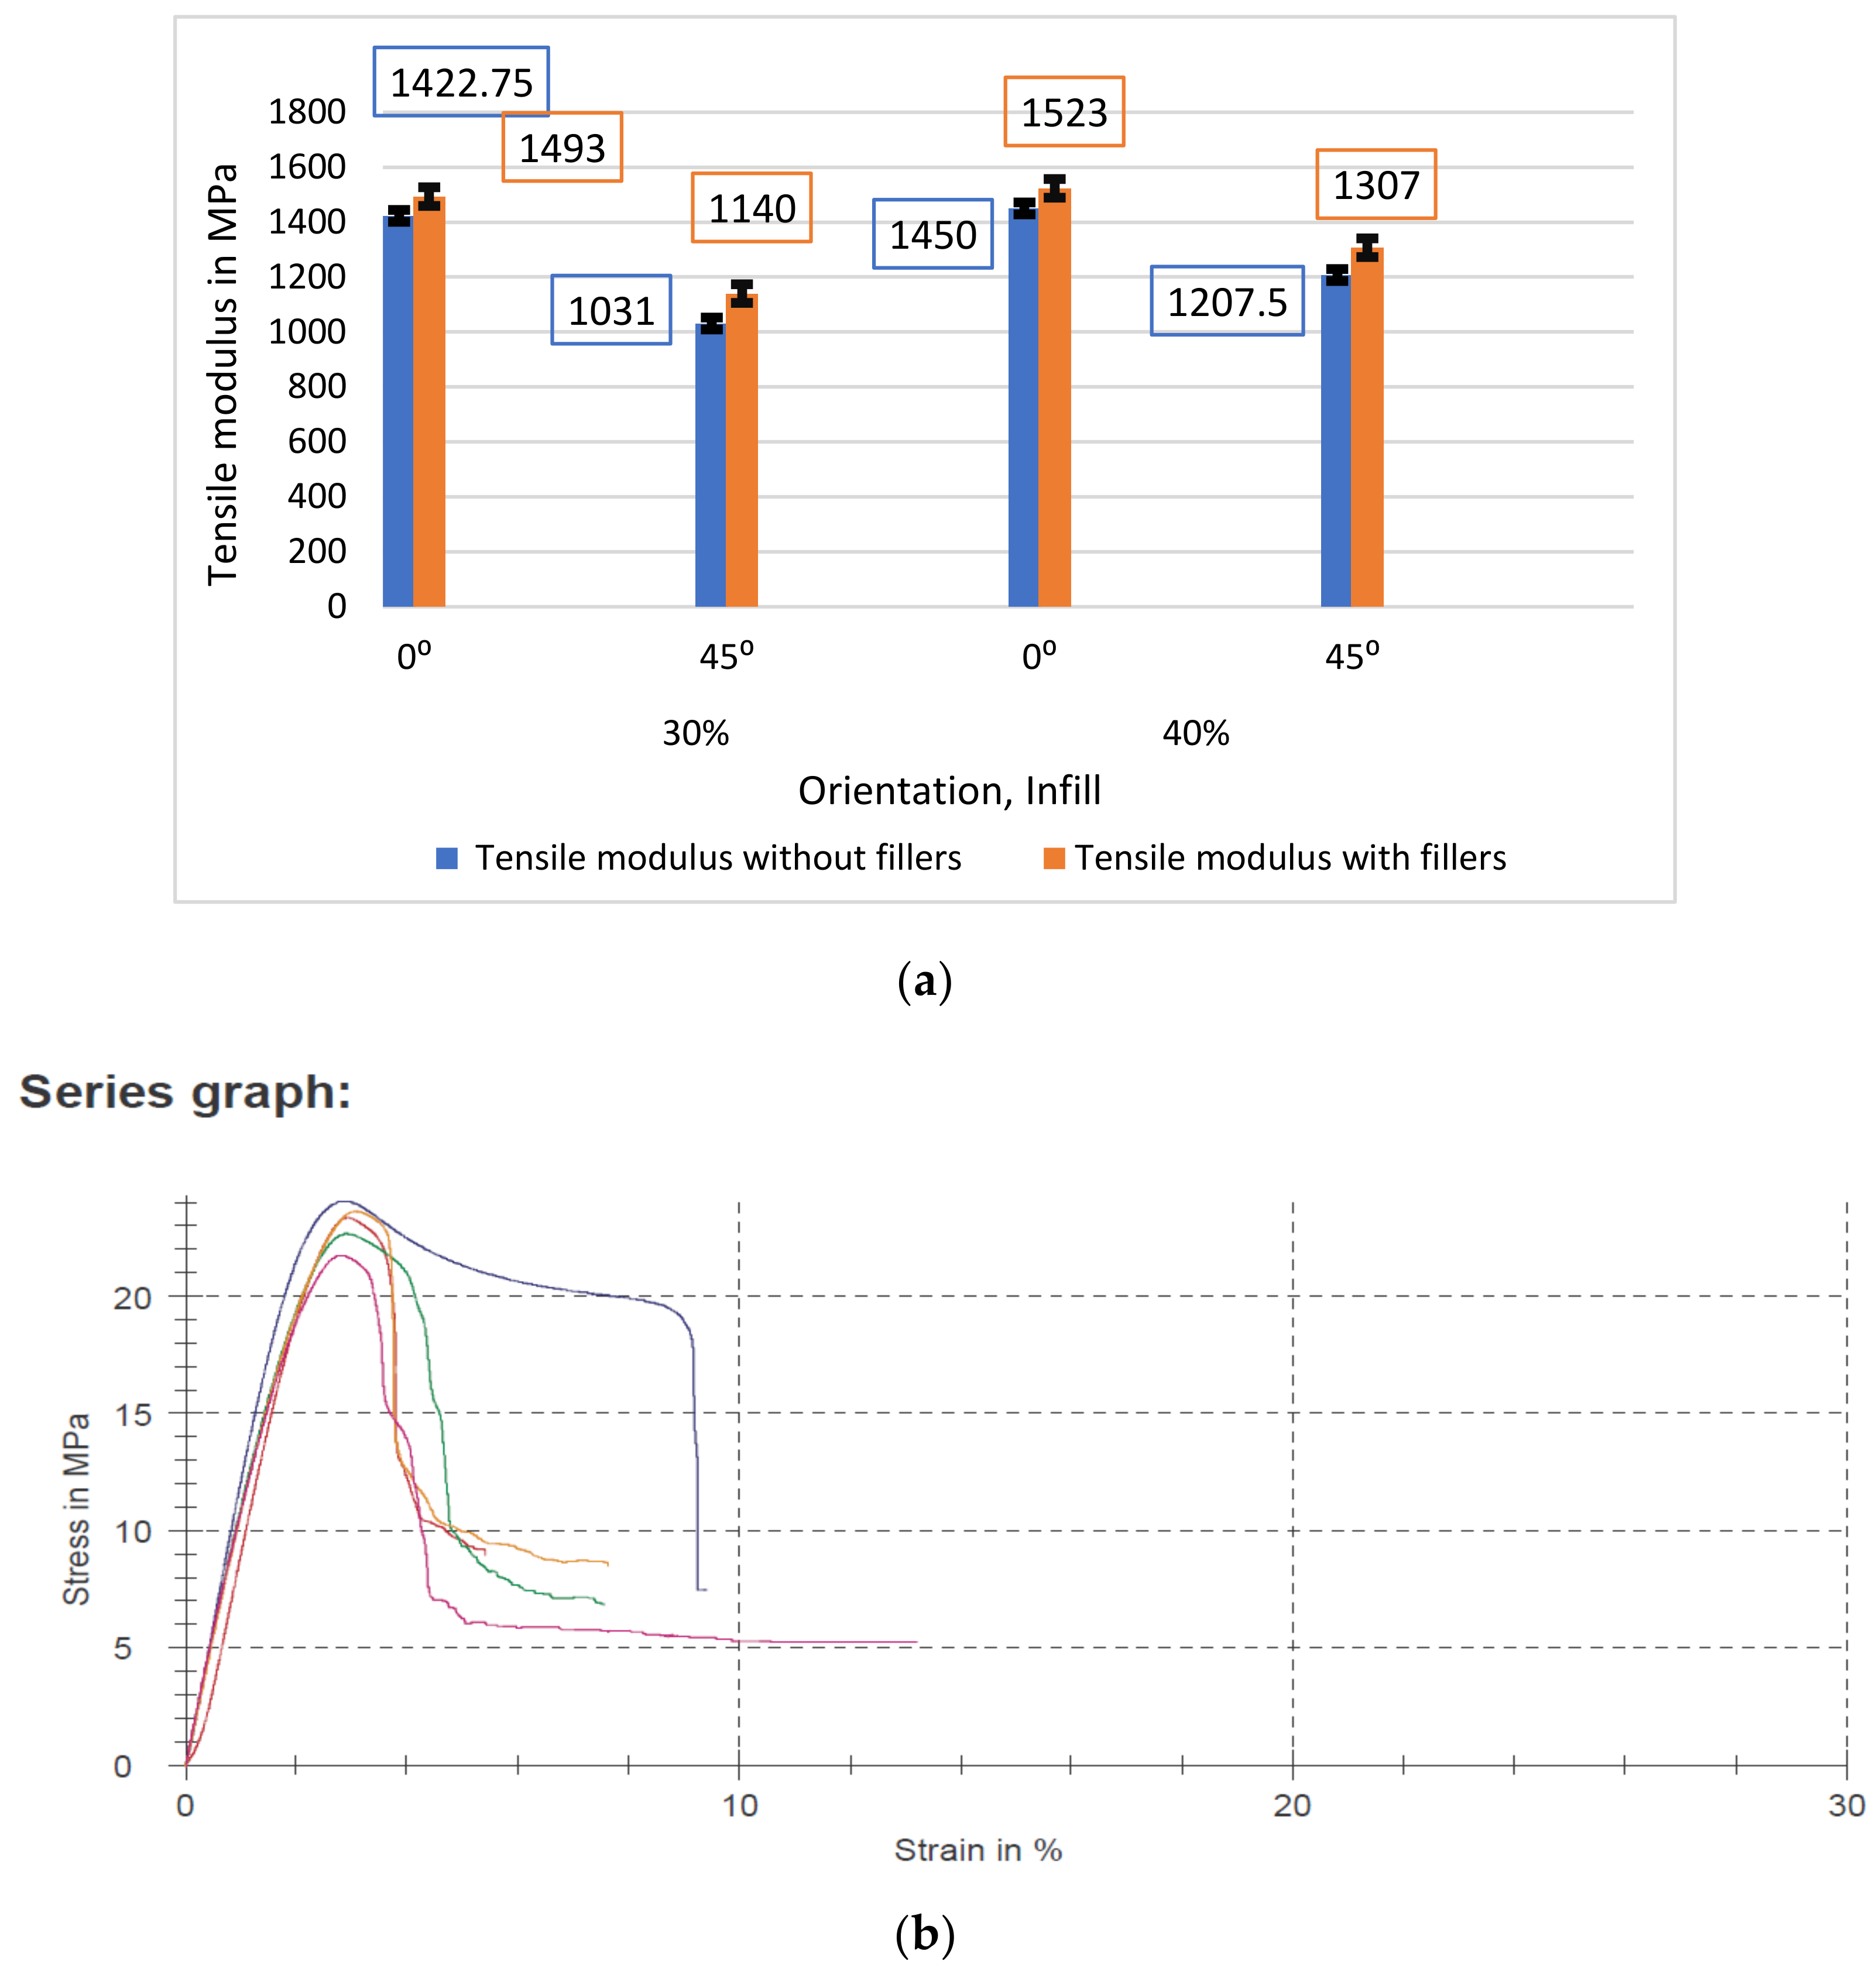
The test results indicated that increasing the infill percentage enhances both strength and stiffness, as more material is present between the layers. Additionally, samples containing fillers exhibited improved performance and ductility during fracture, attributed to the material’s softening from the soybean oil. The 0° orientation samples demonstrated greater elongation due to the interplay between the pattern structure, testing direction, and oil absorption.
The tensile modulus of the samples was noted, which helps in analyzing the stiffness and elastic deformation of the samples under load. From Graph 1b,c, it was observed that the samples containing fillers displayed higher tensile strength, indicating that this category of samples was able to endure a greater tensile force before failure.

6.3. Flexural Test

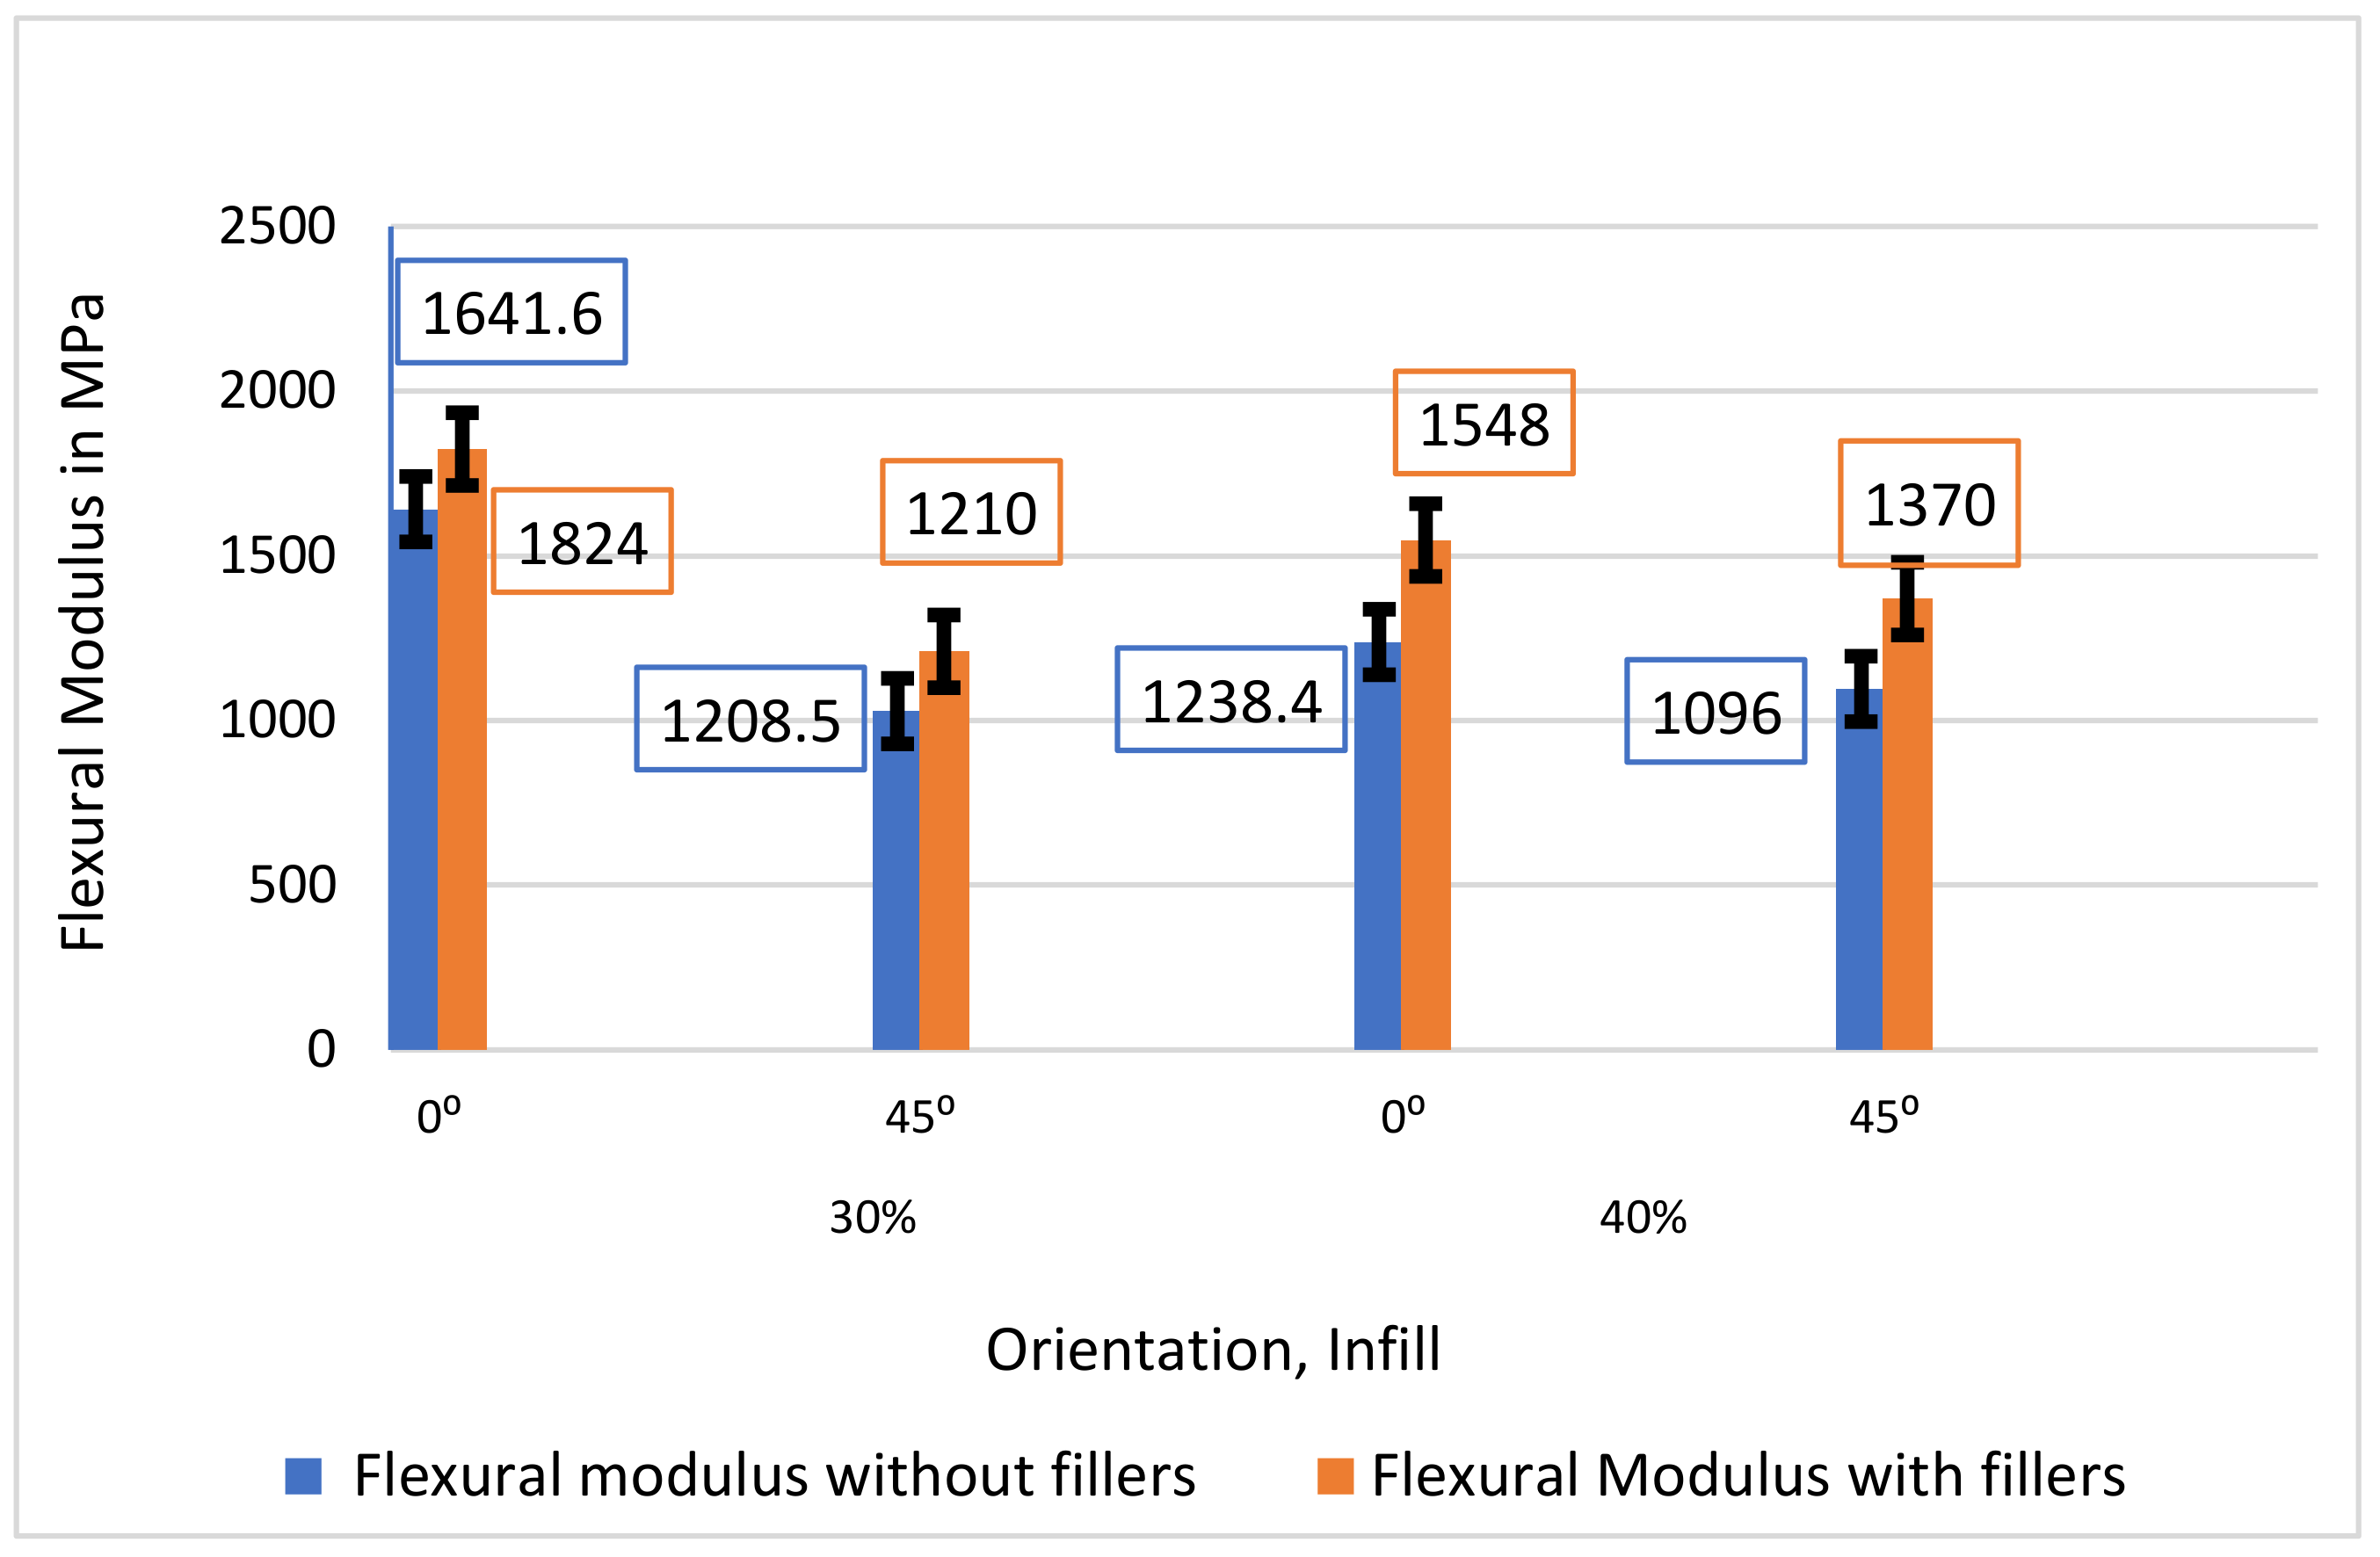
It was observed from Graph 2 that samples with 30% infill had a higher flexural modulus compared to those with 40% infill. This can be attributed to the larger pattern area in the 30% infill samples, which allows for more fillers and better absorption. This discrepancy highlights that the flexural modulus is elevated in samples with fillers due to greater soybean oil absorption, which enhances the plasticizing effect. Soybean oil treatment softens the material, increasing its flexibility and deformation capacity before failure, resulting in a higher apparent modulus during the flexural test.

6.4. Charpy Impact Test

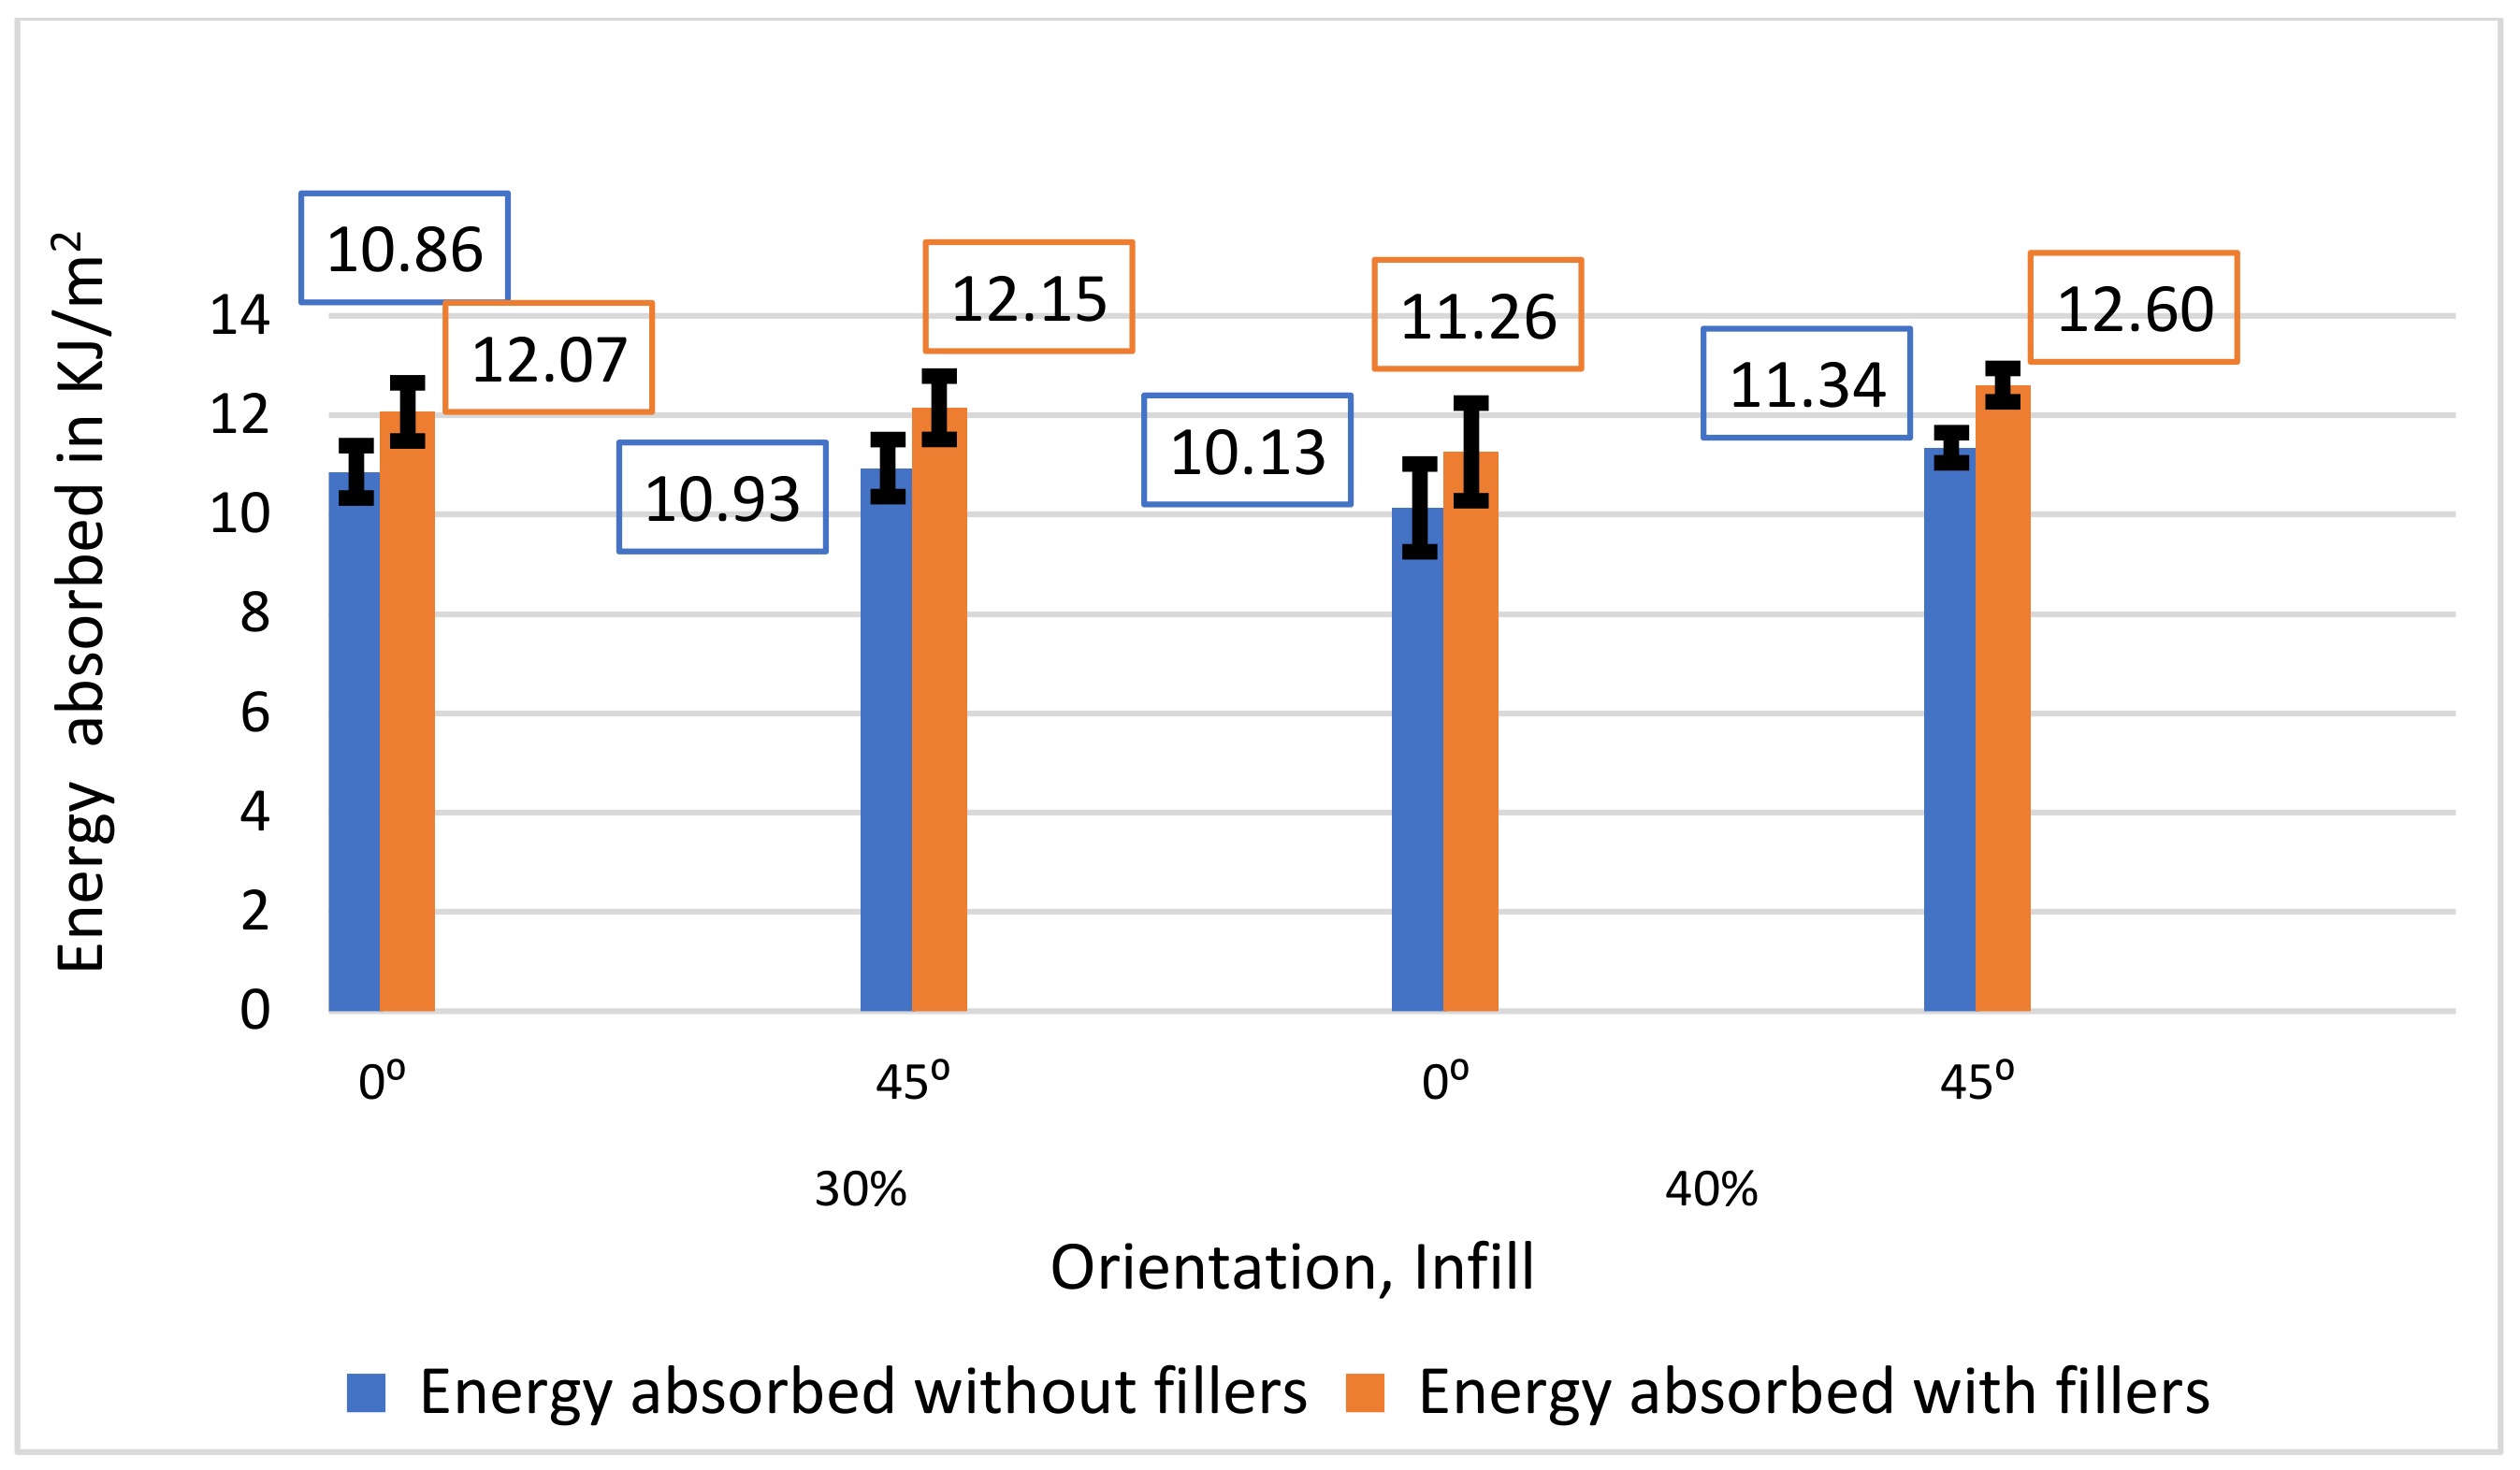
In comparison to samples with 30% infill, those with 40% infill were able to absorb greater energy before fracturing in the Charpy impact test. Through orientation comparison, it was found from Graph 3 that samples with a 45° orientation exhibited superior energy absorption in comparison to those with a 0° orientation.

6.5. Heat Deflection Temperature Test

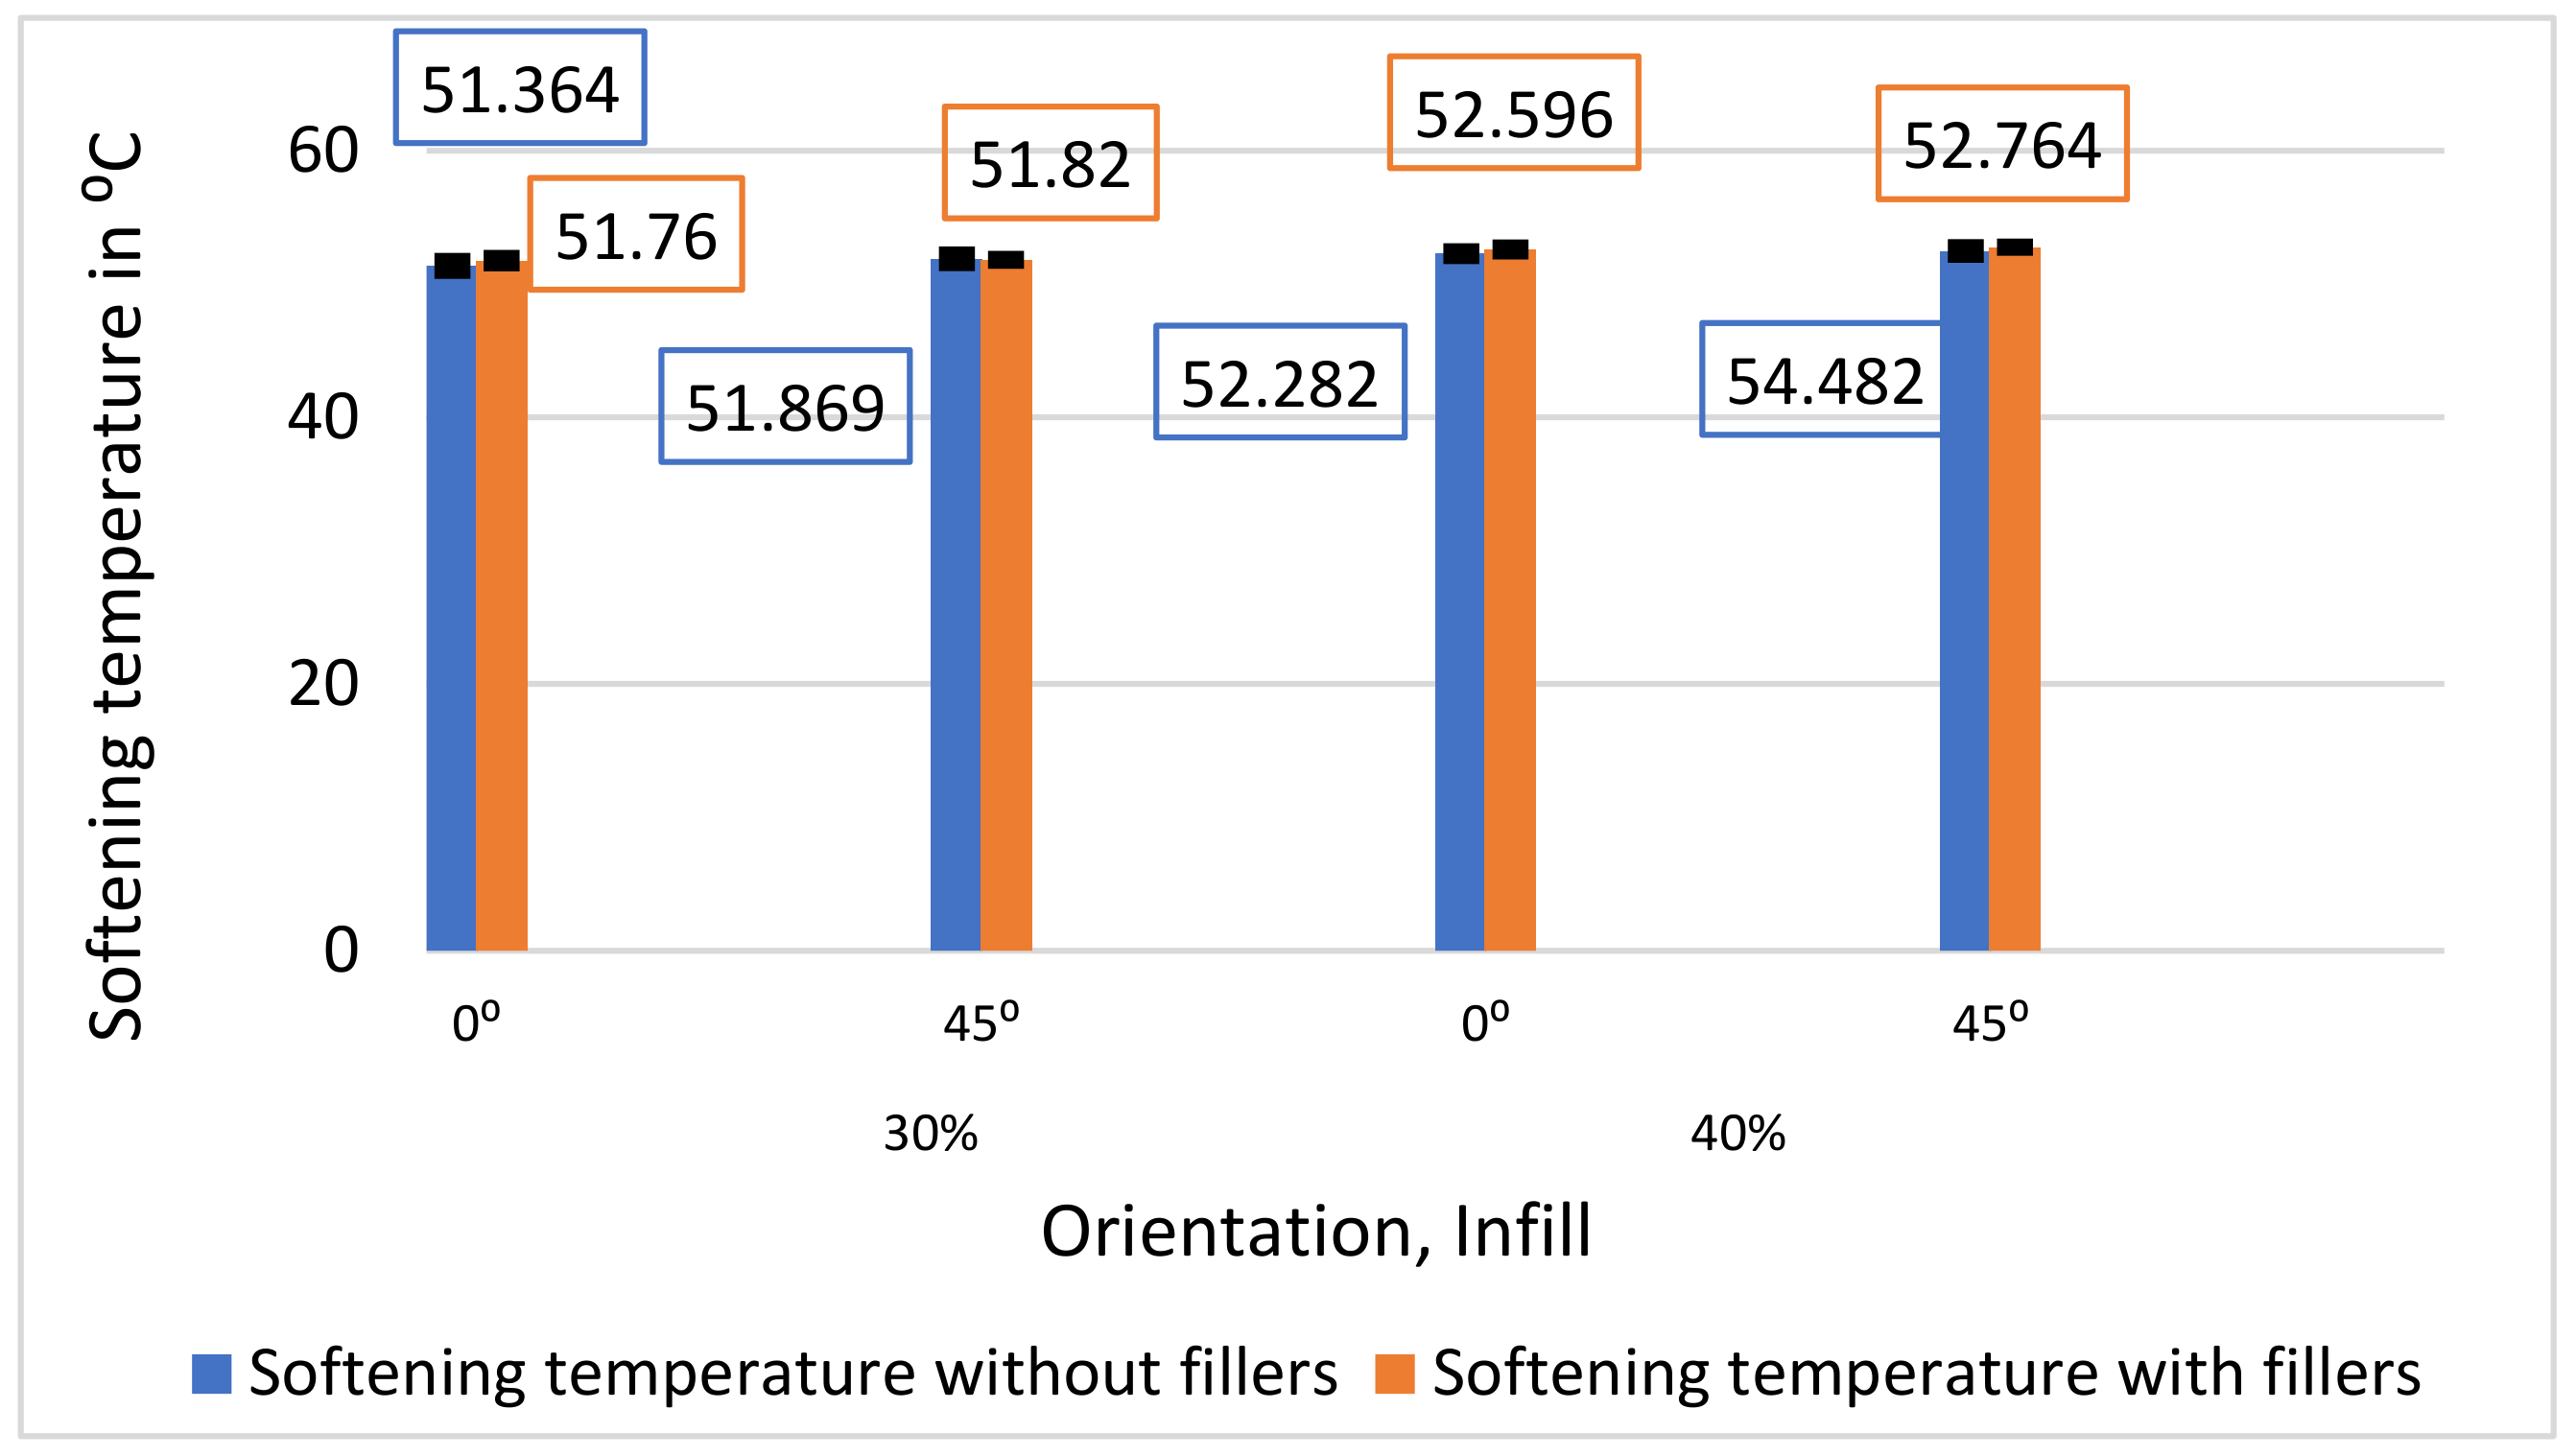
According to the HDT test results in Graph 4, the 3D-printed samples with a 45° orientation, and a greater 40% infill percentage had better thermal resistance, which qualifies them for uses where heat resistance is essential. There is not much of a difference between these readings. This demonstrates that when applying a load at an increased temperature, filler application has very little effect on the material.

7. Discussion

Samples with less infill absorbed more oil due to a much higher pattern area when investigated on each hexagonal structure. Adding sawdust as a filler to PLA+ can enhance its mechanical properties (e.g., stiffness and tensile strength) due to the reinforcing nature of natural fibers, especially in a lightweight, structured design like a hexagonal [24]. Soybean oil acts as a plasticizer, making the PLA matrix more flexible by reducing the glass transition temperature (Tg), which thereby increases the material’s ductility and reduces brittleness [25]. Sawdust serves as an absorption medium for the samples in this instance, allowing the medium to soften the internal pattern region as well. A modest improvement can be seen in the 30% and 40% infill samples, suggesting that the inclusion of fillers improves the tensile characteristics of the samples. This improvement implies that the fillers help strengthen the material and increase its ability to support weight. The layers align with the direction of tensile loading when an item is produced in a 0° orientation. Comparing this alignment to components printed at a 45° orientation, the former usually yields better stiffness and tensile strength, increasing Young’s modulus. In addition, it was noticed that the samples experienced higher ductility caused by oil absorption, and hence, they were able to achieve superior elongation. In contrast to samples printed at a 0⁰ orientation, samples printed at a 45° orientation had a reduced tensile modulus due to the existence of shear stress between the layers.
Additionally, the flexural modulus values increased slightly across the various printing orientations and infill percentages with the introduction of fillers, indicating enhanced material stiffness. Notably, samples with 30% infill and a 0° orientation exhibited more significant improvements due to the larger interior pattern area available for filler integration. This allows the printed layers to interlock more effectively, increasing the part’s resistance to applied stresses. The fillers’ improved binding and reinforcing capabilities also contributed to better energy absorption in the Charpy impact test. The use of sawdust and soybean oil as fillers aids in the efficient distribution of loads, hinders crack propagation, and enhances toughness and energy absorption.

8. Conclusions

In conclusion, the mechanical properties of 3D-printed specimens are significantly influenced by several key variables, including filler content, printing direction, and infill percentage. This investigation has revealed that filler integration enhances tensile characteristics, while lower infill percentages result in increased oil absorption and greater elongation. Moreover, impact resistance and tensile modulus were notably affected by printing orientation, with samples printed at a 45° angle demonstrating superior energy absorption due to the more effective distribution of impulse forces during impact.
Moreover, the inclusion of fillers improves the flexural modulus across different printing orientations and infill percentages, thereby enhancing stiffness. This underscores the significance of optimizing these variables to maximize the mechanical performance of 3D-printed components for various applications. By meticulously adjusting the filler content, printing direction, and infill percentage, manufacturers can customize the mechanical properties of 3D-printed parts to meet specific application needs, ensuring optimal performance and durability in diverse conditions.

9. Future Scope

To optimize the advantages of filler integration while reducing material consumption, further research could concentrate on infill patterns and density optimization. Furthermore, investigating how various environmental factors, such as temperature changes and humidity, affect the mechanical characteristics of filled 3D-printed samples may shed light on how well and how long they last in actual use.
All things considered, the results pave the way for further developments in material science, additive manufacturing, and engineering applications, which could potentially solve a few issues and improve the functionality of 3D-printed parts in a range of sectors.

Author Contributions

Y.T.R. contributed to the data collection, synthesis and writing of the initial drafts of the manuscript. J.S. helped with research progress and reviewing the report. Methodology, Y.T.R.; Supervision, Y.P.S., J.S. and Y.P.S. helped with the report reviewing. All authors have read and agreed to the published version of the manuscript.

Funding

The APC was sponsored by Hochschule Kaiserslautern, whereas no external funding was provided for this research.

Data Availability Statement

Data is contained within the article.

Acknowledgments

The authors are grateful for the financial assistance provided for this study by the Institute for Plastics Technology West Palatinate (IKW).

Conflicts of Interest

The authors declare no conflict of interest.

References

  1. Nyabadza, A.; Mc Donough, L.M.; Manikandan, A.; Ray, A.B.; Plouze, A.; Muilwijk, C.; Freeland, B.; Vazquez, M.; Brabazon, D. Mechanical and antibacterial properties of FDM additively manufactured PLA parts. Results Eng. 2024, 21, 101744. [Google Scholar] [CrossRef]
  2. Dizon, J.R.C.; Espera, A.H., Jr.; Chen, Q.; Advincula, R.C. Mechanical characterization of 3D-printed polymers. Addit. Manuf. 2018, 20, 44–67. [Google Scholar] [CrossRef]
  3. Shahrubudin, N.; Lee, T.C.; Ramlan RJ, P.M. An overview on 3D printing technology: Technological, materials, and applications. Procedia Manuf. 2019, 35, 1286–1296. [Google Scholar] [CrossRef]
  4. Chacón, J.M.; Caminero, M.A.; García-Plaza, E.; Núnez, P.J. Additive manufacturing of PLA structures using fused deposition modelling: Effect of process parameters on mechanical properties and their optimal selection. Mater. Des. 2017, 124, 143–157. [Google Scholar] [CrossRef]
  5. Rajan, K.; Samykano, M.; Kadirgama, K.; Harun WS, W.; Rahman, M.M. Fused deposition modeling: Process, materials, parameters, properties, and applications. Int. J. Adv. Manuf. Technol. 2022, 120, 1531–1570. [Google Scholar] [CrossRef]
  6. Tanikella, N.G.; Wittbrodt, B.; Pearce, J.M. Tensile strength of commercial polymer materials for fused filament fabrication 3D printing. Addit. Manuf. 2017, 15, 40–47. [Google Scholar] [CrossRef]
  7. Shaik, Y.P.; Schuster, J.; Shaik, A.; Mohammed, M.; Katherapalli, H.R. Effect of autoclave pressure and temperature on consolidation of layers and mechanical properties of additively manufactured (FDM) products with PLA. J. Manuf. Mater. Process. 2021, 5, 114. [Google Scholar] [CrossRef]
  8. Chadha, A.; Ul Haq, M.I.; Raina, A.; Singh, R.R.; Penumarti, N.B.; Bishnoi, M.S. Effect of fused deposition modelling process parameters on mechanical properties of 3D printed parts. World J. Eng. 2019, 16, 550–559. [Google Scholar] [CrossRef]
  9. Wasti, S.; Adhikari, S. Use of biomaterials for 3D printing by fused deposition modeling technique: A review. Front. Chem. 2020, 8, 315. [Google Scholar] [CrossRef] [PubMed]
  10. Lohar, D.V.; Nikalje, A.M.; Damle, P.G. Synthesis and characterization of PLA hybrid composites using bio waste fillers. Mater. Today Proc. 2023, 72, 2155–2162. [Google Scholar] [CrossRef]
  11. Jandyal, A.; Chaturvedi, I.; Wazir, I.; Raina, A.; Haq, M.I.U. 3D printing—A review of processes, materials and applications in industry 4.0. Sustain. Oper. Comput. 2022, 3, 33–42. [Google Scholar] [CrossRef]
  12. Bakar AA, B.A.; Zainuddin MZ, B.; Adam AN, B.; Noor IS, B.M.; Tamchek, N.B.; Alauddin MS, B.; Ghazali MI, B.M. The study of mechanical properties of poly (lactic) acid PLA-based 3D printed filament under temperature and environmental conditions. Mater. Today Proc. 2022, 67, 652–658. [Google Scholar] [CrossRef]
  13. Jawad, I.M.; Kochhar, S.P.; Hudson, B.J.F. Quality characteristics of physically refined soyabean oil: Effects of pre-treatment and processing time and temperature. Int. J. Food Sci. Technol. 1983, 18, 353–360. [Google Scholar] [CrossRef]
  14. Ayrilmis, N. Effect of layer thickness on surface properties of 3D printed materials produced from wood flour/PLA filament. Polym. Test. 2018, 71, 163–166. [Google Scholar] [CrossRef]
  15. Jubinville, D.; Tzoganakis, C.; Mekonnen, T.H. Recycled PLA–Wood flour based bio composites: Effect of wood flour surface modification, PLA recycling, and maleation. Constr. Build. Mater. 2022, 352, 129026. [Google Scholar] [CrossRef]
  16. Letcher, T.; Waytashek, M. Material property testing of 3D-printed specimen in PLA on an entry-level 3D printer. In ASME International Mechanical Engineering Congress and Exposition; American Society of Mechanical Engineers: New York, NY, USA, 2014; Volume 46438, p. V02AT02A014. [Google Scholar]
  17. Ezoji, M.; Razavi-Nouri, M.; Rezadoust, A.M. Optimization of processing parameters in 3D-printing of poly (lactic acid) by fused deposition modeling method. Iran. J. Polym. Sci. Technol. 2017, 30, 115–126. [Google Scholar]
  18. Butt, J.; Bhaskar, R. Investigating the effects of annealing on the mechanical properties of FFF-printed thermoplastics. J. Manuf. Mater. Process. 2020, 4, 38. [Google Scholar] [CrossRef]
  19. Michigan Tech. Michigan Technology University, Internet Citation (2022) about Tensile Test. Available online: https://www.mtu.edu/materials/k12/experiments/tensile (accessed on 13 June 2024).
  20. Internet Citation (2022) about Flexural Test Resources. Available online: https://www.testresources.net/applications/test-types/flexural-test (accessed on 15 June 2024).
  21. Faustino, M. On the effect of shear and local performance in three point bending tests. Polym. Test. 2007, 26, 869–877. [Google Scholar]
  22. Tóth, L. Historical background and development of the Charpy test. In From Charpy to Present Impact Testing; European Structural Integrity Society: Cassino, Italy, 2002; pp. 3–19. [Google Scholar]
  23. Plastics–Thermoplastic Materials–Determination of Vicat Softening Temperature (VST) (ISO 306:2013), German Version EN ISO 306:2013. Available online: https://www.dinmedia.de/de/norm/din-en-iso-306/191854089 (accessed on 25 March 2024).
  24. Narlıoğlu, N.; Salan, T.; Alma, M.H. Properties of 3D-printed wood sawdust-reinforced PLA composites. BioResources 2021, 16, 5467–5480. [Google Scholar] [CrossRef]
  25. Bajwa, D.; Eichers, M.; Shojaeiarani, J.; Kallmeyer, A. Influence of biobased plasticizers on 3D printed polylactic acid composites filled with sustainable biofiller. Ind. Crops Prod. 2021, 173, 114132. [Google Scholar] [CrossRef]
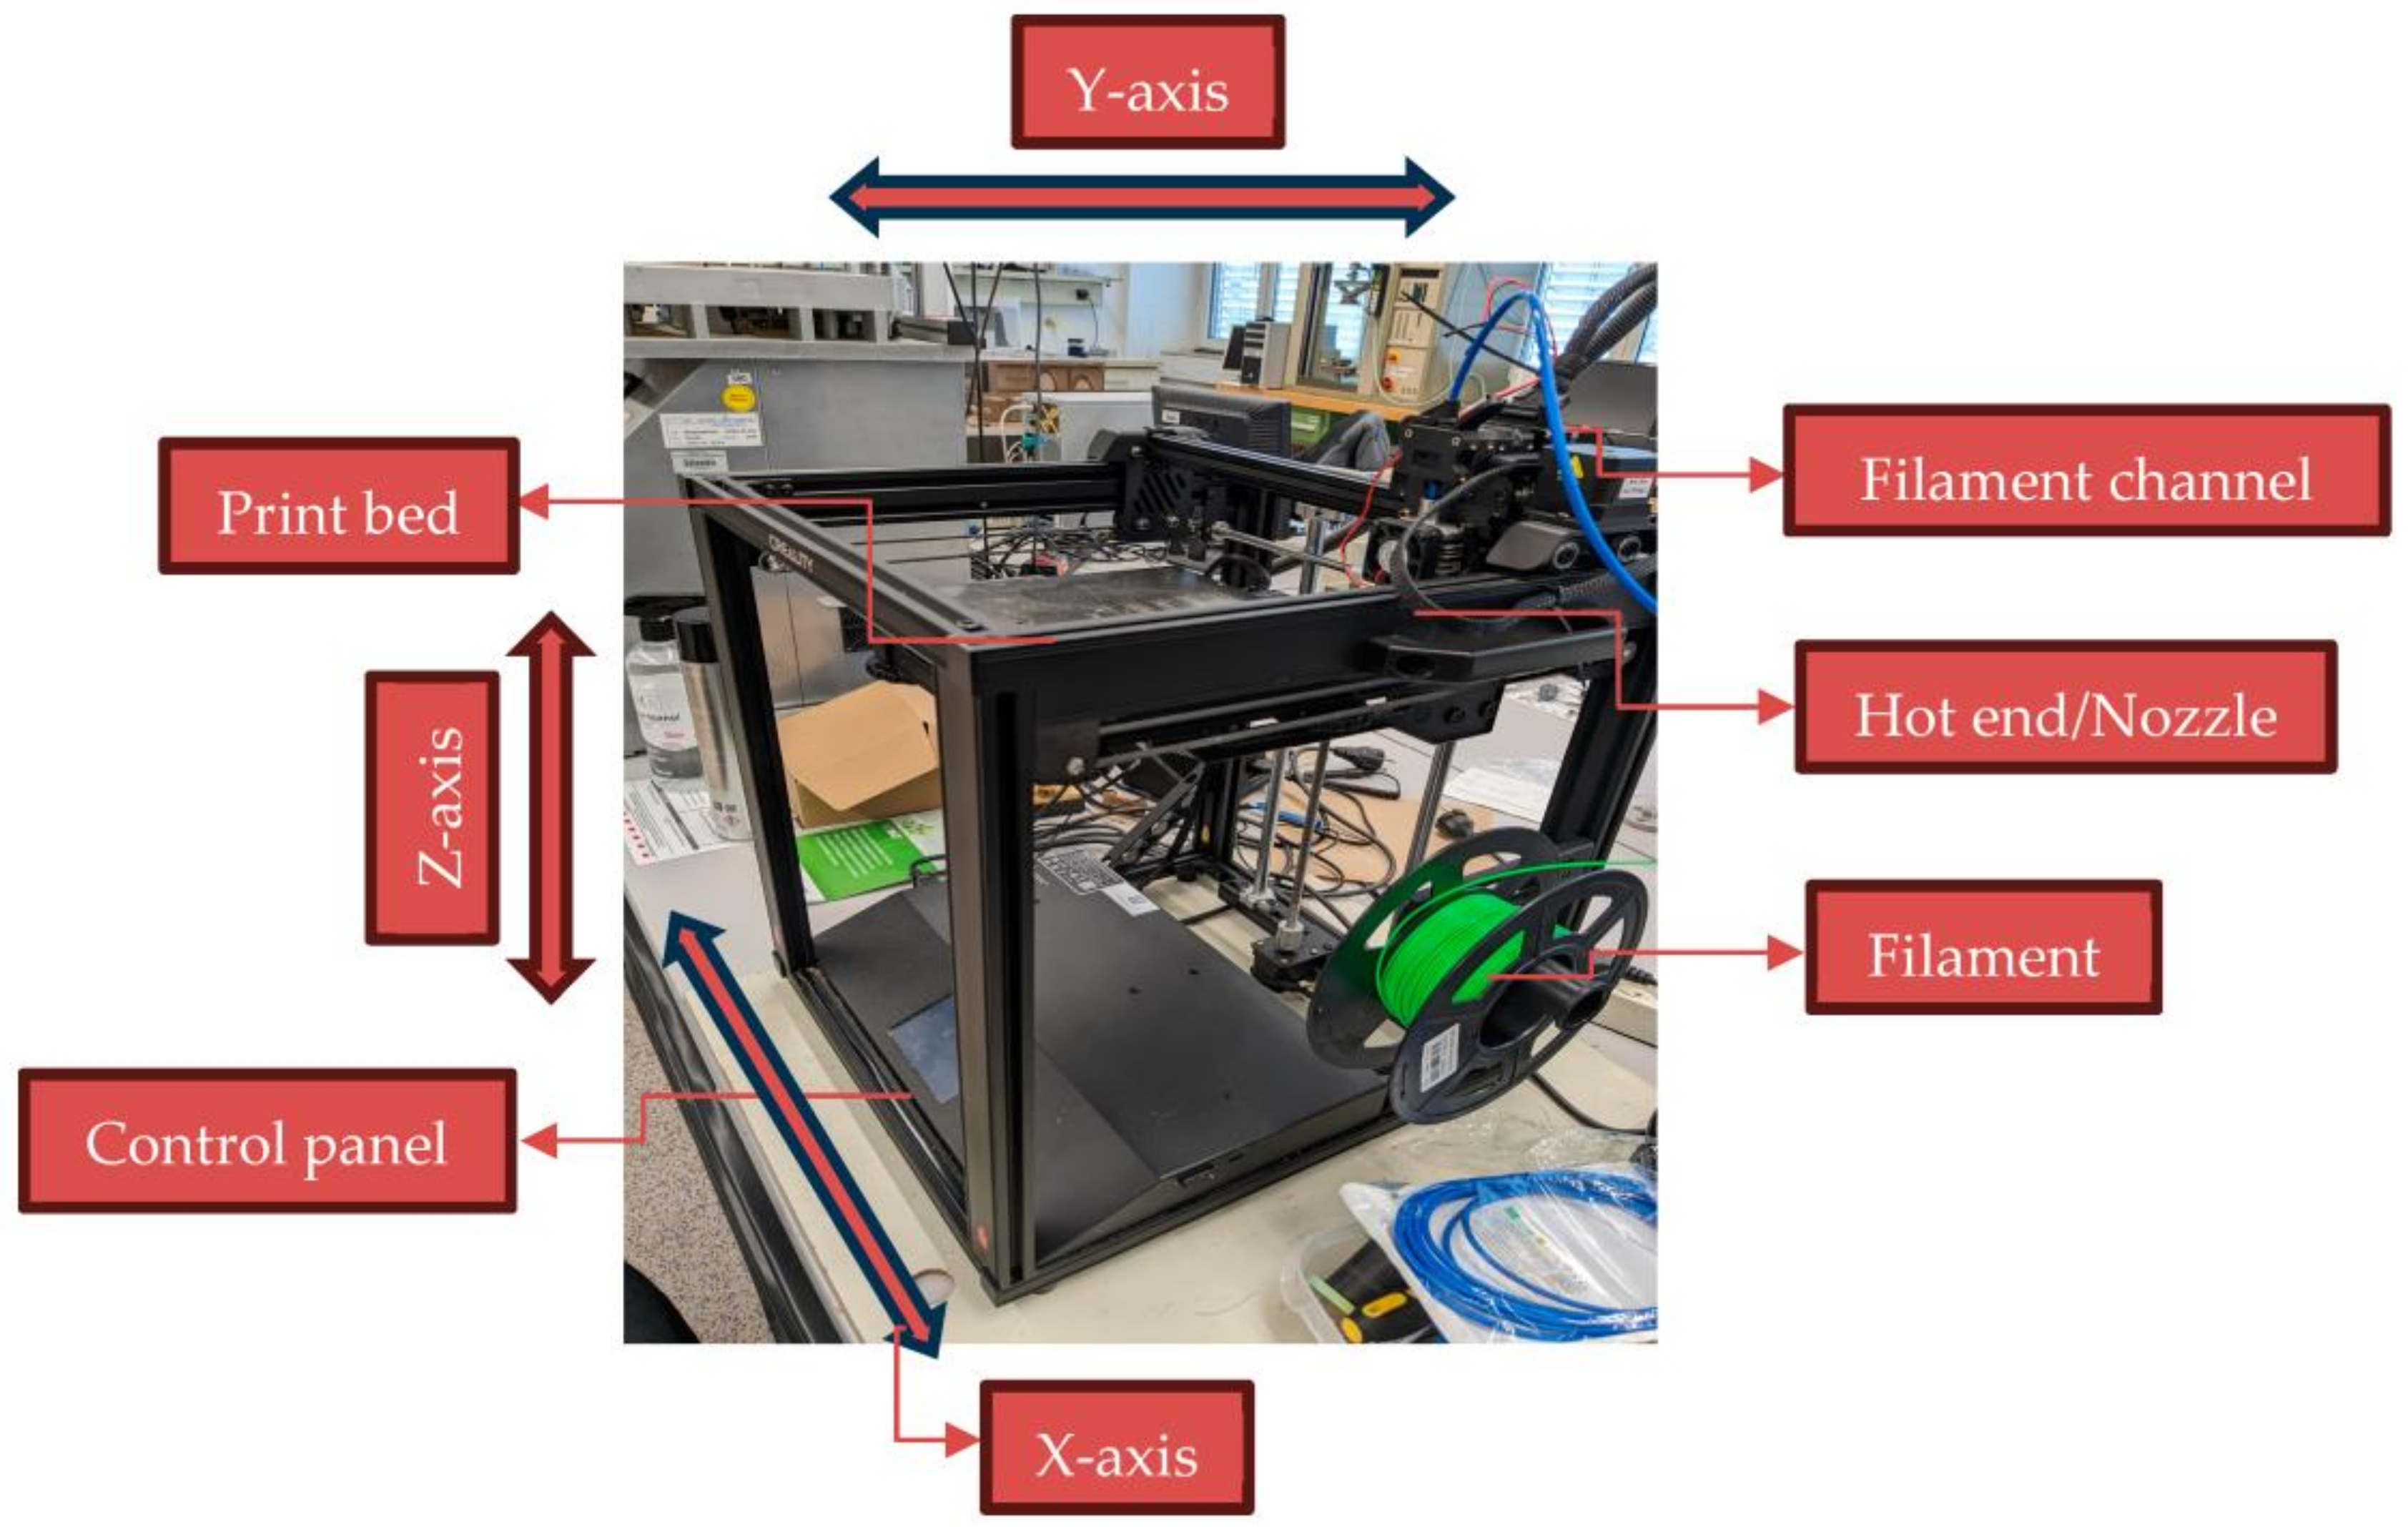
Figure 1. The Creality Ender 5S1 3D printer with its axis and components.
Jmmp 08 00193 g001
Figure 2. (a) Intersection of the sample in slicing software; (b) final sample in slicing software.
Jmmp 08 00193 g002
Figure 3. (a) Sample with 0° orientation with reference axis R. (b) Sample with 45° orientation with reference axis R.
Jmmp 08 00193 g003
Figure 4. (a) View of 3D-printed samples with sawdust. (b) Final view of the samples after printing.
Jmmp 08 00193 g004
Figure 5. (a) Samples for the flexural test with sawdust. (b) Samples without sawdust.
Jmmp 08 00193 g005
Graph 1. (a) Tensile test results for the samples with fillers and without fillers. (b) Tensile test results for the samples without fillers. (c) Tensile test results for the samples with fillers.
Jmmp 08 00193 gr001aJmmp 08 00193 gr001b
Graph 2. Flexural test results for the samples with fillers and without fillers.
Jmmp 08 00193 gr002
Graph 3. Charpy impact test results for the samples with fillers and without fillers.
Jmmp 08 00193 gr003
Graph 4. Heat deflection temperature test results for the samples with fillers and without fillers.
Jmmp 08 00193 gr004
Table 1. Design of experiments.
Tests without Fillers Tests with Fillers
Infill % Orientation Infill % Orientation 
30%30%
45°45°
40%40%
45°45°
Table 2. (a) Oil absorption test results for the samples without fillers. (b) Oil absorption test results for the samples with fillers.
(a)
Infill %OrientationInitial Weight, Wi [g]Final Weight, Wf [g]Oil Absorption [%]
306.48 6.68 3.08
45°6.63 6.80 2.54
407.81 7.98 1.97
45°7.98 8.15 2.12
(b)
Infill %OrientationInitial Weight, Wi [g]Final Weight, Wf [g]Oil Absorption [%]
307.23 7.95 9.95
45°7.45 8.11 8.84
408.42 8.96 6.41
45°8.68 9.08 5.81
Disclaimer/Publisher’s Note: The statements, opinions and data contained in all publications are solely those of the individual author(s) and contributor(s) and not of MDPI and/or the editor(s). MDPI and/or the editor(s) disclaim responsibility for any injury to people or property resulting from any ideas, methods, instructions or products referred to in the content.