Abstract
Multilayer composite materials, consisting of layers of aluminum alloy and steel, are used in the manufacturing of large engineering structures, including in the shipbuilding and railcar industries. Due to the different properties of aluminum alloys and steels, it is difficult to achieve high-strength joints by conventional welding. Therefore, these joints are produced by explosive welding. In the present work, the structure of a multilayer material, AA1070-AlMg6-AA1070 (aluminum alloys)-VT1-0-08Cr18Ni10Ti (steel), was investigated after explosive welding and heat treatments were performed under different conditions. The microstructure of the AlMg6 layer at the AlMg6-AA1070 interface consists of shaped anisotropic grains extending along the weld interface. The AA1070 layer is enriched with magnesium due to its diffusive influx from AlMg6. In the AlMg6 and VT1-0 layers, adiabatic shear bands are found that start at the weld interface and propagate deep into the material. The optimal temperature for the heat treatment is 450–500 °C, as internal stresses are reduced at this temperature and the grain structure of the AlMg6 layer is not coarse. Tear strength testing revealed that the tear strength of the composite material after explosive welding was 130 ± 10 MPa, which exceeded the strength of the AA1070 alloy.
1. Introduction
Multilayer composite materials (MCMs) consisting of aluminum alloy and steel are widely used in the shipbuilding and railcar industries due to their high specific strength and corrosion resistance [1,2,3]. However, due to the significant difference in the properties of aluminum alloys and steels, the joint strength of the layers is low. This is primarily due to the formation of brittle intermetallic compounds (IMCs) of FexAly type at the weld interface.
MCMs are produced by friction welding [4,5,6], diffusion welding [7], magnetic pulse welding [8], rolling [9,10], and explosive welding [11,12]. Although the formation of brittle IMCs occurs in all of these processes, explosive welding (EW) is the most energy-efficient process that produces minimal brittle IMCs at the weld interface.
IMCs are formed by local heating of the welded surfaces under plastic deformation and high-temperature shock gas (SCG) in the welding gap [13]. For example, [14,15] show that, as a result of local heating, the IMCs of Fe4Al13, Fe2Al5, FeAl2 and FeAl are formed at the weld interface. In [16], the temperature in the welding gap was approximately 1100 K during the EW of AA5052 and stainless steel 316 (SS316), whereas, in [17], the authors measured the temperature of the SCG region using optical pyrometry and showed that this temperature reached 4100–4400 K. The temperature value depends on the detonation velocity, as the higher the detonation velocity, the higher the temperature.
When Al-Mg alloys and steels are welded, difficulties arise because of the low ductility and fracture toughness of Al-Mg alloys. In addition, adiabatic shear bands (ASBs) are formed in Al-Mg alloys, which can be a source of weld failure. These difficulties add to the current challenges associated with welding aluminum alloys and steels. Therefore, Al-Mg alloys and steels are welded by using an interlayer. Aluminum is often used as an interlayer due to its high ductility [18], but, in this case, the joint strength cannot exceed the strength of the aluminum. On the other hand, the strength and hardness of aluminum increase after EW since work hardening occurs.
As noted by Han Jun-Hyun et al., the aluminum interlayer (AA1050) is strengthened during the EW of AA5083 to SS4 steel [12]. The maximum strength was achieved using a 0.2 mm thick interlayer.
Titanium is also used as an interlayer because aluminum does not eliminate the formation of brittle IMCs at the weld interface. For example, in [19], the authors showed that the titanium interlayer prevents the formation of brittle FexAly IMCs. Moreover, the IMCs of the TixAly phase system are formed, which have a higher initial temperature and a longer growth time than the FexAly phase system does.
In [20], the formation characteristics and properties of an explosion-welded steel–aluminum composite with a chromium layer diffusion barrier was studied. The authors found that the steel–aluminum composite with a diffusion barrier has a higher strength and better quality than the aluminum–steel bimetal.
Thus, the formation of IMC layers in an MCM during EW and heat treatment (HT) is a complex process involving structural changes and phase transformations. Research by Arisova et al. focused on the formation of IMC layers in a five-layer explosion-welded titanium–steel composite after HT at different temperatures [21]. In [22,23], particular attention was paid to the structure of the IMC layers arising at the weld interfaces during explosive welding.
Furthermore, Pervukhin et al. analyzed the relationship between HT parameters and the formation of IMC in explosion-welded titanium–aluminum-layered composites, highlighting the effects on microhardness and the interlayer thickness of intermetallic phases [23]. Overall, these studies provide insights into the structural evolution of MCMs during EW and subsequent HT. However, these works do not consider the problems of ASB formation at the weld interface and their properties after HT. There are also few works that consider the joints of steel in an Al-Mg alloy with a magnesium content higher than 5% (e.g., AlMg6) since it is a difficult material to weld [24,25].
The purpose of this work was to study the peculiarities of structure formation in the MCM of AA1070-AlMg6-AA1070-Titanium (VT1-0)-08Cr18Ni10Ti steel obtained by EW and the influence of HT on the structure of the weld interface. It is assumed that the obtained MCM has better performance properties, as the use of a refractory barrier layer of titanium increases the temperature of formation of intermetallic phases at the interface of layers and a thin layer of ductile aluminum AA1070 provides a high degree of deformation under EW.
2. Materials and Methods
- –
- The flyer plate is AA1070-AlMg6-AA1070 (10 mm × 200 mm × 300 mm) and was produced by rolling. The AA1070 aluminum layers were 0.15 mm thick (Figure 1);
- –
- The interlayer is titanium VT1-0 (2 mm × 200 mm × 300 mm);
- –
- The base plate is 08Cr18Ni10Ti stainless steel (4 mm × 200 mm × 300 mm).
The rolling process improves the mechanical properties of the AlMg6 alloy but also introduces challenges such as microcrack formation and intergranular corrosion due to high stress during processing [26]. The incorporation of an aluminum layer during rolling serves as a protective measure against these defects.
The initial AlMg6 plate has a structure that is inherent in the rolling material, as follows: elongated grains of an α-solid solution of Mg in (Al), including the intermetallic β-phase (Mg2Al3) and (Fe, Mn)Al6 (Figure 1 and Table 1). Figure 1 shows that the β-phase (Mg2Al3) is located along the grain boundaries. This phase is harder than the α-solid solution [27]. The diameter of the grains was approximately 10–50 µm.
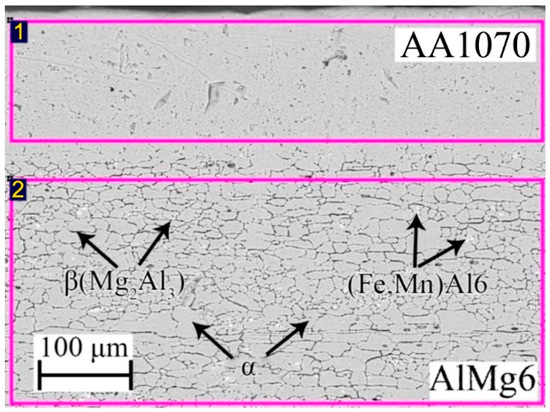


Figure 1.
Microstructure of the initial AlMg6 and EDS results: Spectrum 1 and 2 are scanning areas.

Table 1.
EDS results for the AA1070-AlMg6 interface (all results in atomic %).
Table 1.
EDS results for the AA1070-AlMg6 interface (all results in atomic %).
| Spectrum | C | O | Mg | Al | Mn | Fe |
|---|---|---|---|---|---|---|
| 1 | 16.52 | 4.12 | 0.08 | 79.14 | 0.02 | 0.07 |
| 2 | 14.46 | 3.81 | 5.89 | 75.49 | 0.27 | 0.07 |
Table 2 and Table 3 present the physical and mechanical properties and chemical compositions of the initial materials.


Table 2.
Physical and mechanical properties of the initial materials.
Table 2.
Physical and mechanical properties of the initial materials.
| Material | Ultimate Tensile Strength, MPa | Yield Strength, MPa | Elongation, % | Density, kg/m3 | Microhardness, HV |
|---|---|---|---|---|---|
| AlMg6 | 353–356 | 193–221 | 16.6–19.3 | 2640 | 150 |
| VT1-0 | 375 | 20–30 | 4050 | 380 | |
| 08Cr18Ni10Ti | 490–520 | 196–210 | 40–43 | 7900 | 550 |
| AA1070 | 60 | 20–30 | 2700 | 60 |

Table 3.
Chemical compositions of the initial materials.
Table 3.
Chemical compositions of the initial materials.
| Material | Al | Mg | Mn | Zn | Fe | C | Si | Cu | Ni | Cr | Ti | Impurity |
|---|---|---|---|---|---|---|---|---|---|---|---|---|
| VT1-0 | 0.25 | 0.07 | 0.1 | 99.72 | 0.3 | |||||||
| 08Cr18Ni10Ti | 2.0 | 65 | 0.08 | 0.8 | 0.3 | 9–11 | 17–19 | 0.1 |
The element distribution maps in AlMg6, as illustrated in Figure 2a,b, reveal a uniform magnesium distribution along the thickness of the alloy, which is crucial for its mechanical properties and performance. This uniformity is indicative of effective alloying and processing techniques that enhance the material’s structural integrity. Additionally, the presence of intermetallic phases, specifically (Fe, Mn)Al6, is significant, as these phases are located at the grain boundaries of the α-solid solution, as shown in Figure 1 and Figure 2c,d. The distribution of these intermetallic phases can influence the mechanical properties of AlMg6, affecting its strength and ductility.
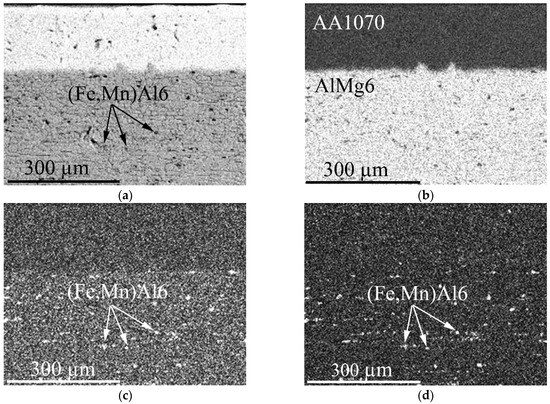
Figure 2.
Element distribution maps in AlMg6: (a) Al; (b) Mg; (c) Mn; (d) Fe.
It is known that AlMg6 alloy is susceptible to brittle fracture, which depends on the amount and size of the β phase (Mg2Al3) in the alloy and the degree of deformation or stress of the crystal lattice. Therefore, both the chemical composition of the material and its fabrication technology, as well as the subsequent HT, influence the realization of good properties.
The explosive used was a 96:4 mixture of microporous ammonium nitrate and diesel oil (density is 780 kg/m3). A layer of sand was used to reduce dispersion and ensure the completeness of the explosive detonation. The EW parameters were calculated from the equations taken from [28]. The equation for the flyer plate velocity is given as follows:
where D is the detonation velocity, m/s; r is the ratio of the explosive mass to the flyer plate mass:
where me is the explosive mass, kg, and mpl is the flyer plate mass, kg.
The collision angle was calculated from the following equation:
Table 4 shows the EW parameters.

Table 4.
EW parameters.
The EW experiments were conducted in a parallel plate configuration (Figure 3a). The surfaces of the plates were mechanically cleaned and degreased before EW. The gaps between the plates were h1 = 6 mm and h2 = 6 mm (Figure 3b). The top surface of the flyer plate was covered with a protective polythene layer. The layer of the explosive was spread over the configuration, placed in a formwork, and exploded with a detonator.
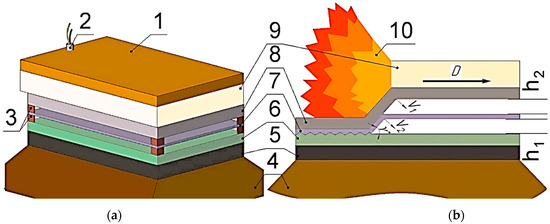
Figure 3.
Schematic diagram of the experimental assembly (a) EW process (b): 1—sand; 2—detonator; 3—copper supports, 4—sand; 5—anvil; 6—base plate; 7—interlayer; 8—flyer plate; 9—explosive; 10—detonation products; h1—upper stand-off distance; h2—lower stand-off distance.
Ultrasonic testing was performed by using a UD2V-P45 (CROPUS, St. Noginsk, Russia) apparatus with two separately combined converters with a test frequency of 5 MHz to detect delamination at the weld interface.
The specimens for metallographic studies and tear strength testing were cut from bimetallic plates by using a DK7725 wire cut electrical discharge machine (St. Beijing, China) according to the scheme shown in Figure 4.
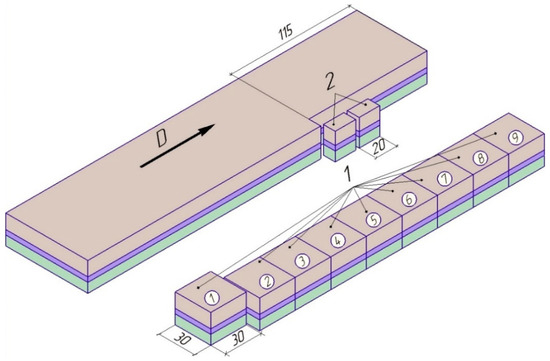
Figure 4.
Scheme of specimens and sections cutting: 1—specimens for tear strength testing; 2—metallographic sections; arrow D shows the detonation direction.
Grinding and polishing of the metallographic sections were performed on a AUTOPOL-1000 (St. Laizhou, Shandong, China) fully automatic metallographic grinding and polishing machine. Abrasive paper with grit sizes from 40 to 2500 was used for grinding. Polishing to a metallic shine was carried out using emulsions containing diamond particles ranging in size from 2 to 5 µm.
To reveal the microstructure of the surface of the metallographic sections, chemical etching was carried out with a reagent consisting of orthophosphoric, sulfuric and nitric acid at a ratio of 5:1:0.5. Etching was carried out by immersing the polished surface of the metallographic sections into the reagent heated to 100 °C and holding it for 10 s.
The microstructure of the specimens was examined using a METAM LV-34 optical microscope with a TC-500 camera (LOMO-Microsystems, St. Petersburg, Russia). Energy dispersive analysis was performed using a Carl Zeiss Ultra Plus autoemission scanning electron microscope (Carl Zeiss Microscopy, Oberkochen, Germany) based on Ultra 55 with an INCA Energy 350 XT microanalysis system from Oxford Instruments (Oxford Instruments, Abingdon, UK).
Heat treatment of the specimens was performed in a SNOL 8.2/1100 muffle furnace. Heat treatment of aluminum alloys, including AlMg6, can greatly influence their structure and properties. The main types of HT are as follows: Homogenization—alloys are heated to 450–520 °C and kept at these temperatures for 4 to 40 h [29]. As a result, the structure becomes more homogeneous and plasticity increases; annealing is carried out at temperatures of 350–450 °C with a holding time of 1–2 h, followed by relatively slow cooling. This ensures diffusion processes of solid solution decomposition and coagulation of decomposition products [30]. While higher temperatures can enhance certain properties of AlMg6, they may also lead to a decrease in strength, highlighting the need for careful control of heat treatment parameters.
In the present work, three HT modes were used for the specimens: heating to temperatures of 450 °C, 500 °C and 550 °C and holding for 1 h, with subsequent cooling in the furnace (Figure 5). These HT modes were chosen on the basis of the temperatures reached in the heat affected zone when welding products to the hull of a ship or a railway car.
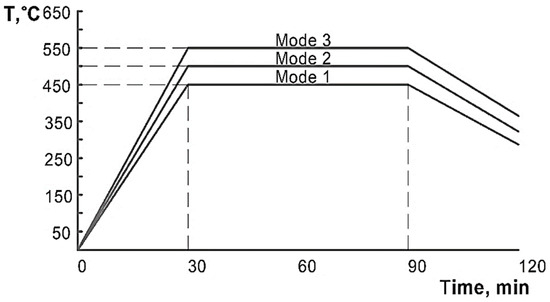
Figure 5.
Heat treatment modes.
The microhardness (HV) was measured by using a PMT-3 Vickers hardness tester (LOMO-Microsystems, St. Petersburg, Russia) and MMS 2.3 software. Loads of 50 g were applied for 10 s.
To determine the tear strength of the joint, mechanical testing was performed on a MIM.2-100 electromechanical universal testing machine (St. Neftekamsk, Russia). Since it was assumed that the tear strength of the joint between aluminum and titanium would be lower than that between titanium and 08Cr18Ni10Ti steel, the specimens for the tear testing were machined with a small deepening in the titanium interlayer (Figure 6a). A schematic of the tear testing is shown in Figure 6b.
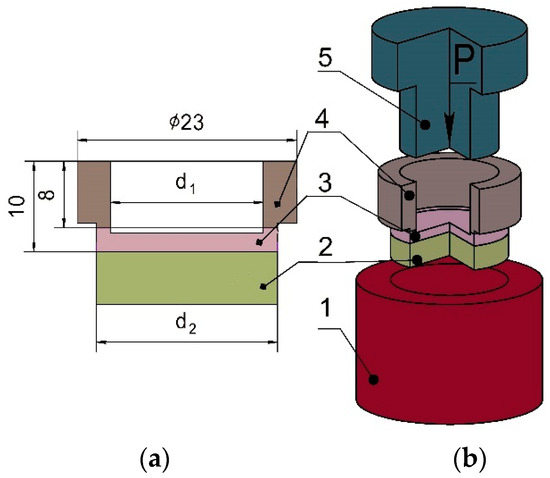
Figure 6.
Scheme of tear strength testing: (a) tear specimen; (b) tear testing diagram: 1—mold, 2—base layer, 3—interlayer, 4—flyer layer, 5—male die, P is the applied load.
The tear strength σt was calculated via the following equation:
where P is the applied load, N; d1 is the inner diameter of the specimen, mm; d2 is the outer diameter of the specimen, mm.
3. Results and Discussion
The ultrasonic testing results revealed that the unflawed regions constituted approximately 86% of the total area of the multilayer composite. The delamination regions are located along the edges of the bimetallic specimens (Figure 7a). These regions are caused by the partial dispersion of explosive particles in the environment and edge deformation of the plates. Figure 7b shows a general view of the weld interface microstructure.
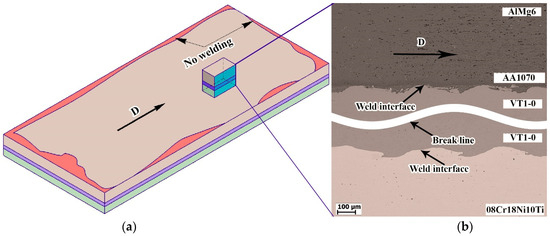
Figure 7.
Schematic illustration of the multilayer composite after ultrasonic testing (a) and the microstructure of the weld interface (b).
3.1. Study of the AlMg6–AA1070–VT1-0 Weld Interfaces
Figure 8a shows the microstructure of both the AlMg6-AA1070 and AA1070-VT1-0 weld interfaces. There is a solid layer of melted zone along the AA1070-VT1-0 weld interface. Figure 8a also shows that ASBs are formed in AlMg6 during the EW process. They are located at an angle of 45° to the AlMg6-AA1070 weld interface and extend into the AlMg6 to a depth of up to 390 µm. The presence of ASBs leads to an uneven distribution of internal stresses, which causes inhomogeneity in the AlMg6 structure [31].
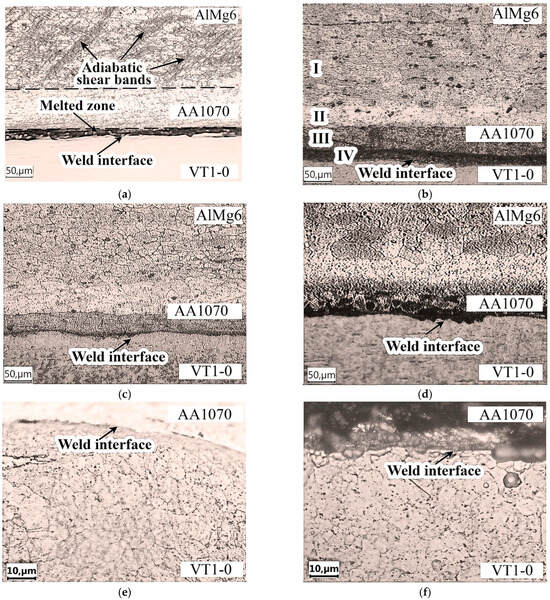
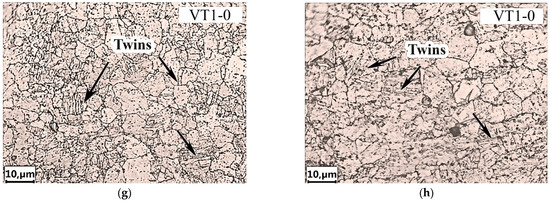
Figure 8.
Optical microstructure of the specimens after explosive welding and heat treatment: (a), (e), (g) after EW; (b) after HT at 450 °C; (c) at 500 °C; (d), (f), (h) at 550 °C.
Furthermore, in a study examining explosively welded Mg/Al alloy plates [32], ASBs were observed specifically at the interface on the magnesium alloy side, attributed to the intense deformation caused by the explosive impact. This formation is consistent with the general understanding of ASBs as a significant failure mechanism in metals under high strain rates, where micro-structural changes such as twinning and dislocation accumulation occur, leading to dynamic recrystallization and, ultimately, ASB formation [33,34].
The dynamic recrystallization plays a more critical role in formation of ASBs under high strain rates [35]. For example, in the 7003 aluminum alloy, ASB initiation occurs only after a significant temperature rise and is influenced by the strain rate and strain levels, with specific thresholds being identified for their formation [36].
The formation of ASBs in AlMg6 is due to the presence of Mg, which promotes direct interaction between dislocations and Mg atoms. This prevents the free movement of dislocations in AlMg6. In the present study, the spacing between the ASBs was measured and found to be equal to the length of the deformed α-solid solution grains along the weld interface. This indicates that the intragranular deformation mechanism predominates over the intergranular mechanism (grain boundary slip).
The predominance of intragranular deformation mechanisms over intergranular mechanisms, such as the grain boundary slip, is supported by several studies. For example, studies on the TA2 titanium alloy show that prismatic slip becomes the dominant deformation mode with increasing strain, highlighting the limitations of grain boundary slip in effectively accommodating strain transfer [37]. Furthermore, in Al-Mg-based alloys, while grain boundary slip contributes significantly to superplastic deformation, intragranular mechanisms, including dislocation slip and diffusion creep, are critical, especially as the Mg content increases, which enhances the intragranular deformation contributions [38]. In addition, a statistical crystal plasticity model emphasizes the interaction between intragranular dislocation slip and grain boundary slip, suggesting that intragranular mechanisms can enhance grain boundary slip by increasing defect density [39].
The thickness of the AA1070 layer after EW decreased by about 50 µm compared with that in the initial state (150 µm) (Figure 8a), which was due to the plastic deformation during plate collision. Importantly, there are no ASBs in the AA1070 layer, which is due to the greater ductility of the material (due to the absence of Mg) than that of the AlMg6 alloy (Table 2).
Metallographic studies have shown that two zones with different structures form in AlMg6 after EW, as follows:
- –
- The first zone is directly adjacent to the AlMg6-AA1070 weld interface and has a thickness of 390–400 µm. This zone consists of predominantly unequal grains (length of 4–62 µm, width of 2–19 µm) elongated in the direction of the EW process and located between the ASBs.
- –
- The second zone is located at a distance of 400 µm from the weld interface, where the structure of AlMg6 is practically indistinguishable from that of the initial material. A similar result was obtained in [26] for the welding of magnesium alloys with aluminum A6005C.
- –
- After HT at temperatures of 450 and 500 °C, two zones are observed in the structure of AlMg6 (Figure 8b):
- –
- The first zone has a microstructure similar to that of the original AlMg6 alloy, with clear grain boundaries visible. The ASBs disappeared through diffusion processes during HT and α-solid solution grains were formed.
- –
- The second zone (diffusion zone) is located at the boundary between AlMg6 and AA1070 and is characterized by a lighter shade with implicit grain boundaries. The thickness of this zone is 40–50 µm at 450 °C and 60–70 µm at 500 °C. Notably, HT at 450 °C led to the formation of a large amount of Mg2Al3 due to the decomposition of the supersaturated α-solid solution (Figure 8b).
After HT at temperatures of 450 and 500 °C, in the regions of plastic deformation of AlMg6 (near the AlMg6-AA1070 weld interface), there was an elimination of the structural signs of the deformed state due to the primary recrystallization processes (Figure 8b,d), as evidenced by the formation of new equiaxed grains 40–60 µm in size and the disappearance of ASBs.
In the AlMg6-AA1070 interface, a decrease in the thickness of the aluminum layer was observed after HT, indicating the diffusion of Mg from the AlMg6 alloy into the AA1070 aluminum layer [40]. The thickness of the aluminum layer after HT at 450 and 500 °C decreased to 50 µm, whereas the thickness of the molten layer at the AA1070-VT1-0 weld interface did not change (Figure 8b,c). HT at 550 °C resulted in grain enlargement of AlMg6 of up to 50–70 µm (Figure 8d), with the largest grain growth occurring in the regions closest to the AlMg6-AA1070 interface. This may be due to the diffusion of Mg into the AA1070 layer, since the solubility of Mg in Al at this temperature is not less than 16.5% (at), which reduced the constraints on dislocation movements in the grains and at the grain boundary.
Due to the presence of many small, deformed grains at the AlMg6-AA1070 interface, a large interfacial area is formed, which increases the surface energy. As the size of the AlMg6 grains increases, the total extent of the boundaries decreases, and the deformed grain system enters a more balanced state. Thus, a conglomerate of large grains adjacent to small grains is formed as a result of secondary recrystallization.
A study of the weld interface between AA1070 and VT1-0 revealed that local melting of the weld surfaces resulted in melted zones that were up to 13 µm thick (Figure 8a). The microstructure of VT1-0 in the near of the weld interface consists of grains stretched unequally in the direction of the EW process, with the thickness of the zone of deformed grains reaching 10 µm (Figure 8e). The grains of titanium in the plastic deformation region were 1–10 µm wide by 2–17 µm long. Thus, there is no significant plastic deformation of titanium near the weld interface during EW, which is apparently due to the low hardness and density of AA1070. The structure of titanium did not change after HT (Figure 8f–h).
Figure 9 shows the microstructure of the AA1070-VT1-0 weld interface. EDS analysis revealed that the molten layer was mainly aluminum (Figure 9a and Table 5, point 3) and titanium was present as fragmented particles. The AA1070 layer showed an increase in Mg content (Figure 9a and Table 5, scan area 1 and 2), which may indicate the diffusion of Mg into aluminum from AlMg6 throughout the thickness of the layer after EW. In turn, the decrease in Mg content and grain aggregation in AlMg6 lead to partial weakening and hardening of the AA1070 layer due to the formation of an Al-Mg solid solution. At point 4 (Figure 9a and Table 5), the content of aluminum (45.84%) and titanium (53.85%) was determined, which corresponds to the intermetallic compound TiAl according to the Al-Ti phase diagram [41].
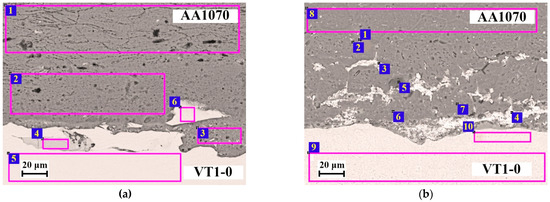
Figure 9.
Microstructure of the AA1070-VT1-0 weld interface: (a) after EW; (b) 550 °C.

Table 5.
EDS results for the AA1070-VT1-0 weld interface after EW (all results in atomic %).
A high copper content was found in the AA1070 structure (Figure 9b and Table 6), whereas copper was absent in the initial materials. The appearance of copper at the AA1070-VT1-0 weld interface is associated with the melting and dissolution of copper supports due to the effect of the high temperature of the shock-compressed gas in the gap [17] and the plastic deformation of the welded surfaces. The thickness of the copper diffusion layer increases as a function of HT temperature, particularly in the specimen after HT at 550 °C (Figure 9b and Table 6).

Table 6.
EDS results for the AA1070-VT1-0 weld interface after HT 550 °C (all results in atomic %).
3.2. Study of the Titanium VT1-0-08Cr18Ni10Ti Weld Interface
Figure 10 shows the microstructure of the VT1-0-08Cr18Ni10Ti weld interface. The weld interface between VT1-0 and 08Cr18Ni10Ti has a wave shape with an amplitude of 24 µm and a length of 225 µm (Figure 10a). The formation of vortex zones and melted zones at the peaks of the waves was observed at the weld interface. The average thickness of the melted zone was 2.1 µm. The formation of molten areas indicates that the temperature in these areas exceeded the melting point of the welded materials.
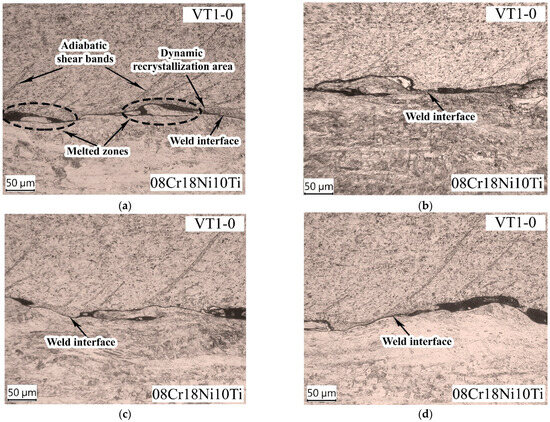
Figure 10.
Microstructure of the VT1-0-08Cr18Ni10Ti weld interface: (a) after EW; (b) 450 °C; (c) 500 °C; (d) 550 °C.
In titanium, dynamic recrystallization regions of up to 10 µm thick (Figure 10a) surrounding the molted zones are present at the weld interface after EW. According to the authors of [32], the recrystallization of the deformed metal occurs under the influence of heat from the molten metal. Given the rapid duration of the EW process and the relatively low thermal conductivity of titanium, it can be assumed that a significant part of the recrystallization process has already developed after EW during the cooling of the material. Furthermore, due to titanium’s low thermal conductivity and high sensitivity to rapid deformation processes, the ASBs formed near the weld interface (Figure 10). They arose at the weld interface and spread into the titanium at an angle of 45° to a depth of 200 µm. The localization of plastic deformation can lead to crack initiation and development in the material, but no crack formation along the ASBs was detected during EW under the mode selected in this work.
The deformation zone in stainless steel is characterized by the presence of deformed (elongated) grains adjacent to the weld interface. The thickness of the zone was approximately 350 µm. No structural changes occurred in 08Cr18Ni10Ti steel and titanium VT1-0 after HT (Figure 10b–d).
The EDS analysis revealed that the main elements of the melted zones are Ti, Cr, Fe, and Ni (Figure 11a and Table 7, points 3 and 5). The chemical composition of the melted zones did not change after HT, indicating that there was no diffusion between the components at the HT temperature (Figure 11b and Table 8, points 1–3). Analysis of melted zones in various studies shows that the primary elements present are actually Ti, Cr, Fe, and Ni. In the context of the electron beam melting of γ-TiAl alloys, significant diffusion of Fe, Cr and Ni was observed, particularly at the interfaces with stainless steel platforms, resulting in the formation of hard IMCs [42]. Similarly, when laser welding Ti-6Al-4V with stainless steel, the morphology and elemental distribution of the melted zones were influenced by the mixture of titanium and stainless steel, which also contained these elements [43]. Furthermore, the diffusion of Fe, Cr and Ni was found in the fusion-bonded joints of Fe3Al/Cr–Ni alloys, confirming their presence in the melted zones [44].
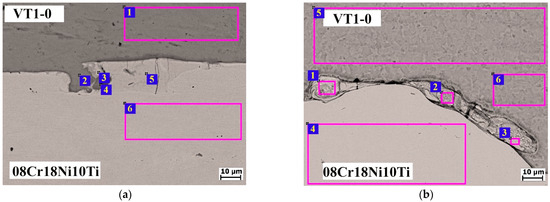
Figure 11.
SEM image of the 08Cr18Ni10Ti–AlMg6 weld interface: (a) after EW; (b) after HT (550 °C).

Table 7.
EDS results for the VT1-0-08Cr18Ni10Ti weld interface after EW (all results in atomic %).

Table 8.
EDS results for the VT1-0-08Cr18Ni10Ti weld interface after HT 550 °C (all results in atomic %).
Figure 12 shows the microhardness distribution along the thickness of the MCM after EW and HT. The microhardness values of the initial materials are shown in Table 2. After EW, the microhardness of the AA1070 layer, which is close to the VT1-0 layer, was 90 HV. Compared with the initial values, the microhardness values of AlMg6, VT1-0 and 08Cr18Ni10Ti increased by approximately 12% (Table 2). The increase in microhardness of the welded surfaces was attributed to the plastic deformation (work hardening) during EW. HT at 450 °C resulted in a decrease in the microhardness of AA1070 and AlMg6, which was related to the recrystallization (Figure 8b). The microhardnesses of VT1-0 and 08Cr18Ni10Ti after HT in the maximum hardening zones were 400 HV (~11% decrease) and 520 HV (~5% decrease), respectively (Figure 12).
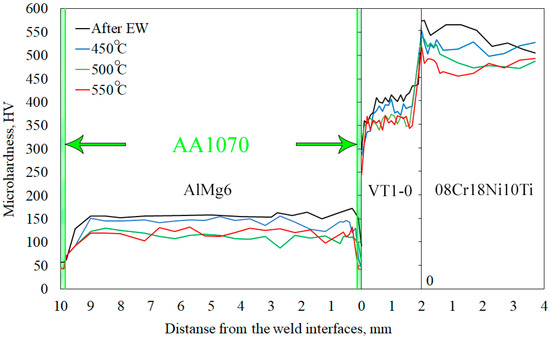
Figure 12.
Microhardness distribution in the AlMg6-AA1070-VT1-0-08Cr18Ni10Ti.
The microhardness of AA1070 and AlMg6 after HT at 550 °C corresponds to the microhardness after HT at 500 °C. This indicates the removal of work hardening in AA1070 and AlMg6 after EW and HT at a temperature of 500 °C. An increase in temperature does not lead to a noticeable change in the mechanical properties of the materials.
The results of mechanical tests showed that the average joint strength of the composite material after EW was 130 ± 10 MPa (Figure 13), which is almost a factor of two higher than the strength of the initial AA1070 layer. The failure of the specimens occurred along the AA1070-VT1-0 weld interface. The fracture surface was brittle for all specimens.
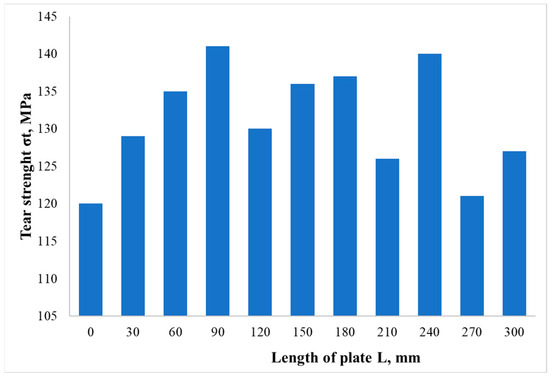
Figure 13.
The tear strength value distribution along the bimetal plate.
4. Conclusions
An explosive welding procedure was developed to produce the multilayer composite material AA1070-AlMg6-AA1070-Titanium (VT1-0)-08Cr18Ni10Ti steel. Metallographic examination showed that the weld interface between AA1070 and titanium VT1-0 has a straight profile and the weld interface between titanium VT1-0 and 08Cr18Ni10Ti steel has a wavy profile. The AlMg6 layer exhibits both a deformed microstructure along the explosive welding direction with a thickness of up to 390 µm and an undeformed microstructure located 400 µm from the AlMg6-AA1070 weld interface. In the AA1070 layer, the increase in Mg content is due to the diffusion of Mg from AlMg6 over the entire layer thickness. The decrease in Mg content and grain enlargement in AlMg6 lead to softening of the AlMg6 layer. The optimum temperature for heat treatment is 450–500 °C. This heat treatment mode allows for recrystallization of the deformed structure without significant grain growth and the elimination of adiabatic shear bands that form in AlMg6 at the weld interface. The brittle fracture surfaces observed in all tear strength specimens suggest that further investigations into the material behavior loading are required. These results provide valuable insights into the performance of explosive welded composite materials and pave the way for future research aimed at understanding and optimizing the durability and reliability of such materials in practical applications.
Author Contributions
Conceptualization, A.M. and I.D.; methodology, N.N.; software, I.D.; validation, I.S., D.S. and E.V.; formal analysis, I.D. and I.S.; investigation, D.S.; resources, A.M.; data curation, I.S.; writing—original draft preparation, N.N., I.D. and A.M.; writing—review and editing, A.M.; visualization, E.V.; supervision, I.D.; project administration, A.M.; funding acquisition, D.S. All authors have read and agreed to the published version of the manuscript.
Funding
This research was funded by the Russian Science Foundation (RSF) No. 23-19-00446. (https://rscf.ru/project/23-19-00446/, accessed on 22 August 2024).
Data Availability Statement
Data are contained within the article.
Conflicts of Interest
The authors declare no conflicts of interest.
References
- Wahid, M.A.; Siddiquee, A.N.; Khan, Z.A. Aluminum alloys in marine construction: Characteristics, application, and problems from a fabrication viewpoint. Mar. Syst. Ocean Technol. 2020, 15, 70–80. [Google Scholar] [CrossRef]
- Senkov, O.N.; Bhat, R.B.; Senkova, S.V.; Miracle, D.B.; Firstov, S.A. High Strength Aluminum Alloys for Cryogenic Applications. In Metallic Materials with High Structural Efficiency; Senkov, O.N., Miracle, D.B., Firstov, S.A., Eds.; NATO Science Series II: Mathematics, Physics and Chemistry; Springer: Dordrecht, The Netherlands, 2004; Volume 146, pp. 151–162. [Google Scholar] [CrossRef]
- Matteis, P.; Gullino, A.; D’Aiuto, F.; Puro, C.M.; Scavino, G. Welding between Aluminum Alloy and Steel Sheets by Using Transition Joints. J. Mater. Eng. Perform. 2020, 29, 4840–4853. [Google Scholar] [CrossRef]
- Yang, Y.; Paidar, M.; Mehrez, S.; Ojo, O. Enhancement of mechanical properties and wear of AA5083/316 stainless steel surface-composite developed through multi-pass friction stir processing (MPFSP). Archiv. Civ. Mech. Eng. 2023, 23, 13. [Google Scholar] [CrossRef]
- Aghajani, D.H.; Eyvazian, A.; Simchi, A. Submerged friction stir welding of dissimilar joints between an Al-Mg alloy and low carbon steel: Thermo-mechanical modeling, microstructural features, and mechanical properties. J. Manuf. Process. 2020, 50, 68–79. [Google Scholar] [CrossRef]
- Sahu, M.; Ganguly, S. Distribution of intermetallic compounds in dissimilar joint interface of AA 5083 and HSLA steel welded by FSW technique. Intermetallics 2022, 151, 107734. [Google Scholar] [CrossRef]
- Shi, H.X.; Qiu, R.F.; Tu, Y.M.; Yu, H.; Yin, D.Q. Study on the Joining Characteristics of Diffusion Welding Lap Joint with Various Temperatures between Aluminum Alloy and Stainless Steel. J. Adv. Mater. Res. 2011, 291–294, 1003–1006. [Google Scholar] [CrossRef]
- Khalil, C.; Marya, S.; Racineux, G. Construction of physical welding windows for magnetic pulse welding of 5754 aluminum with DC04 steel. Int. J. Mater. Form. 2021, 14, 843–854. [Google Scholar] [CrossRef]
- Vincze, G.; Simões, F.J.; Butuc, M.C. Asymmetrical Rolling of Aluminum Alloys and Steels: A Review. Metals 2020, 10, 1126. [Google Scholar] [CrossRef]
- Chen, K.; Liu, W.; Wang, T.; Wang, N.; Chen, Z. Experimental research on the technology of two-pass different temperature rolling for thick steel/aluminum/aluminum-alloy composite plate. Int. J. Adv. Manuf. Technol. 2022, 120, 7689–7705. [Google Scholar] [CrossRef]
- Saravanan, S.; Raghukandan, K. Microstructure, strength and welding window of aluminum alloy-stainless steel explosive cladding with different interlayers. Trans. Nonferrous Met. Soc. China 2022, 32, 91–103. [Google Scholar] [CrossRef]
- Han, J.H.; Ahn, J.P.; Shin, M.C. Effect of interlayer thickness on shear deformation behavior of AA5083 aluminum alloy/SS41 steel plates manufactured by explosive welding. J. Mater. Sci. 2003, 38, 13–18. [Google Scholar] [CrossRef]
- Pervukhin, L.B.; Pervukhina, O.L. Interaction of impact-compressed gas in the welding gap with the welded surfaces in explosive welding. Weld. Int. 2017, 31, 457–461. [Google Scholar] [CrossRef]
- Chen, X.; Inao, D.; Tanaka, S.; Mori, A.; Li, X.; Hokamoto, K. Explosive welding of Al alloys and high strength duplex stainless steel by controlling energetic conditions. J. Manuf. Process. 2020, 58, 1318–1333. [Google Scholar] [CrossRef]
- Li, X.; Ma, H.; Shen, Z. Research on explosive welding of aluminum alloy to steel with dovetail grooves. Mater. Des. 2015, 87, 815–824. [Google Scholar] [CrossRef]
- Elango, E.; Saravanan, S.; Raghukandan, K. Experimental and numerical studies on aluminum-stainless steel explosive cladding. J. Cent. South Univ. 2020, 27, 1742–1753. [Google Scholar] [CrossRef]
- Malakhov, A.; Denisov, I.; Niyozbekov, N.; Saikov, I.; Shakhray, D.; Sosikov, V.; Emelyanov, A. Theoretical and Experimental Studies of the Shock-Compressed Gas Parameters in the Welding Gap. Materials 2024, 17, 265. [Google Scholar] [CrossRef]
- Miao, Y.; Chen, X.; Wang, H. Some applications of interlayer explosive welding. Compos. Interfaces 2021, 29, 345–360. [Google Scholar] [CrossRef]
- Aceves, S.M.; Espinosa, L.F.; Elmer, J.W.; Huber, R. Comparison of Cu, Ti and Ta interlayer explosively fabricated aluminum to stainless steel transition joints for cryogenic pressurized hydrogen storage. Int. J. Hydrogen Energy 2015, 40, 1490–1503. [Google Scholar] [CrossRef]
- Kuz’min, V.I.; Lysak, V.I.; Kuz’min, S.V.; Kuz’min, E.V. Formation characteristics and properties of an explosion-welded steel–aluminum composite with a diffusion barrier. Compos. Interfaces 2023, 31, 215–238. [Google Scholar] [CrossRef]
- Arisova, V.N.; Gurevich, L.M.; Kharlamov, V.O.; Tverdysheva, D.D.; Izyumsky, V.A. Formation of a multi-layered titano-steel intermetallic composite. Izv. Volgogr. State Tech. Univ. 2020, 6, 6–14. [Google Scholar] [CrossRef]
- Lazurenko, D.V.; Bataev, I.A.; Mali, V.I.; Bataev, A.A.; Maliutina, I.N.; Lozhkin, V.S.; Esikov, M.A.; Jorge, A.M.J. Explosively welded multilayer Ti-Al composites: Structure and transformation during heat treatment. Mater. Des. 2016, 102, 122–130. [Google Scholar] [CrossRef]
- Pervukhin, L.B.; Kryukov, D.B.; Krivenkov, A.O.; Chugunov, S.N. Structural transformations and properties of titanium–aluminum composite during heat treatment. Phys. Met. Metallogr. 2017, 118, 759–763. [Google Scholar] [CrossRef]
- Hwang, I.H.; Watanabe, T.; Doi, Y. Dissimilar Metal Welding of Steel to Al-Mg Alloy by Spot Resistance Welding. Open J. Adv. Mater. Res. 2007, 15, 381–386. [Google Scholar] [CrossRef]
- Shirzadi, A.A.; Zhang, C.; Mughal, M.Z.; Xia, P. Challenges and Latest Developments in Diffusion Bonding of High-Magnesium Aluminium Alloy (Al-5056/Al-5A06) to Stainless Steels. Metals 2022, 12, 1193. [Google Scholar] [CrossRef]
- Lim, S.-S.; Hong, J.-P.; Kim, M.; Park, Y.-C.; Lee, S.-M.; Cho, D.-Y.; Cho, C.-H. Study on Rolling Defects of Al-Mg Alloys with High Mg Content in Normal Rolling and Cross-Rolling Processes. Materials 2023, 16, 6260. [Google Scholar] [CrossRef]
- Ruifeng, Z.; Matthew, S.; Agnew, S.R.; Shravan, K.; Davies, C.; Nick, B. Experiment-based modelling of grain boundary β-phase (Mg2Al3) evolution during sensitisation of aluminium alloy AA5083. Sci. Rep. 2017, 7, 2961. [Google Scholar] [CrossRef]
- Saikov, I.V.; Malakhov, A.Y.; Saikova, G.R.; Denisov, I.V.; Gulyaev, P.Y. Influence of Explosive Welding Parameters on the Structure of Interface in Brass–Invar Thermobimetal. Inorg. Mater. Appl. Res. 2020, 11, 448–452. [Google Scholar] [CrossRef]
- Luo, J.; Liu, Y.; Yang, R.; Li, S.; Chen, Y.; Ran, P.; Zhou, T. Effect of Heat Treatment Temperatures on Microstructure and Mechanical Properties of Continuous Casting and Rolling Al-Mg Alloy. Solid. State Phenom. 2022, 331, 91–95. [Google Scholar] [CrossRef]
- Çadırlı, E.; Kaya, H.; Büyük, U.; Üstün, E.; Gündüz, M. Effect of Heat Treatment on the Microstructures and Mechanical Properties of Al–4Cu–1.5Mg Alloy. Int. J. Met. 2022, 16, 1020–1033. [Google Scholar] [CrossRef]
- Sokovikov, M.; Uvarov, S.; Simonov, M.; Chudinov, V.; Naimark, O. Metastability, adiabatic shear bands initiation and plastic strain localization in the AMg6 alloy under dynamic loading. Frat. Ed Integrità Strutt. 2024, 18, 255–266. [Google Scholar] [CrossRef]
- Mihara-Narita, M.; Asai, K.; Sato, H.; Watanabe, Y.; Mori, H.; Saito, N.; Chin, Y. Interfacial Microstructure and Mechan-ical Proper-ties of Explosively Welded Mg/Al Alloy Plates. J. Mater. Eng. Perform. 2022, 31, 7039–7048. [Google Scholar] [CrossRef]
- Guo, W.; Zhou, L.; Mao, P.; Wang, Z.; Wang, F.; Wei, Z. Effect of strain on the adiabatic shear behaviour of AZ31 magnesium alloy. Mater. Sci. Technol. 2024, 02670836241255852. [Google Scholar] [CrossRef]
- Zeng, Q.; Chen, M.; Yu, X.; Qi, W.; Zhu, S.; Yang, H.; Chen, H.-S. Two-dimensional evolution of temperature and deformation fields during dynamic shear banding: In-situ experiments and modeling. Int. J. Plast. 2023, 171, 103782. [Google Scholar] [CrossRef]
- Zhang, W.; He, L.; Lu, Z.; Kennedy, G.B.; Thadhani, N.N.; Li, P. Microstructural characteristics and formation mechanism of adiabatic shear bands in Al–Zn–Mg–Cu alloy under dynamic shear loading. Mater. Sci. Eng. A 2020, 791, 139430. [Google Scholar] [CrossRef]
- Wu, X.; Li, L.; Liu, W.; Li, S.; Zhang, L.; He, H. Development of adiabatic shearing bands in 7003-T4 aluminum alloy under high strain rate impacting. Mater. Sci. Eng. A 2018, 732, 91–98. [Google Scholar] [CrossRef]
- Wang, P.; Wei, Z.; Mao, P.; Zhou, L.; Wang, Z.; Wang, F.; Liu, X.; Liu, Z. Investigation of active slip modes via in-grain misorientation axis and strain compatibility of TA2 alloy during in-situ tensile deformation. J. Alloys Compd. 2024, 984, 173970. [Google Scholar] [CrossRef]
- Mikhaylovskaya, A.V.; Yakovtseva, O.A.; Irzhak, A.V. The role of grain boundary sliding and intragranular deformation mechanisms for a steady stage of superplastic flow for Al–Mg-based alloys. Mater. Sci. Eng. A 2022, 833, 142524. [Google Scholar] [CrossRef]
- Shveykin, A.; Trusov, P.; Sharifullina, E. Statistical Crystal Plasticity Model Advanced for Grain Boundary Sliding Description. Crystals 2020, 10, 822. [Google Scholar] [CrossRef]
- Ghosh, P.S.; Sen, A.; Chattopadhyaya, S.; Sharma, S.; Jujhar, S.; Li, C.; Królczyk, G.; Rajkumar, S. Progressive developments and challenges in dissimilar laser welding of steel to various other light alloys (Al/Ti/Mg): A comprehensive review. Heliyon 2022, 8, e11710. [Google Scholar] [CrossRef]
- Fronczek, D.M.; Wojewoda-Budka, J.; Chulist, R.; Sypien, A.; Korneva, A.; Szulc, Z.; Schell, N.; Zieba, P. Structural properties of Ti/Al clads manufactured by explosive welding and annealing. Mater. Des. 2016, 91, 80–89. [Google Scholar] [CrossRef]
- Kenevisi, M.S.; Ghibaudo, C.; Bassini, E.; Ugues, D.; Marchese, G.; Biamino, S. Iron Diffusion in Electron Beam Melt (EBM) γ-TiAl Based Alloy from the Building Platform: Interface Characterization. Metals 2023, 13, 772. [Google Scholar] [CrossRef]
- Mitelea, I.; Groza, C.; Craciunescu, C.M. Pulsed Laser Processing of Dissimilar Ti-6Al-4V and X5CrNi18-10 Joints. Mater. Manuf. Processes. 2014, 29, 975–979. [Google Scholar] [CrossRef]
- Ma, H.; Li, Y.; Li, J.; Wang, J. Division of character zones and elements distribution of Fe3Al/Cr–Ni alloy fusion bonded joint. Mater. Sci. Technol. 2007, 23, 799–802. [Google Scholar] [CrossRef]
Disclaimer/Publisher’s Note: The statements, opinions and data contained in all publications are solely those of the individual author(s) and contributor(s) and not of MDPI and/or the editor(s). MDPI and/or the editor(s) disclaim responsibility for any injury to people or property resulting from any ideas, methods, instructions or products referred to in the content. |
© 2024 by the authors. Licensee MDPI, Basel, Switzerland. This article is an open access article distributed under the terms and conditions of the Creative Commons Attribution (CC BY) license (https://creativecommons.org/licenses/by/4.0/).