1. Introduction
With the increasing number of regulations addressing global warming, environmental pollution, and climate change, there is a prevailing inclination to reduce carbon emissions within energy-intensive industries. This shift aims to foster sustainable production practices. The crux of sustainability in engineering manufacturing lies in mitigating environmental impacts through a comprehensive set of measures. These measures focus on optimizing resource utilization, minimizing waste and emissions, and reducing energy consumption. The fundamental goal is to create manufacturing processes that are not only economically viable but also environmentally friendly [
1].
The aerospace and nuclear industries heavily rely on advanced materials, particularly nickel-based superalloys chosen for their distinctive properties. These alloys play a pivotal role in fostering continuous innovation within these industries, primarily due to their exceptional performance in elevated-temperature applications. Their commendable properties, such as high creep and corrosion resistance coupled with impressive strength values, provide a competitive edge. Among these alloys, Monel 400 has emerged as a recognized material, finding applications in aerospace, medical instruments, and prosthetic components, owing to its outstanding thermophysical properties at elevated temperatures. Despite its structural stability, which contributes to its low thermal conductivity, the heat generated when the tool comes into contact with the workpiece can lead to the tool sustaining cutting-edge wear. It is therefore argued that these properties are associated with impaired machinability and a more complicated machining process [
1,
2].
Conventional machining methods, such as milling, are less effective when applied to advanced materials. Hence, a closer examination of progressive machining methods and cutting-edge tooling materials becomes imperative. Utilizing these innovative approaches holds the potential to optimize and streamline the machining process for these advanced materials [
3,
4,
5].
Continuous advances in advanced materials, often characterized by challenging machinability properties, serve as the primary driver for technological advancements. Additionally, economic considerations and the escalating costs of energy underscore the need to optimize cutting conditions. This optimization is crucial for sustaining quality while concurrently enhancing productivity. One such optimization strategy involves the utilization of high-feed milling, recognized as a high-productivity machining method [
6,
7,
8].
The first person to define HSM (high-speed machining) was Carl Salomon in 1931 [
9,
10,
11]. In fact, there are numerous ways of defining HSM, on the basis of which it is possible to talk about HSM:
High-cutting-speed machining (vc)
High-frequency machining (n)
High-feed machining (vf)
High-speed-and-feed machining
High-productivity machining [
9,
12,
13]
Practically, it can be stated that HSM is not simply about high cutting speed. It can also be considered as a process in which operations are carried out by very specific methods and manufacturing procedures, using special machine tools. Previous research has shown the positive effect of increasing the feed rate and, therefore, our focus shifts to HFM as a distinctive method within the realm of HSM [
14,
15,
16,
17].
High feed milling (HFM) is a machining method characterized by high feed rates (f
z—feed per tooth) while concurrently maintaining a shallow depth of cut. This approach has the potential to substantially reduce machining time by up to three times when compared to conventional methods. Notably, a feed rate f
z of up to 4 mm corresponds to a maximum depth of cut of 2 mm [
18,
19,
20]. Considered as one of the rough milling operations, HFM places a primary emphasis on tool life for ensuring a successful machining process [
21,
22,
23,
24]. The performance of cutting tools assumes a key role across various machining industries, exerting a significant influence on production costs, product quality, and overall cutting tool life [
25,
26,
27,
28].
In employing this method, the extension of tool life is achievable through a synergistic approach involving the reduction of the depth of cut and an increase in the feed rate. It is also possible to improve the quality of the machined surface by eliminating vibrations. Therefore, this method, generally classified as a roughing operation, can also be used to produce parts with high surface quality [
29,
30,
31,
32].
The advantages of HFM include the following:
No high spindle speed requirements;
Axial direction of cutting forces acting on the spindle;
Reduction in vibrations;
Better tool life and more stable cut;
Potential to achieve feed rates up to ten times higher, compared to conventional machining methods;
Creation of clear shapes that do not require extensive post-processing.
On the contrary, the disadvantages of this method include the following:
Incompatibility with older machines;
Increased risk of vibration;
Elevated noise levels during the cutting process;
Invariant clamping of the workpiece [
33,
34,
35].
Hui Sun et al. [
36] conducted a study investigating the impact of tooth feed on cutting forces in the machining of the titanium alloy Ti5Al5Mo5VCrFe. Their research revealed an increase in cutting forces with a rise in feed per tooth. Moreover, the authors performed calculations to determine the cutting power based on the measured cutting forces. This calculated value was then compared with the actual output power of the machine tool, resulting in the development of a model capable of simulating cutting power during machining. In a related study [
37], researchers compared various methods for residual stress analysis following high-feed milling. They employed electrochemical polishing as a technique to examine residual stresses, providing insights into their nature at different material depths. This method enables the acquisition of information confirming or refuting the presence of residual stresses across the entire cross-section, from the surface to the depth of the specimen under investigation.
In previous research conducted by Sajgalik et al., the machining of Monel nickel alloy using ceramic milling cutters was explored [
38]. The findings indicated that these cutters can be effectively employed, enabling higher cutting speeds compared to conventional milling methods. Monel alloy, renowned for its robust corrosion resistance, high hardness, and ability to retain strength at elevated temperatures, finds applications in the marine, aerospace, and power generation industries [
39]. Despite these favorable properties, its machinability is hampered by rapid tool wear, resulting in low dimensional accuracy. Further investigations into the machining of Monel 400 alloy were undertaken by Dhananchezian and others. Their study delved into cutting forces, cutting temperature, coating quality parameters, and chip morphology during turning, utilizing tungsten carbide cutting inserts (both uncoated and TiAlN coated) [
25]. Exploring the impact of cooling in high-efficiency machining (HEM), researchers [
40] determined that the combination of cryogenic carbon dioxide (CO
2) and minimum quantity lubrication (MQL) represents the most effective cooling technique. This combination reduces friction and yields superior surface quality compared to dry conditions and MQL or CO
2 alone. Vibration, a factor influencing tool and spindle life during machining, was investigated by researchers from Tamil Nadu [
41]. Their study analyzed the effects of spindle speed (n), feed rate (mm/rev), and depth of cut (a
p) on tool wear and vibration during Monel alloy machining. Additionally, they conducted an economic and environmental sustainability analysis, concluding that high-speed dry milling serves as an environmentally friendly final manufacturing process, enhancing machining efficiency while reducing environmental impacts [
42].
2. Materials and Methods
The material chosen for the current study is Monel 400, selected for its favorable mechanical properties which render it suitable for the intended experimental measurements. Monel 400 is characterised by its high corrosion and acid resistance, its low coefficient of thermal expansion, and its weldability and solderability. This versatile material finds applications across various industries, including marine engineering, chemical equipment, metal tools, and eyeglass frames.
Table 1 provides the chemical composition of Monel for reference.
The material was selected based on previous experiments in the milling of difficult-to-machine materials.
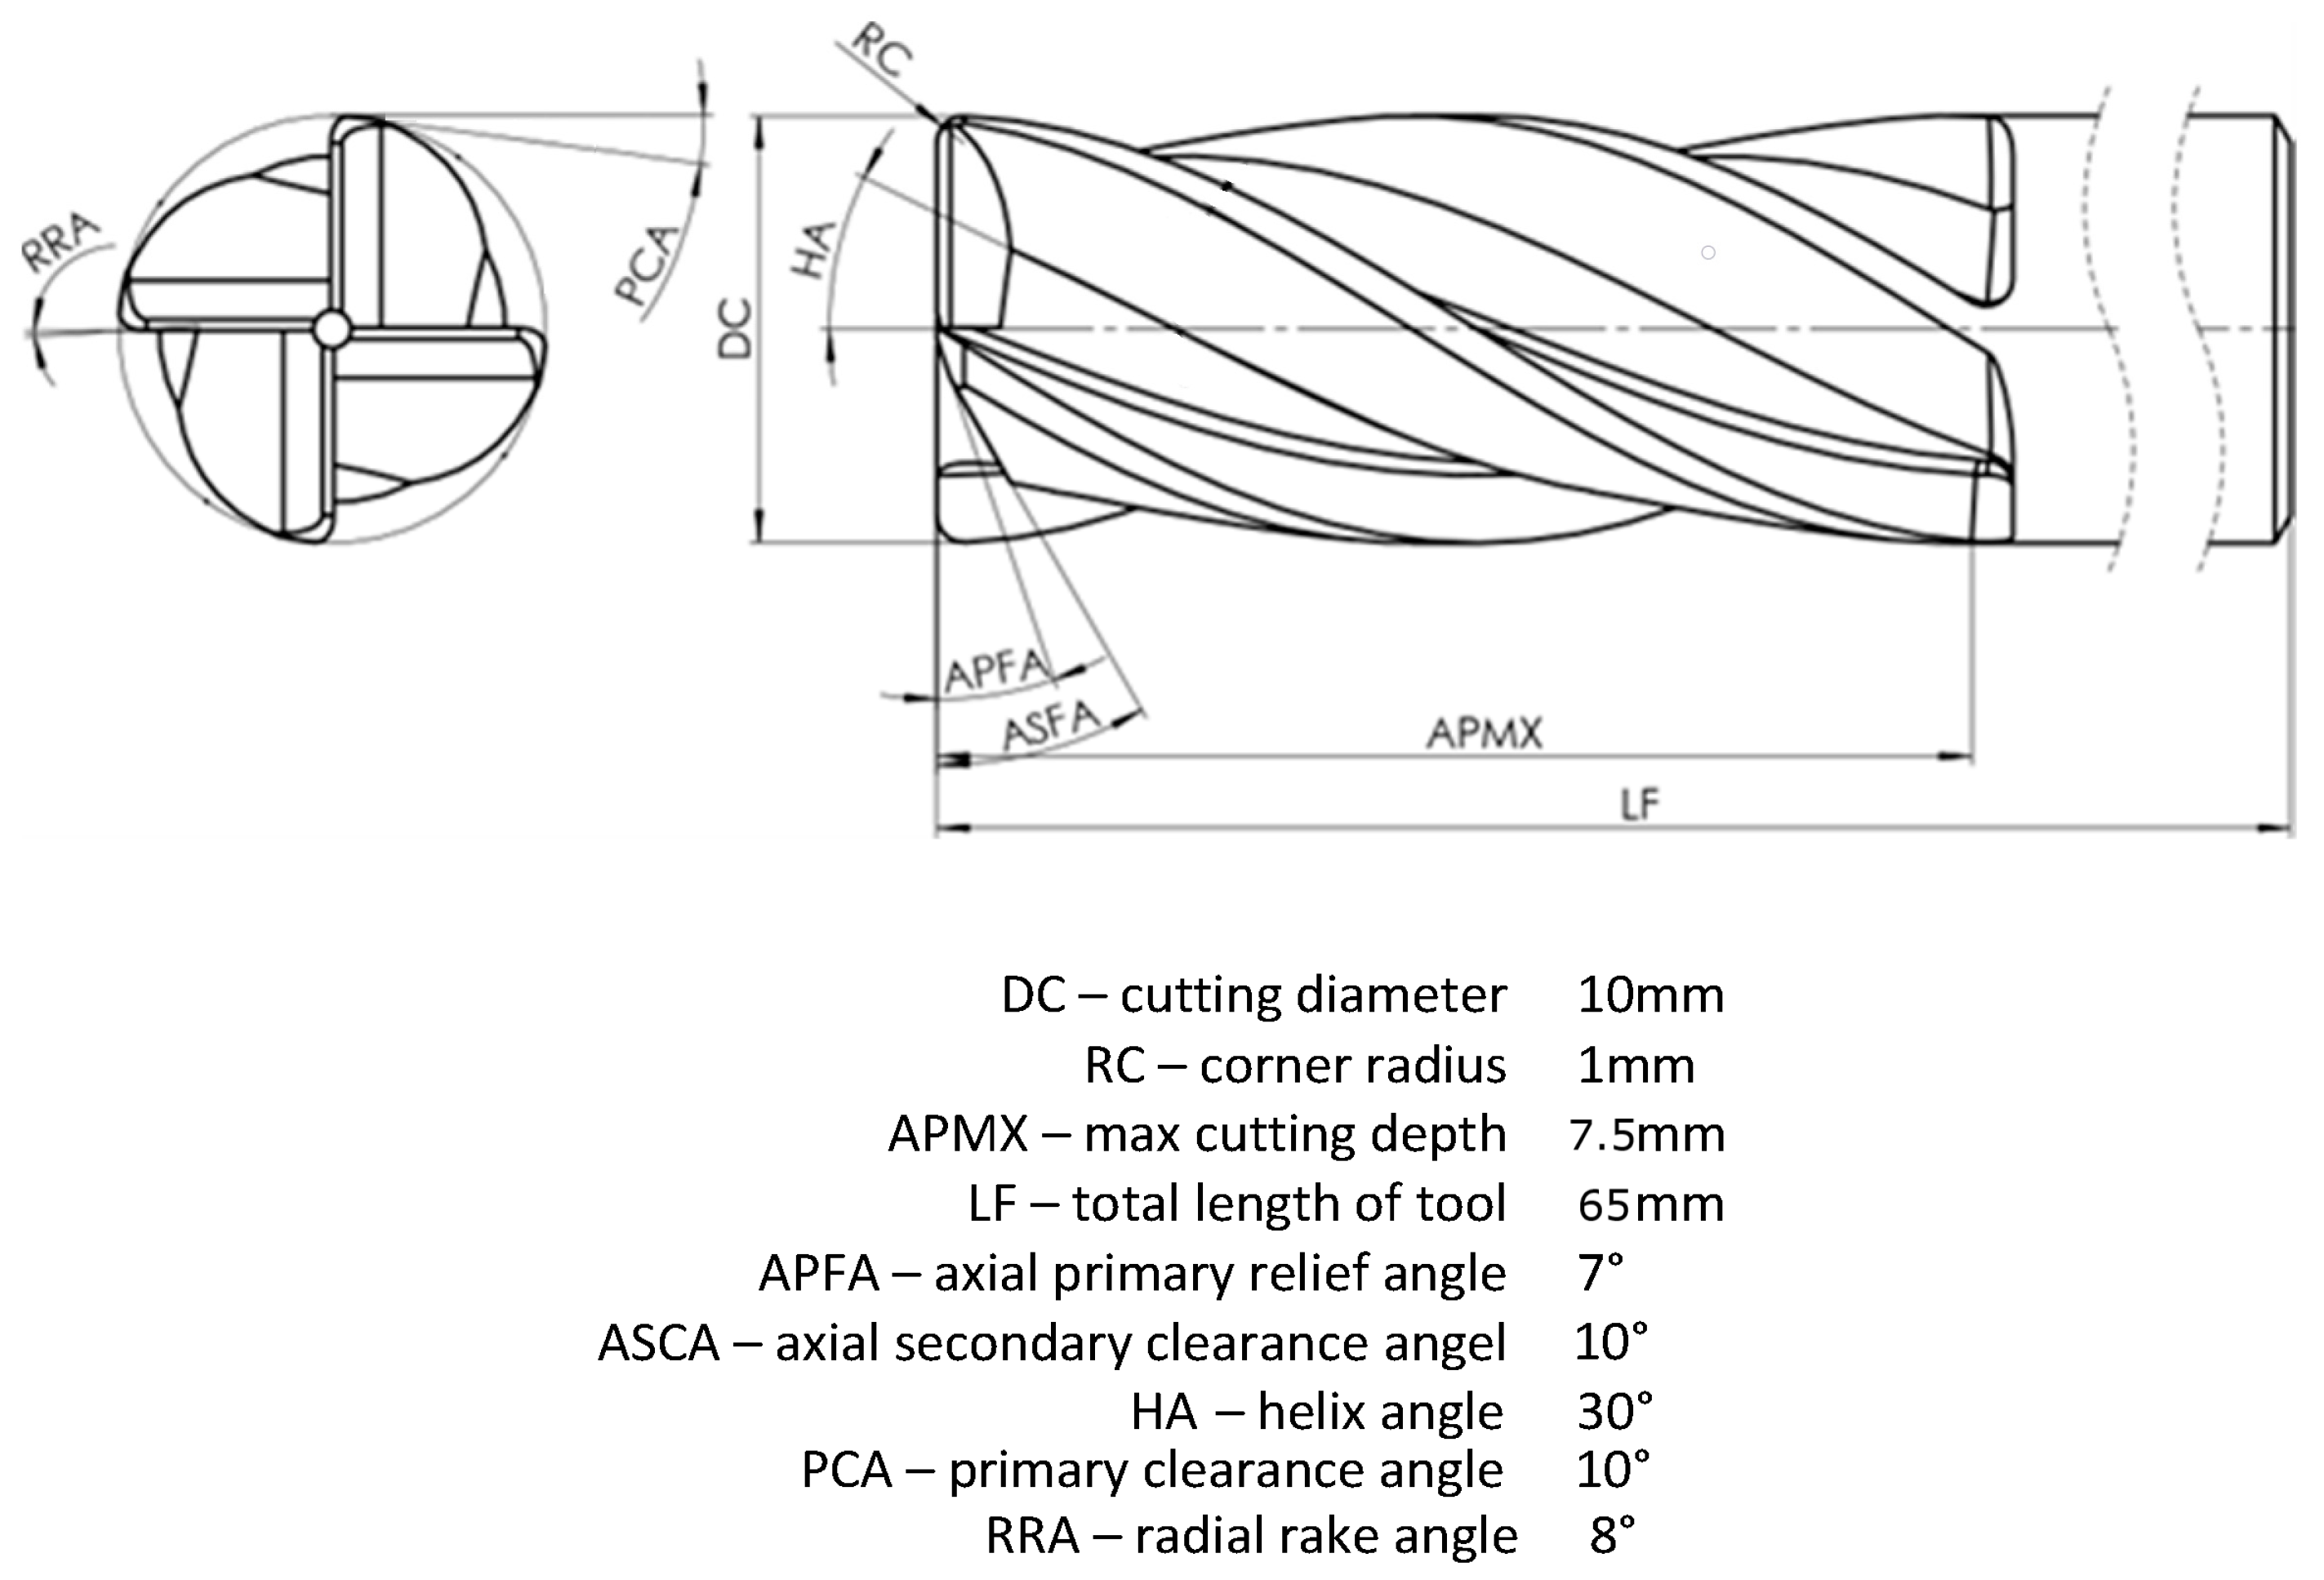
For machining, a monolithic ceramic milling cutter CE4SRBD1000R100 ( Mitsubishi Materials Corporation, Tokyo 100-8117, Japan) with 10 mm diameter, 65 mm length, and 4 cutting edges was chosen. The geometry of the cutting edge was as follows in an axial direction: relief angle 7° and axial clearance angle 10°. In the radial direction it was as follows: clearance angle 10° and rake angle 8°. The choice of this tool (see
Figure 1) was driven by its properties, such as high heat resistance, which make it suitable for machining difficult-to-machine materials.
The tool material is based on α-/β-SiAlON ceramic. Its mechanical properties (see table) make it suitable for machining applications (turning, milling, drilling). α-/β-SiAlON is characterized by gradient properties that combine exceptional hardness and an extremely wear-resistant surface with a very tough core.
2.1. Machining Centre HSC 105 Linear
The experiments were conducted on the HSC 105 linear envelope center, and the cutting parameters employed are detailed in
Table 2. Each pre-pass of the tool involved the alteration of three parameters—lead-in angle, depth of cut, and width of cut—followed by comprehensive evaluations. Cutting parameters were determined on the basis of the manufacturer’s recommendations, machine parameters, and the DoE principles of central composite design. Climb milling (or down cut) was also chosen as suitable.
The following cutting parameters remained constant throughout all experiments:
Cutting speed vc = 600 mm·min−1;
Feed per tooth fz = 0.04 mm;
Spindle speed n = 19,098 rpm;
Feed rate vf = 4560 mm·min−1.·
2.2. Design of Experiment
The design of the experiments was based on DoE (design of experiments) principles. A center-low composite design with three levels of adjustment (lowest, middle, and highest) was selected as a potentially suitable model for the study. The central composite plan included lead-in angle, depth of cut, and width of cut. After performing the experiments and sub-analyses of the measured results, the obtained data underwent statistical analysis.
2.3. Evaluation of Cutting Forces
The machining force components can be measured by indirect methods. For example, it is possible to start from the power of the machine’s electric motor or the torque of the force with respect to the axis of rotation [
44,
45]. In our research, the evaluation of cutting forces employed direct measurement methods, specifically utilizing a Kistler 9257B three-component dynamometer(Kistler GmbH, Wien, Austria). The gained data were analyzed using MATLAB and Simulink software (MATLAB 2022b), and further compared with the primary profile utilizing Alicona InfiniteFocus (Alicona Imag-ing GmbH Dr., Raaba, Austria). The measured resultant values were output in the X, Y, Z coordinate system, which was the machine coordinate instrument.
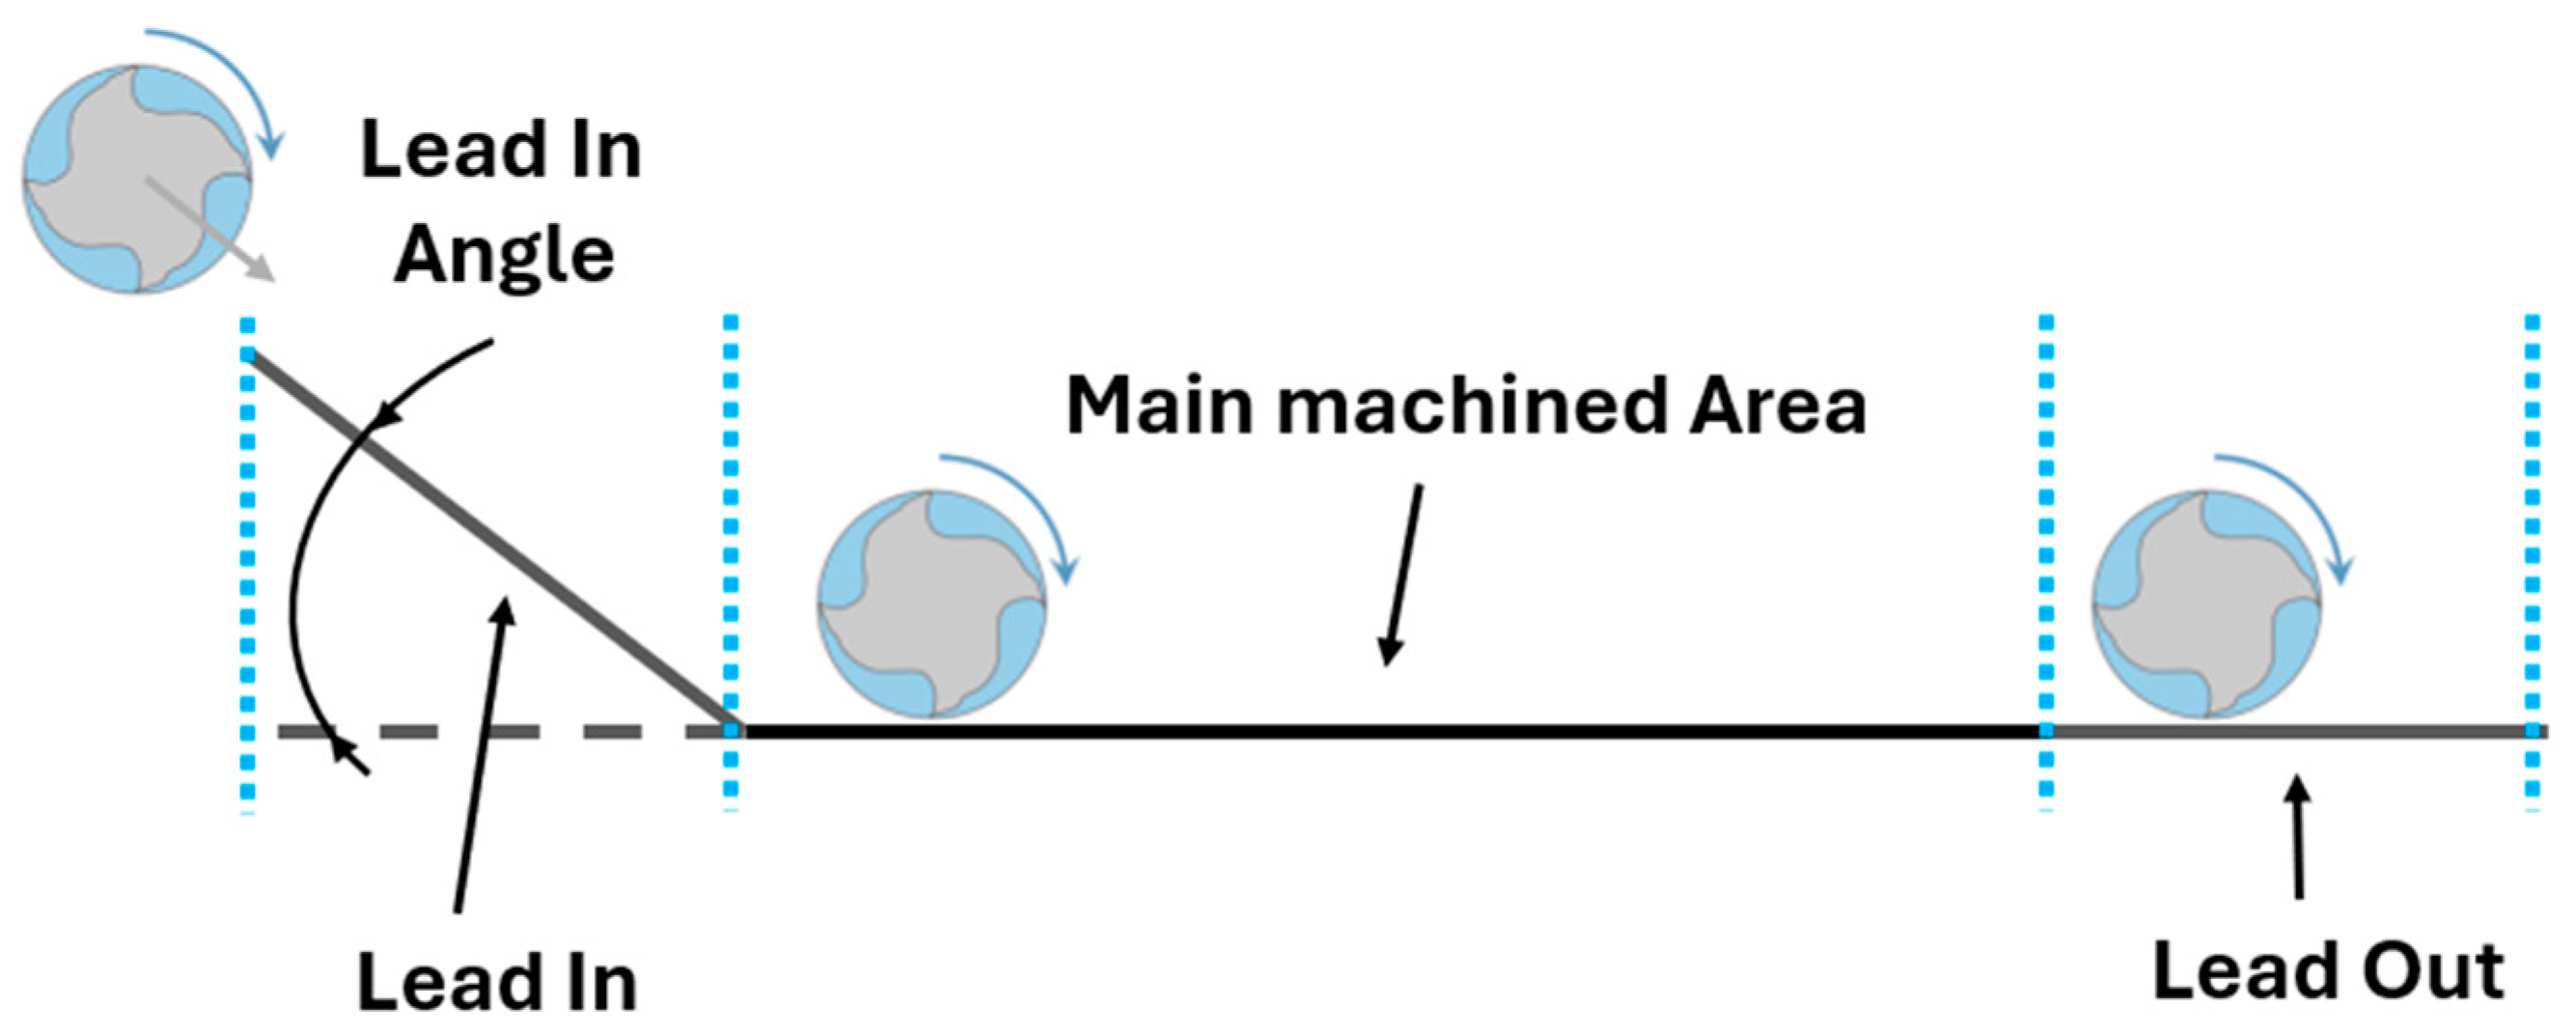
Based on the tool manufacturer’s recommendations, the lead-in angle has been defined as one of the parameters that can influence the process. As presented in
Figure 2, the experimental tool path consisted of three parts, defined in the paper as lead in, main machined area, and lead out.
In the evaluation of the cutting force components, three distinct areas were analyzed:
Lead in: this refers to the area where the tool initially makes contact with the workpiece material.
Main machined area: this area denotes the segment where the tool smoothly machines the surface, and where observations regarding tool life or wear are continuously made.
Lead out: this refers to the area where the tool exits the workpiece material and where the forces gradually decrease to zero.
2.4. Surface Roughness Measurement
In the experimental part of the current study, parameters such as surface roughness and primary profile of machined surfaces were systematically evaluated. The surface of the machined material was evaluated using an Alicona InfiniteFocus confocal microscope (Alicona Imaging GmbH Dr., Raaba, Austria). The surfaces were evaluated according to the available standards for curvilinear roughness ISO 4287 and ISO 11562, and for planar roughness according to ISO 25178 and ISO 12781-1:2003 [
46]. Single grooves on the milled surfaces were measured to evaluate surface roughness parameters, namely Ra, Rz, and Rsk, specifically at the center of the machined groove. Additionally, the primary profile of the measured grooves was evaluated, segmented into distinctive parts. The workpiece dimensions were 50 × 70 mm, and the length of the machined area extended to 70 mm, with the width varying in accordance with the selected a
e parameter.
3. Results
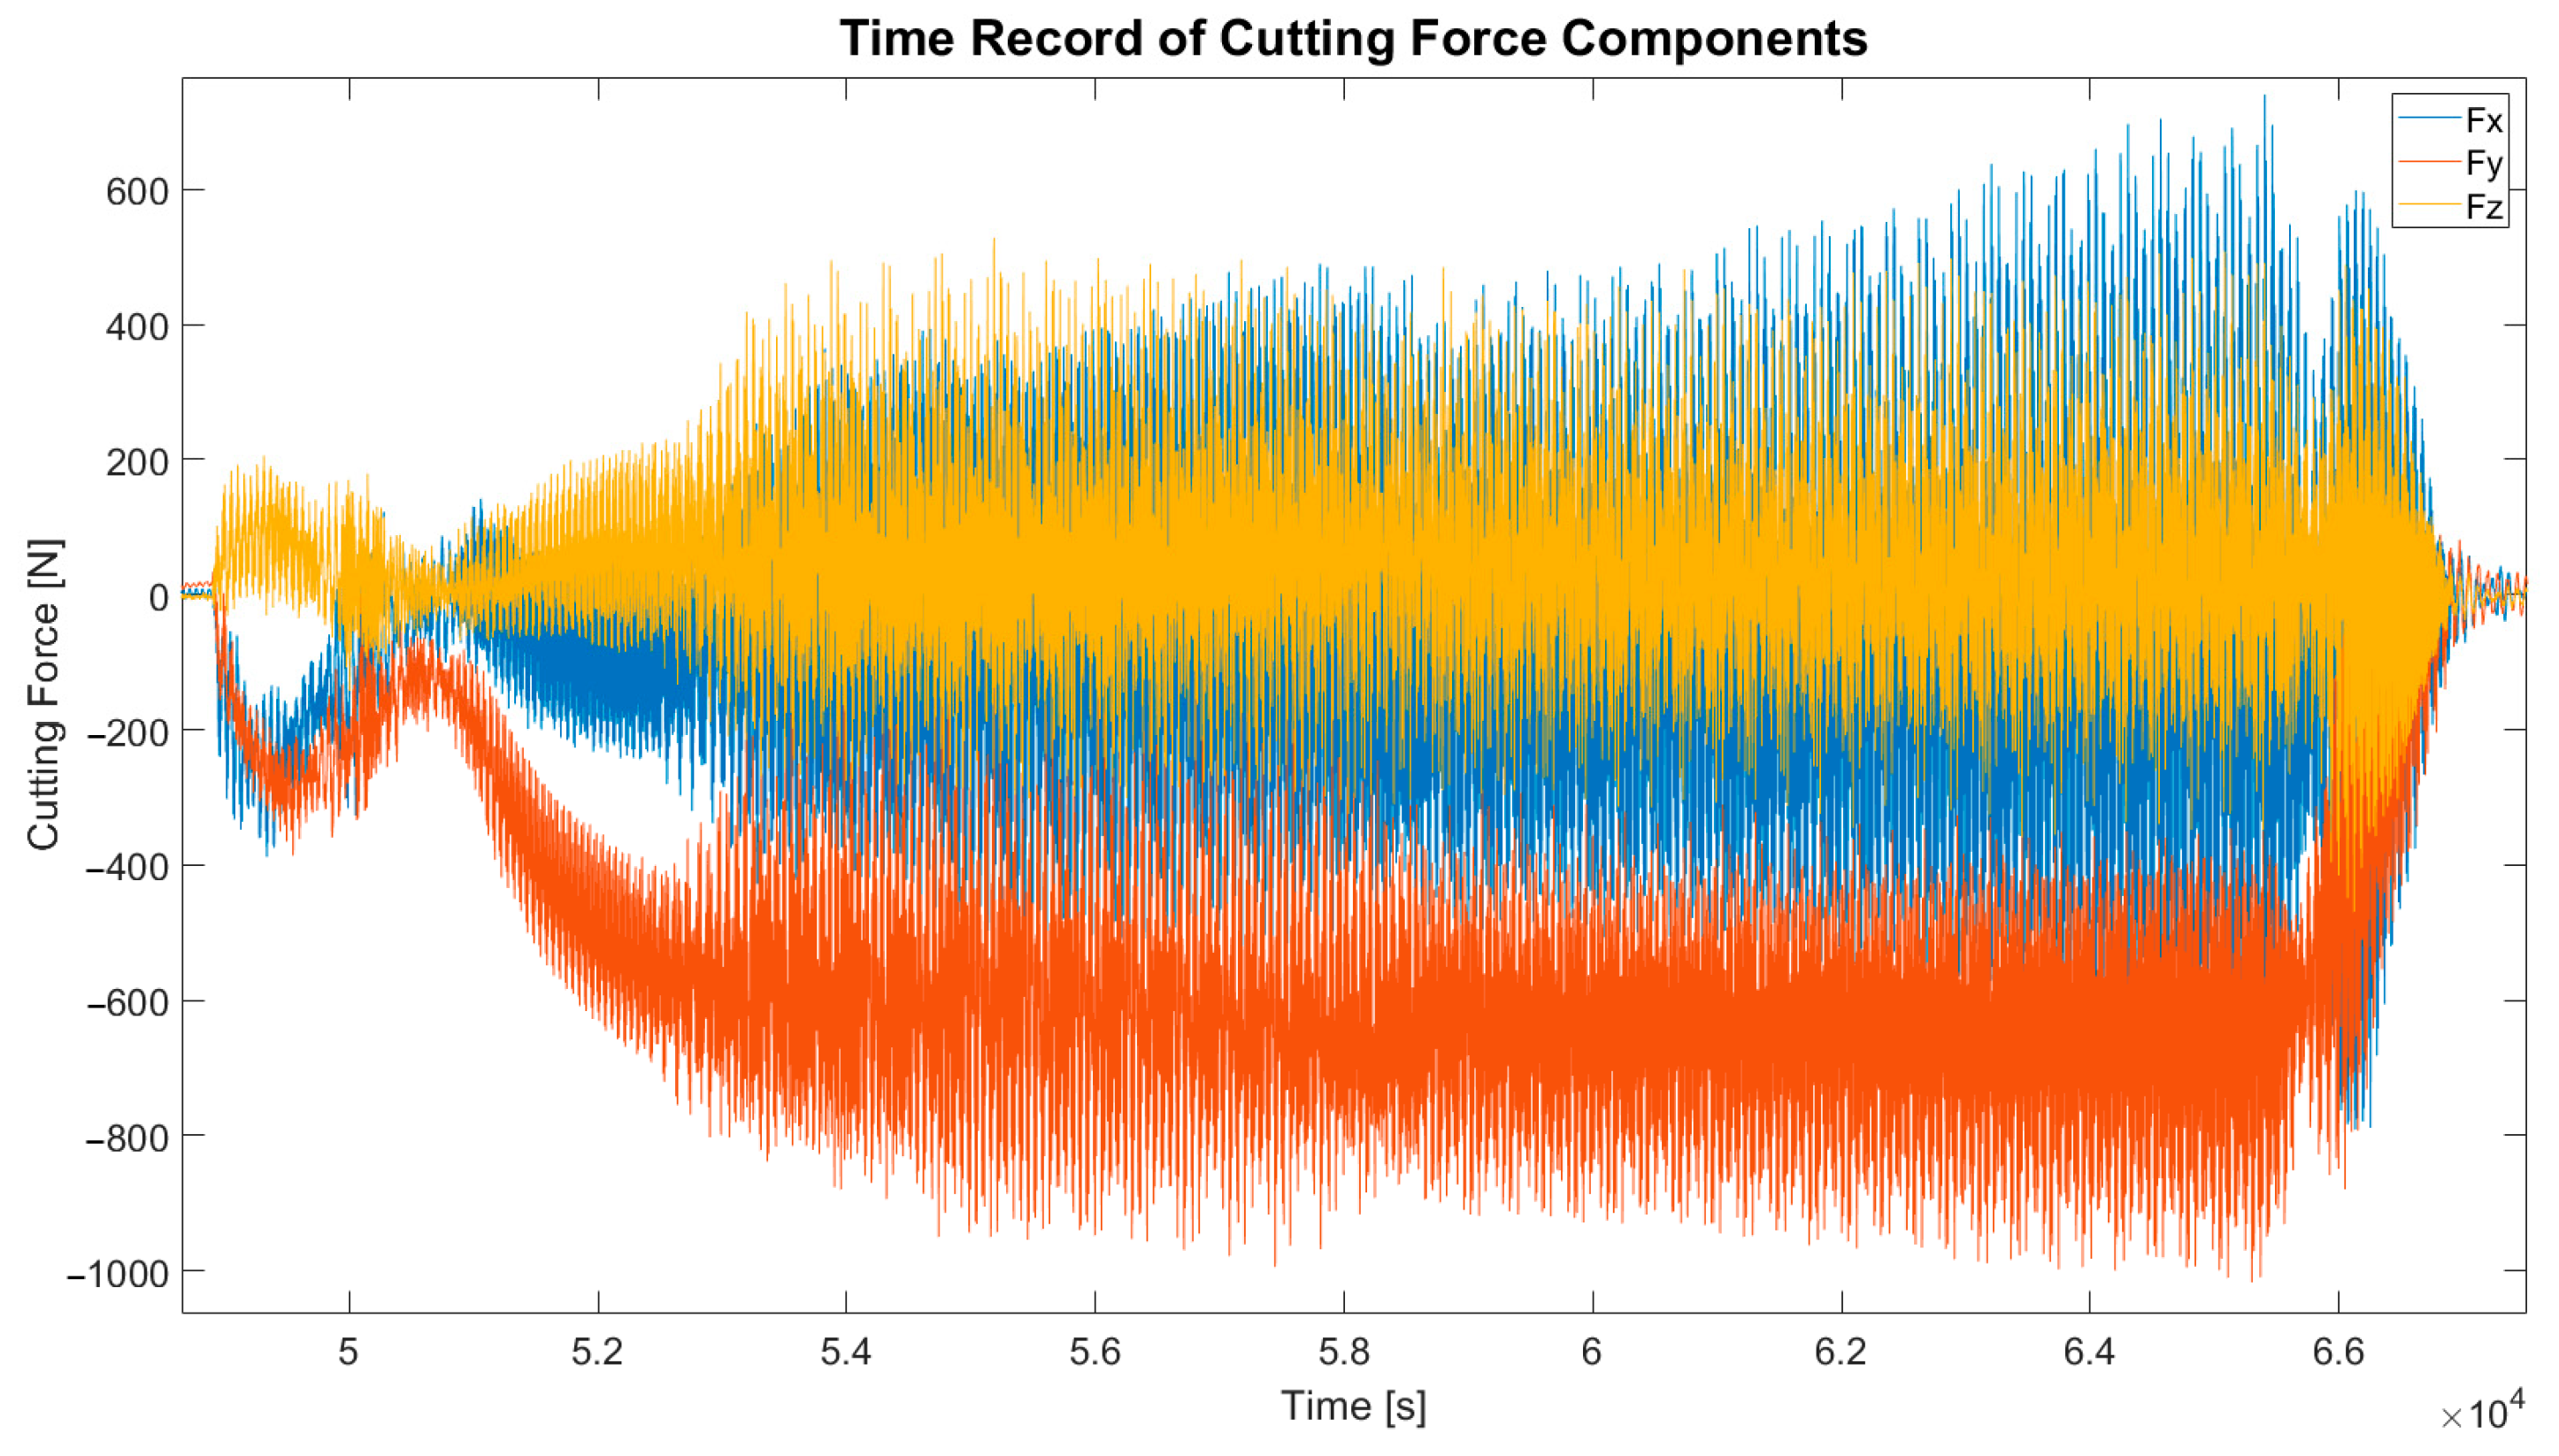
The graphs
Figure 3 show the evaluation of the cutting force components Fx, Fy, and Fz throughout the entire groove machining process. In the individual graphs for each cutting force component, distinctive behaviors of the tool load are observable as the tool approaches the cutting point (forces dropping to almost zero), followed by a phase of force increase as the tool aligns with the linear path. In the third part, an increased dispersion of values is observed, indicating that the tool required some time to stabilize its load. Subsequently, stability in the cutting force components persisted until nearly the end of machining, at which point another alteration like the load path occurred as the tool exited the cutting groove.
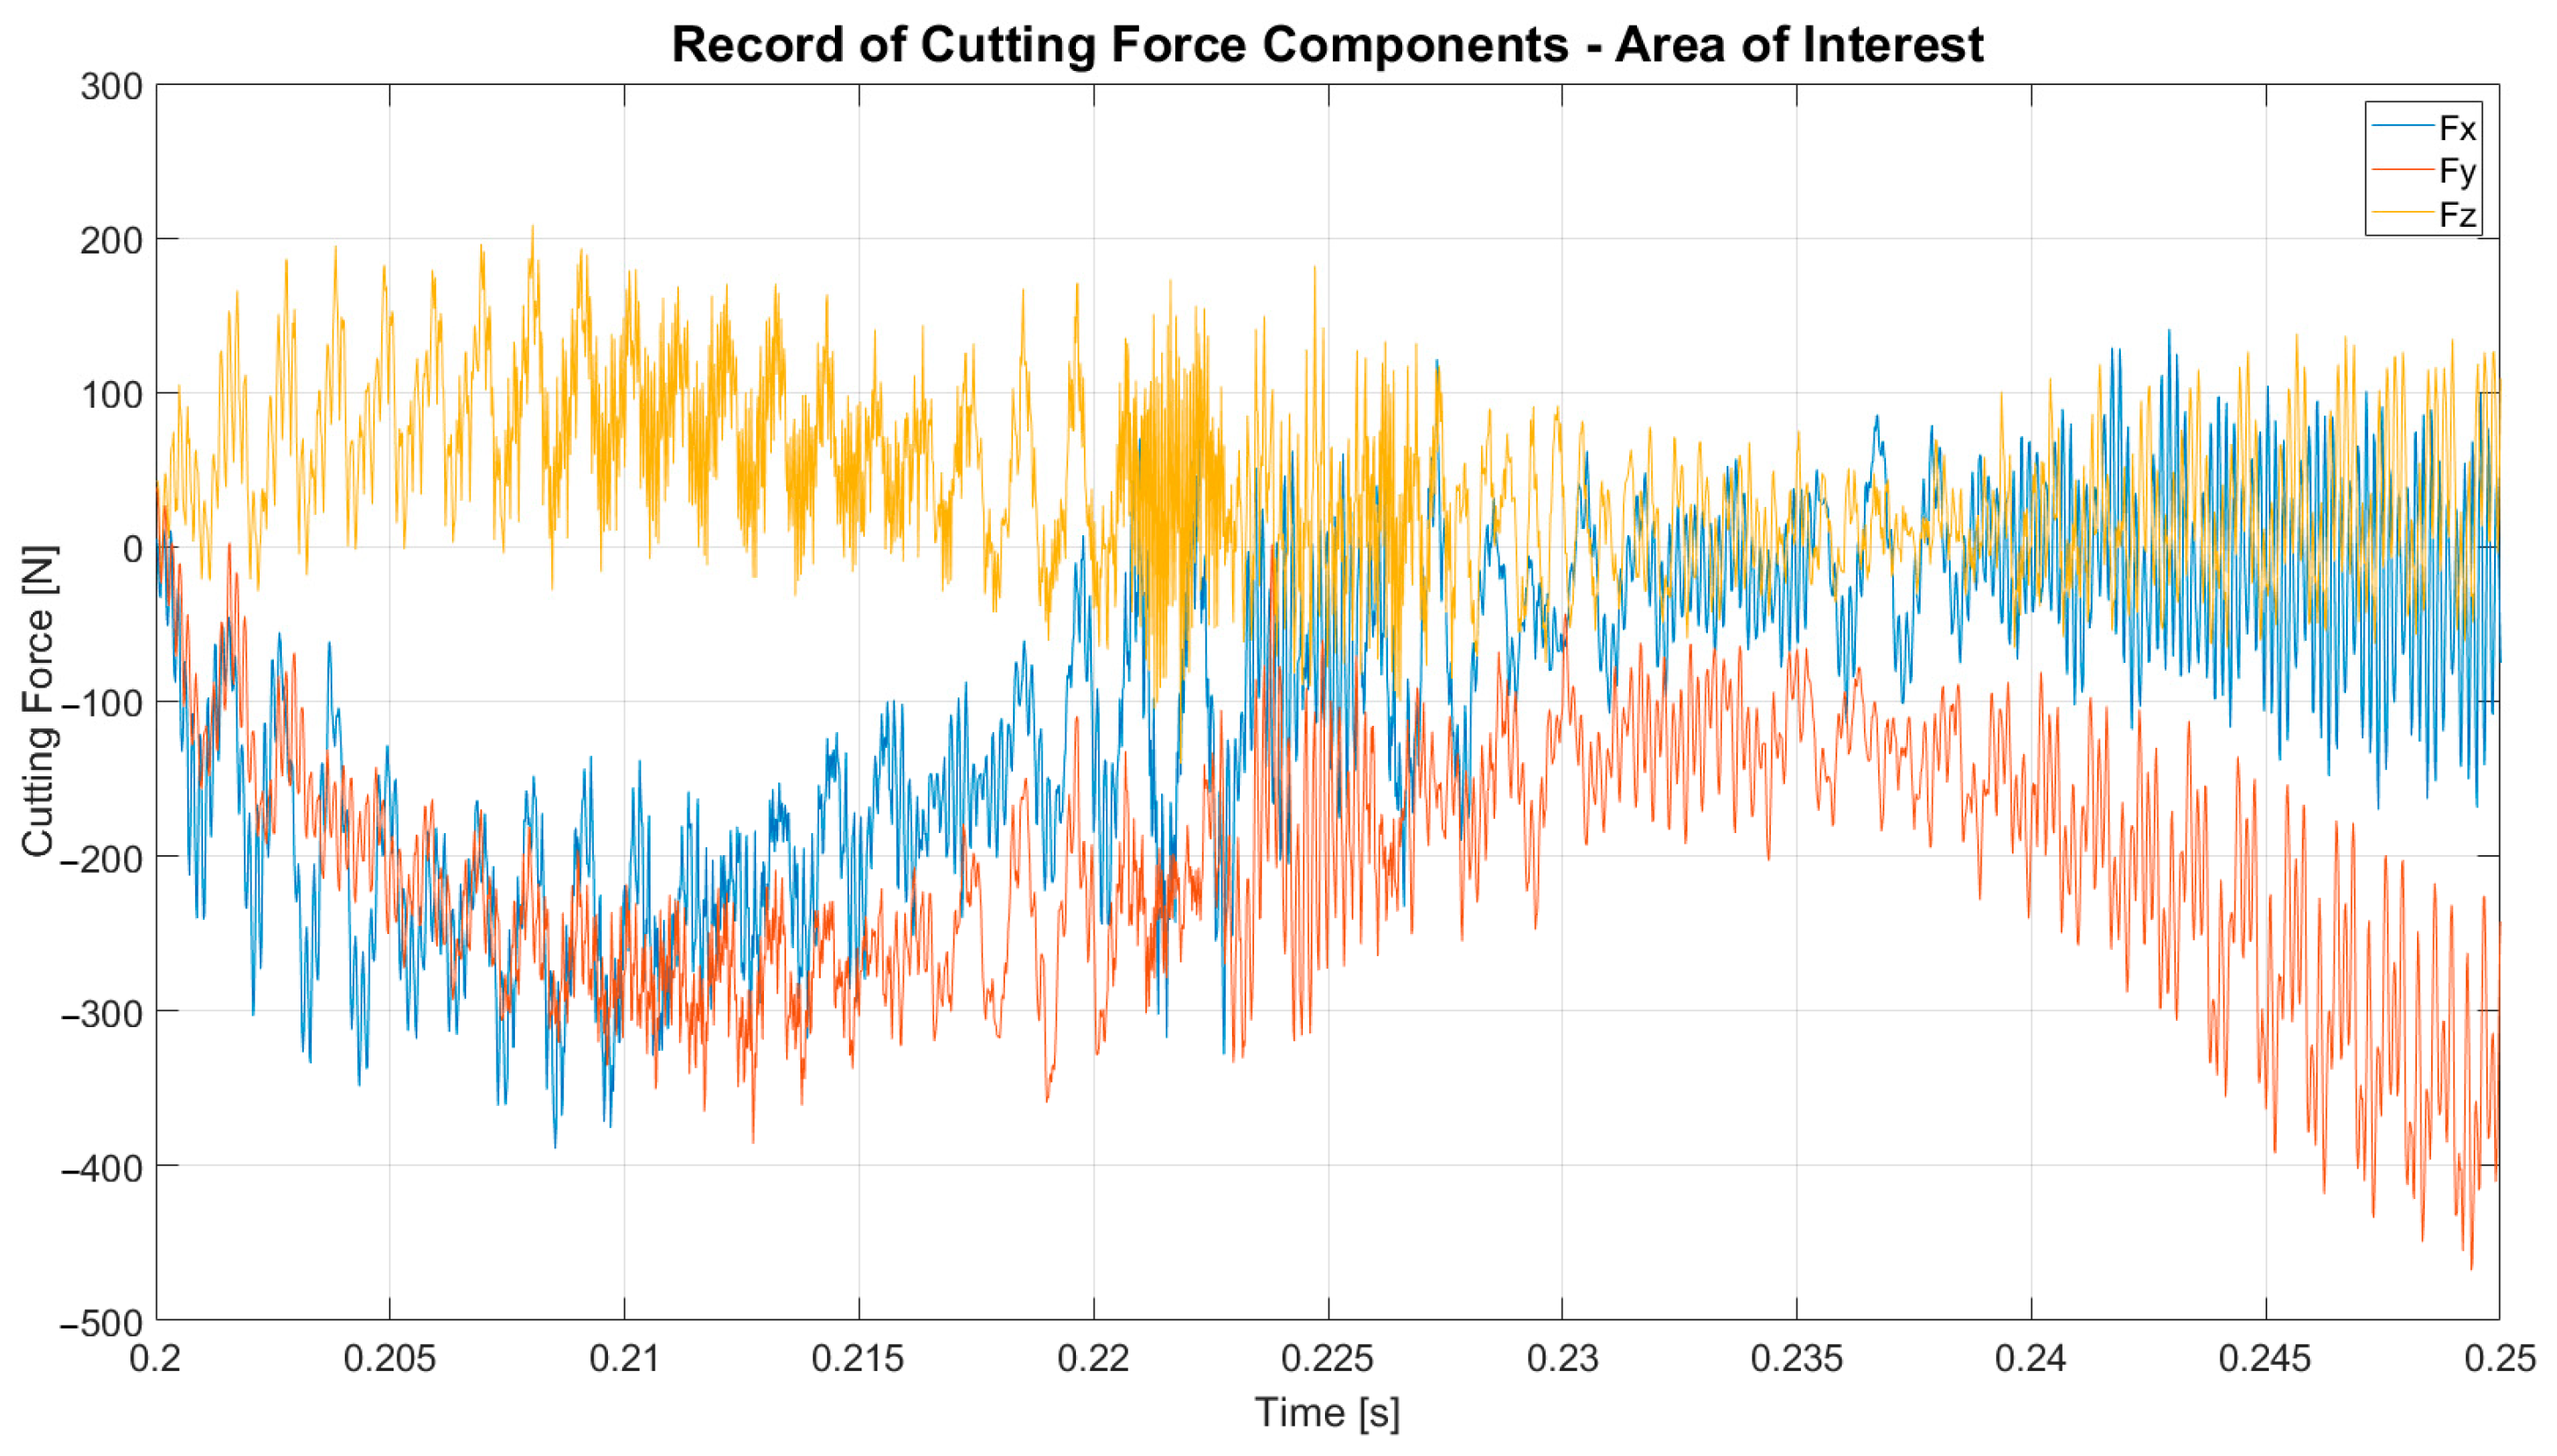
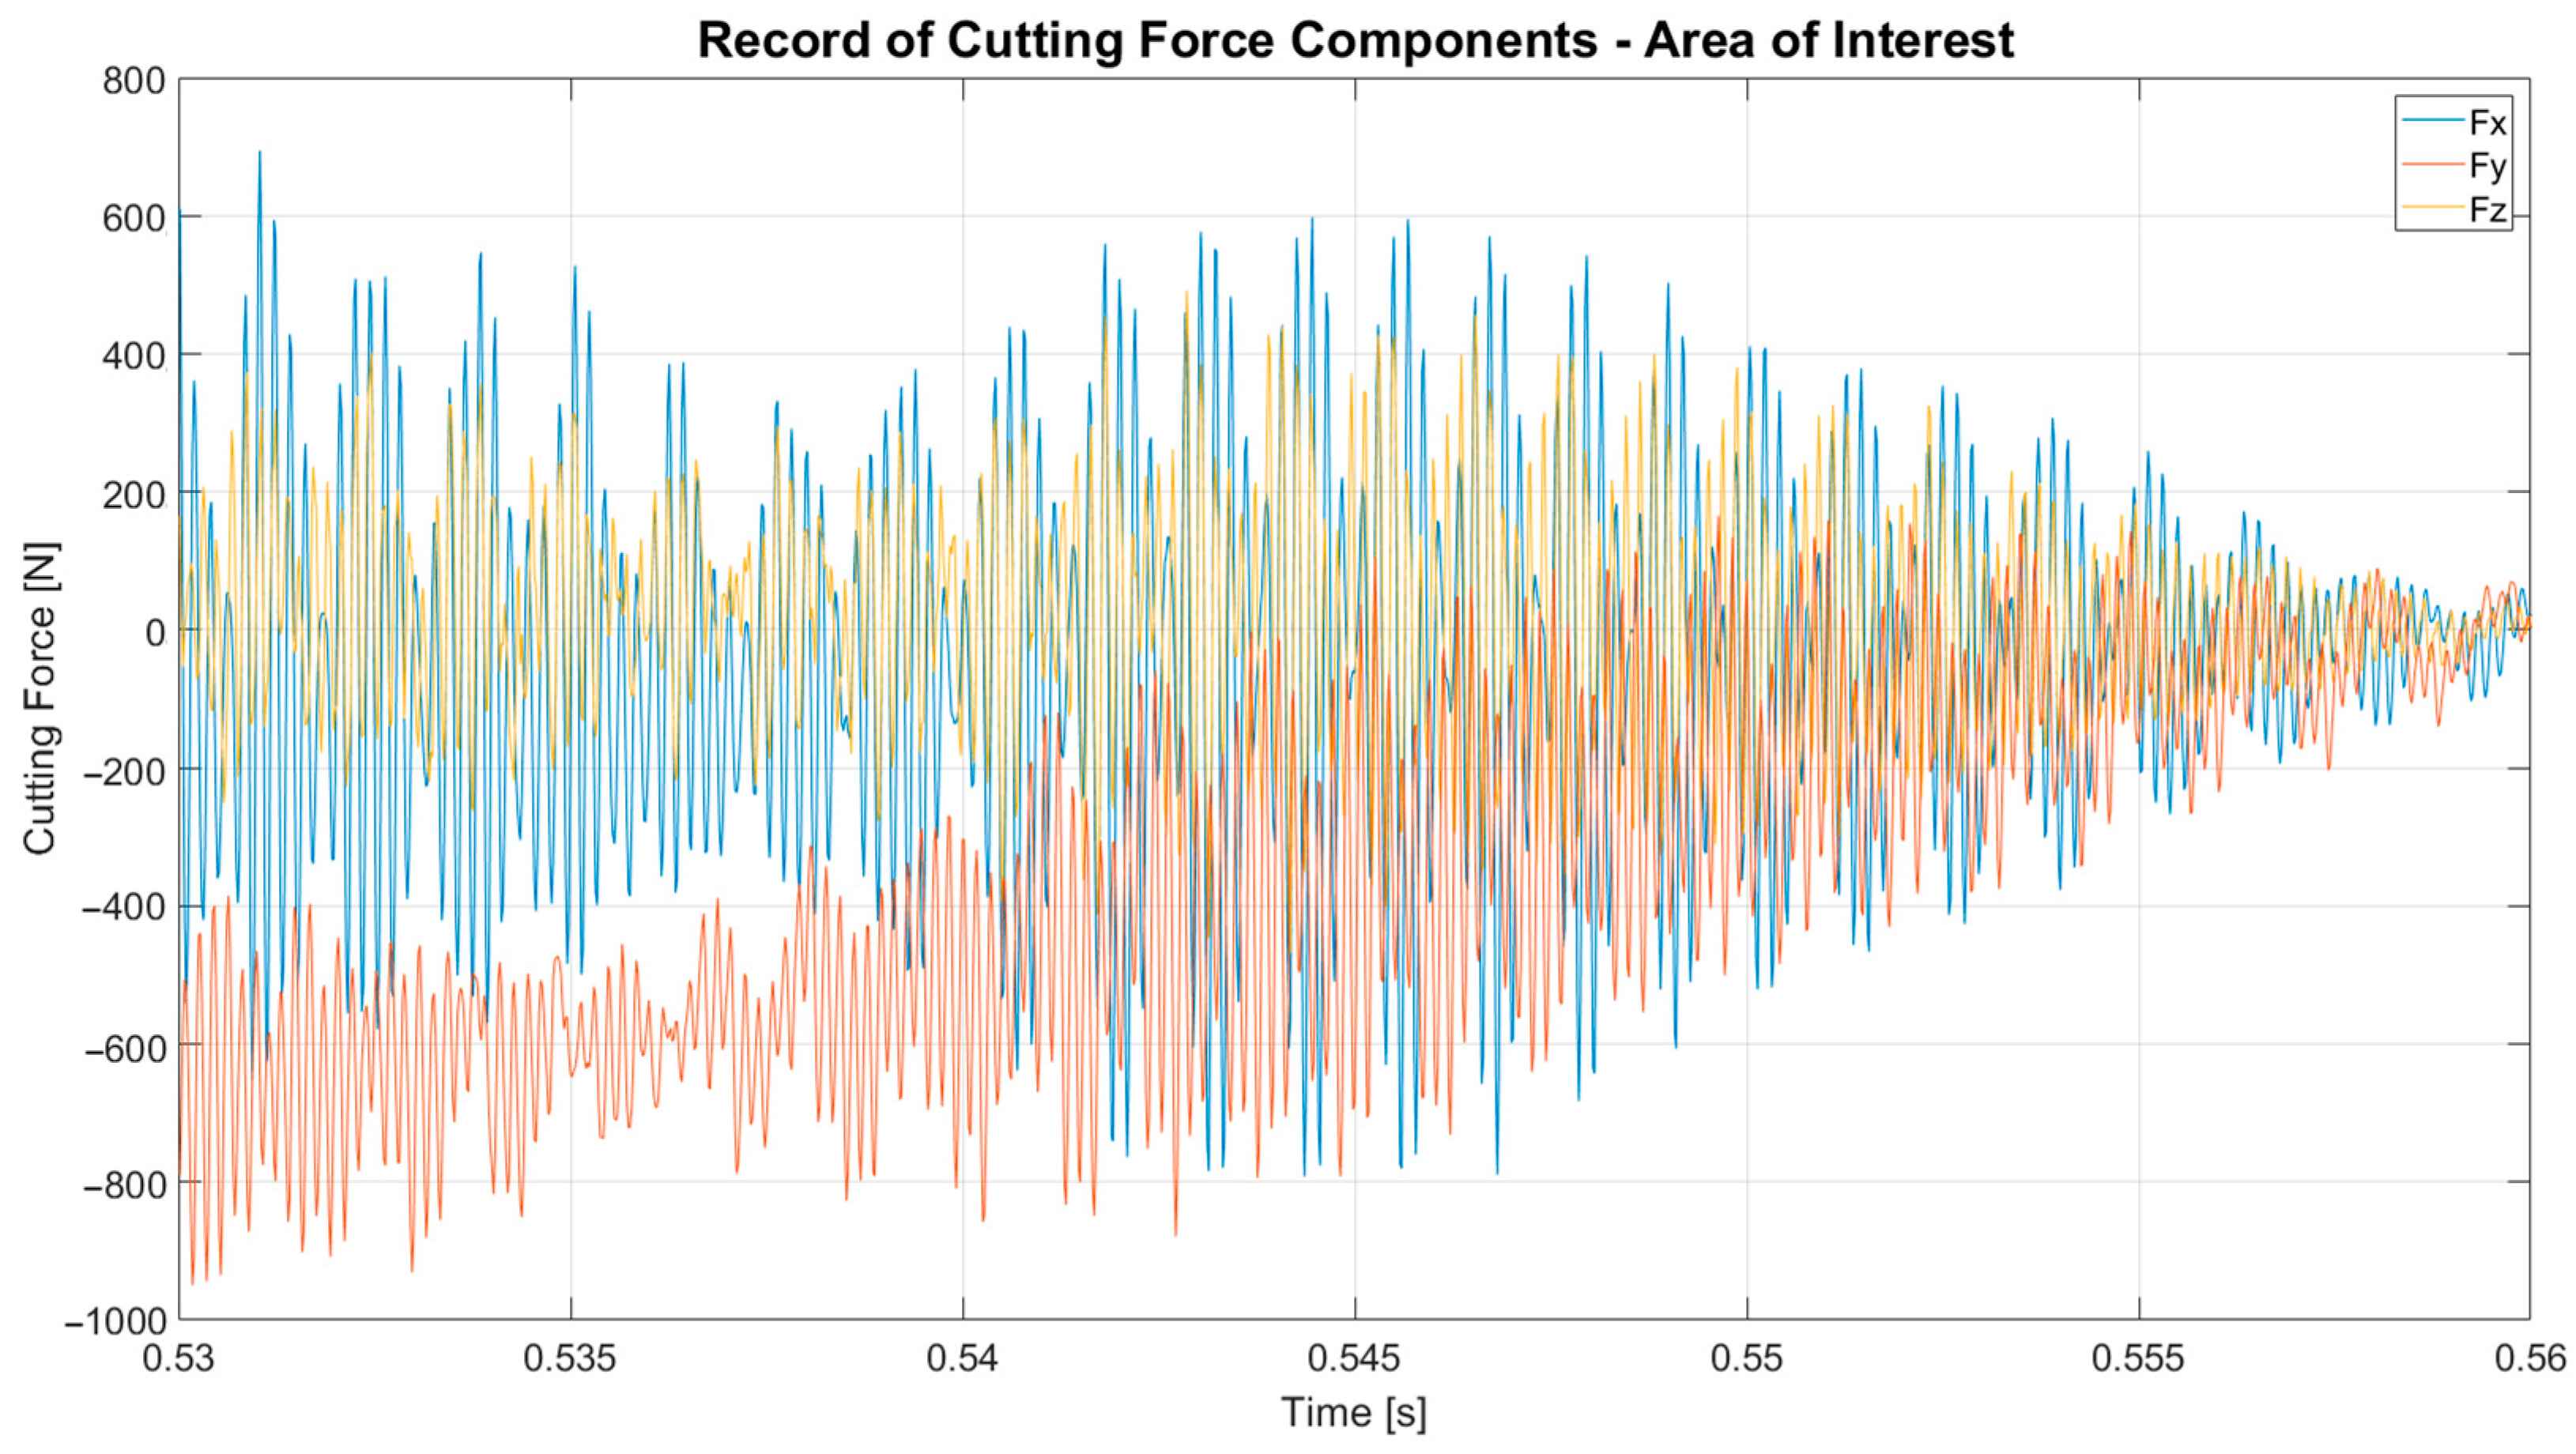
In the subsequent set of graphs, the behavior of cutting force components during different stages of the cutting process is presented.
Figure 4 depicts the cutting force components Fx, Fy, and Fz at the ramp-up, with a lead-in angle of 40°, a depth of cut of 7.5 mm, and a cut width of 1 mm. The graph illustrates a gradual decrease in all cutting force components following a smooth increase. This behavior corresponds to the measured primary groove profile, indicating that the tool did not smoothly follow the programmed path during high-feed milling. Instead, it experienced deflections from its path, subsequently returning to the programmed trajectory. This phenomenon resulted in a resumption of cutting forces when the tool deviated from its programmed linear trajectory.
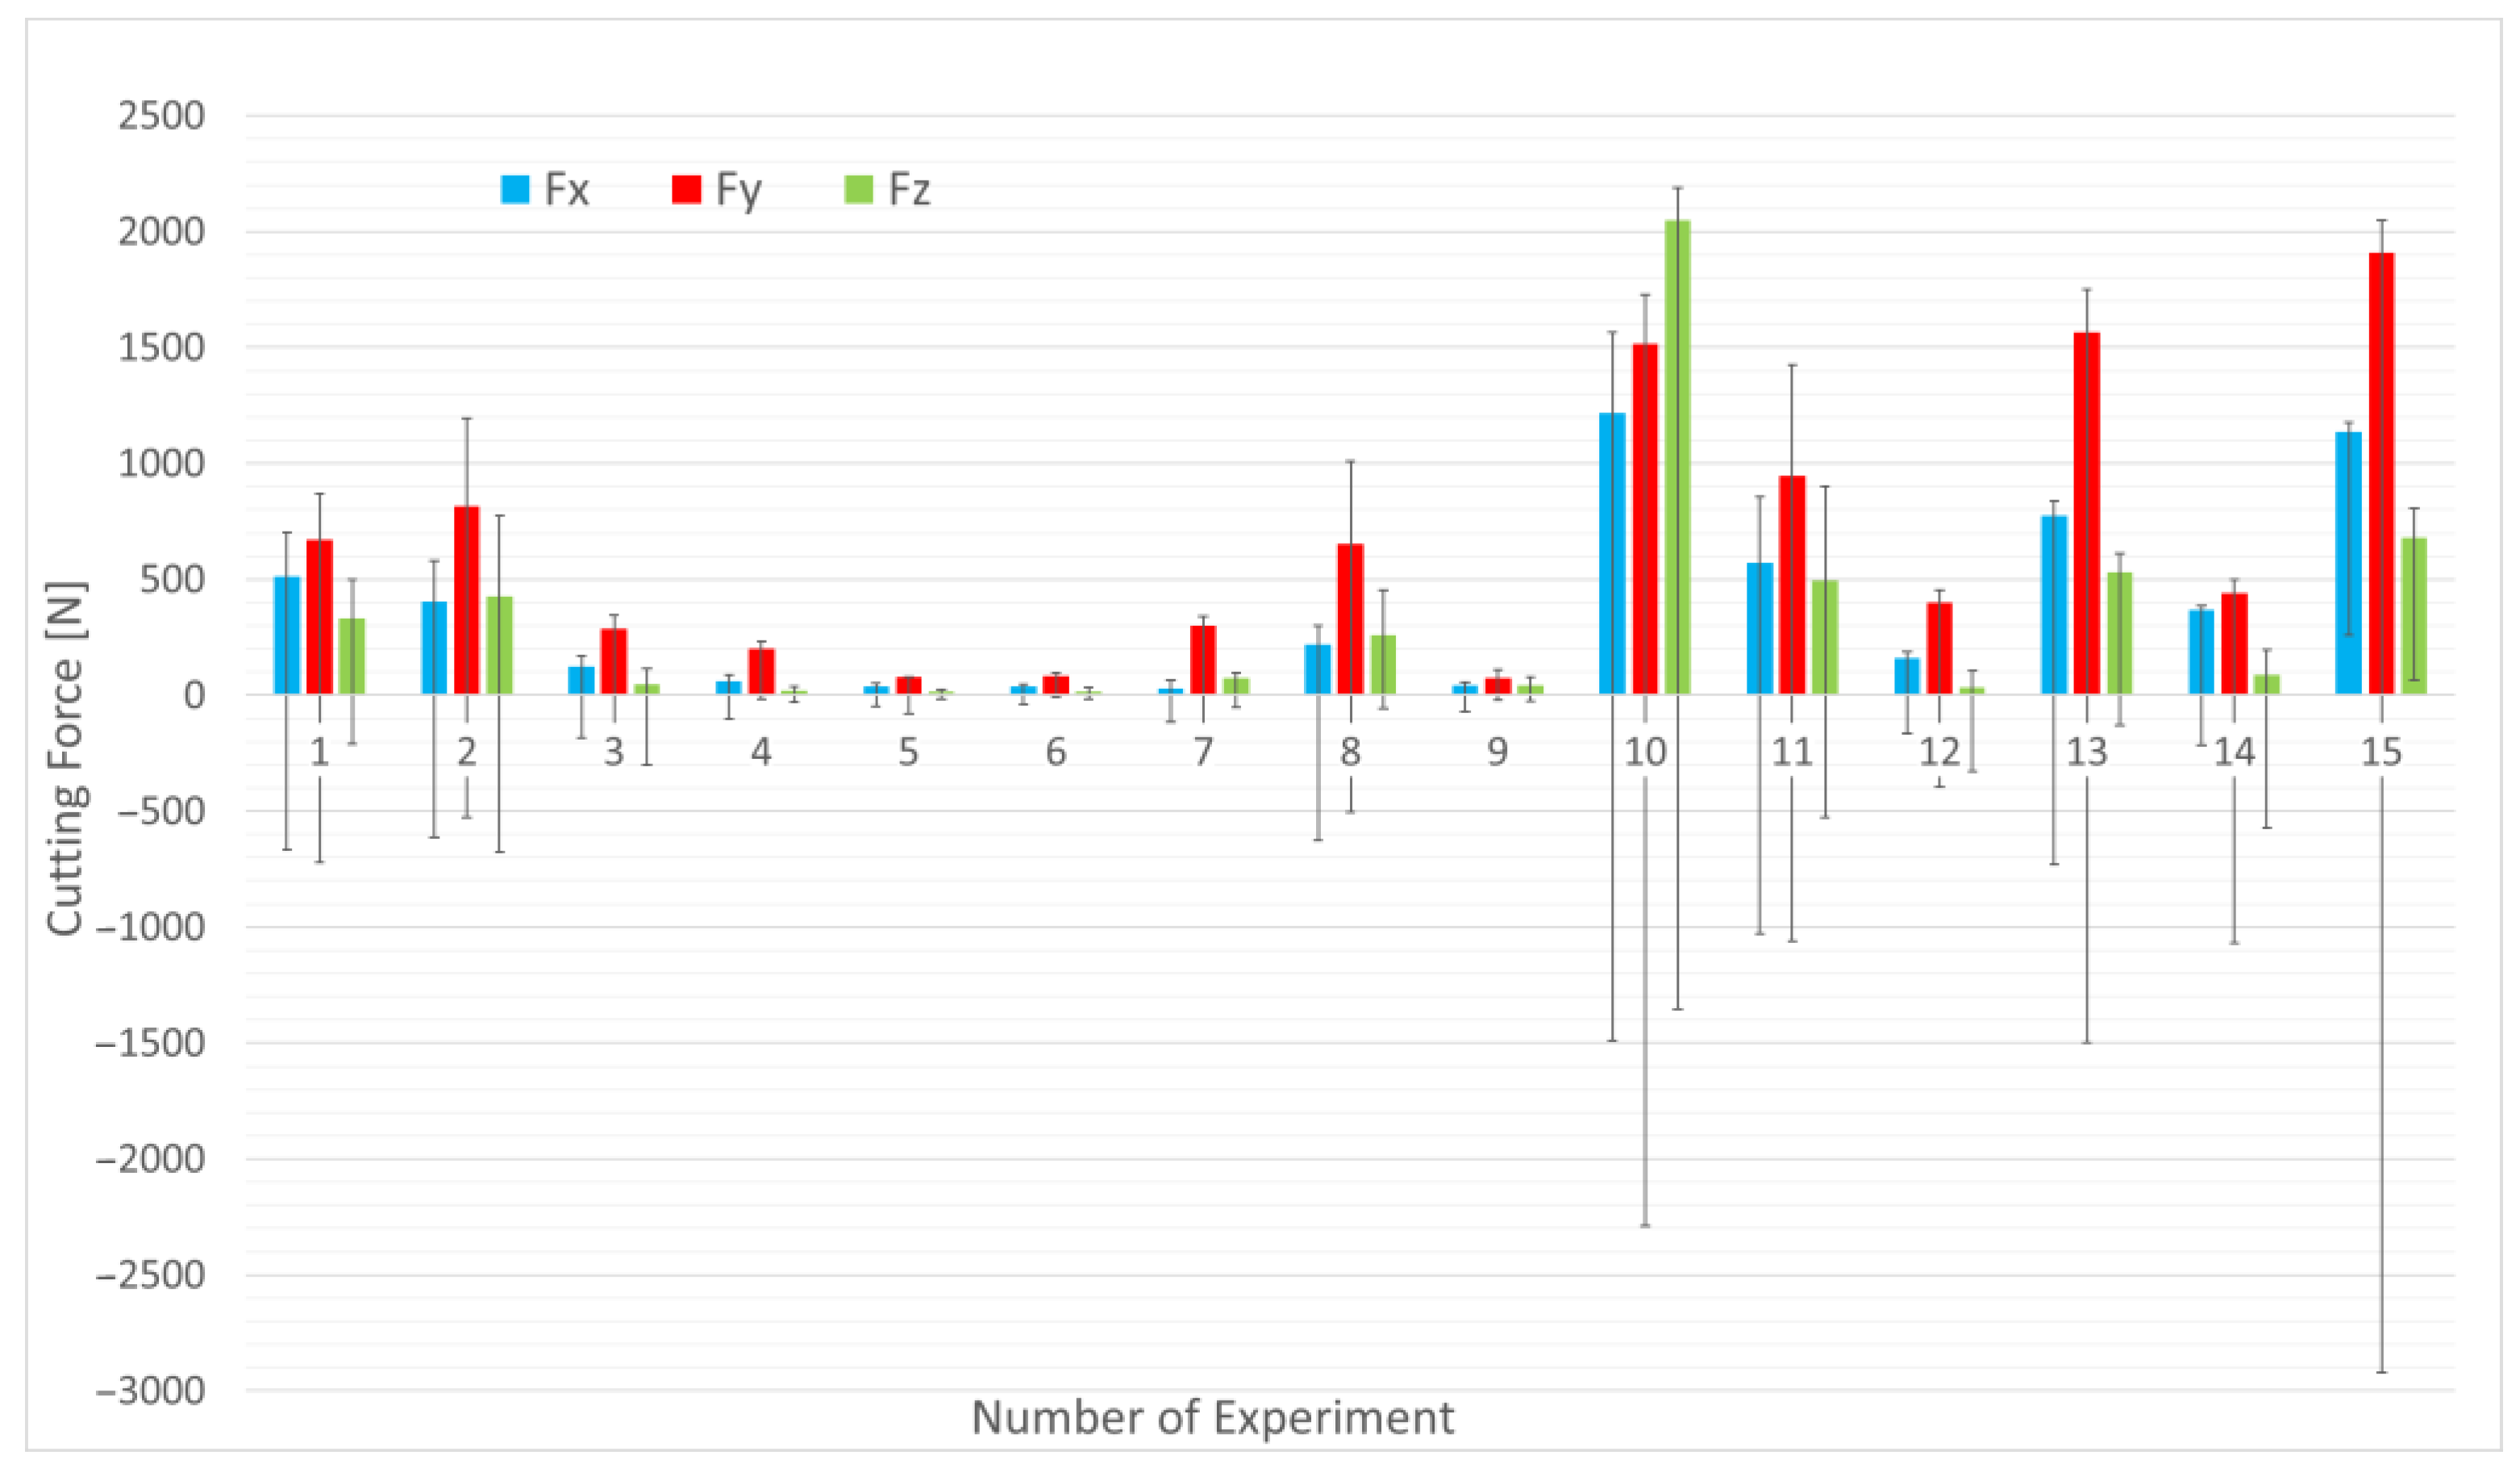
The graph (
Figure 5) presents three mutually perpendicular components of the cutting force at lead in, highlighting extremes observed in each experiment. The experiments with the largest chosen parameters for thickness and width of cut exhibit the highest values. Notably, the Y component of the cutting force experiences the most significant increase in Experiment 15, suggesting that this trend may be attributed to the combination of the selected width and thickness of the cut.
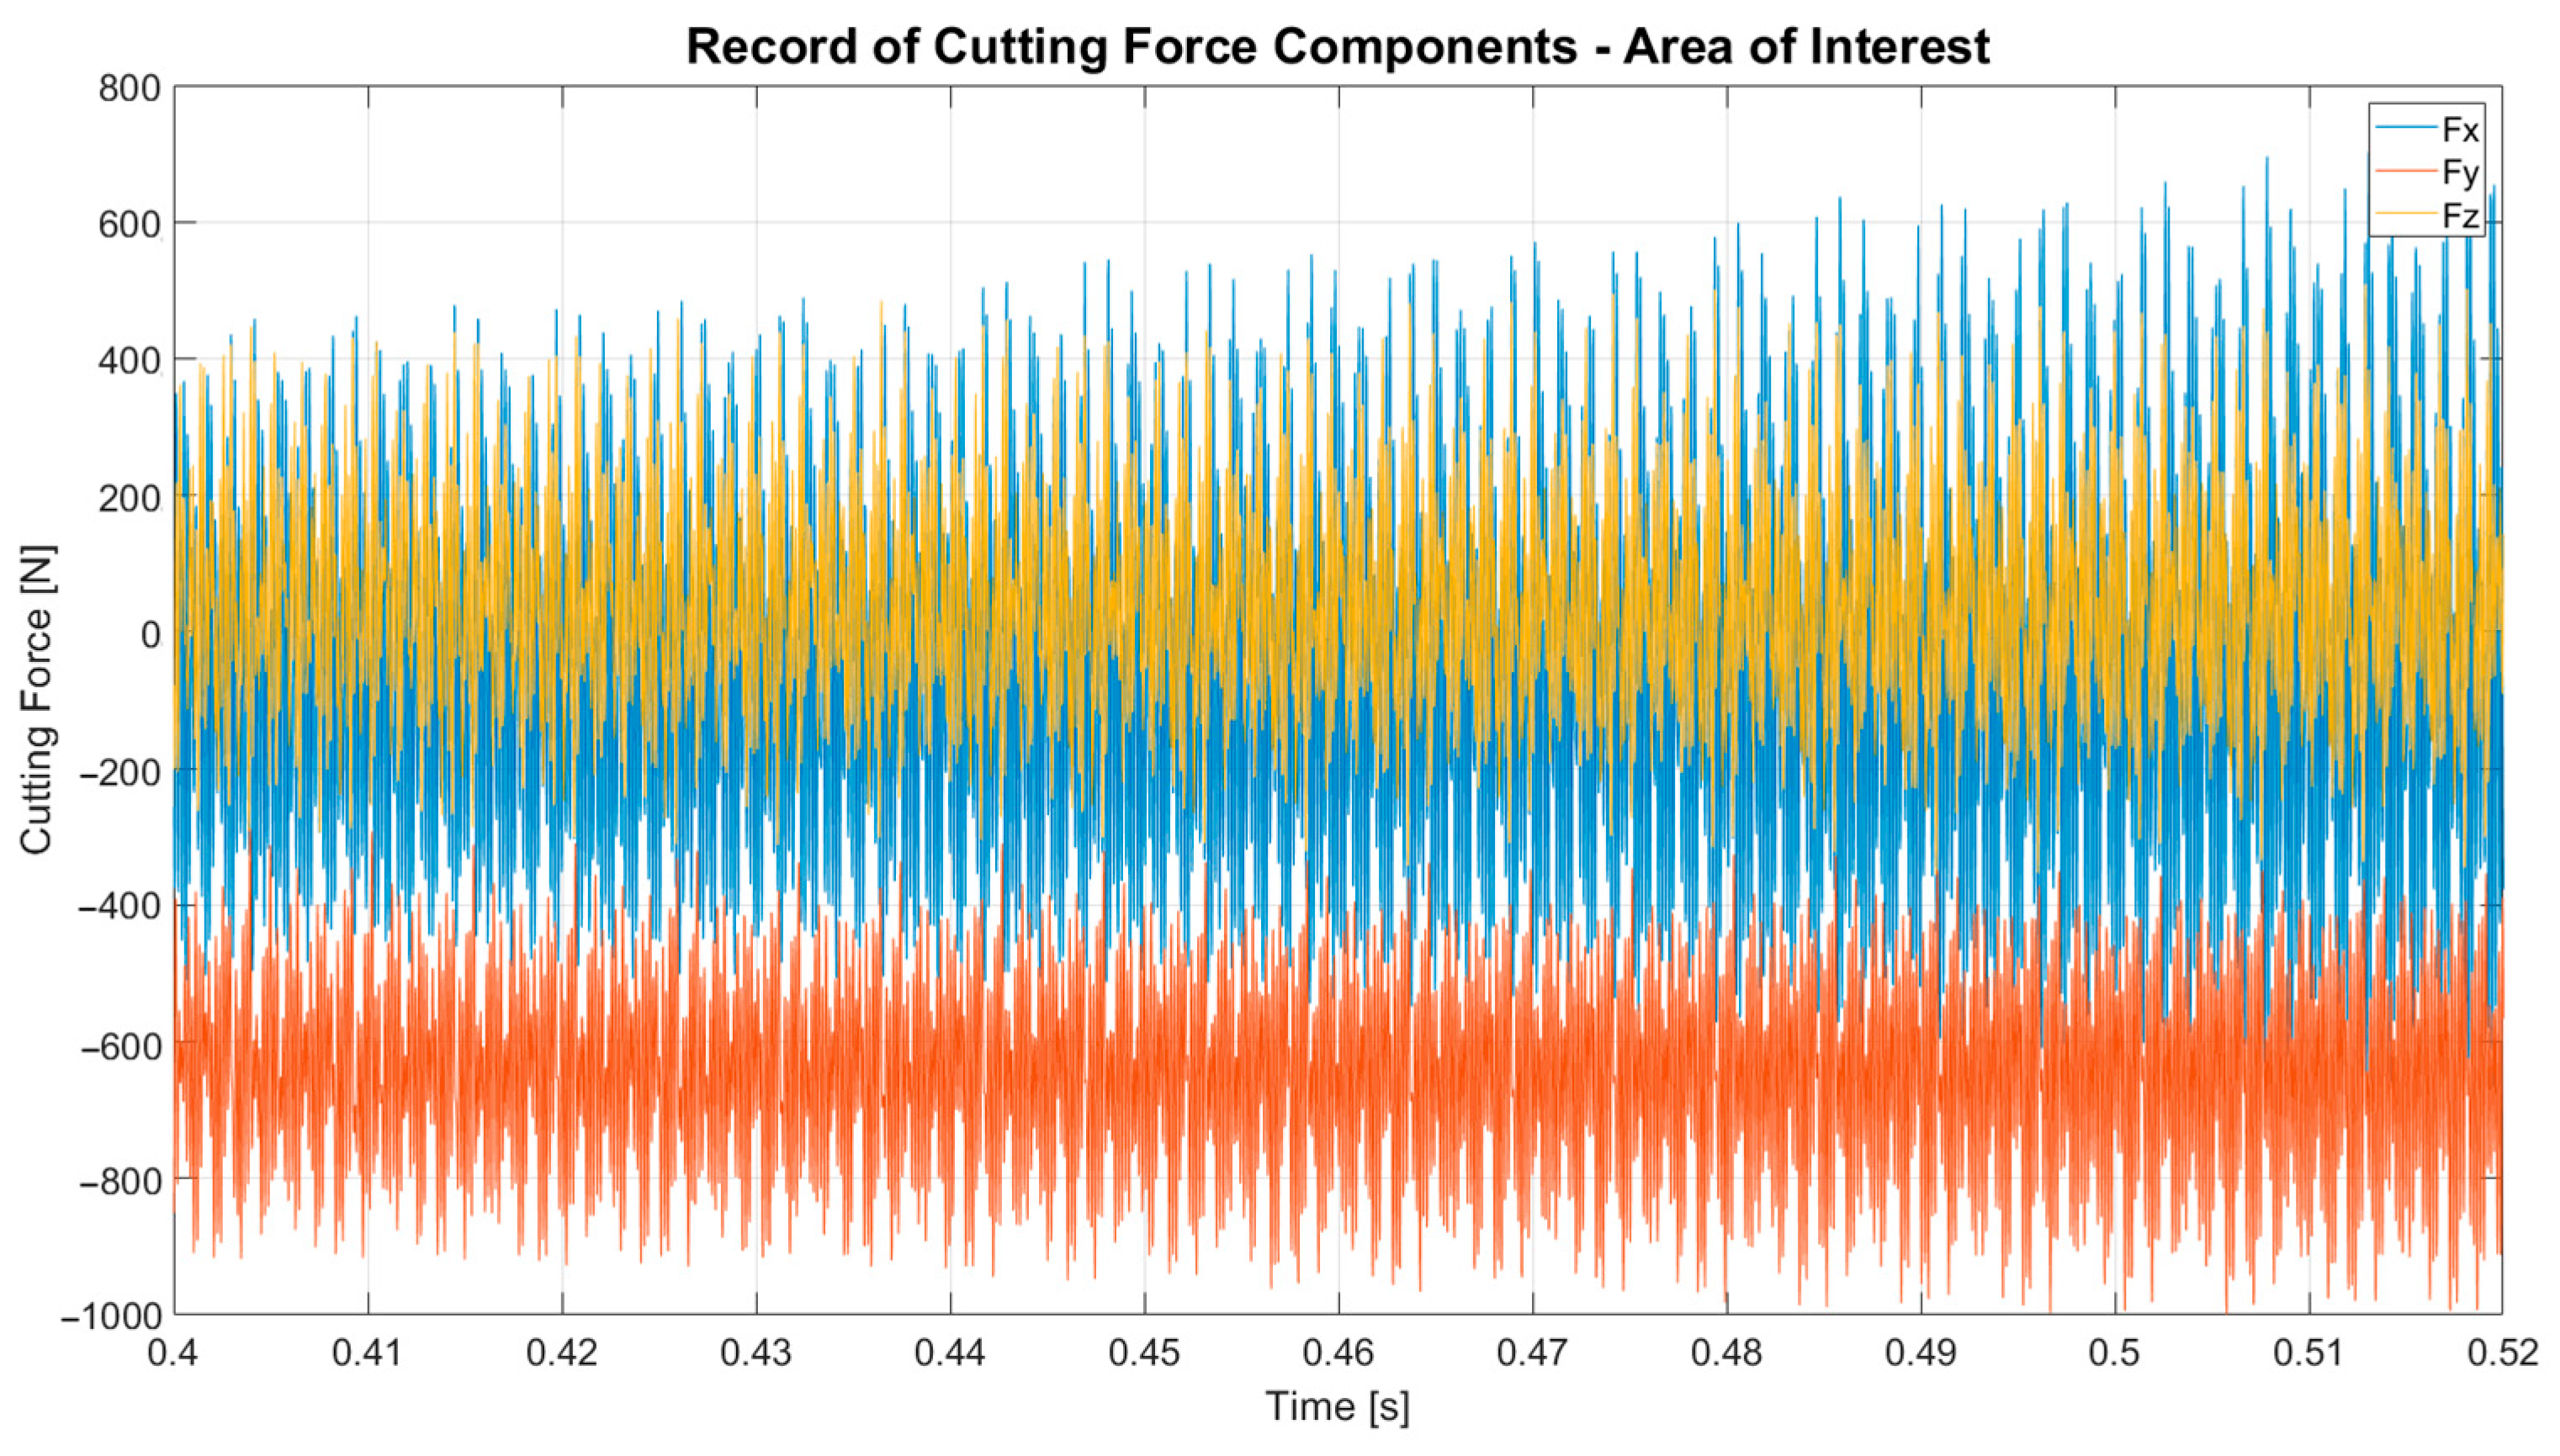
After the tool has run into the material, the tool starts to remove the workpiece material continuously with a linear trajectory. The magnitude of cutting forces can be seen in
Figure 6, which presents the components of cutting force applied during the first experiment. The magnitude of the cutting force components varies from +600 to −800 N, where the positive or negative value determines the direction of the force.
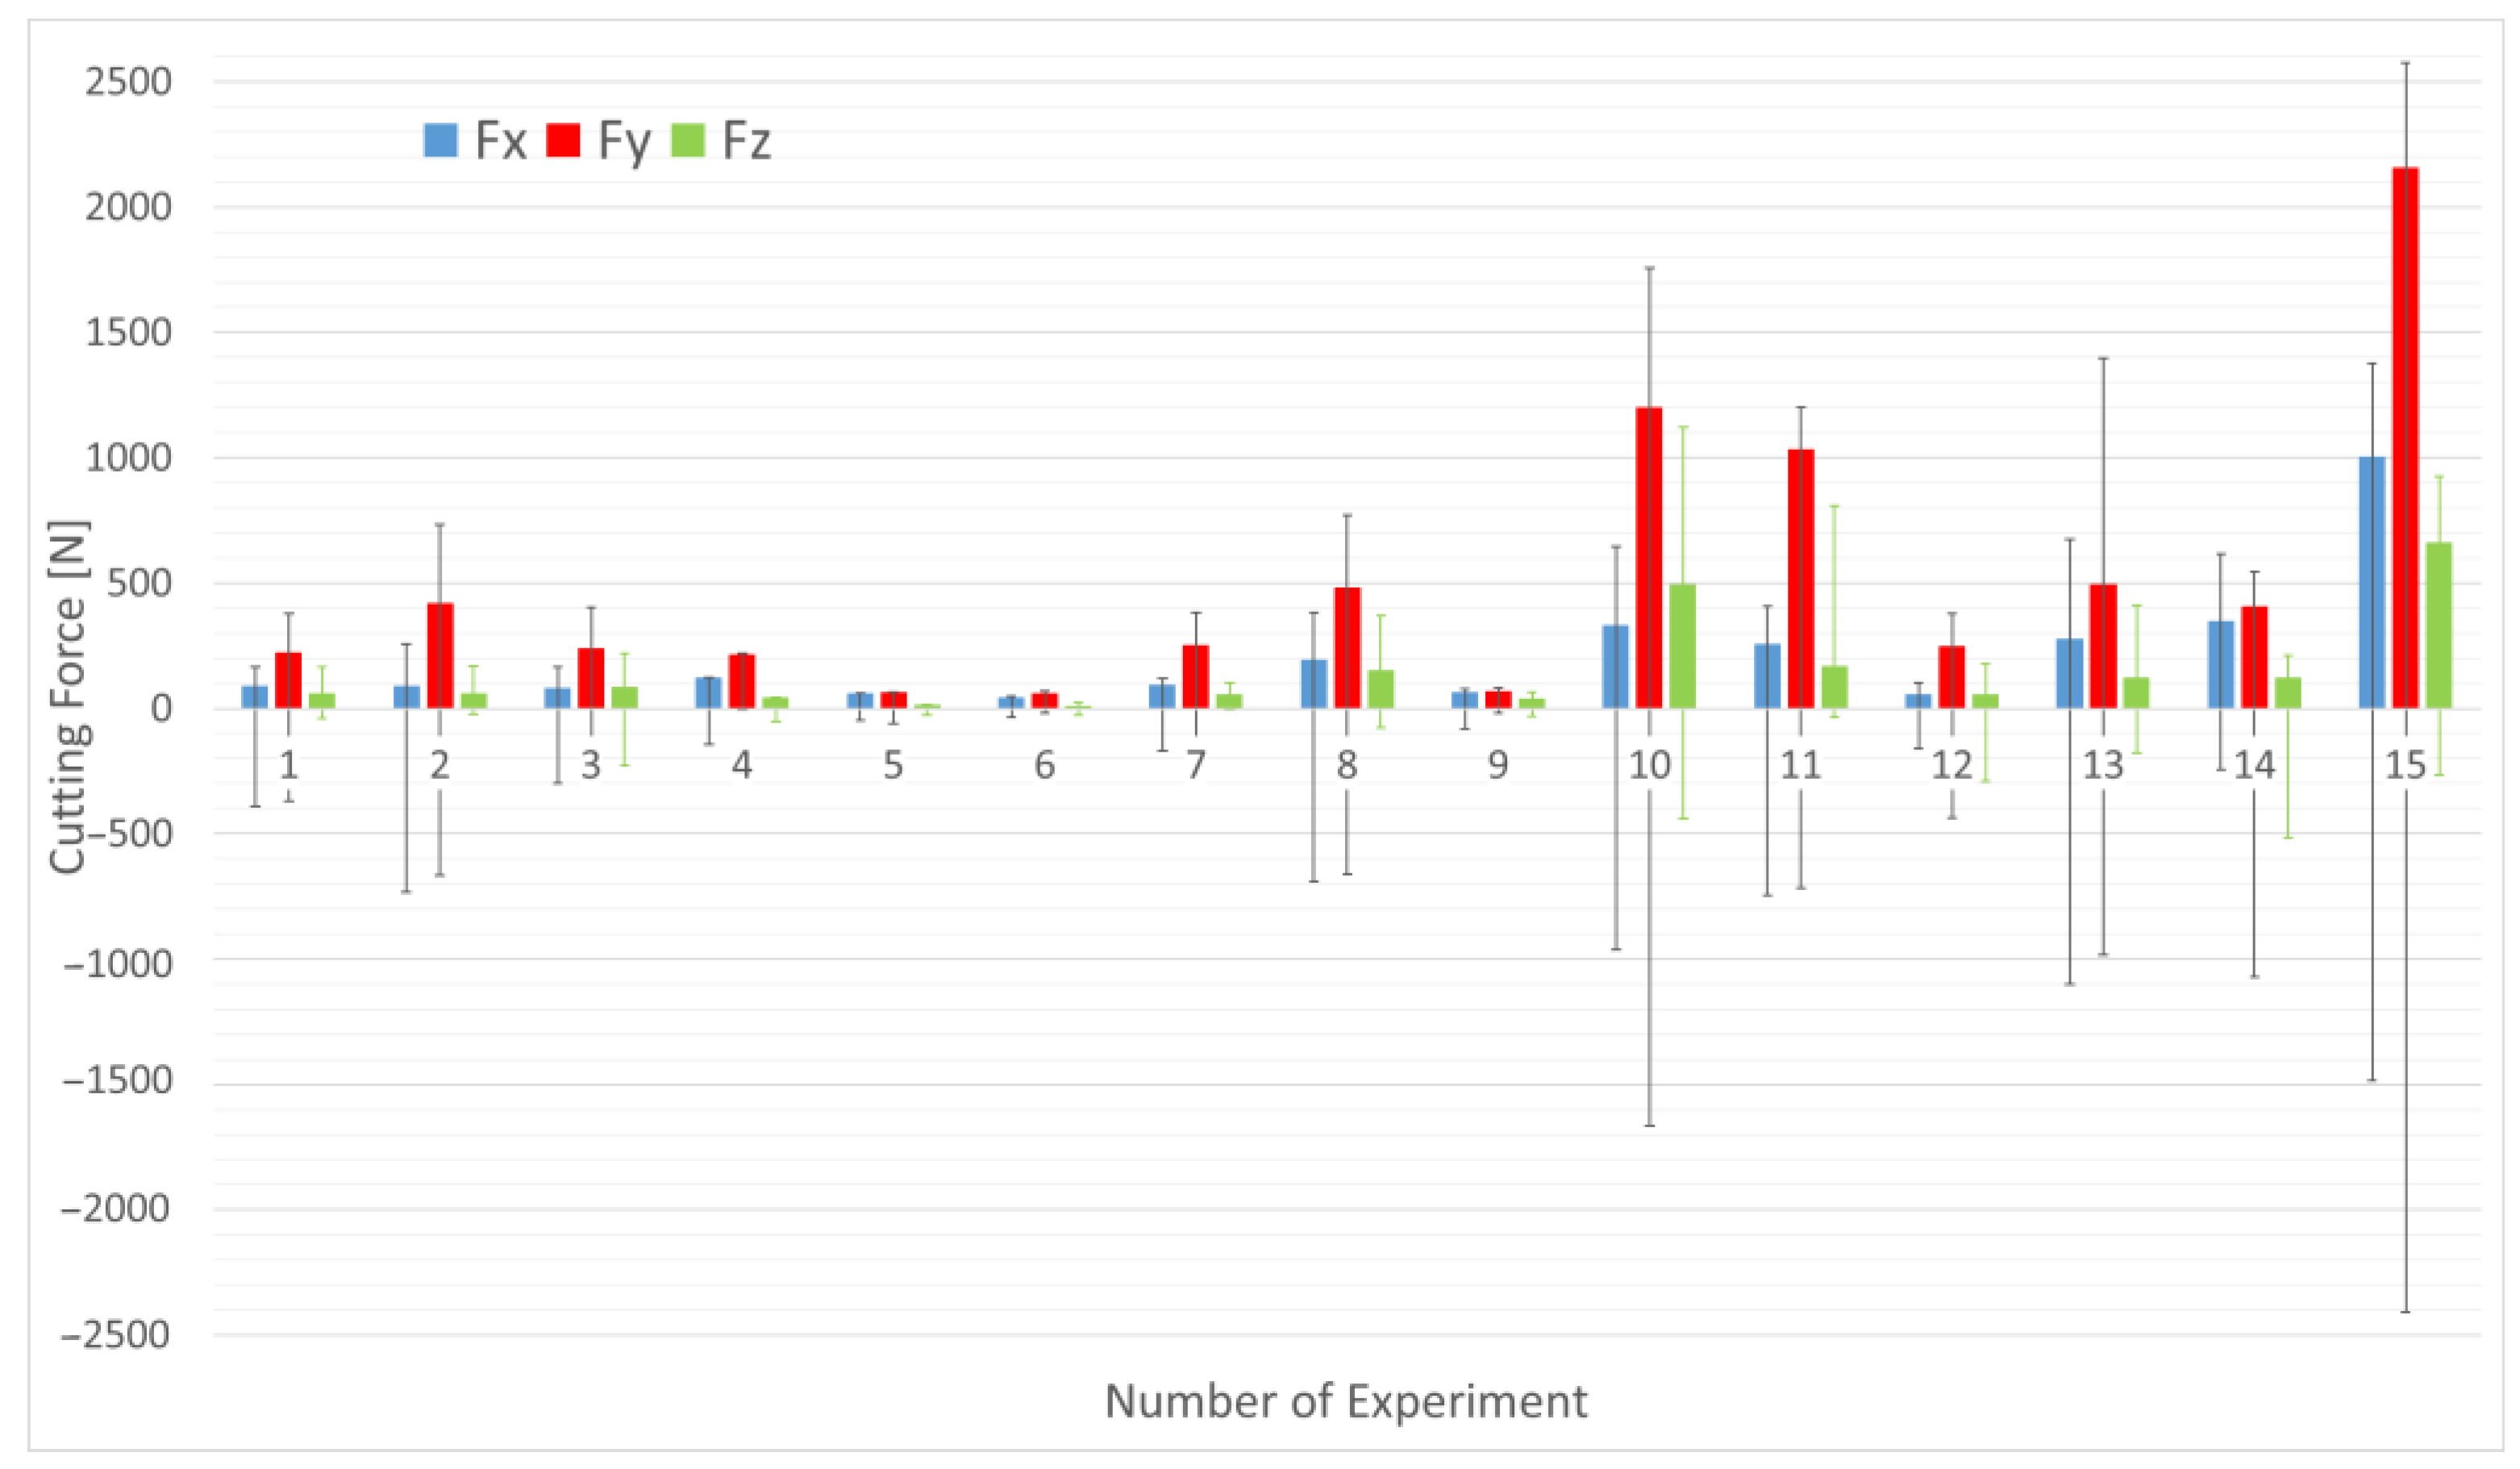
In the middle area, a comparable trend to that observed in the run-up area is noted, but with a less pronounced increase in forces. As depicted in the graph (
Figure 7), the major changes include the increase in Fz for Experiment 10. The direction of the z component of the cutting force is acting from bottom to top, indicating that the tool was being pushed out of the cutting location. According to all known findings, this can be caused by the cutting edge in the helix, which under certain conditions causes a pulling of the tool out of the cutting site.
In the graph (
Figure 8), the completion of the machining of the groove is depicted by a gradual decrease in all three components of the cutting force.
Tool run-out (
Figure 9) extending from the cutting point can involve tool oscillations and other influences that can impact the resultant values. Consequently, values from the middle part of the machining process, where the cut is stable, have been utilized, ensuring that the measured values are considered highly significant.
To summarize the measured components, the resultant principal cutting force was calculated.
The following table (
Table 3) gives an overview of the medians of the calculated cutting force in the main machined area of the cut, where the measured components were the most stable and thus the resulting rank notes have the greatest predictive value. Additionally, the table includes the maximum and minimum cutting force values, indicating the variance within the dataset, showing the average values of the cutting force components for each experiment. The measured values are supplemented by the calculated total cutting force, according to which the effect of parameter variation can be evaluated.
As shown by the values of the individual cutting force components and the mutual interactions of the cutting parameters, the individual cutting force components are affected not only individually but also in combination.
It can be noticed that the Fx component was primarily influenced by the cutting width, the Fy component was primarily influenced by the feed of the milling cutter, and the Fz component was most dependent on the depth of cut.
Hence, the lowest cutting forces were obtained with the combination of the investigated cutting parameters with the lowest values (ap vs. ae, e.g., Experiment 6).
The largest values were found in Experiments 10 and 15, when the combination of depth of cut and width of cut resulted in the chip with the greatest thickness (largest volume of material).
In the case of Experiment 10, the approach angle was chosen at the lower limit. This may have caused the material being removed to stick to the adhering material due to imperfect cutting. This resulted in a greater cutting force than in the case of Experiment 15. There, the lead-in angle was set to the maximum value, i.e., the tool went directly to the maximum cutting width, which at the set cutting parameters provided cutting conditions that did not allow material to stick to the cutting edge.
3.1. Analysis of Variance
The response area statistics for the cutting force components Fx, Fy, Fz and the resultant cutting force F were also evaluated in this study (
Table 4). In
Table 5, the response areas for the cutting force component Fx are evaluated depending on the thickness of the material to be removed. From the evaluated data, it can be concluded that the parameter ae has the most significant influence on the given cutting force component Fx, namely 32.56%.
From the above data, the response surface equation can be reformulated:
In
Table 6, the response surfaces for the cutting force component Fy are evaluated as a function of the thickness of the measured material.
Table 7 evaluates the response surfaces for the cutting force component Fz depending on the thickness of the material to be removed. The parameter ae exhibited the most significant influence, reaching up to 35%. Additionally, the combination of parameters ap and ae had an influence exceeding 22%.
Table 8 evaluates the response surfaces for the resultant cutting force component F to the thickness of the material to be removed.
3.2. Evaluation of Selected Roughness Parameters
Table 9 shows selected surface roughness parameters that were evaluated at the center of each machined groove. Experimentally evaluated parameters include Ra (mean arithmetic deviation of the profile), Rz (maximum height of the profile protrusion), and Rsk (coefficient of asymmetry of the profile), which reflect the functional properties of the surface.
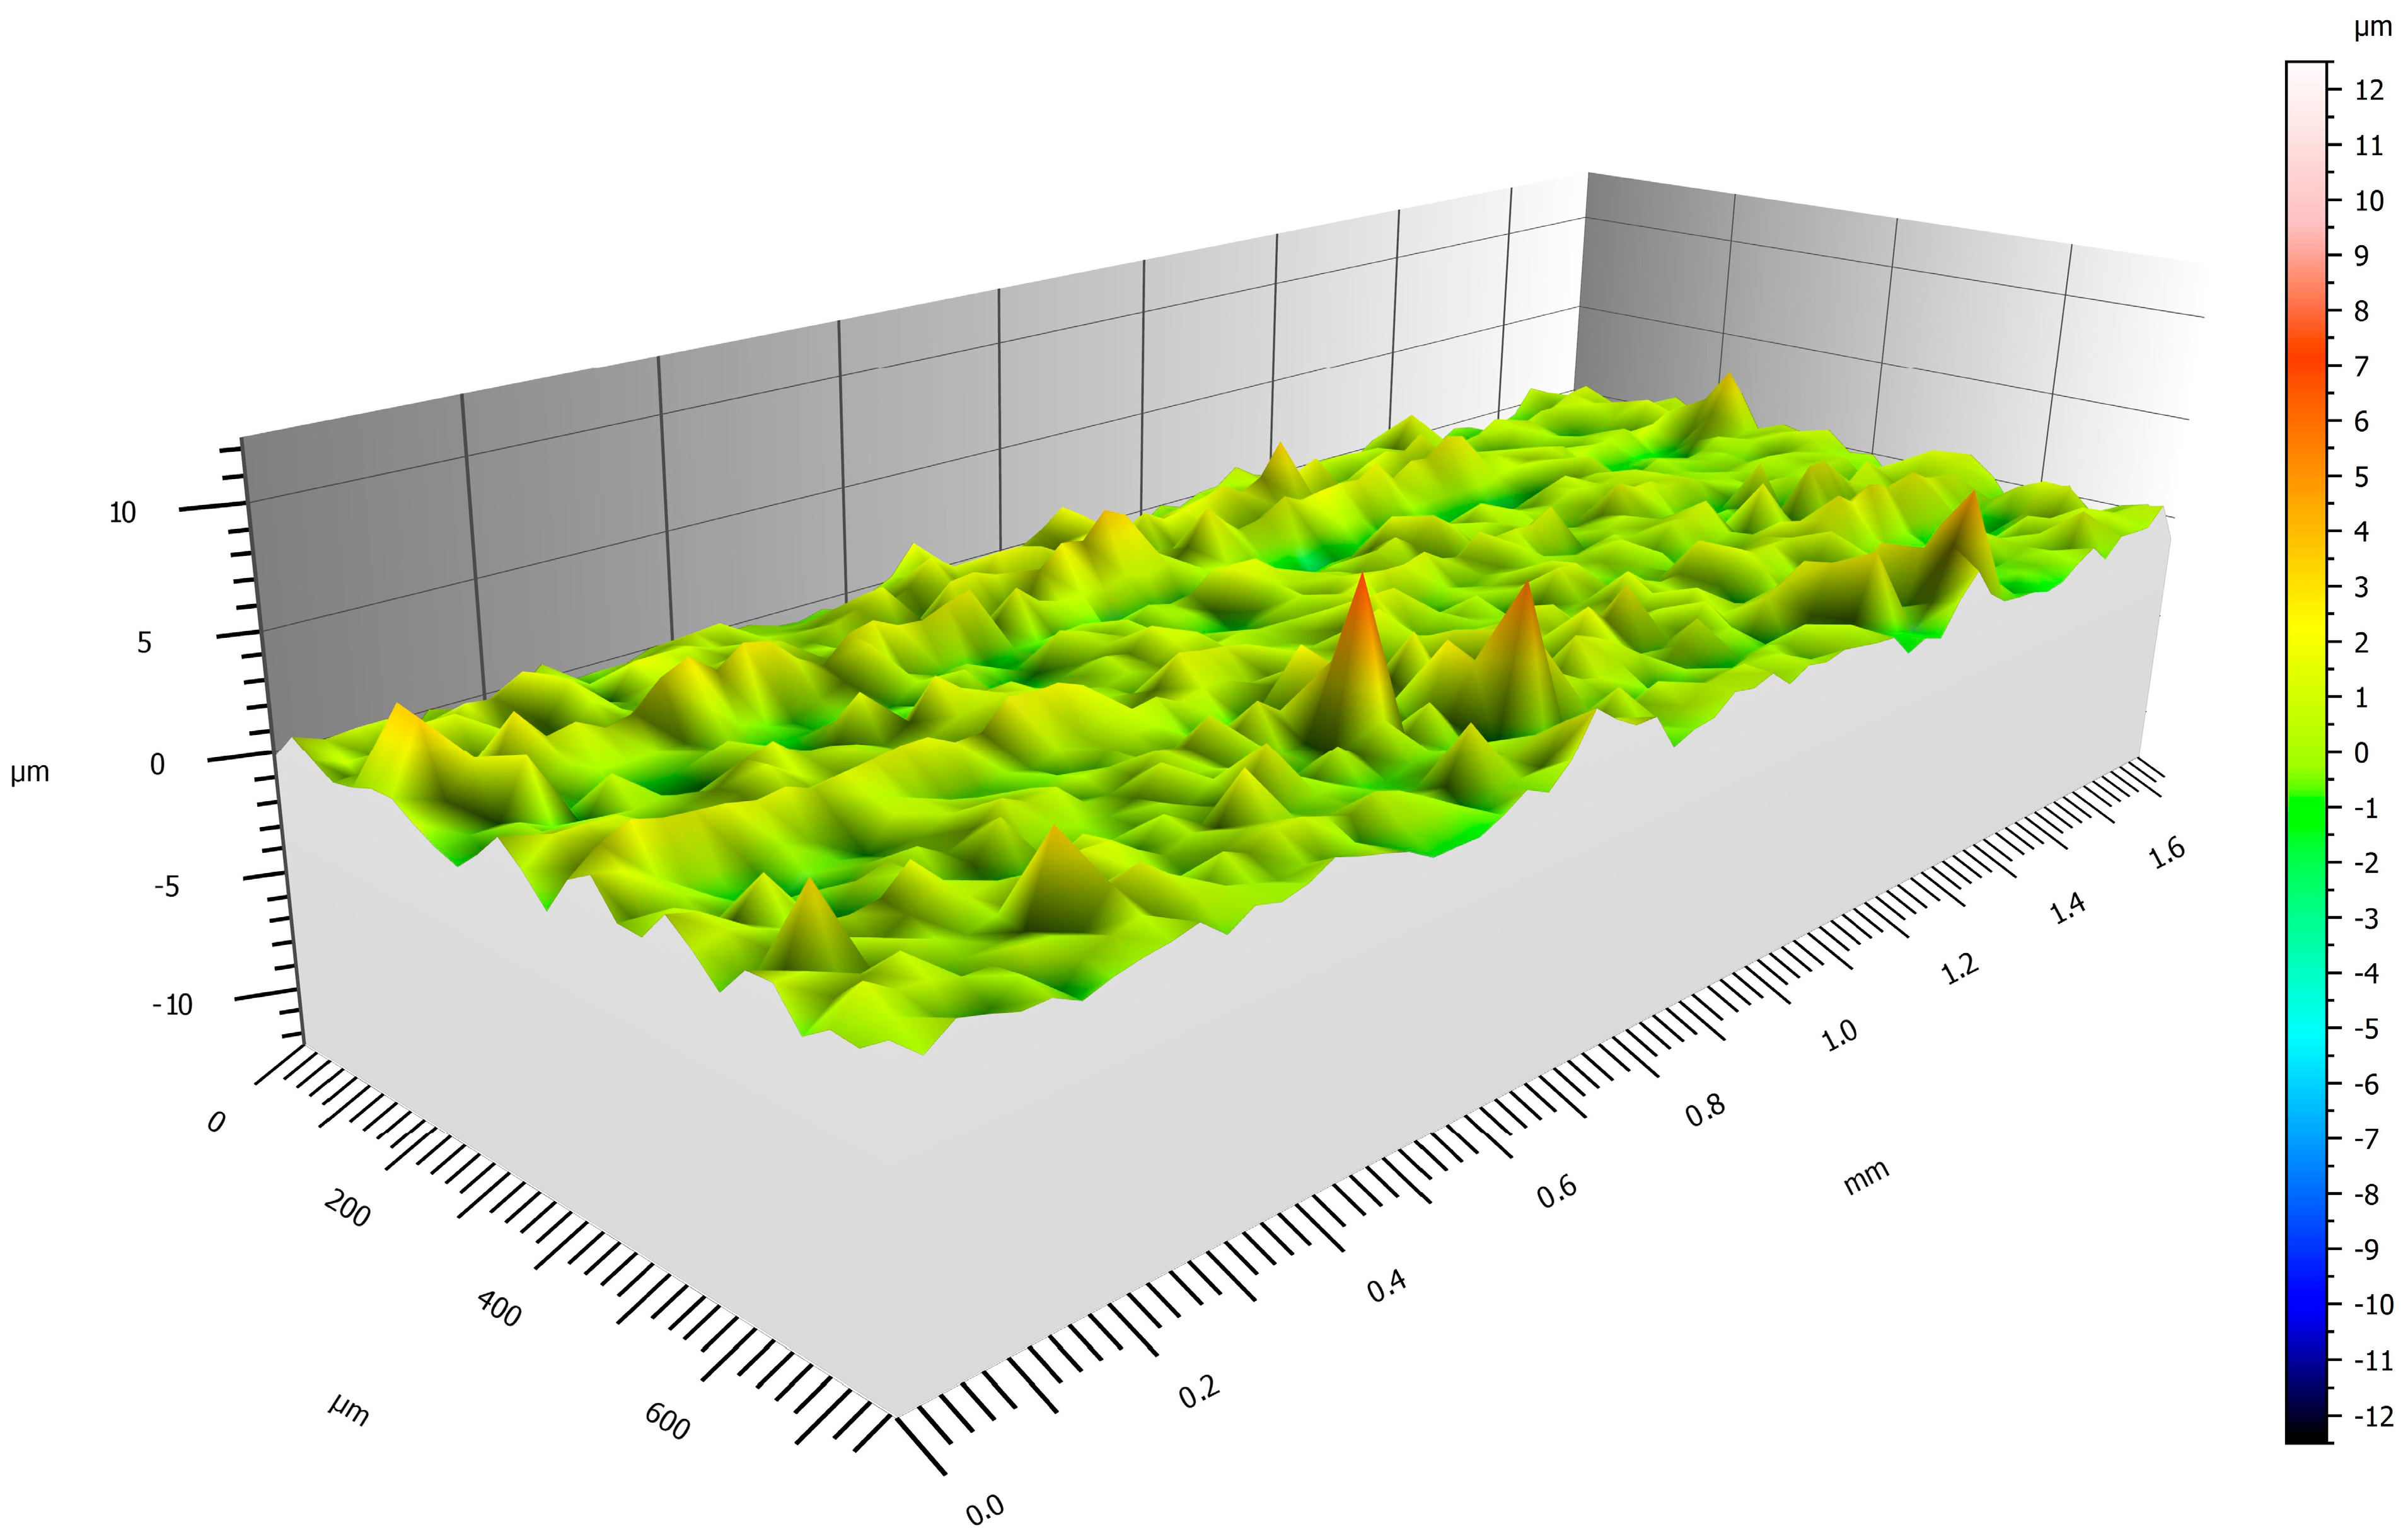
Table 9 shows the measured values of the surface roughness parameters, which indicate the differences between the protrusions and depressions. Observing the measured values, it is evident that the groove in Experiment 4 (ε = 90°, a
p = 7.5 mm, a
e = 0.1 mm) exhibits the lowest roughness values, while the groove in Experiment 11 (ε = 90°, a
p = 4.5 mm, a
e = 1 mm) displays the highest values. Based on the measured results, it can be concluded that the chosen mean depth and the maximum cut width have notable influences on the quality of the machined surface.
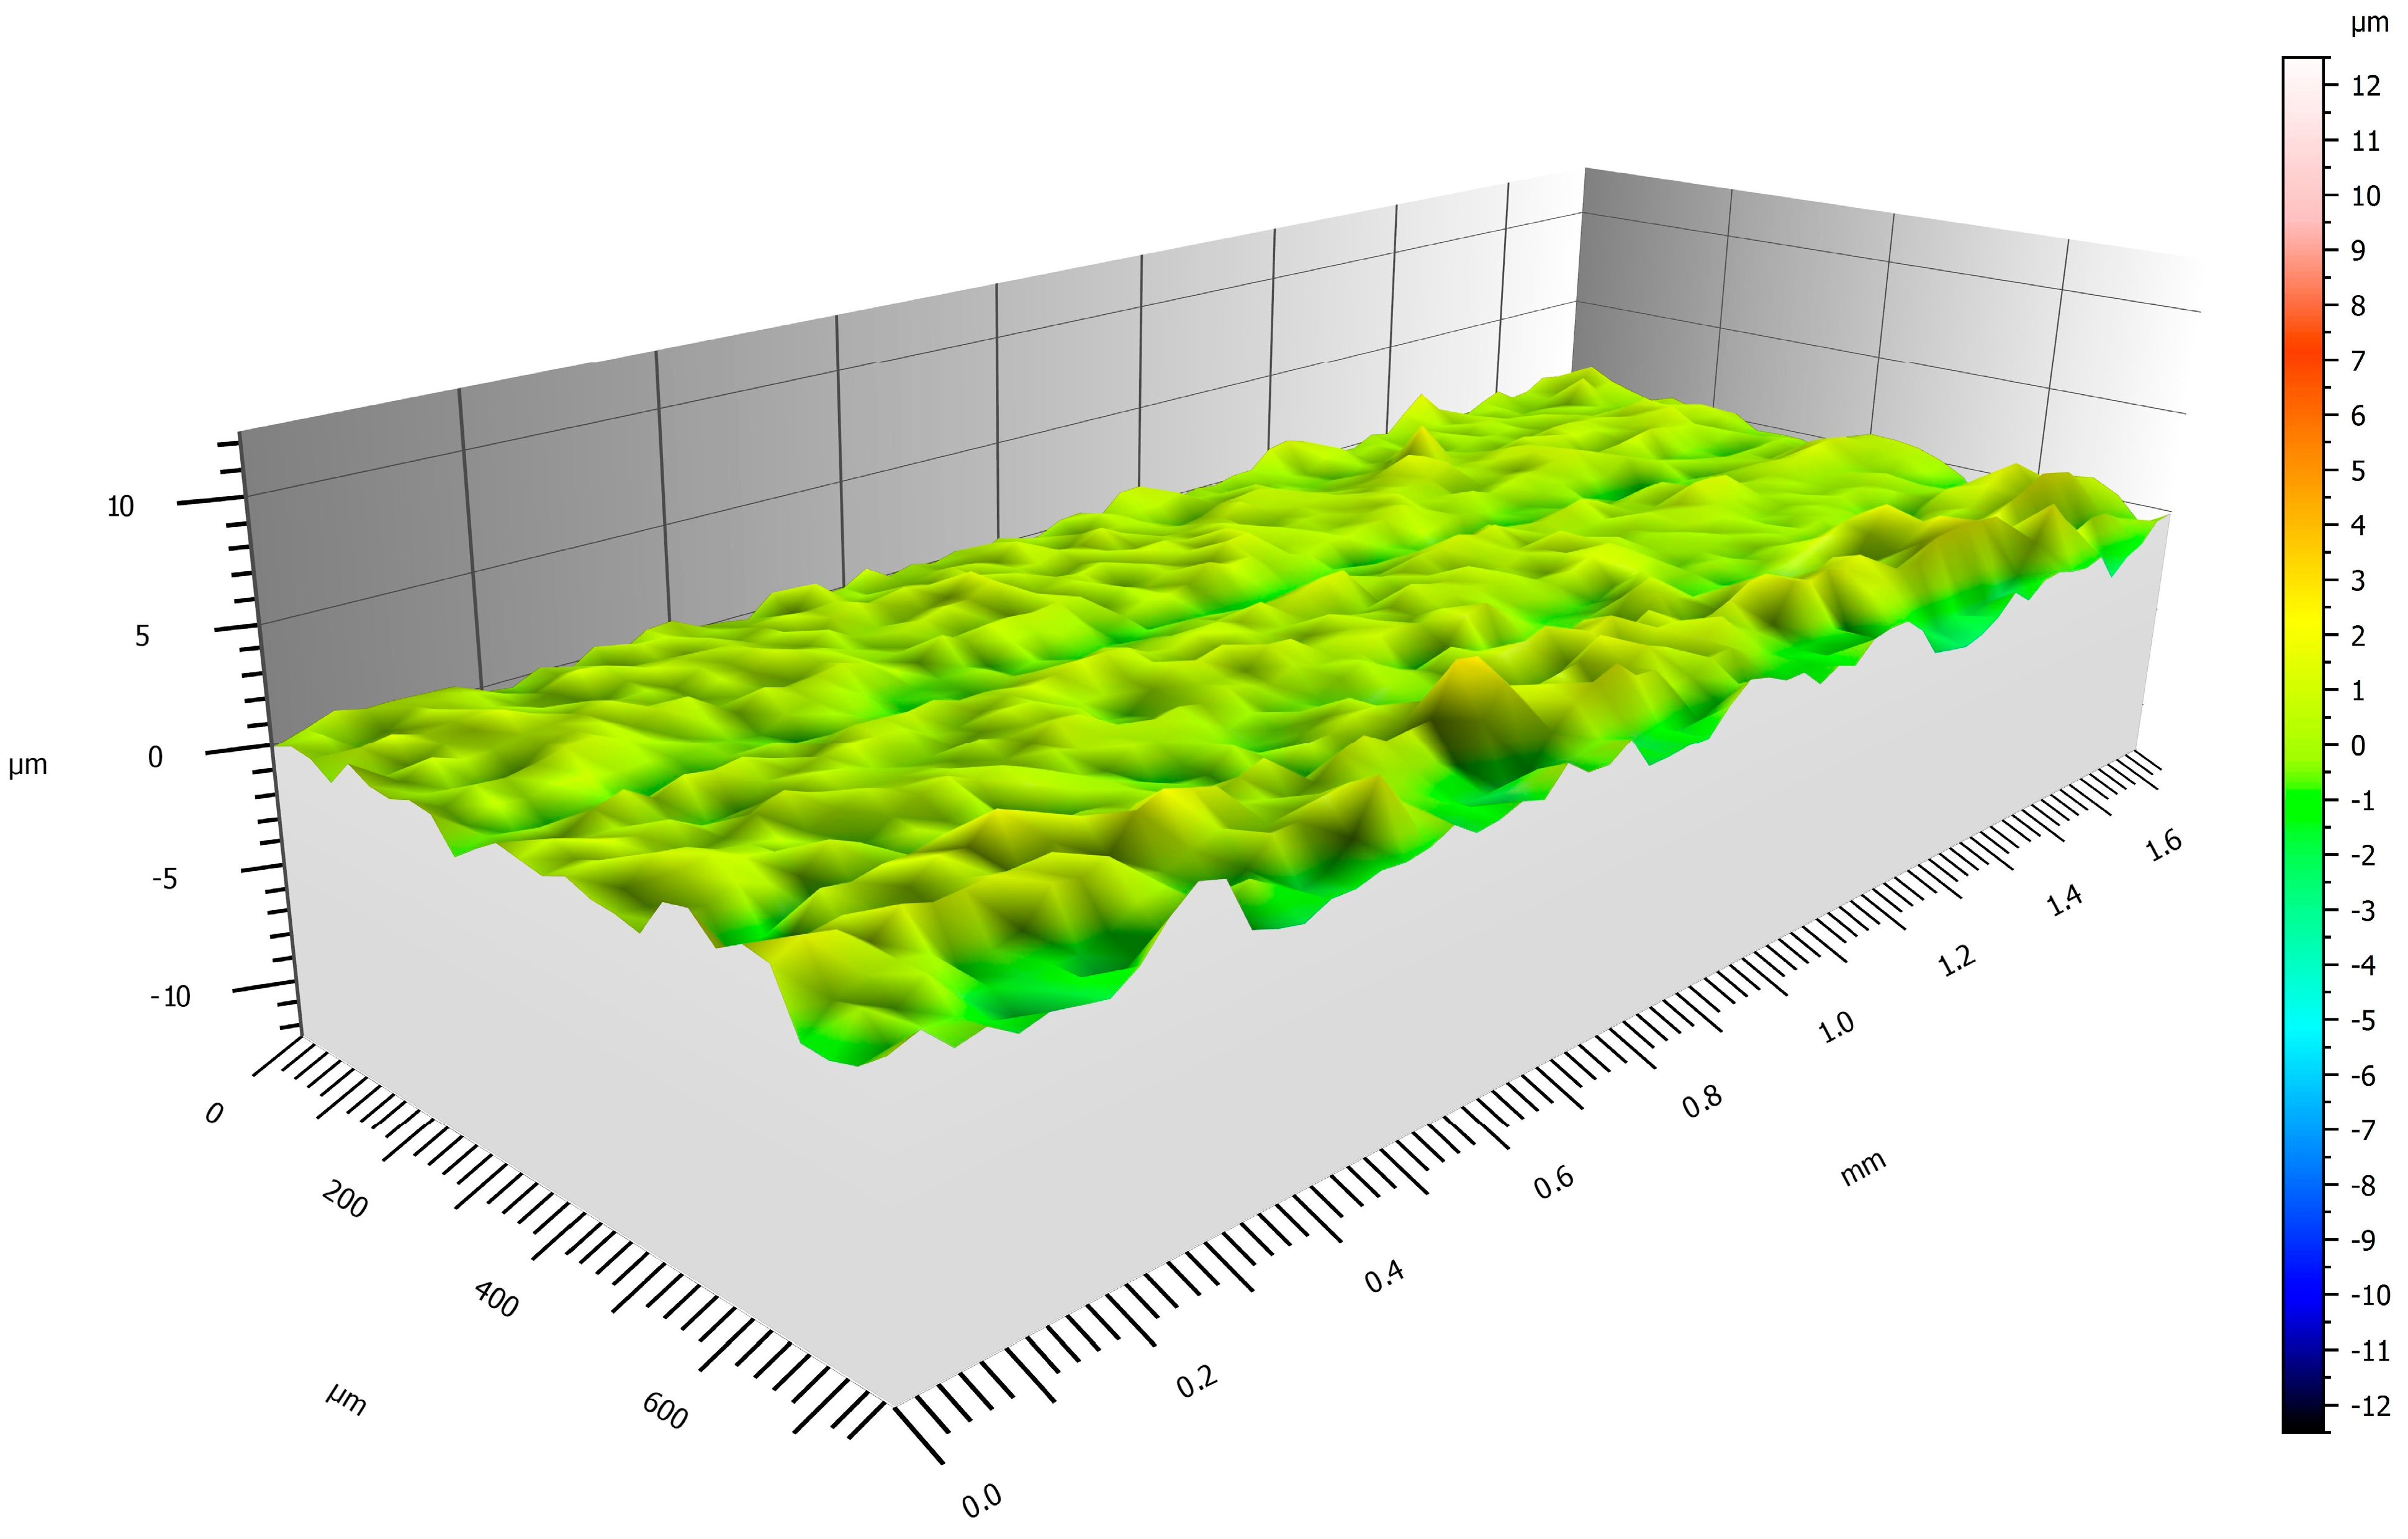
This fact is confirmed by the values of the S parameters (Sa, Sz, Ssk). The lowest values, also suitable for a functional surface, are in Experiment 4. In surface roughness evaluation, it is also important to observe the Ssk and Sk parameters, whose comprehensive evaluation shows how the finished functional surface can resist wear. In this case, negative values for the Ssk parameter and higher values for the Sk parameter are appropriate.
The figures below depict a graphical representation of the best (
Figure 10) and worst (
Figure 11) machined grooves, with achieved values ranging from 4 to −2 µm from the center line of the profile.
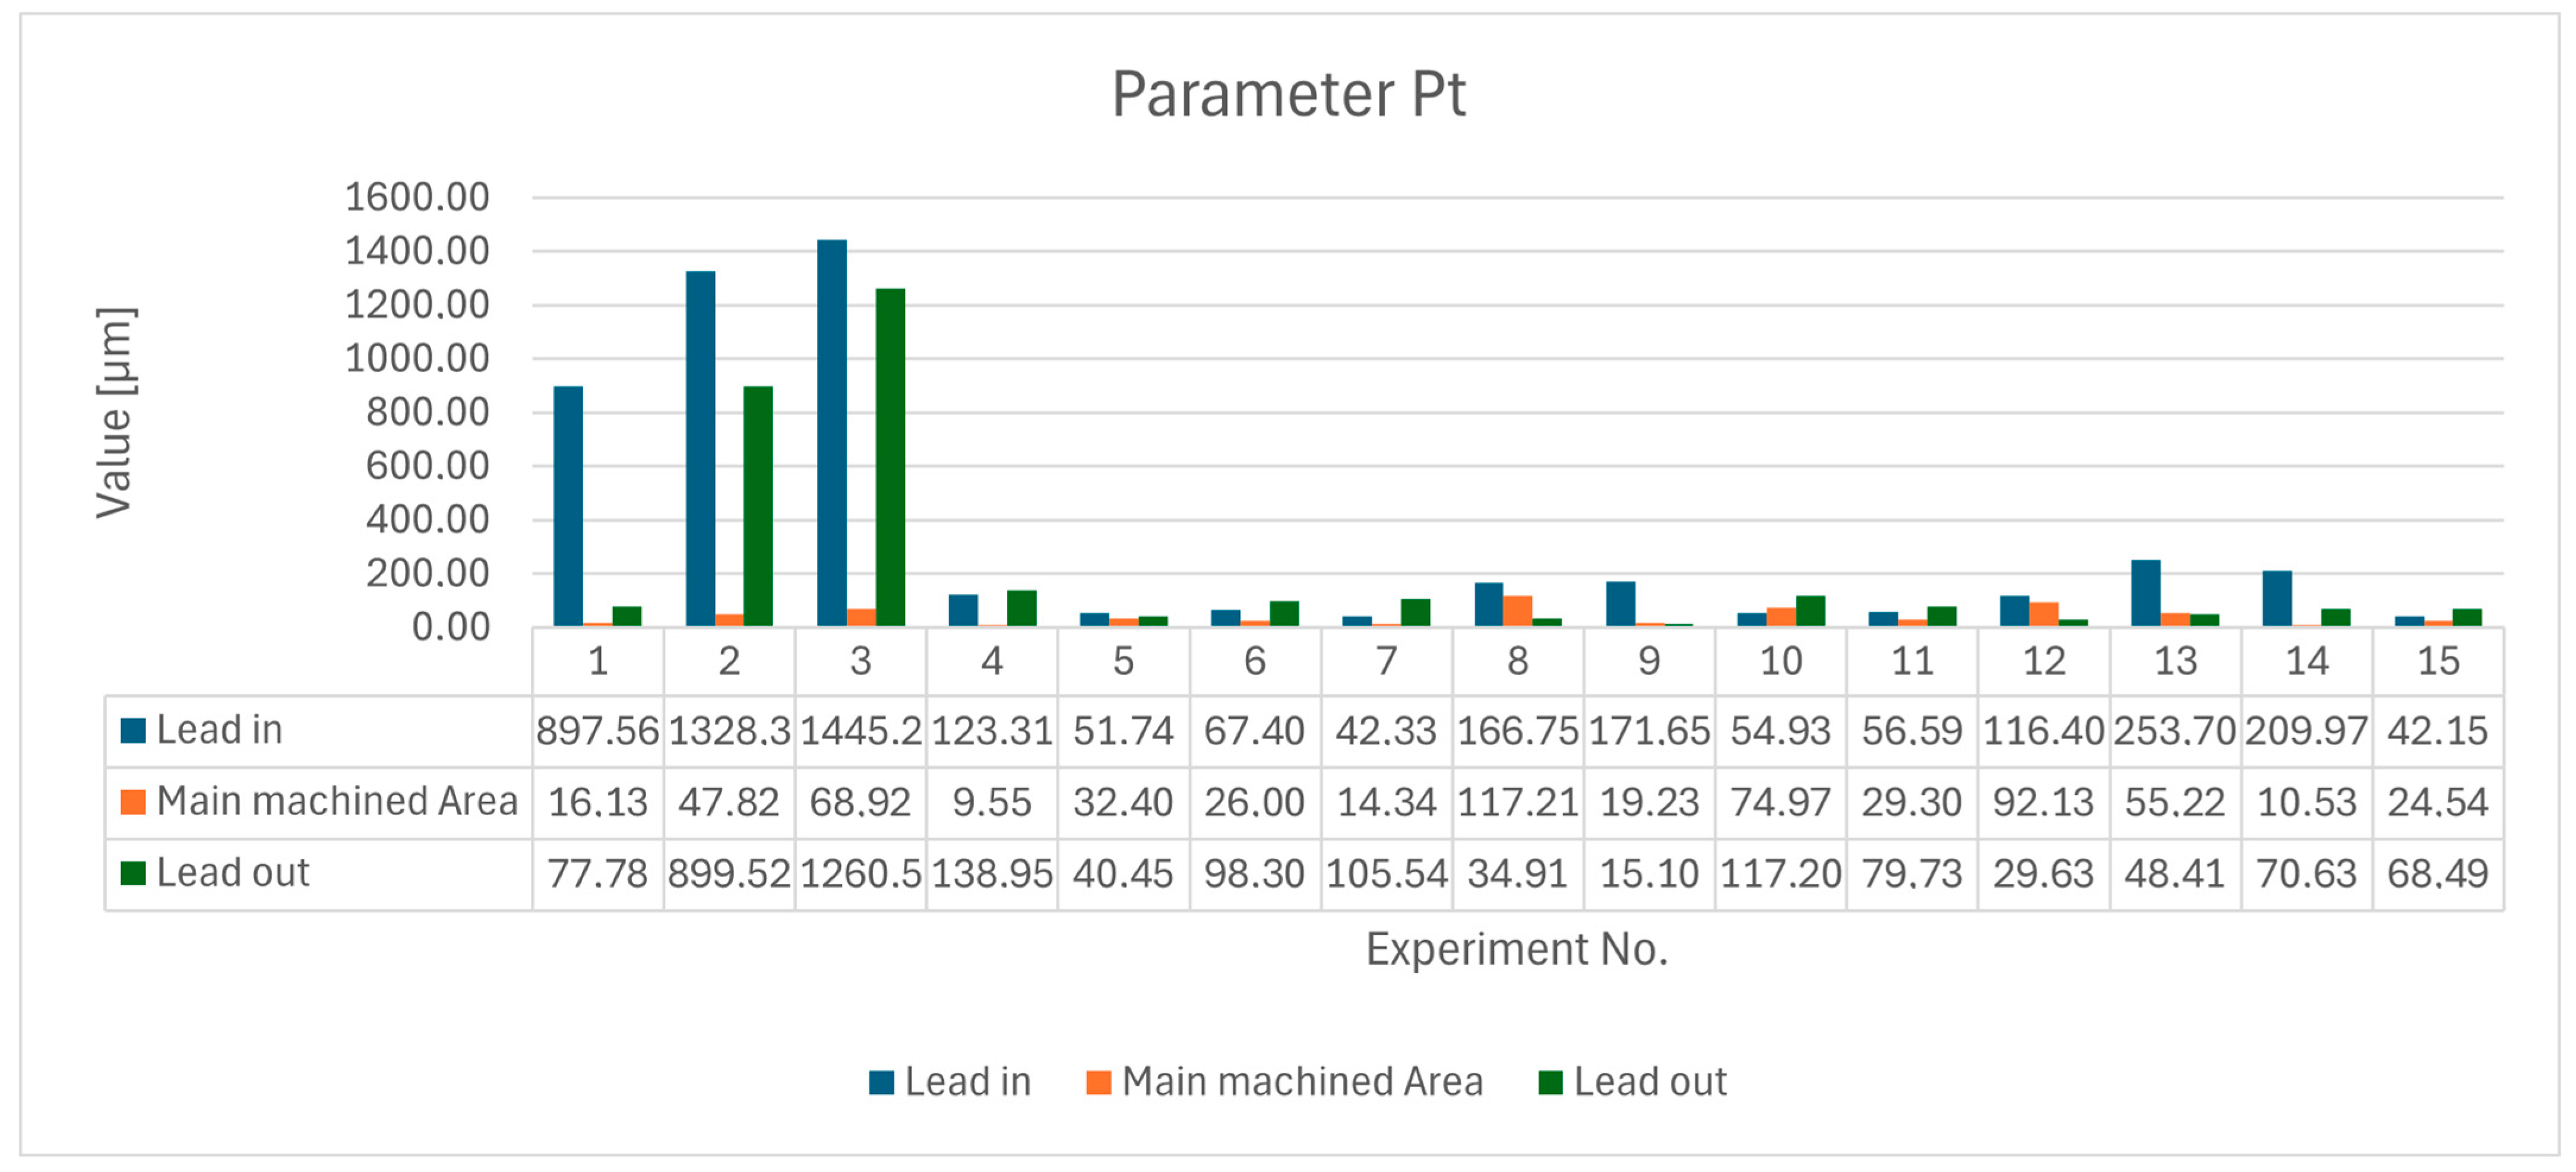
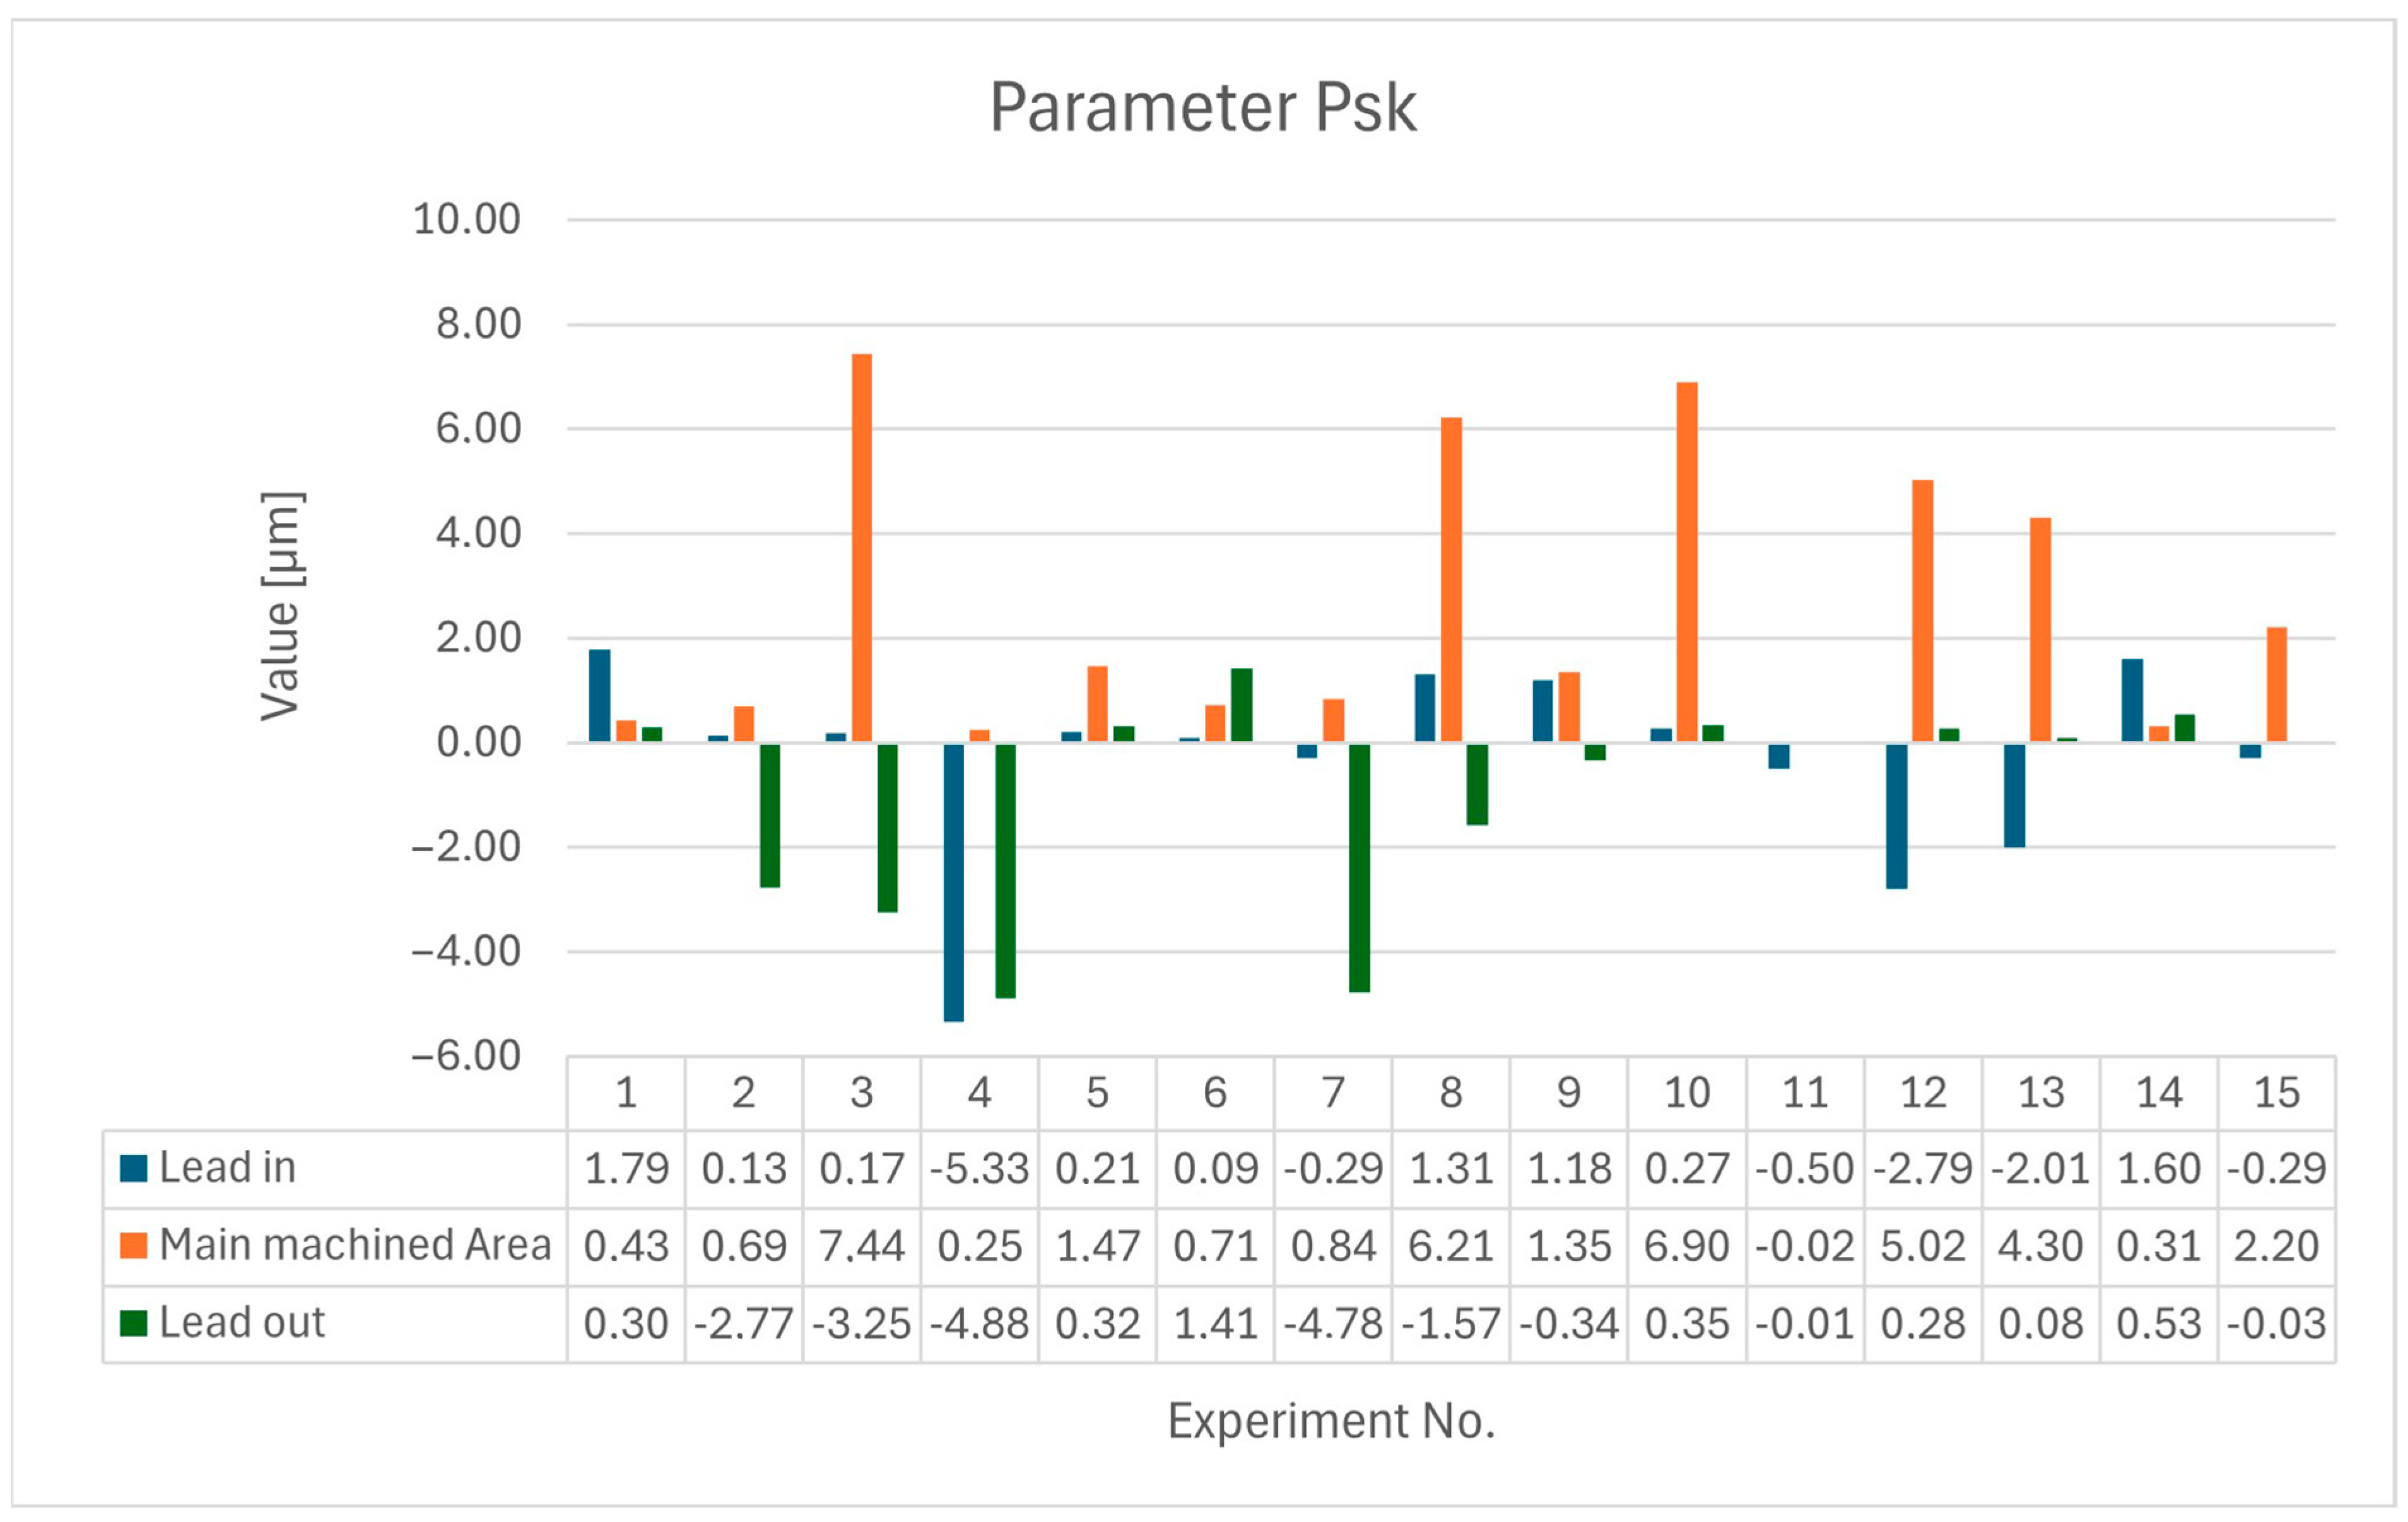
Other evaluated surface integrity parameters include profile parameters, which help determine tool deviation during machining and its influence on the final quality of the machined surface. Two selected profile parameters, Pt and Psk, were considered. The Pt parameter (total profile height [μm]) represents the sum of the height of the highest profile protrusion and the depth of the lowest profile depression within the evaluated length range. The Psk parameter represents the slope of the evaluated profile.
Figure 12 and
Figure 13 illustrate the evaluated parameters, Pt and Psk, in the three investigated areas.
The highest recorded values of the Pt profile parameter were measured for samples 2 (ε = 40°, ap = 4.5 mm, ae = 1 mm) and 3 (ε = 40°, ap = 1.5 mm, ae = 1 mm). It can be observed that the highest parameters are captured during the tool run-in into the material itself. The lowest measured values are recorded for samples 7 (ε = 5°, ap = 7.5 mm, ae = 0.1 mm) and 15 (ε = 90°, ap = 7.5 mm, ae = 2 mm), which may be related to the tool not heating up and softening the material. Consequently, the material was subsequently removed more easily, resulting in reduced values of the profile parameter for the machined area.
4. Discussion
A monolithic ceramic cutter was analyzed for its application in HFM machining of nickel alloy Monel 400.
Based on previous measurements [
3], the constant cutting conditions of tool movement (cutting speed and feed) were determined, and the conditions affecting the volume of removed material (depth of cut and width of cut) were analyzed.
The results obtained from the measurement of cutting forces were statistically analyzed for the main machining area using a response surface method and ANOVA analysis. The calculated dependencies show more than 90% accuracy for the individual components and for the total resultant force.
From general experience of cutting ceramics applications, we know that direct tool approach into the cut (lead-in motion) is not suitable, but angled approach is recommended. However, for the analyzed tool and cutting material, this statement is not unequivocal, as can be seen from the individual values for the selected range of conditions.
Although straight-line machining is involved, the complex influence of the individual parameters can be seen from the results obtained and, thus, the Fx component is not only most influenced by the cutting width, but also by the combination with cutting depth and feed fz. A similar influence was also found for the Fy and Fz components.
For the main machining area, the effects of tool deflection due to the resistance of the work material and the roughness of the machined surface were further analyzed.
Here it can be seen that it is more suitable for the milling tool when it removes larger amounts of material, at which point there is a thermal effect on the work material to the extent that it softens, thus reducing its mechanical properties and decreasing its resistance.
Investigating the tool load is also important for tool life, but the mechanical properties of the cutting material vs. the total cutting force, the rigidity of the clamping, the machine, and the overall system in which the machining is carried out must also be taken into account. This is a limiting factor in the further investigation and application of a monolithic ceramic tool.
In the evaluation of roughness parameters, profile and surface parameter were analyzed. Of these, the monitoring of Rz and Rsk parameters are of strategic importance for surface evaluation. Due to the thermal influence (and uncontrolled cooling) after passing the tool, it is not possible to see the dependence. However, the values range from 7 to almost 30 µm. Lower roughness values were obtained when combining a larger depth of cut with smaller cutting width than when these combinations were small (e.g., Exp. 4, 9, etc.) Similar findings can be found by taking a closer look at the surface roughness parameters, particularly the Sk parameter, whose values for a potentially functional surface are better precisely for those conditions where a higher depth of cut is combined with a smaller lateral runout.
Based on the analyzed data, the monolithic ceramic tool in Monel 400 machining has potential in terms of the quality indicators of the machined surface achieved. If the material did not produce cutting resistance, it would be unsuitable for this tool.
Considering the results obtained, it can be concluded that the tool has the potential for roughing operations based on high feeds and speeds and, at the same time, it is possible to create a final functional surface with a suitable combination of cutting parameters.
5. Conclusions
The current research analyzes the influence of the parameters ε, ap, and ae in the machining of nickel-copper-based alloy (Monel). A comprehensive understanding of the influence of cutting forces and deformation phenomena in the cutting zone has the potential to positively influence the optimization and intensification of manufacturing processes, particularly in the machining of difficult-to-machine materials.
Research results have shown the following:
The influence of cutting width and depth of cut parameters (ae and ap) on tool load was examined. Statistically, the combination of these parameters had a significant effect. While the ceramic cutter was capable of withstanding the loads, optimal combinations of parameters should be chosen to ensure the cutter is not subjected to extreme loads for enhanced durability. For more in-depth research, simulating the tool loading would be necessary to obtain stresses at the cut, allowing for a comparison with the strength characteristics of the ceramic cutter.
Various types of lead-in angles were chosen and, for some, the primary profile of the machined groove revealed a deficiency in the machine’s travel system. In these cases, the tool deviated beyond the intended path, transitioning from an arc into a linear trajectory. If this were a surface machined to final tolerances, it would result in a production failure. For roughing operations, it is crucial to opt for a larger allowance for additional machining when choosing similar angles of lead-in motions for a milling cutter.
The surface integrity of the machined grooves was evaluated by analyzing the surfaces after each tool pass. The analysis revealed that, among the selected values for depth and width of cut, the intermediate values led to higher roughness compared to the highest selected cutting conditions. This phenomenon can be attributed to the properties of the ceramic monolithic cutter which, due to its characteristics, induced sufficient heating of the material, making it easier to cut using the cutting edges of the tool.
The above results for the Pt and Psk profile parameters show that the tool removes material more easily under sufficient load compared to lower load caused by reduced cutting parameters.
The measured and evaluated data can serve as a foundation for further research in the field of high-feed milling, especially for the simulation of the effects of cutting parameters on the resulting surface quality, or other phenomena occurring during or after machining. Research also contributes to practical applications, providing a mathematical description for calculating cutting force that can assist practitioners in determining the anticipated forces during the milling process.
For an exact determination of the influence of the magnitude of the cutting forces, it will also be necessary to investigate the stiffness of the system in which the machining is carried out, i.e., the properties of the cutting material, the stiffness of the clamping, and the stiffness of the machine. Thus, with this finding, it will be possible to know how much machine tool power will be required for machining.
Author Contributions
Conceptualization, M.M., P.K. and V.B.; methodology, M.M., P.K. and M.Š.; validation, V.B. and J.H.; investigation, J.H. and M.Š.; data curation, J.H. and R.J.; writing—original draft preparation, M.M., P.K. and V.B.; writing—review and editing, M.Š., M.M., V.B. and P.K.; software, R.J. and P.K.; project administration, M.Š.; visualization, R.J., V.B. and M.M.; funding acquisition, M.Š. All authors have read and agreed to the published version of the manuscript.
Funding
The article was supported by the grant scheme KEGA 017/ŽU-4/2022: “Implementation of digital technologies and simulations into the teaching process of machining technology”, APVV-20-0216: “Research on the implementation of high-impact surface technologies for precision automotive structural components”, APVV-22-0328: “Design of a Methodology and its Verification for the Measurement of Selected Parameters of Ti Implants in the Manufacturing Process”.
Data Availability Statement
The data that support the findings of this study are available from thecorresponding author (M.Š.), upon reasonable request.
Conflicts of Interest
The authors declare no conflict of interest.
References
- Ross, N.S.; Rai, R.; Ananth, M.B.J.; Srinivasan, D.; Ganesh, M.; Gupta, M.K.; Korkmaz, M.E.; Krolczyk, G.M. Carbon emissions and overall sustainability assessment in eco-friendly machining of Monel-400 alloy. Sustain. Mater. Technol. 2023, 37, e00675. [Google Scholar] [CrossRef]
- Pleta, A.; Mears, L. Cutting Force Investigation of Trochoidal Milling in Nickel-based Superalloy. In Procedia Manufacturing; Elsevier: Amsterdam, The Netherlands, 2016; pp. 1348–1356. [Google Scholar] [CrossRef]
- Slabejova, S.; Holubjak, J.; Czánová, T.; Timko, P.; Horák, A.; Prokein, D. Surface Quality of a Groove after Trochoidal Milling with a Monolithic Ceramic Milling Cutter. Manuf. Technol. 2022, 22, 334–341. [Google Scholar] [CrossRef]
- Niaki, F.A.; Pleta, A.; Mears, L. Trochoidal milling: Investigation of a new approach on uncut chip thickness modeling and cutting force simulation in an alternative path planning strategy. Int. J. Adv. Manuf. Technol. 2018, 97, 641–656. [Google Scholar] [CrossRef]
- Amini, S.; Paktinat, H. Ceramic tools with ordinary and wiper inserts in near dry machining with high speed on super alloy monel K500. Mater. Manuf. Process. 2014, 29, 579–584. [Google Scholar] [CrossRef]
- Czan, A.; Sajgalik, M.; Martikan, A.; Mrazik, J. Observation of dynamic processes in cutting zone when machining nickel alloys. Commun.-Sci. Lett. Univ. Žilina 2014, 16, 161–168. [Google Scholar] [CrossRef]
- Sadílek, M.; Kousal, L.; Náprstková, N.; Szotkowski, T.; Hajnyš, J. The analysis of accuracy of machined surfaces and surfaces roughness after 3axis and 5axis milling. Manuf. Technol. 2018, 18, 1015–1022. [Google Scholar] [CrossRef]
- Cep, R.; Kyncl, L.; Malotova, S.; Petru, J.; Zlamal, T.; Czan, A. Testing Ceramics Inserts at Irregular Interrupted Cut on Material 14MoV6. Eng. Rev. 2017, 37, 67–73. [Google Scholar]
- Pasko, R.; Przybylski, L.; Slodki, B. High speed machining (HSM)—The effective way of modern cutting. Eng. Mater. Sci. 2002, 18, 72–79. [Google Scholar]
- Villarrazo, N.; Martínez de Pissón, G.; Fernandez, P.; Pereira, O.; López de Lacalle, L.N. Titanium Blade Milling with Minimum Piece Deformation Based on Tool Orientation. MM Sci. J. 2023. [Google Scholar] [CrossRef]
- Basso, I.; Voigt, R.; Rodrigues, A.R.; Marin, F.; de Souza, A.F.; de Lacalle, L.N.L. Influences of the workpiece material and the tool-surface engagement (TSE) on surface finishing when ball-end milling. J. Manuf. Process. 2022, 75, 219–231. [Google Scholar] [CrossRef]
- Al-Ghamdi, K.A.; Iqbal, A. A sustainability comparison between conventional and high-speed machining. J. Clean. Prod. 2015, 108, 192–206. [Google Scholar] [CrossRef]
- Sanz-Calle, M.; Munoa, J.; Morelli, L.; Iglesias, A.; de Lacalle, L.N.L.; Dombovari, Z. On the effect of radial engagement on the milling stability of modes perpendicular to the feed direction. CIRP J. Manuf. Sci. Technol. 2024, 49, 111–127. [Google Scholar] [CrossRef]
- Wang, Z.; Rahman, M. High-Speed Machining. Ref. Modul. Mater. Sci. Mater. Eng. 2014, 11, 221–253. [Google Scholar]
- Schulz, H.; Moriwaki, T. High-speed machining. CIRP Ann. 1992, 41, 637–643. [Google Scholar] [CrossRef]
- Pérez-Salinas, C.F.; Del Olmo, A.; López de Lacalle, L.N. Estimation of drag finishing abrasive effect for cutting edge preparation in broaching tool. Materials 2022, 15, 5135. [Google Scholar] [CrossRef] [PubMed]
- Mishra, S.K.; Gómez Escudero, G.; González-Barrio, H.; Calleja-Ochoa, A.; Pereira Neto, O.; Norberto López de Lacalle Marcaide, L. Wear mechanisms and cutting performance of coated carbides in milling LPBF IN718 alloy under hybrid cryogenic conditions. Mach. Sci. Technol. 2024, 28, 187–214. [Google Scholar] [CrossRef]
- Fang, X.D.; Dufour, J.L.; Wills, D.J. Double-Sided Cutting Inserts for High Feed Milling. U.S. Patent No. 7,976,250. U.S. Patent and Trademark Office: Washington, DC, USA, 11 July 2011. [Google Scholar]
- Jiang, Y.; Yang, X.; Tian, H.; Ma, L.; Li, L.; Yang, Y. Investigation on the high feed milling of M28. Eur. PMC 2023, preprint. [Google Scholar] [CrossRef]
- Pérez, J.D.; Fernandez, P.; Del Olmo, A.; De Lacalle, L.L. Deep hole finishing of Inconel 718 SLMed features by endmilling and reaming. In IOP Conference Series: Materials Science and Engineering; IOP Publishing: Bristol, UK, 2021; Volume 1193, p. 012006. [Google Scholar]
- Xu, J.; Rong, B.; Zhang, H.Z.; Wang, D.S.; Li, L. Investigation of cutting force in high feed milling of Ti6Al4V. In Materials Science Forum; Trans Tech Publications Ltd.: Zurich, Switzerland, 2014; pp. 106–109. [Google Scholar] [CrossRef]
- Bergs, T.; Richter, V.; Ottersbach, M.; Pötschke, J.; Hochmuth, C.; Busch, K. Tool technologies for milling of hardmetals and ceramics. Procedia CIRP 2016, 46, 299–302. [Google Scholar] [CrossRef]
- Petrů, J.; Drábek, L.; Hajnyš, J.; Jurok, D.; Pagáč, M.; Měsíček, J. Experimental investigation of cutting forces in high-feed milling of titanium alloy. Adv. Sci. Technol. Res. J. 2020, 14, 89–95. [Google Scholar] [CrossRef]
- Fernández-Lucio, P.; Pereira Neto, O.; Gómez-Escudero, G.; Amigo Fuertes, F.J.; Fernández Valdivielso, A.; López de Lacalle Marcaide, L.N. Roughing milling with ceramic tools in comparison with sintered carbide on nick-el-based alloys. Coatings 2021, 11, 734. [Google Scholar] [CrossRef]
- Dhananchezian, M.; Rajkumar, K. Cutting velocity influenced machinability of Monel 400 by coated tool. Mater. Manuf. Process. 2023, 38, 116–125. [Google Scholar] [CrossRef]
- Wang, B.; Liu, Z. Cutting performance of solid ceramic end milling tools in machining hardened AISI H13 steel. Int. J. Refract. Met. Hard Mater. 2016, 55, 24–32. [Google Scholar] [CrossRef]
- Yan, X.; Dong, S.; Li, X.; Zhao, Z.; Dong, S.; An, L. Optimization of Machining Parameters for Milling Zirconia Ceramics by Polycrystalline Diamond Tool. Materials 2021, 15, 208. [Google Scholar] [CrossRef] [PubMed]
- Celaya, A.; Pereira, O.; González, H.; Gómez-Escudero, G.; Fernández-Lucio, P.; Fernández-Valdivielso, A.; de Lacalle, L.N. Influence of cutting edge radius on tool life in milling Inconel 718. In AIP Conference Proceedings; AIP Publishing: Melville, NY, USA, 2019; Volume 2113, No. 1. [Google Scholar]
- Coelho, R.T.; De Souza, A.F.; Roger, A.R.; Rigatti, A.M.Y.; De Lima Ribeiro, A.A. Mechanistic approach to predict real machining time for milling free-form geometries applying high feed rate. Int. J. Adv. Manuf. Technol. 2010, 46, 1103–1111. [Google Scholar] [CrossRef]
- Duplák, J.; Hatala, M.; Dupláková, D.; Steranka, J. Evaluation of time efficiency of high feed milling. TEM J. 2018, 7, 13–18. [Google Scholar] [CrossRef]
- Sventickas, D.; Juzėnas, K. Research of Quality in the Case of High Feed Milling. Mechanika 2012, 18, 298. [Google Scholar]
- Pérez-Salinas, C.F.; Fernández-Lucio, P.; del Olmo, A.; Aldekoa-Gallarza, I.; de Lacalle, L.N.L. The influence of cutting edge microgeometry on the broaching of Inconel 718 slots. Eng. Sci. Technol. Int. J. 2023, 48, 101563. [Google Scholar] [CrossRef]
- Hutyrová, Z.; Makiela, W.; Michalik, P.; Mital, D.; Radchenko, S.; Duplak, J.; Czan, A. Creation of mathematical prescription of residual stress depending on various cutting conditions. Key Eng. Mater. 2016, 669, 126–133. [Google Scholar] [CrossRef]
- Zhao, P.; Cheng, K.; Jiang, B.; Zuo, L. Development of the innovative differential tool wear modeling for high-feed milling and its experimental verification. Proc. Inst. Mech. Eng. Part B J. Eng. Manuf. 2021, 235, 85–97. [Google Scholar] [CrossRef]
- Li, X.; Liu, X.; Yue, C. Tool failure mechanisms and cutting performance analysis during high-feed milling of 508-III steel. Int. J. Adv. Manuf. Technol. 2023, 128, 3921–3936. [Google Scholar] [CrossRef]
- Sun, H.; Xiao, H.; Li, L. Experimental study on cutting force and cutting power in high feed milling of Ti5Al5Mo5VCrFe. In Materials Science Forum; Trans Tech Publications Ltd.: Zurich, Switzerland, 2016; pp. 88–93. [Google Scholar] [CrossRef]
- Zauskova, L.; Czan, A.; Sajgalik, M.; Drbul, M.; Rysava, Z. Triaxial Measurement of Residual Stress after High Feed Milling Using X-ray Diffraction. In Procedia Engineering; Elsevier: Amsterdam, The Netherlands, 2017; pp. 982–987. [Google Scholar] [CrossRef]
- Sajgalik, M.; Czan, A.; Drbul, M.; Danis, I.; Miklos, M.; Babik, O.; Joch, R. Identification of Technological Parameters when Machining Ni-Alloys by Monolithic Ceramic Milling Tool. Procedia Manuf. 2017, 14, 51–57. [Google Scholar] [CrossRef]
- Shoemaker, L.E.; Smith, G.D. Nickel: A Century of Innovation Overview. In A Century of Monel Metal: 1906–2006; Springer: Berlin/Heidelberg, Germany, 2006. [Google Scholar]
- Ross, N.S.; Ganesh, M.; Srinivasan, D.; Gupta, M.K.; Korkmaz, M.E.; Krolczyk, J.B. Role of sustainable cooling/lubrication conditions in improving the tribological and machining characteristics of Monel-400 alloy. Tribol. Int. 2022, 176, 107880. [Google Scholar] [CrossRef]
- Shihan, M.; Chandradass, J.; Kannan, T.T.M. Investigation of vibration analysis during end milling process of monel alloy. In Materials Today: Proceedings; Elsevier: Amsterdam, The Netherlands, 2020; pp. 695–699. [Google Scholar] [CrossRef]
- Shihan, M.; Chandradass, J.; Kannan, T.T.M.; Sivagami, S.M. Machining feasibility and sustainability study on end milling process of Monel alloy. In Materials Today: Proceedings; Elsevier: Amsterdam, The Netherlands, 2020; pp. 7162–7165. [Google Scholar] [CrossRef]
- Monel® 400: Uses, Composition, Properties. Available online: https://www.xometry.com/resources/materials/monel-400/ (accessed on 1 April 2024).
- Liu, D.; Zhang, Y.; Luo, M.; Zhang, D. Investigation of tool wear and chip morphology in dry trochoidal milling of titanium alloy Ti-6Al-4V. Materials 2019, 12, 1937. [Google Scholar] [CrossRef] [PubMed]
- de Lacalle, L.N.L.; Lamikiz, A.; Sánchez, J.A.; de Bustos, I.F. Simultaneous measurement of forces and machine tool position for diagnostic of machining tests. IEEE Trans. Instrum. Meas. 2005, 54, 2329–2335. [Google Scholar]
- Surface texture ISO Standards: Geometrical product specifications (GPS). Available online: https://www.iso.org/standard/42896.html/ (accessed on 20 April 2024).
Figure 1.
Ceramic shank milling cutter.
Figure 1.
Ceramic shank milling cutter.
Figure 2.
Detail of individual areas of the machined surface.
Figure 2.
Detail of individual areas of the machined surface.
Figure 3.
Time record of cutting force components for Experiment 1.
Figure 3.
Time record of cutting force components for Experiment 1.
Figure 4.
Experiment 1—cutting force components at lead in.
Figure 4.
Experiment 1—cutting force components at lead in.
Figure 5.
Graph of cutting force components (Fx, Fy, Fz) measured at lead in.
Figure 5.
Graph of cutting force components (Fx, Fy, Fz) measured at lead in.
Figure 6.
Experiment 1—cutting force components (main machined area).
Figure 6.
Experiment 1—cutting force components (main machined area).
Figure 7.
Graph of cutting force components (Fx, Fy, Fz) measured at main machined area.
Figure 7.
Graph of cutting force components (Fx, Fy, Fz) measured at main machined area.
Figure 8.
Experiment 1—cutting force components (lead out).
Figure 8.
Experiment 1—cutting force components (lead out).
Figure 9.
Graph of cutting force components (Fx, Fy, Fz) measured at lead out.
Figure 9.
Graph of cutting force components (Fx, Fy, Fz) measured at lead out.
Figure 10.
Surface roughness of Experiment 4.
Figure 10.
Surface roughness of Experiment 4.
Figure 11.
Surface roughness of Experiment 11.
Figure 11.
Surface roughness of Experiment 11.
Figure 12.
Graphical evaluation and measured values of the profile parameter Pt.
Figure 12.
Graphical evaluation and measured values of the profile parameter Pt.
Figure 13.
Graphical evaluation and measured values of the profile parameter Psk.
Figure 13.
Graphical evaluation and measured values of the profile parameter Psk.
Table 1.
Chemical composition of Monel material [
43].
Table 1.
Chemical composition of Monel material [
43].
| Element | C | Cu | Fe | Mn | Ni | S | Si |
|---|
| % of Weight | Max. 0.3 | 28–34 | Max. 2.5 | Max. 2 | Min. 63 | Max. 0.024 | Max. 0.5 |
Table 2.
Properties of the selected tool material.
Table 2.
Properties of the selected tool material.
| Properties | Value |
|---|
| Density | 6 g·cm−3 |
| Flexural Strength | 1300 MPa |
| Compressive Strength | 3000 MPa |
| Modulus of Elasticity | 205 GPa |
| Fracture Toughness | 12 MPa·m1/2 |
| Weibull Modulus | 25 |
| Vickers Hardness | 1150 HV 0.5 |
| Thermal Conductivity | <2 W/mK |
| Thermal Shock Resistance | 280 ΔT °C |
| Maximum Operating Temperature | Up to 1700 °C |
Table 3.
Parameters of the experiments.
Table 3.
Parameters of the experiments.
| Exp. No. | Lead-In Angle ε [°] | Depth of Cut ap [mm] | Cutting Width ae [mm] |
|---|
| 1 | 40 | 7.5 | 1 |
| 2 | 40 | 4.5 | 1 |
| 3 | 40 | 1.5 | 1 |
| 4 | 90 | 7.5 | 0.1 |
| 5 | 40 | 4.5 | 0.1 |
| 6 | 90 | 1.5 | 0.1 |
| 7 | 5 | 7.5 | 0.1 |
| 8 | 5 | 7.5 | 1 |
| 9 | 5 | 1.5 | 0.1 |
| 10 | 5 | 7.5 | 2 |
| 11 | 90 | 4.5 | 1 |
| 12 | 5 | 1.5 | 2 |
| 13 | 40 | 4.5 | 2 |
| 14 | 90 | 1.5 | 2 |
| 15 | 90 | 7.5 | 2 |
Table 4.
Table of main cutting forces.
Table 4.
Table of main cutting forces.
Experiment
No. | F [N] | F-max [N] | F-min [N] | Fx [N] | Fy [N] | Fz [N] |
|---|
| 1 | 907 | 1225 | −1005 | 510.8 | 672.0 | 332.3 |
| 2 | 1007 | 1537 | −1053 | 404.5 | 816.3 | 428.5 |
| 3 | 317 | 403 | −388 | 125.1 | 288.1 | 45.5 |
| 4 | 210 | 251 | −108 | 60.9 | 200.1 | 20.7 |
| 5 | 88 | 98 | −96 | 38.4 | 78.3 | 14.4 |
| 6 | 91 | 113 | −42 | 36.0 | 82.1 | 16.2 |
| 7 | 309 | 361 | −243 | 28.9 | 299.3 | 73.3 |
| 8 | 735 | 1146 | −809 | 217.0 | 652.0 | 260.6 |
| 9 | 97 | 149 | −79 | 43.8 | 76.2 | 40.4 |
| 10 | 2824 | 3196 | −3046 | 1219.3 | 1514.6 | 2048.2 |
| 11 | 1212 | 1892 | −1567 | 573.5 | 945.8 | 494.8 |
| 12 | 432 | 502 | −541 | 159.9 | 400.2 | 34.4 |
| 13 | 1823 | 2034 | 1672 | 773.7 | 1563.3 | 529.4 |
| 14 | 578 | 660 | −1231 | 366.2 | 439.3 | 85.9 |
| 15 | 2323.4 | 2815 | −2944 | 1134.7 | 1910 | 680.1 |
Table 5.
Analysis of variance, cutting force component Fx.
Table 5.
Analysis of variance, cutting force component Fx.
| Source | DF | Seq SS | Contribution | Adj SS | Adj MS | F-Value | p-Value |
|---|
| Model | 9 | 782,065 | 94.16% | 782,065 | 86,896 | 8.95 | 0.013 |
| Linear | 3 | 501,911 | 60.43% | 504,381 | 168,127 | 17.32 | 0.005 |
| ε | 1 | 121,849 | 14.67% | 109,160 | 109,160 | 11.25 | 0.020 |
| ap | 1 | 109,637 | 13.20% | 116,058 | 116,058 | 11.96 | 0.018 |
| ae | 1 | 270,425 | 32.56% | 279,324 | 279,324 | 28.78 | 0.003 |
| Square | 3 | 47,241 | 5.69% | 47,633 | 15,878 | 1.64 | 0.294 |
| ε * ε | 1 | 40,090 | 4.83% | 25,057 | 25,057 | 2.58 | 0.169 |
| ap * ap | 1 | 193 | 0.02% | 1439 | 1439 | 0.15 | 0.716 |
| ae * ae | 1 | 6958 | 0.84% | 7067 | 7067 | 0.73 | 0.432 |
| 2-Way Interaction | 3 | 232,913 | 28.04% | 232,913 | 77,638 | 8.00 | 0.024 |
| ε * ap | 1 | 26,697 | 3.21% | 26,520 | 26,520 | 2.73 | 0.159 |
| ε * ae | 1 | 120,805 | 14.54% | 120,805 | 120,805 | 12.45 | 0.017 |
| ap * ae | 1 | 85,411 | 10.28% | 85,411 | 85,411 | 8.80 | 0.031 |
| Error | 5 | 48,530 | 5.84% | 48,530 | 9706 | | |
| Total | 14 | 830,595 | 100.00% | | | | |
Table 6.
Analysis of variance, cutting force components Fy.
Table 6.
Analysis of variance, cutting force components Fy.
| Source | DF | Seq SS | Contribution | Adj SS | Adj MS | F-Value | p-Value |
|---|
| Model | 9 | 4,085,285 | 91.45% | 4,085,285 | 453,921 | 5.94 | 0.032 |
| Linear | 3 | 2,729,480 | 61.10% | 2,749,932 | 916,644 | 11.99 | 0.010 |
| ε | 1 | 325,608 | 7.29% | 268,528 | 268,528 | 3.51 | 0.120 |
| ap | 1 | 919,701 | 20.59% | 961,112 | 961,112 | 12.58 | 0.016 |
| ae | 1 | 1,484,171 | 33.22% | 1,520,881 | 1,520,881 | 19.90 | 0.007 |
| Square | 3 | 359,030 | 8.04% | 360,030 | 120,010 | 1.57 | 0.307 |
| ε * ε | 1 | 272,840 | 6.11% | 359,207 | 359,207 | 4.70 | 0.082 |
| ap * ap | 1 | 62,605 | 1.40% | 38,776 | 38,776 | 0.51 | 0.508 |
| ae * ae | 1 | 23,585 | 0.53% | 23,342 | 23,342 | 0.31 | 0.604 |
| 2-Way Interaction | 3 | 996,776 | 22.31% | 996,776 | 332,259 | 4.35 | 0.074 |
| ε * ap | 1 | 97,180 | 2.18% | 96,203 | 96,203 | 1.26 | 0.313 |
| ε *ae | 1 | 180,609 | 4.04% | 180,609 | 180,609 | 2.36 | 0.185 |
| ap * ae | 1 | 718,987 | 16.09% | 718,987 | 718,987 | 9.41 | 0.028 |
| Error | 5 | 382,116 | 8.55% | 382,116 | 76,423 | | |
| Total | 14 | 4,467,401 | 100.00% | | | | |
Table 7.
Analysis of variance, cutting force components Fz.
Table 7.
Analysis of variance, cutting force components Fz.
| Source | DF | Seq SS | Contribution | Adj SS | Adj MS | F-Value | p-Value |
|---|
| Model | 9 | 436,381 | 91.46% | 436,381 | 48,487 | 5.95 | 0.032 |
| Linear | 3 | 276,246 | 57.90% | 277,741 | 92,580 | 11.37 | 0.011 |
| ε | 1 | 7597 | 1.59% | 4639 | 4639 | 0.57 | 0.484 |
| ap | 1 | 99,695 | 20.90% | 103,353 | 103,353 | 12.69 | 0.016 |
| ae | 1 | 168,954 | 35.41% | 169,775 | 169,775 | 20.84 | 0.006 |
| Square | 3 | 37,095 | 7.77% | 37,163 | 12,388 | 1.52 | 0.318 |
| ε * ε | 1 | 36,392 | 7.63% | 24,498 | 24,498 | 3.01 | 0.143 |
| ap * ap | 1 | 673 | 0.14% | 533 | 533 | 0.07 | 0.808 |
| ae * ae | 1 | 29 | 0.01% | 31 | 31 | 0.00 | 0.953 |
| 2-Way Interaction | 3 | 123,040 | 25.79% | 123,040 | 41,013 | 5.03 | 0.057 |
| ε * ap | 1 | 2997 | 0.63% | 2930 | 2930 | 0.36 | 0.575 |
| ε * ae | 1 | 11,193 | 2.35% | 11,193 | 11,193 | 1.37 | 0.294 |
| ap * ae | 1 | 108,851 | 22.81% | 108,851 | 108,851 | 13.36 | 0.015 |
| Error | 5 | 40,730 | 8.54% | 40,730 | 8146 | | |
| Total | 14 | 477,112 | 100.00% | | | | |
Table 8.
Analysis of the variance of the components of the main cutting force F.
Table 8.
Analysis of the variance of the components of the main cutting force F.
| Source | DF | Seq SS | Contribution | Adj SS | Adj MS | F-Value | p-Value |
|---|
| Model | 9 | 5,235,558 | 92.51% | 5,235,558 | 581,729 | 6.86 | 0.024 |
| Linear | 3 | 3,512,075 | 62.05% | 3,533,242 | 1,177,747 | 13.89 | 0.007 |
| ε | 1 | 446,638 | 7.89% | 370,968 | 370,968 | 4.37 | 0.091 |
| ap | 1 | 1,112,352 | 19.65% | 1,162,722 | 1,162,722 | 13.71 | 0.014 |
| ae | 1 | 1,953,085 | 34.51% | 2,000,346 | 2,000,346 | 23.58 | 0.005 |
| Square | 3 | 416,947 | 7.37% | 418,419 | 139,473 | 1.64 | 0.292 |
| ε * ε | 1 | 354,637 | 6.27% | 410,688 | 410,688 | 4.84 | 0.079 |
| ap * ap | 1 | 51,603 | 0.91% | 35,874 | 35,874 | 0.42 | 0.544 |
| ae * ae | 1 | 10,707 | 0.19% | 10,500 | 10,500 | 0.12 | 0.739 |
| 2-Way Interaction | 3 | 1,306,536 | 23.09% | 1,306,536 | 435,512 | 5.13 | 0.055 |
| ε * ap | 1 | 116,540 | 2.06% | 115,344 | 115,344 | 1.36 | 0.296 |
| ε * ae | 1 | 289,851 | 5.12% | 289,851 | 289,851 | 3.42 | 0.124 |
| ap * ae | 1 | 900,145 | 15.90% | 900,145 | 900,145 | 10.61 | 0.023 |
| Error | 5 | 424,105 | 7.49% | 424,105 | 84,821 | | |
| Total | 14 | 5,659,663 | 100.00% | | | | |
Table 9.
Selected roughness parameters evaluated in main machined area.
Table 9.
Selected roughness parameters evaluated in main machined area.
| | Ra | Rz | Rsk | Sa | Sz | Ssk | Sk |
|---|
| 1 | 1.4497 | 9.2737 | 0.5923 | 1.1551 | 14.0479 | 0.14 | 3.6737 |
| 2 | 1.2409 | 25.1472 | 4.9632 | 1.187 | 47.6408 | 38.8312 | 3.1229 |
| 3 | 1.0415 | 21.2771 | 17.5367 | 2.429 | 15.568 | 0.9086 | 2.4041 |
| 4 | 0.3817 | 2.8415 | 0.108 | 0.772 | 7.0324 | −0.2279 | 5.4895 |
| 5 | 2.3463 | 14.9459 | 0.8798 | 1.2538 | 12.6133 | 0.1535 | 3.9568 |
| 6 | 2.169 | 14.5686 | 0.6212 | 1.1193 | 9.3672 | 0.5707 | 3.3635 |
| 7 | 1.5844 | 10.783 | 0.7652 | 2.7416 | 85.1976 | 4.2762 | 6.1556 |
| 8 | 1.2722 | 10.277 | 0.9127 | 0.958 | 31.3855 | 4.875 | 2.7171 |
| 9 | 1.2839 | 10.3912 | 1.512 | 2.8012 | 18.8719 | −0.5918 | 5.5765 |
| 10 | 1.0575 | 27.5016 | 11.188 | 1.1513 | 11.8957 | −0.5168 | 3.6158 |
| 11 | 3.0399 | 13.7116 | −0.1687 | 0.987 | 13.5914 | −1.2508 | 5.9787 |
| 12 | 1.0051 | 28.8122 | 16.3805 | 3.1331 | 19.0188 | 0.8488 | 3.0534 |
| 13 | 1.7533 | 24.0926 | 4.5198 | 0.8926 | 10.5989 | 0.1193 | 2.5424 |
| 14 | 1.2071 | 7.339 | 0.4984 | 1.5433 | 17.9368 | 0.6277 | 4.7652 |
| 15 | 1.2666 | 16.1819 | 3.3996 | 0.8138 | 14.4555 | 2.5978 | 2.6281 |
| Disclaimer/Publisher’s Note: The statements, opinions and data contained in all publications are solely those of the individual author(s) and contributor(s) and not of MDPI and/or the editor(s). MDPI and/or the editor(s) disclaim responsibility for any injury to people or property resulting from any ideas, methods, instructions or products referred to in the content. |
© 2024 by the authors. Licensee MDPI, Basel, Switzerland. This article is an open access article distributed under the terms and conditions of the Creative Commons Attribution (CC BY) license (https://creativecommons.org/licenses/by/4.0/).
