1. Introduction
Among additive manufacturing (AM) technologies, stereolithography (SLA) is largely used to fabricate parts with intricate 3D geometry and very accurate features, due to its performance, high speed, resolution, high precision, smooth finishing, low waste, and the affordability of polymers, composites, and ceramics materials, with a fully-digitalized process [
1]. SLA belongs to the family of VAT Photo Polymerization technologies, and it exploits liquid photopolymers, which are polymerized by a laser beam spot that scans and UV-cures the material, layer by layer.
The SLA process with its variants (top-down and bottom-up exposure) is, among other applications, successfully used to fabricate regular/high-ordered lattice 3D microstructures [
2,
3], which are widely exploited in such applications as gas/air and fluids filtration and treatment, energy storage and conversion, sensors, scaffolds to enable and promote in-vitro cell culture, in-vivo tissue-induced regeneration, specialized human tissue substitutions and prosthesis, foams for drug delivery, diagnostic and sensing, and 3D culture platforms for cancer responses to drugs [
4].
Figure 1 shows an inverse opal, a face-centered cubic structure (FCC) typical of photonic crystals and shape memory polymers, fabricated via bottom-up SLA.
These structures are characterized by a sequence of cavities, regularly distributed along the three directions.
A specific challenge is the accurate fabrication of these surface sub-mm textures.
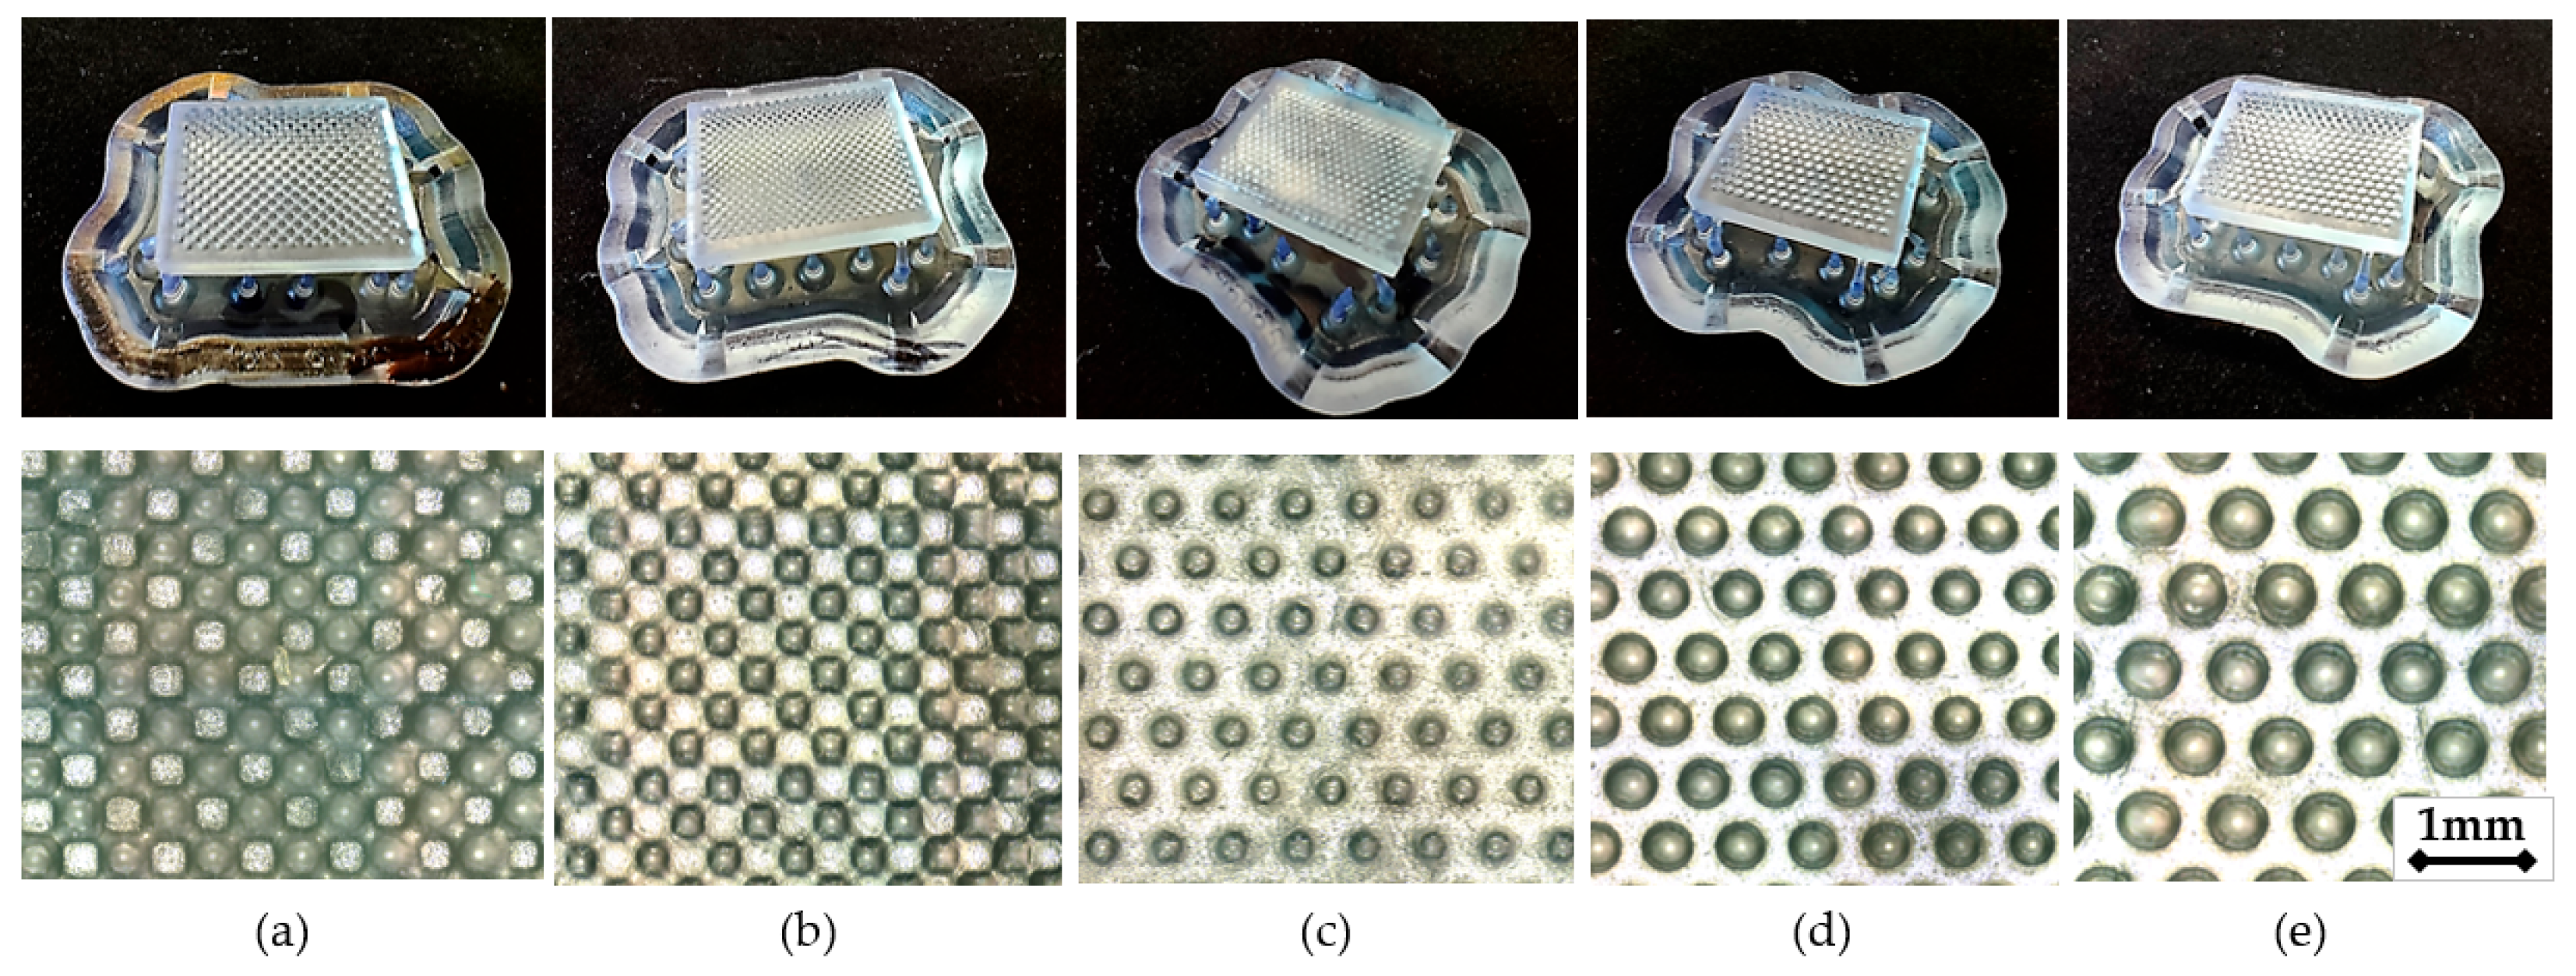
Figure 2 shows hemispherical sub-mm cavities fabricated with different patterns (squared and hexagonal), nominal cavity diameters (D = 600, 800 μm), and pitches (P = 500, 650, 700, 775, 850 μm)
Several studies were conducted with different objectives: development of advanced applications, process parameters optimization, investigation of new materials’ performance and processability, addressing technology issues and process sustainability, and conceiving innovative process chains [
6,
7,
8,
9,
10]. Remarkable achievements were obtained by investigating SLA process parameters aiming at identifying their effects on the 3D-printed part quality: dimensional accuracy, surface finishing, mechanical properties, defects occurrence, etc.
Sabbah A. et al. [
11] found a negligible impact of the layer thickness (LT) on surface finishing. Conversely, it strongly affects the dimensional accuracy of 3D-printed parts due to the higher slicing resolution, which results in more accurate geometry fabrications, especially on freeform surfaces where the step effect of the slicing is proportional to the LT.
The minimum layer thickness of 25 μm resulted in higher precision. Cotabarren, I. et al., confirmed that layer thickness is a critical parameter for part accuracy; measurement deviation was reduced by about 90% when this parameter was reduced from 100 to 25 μm [
12].
Arnold C. et al. [
13] concluded that the surface roughness of 3D-printed parts is firmly dependent on the model orientation in the build volume. The best results were obtained with a 0-degree part orientation (the surface lies horizontally on the build platform) with measured values of Ra = 1.15 ± 0.47 μm along the
X-axis and Ra = 0.90 ± 0.33 μm along the
Y-axis.
Basile V. et al. analyzed the surface finishing and dimensional accuracy of sub-mm textured surfaces of SLA-fabricated molds [
14]. This study compared three part orientations: 15-deg slanted, vertical (90 degrees), and horizontal (0 degrees). The dimensional error on feature diameters of slanted and horizontal orientations were in the ranges of 8–19% and 26–27%, respectively. The error percentages on feature heights were 1–18% and 1%, respectively. Thus, the slanted orientation results in higher precision on feature dimensions. However, the horizontal orientation results in higher geometrical accuracy (feature shapes, i.e., circularity, roundness, and solidity indexes). The best surface finishing was obtained with horizontal orientation, lying on a plane parallel to the build platform, Sa = 0.7–0.9 μm, compared with Sa = 1.5 μm obtained with the slanted.
Shanmugasundaram S. et al. investigated the effects of printing orientation on the part’s mechanical properties, and no significant anisotropy was detected thanks to UV-curing post-processing [
15]. Hada, T. et al. found that the highest dimensional accuracy is achieved by orienting the part with a 45-degree angle on the build platform, followed by a 90-degree orientation. The worst orientation is the 0-degree with the part parallel to the build platform [
16]. These results were also confirmed by other studies [
17,
18].
As it can be noticed, several works focused on the influence of process parameters on the quality of 3D-printed parts, but there is a lack of research studies on the effects of the laser-scanning path and post-processing operations on the feature accuracy, especially at the sub-mm scale.
An original approach was implemented by Wen C. et al. [
19], who investigated the geometric accuracy of microstructures of a Projected SLA, also known as Digital Light Processing (DLP) technology. They identified a compensation method of inaccuracy introduced by the light power intensity distribution. The proposed solution is based on structure optimization using a compensation parameter derived by the simulation results. The sub-mm features design (circles, squares, and triangles) is modified in dimension and shape to increase the dimensional accuracy. This compensation strategy allows the achievement of a mean error reduction from 21–23% down to 1.6–4.8%.
The measurement of geometric accuracy is a crucial topic of this research field. Concerning this aspect and issues related to the methodology analysis of measurement accuracy, recently, many approaches have been proposed in the literature [
20,
21,
22]. Peta K. et al. focused on assessing the precision of measurements applied to surface geometric features. They proved that the accuracy of topographic measurements is important in establishing various types of correlations with surface functionalities and that the accuracy of a measurement depends on its repeatability [
20]. Zhang M. et al. proposed an algorithm to improve the accuracy of surface profile measurement [
21]. The ISO standard definitions and methods of measuring precision, accuracy, and uncertainty should be assumed as references [
22].
In SLA at the sub-mm and micro-scale, other phenomena (i.e., surface tension effects, viscosity, Van der Waals force, capillarity) and inaccuracy sources become more dominant [
23], as summarized in
Table 1.
The washing phase, as a combination of mechanical and chemical actions, is aimed at the removal of liquid resin present on the solid 3D-printed part due to the resin surface tension and viscosity. At the meso- and macro-scale, the solvent (IPA or equivalent such as tripropylene glycol monomethyl ether TPM) can easily remove the resin from the cavities. By reducing the dimensions of the features, particularly for cavities, the effectiveness of washing is reduced because the surface tension becomes higher than the mechanical action of the solvent flow. Other phenomena do not occur (or their effects are negligible) in the pre-processing and post-processing UV-curing but can be critical in the printing and washing phases [
24]. Finally, peeling force can be critical for protrusion features (i.e., micro-pillars) where the laser UV-cured surface is small (microscale), and the peeling stress can result in thin layer breakages [
8].
In the present work, the dimensional accuracy of sub-mm features and structures manufactured via SLA technology was investigated and an experiment-based compensation method was proposed and validated as an extension of a previous preliminary study [
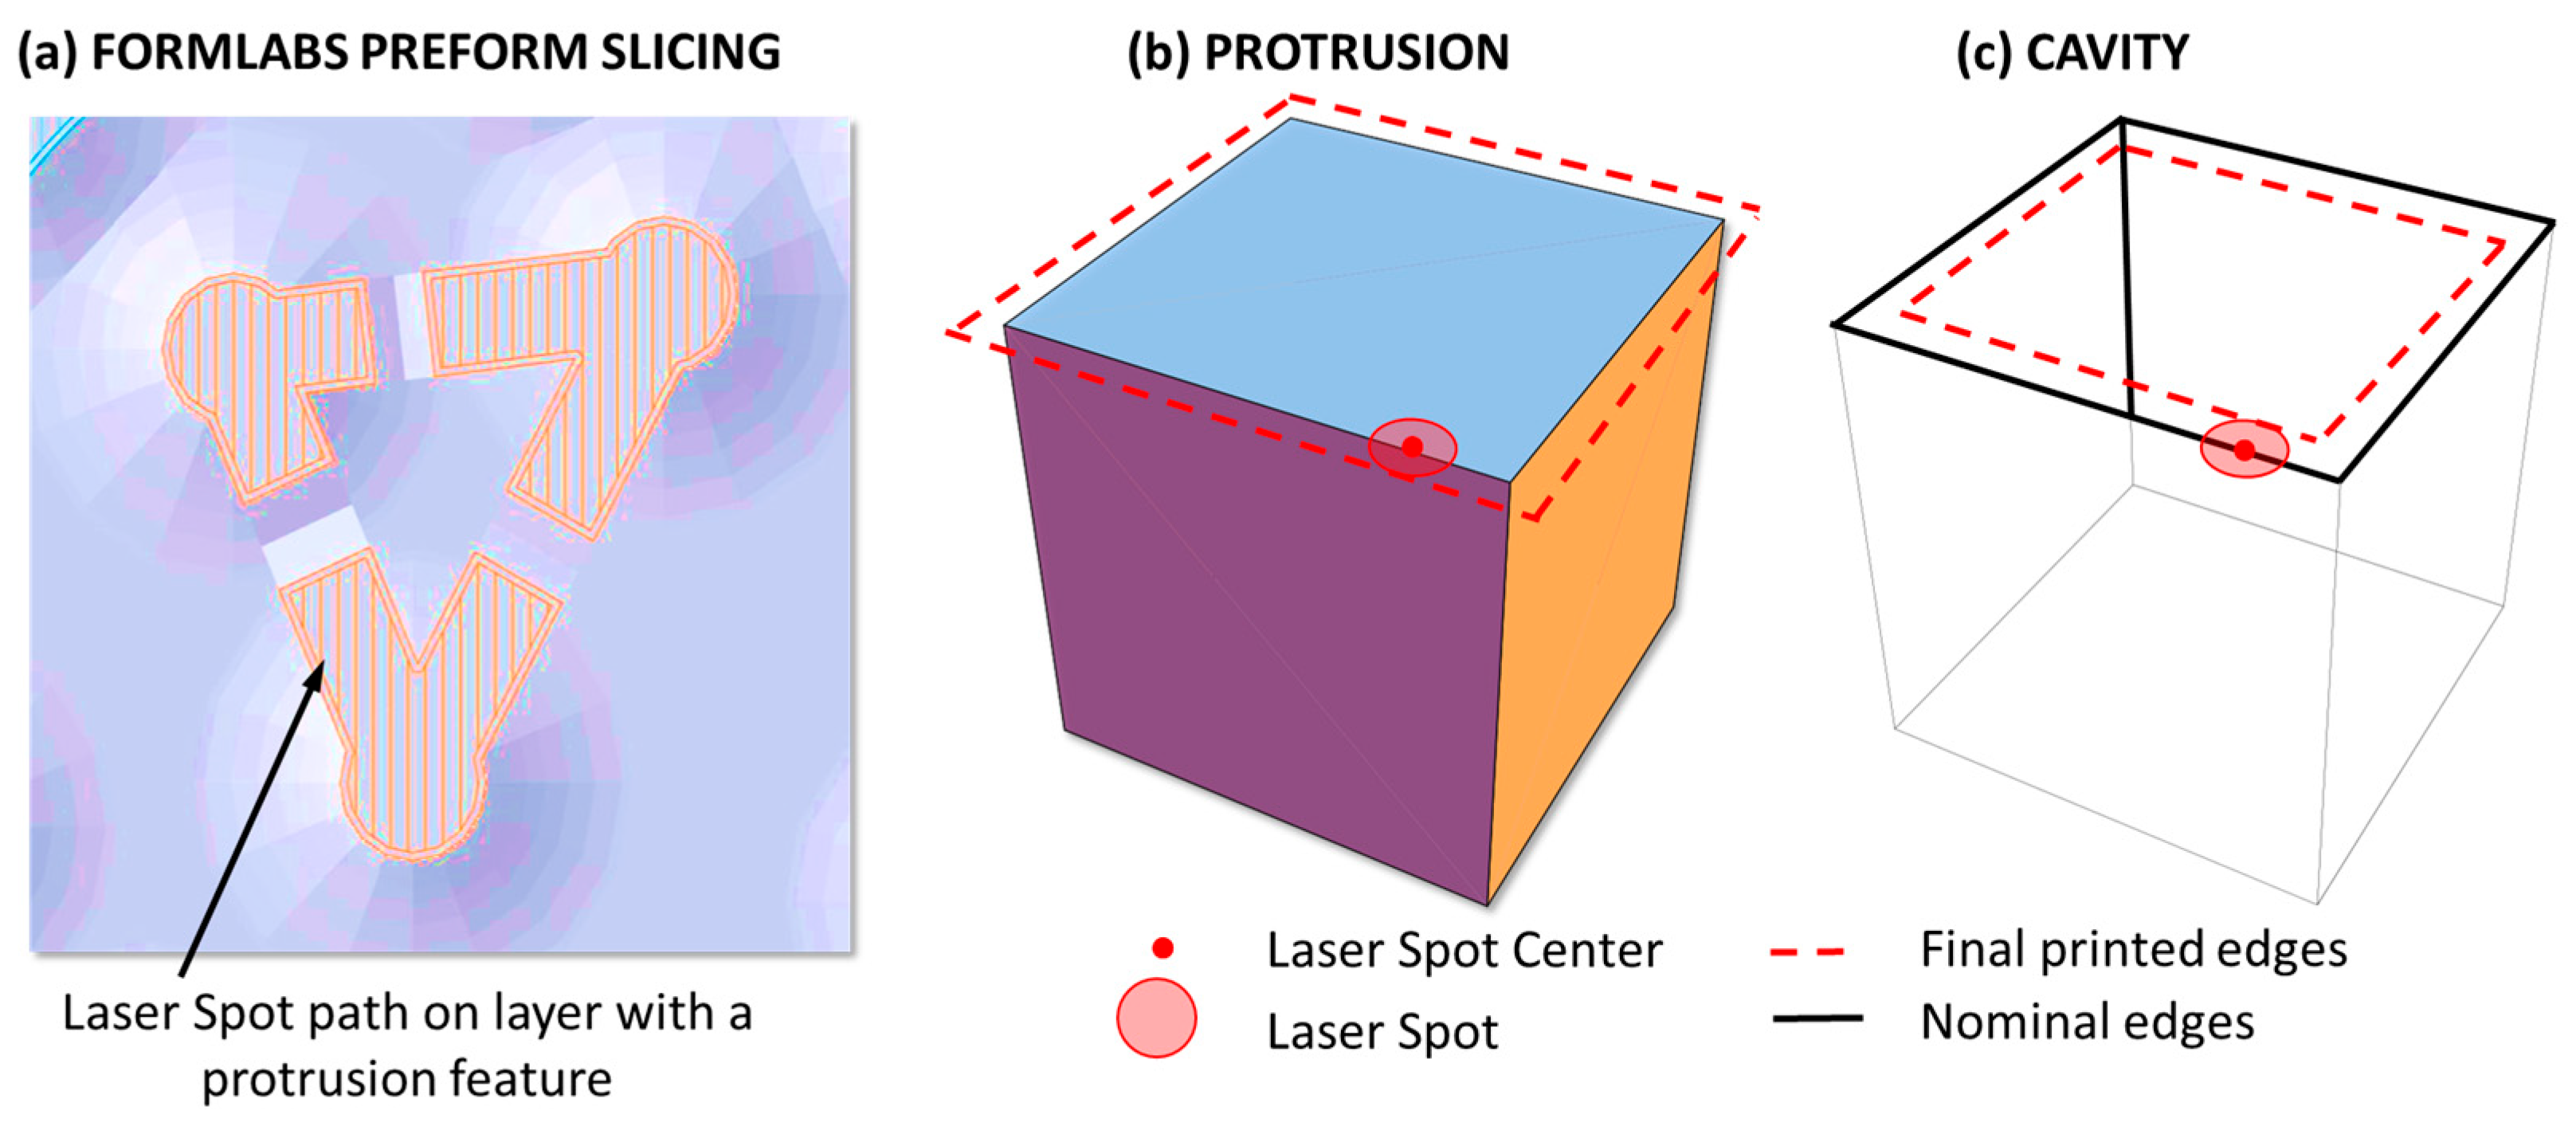
5]. The approach is experimental and can be customized for any implementation of the SLA technology. However, SLA-specific aspects, such as the laser beam spot and laser path, were analyzed to support a consistent compensation procedure. The investigation revealed that when the feature’s size approaches the sub-mm scale, other phenomena become more important, such as the surface tension that hinders the liquid resin residuals removal, effective laser spot size, and its position resolution. Therefore, the study focused on the identification of the laser size and path issues, and the definition of compensation methods of dimensional errors.
2. Materials and Methods
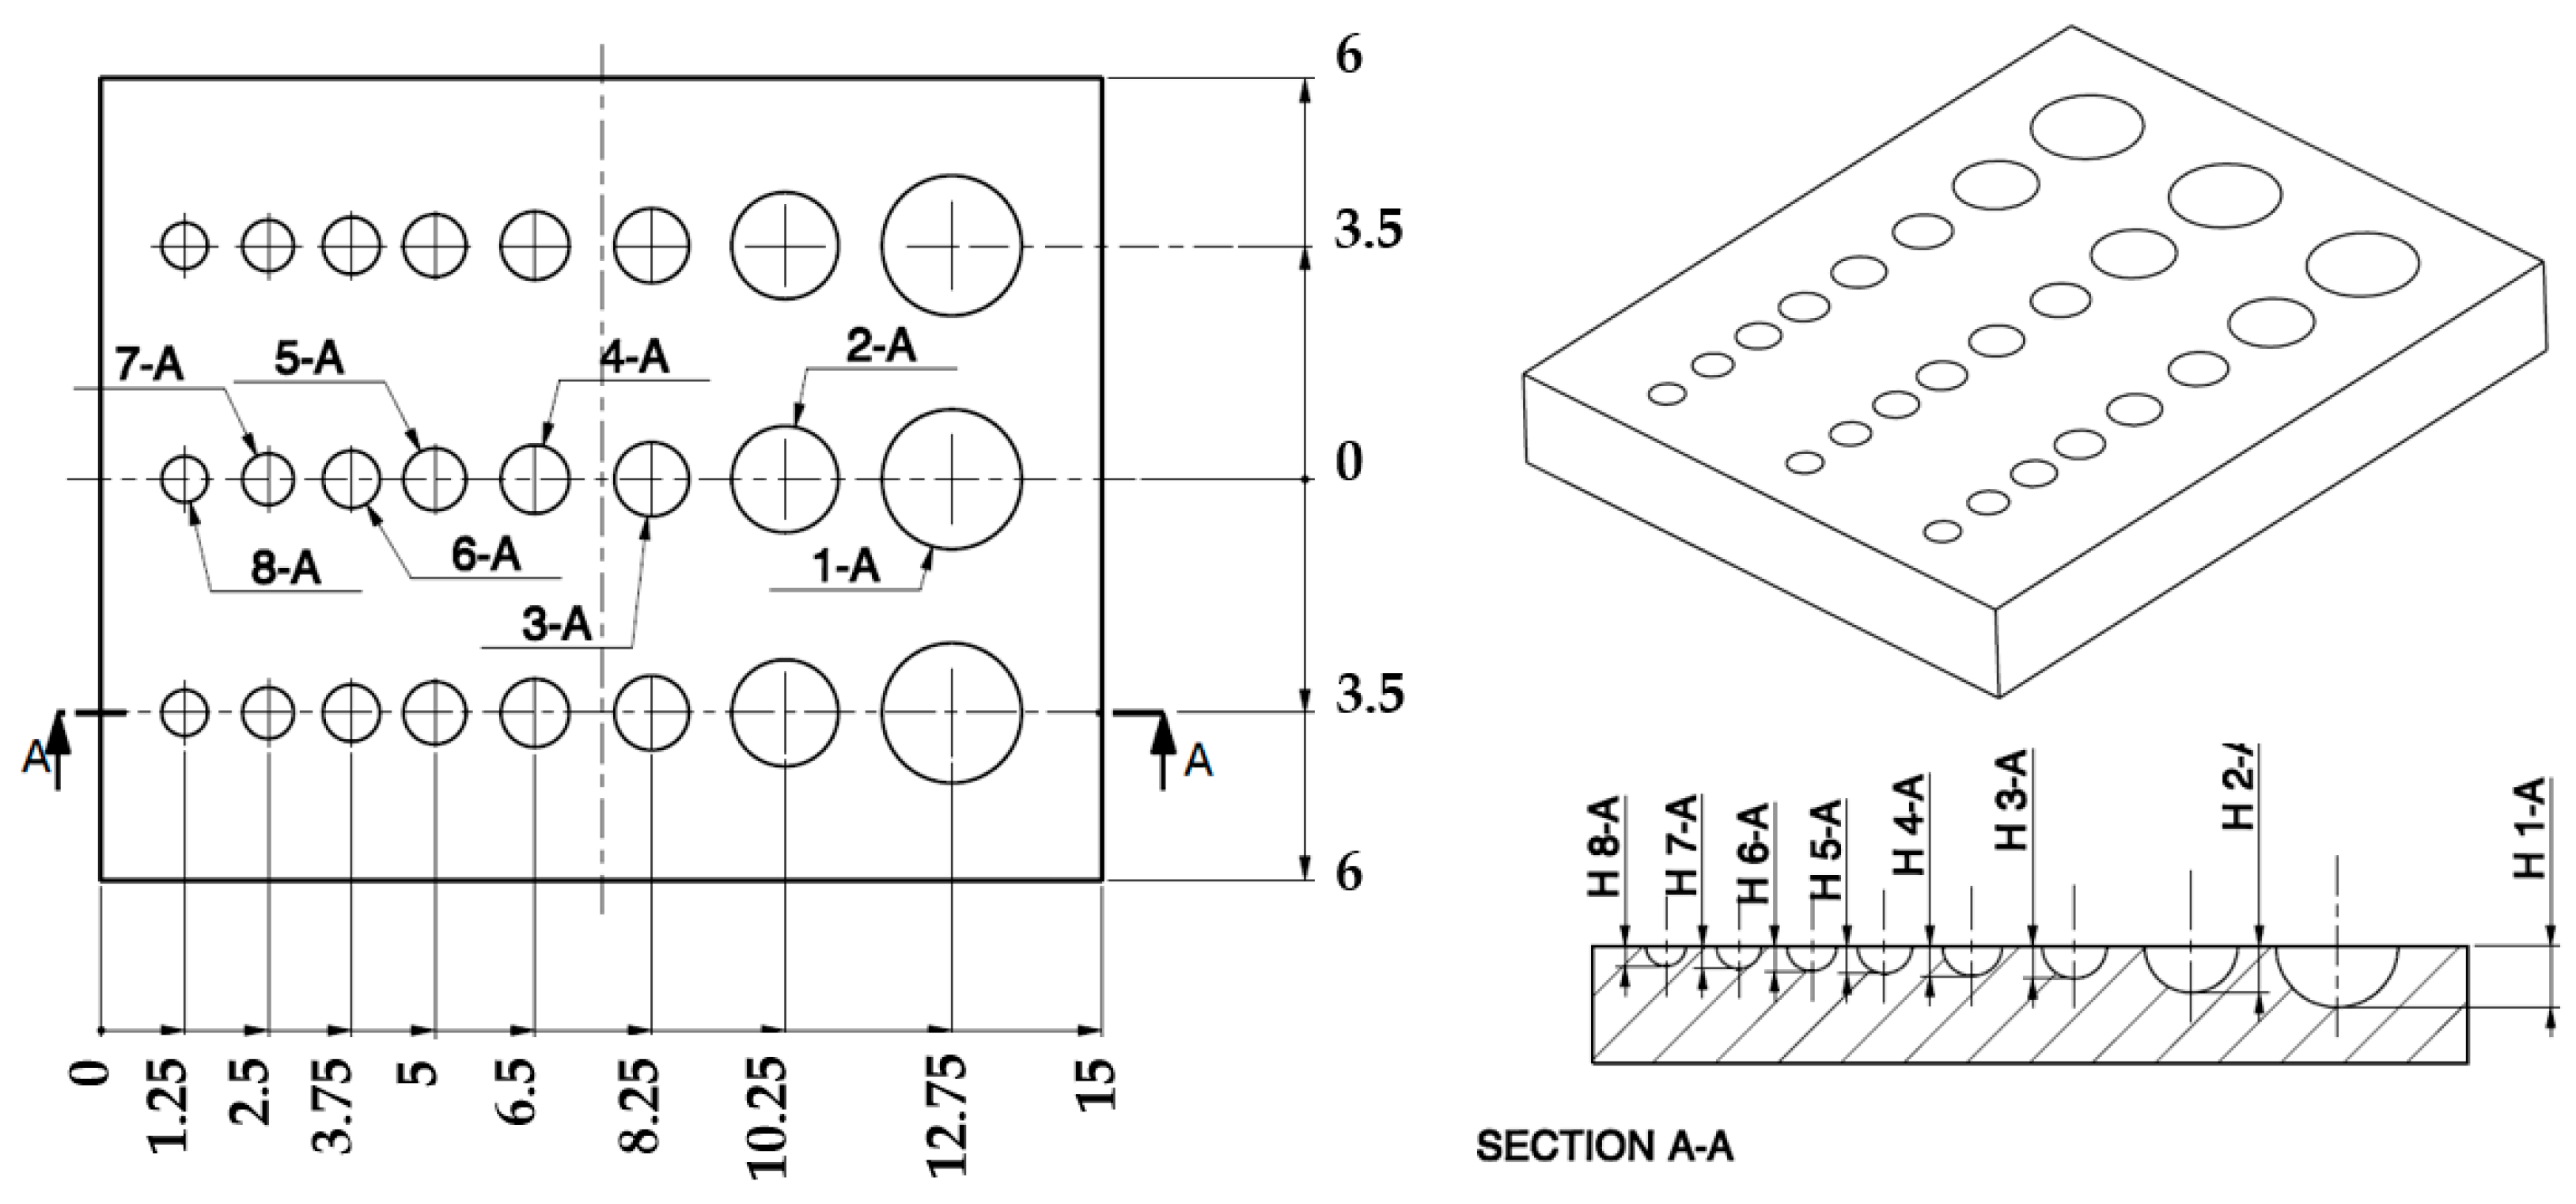
Sub-mm cavity features are the fundamental component of all lattice-structured materials, as a single feature (1D), or replicated in a surface texturing (2D planar or freeform patterns) or in a volume (3D). The proposed approach investigates the fabrication of a single cavity and its accuracy as a fundamental element of lattice structures. The investigation was performed by designing a sample with full-open cavities (FOC), thus hemispherical cavities (
Figure 3), with variable diameters from 2 mm (1-A) down to 0.5 mm (8-A), as reported in
Table 2.
Three samples were fabricated in a single printing run. Each sample presents three repetitions of the same features, thus obtaining nine cavities with the same nominal diameter.
The equipment adopted for fabricating the samples is a Formlabs Form 3 (Formlabs Inc., Somerville, MA, USA), having a build volume of 145 × 145 × 185 mm
3, equipped with a class 1 violet and continuous wave laser emitting at a wavelength of 405 nm with a nominal laser beam spot diameter D
LS of 85 μm and a power of 250 mW. The positioning resolution on the x-y plane is 25 μm, while the
z-axis resolution can be set from 200 to 25 μm (layer thickness). Samples were designed with the 3D CAD Solidworks 2017 (Solidworks Corp., Dassault Systèmes, Waltham, MA, USA), exported to stereolithography interface (STL) format, and then imported into the Formlabs slicing software Preform v.3.32.0. In this software environment, parts were oriented, and all the process parameters were chosen according to the database supplied by the machine manufacturer and to previous studies [
8,
14,
25]. The surface with sub-mm cavity features was oriented horizontally, thus parallel to the build platform, which guarantees a higher surface finishing [
14,
25].
The process parameters used in this work were: layer thickness LT = 25 μm; support attachment point size of 0.7 mm; base thickness of 2 mm; min distance of part from base of 5 mm; part orientation horizontal/parallel to the build platform (plane XY); support density index equal to 1 (1.75 supports/10 mm2); supports were uniformly distributed on the sample surface.
Samples were fabricated in Formlabs Clear V04 photopolymer resin, identified by the manufacturer’s code RS-F2-GPCL-04 [
26]. After the SLA processing, parts were removed from the build platform and washed for 20 min with high-purity 99% isopropyl alcohol (IPA) and 5 min with ultrasound washing. Samples were measured with an optical profilometer Sensofar S-Neox (Sensofar group, Barcellona, Spain), set with a Focus Variation acquisition method, using an objective EPI 10X with numerical aperture NA of 0.30 and a pixel resolution of 1.29 μm. Acquired images were processed using a “threshold” (
Figure 4a) and a “analyze particles” (
Figure 4b) algorithm by ImageJ (National Institutes of Health NIH, Bethesda, MD, USA) version 1.54 g. This image processing procedure automatically gives several parameters regarding the shape (such as roundness, circularity, and solidity indexes) and size (such as area, perimeter, width, and height) of the region of interest. The average diameter of each cavity is calculated by the measured area using the formula: Diameter D =
.
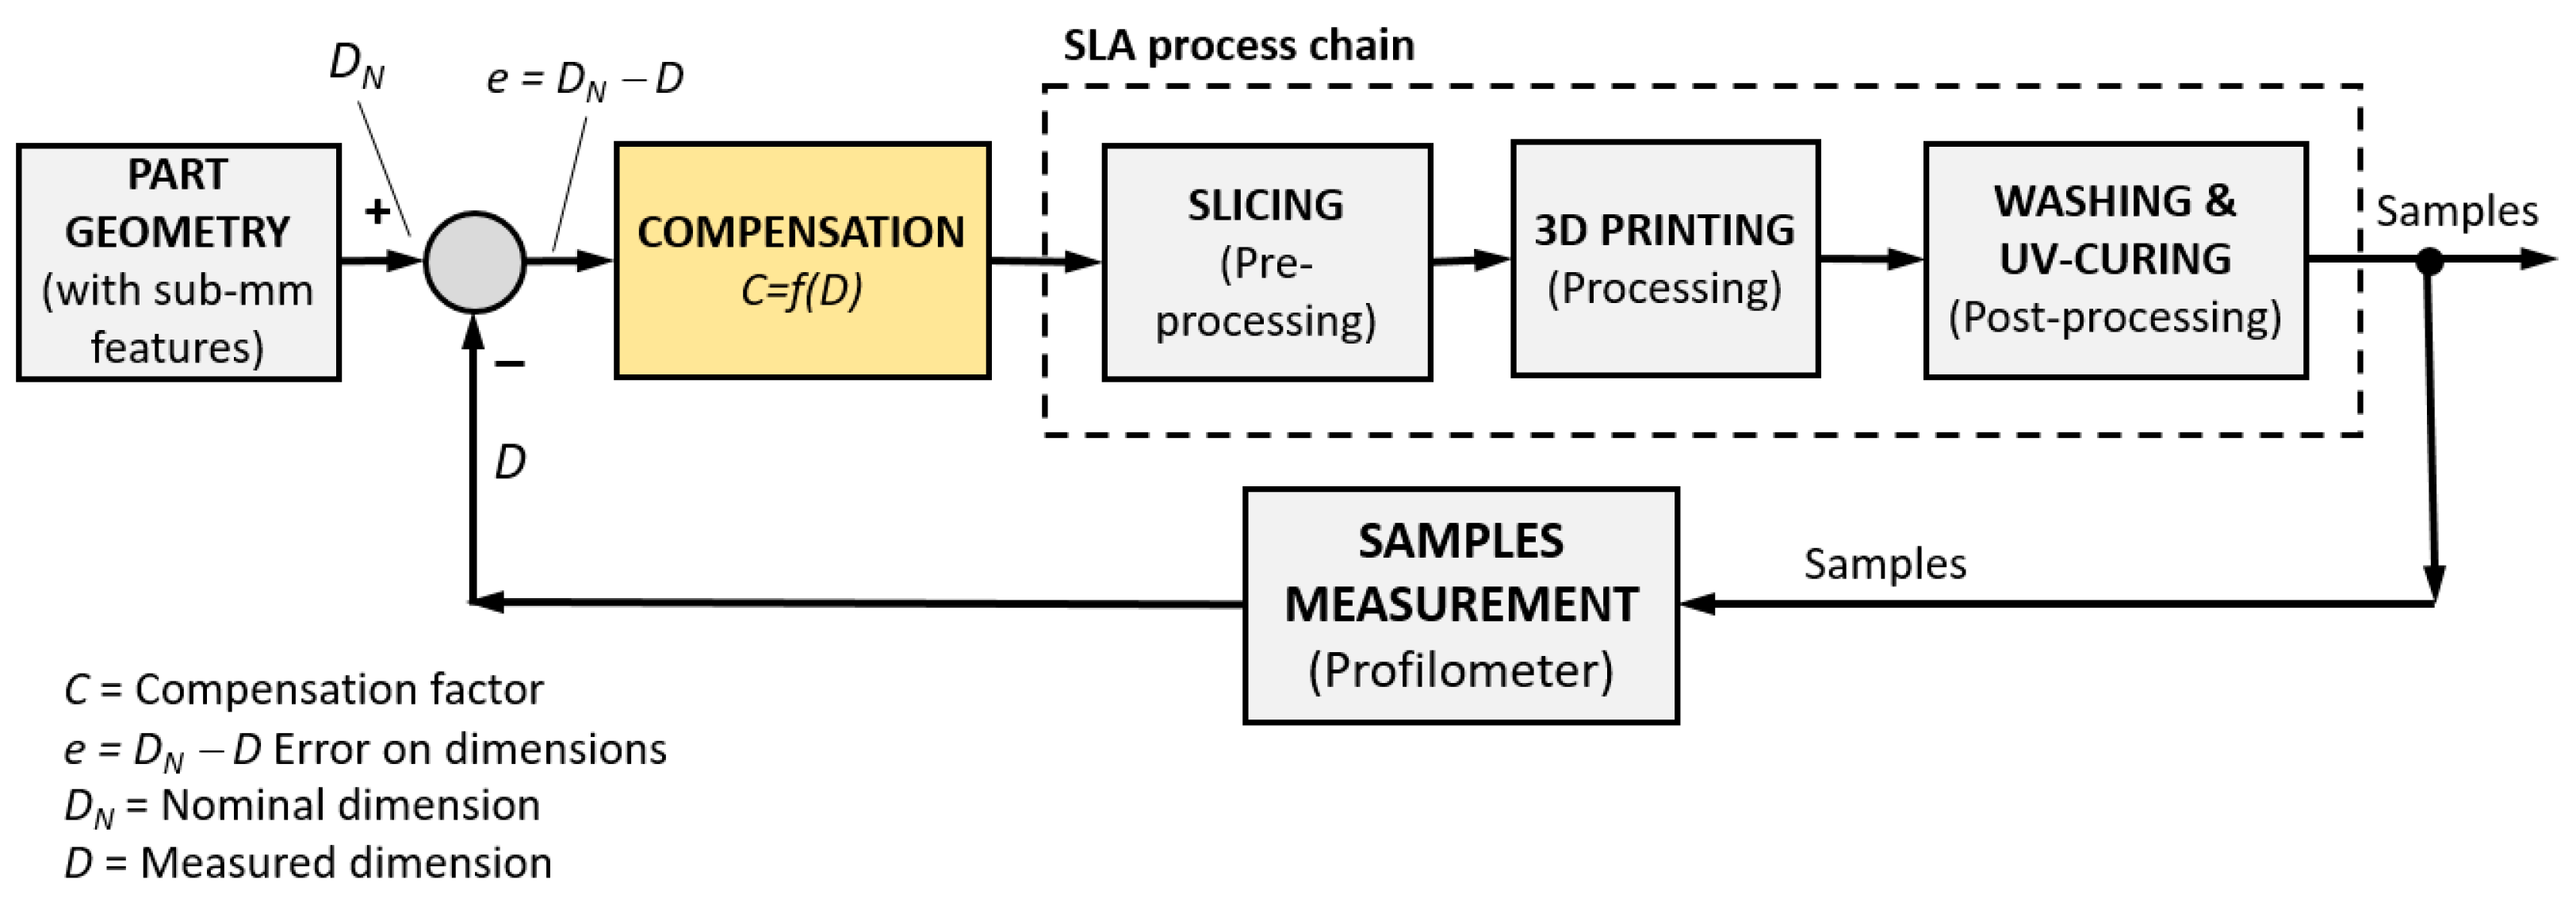
Concerning the methodology adopted in this work, a closed-loop compensation is implemented to optimize the dimensional accuracy of the process at the sub-mm scale. The setpoint (reference) of the workflow is the nominal dimensions DN of the part geometry. The feedback is achieved with sample measurements by metrology (i.e., profilometer), whose results are the actual values D of the sub-mm features. This work aims at the definition of the compensation in the workflow, which, starting from the errors e = DN − D on feature nominal dimensions, applies a correction law C = f(D) to the setpoint of the SLA process chain to obtain higher dimensional accuracy.
The workflow is schematically depicted in
Figure 5.
Therefore, the same samples of
Figure 3 are printed, adding a compensation factor
C identified by the closed loop of
Figure 5 to each nominal diameter of
Table 2, according to Equation (1):
where
DC is the modified diameter used to generate the new sample geometry to be printed and
C is the compensation parameter.
It is worth noticing that the approach exploits only experimental data acquired from the process and does not take into account the specific implementation of the SLA technology (i.e., the machine), slicer SW, or process parameters. The final result will be a feature size-dependent compensation method based on an experimental procedure that all technology implementations can adopt.
4. Results and Discussion
4.1. Constant Compensation Strategy
Since variability in the esteem of C has been found, the constant model compensations strategy was applied to the sub-mm cavity diameters considering three levels of compensation:
Figure 9 shows the effects of the constant compensation strategy compared with the curve obtained without compensation.
However, the constant compensations—the same value of the parameter C for all cavities—are not fully effective, especially at the smaller scale (diameters below 1.2 mm), where the error dramatically increases. The smaller the sub-mm cavity, the higher the compensation that is required.
Furthermore, the value of C = 120 μm produces an overcompensation (positive errors) for feature diameters higher than 1.0 mm, and similar results are obtained with C = 85 μm for feature diameters higher than 1.6 mm. From these results, it can be concluded that inaccuracy related to the laser spot diameter is the most important and can be effectively compensated for cavity dimensions down to about 1.2 mm.
4.2. Variable Compensation Strategy
The results presented in the previous section suggest that a nonlinear compensation law could be more effective than a constant or a linear compensation strategy as the cavity dimension decreases to take into account phenomena typically arising at the sub-mm scale, such as adhesion and surface tension.
The nonlinear compensation law can be derived by processing the experimental data set. Since the variable compensation is more effective and used at the small scale (
Section 4.1), the experimental data set is reduced to diameters in the range of 500–1200 μm. The identification of the nonlinear compensation was performed by following three steps:
- (1)
Plot of all measurements of features on samples (i.e., cavity diameters in the range of 500–1200 μm), with and without compensations;
- (2)
Identification by polynomial regression of a mathematical relationship between actual and nominal values of the meso- and sub-mm feature size;
- (3)
Solving the equation obtained in the previous step; thus, the value of the compensation parameter can be derived as a function of the feature size C = f(D) (i.e., cavity diameter).
According to this procedure, data of nominal and actual diameters were plotted and analyzed. The polynomial model order for data identification was chosen as a trade-off between the mathematical complexity and the statistical confidence (coefficient of determination R2) in the model’s data prediction.
A second-order polynomial interpolation model (three parameters) was identified by the Microsoft Excel regression algorithm, resulting in a value of R
2 = 0.9954, which was considered satisfactory for the objective of the work. The model equations (explicit and implicit forms) are given by:
where y is the actual (measured) diameter, x is the related nominal diameter, and (a, b, c) are the parameters of the second-order polynomial regression model. The values of the model parameters are a = −0.0001; b = 1.3641; c = −385.77.
Equation (2) was solved to obtain the nominal (compensated) values (x) of diameters that give the desired (y) values. Finally, the values of the required compensation parameter C are calculated as the difference between the measured and the compensated values of the cavity diameters:
where N is the total number of compensations to be calculated.
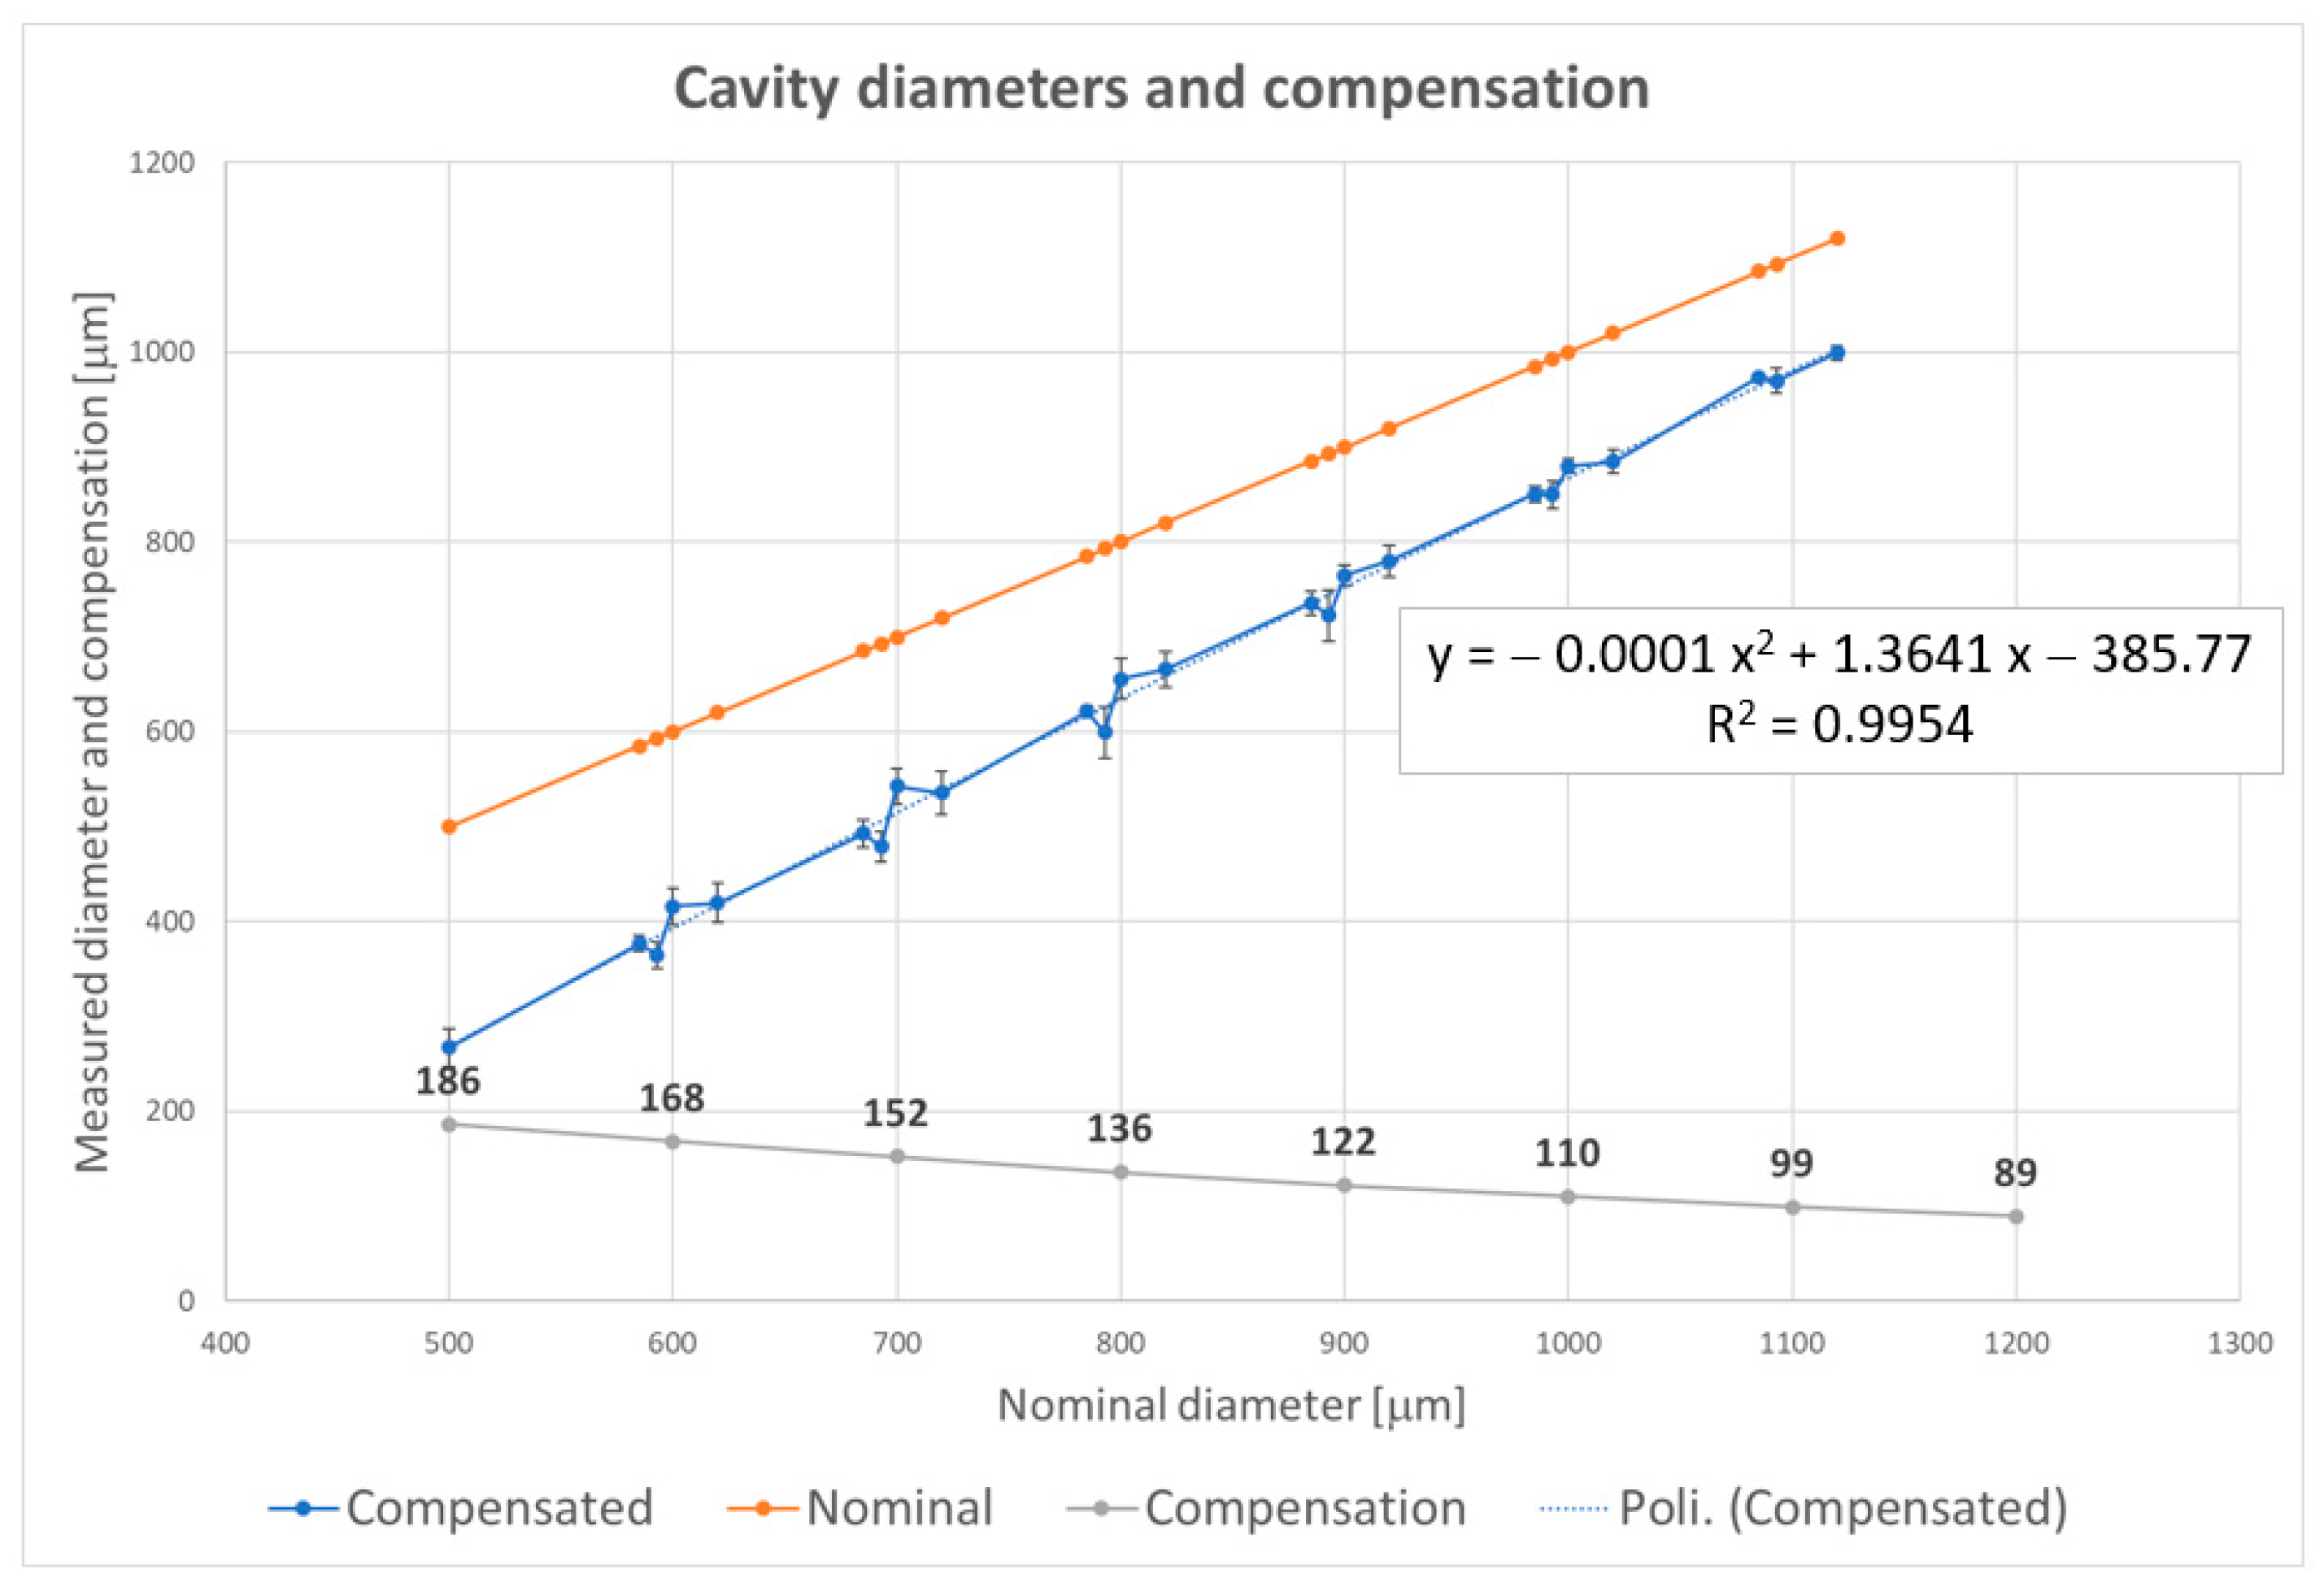
Figure 10 shows the plots of nominal (orange line) and measured (blue line) cavity diameters obtained by the SLA fabrications.
It is worth noticing that the plot of
Figure 10 reports the diameters of all samples, including the three trials of constant compensated ones, as nominal diameters. Therefore, the nominal diameters in the plot are summarized in
Table 3.
Eight values of the compensation parameter C—related to diameters DN = 500, 600, 700, 800, 900, 1000, 1100, 1200 μm—were calculated and plotted in the same graph (grey line). The second-order polynomial interpolation curve (blue dashed line) is superimposed to the measured diameter curve, while the explicit form of the Equation (2) is reported in the figure inset.
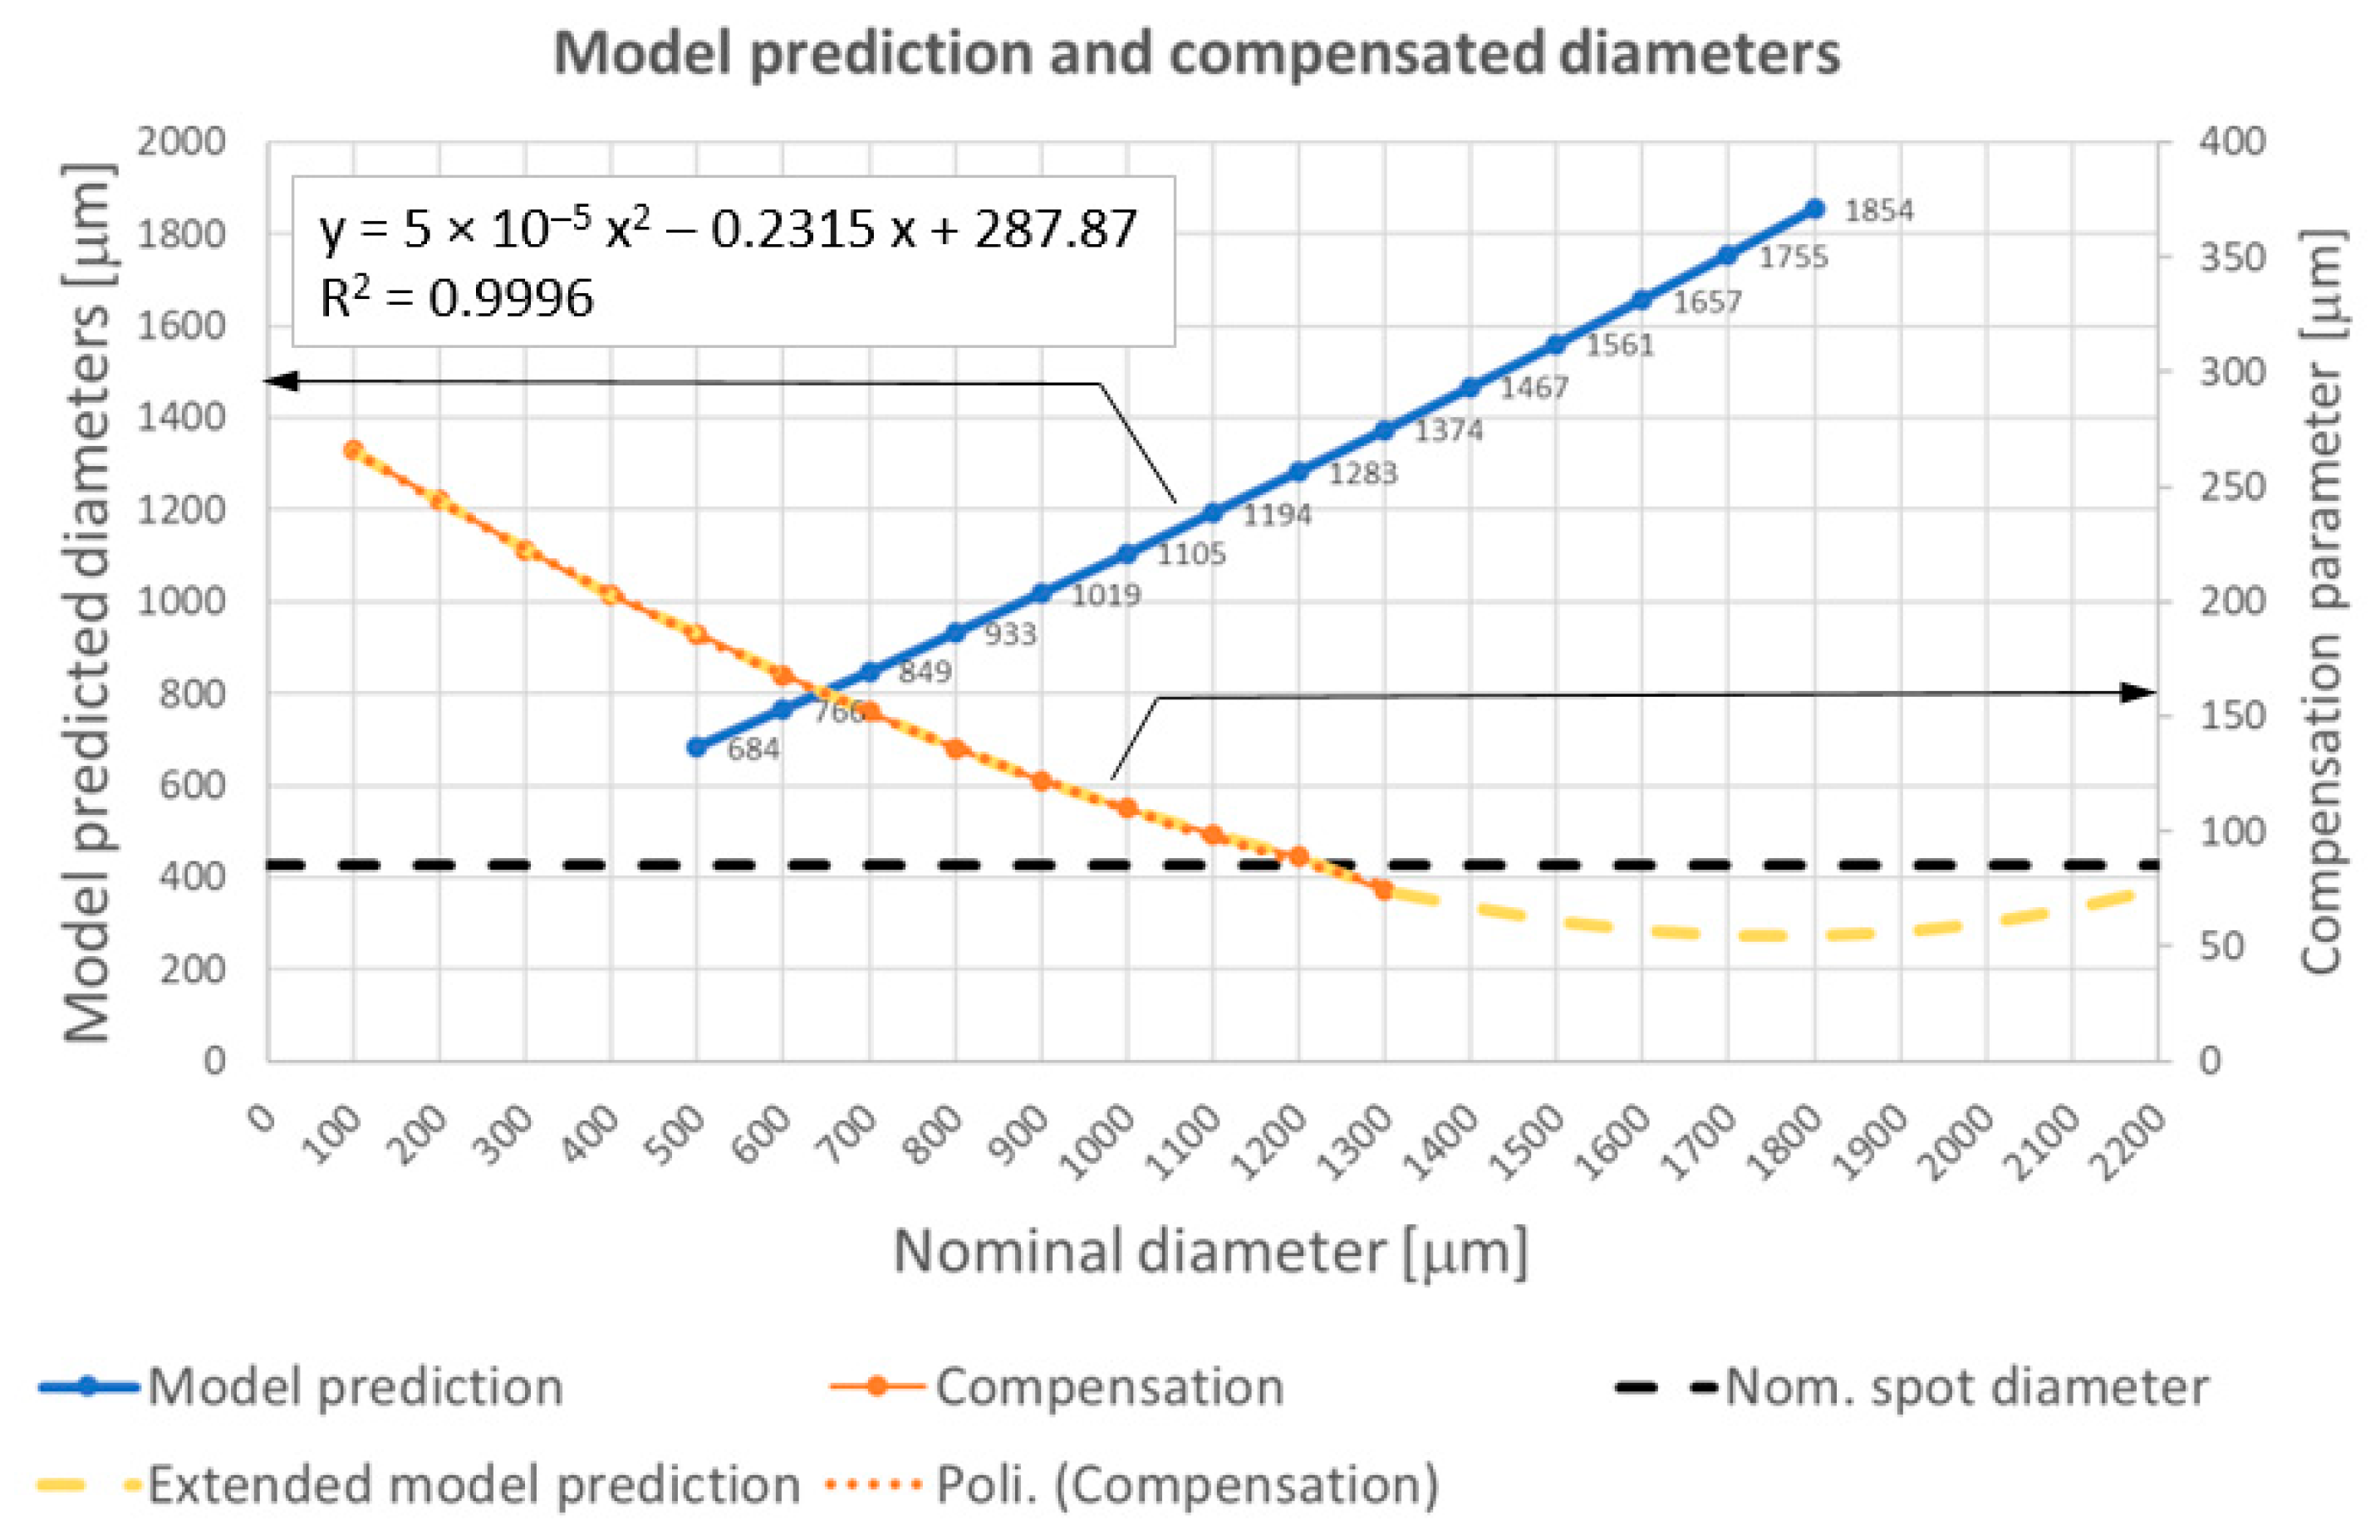
The model prediction of diameters and the related compensations were plotted on an extended and denser range of the nominal diameters (
Figure 11). The curve of the variable compensation parameter (yellow line) reveals that for bigger features (diameters bigger than 1.2 mm), the compensation has values close to the constant nominal compensation and does not vary significantly. For this reason, at the meso scale, a variable compensation is not required, and a constant compensation strategy can be adopted. Therefore, it can be concluded that a discontinuity occurs in the compensation law: variable compensation at the sub-mm scale, down to D′ = 1200 μm, and a constant compensation law beyond this threshold.
Eight (N = 8) values of FOC diameters were assumed for the final validation of the procedure: 500, 600, 700, 800, 900, 1000, 1500, 2000 μm. Four samples were 3D-printed at different positions on the build platform to consider the effects of this parameter on data dispersion and part accuracy (
Figure 12). Each sample reports a pattern of three sequences of full-open cavities with eight target diameters in the range 500–2000 μm. The compensation parameter for diameters higher than 1200 μm was set to 96 μm; thus, the estimated value of the laser spot diameter obtained in [
5]. The nominal value of diameters and compensation parameters are reported in
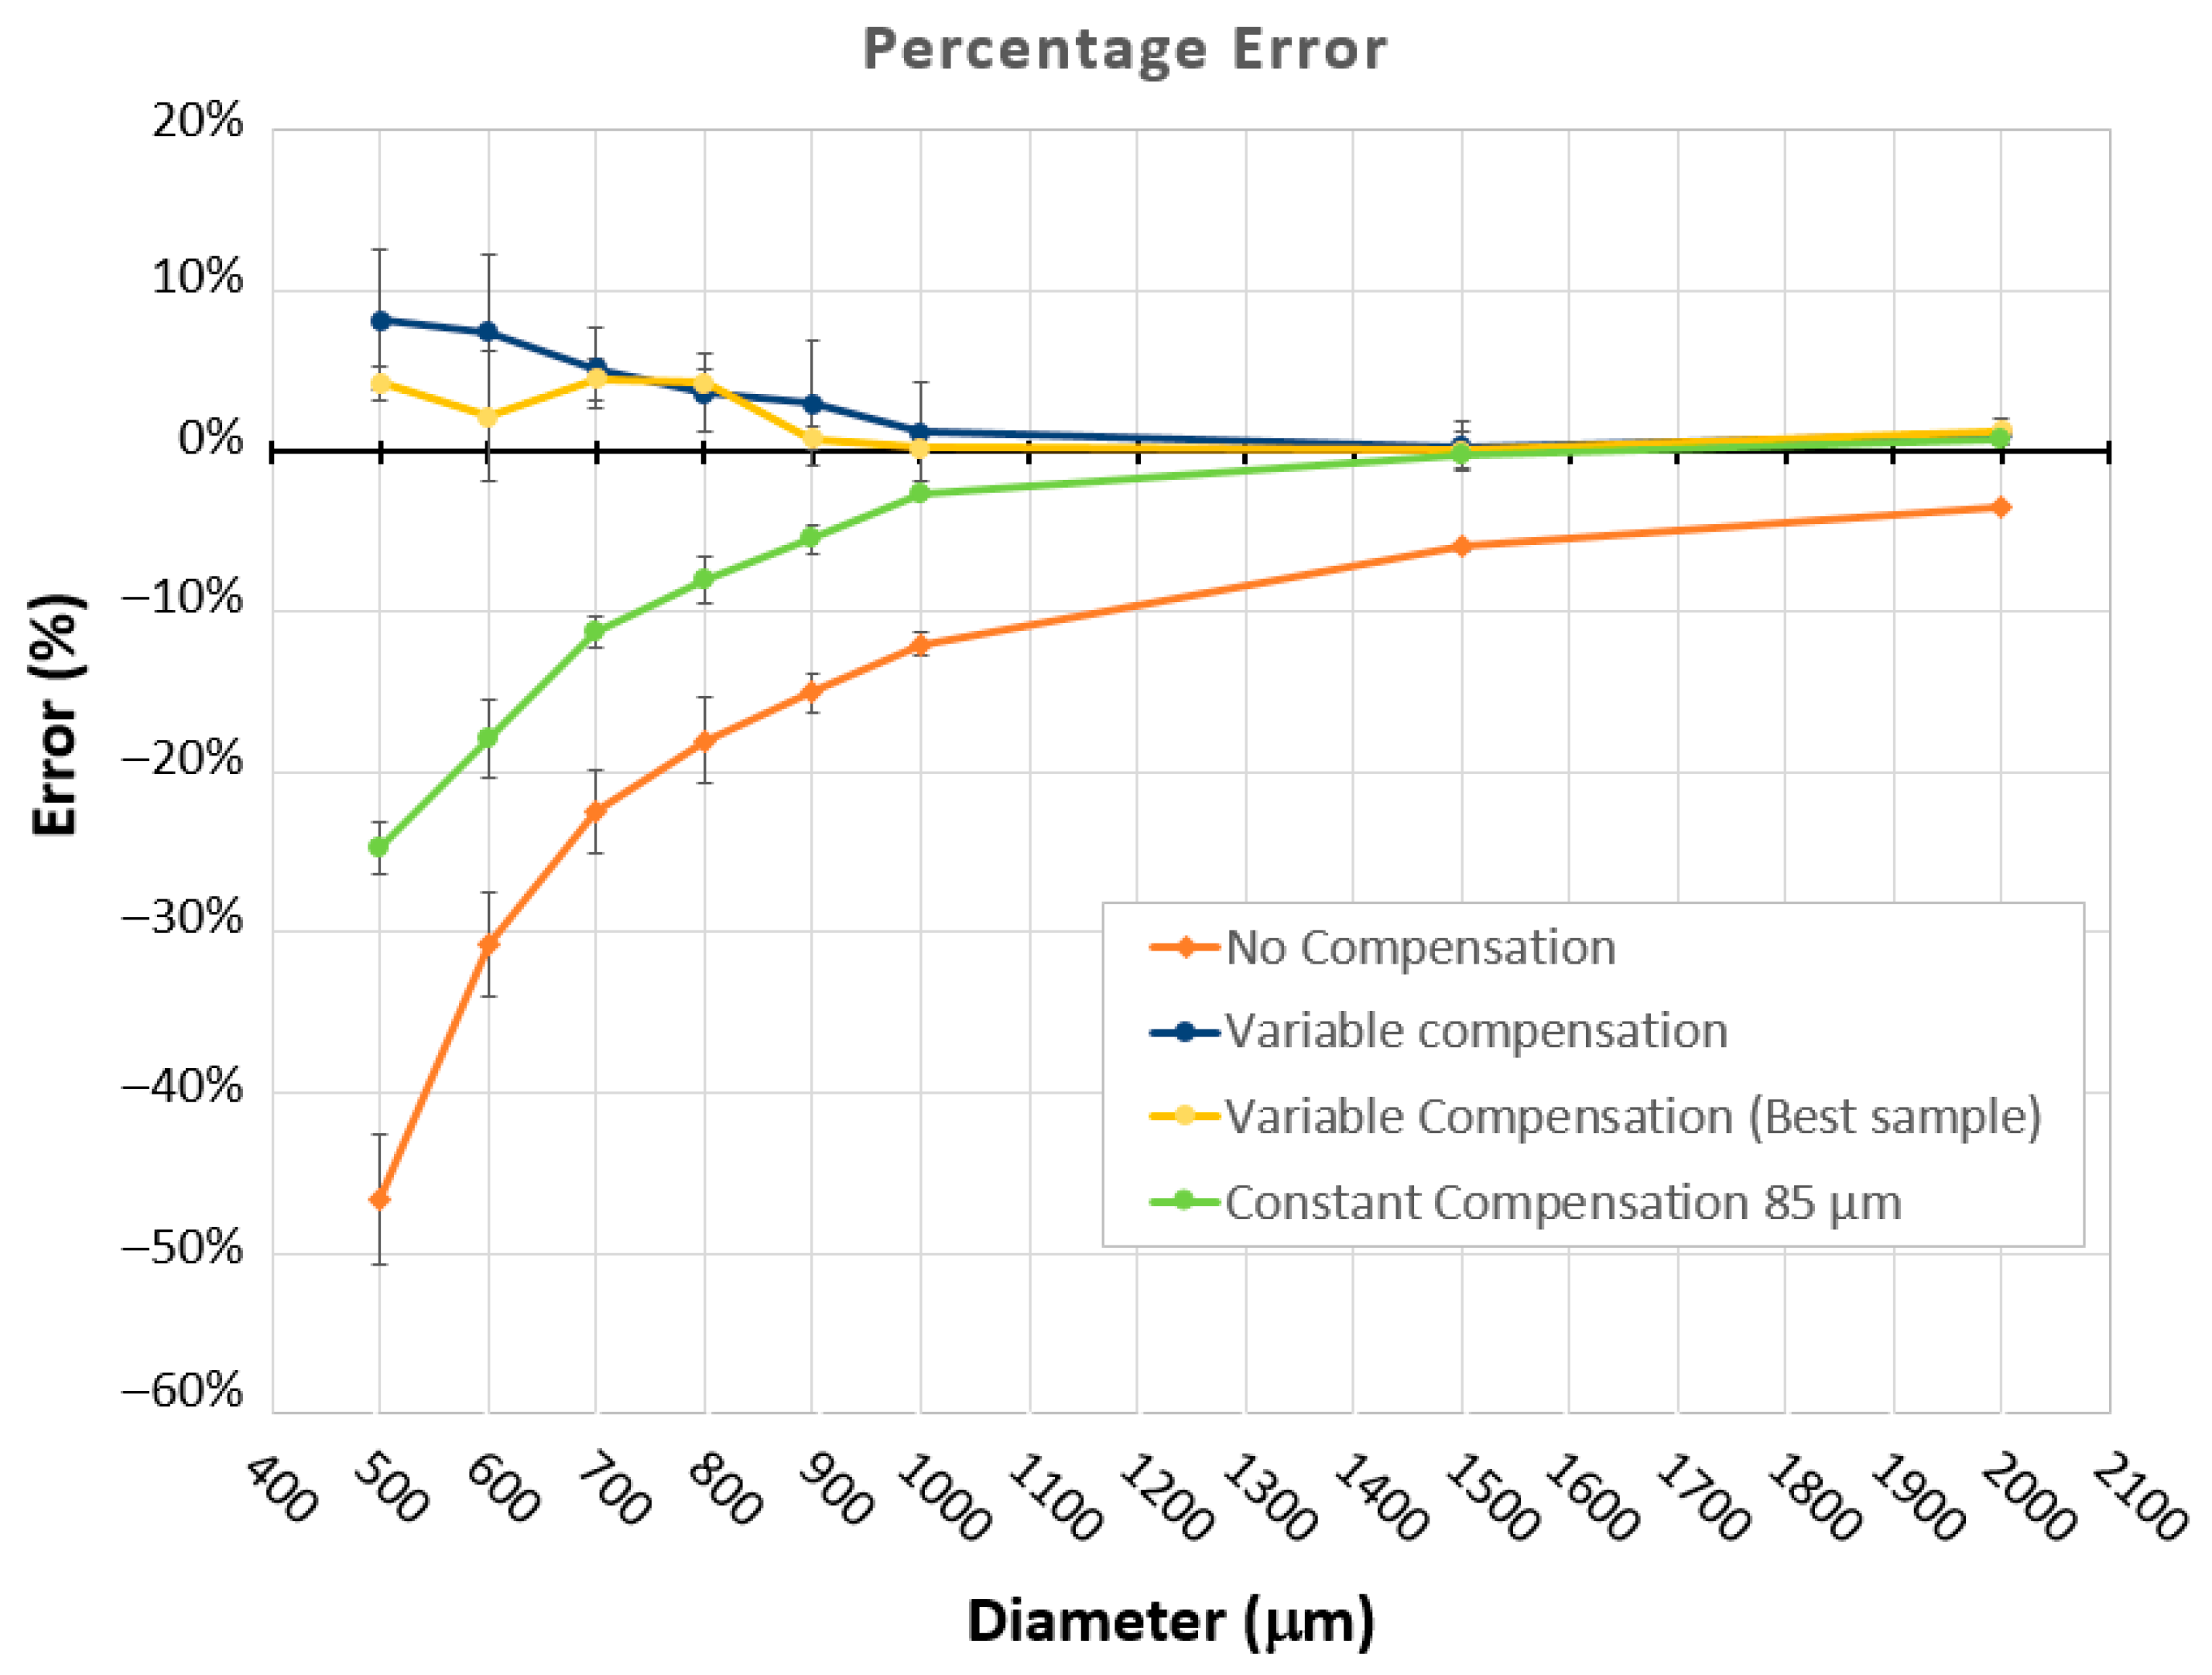
Table 4. The error percentages calculated on sample measurements with their dispersions are reported in
Figure 13.
The curve of variable compensation (blue line) reveals a sharp improvement in accuracy with errors below 8.2%. The best sample error (yellow curve) is always below 4.4%. A slight overcompensation occurs at the sub-mm scale (below 900 μm). Furthermore, a constant compensation strategy beyond D = 1200 μm is confirmed to be the best choice.
The graph in
Figure 13 shows that the dimensional error without compensation always has negative percentage values. Furthermore, moving towards the smaller scale, the dimensional error grows more than proportionally. This means that if the part design requires features, such as cavities, pillars, thin walls, etc., with sub-millimeter dimensions (diameters, edge length, thickness, etc.), then the nominal value of the feature dimension should be modified to take into account of this error with an SLA fabrication. This precaution allows the fabrication of small features also with conventional and low-cost equipment. By applying the compensation method presented in this paper, a preliminary assessment of the equipment would allow higher levels of manufacturing accuracy and quality.
Table 5 reports mean errors and standard deviations without compensation and with constant and variable compensation.
The proposed method allows pushing forward the capabilities of equipment at their actual limits, thus exploiting them more than in a conventional way. At the same time, it enables a deeper knowledge of the process and equipment.
As can be noticed, the absolute and percentage errors progressively decreased from no compensation to variable compensation. In addition, data dispersion has been improved. These results demonstrate that a compensation strategy increases the accuracy of technology, especially at the sub-mm level. Furthermore, a variable compensation method based on the feature dimension is successful since it allows further improvement compared to the constant compensation strategy.
5. Conclusions
This study analyzed an SLA process in terms of dimensional accuracy addressing sub-mm feature fabrication by investigating the effects of inaccuracy due to scanning paths, laser spot compensation, and post-processing operations.
This analysis showed that introducing a tuned compensation factor could improve the accuracy of the fabrication. The experimental data revealed that a variable (nonlinear) compensation method as a function of the sub-mm feature size (i.e., sub-mm cavity diameter) is more suitable and effective than a constant compensation.
Summarizing, the main achievements of this study are:
- ▪
The dimensional accuracy of conventional SLA equipment dramatically worsens at the sub-millimeter and sub-mm scale;
- ▪
The main issues at the sub-mm scale are: (i) laser spot size compensation; (ii) infill strategy in laser scanning of the layer; (iii) reduced efficiency of the IPA-washing post-processing. All these issues contribute to the dimensional inaccuracy;
- ▪
A compensation factor applied to the part nominal geometry reduces the error on feature dimensions;
- ▪
A constant compensation C is effective at the meso-scale (feature dimensions D > 1200 μm), thus reducing the error on feature dimensions from −12% (uncompensated) to −0.1%. However, it has limited effects at the sub-mm scale (D < 1200 μm), where the error on feature decreases from −46% (uncompensated) to −16%;
- ▪
A variable compensation factor C, identified experimentally as a function of the feature dimension C = f(D), reduces the error in feature dimensions. A second-order law (i.e., C = ax2 + bx + c) reduces the dimensional error below 8.2%;
- ▪
The proposed compensation method allows the achievement of higher levels of accuracy at the sub-millimeter and sub-mm scale with conventional and low-cost equipment.
This study focused on simple spherical sub-mm cavities, and it did not consider complex geometries, which can require a challenging assessment to identify the correct compensation laws along the three axes. Other aspects to be further investigated at the sub-mm scale are the effectiveness of the IPA-washing post-processing, the role of surface tension, and photopolymer viscosity in eliminating the trapped liquid resin into sub-mm cavities and lattice structures.

