Article

Enhanced Energy Absorption with Bioinspired Composite Triply Periodic Minimal Surface Gyroid Lattices Fabricated via Fused Filament Fabrication (FFF)

by
Dawit Bogale Alemayehu
1,* and
Masahiro Todoh
2
1
Division of Human Mechanical Systems and Design, Graduate School of Engineering, Hokkaido University, Sapporo 060-8628, Japan
2
Division of Mechanical and Aerospace Engineering, Faculty of Engineering, Hokkaido University, Sapporo 060-8628, Japan
*
Author to whom correspondence should be addressed.
J. Manuf. Mater. Process. 2024, 8(3), 86; https://doi.org/10.3390/jmmp8030086
Submission received: 16 March 2024 / Revised: 17 April 2024 / Accepted: 19 April 2024 / Published: 23 April 2024
(This article belongs to the Special Issue Lattice Structure and Metamaterial Design for Additive Manufacturing)

Abstract

:
Bio-inspired gyroid triply periodic minimum surface (TPMS) lattice structures have been the focus of research in automotive engineering because they can absorb a lot of energy and have wider plateau ranges. The main challenge is determining the optimal energy absorption capacity and accurately capturing plastic plateau areas using finite element analysis (FEA). Using nTop’s Boolean subtraction method, this study combined walled TPMS gyroid structures with a normal TPMS gyroid lattice. This made a composite TPMS gyroid lattice (CTG) with relative densities ranging from 14% to 54%. Using ideaMaker 4.2.3 (3DRaise Pro 2) software and the fused deposition modeling (FDM) Raise3D Pro 2 3D printer to print polylactic acid (PLA) bioplastics in 1.75 mm filament made it possible to slice computer-aided design (CAD) models and fabricate 36 lattice samples precisely using a layer-by-layer technique. Shimadzu 100 kN testing equipment was utilized for the mechanical compression experiments. The finite element approach validates the results of mechanical compression testing. Further, a composite CTG was examined using a field emission scanning electron microscope (FE-SEM) before and after compression testing. The composite TPMS gyroid lattice showed potential as shock absorbers for vehicles with relative densities of 33%, 38%, and 54%. The Gibson–Ashby model showed that the composite TPMS gyroid lattice deformed mainly by bending, and the size effect was seen when the relative densities were less than 15%. The lattice’s relative density had a significant impact on its ability to absorb energy. The research also explored the use of these innovative foam-like composite TPMS gyroid lattices in high-speed crash box scenarios to potentially enhance vehicle safety and performance. The structures have tremendous potential to improve vehicle safety by acting as advanced shock absorbers, which are particularly effective at higher relative densities.

1. Introduction

Lattice structures are classified into three types: random, periodic, and pseudo-periodic. Voronoi and Delaunay structures, which are formed using beams or struts, are examples of random lattices. Periodic lattices are further classified into conformal, homogeneous Triply Periodic Minimal Surfaces (TPMS) and non-conformal, heterogeneous structures such as beam/strut-based and shell-based. The TPMS family includes popular configurations such as Lidinoid, SplitP, Neovius, Schwartz Diamond, and Gyroid. Meanwhile, beam/strut-based periodic lattices are made up of basic geometric shapes like the hexagonal honeycomb and triangular honeycomb, while more sophisticated forms include the Kelvin cell, octet, and diamond, as well as cubic versions like the face-centered cubic and body-centered cubic [1,2,3]. Lattice structures—especially the Gyroid TPMS lattice, which is based on the triply periodic minimal surface (TPMS)—are becoming more and more popular in fields like biomedical, aerospace, and automotive engineering. This is due to their remarkable mechanical characteristics and adaptability [4,5,6,7,8,9], enhancing both shape and function; the bio-inspired Gyroid TPMS lattice draws its design ideas from nature, such as insect wings [10,11,12,13,14]. These lattices are perfect for distributing stresses and absorbing energy, which are essential for creating robust yet lightweight solutions. The main advantages associated with TPMS lattices are their complex, continuous surfaces, which have better mechanical properties than typical lattice types. They have distinct deformation properties, such as bending rather than buckling, which contribute to improved energy absorption during impacts. However, innovative lattice structures require precise production, modeling, finite element analysis, and precise parameter management for impact absorption, while advanced fused filament fabrication challenges material constraints like polylactic acid [15,16].
Due to its biodegradability, polylactic acid (PLA) is a desirable material for a variety of applications, including orthopedic bone fixation, surgical sutures, drug delivery systems, and eco-friendly food packaging. PLA also breaks down into non-toxic compounds [17]. Moreover, PLA’s application has been extended by recent studies, which take into account its ability to enhance vehicle crashworthiness [18,19].
The butterfly wings are a magnificent example of structure-matching function. The gyroid TPMS lattice structure (GTLS) was derived from the gyroid-type triply periodic minimum surface (TPMS) structure in this study. This pattern was inspired by the scales on a butterfly’s wing (Figure 1a) [13], illustrating how inventive engineering solutions frequently draw inspiration from natural designs. Because they have high stiffness-to-weight ratios and can absorb energy, lattice structures are great for load-bearing and biocompatible uses. Their patterns are repeated and connected [10,20,21,22]. Lattice structures’ adaptability in design contributes to their versatility by allowing modification for certain applications [23,24].
In numerous disciplines, the efficacy of lattice structures, which are characterized by repetitive patterns of interconnected elements, has been demonstrated. High stiffness-to-weight ratios and energy absorption capacities are just two of the extraordinary mechanical properties provided by the lattice’s inherent porosity and shape [25]. Applications requiring load-bearing capacity and biocompatibility, such as structural engineering, aircraft, and medical implants, significantly benefit from these characteristics. Changing configurational features such as cell size, shape, and arrangement enables lattice structures to be tailored to specific applications [10]. Similar to this research, recent studies have attempted to increase the energy-absorbing capacity of lattice structures by combining two distinct lattice topologies [22]. Using this method, it is possible to construct a composite lattice with superior mechanical properties by combining the advantages of multiple lattices. Previous research has demonstrated the effectiveness of this method in enhancing energy absorption within lattice structures for impact reduction [20]. Such efforts demonstrate the necessity of developing new techniques to enhance the inherent benefits of lattices in numerous engineering disciplines. Studies aimed at enhancing the mechanical strength of lattice structures have led to advancements in manufacturing and design [23].
Studies of bio-inspired lattice structures with TPMS diamond shapes show their promise for aerospace applications owing to their increased lightweight and strength [26]. This research examines the flexural properties of ABS TPMS diamond sandwich panels at different densities (25%, 35%, 45%, and graded). And it uses digital image correlation for deflection experiments and theoretical analysis for mechanical efficiency findings. Based on the shape of the human tibia, one study showed hybrid architectures that combine elliptical and circular connections between IWP and Gyroid TPMS types, showing better energy absorption abilities [27]. This achievement highlights the possibility of developing lightweight porous structures with improved energy absorption and impact resistance, and it provides valuable insights for future engineering applications. There has been little research on hybrid Triply Periodic Minimal Surface (TPMS) designs that either gradient modify their parameters or integrate numerous patterns into a single design influenced by natural shapes [28]. Another study explored this terrain by creating hybrid structures that included linear and radial aspects of diamond and gyroid shapes and then evaluating their mechanical properties using both experimental and theoretical methods. Their results revealed a significant rise in plateau stresses of 19% and 11% in hybrid models compared to uniform equivalents, with hybrid designs also demonstrating 10% and 7% improved specific energy absorption. Furthermore, a strong correlation was found between the actual data and the simulation results [29]. Extending their study, they found that hybrid structures outperform solitary solutions in terms of mechanical performance, notably compressive strength and energy absorption [30].
Researchers have used the Gibson–Ashby model to evaluate 3D-printed lattice structures made from materials like polylactic acid (PLA) [31,32,33,34,35]. The interplay between lattice geometry, material properties, and mechanical response controls engineered lattice behaviors.
These advancements enable the production of lattice structures with characteristics that surpass those of conventional engineering materials, paving the way for new ways of exploring lattices [36,37,38,39]. The combinations of two TPMS gyroid lattice structures and advancements in additive manufacturing techniques have revolutionized lattice fabrication [35,40,41,42].
Their controlled deformation and energy dissipation upon impact have shown that they could be used for shock absorption applications, especially in crash boxes and bumper beams for cars [43,44,45,46,47]. Previous research has verified the effectiveness of lattice-based bumper beams in absorbing impact energy and mitigating vehicle damage [33,34,35]. These applications demonstrate the suitability of lattice structures in regulating the absorption of energy in a variety of scenarios. This work aims to explore the mechanical properties of a newly designed composite Gyroid TPMS lattice that is advanced and bioinspired. This unique lattice combines walled TPMS with normal TPMS gyroid lattices using a Boolean subtraction method.
The finite element method (FEM) is a powerful computer methodology for structural analysis that provides insights into complicated behaviors under different situations [48,49,50,51]. We extensively use finite element analysis to simulate and numerically assess various lattice structures [52]. In biomimetic engineering, the FEM simulates stress distribution in dental implant systems using variable-pore size Voronoi lattices, replicating trabecular bone structures [53]. This method is necessary to evaluate how much energy quasi-statically loaded hybrid lattice structures can absorb, which leads to better mechanical performance [54,55].
This study examines how well the lattice works at five different relative densities to further determine if it has better mechanical properties than the single TPMS gyroid and walled TPMS gyroid lattices. We investigate the nuances of the Gibson–Ashby model, particularly its energy-absorbing ability and deformation behavior. Our new approach provides a comprehensive analysis of the PLA material family by comparing normalized energy absorption efficiency with normalized stress. Using the finite element method, we demonstrate that the stress–strain curve from mechanical compression tests accurately represents the linear elastic, plastic plateau, and densification phases. Our results are used in a real-world scenario by utilizing a crash box case study that is built from a composite TPMS gyroid lattice with various relative densities. Our ultimate goal is to further advance the study of bio-inspired lattice structures, specifically enhancing vehicle structural dynamics to increase crashworthiness.

2. Materials and Methods

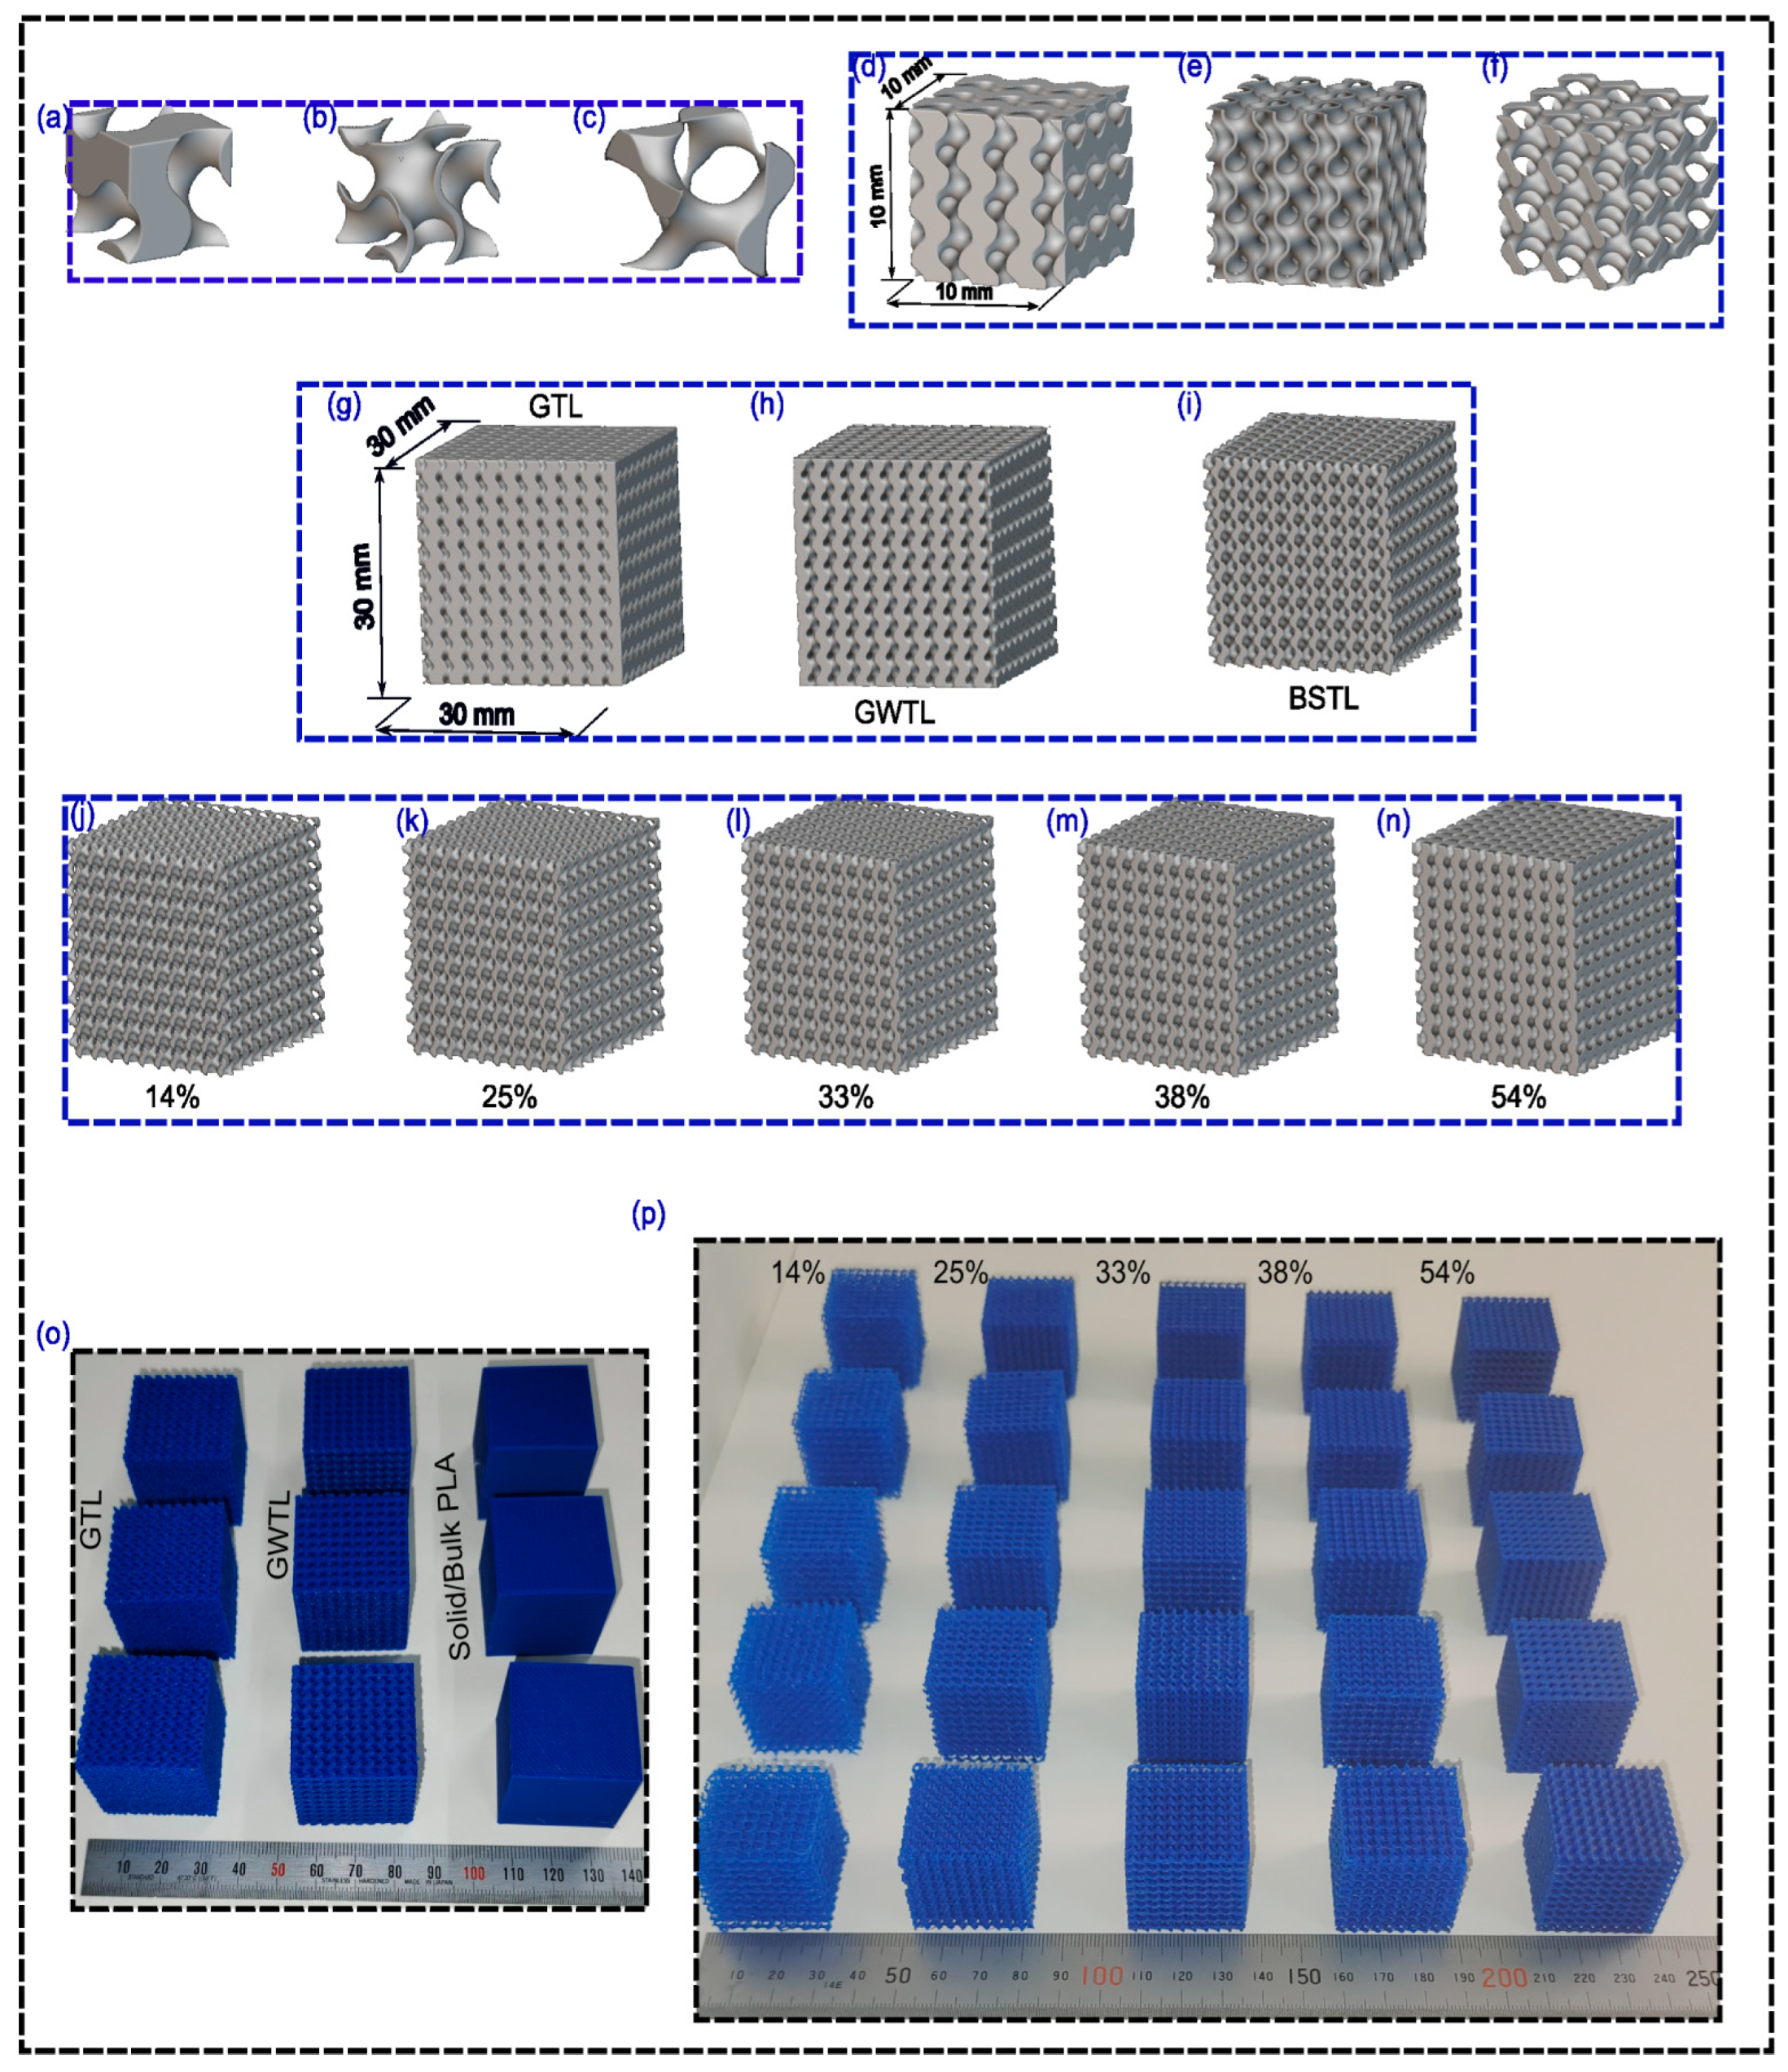
2.1. Lattice 3D CAD Design

The lattice structure’s design began with the creation of a comprehensive 3D CAD model using nTop 4.19.2 student-licensed software (Figure 2) [56]. Table 1 contains a comprehensive list of symbols and descriptions used throughout this research. Five intricate geometry of the composite TPMS gyroid lattice was accurately constructed, incorporating the specific parameters necessary for evaluating mechanical performance as outlined in Table 2. The relative densities of the composite lattice were systematically varied to encompass a broad spectrum of potential applications. The lattice design accounted for loading conditions, ensuring that the targeted mechanical parameters were representative of real-world scenarios. A new TPMS gyroid lattice unit cell (see Figure 2c) is made by putting together a regular TPMS gyroid lattice unit cell (see Figure 2a) and a walled TPMS gyroid unit cell (see Figure 2a). As seen in Figure 2, the normal unit cell has a closed-cell design with thick walls, while the walled unit cell has a closed-cell, sheet-type TPMS gyroid lattice. In contrast, the newly developed composite unit cell has an open-cell structure with beam-type walls, which is especially visible at lower relative densities.

2.2. Lattice Additive Manufacturing

To transform the conceptual lattice structures into physical objects, we employed fused deposition modeling (FDM) using a 3D printer. For this procedure, we picked a 1.75-mm-diameter blue polylactic acid (PLA) filament because of its excellent mechanical properties and adaptability for the manufacturing process. Table 3 outlines the specific settings for the RAISE3D PRO 2 printer, which we used to create all lattice samples, while Table 4 lists the characteristics of the PLA material. The slicing ideaMaker 4.2.3 (3DRaise Pro 2) software was utilized to convert the intricate 3D CAD model into precise print paths, accounting for layer-by-layer deposition to accurately reproduce the lattice design (Figure 2). The orientation of the lattice samples during 3D printing was in the flat (X-Y) plane. This orientation is chosen because lattice structures are self-supporting, eliminating the need for additional supports during manufacturing.

2.3. Measurement of Density and Relative Density

The Shimadzu Electronic Balance TW223N Series (Shimadzu Corporation, Kyoto, Japan) was used to accurately measure the density of the 3D-printed PLA-based TPMS gyroid lattice structures. PLA’s inherent theoretical density was determined to be 1.24 g/cm3. For increased precision, a set of six measurements were carefully recorded. Both the relative density and the porosity percentage were calculated precisely in accordance with ASTM D792-98 [57,58,59]. To perform this, the Equations (1)–(3) in the referenced standard were used.
The actual density of the composite TPMS gyroid lattice cube is calculated as follows:
ρ a c t u a l = M C G V C G
The relative density of each composite TPMS Gyroid lattice cube is as follows:
ρ * = ρ ρ P L A
And then, the porosity of the composite lattice can be calculated as follows:
P = ρ P L A ρ ρ P L A = 1 ρ *

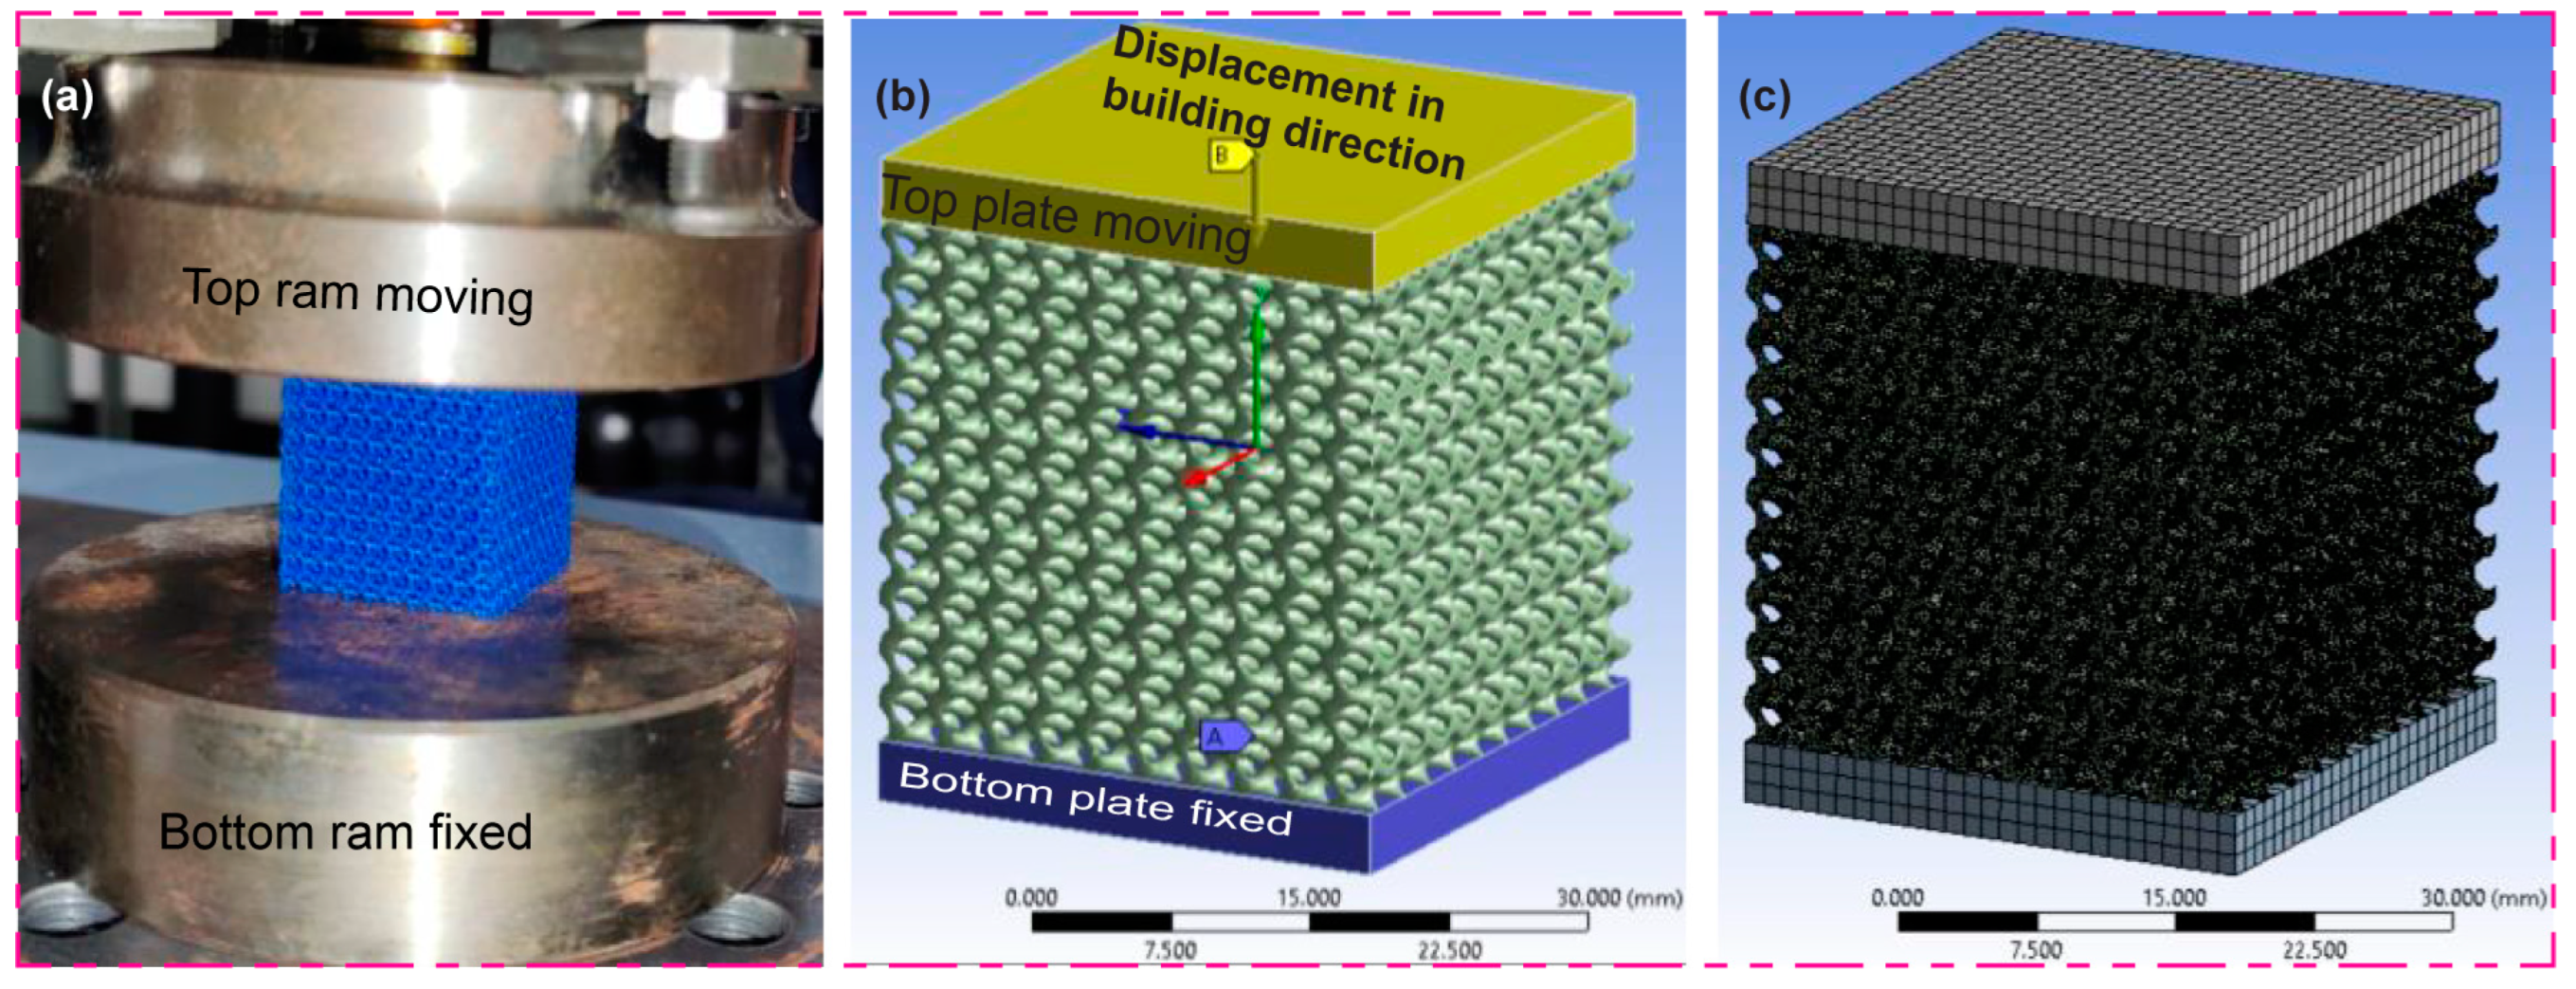
2.4. Mechanical Compression of Lattice

The quasi-static compression load test was conducted on all TPMS samples with universal testing machine SHIMADZU AG-100kNXplus equipped with 100 kN load cell and 0.005–1000 mm/min crosshead speed. All the TPMS samples were compressed between hardened steel plates with flattened top and bottom surfaces to avoid any small misalignment during compression loading according to ASTM D638-14 [17]. The sample specimens were placed between the moving top plate and fixed bottom plate of the test machine, where the compressive strain reached up to 60% of the original specimen heights in the building direction, which is the point where the densification dominates. The strain rate utilized for this study was 0.03 mm/s. To assess the mechanical characteristics of composite TPMS gyroid lattice (CTL) structures, we designed an experiment with five different relative densities. For a more comprehensive analysis, we tested a solid PLA cube, a standard TPMS gyroid lattice, and walled TPMS gyroid lattices. We performed at least three repeated mechanical compression tests on each sample type to confirm the findings’ reliability and accuracy. The setup for testing the mechanical compression of TPMS gyroid lattices and solid PLA cubes is shown in Table 5. This enabled the determination of peak stress, plateau stress, densification strain, and other vital parameters. The specimens underwent gradual compression until densification, allowing a comprehensive understanding of their deformation behavior and energy absorption capacities. We used Equation (4) for the experimental design.
T o t a l   n o . t e s t = n o . l e v e l s × n o . r e p l i c a

Gibson–Ashby Model

The parameter ‘n’ is of considerable importance in characterizing the various forms of deformation that occur within cellular structures [6,60,61,62,63]. The Gibson–Ashby model, a cornerstone in the analysis of cellular materials [64,65,66], establishes critical relationships among a multitude of parameters inherent to cellular structures. These fundamental parameters encompass relative density (ρ/ρs), plateau strength (σpl), elastic modulus (E), and the strain at the densification point(εD). These intricate relationships, elegantly described by power law Equations (4) and (5), offer profound insights into the mechanical characteristics of composite TPMS gyroid lattice structures.
Theoretically, power indices n and m are anticipated to be 1.5 and 2 for structures dominated by bending and emphasizing strength and 1 for those governed by stretching. A value of “n” equal to or greater than 2 indicates a prioritization of rigidity. ‘n’ values that fall within the aforementioned range serve as an alternative definition of a mixed mode of deformation.
E E S = C 1 ρ * ρ S n 1
σ p l σ y s = C 2 ρ ρ S n 2
The modified Gibson–Ashby model is crucial for applications requiring higher stiffness, like orthopedic surgical scaffolds and vehicle shock absorption systems. It is obtained from combination of Equations (4) and (5). It aligns with previous lattice design studies and allows comparison of strength-to-stiffness ratios among different relative density composite TPMS gyroid lattice structures [67,68,69].
σ p l σ y s = C 3 E E S n 3
The densification strain can be evaluated using the following:
ε D = 1 α ρ ρ S

2.5. SEM of Deformed and Undeformed Lattice

The SEM image of newly constructed TPMS lattice with 38% relative density was captured from two different planes, XZ and YZ, for both before and after compression testing. For such a purpose, the JSM-7400F field emission scanning electron microscope (FE-SEM) was utilized. The morphology and deformation behavior of the 3D-printed TPMS gyroid lattice structure were observed using FE-SEM. Scanning Electron Microscopy (SEM) analysis was conducted on both deformed and undeformed lattice specimens. This microscopic examination provided insights into the microstructural changes induced by mechanical deformation. SEM imaging aided in visualizing lattice distortions, fracture patterns, and any material irregularities arising from the compression testing process. And there are defects from the FDM printing due to printing filament melting rate variations, which reduce the mechanical strength.

2.6. Finite Element Analysis (FEA) of Lattice

To accurately capture the stress–strain characteristic of the 3D-printed TPMS lattice structure, a finite element model (FEM) was developed. In the numerical simulation, the commercial software package ANSYS 2022 was utilized. Following the experimental setting, similar boundary conditions are applied to all FE models. The FE mesh entirely consists of tetrahedrons. Since the FEM is the approximate solution for the purpose of reducing the numerical error, Ramesh surface, robust tetrahedral mesh, followed by FE volume mesh, were applied during FE discretization. Further, to accurately capture the experimental compression scenario from ANSYS Workbench 2022, the LS-DYNA analysis system was used. The TPMS lattice structure has an overall seed size of 0.2 mm and different mesh elements for all structures. To better simulate the post-softening (plasticity) behaviors after the lattice yield, the multilinear isotropic hardening model was utilized by supplying the plastic strain and stress in the plastic region. However, the elastic region just needs Young’s modulus and poison’s ratio calculated from the experimental result. To corroborate the experimental findings and gain further insights into the mechanical behavior of the bio-inspired gyroid Composite TPMS lattice, Finite Element Analysis (FEA) was conducted. Computational simulations were performed to predict mechanical responses under varying loading conditions. The FEA models were designed to replicate the experimental setup, allowing the extraction of stress–strain relationships and energy absorption characteristics. The FEA outcomes served as a validation tool for the experimental data and provided a deeper understanding of the composite lattice’s intricate mechanical behavior. The FE boundary conditions and the corresponding FE meshing of the sample are shown in Figure 3b and Figure 3c, respectively. Figure 4 shows the assembly of top and bottom plates with a composite TPMS gyroid lattice utilizing ANSYS space Claim and effortlessly linked into ANSYS LS-DYNA for further dynamic explicit compression analysis.

2.7. Energy Absorption

Extensive research has been conducted on the complex energy absorption properties of a PLA-based composite TPMS gyroid lattice, leveraging key parameters including energy absorption value (WV), energy absorption efficiency (γ), and ideal energy absorption efficiency (η). In this particular framework, the symbol “WV” represents “energy absorption”, and Equation (8) provides a dependable approach to calculating it in relation to volume [70,71]:
W V = 0 ε l a t t σ l a t t ε l a t t d ε l a t t
In this particular case, ε denotes a stochastic strain, σlatt represents stress, and εlatt is the corresponding strain; σ is a function that is dependent on ε [72]. The determination of the optimal energy absorption state in this composite lattice involves consideration of the energy absorption efficiency parameter, which can be mathematically expressed as follows [70,71]:
γ = 0 ε l a t t σ l a t t ε l a t t d ε l a t t σ l a t t
In this case, γ represents the efficiency of energy absorption by the PLA-based composite gyroid lattice during compression deformation, thereby decreasing the flow stress.
In addition, we include the following concept—ideal energy absorption efficiency (η) [70,71]:
η = 0 ε l a t t σ l a t t ε l a t t d ε l a t t σ l a t t ε l a t t
The ratio of the area enclosed by the stress–strain curve of the composite lattice to the rectangular area it encompasses illustrates the ideal energy absorption efficiency at any given strain. Furthermore, an energy envelope concerning lattice structures composed of PLA materials can be obtained by normalizing the cumulative energy absorption per unit volume of this composite TPMS gyroid lattice by the Young’s modulus of its base material and plotting a curve against the normalized stress (which is also divided by the Young’s modulus) [73]. It is important to remember that both the normalized stress axis and the normalized energy absorption efficiency axis are logarithmic. This makes it possible to accurately show the complex mechanical properties that these lattice structures exhibit.

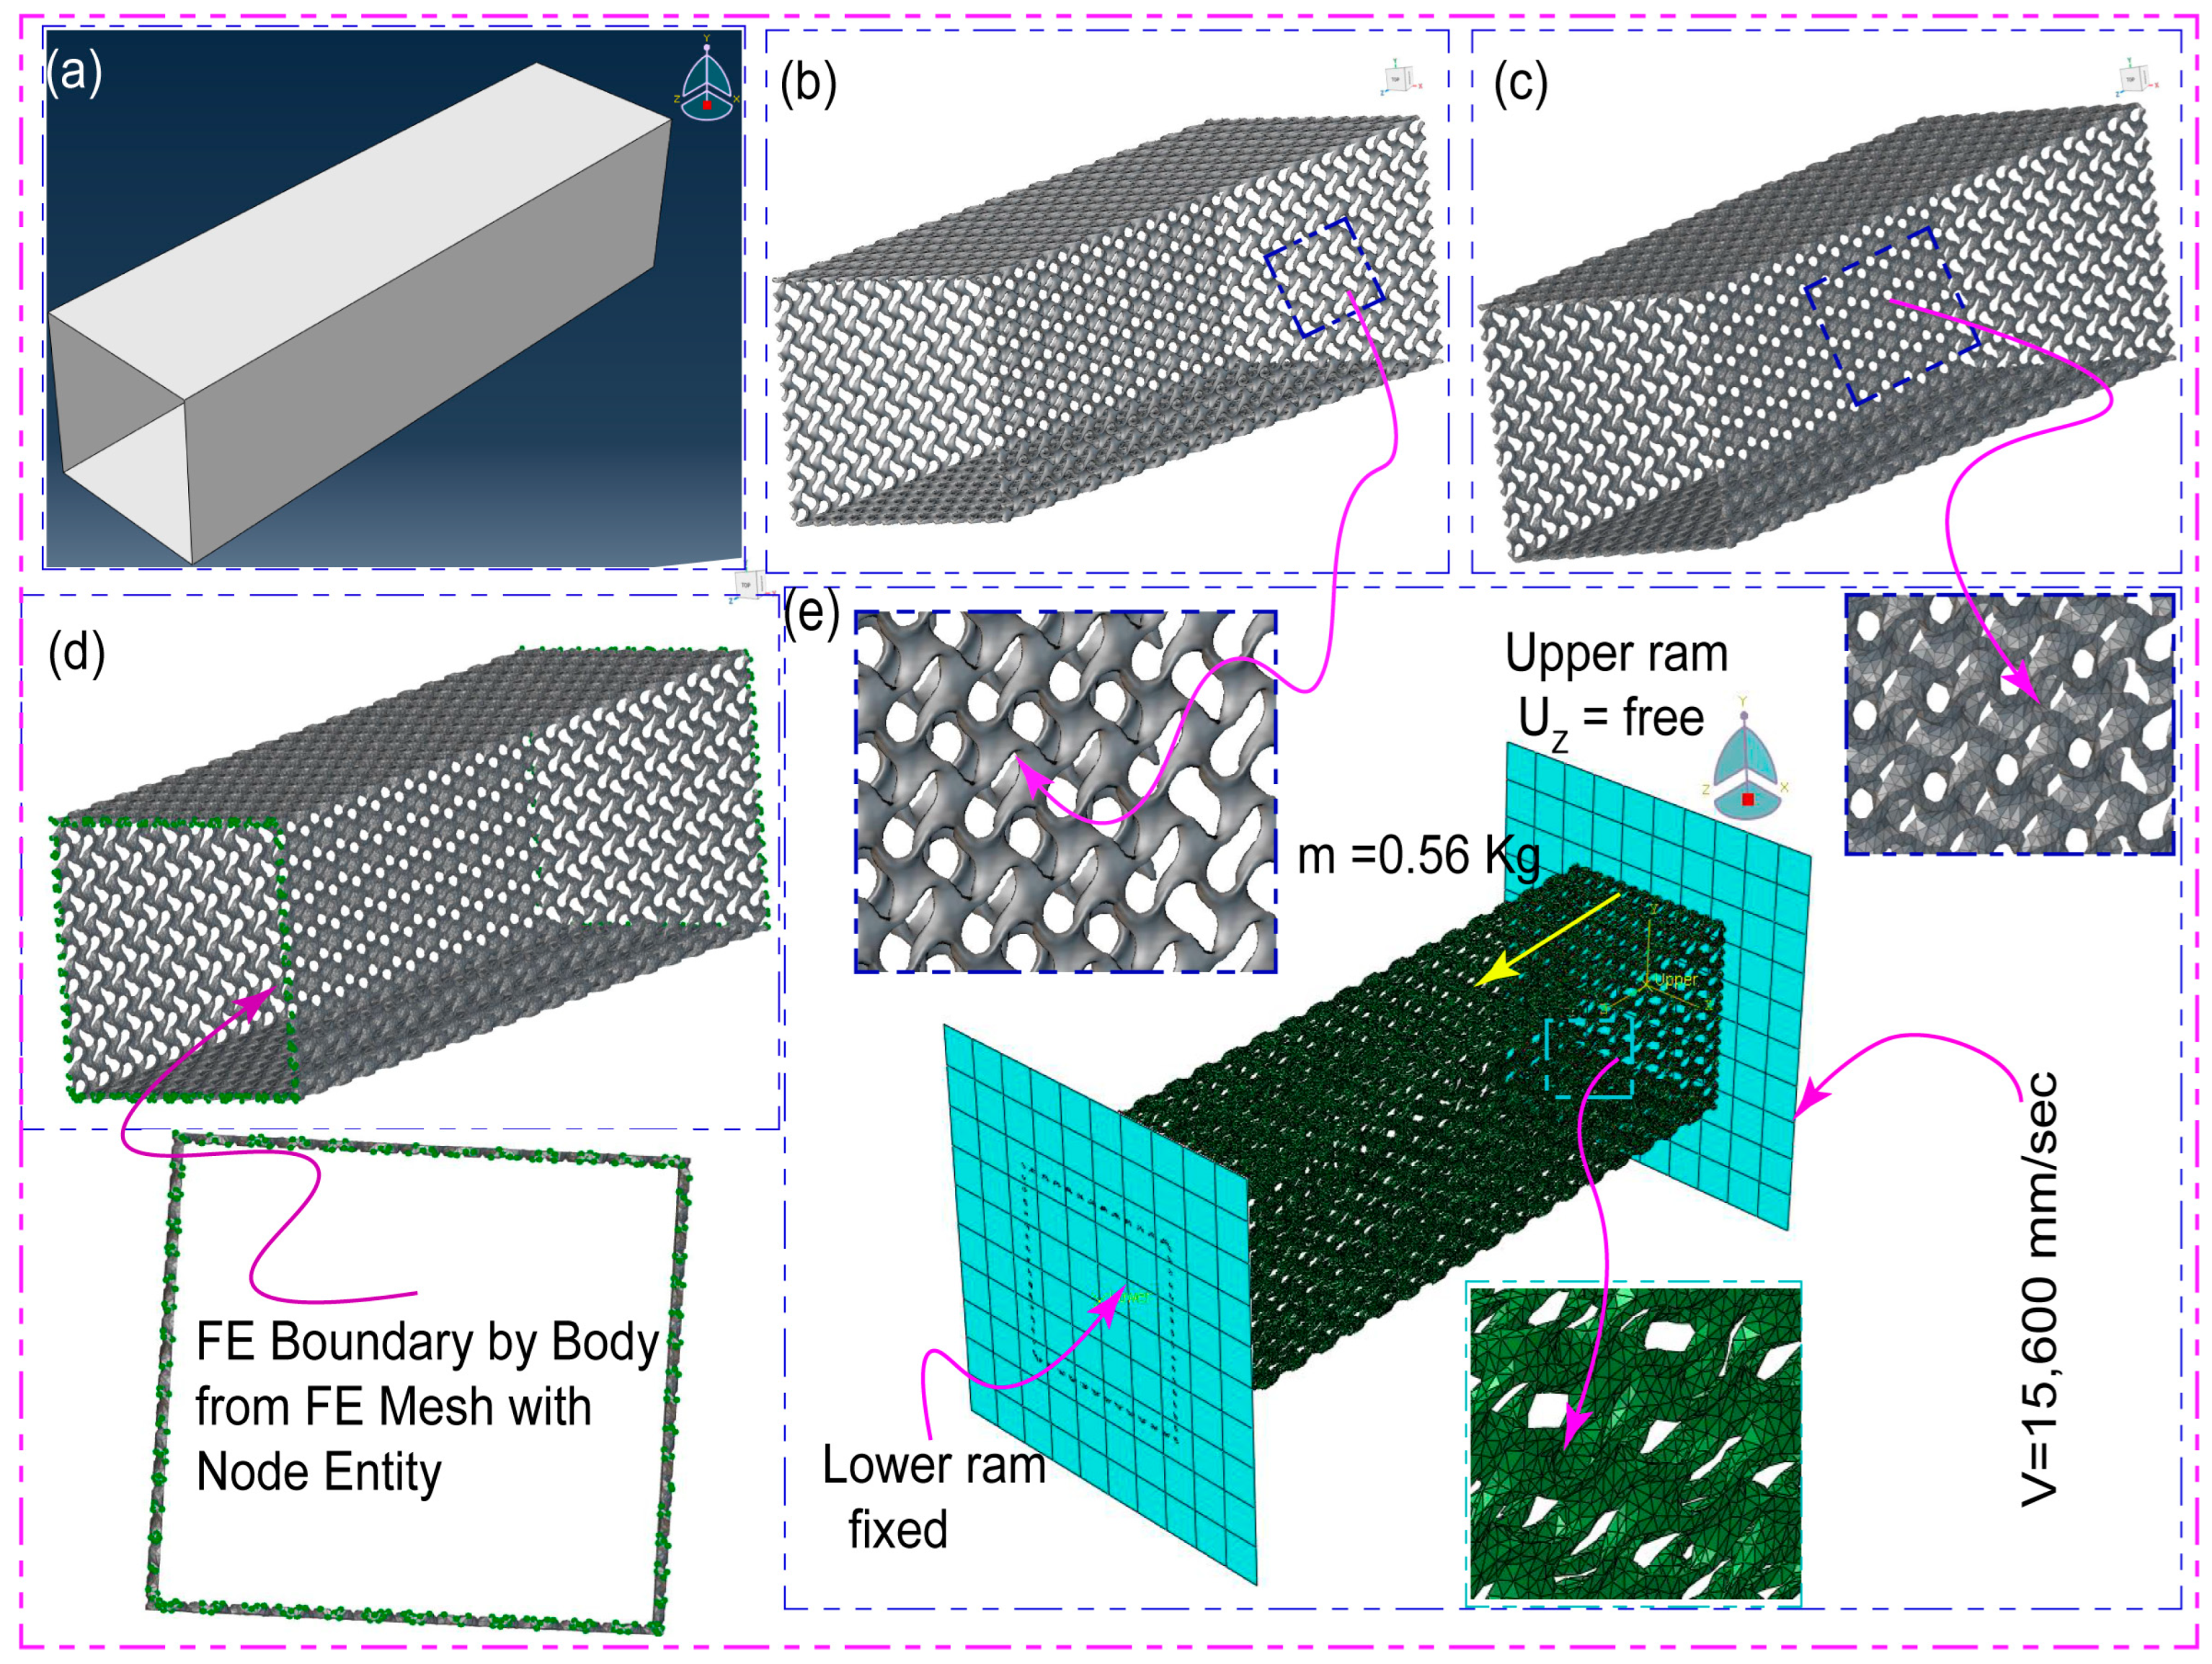
2.8. Case Study on Vehicle Crush Box Energy Absorption

The aim of this case study is to evaluate the composite TPMS gyroid lattice structure’s high-energy absorption capabilities under 15.6 m/s impact scenarios. We classify this as a high-velocity impact because it is significantly faster than the norm of 5–6 m/s. Thus, test results are expected to provide a more reliable indicator of the composite lattice or compression box’s resistance in real-world conditions. The implications of the results of mechanical compression experiments on TPMS gyroid lattice structures with relative densities of 14%, 25%, 33%, 38%, and 54% for enhancing the crashworthiness and safety of automobiles are optimistic. For the purpose of the investigation, a 50 mm × 50 mm × 200 mm square shell-type box with a 1.5 mm thickness was used [74,75], as shown in Figure 5. We properly designed and constructed five TPMS gyroid latticed square crash boxes using nTop 4.19.2 software, each of which corresponded to one of the five relative densities examined in this work.

3. Result and Discussion

3.1. Lattice Samples Density and POROSITY Measurement

Table 6 illustrates the average values of measured weight, calculated actual densities, calculated relative densities, and porosities (volumetric percentage) of FFF-printed PLA TPMS gyroid Lattice samples. The standard deviation is evaluated for the corresponding measured weight and actual densities. The actual densities of printed samples vary according to the theoretical density of 1.24 g/cm3 of PLA. The calculated maximum porosity is 86% for composite TPMS gyroid lattice with the lowest relative density of 14%. Similar to the actual densities, the calculated porosity varies with the measured weight of the sample lattices.

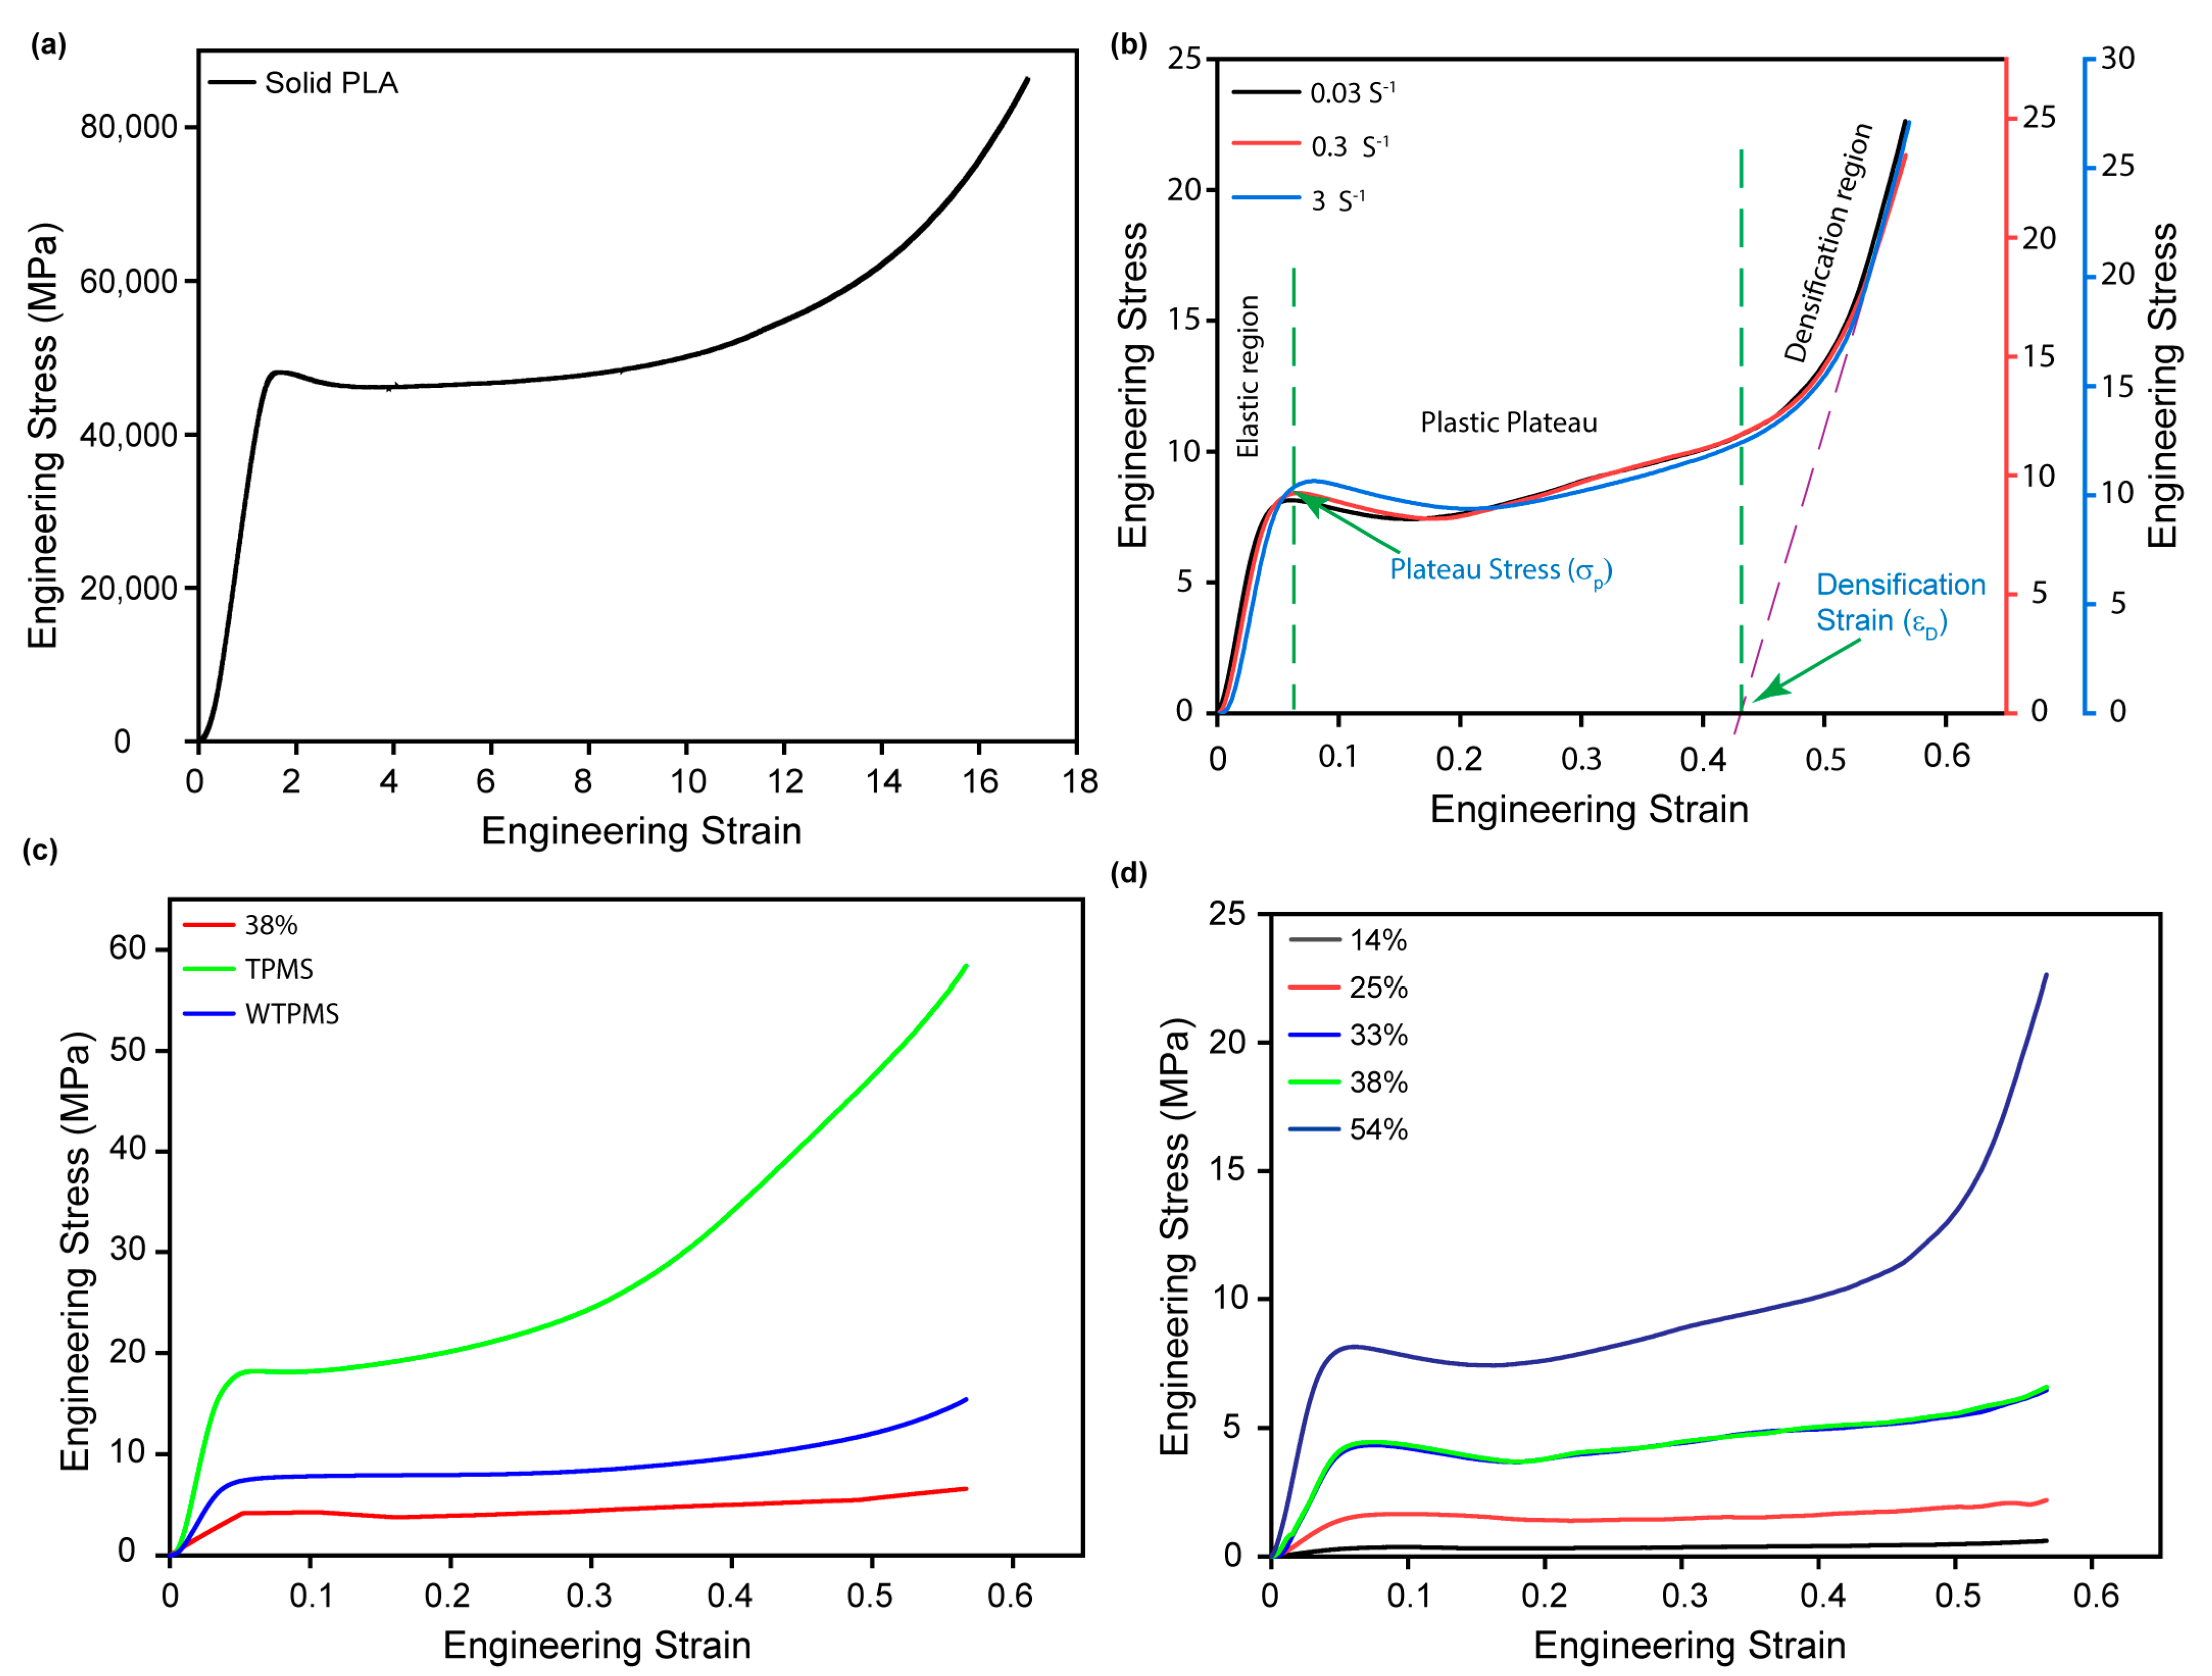
3.2. The Mechanical Properties and Compressive Response

Our results closely support Ashby’s theories, showing that an ideal energy absorber has a longer plateau phase in the stress–strain curve, with the plateau stress falling below the protected object’s stress threshold [76]. Figure 6a,b present the compressive stress–strain curve of Solid printed PLA TPMS lattice with five different relative densities and TPMS lattice types, respectively. The mechanical stress–strain response of the composite TPMS-gyroid lattice with 33% and 38% relative density is approximately overlapped, indicating repeatability. There are three interesting regions that were realized for the composite TPMS gyroid with 54% relative density, and the conventional TPMS lattice resembles the Gibson and Ashby model described in [77,78,79,80,81,82]: a linear elastic region, a plateau region, and a densification region. There were no significant mechanical properties lost during the collapse scenario, except for the composite TPMS gyroid lattice with a relative density lower than 15% (Figure 5a and Figure 6a,b). This was expected since stiffness is expressed as the ratio of force to displacement and is directly affected by the size effect [83]. Figure 7 depicts the results of mechanical compression testing at five different relative densities and five strain stages, with a maximum displacement of 17 mm and a corresponding strain of roughly 60%. Beyond this point, the lattice stops deforming and enters the densification stage. The studied deformation patterns clearly show the elastic, plastic plateau, and final densification properties.
The combined results of mechanical compression tests and finite element method (FEM) compression deformation studies are shown in Figure 8. These show that the composite TPMS gyroid lattice structure fails in two different directions, each with a different cause. The vertical walls collapsing down by buckling and the horizontal walls collapsing down by bending are the two types of failure modes that our technique predicted. This duality in failure behavior endows the innovative lattice structure with unique properties under external compressive pressures, as demonstrated in Figure 8.

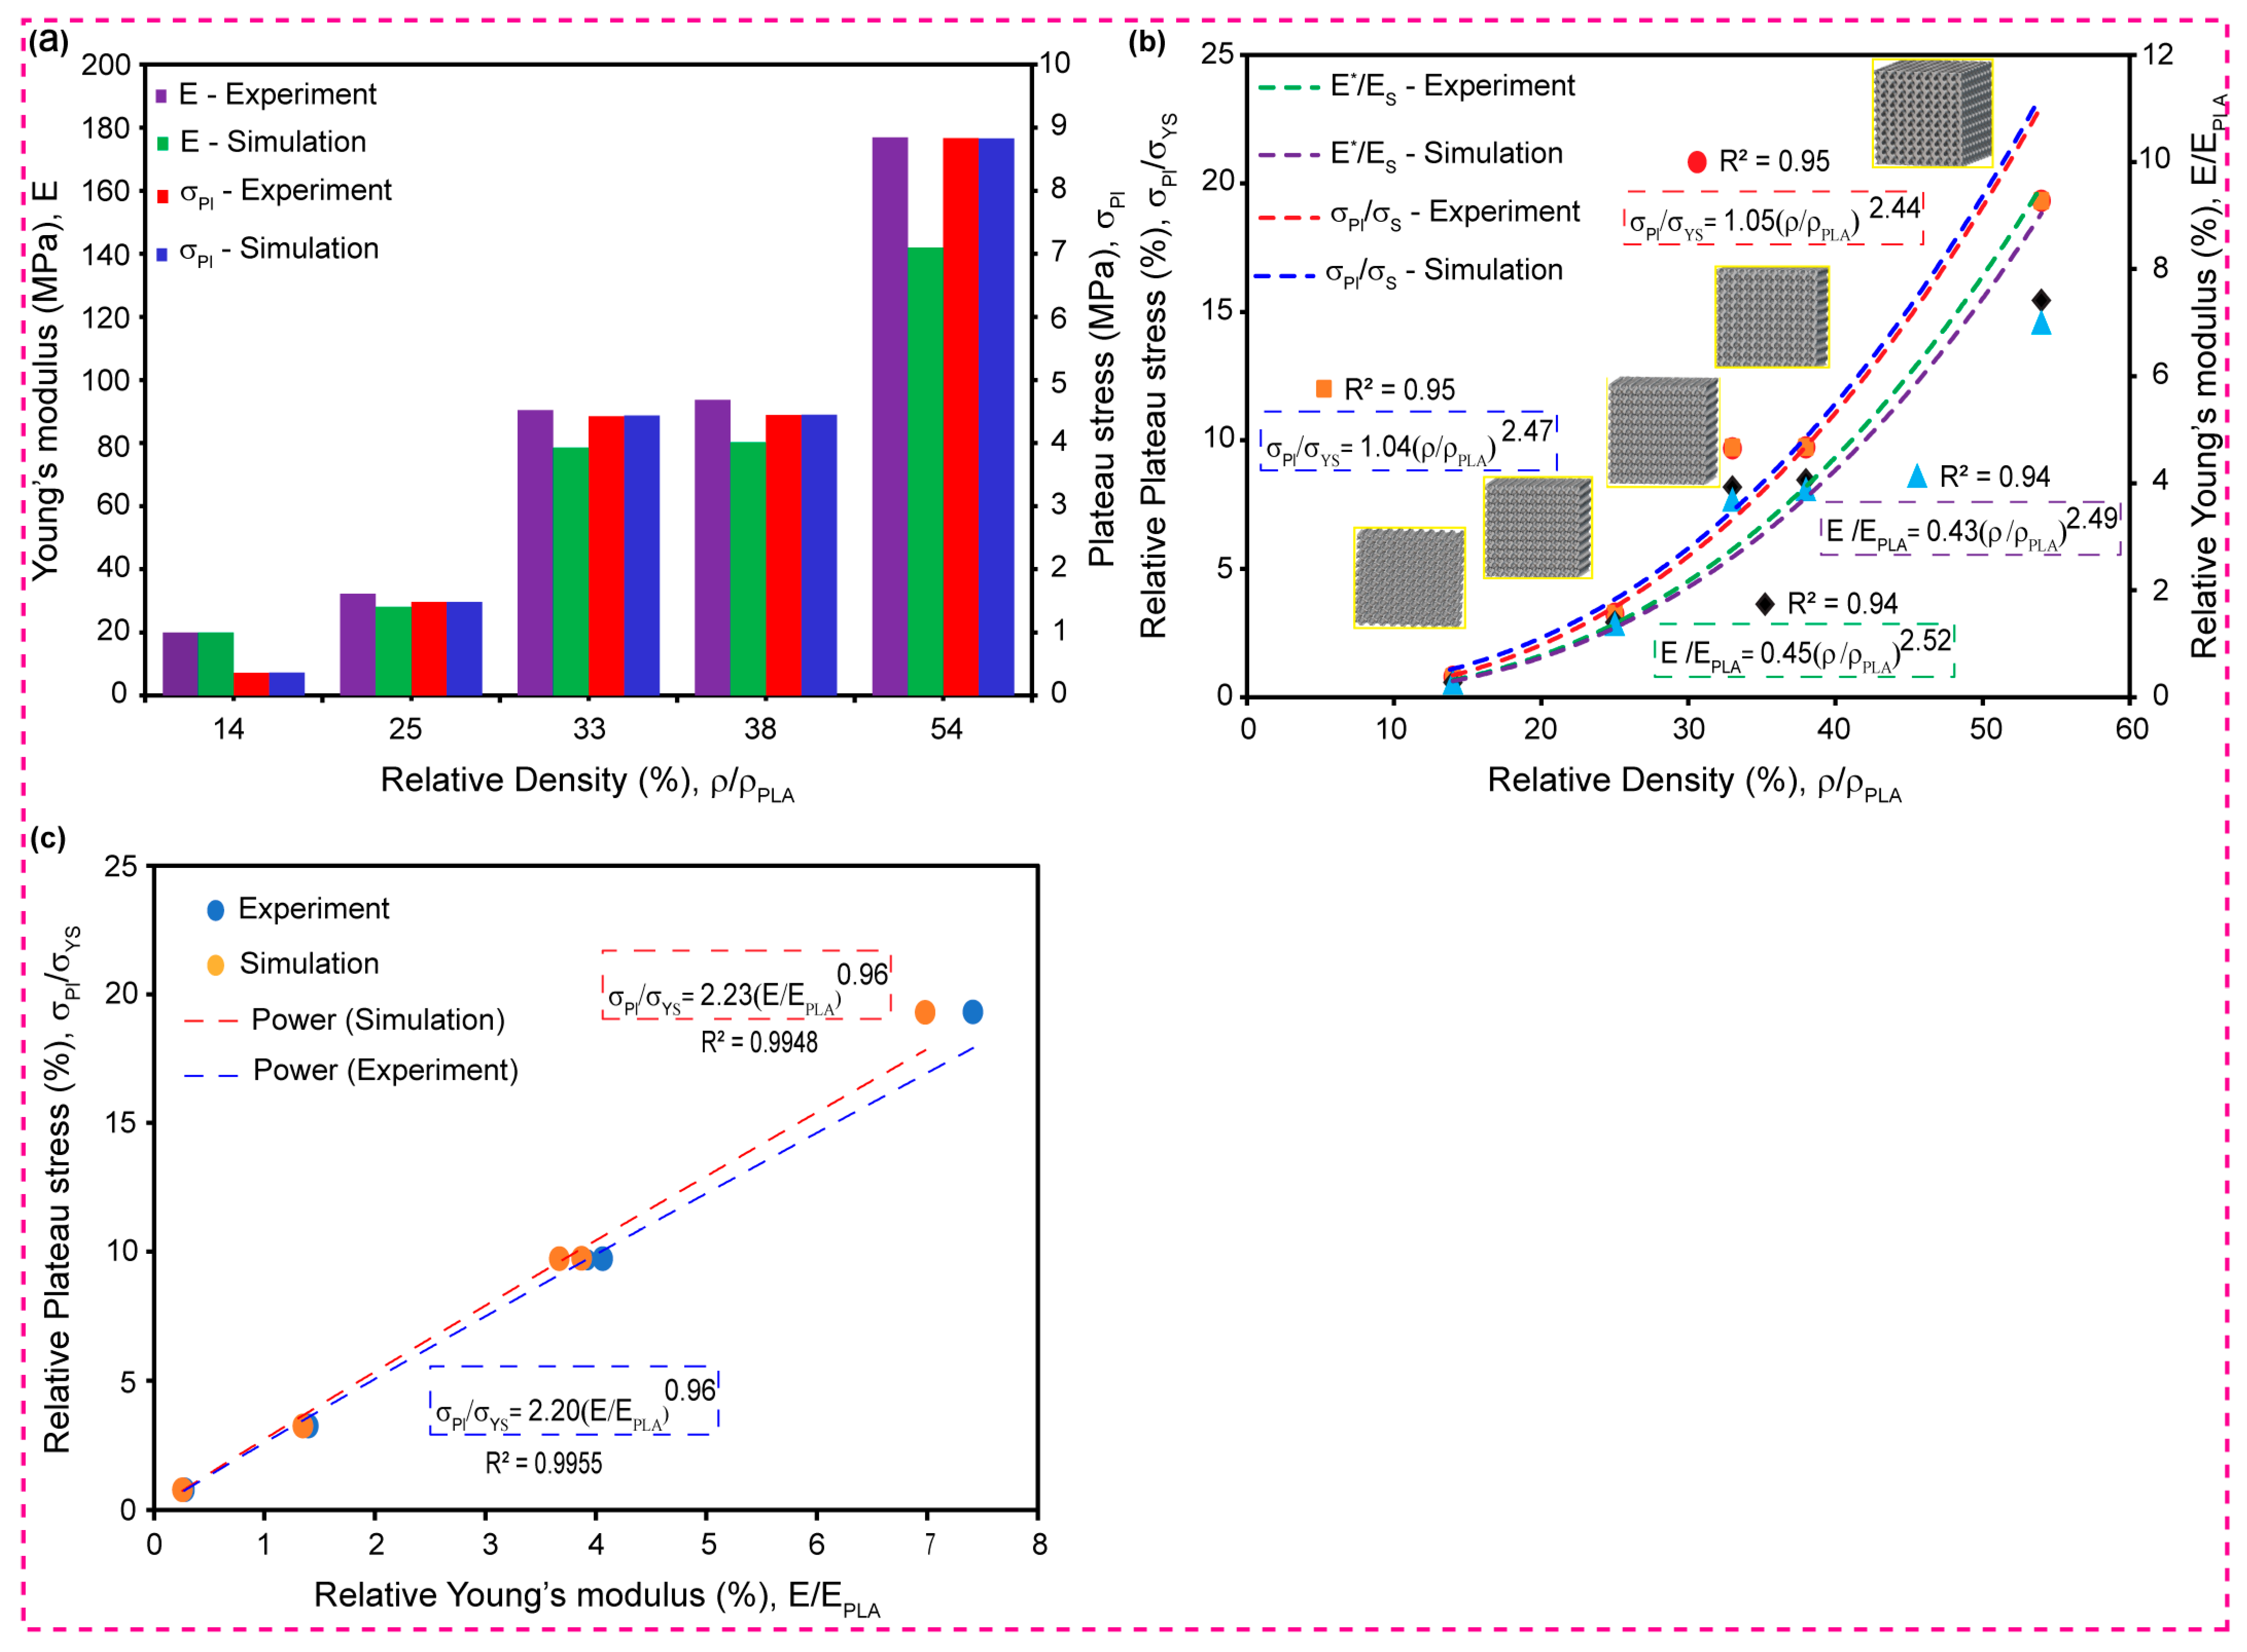
3.3. Plastic Plateau Stress and Young’s Modulus

Young’s modulus (the primary axis) and plateau stress (the secondary axis) are shown on a graph in Figure 9a. It shows how these two parameters change for five different relative densities of the composite TPMS gyroid lattice in both mechanical compression and finite element (FE) simulations. The stress vs. strain curves of the composite lattice structures are the source of these mechanical properties. The findings indicate a clear relationship: as the relative density of the composite lattice increases, the elastic modulus and plateau stress consequently rise. Both simulated and experimental data exhibit this property. The highest and lowest percentage errors, when comparing Young’s modulus between the findings of the simulation and the experiment, are 9.21% and 10.02%, respectively. In contrast, the highest and lowest percentage errors between the simulation and experiment data for the plateau stress are 0.017% and 0.22%, respectively. For the mechanically compressed composite lattice structure, the percentage error in Young’s modulus is greater than the percentage error in plateau stress. This indicates that the finite element analysis accurately captured the plastic plateau zones. Table 7 displays the percentage errors between the simulation and experimental results for Young’s modulus and plateau stress. This demonstrates how accurate the models were, as well as how they varied for different relative densities of TPMS gyroid lattices. This is important for making sure that the models used in the study are accurate.

3.4. Gibson–Ashby Power Fitting Analysis

The relative modulus, derived from both simulations and practical experimentation, exhibits a discernible increase as the relative density rises, as illustrated in Figure 9b. This figure visually and succinctly summarizes the findings and emphasizes a clear trend. The experimentally determined parameters for the TPMS Gyroid composite structure are n1 and C1, equal to 0.45 and 2.52, respectively. The numerical values of 2.49 for n1 and 0.43 for C1 were produced concurrently by the finite element method (FEM) simulation. Interestingly, there is a clear pattern in the relative modulus divergence between the five different relative density composite Gyroid lattice architectures. A consistent pattern is observed at relative densities of 14% and 25%. In contrast, the relative modulus of the 54% composite TPMS Gyroid structure is nearly five times that of the 14% relative density composite lattice. This substantial mismatch is attributable to the distinctive deformation mode intrinsic to this structure, as illustrated graphically in Figure 9b.
As relative density increases, the difference between the relative modulus values derived from experimental and simulated data becomes more noticeable. The experimental and computer-based mechanical compression analyses make it clear that the relative density has a big impact on the relative modulus of the five lattice samples. It is also possible to evaluate the relative plateau strength using data from experiments and finite element analysis (FEA) simulations that are in line with the Gibson–Ashby model. This procedure yields the parameters C2 and m. The experimental data yield the following values for C2 and n2: 1.05 and 2.44, respectively. The simulation data, as displayed in Figure 6b, indicate that the obtained values are 1.04 and 2.47.
The fitting curves exhibit a discernible trend, as illustrated in Figure 9b. Specifically, the relative plateau stress within composite TPMS gyroid structures increases substantially as the relative density rises. An examination of the five composite TPMS gyroid architectures through the comparison of experimental data and finite element analysis (FEA) outcomes yields intriguing findings. Comparing the two techniques at relative densities of 14% and 25%, we find that the relative plateau stresses are virtually identical. As relative density increases, the experimental and FEA simulation results for individual plateau stresses reveal a distinct discrepancy. The relative plateau stress in the experiments is about 0.2 at 54% relative density, which is about 20% higher than the value of 0.18 found in the simulations for the composite Gyroid architecture.
This is an interesting finding. The simulation results and mechanical compression experiment both showed that the relative density had a significant impact on the relative plateau stress of these five composite TPMS gyroid structural types. Our new composite lattice exhibits a bending-dominated deformation mode. And it demonstrates similar behavior to an idealized gyroid lattice and ligament-based TPMS. This conclusion is drawn from the observation that the Gibson–Ashby model yields a value of n ≥ 2 when utilized for data fitting that includes both experimental and simulation results. This finding is in line with the results of other previous studies [84,85].
Moreover, Figure 9c represents an intricate relationship between relative plateau strength and relative Young’s modulus, which can be illustrated using the modified Gibson–Ashby model. Through accurate data fitting, precise values of C3 and n3 may be achieved with the help of this graphical depiction. For each of the five composite lattice structures with various relative densities, simulation data and mechanical compression testing effectively verify the graphs that show the relationship between relative plateau stress and relative Young’s modulus. The results of experimental testing demonstrate that the values of n3 and C3 are 0.96 and 2.32, respectively. Nevertheless, in the simulation, the corresponding values are 0.96 and 2.20. The experiments and computer models also look at a consistent link between the relative Young’s modulus and the relative plateau stress for gyroid lattice structures made of 14% and 25% composite TPMS. The differences in the results between the simulations and the experiments are evident, but they increase in significance by increasing the relative Young’s modulus. It is shown that the relative stiffness has a significant effect on the strength ratio of composite lattice structures that are systematically designed utilizing Boolean subtract operations. By using these significant effects, the PLA lattice family’s architectural form is modified to max each of the five composite lattice structures with various relative densities. Simulation data and mechanical compression testing effectively verify the graphs that show the relationship between relative plateau stress and relative Young’s modulus. The results of experimental testing demonstrate that the values of n3 and C3 are 0.96 and 2.32, respectively. Nevertheless, in the simulation, the corresponding values are 0.96 and 2.20. The experiments and computer models also look at a consistent link between the relative Young’s modulus and the relative plateau stress for gyroid lattice structures made of 14% and 25% composite TPMS. The differences in the results between the simulations and the experiments are evident, but they increase in significance by increasing the relative Young’s modulus. It is shown that the relative stiffness has a significant effect on the strength ratio of composite lattice structures that are systematically designed utilizing Boolean subtract operations. By using these significant effects, the PLA lattice family’s architectural form is modified to maximize its energy absorption capacities.

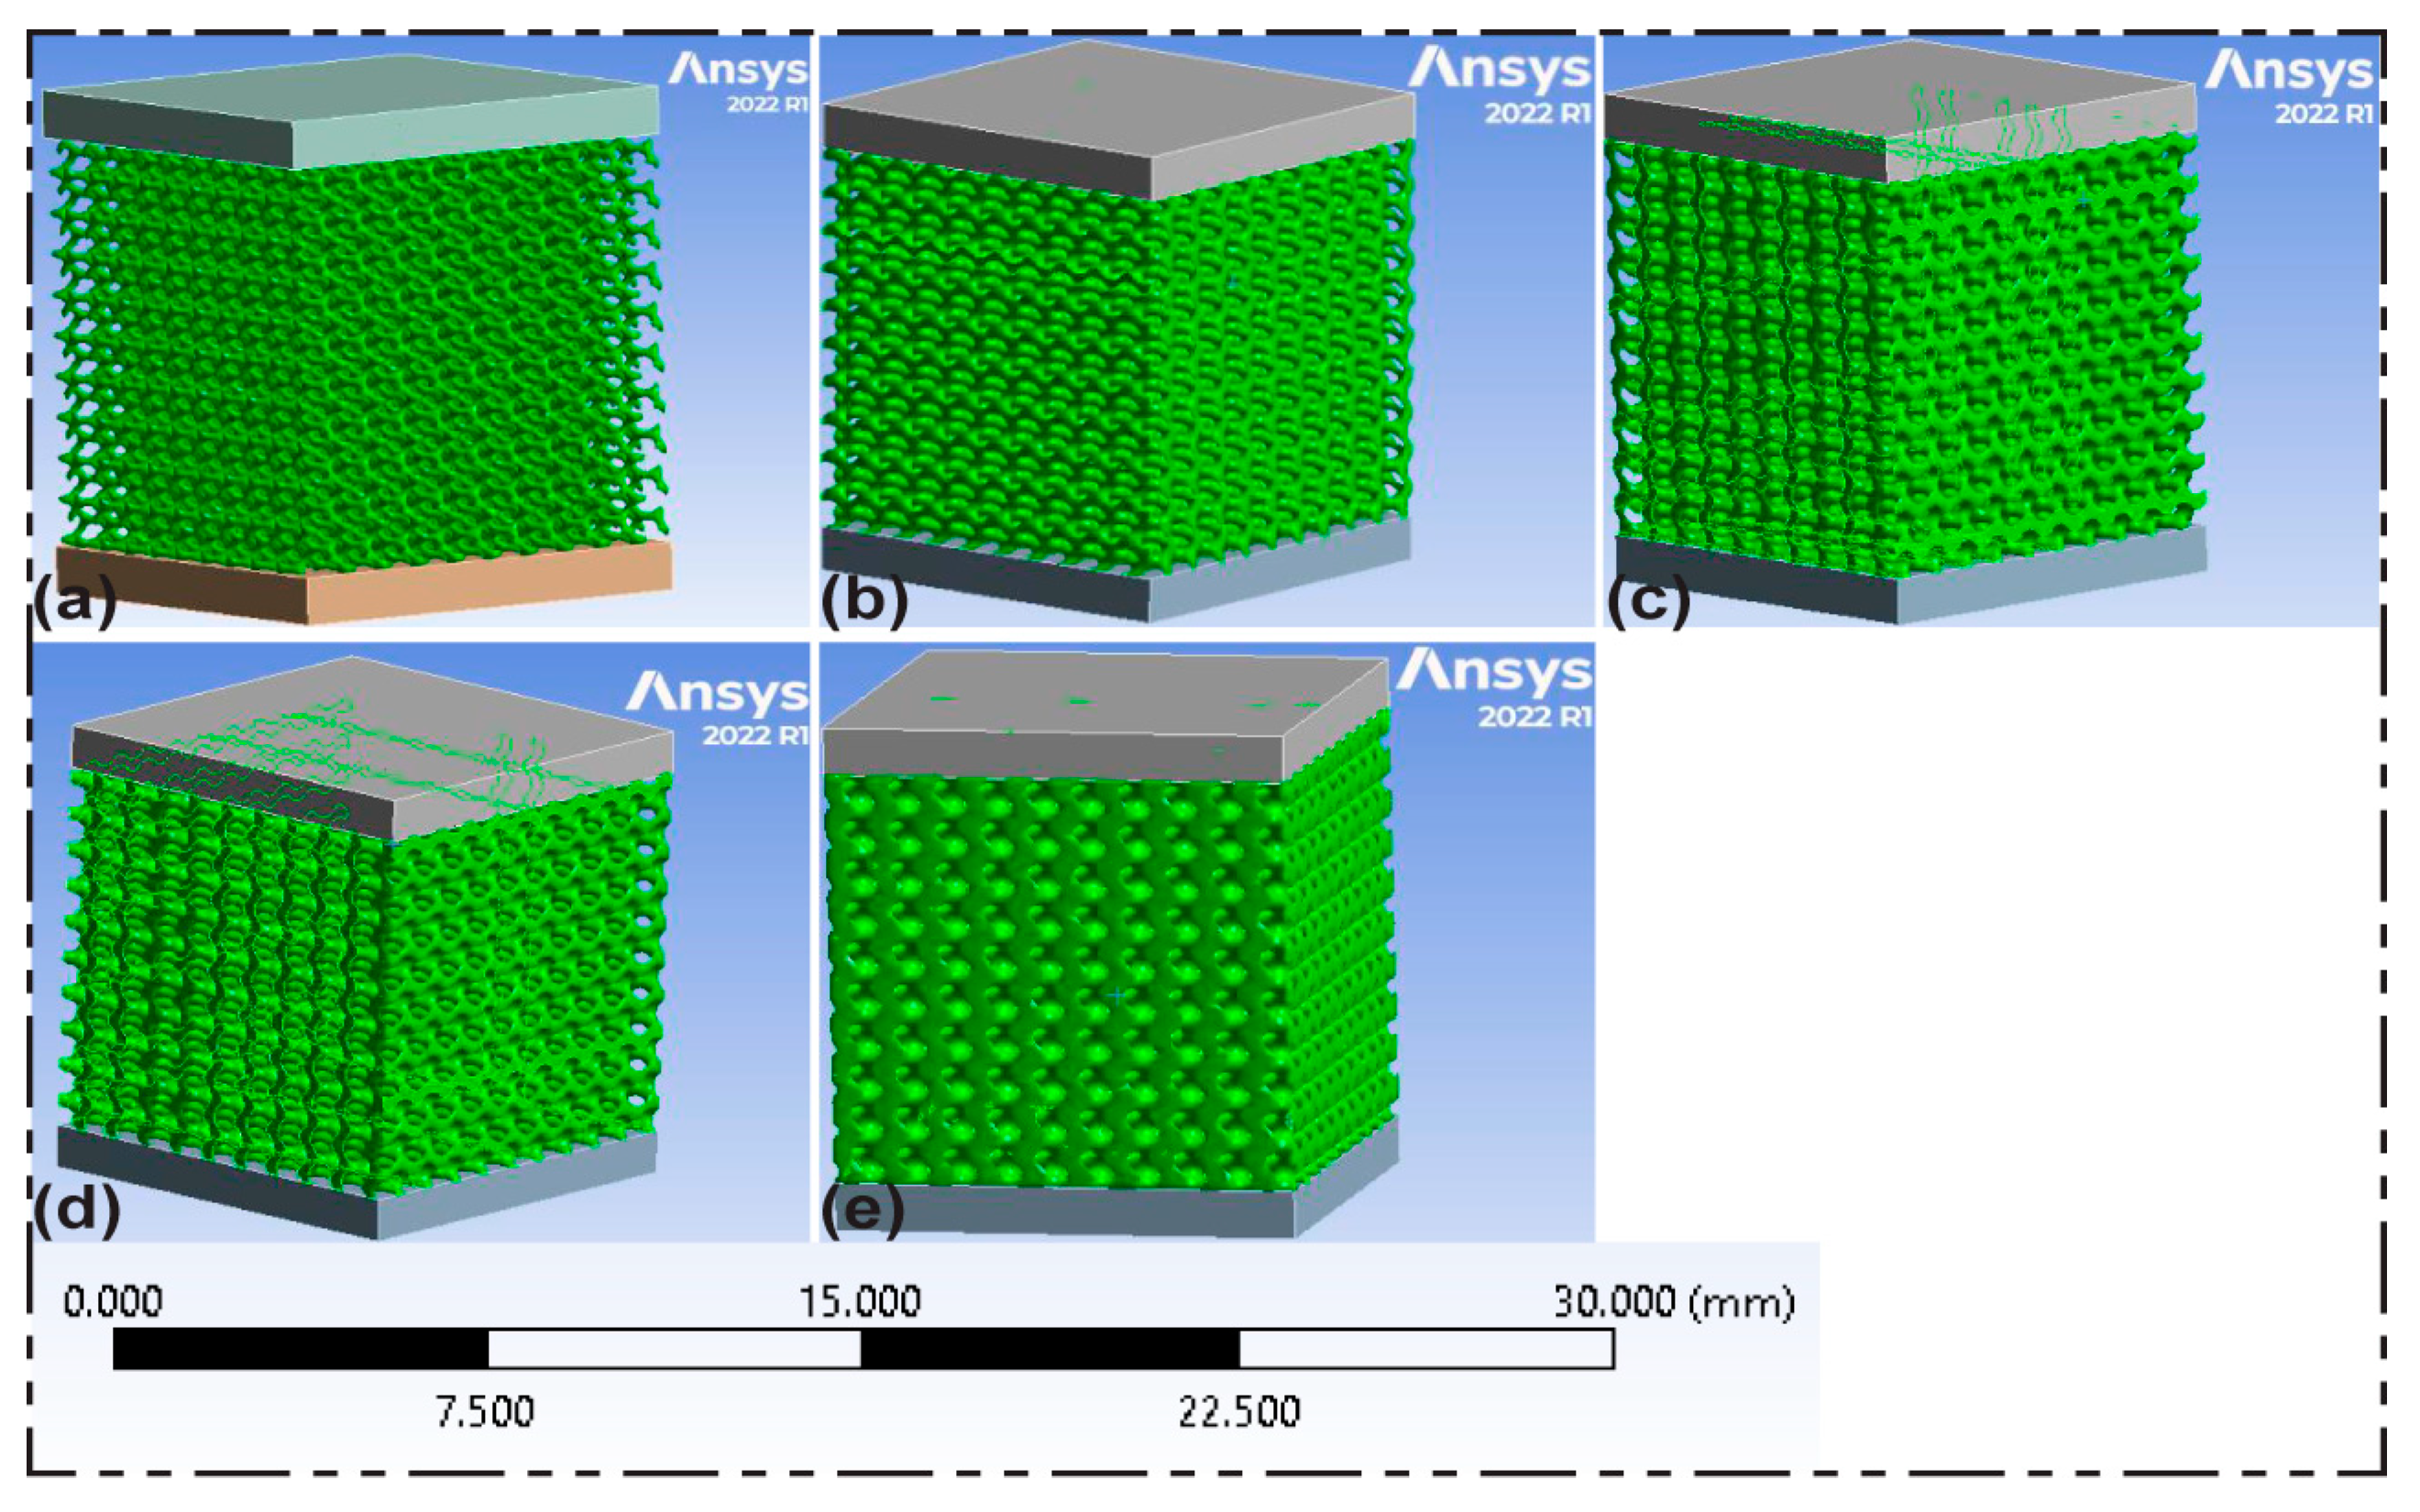
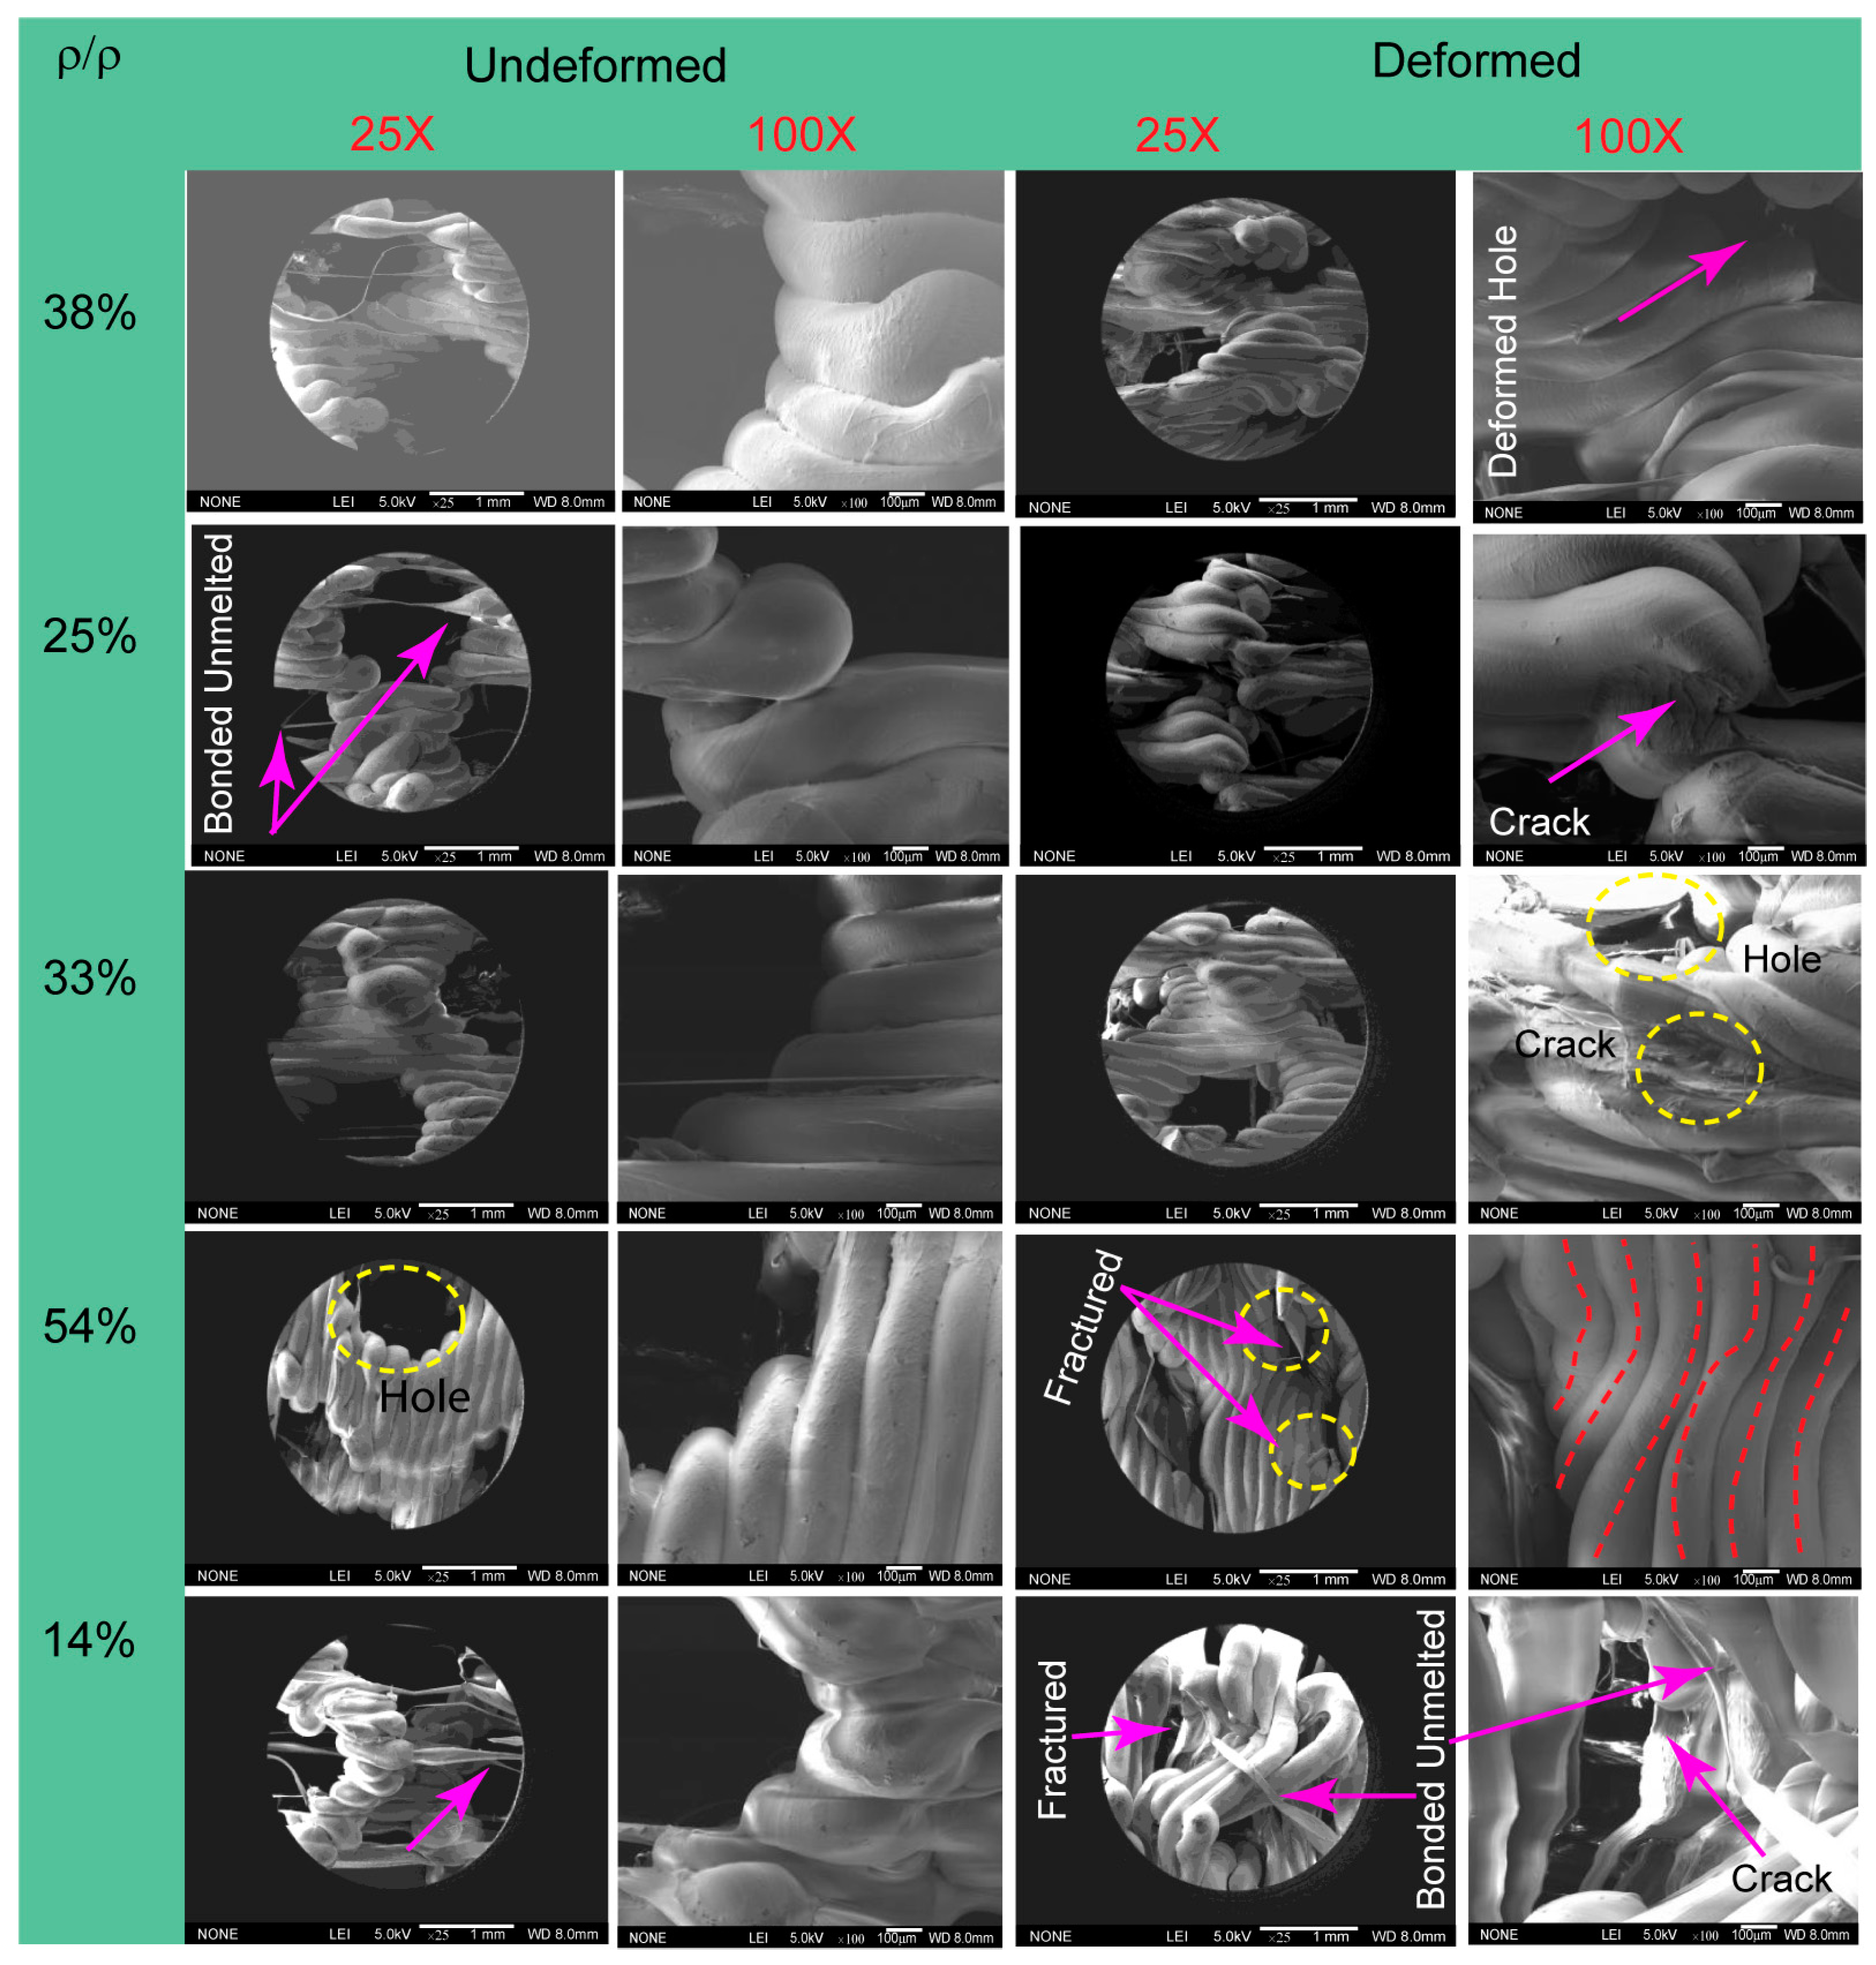
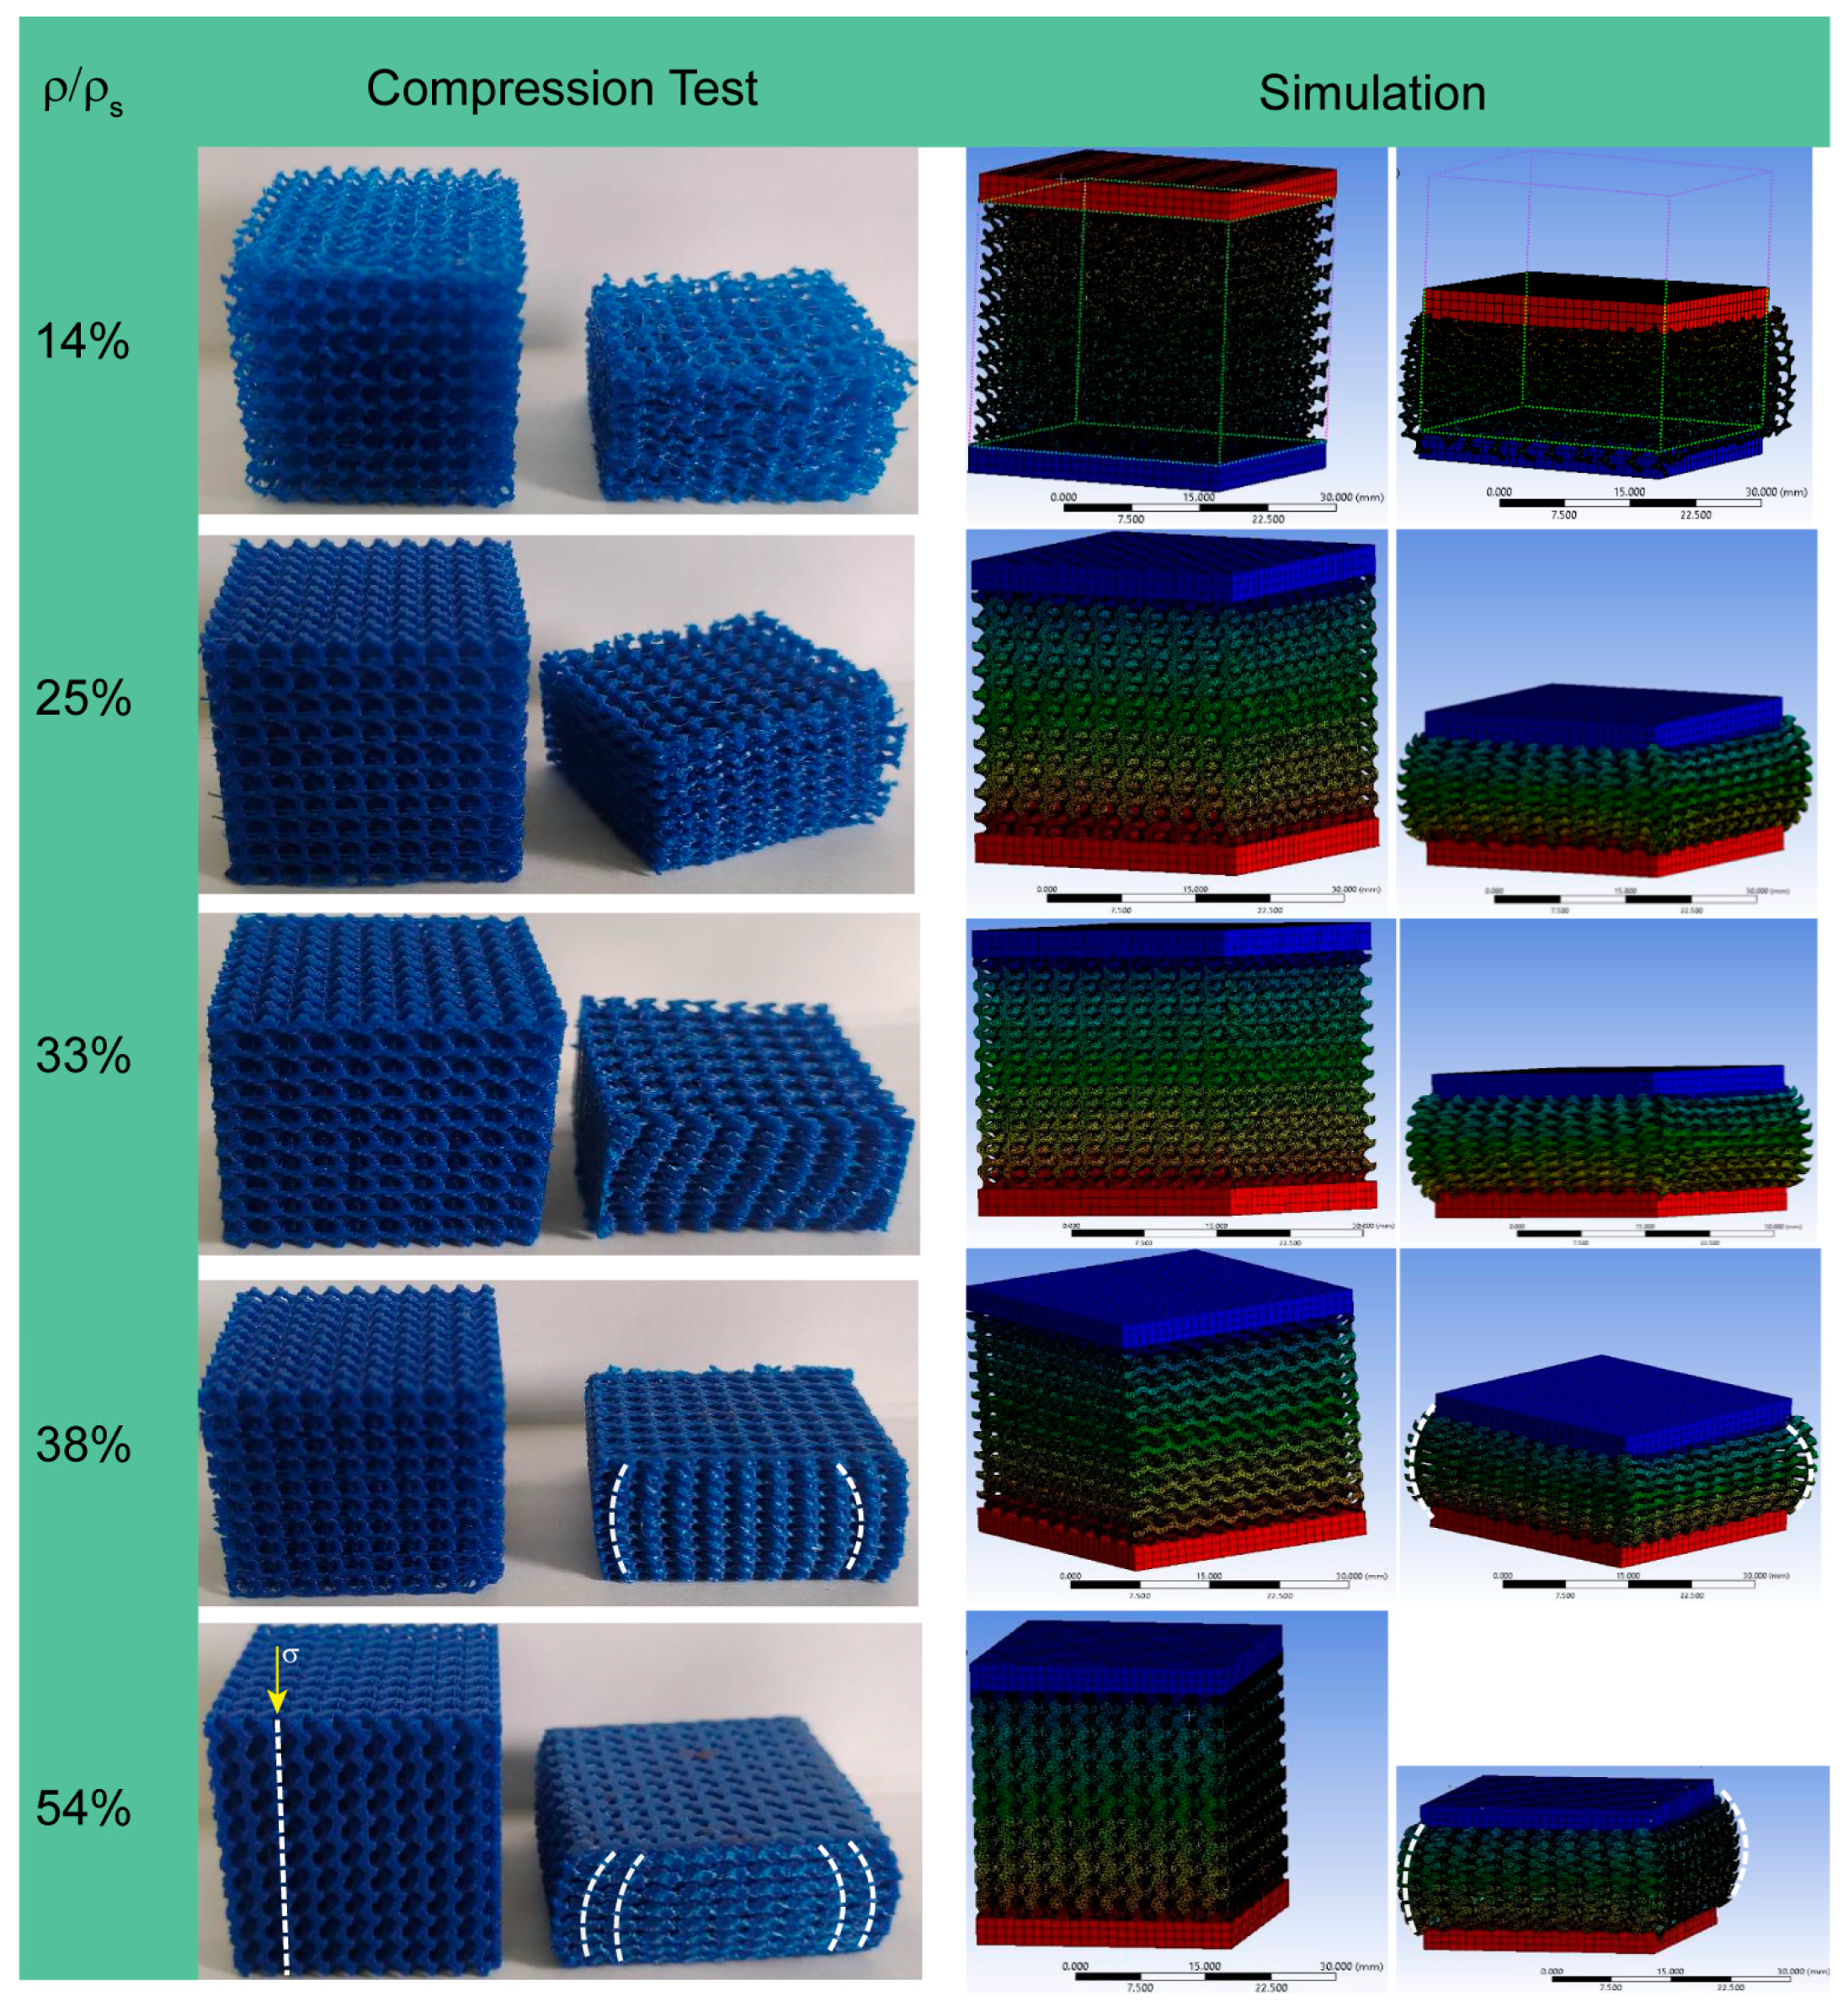
3.5. Microstructure of Undeformed and Deformed Lattice Structure

In Figure 10, we show a series of scanning electron microscopy (SEM) images that show the fine details of fused deposition modeling (FDM)-made composite TPMS gyroid structures. The two dissimilar states of the structures—their initial, undeformed condition and their transformed state after mechanical compression—are compared in the images below. The visual data show the subtle morphological changes caused by the applied stresses. The visual data were obtained at magnifications of 25× for the undeformed structures and an enhanced 100× for the deformed counterparts. While it is undeniable that additive manufacturing has many benefits over more conventional approaches to manufacturing, there are also some important limitations to avoid. One such limitation is the possibility that the mechanical properties of a product will be affected by the printing parameters executed, which could have a knock-on effect on the final lattice structure. Figure 10 depicts the results obtained from the FE-SEM investigation, which provide important knowledge about these structural modifications. The undeformed SEM picture reveals the presence of non-melted filament-bonded particles and the presence of distinct layers of varied diameters when examining a lattice with a 14% relative density. However, the deformed SEM picture illustrates considerable mechanical property degradation during compression, revealed by fractured layers and significantly deformed holes.
In contrast, the deformed SEM image of the 54% relative density lattices shows bending-dominant behavior, where layers display identical bending. The significance of relative density on the mechanical response of the lattice is demonstrated by the present finding. These results emphasize how crucial it is to preserve precise control over printing settings and have an in-depth understanding of how they influence lattice structure and subsequent mechanical performance. We contribute to the scientific community by facilitating such insights into additive manufacturing and improving the quality and performance of lattice structures.

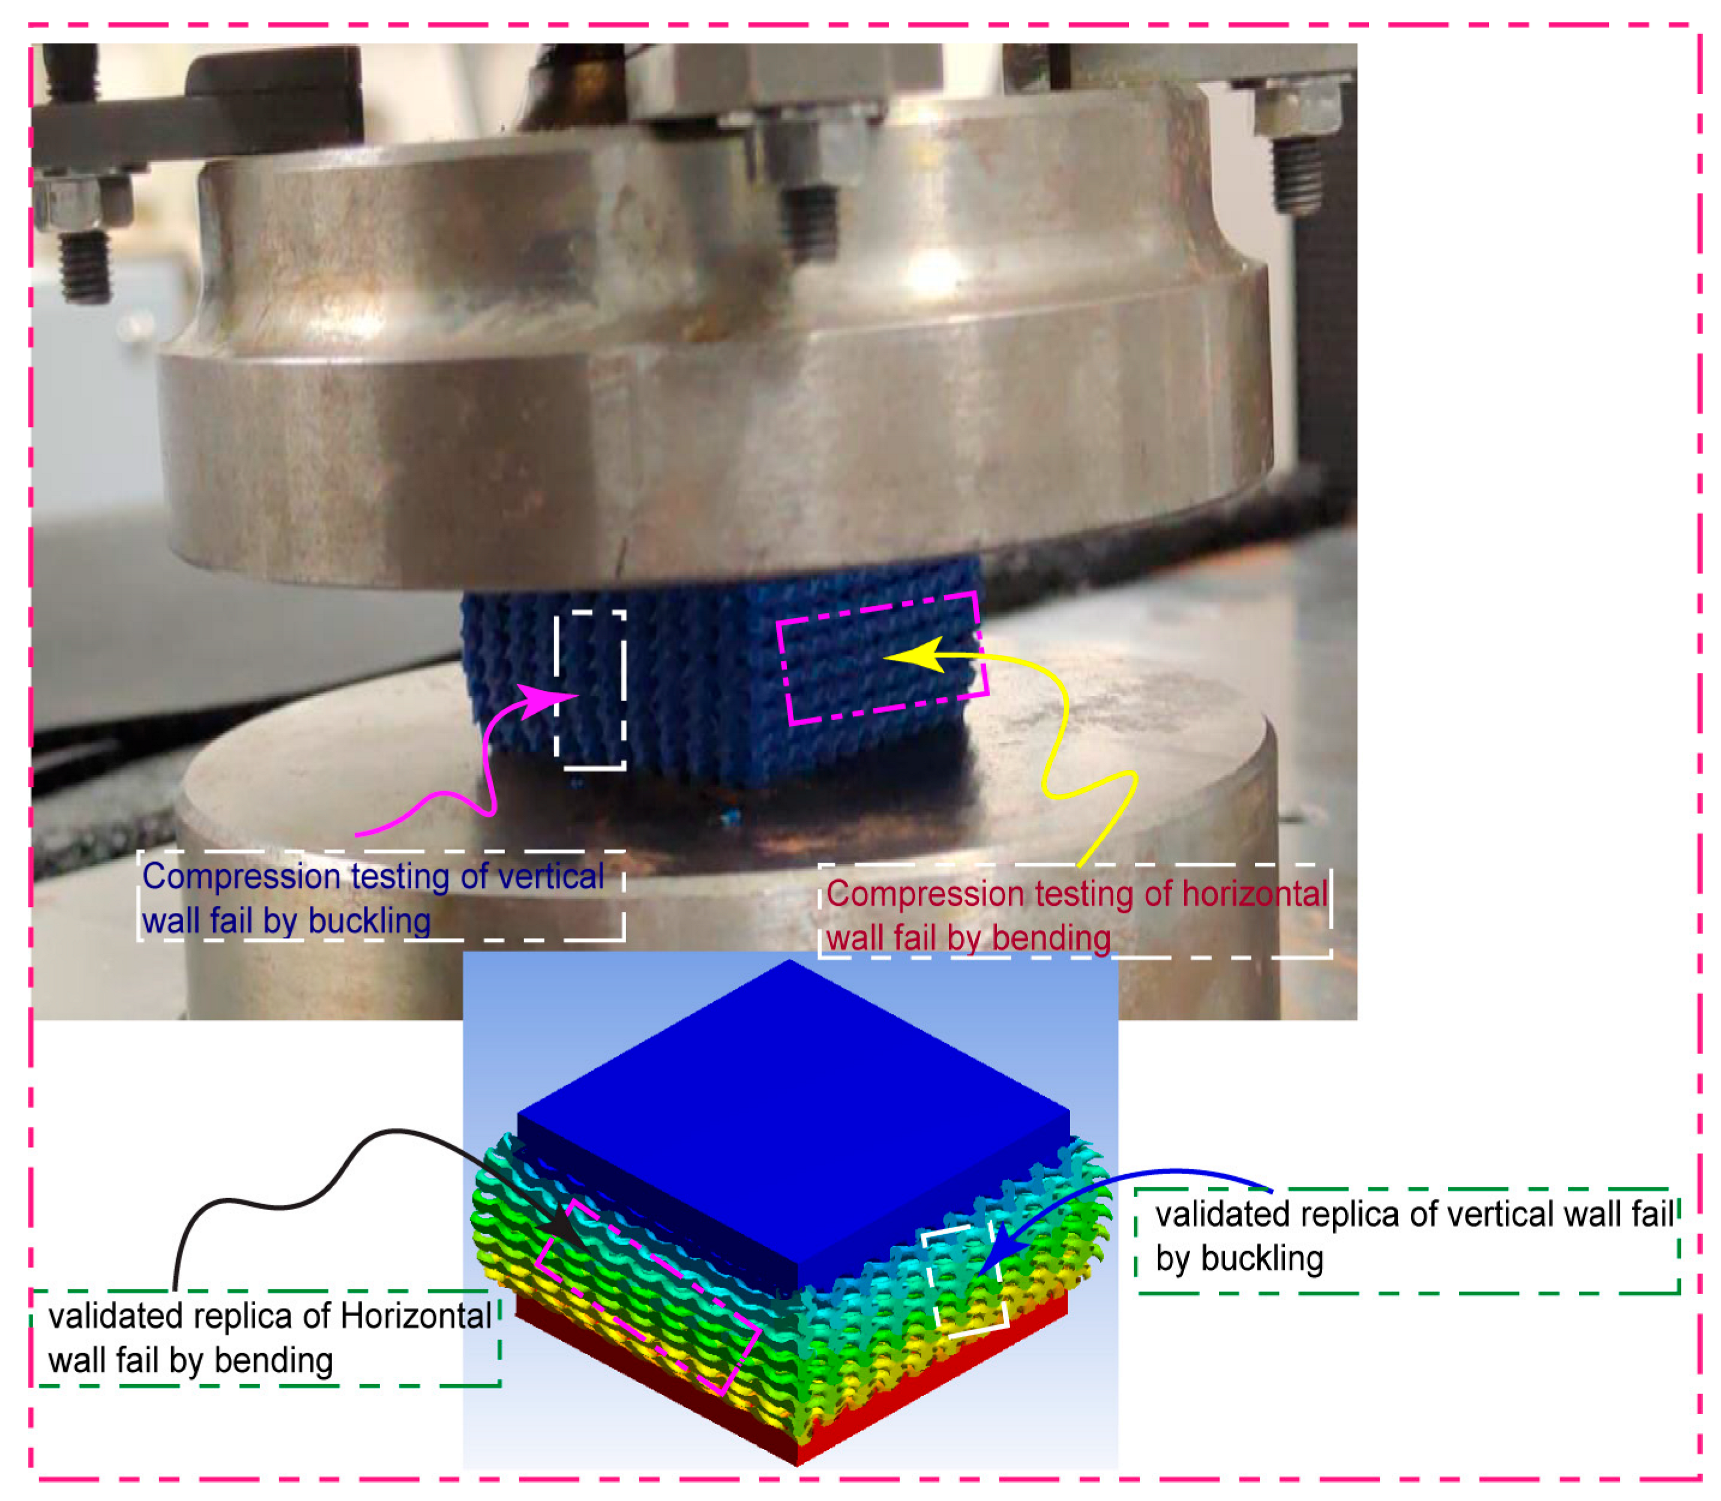
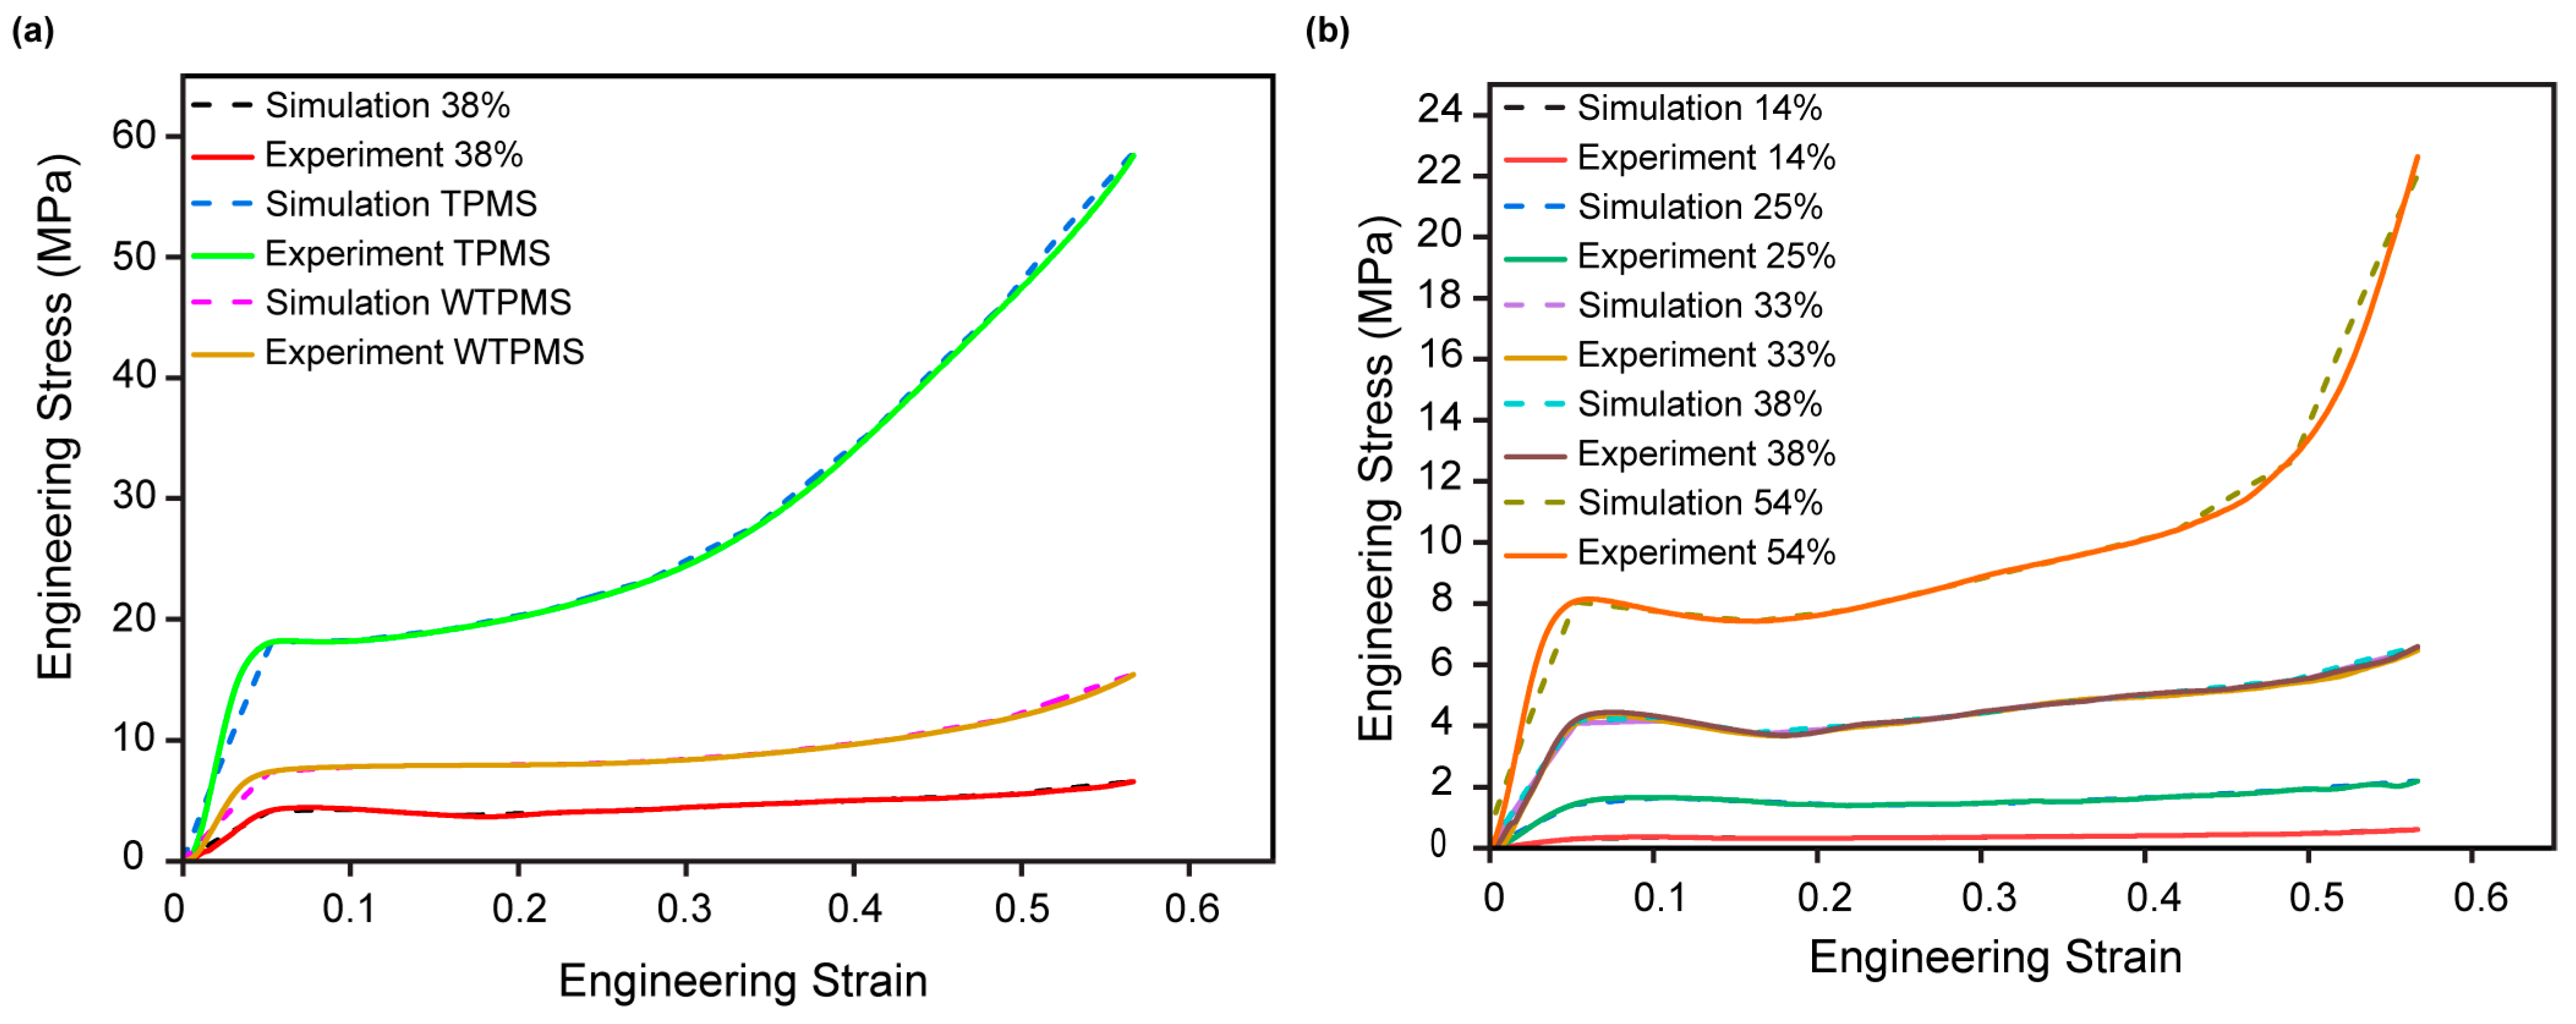
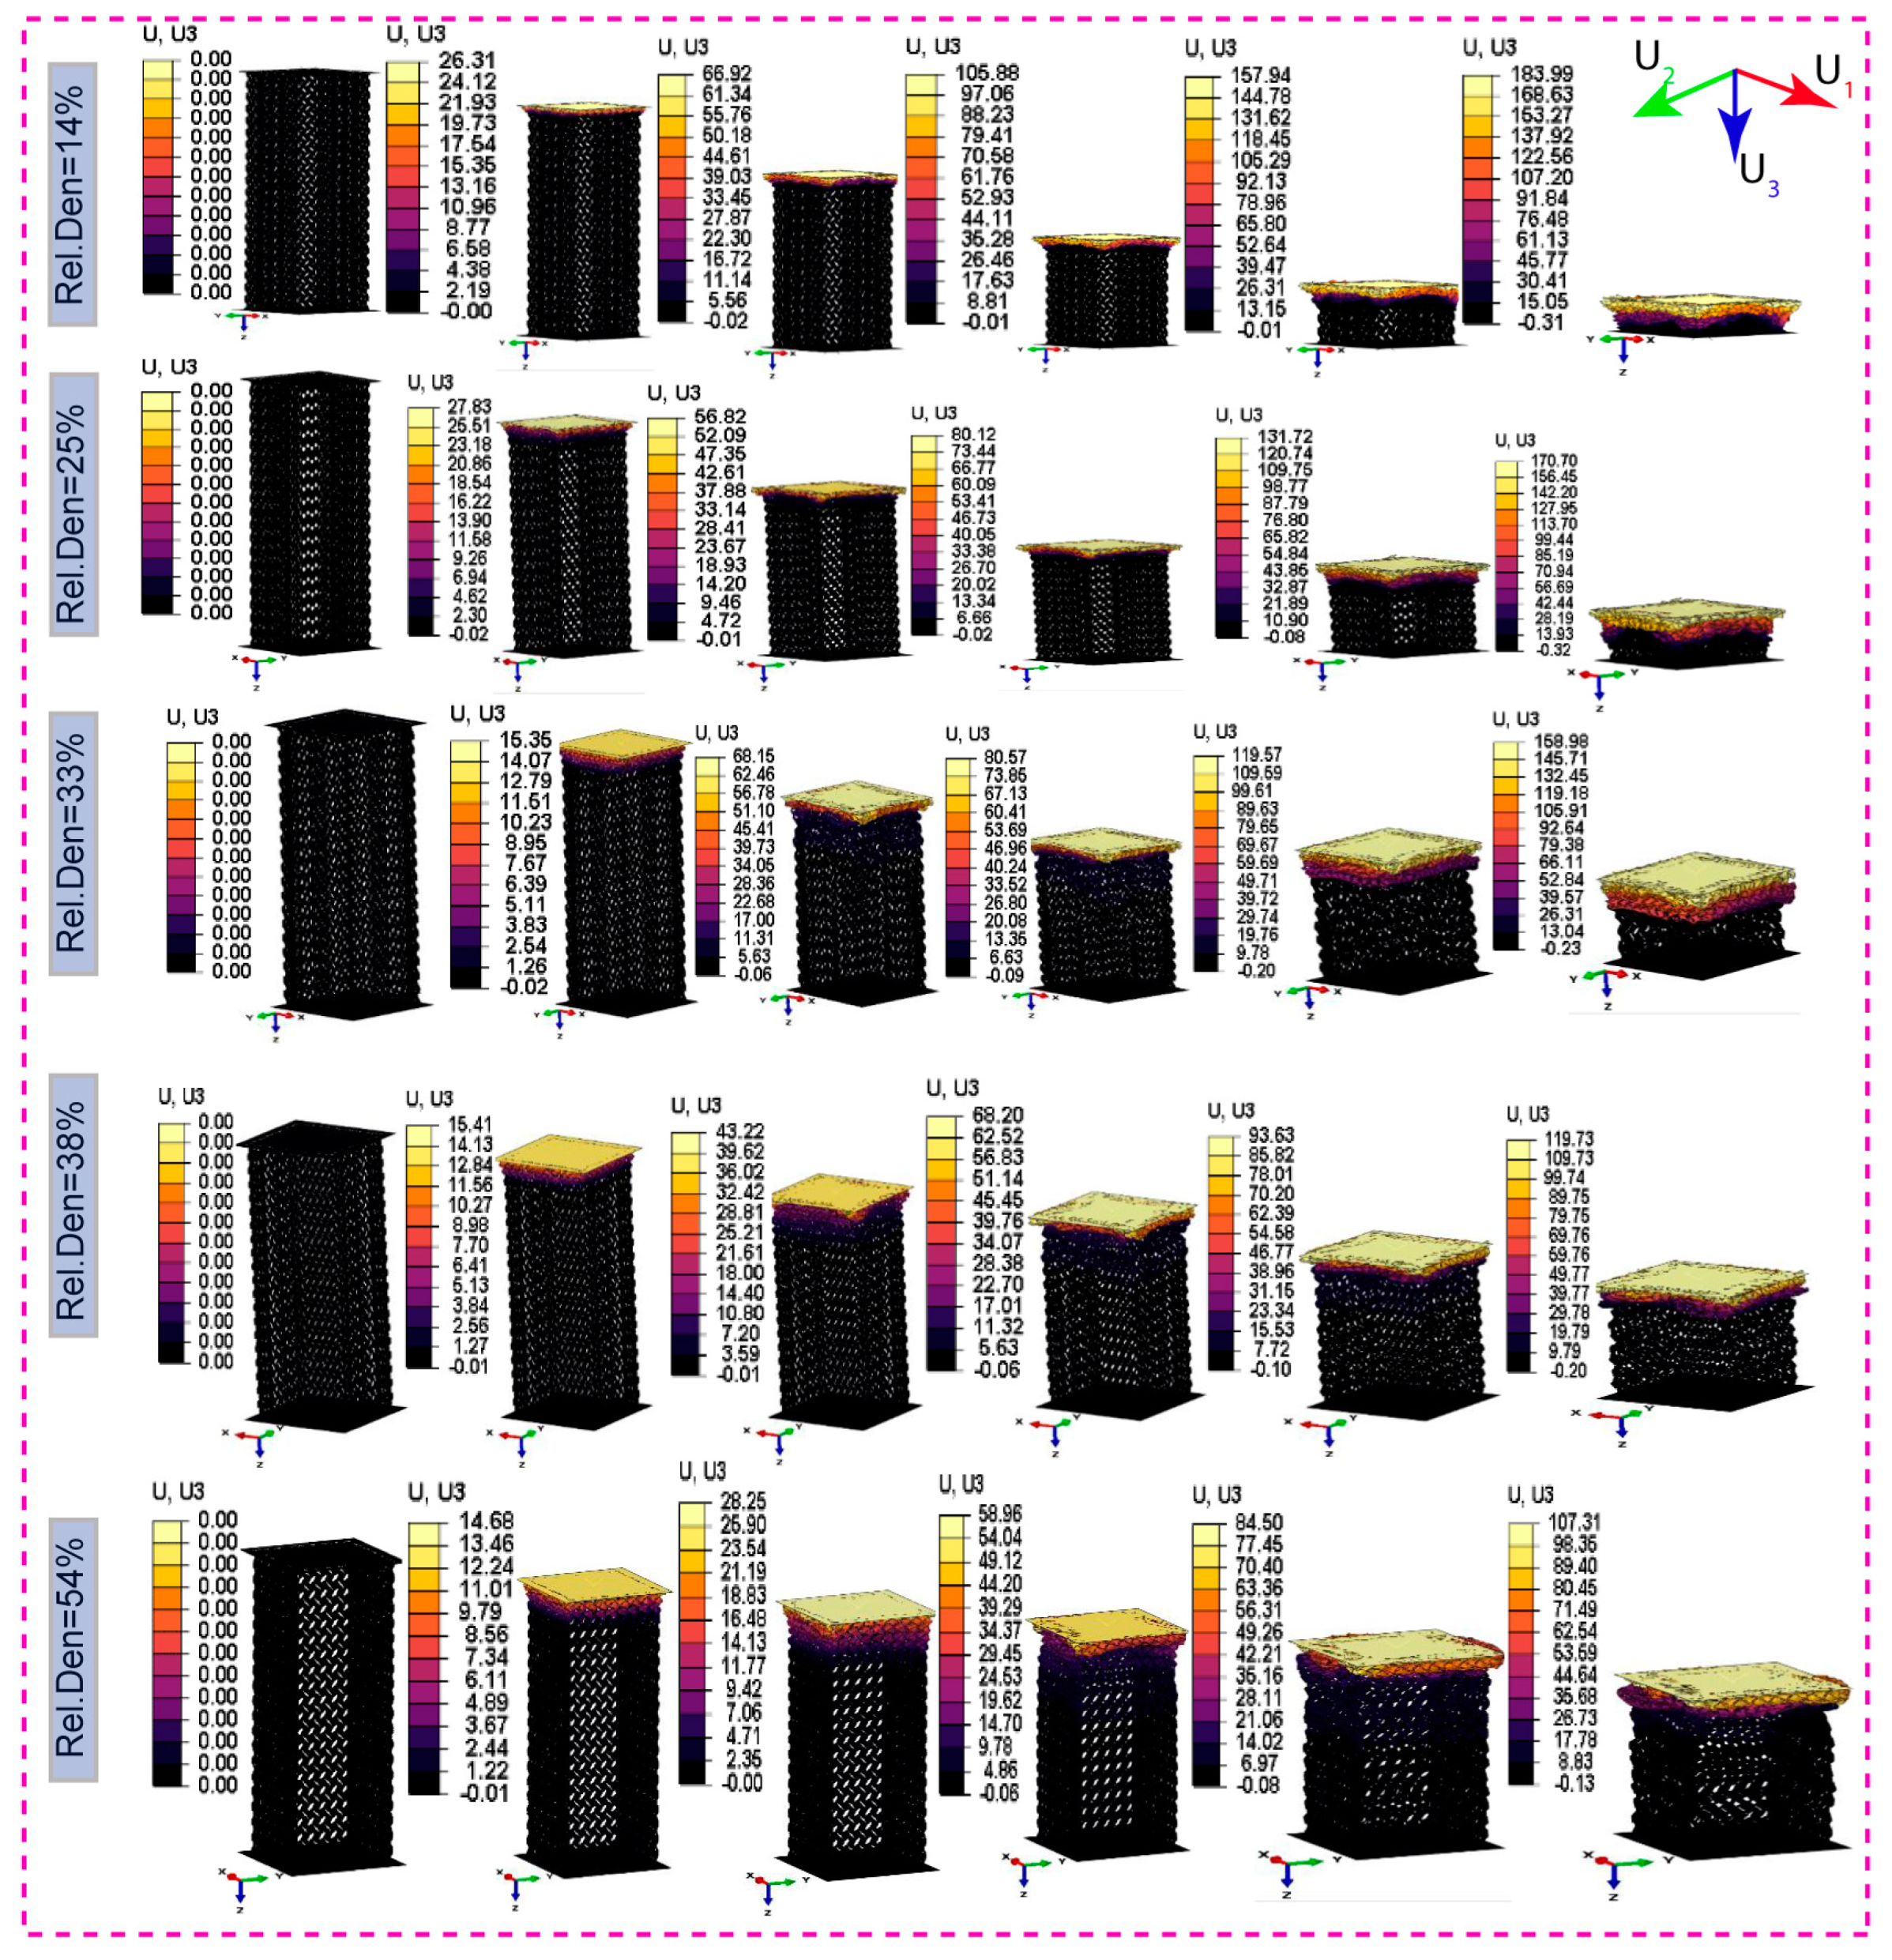
3.6. FEM Simulation of Mechanical Compression and Validation of Stress–Strain Curve

Mesh Convergence STUDY

A mesh sensitivity study is critical for improving finite element analysis’s accuracy, stability, and computing efficiency. As a result, we conducted a mesh convergence investigation, concentrating specifically on the CTL with a relative density of 54%. We examined the following seven finite element mesh sizes: 0.8 mm, 0.6 mm, 0.4 mm, 0.35 mm, 0.3 mm, 0.25 mm, and 0.2 mm. These sizes correspond to element counts of 588,453, 735,566, 919,458, 1,379,187, 1,746,970 and 1,838,917, respectively. The simulation set the dynamic compression displacement to 58.89% of the real lattice height, which corresponds to the FDM printing orientation. Figure 11 shows the engineering stress–strain curves obtained from simulations with varied mesh sizes. It is clear that the differences between curves for mesh sizes 0.25 mm and 0.2 mm are negligible. To balance computational performance, cost, and accuracy, we chose a 0.25-mm mesh size for all lattice designs.
Figure 12 and Figure 13 show how different relative densities affect the mechanical behavior of composite TPMS gyroid structures. A graphic illustration of how these structures perform under various situations is shown in Figure 14. The figure displays the deformation and failure mechanisms of these structures. Notably, when these lattice structures move from the linear elastic area, local buckling events become visible, mainly at the structures’ bottom portions. After the first yielding point, the stress–strain curve significantly reduces due to local buckling. Figure 12 shows that fractures appear in the bottom parts of the composite TPMS gyroid structures at a strain level of 60%, particularly when the relative density is 14%. Finite Element (FE) simulations further support these findings by demonstrating how, between strain levels of 50% and 60%, a homogeneous deformation pattern is seen throughout all composite lattice structures, often accompanied by self-contacting. The current study stands out from previous studies due to successfully capturing all three regions of the engineering stress versus engineering strain curve from mechanical compression testing using the multilinear plasticity hardening model [83,86], as shown in Figure 12a,b. In the Supplementary Materials, it is possible to download the video animation of the finite element analysis (FEA) simulation using ANSYS LS-DYNA 2022 software, which shows the compression of CTG lattice structures across five relative densities.
These results are important because they provide a further understanding of the reasons for structural failure in composite TPMS gyroid structures and might lead to improvements in their use in a variety of applications. Mechanical compression testing was performed at five different relative densities and five strain stages, with a maximum displacement of 17 mm and a corresponding strain of roughly 60%. Beyond this point, the lattice stops deforming and enters the densification stage. The studied deformation patterns clearly show the elastic, plastic plateau, and final densification properties.

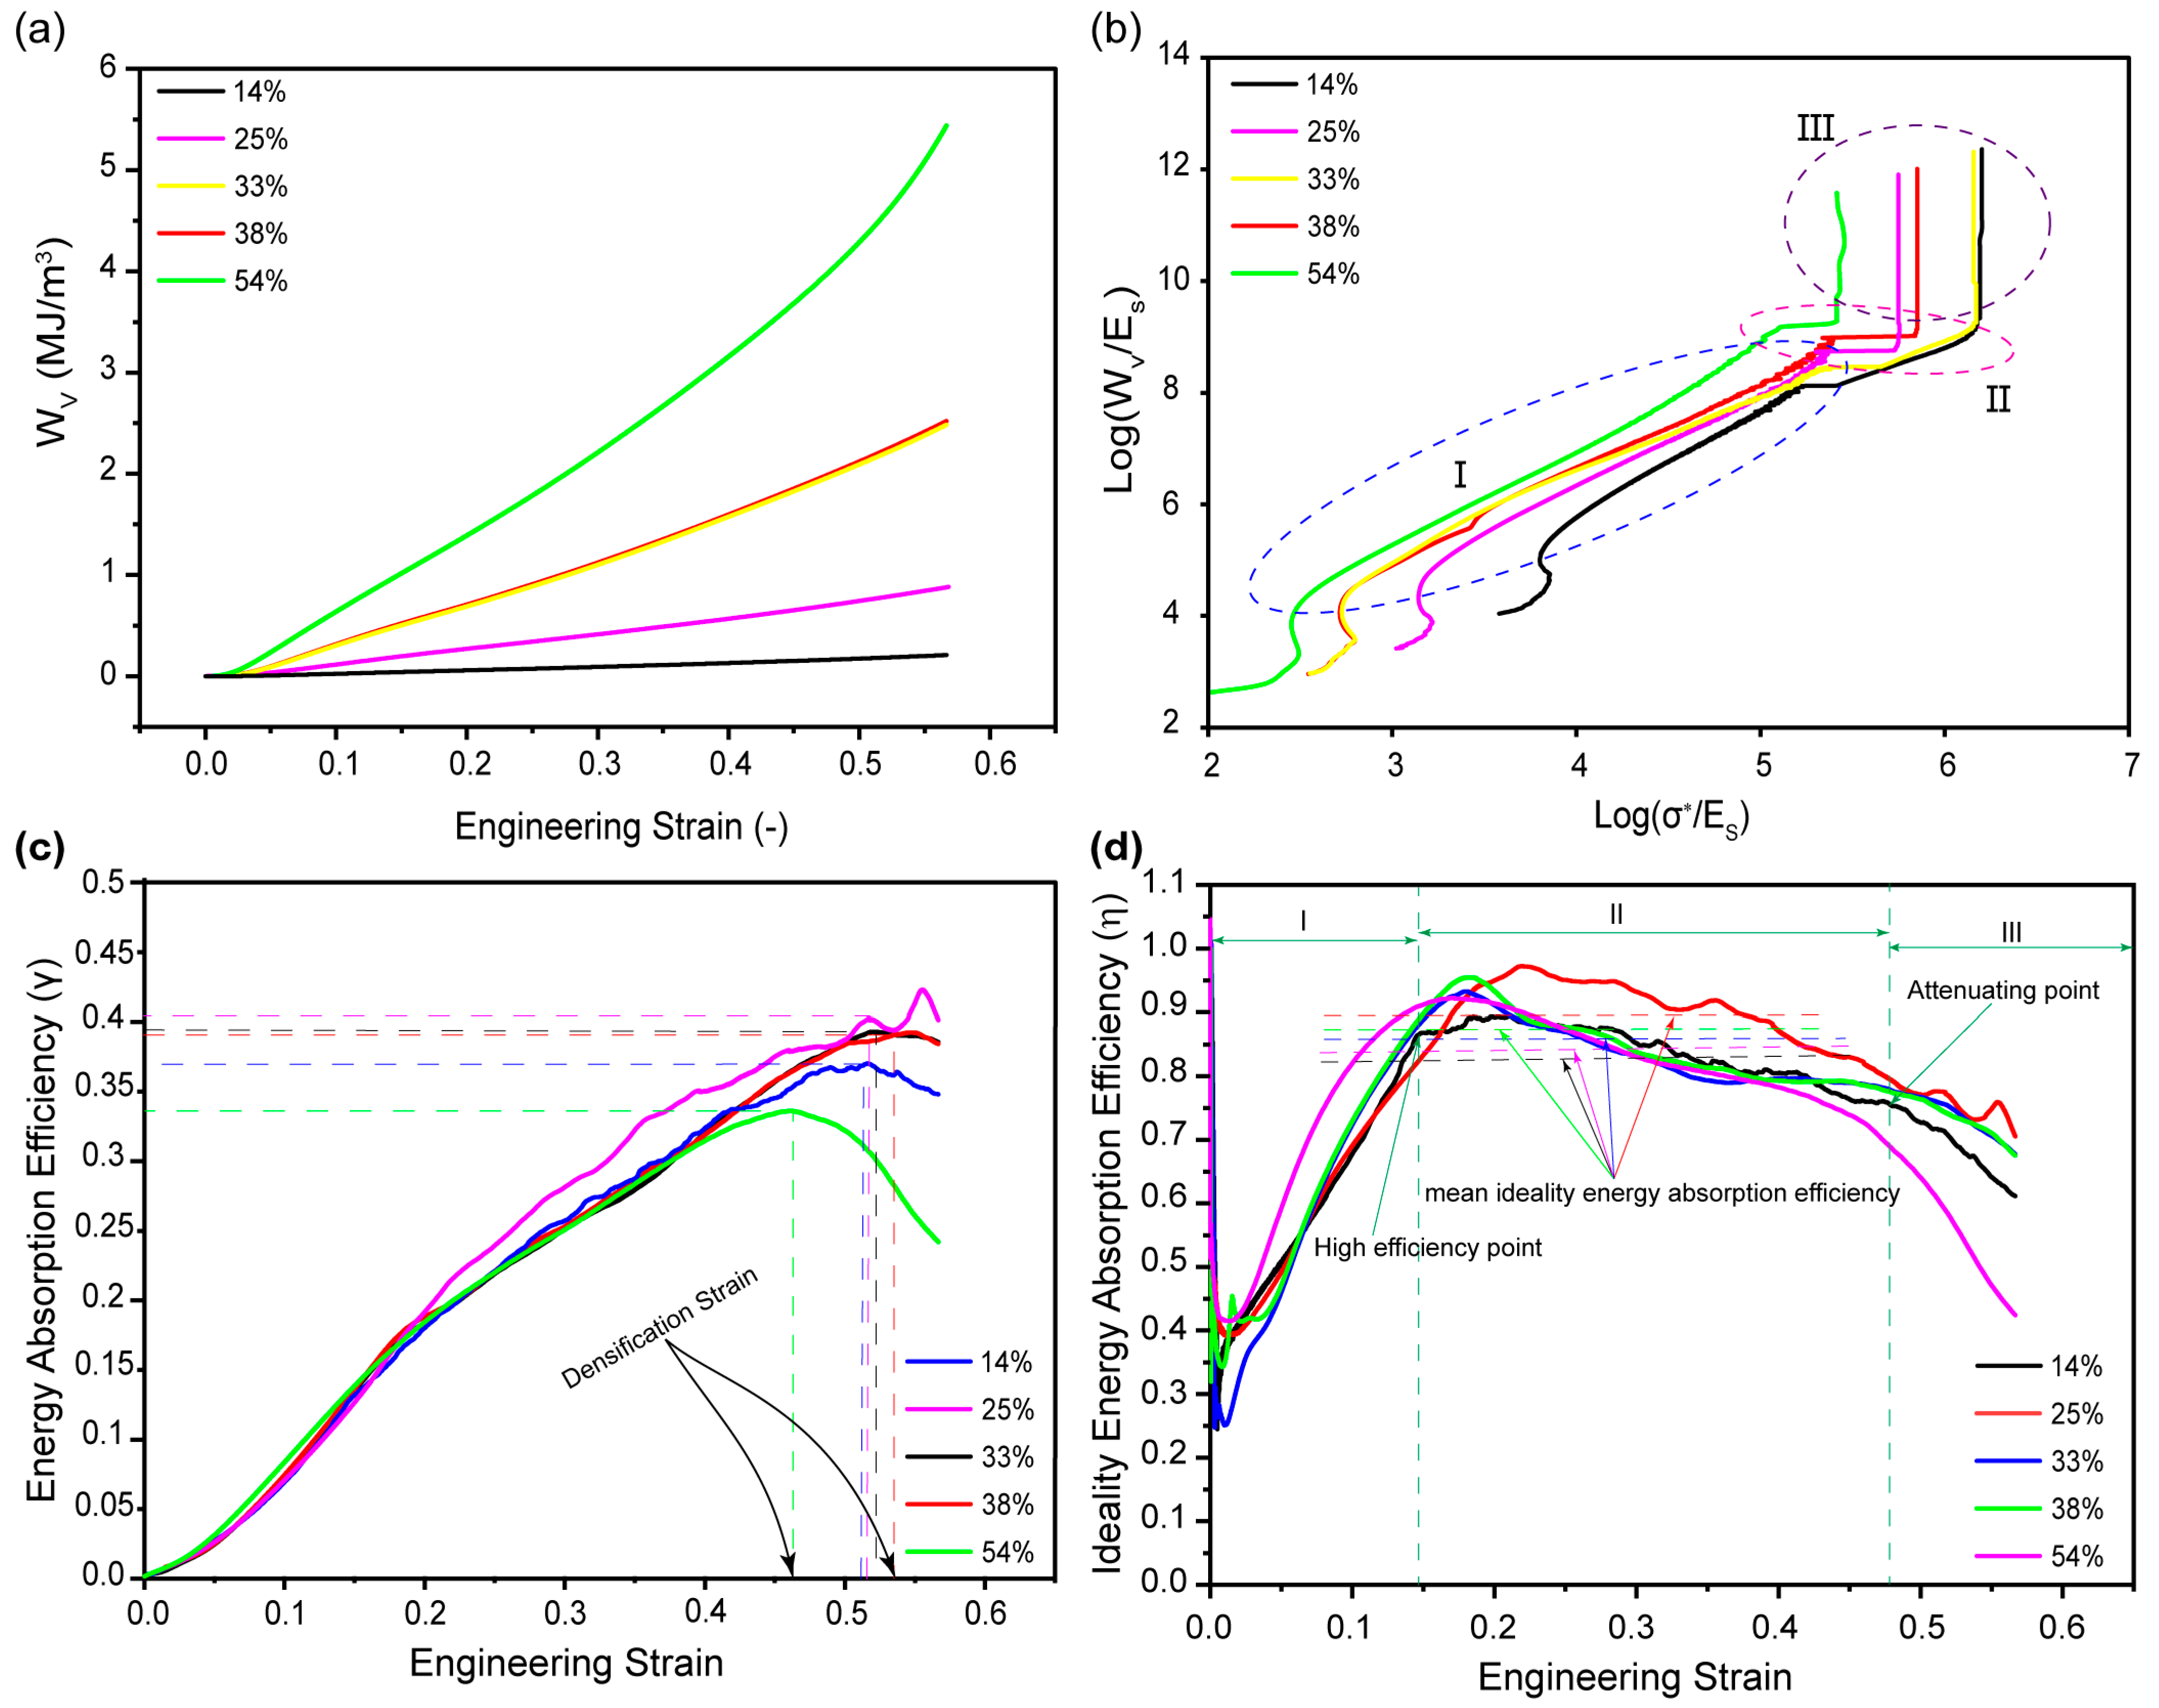
3.7. Energy Absorption

The significance of energy absorption in the testing of materials is crucial. The parameter in question is energy absorption per unit volume of the specimen. In order to effectively represent the degree to which a material can absorb energy during deformation, this measure can often be expressed geometrically by the area confined under the stress–strain curve. It is important to describe the PLA Composite TPMS Gyroid Lattice so that we can figure out how much energy it can hold when it is compressed mechanically.
Figure 15a illustrates the correlation between strain and energy absorption at various relative densities. Based on the results, the bioinspired composite TPMS gyroid foam absorbs less energy during the elastic-plastic phase. This decline is primarily due to the energy absorption mechanism being dependent on pore structure collapse, which is predominantly observed in the plateau region. As strain increases, energy absorption exhibits a linear correlation with strain, which is remarkable. It is possible to see a power function relationship between energy absorption and strain at lower relative densities because this type of biopolymer foam has strain hardening and a high plastic modulus. As densification strain approaches, the energy absorption of the composite lattice foam increases dramatically in response to stress. Energy absorption efficiency and ideal energy absorption efficiency were suggested by previous studies [87,88] as methods to measure the energy absorption characteristics of foam materials for use in their study of various forms of energy absorption capacity. The normalized energy absorption characteristics of the composite TPMS gyroid structures are illustrated in Figure 15b. This graphical representation assigns logarithmic values to two significant ratios: the lattice stress to Young’s modulus of solid PLA material (σ*./Es) and the total energy absorption to the elastic modulus of bulk PLA materials (Wv/Es). The graph contained in this representation illustrates the relationship between strains and the cumulative energy per unit volume.
One can gain a more comprehensive understanding of the different compression phases by implementing these logarithmic modifications. To elucidate the intricate mechanisms underlying energy absorption in diverse architectural configurations, Gibson and Ashby initially introduced the concept that serves as the foundation for the aforementioned mathematical expression [5,25,87,88]. This normalized graphical curve is one of the most effective methods to illustrate how foam structures maximize energy absorption while minimizing stress. Figure 15b depicts three unique zones that give varied information on compression-phase energy absorption characteristics based on altering slopes of the curves. The elastic deformation phase of composite TPMS gyroid structures corresponds to Region I. The pictures above show that TPMS Gyroid structures with relative densities of 14% and 25% fail, even though they only absorb a small amount of energy when they are compressed. The reason for this limitation is due to the size effect of the Gibson and Ashby composite gyroid lattices with relative densities of 25%, 38%, and 54%. Based on such findings, this lattice structure seems to be an excellent match for use in impact-resistant applications since it mimics foam structures and models. The entire structural collapse of the composite TPMS gyroid lattice provides a large increase in energy absorption with minimal stress increases as we investigate Region II. This behavior is most noticeable in Composite TPMS Gyroid designs, which, on the other hand, have steeper curve slopes, indicating a quick rise in cumulative energy absorption even for minor variations in stress. Prominent inflection points demonstrate that composite lattices enter the densification phase in Region III at all five relative densities.
Densification phases are observable even in low-relative-density composite lattices, which were not discernible in the stress–strain curves produced in this investigation. Because of the results, the composite TPMS gyroid lattice, which has normalized energy absorption and stress, seems to be a great model for creating foam structures out of a group of PLA materials that are designed to absorb energy. The complex relationship between strain and energy absorption efficiency across five different relative densities is shown in Figure 15c. This figure makes an evident illustration of the peak energy absorption efficiency, which is characterized by values ranging from 0.34, 0.37, 0.38, 0.39, and 0.43, corresponding to relative densities of 54%, 14%, 33%, 38%, and 25%, respectively. Energy absorption efficiency in PLA composite TPMS gyroid foam, which has these five relative densities, peaks with increasing deformation during mechanical compression and then gradually declines as strain continues to rise. It peaks during the compression deformation phase when strain is increasing and then progressively decreases as strain keeps rising. Nevertheless, when it reaches its maximum within the range of relative densities from 33% to 38%, energy absorption efficiency stays constant, showing remarkable resistance to increasing deformation extents. It is interesting that when the relative density is higher and the strain-hardening effect is amplified at the plateau stage, the presence of larger pore walls leads to a higher plastic modulus. The maximum energy absorption efficiencies correspond to engineering strains of 0.46, 0.51, 0.51, 0.53, and 0.55, respectively. It is interesting that these strain values are a lot like the densification strain on the stress–strain curve. This means that the PLA composite TPMS gyroid foam works best as an energy absorber when all of its pores are compressed.
By expanding our focus to Figure 15d, we look into the interesting range of ideal energy absorption efficiency with respect to strain across a range of relative densities. Figure 15d shows that peak ideal energy absorption efficiencies of 0.90, 0.93, 0.94, 0.955, and 0.97 can be seen across a range of relative densities from 14% to 54%. When these efficiencies are at their peak, the corresponding strain values are 0.21, 0.16, 0.19, 0.18, and 0.23, respectively. A pattern becomes apparent: with decreasing relative densities, the optimum energy absorption efficiency becomes convincingly close to 1. The complex interaction between the plastic modulus and relative density during the plateau phase is what causes this effect. Composite TPMS gyroid PLA foam hardens in amazing ways as relative densities rise, acting a lot like the best materials for absorbing energy when they are compressed.

Maximum Energy Absorption and Densification Strain

Figure 16 illustrates the peak energy absorbed by the five composite TPMS Gyroid Lattice structures during mechanical compression and its corresponding densification strain. The composite TPMS Gyroid TPMS with 14% relative density absorbed the lowest energy per volume at 56.05% deformation. This is due to its lowest strength in overcoming buckling and bending-dominated deformation during mechanical compression. And this result coincides with both SEM and mechanical property results in this study, which clearly reinforces the fact that size effect leads to the mechanical property deterioration of lattice structures below 15% relative density. And 5.54 MJ/m3, absorbed at 56.70% strain by the composite lattice with 54% relative density.

3.8. Case Study on Composite TPMS Gyroid Latticed Crash Box

Five different relative densities—54%, 38%, 33%, 25%, and 14%—show a latticed crash box that is simulated to occur at an impact speed of 15,600 mm/s for 12.5 ms in Figure 17. The accompanying Figure 17 and Figure 18 make it easy to see the displacement contour and the von Mises stress contour, respectively. The latticed crash box exhibits the maximum displacement at a relative density of 14% and the lowest displacement at a relative density of 54%, as shown in Figure 18. Less dense composite TPMS gyroid latticed crash boxes are less stiff and structurally robust because they distort more under the same impact conditions. On the other hand, Figure 17e demonstrates that the latticed crash box experiences a maximum von Mises stress at 54% relative density and a minimum at 14% relative density. The von Mises stress, a measure of a material’s yielding tendency, shows that a latticed crash box can withstand higher stresses before deforming. The findings show that at 14% relative density, which is the decrease in threshold in both situations, the mechanical characteristics significantly deteriorate.
This deterioration significantly decreases the effective energy absorption capacity in usage, where energy dissipation is crucial. With their relative densities of 38% and 33%, latticed crash boxes seem to be the ideal choice for this kind of application since they maintain a reasonable balance between displacement and energy absorption. The balance is necessary to store strain energy efficiently without degrading the structure. Looking at composite TPMS gyroid latticed crash boxes under high-speed impact at different relative densities might help us understand how they behave mechanically, especially when it comes to how well they absorb energy. Higher relative densities may be able to handle more stress, but for many energies’ dissipation uses, moderate relative densities of latticed crash boxes are the best balance between being able to handle displacement and stress.
Under velocity impact circumstances, the research investigated the effects of different relative densities on the maximum displacement in the Z direction of the composite TPMS gyroid-latticed crash box (see Figure 18). The results offer important insights into the potential crashworthiness of these novel materials. The maximum displacement at 14% relative density showed considerable deformation capacity under impact loading, ranging from a starting value of 0.0 mm to a peak value of 183.99 mm. Similarly, the displacement changed from 27.83 mm to 170.70 mm at 25% relative density, demonstrating significant deformability. Additionally, the highest displacement peaked at 68.15 mm at 33% relative density and then steadily decreased. At 38% relative density, this trend continued until it reached 68.20 mm, at which point it started to decline further. With a high value of 58.96 mm, the 54% relative density was found to have the lowest maximum displacement. The research examined the effect of different relative densities on the maximum displacement in the Z direction of a composite TPMS gyroid-latticed crash box under velocity impact. The findings provide fascinating insights into the possibilities for increased energy absorption and improved crashworthiness performance. The maximum displacements were much larger at lower relative densities, such as 14% and 25%, showing improved deformability and energy absorption capacity (refer to Figure 18). This shows that crash boxes with lower relative densities have a stronger ability to absorb energy during impact incidents. Higher relative densities, such as 38% and 54%, resulted in comparably smaller maximum displacements, suggesting more limited deformation behavior and perhaps reduced energy absorption capability. The influence of relative density and porosity on maximum displacement and energy absorption is obvious. Lower relative densities with higher porosity allow for more widespread deformation and increased energy dissipation, while higher relative densities with lower porosity constrain deformation and may limit energy absorption. In terms of mechanical stiffness, crash boxes with lower relative densities have lower stiffness because they are more deformable, while those with higher relative densities have better stiffness but may lose some energy absorption capabilities. According to the research findings, the crash box with a 25% relative density seems to provide a balanced mix of maximal displacement, energy absorption, and mechanical rigidity. It has a high energy absorption potential while retaining moderate stiffness, making it a good contender for improving crashworthiness in automobile safety applications. Further optimization efforts might concentrate on fine-tuning the relative density within this range in order to achieve the ideal balance of energy absorption and structural stability.
Figure 19a illustrates the dynamic response of latticed crash boxes with different relative densities (14%, 25%, 33%, 38%, and 54%) and discusses the force-versus-displacement behavior under high-speed impacts. The composite TPMS gyroid lattice crash box with a density of 54% has the highest crashing force, while the one with a density of 14% has the lowest. This significant variation illustrates the size effect and the deterioration of mechanical properties with decreasing relative density, especially below 15%.
The force–displacement curves and the stress–strain behavior of the composite TPMS lattice structures explain why the mechanical response is consistent. Also, the long plateau area shows a good bending deformation mode—this is needed to obtain the best energy absorption with the least amount of changes in load versus deformation.
The aerospace, automotive, and safety sectors will use lattice structures more often as a consequence of these studies, which emphasize the need to consider relative density when designing lattice structures in order to achieve the best possible balance between structural strength and energy absorption efficiency. Furthermore, Figure 19b illustrates the strain energy absorption with time for the same latticed crash boxes for high-speed impacts. The 54% relative density crash box has a considerably shorter densification phase while having a larger strain energy storage capacity than the 33% and 38% relative density crash boxes, which show ideal energy absorption prior to densification. Based on these findings, it seems that medium-relative density lattices are the most reliable and consistent when it comes to absorbing energy, showing optimal performance.
Applications that need efficient energy absorption and structural integrity under impact are indispensable to this performance. Including the force–displacement results, the study’s insights into strain energy dynamics provide a whole picture of how latticed crash boxes mechanically behave. These studies highlight the significance of material relative density in attaining the intended mechanical and energy absorption properties and, together, make a significant contribution to the design and implementation of structures that absorb shock in high-impact scenarios.

4. Conclusions

This paper includes an intensive investigation of the mechanical behavior of five different kinds of composite TPMS latticed structures. These structures were designed by combining walled TPMS and normal TPMS gyroid lattices using the Boolean subtraction technique. After that, they were 3D-printed from polylactic acid (PLA) using fused deposition modeling (FDM). The study explores the mechanical properties and energy absorption capabilities under dynamic mechanical compression loading and examines the stress–strain response and deformation modes at various relative densities. Experimental and numerical simulations are both included in the broad scope of this study. The impacts of the five different relative densities (14%, 25%, 33%, 38%, and 54%) on the mechanical characteristics and energy absorption efficiency of the TPMS structures are the most significant findings. The following results reflect the conclusions that have been drawn from the current study.
  • A newly created composite TPMS gyroid lattice, created by Boolean subtraction, exhibits a deformation mode that is primarily bending, which is consistent with idealized gyroid and ligament-based TPMS behaviors.
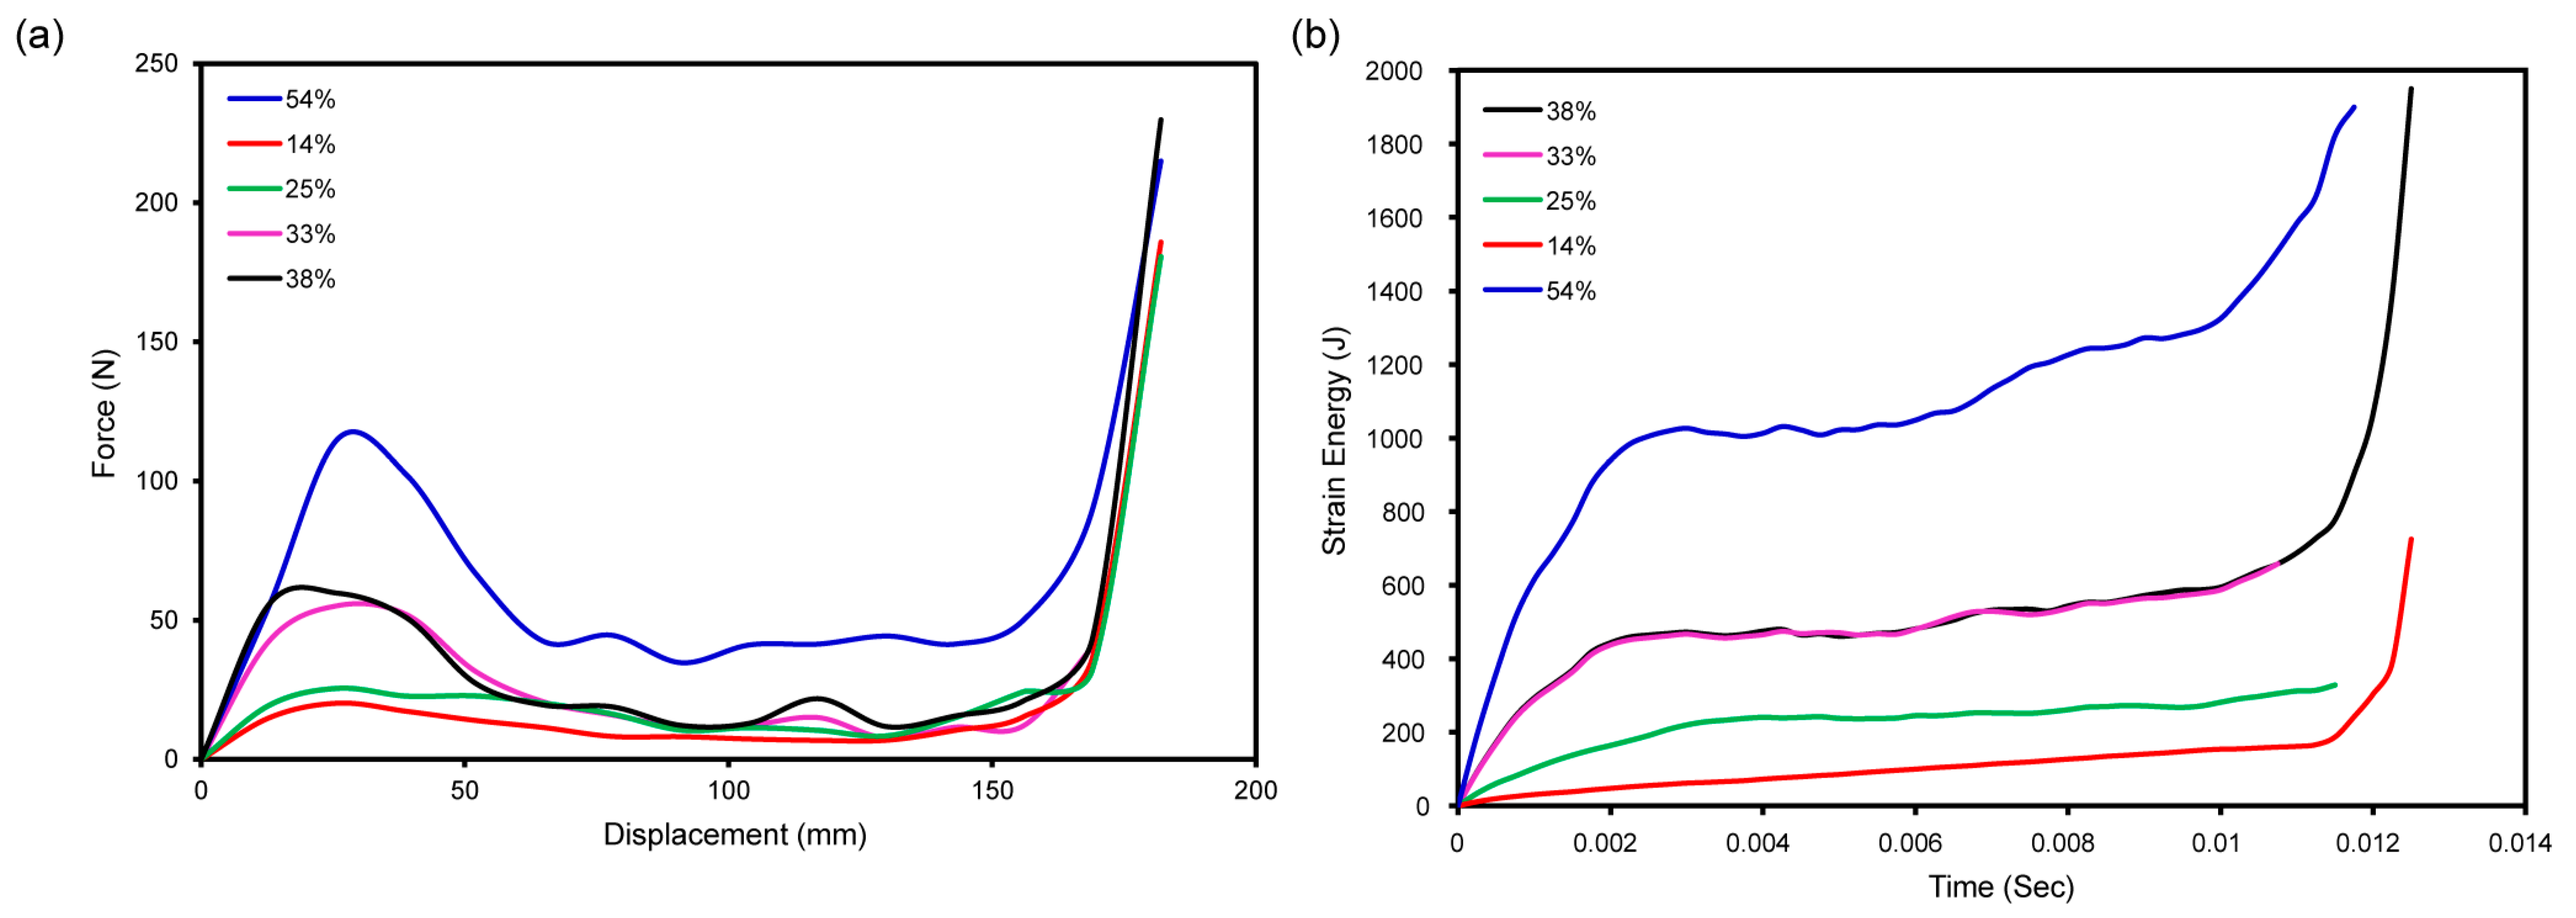
  • The 54% relative density crash box has a significantly shorter densification phase while having a larger strain energy storage capacity than the 33% and 38% relative density crash boxes, which show ideal energy absorption prior to densification.
  • The findings suggest that the composite TPMS gyroid lattice, with its normalized stress and energy absorption, is an excellent model for fabricating foam structures from a class of PLA materials engineered for energy absorption.
  • Our findings support the Gibson–Ashby model by confirming the significant influence of relative density on the mechanical properties of composite TPMS gyroid lattices. They also emphasize the importance of tailoring the lattice architecture to optimize energy absorption capabilities.
  • A comprehensive force–displacement and strain energy–time analysis elucidates the mechanical behavior of latticed crash boxes when subjected to impact. This analysis has significance for the advancement of design and implementation in high-impact scenarios.
  • According to the study, composite TPMS gyroid-latticed crash boxes with lower relative densities outperform in energy absorption and deformability, particularly at 25% density, which provides an optimal balance of displacement capacity and mechanical rigidity, promising improved crashworthiness for automotive safety applications.
This study gives a comprehensive examination of composite TPMS gyroid lattices intended for optimum energy absorption, which is critical for improving automobile safety. This study not only investigates the mechanical reactions under compression but also demonstrates the lattices’ applicability in dynamic automobile settings by combining walled TPMS and regular TPMS gyroid lattices using Boolean subtraction and FDM for manufacture. The use of these structures in car crash boxes demonstrates their capacity to increase impact resistance and safety. Specifically, the 33% and 38% relative density crash boxes have superior energy absorption properties that outperform lesser density arrangements, making them appropriate for high-impact applications in vehicle design. This verifies the design’s effectiveness in real-world automotive applications, particularly for boosting vehicle crashworthiness, thereby leading to safer and more robust automotive structures.
In conclusion, this study successfully delineates the boundaries of optimal energy absorption and accurately models plastic plateau regions by combining Mechanical Compression testing with Finite Element Analysis to improve our understanding of the behavior of composite lattice structures built using FDM 3D printing from blue PLA material under stress.

Supplementary Materials

The following supporting information can be downloaded at: https://www.mdpi.com/article/10.3390/jmmp8030086/s1, Video S1: FEA simulation CTG 14% Relative Density Deformation; Video S2 FEA simulation CTG 25% Relative Density Deformation; Video S3: FEA simulation CTG 33% Relative Density Deformation; Video S4: FEA simulation CTG 38% Relative Density Deformation; Video S5: FEA simulation CTG 54% Relative Density Deformation.

Author Contributions

Conceptualization, D.B.A. and M.T.; methodology D.B.A.; software, D.B.A. and M.T.; validation, D.B.A.; formal analysis, D.B.A.; investigation, D.B.A.; resources, M.T.; data curation, D.B.A. and M.T.; writing—original draft preparation, D.B.A.; writing—review and editing, D.B.A.; visualization, D.B.A.; supervision, M.T.; project administration, M.T.; funding acquisition, M.T. All authors have read and agreed to the published version of the manuscript.

Funding

This research was funded partially by MEXT Grant-in-Aid for Scientific Research (A) (Grant No. 21H04731).

Data Availability Statement

Data are contained within the article.

Acknowledgments

The authors gratefully acknowledge the Laboratory of Biomechanical Design (LBD), Graduate school of Engineering, Hokkaido University, for providing the simulation software and advanced manufacturing equipment essential for this study.

Conflicts of Interest

The authors declare no conflicts of interest.

References

  1. Bacciaglia, A.; Ceruti, A.; Liverani, A. Structural Analysis of Voxel-Based Lattices Using 1D Approach. 3D Print. Addit. Manuf. 2022, 9, 365–379. [Google Scholar] [CrossRef] [PubMed]
  2. Pei, E.; Kabir, I.; Breški, T.; Godec, D.; Nordin, A. A Review of Geometric Dimensioning and Tolerancing (GD&T) of Additive Manufacturing and Powder Bed Fusion Lattices. Prog. Addit. Manuf. 2022, 7, 1297–1305. [Google Scholar] [CrossRef]
  3. McGregor, M.; Patel, S.; McLachlin, S.; Vlasea, M. Data Related to Architectural Bone Parameters and the Relationship to Ti Lattice Design for Powder Bed Fusion Additive Manufacturing. Data Br. 2021, 39, 107633. [Google Scholar] [CrossRef] [PubMed]
  4. Hussain, S.; Nazir, A.; Waqar, S.; Ali, U.; Gokcekaya, O. Effect of Additive Manufactured Hybrid and Functionally Graded Novel Designed Cellular Lattice Structures on Mechanical and Failure Properties. Int. J. Adv. Manuf. Technol. 2023, 128, 4873–4891. [Google Scholar] [CrossRef]
  5. Pugliese, R.; Graziosi, S. Biomimetic Scaffolds Using Triply Periodic Minimal Surface-Based Porous Structures for Biomedical Applications. SLAS Technol. 2023, 28, 165–182. [Google Scholar] [CrossRef] [PubMed]
  6. Shi, K.; Yang, W.; Mei, H.; Yan, Y.; Xu, L.; Cheng, L.; Zhang, L. Characterization and Enhancement of Quasi-Static and Shear Mechanical Properties of 3D Printed Lightweight SiOC Lattices: Effects of Structural Design and Parameters. J. Eur. Ceram. Soc. 2023, 43, 5882–5893. [Google Scholar] [CrossRef]
  7. Wu, J.; Yin, H.; Yan, Z.; Tian, G.; Ding, Z.; Yuan, X.; Fu, L.; Tian, Z.; Sui, X.; Liu, S. Preparation of Hierarchical Porous Cartilage Composite Scaffolds Loaded with Stromal Cell-Derived Factor-1 Using Low-Temperature Deposition 3D Printing. Chin. J. Tissue Eng. Res. 2023, 27, 4776. [Google Scholar]
  8. Yang, N.; Wei, H.; Mao, Z. Tuning Surface Curvatures and Young’s Moduli of TPMS-Based Lattices Independent of Volume Fraction. Mater. Des. 2022, 216, 110542. [Google Scholar] [CrossRef]
  9. Zhang, C.; Zheng, H.; Yang, L.; Li, Y.; Jin, J.; Cao, W.; Yan, C.; Shi, Y. Mechanical Responses of Sheet-Based Gyroid-Type Triply Periodic Minimal Surface Lattice Structures Fabricated Using Selective Laser Melting. Mater. Des. 2022, 214, 110407. [Google Scholar] [CrossRef]
  10. Du Plessis, A.; Razavi, N.; Benedetti, M.; Murchio, S.; Leary, M.; Watson, M.; Bhate, D.; Berto, F. Properties and Applications of Additively Manufactured Metallic Cellular Materials: A Review. Prog. Mater. Sci. 2022, 125, 100918. [Google Scholar] [CrossRef]
  11. du Plessis, A.; Broeckhoven, C.; Yadroitsava, I.; Yadroitsev, I.; Hands, C.H.; Kunju, R.; Bhate, D. Beautiful and Functional: A Review of Biomimetic Design in Additive Manufacturing. Addit. Manuf. 2019, 27, 408–427. [Google Scholar] [CrossRef]
  12. Kladovasilakis, N.; Tsongas, K.; Tzetzis, D. Finite Element Analysis of Orthopedic Hip Implant with Functionally Graded Bioinspired Lattice Structures. Biomimetics 2020, 5, 44. [Google Scholar] [CrossRef] [PubMed]
  13. Pelanconi, M.; Ortona, A. Nature-Inspired, Ultra-Lightweight Structures with Gyroid Cores Produced by Additive Manufacturing and Reinforced by Unidirectional Carbon Fiber Ribs. Materials 2019, 12, 4134. [Google Scholar] [CrossRef]
  14. Ren, J.; Wang, Y.; Yao, Y.; Wang, Y.; Fei, X.; Qi, P.; Lin, S.; Kaplan, D.L.; Buehler, M.J.; Ling, S. Biological Material Interfaces as Inspiration for Mechanical and Optical Material Designs. Chem. Rev. 2019, 119, 12279–12336. [Google Scholar] [CrossRef] [PubMed]
  15. Panesar, A.; Abdi, M.; Hickman, D.; Ashcroft, I. Strategies for Functionally Graded Lattice Structures Derived Using Topology Optimisation for Additive Manufacturing. Addit. Manuf. 2018, 19, 81–94. [Google Scholar] [CrossRef]
  16. Pelanconi, M.; Zavattoni, S.; Cornolti, L.; Puragliesi, R.; Arrivabeni, E.; Ferrari, L.; Gianella, S.; Barbato, M.; Ortona, A. Application of Ceramic Lattice Structures to Design Compact, High Temperature Heat Exchangers: Material and Architecture Selection. Materials 2021, 14, 3225. [Google Scholar] [CrossRef] [PubMed]
  17. Alizadeh-Osgouei, M.; Li, Y.; Vahid, A.; Ataee, A.; Wen, C. High Strength Porous PLA Gyroid Scaffolds Manufactured via Fused Deposition Modeling for Tissue-Engineering Applications. Smart Mater. Med. 2021, 2, 15–25. [Google Scholar] [CrossRef]
  18. Bouteldja, A.; Louar, M.A.; Hemmouche, L.; Gilson, L.; Miranda-Vicario, A.; Rabet, L. Experimental Investigation of the Quasi-Static and Dynamic Compressive Behavior of Polymer-Based 3D-Printed Lattice Structures. Int. J. Impact Eng. 2023, 180, 104640. [Google Scholar] [CrossRef]
  19. Qin, D.; Sang, L.; Zhang, Z.; Lai, S.; Zhao, Y. Compression Performance and Deformation Behavior of 3D-Printed PLA-Based Lattice Structures. Polymers 2022, 14, 1062. [Google Scholar] [CrossRef]
  20. Coluccia, A.; Jiang, G.; Meyer, G.; De Pasquale, G.; Mittelstedt, C. Nonlinear Static and Dynamic Modeling of Energy Absorption Lattice Structures Behavior. Mech. Adv. Mater. Struct. 2023, 30, 2838–2849. [Google Scholar] [CrossRef]
  21. Guo, T.; Scimeca, J.-C.; Ivanovski, S.; Verron, E.; Gulati, K. Enhanced Corrosion Resistance and Local Therapy from Nano-Engineered Titanium Dental Implants. Pharmaceutics 2023, 15, 315. [Google Scholar] [CrossRef] [PubMed]
  22. Intrigila, C.; Nodargi, N.A.; Bisegna, P. The Compressive Response of Additively-Manufactured Hollow Truss Lattices: An Experimental Investigation. Int. J. Adv. Manuf. Technol. 2022, 120, 3529–3541. [Google Scholar] [CrossRef]
  23. Varma, R.P. Energy Absorption of Multi-Material Cellular Structures. Ph.D. Thesis, Arizona State University, Tempe, AZ, USA, 2021. [Google Scholar]
  24. Yu, S.; Sun, J.; Bai, J. Investigation of Functionally Graded TPMS Structures Fabricated by Additive Manufacturing. Mater. Des. 2019, 182, 108021. [Google Scholar] [CrossRef]
  25. Guo, X.; Li, X.; Wang, E.; Fuh, J.Y.H.; Lu, W.F.; Zhai, W. Bioinspired Hierarchical Diamond Triply Periodic Minimal Surface Lattices with High Energy Absorption and Great Damage Tolerance. Addit. Manuf. 2023, 76, 103792. [Google Scholar]
  26. Mahapatra, I.; Velmurugan, R.; Jayaganthan, R. Enhanced Flexural Performance of Diamond Latticed Triply Periodic Minimal Surface Sandwich Panels. Adv. Eng. Mater. 2023, 2300813. [Google Scholar] [CrossRef]
  27. Li, F.; Gan, J.; Zhang, L.; Tan, H.; Li, E.; Li, B. Enhancing Impact Resistance of Hybrid Structures Designed with Triply Periodic Minimal Surfaces. Compos. Sci. Technol. 2024, 245, 110365. [Google Scholar] [CrossRef]
  28. Novak, N.; Al-Ketan, O.; Borovinšek, M.; Krstulović-Opara, L.; Rowshan, R.; Vesenjak, M.; Ren, Z. Development of Novel Hybrid TPMS Cellular Lattices and Their Mechanical Characterisation. J. Mater. Res. Technol. 2021, 15, 1318–1329. [Google Scholar] [CrossRef]
  29. Nazir, A.; Hussain, S.; Ali, H.M.; Waqar, S. Design and Mechanical Performance of Nature-Inspired Novel Hybrid Triply Periodic Minimal Surface Lattice Structures Fabricated Using Material Extrusion. Mater. Today Commun. 2024, 38, 108349. [Google Scholar] [CrossRef]
  30. Ingrole, A.; Hao, A.; Liang, R. Design and Modeling of Auxetic and Hybrid Honeycomb Structures for In-Plane Property Enhancement. Mater. Des. 2017, 117, 72–83. [Google Scholar] [CrossRef]
  31. Lazar, P.J.L.; Subramanian, J.; Natarajan, E.; Markandan, K.; Ramesh, S. Anisotropic Structure-Property Relations of FDM Printed Short Glass Fiber Reinforced Polyamide TPMS Structures under Quasi-Static Compression. J. Mater. Res. Technol. 2023, 24, 9562–9579. [Google Scholar] [CrossRef]
  32. Miralbes, R.; Higuera, S.; Ranz, D.; Gomez, J.A. Comparative Analysis of Mechanical Properties and Energy Absorption Capabilities of Functionally Graded and Non-Graded Thermoplastic Sheet Gyroid Structures. Mech. Adv. Mater. Struct. 2022, 29, 5142–5155. [Google Scholar] [CrossRef]
  33. Pasini, C.; Pandini, S.; Ramorino, G.; Sartore, L. Tailoring the Properties of Composite Scaffolds with a 3D-Printed Lattice Core and a Bioactive Hydrogel Shell for Tissue Engineering. J. Mech. Behav. Biomed. Mater. 2024, 150, 106305. [Google Scholar] [CrossRef] [PubMed]
  34. Sankineni, R.; Ravi Kumar, Y. Evaluation of Energy Absorption Capabilities and Mechanical Properties in FDM Printed PLA TPMS Structures. Proc. Inst. Mech. Eng. Part C J. Mech. Eng. Sci. 2022, 236, 3558–3577. [Google Scholar] [CrossRef]
  35. Zhang, J.; Chen, X.; Sun, Y.; Yang, J.; Chen, R.; Xiong, Y.; Hou, W.; Bai, L. Design of a Biomimetic Graded TPMS Scaffold with Quantitatively Adjustable Pore Size. Mater. Des. 2022, 218, 110665. [Google Scholar] [CrossRef]
  36. Borikar, G.P.; Patil, A.R.; Kolekar, S.B. Additively Manufactured Lattice Structures and Materials: Present Progress and Future Scope. Int. J. Precis. Eng. Manuf. 2023, 24, 1–48. [Google Scholar] [CrossRef]
  37. Li, X.; Yu, X.; Chua, J.W.; Lee, H.P.; Ding, J.; Zhai, W. Microlattice Metamaterials with Simultaneous Superior Acoustic and Mechanical Energy Absorption. Small 2021, 17, 2100336. [Google Scholar] [CrossRef] [PubMed]
  38. Noronha, J.; Qian, M.; Leary, M.; Kyriakou, E.; Brandt, M. Hollow-Walled Lattice Materials by Additive Manufacturing: Design, Manufacture, Properties, Applications and Challenges. Curr. Opin. Solid State Mater. Sci. 2021, 25, 100940. [Google Scholar] [CrossRef]
  39. Yang, X.; Ma, W.; Zhang, Z.; Liu, S.; Tang, H. Ultra-High Specific Strength Ti6Al4V Alloy Lattice Material Manufactured via Selective Laser Melting. Mater. Sci. Eng. A 2022, 840, 142956. [Google Scholar] [CrossRef]
  40. Amaechi, C.V.; Adefuye, E.F.; Kgosiemang, I.M.; Huang, B.; Amaechi, E.C. Scientometric Review for Research Patterns on Additive Manufacturing of Lattice Structures. Materials 2022, 15, 5323. [Google Scholar] [CrossRef] [PubMed]
  41. Yu, Z.; Pan, Z.; Ding, D.; Rong, Z.; Li, H.; Wu, B. Strut Formation Control and Processing Time Optimization for Wire Arc Additive Manufacturing of Lattice Structures. J. Manuf. Process. 2022, 79, 962–974. [Google Scholar] [CrossRef]
  42. Zhao, M.; Zhang, D.Z.; Li, Z.; Zhang, T.; Zhou, H.; Ren, Z. Design, Mechanical Properties, and Optimization of BCC Lattice Structures with Taper Struts. Compos. Struct. 2022, 295, 115830. [Google Scholar] [CrossRef]
  43. Bodaghi, M.; Namvar, N.; Yousefi, A.; Teymouri, H.; Demoly, F.; Zolfagharian, A. Metamaterial Boat Fenders with Supreme Shape Recovery and Energy Absorption/Dissipation via FFF 4D Printing. Smart Mater. Struct. 2023, 32, 95028. [Google Scholar] [CrossRef]
  44. Bouakaz, I.; Drouet, C.; Grossin, D.; Cobraiville, E.; Nolens, G. Hydroxyapatite 3D-Printed Scaffolds with Gyroid-Triply Periodic Minimal Surface Porous Structure: Fabrication and an In Vivo Pilot Study in Sheep. Acta Biomater. 2023, 170, 580–595. [Google Scholar] [CrossRef] [PubMed]
  45. Chen, D.; Gao, K.; Yang, J.; Zhang, L. Functionally Graded Porous Structures: Analyses, Performances, and Applications—A Review. Thin-Walled Struct. 2023, 191, 111046. [Google Scholar] [CrossRef]
  46. Hamzehei, R.; Serjouei, A.; Wu, N.; Zolfagharian, A.; Bodaghi, M. 4D Metamaterials with Zero Poisson’s Ratio, Shape Recovery, and Energy Absorption Features. Adv. Eng. Mater. 2022, 24, 2200656. [Google Scholar] [CrossRef]
  47. Medvedev, A.E.; Maconachie, T.; Leary, M.; Qian, M.; Brandt, M. Perspectives on Additive Manufacturing for Dynamic Impact Applications. Mater. Des. 2022, 221, 110963. [Google Scholar] [CrossRef]
  48. Shen, B.; Chen, Y.; Li, C.; Wang, S.; Chen, X. Superconducting Fault Current Limiter (SFCL): Experiment and the Simulation from Finite-Element Method (FEM) to Power/Energy System Software. Energy 2021, 234, 121251. [Google Scholar] [CrossRef]
  49. David Müzel, S.; Bonhin, E.P.; Guimarães, N.M.; Guidi, E.S. Application of the Finite Element Method in the Analysis of Composite Materials: A Review. Polymers 2020, 12, 818. [Google Scholar] [CrossRef] [PubMed]
  50. Alemayehu, D.B.; Huang, S.-J.; Koricho, E.G. Experimental and FEM Analysis of Three Carbon Steel Characterization under Quasi-Static Strain Rate for Bumper Beam Application. In MATEC Web of Conferences; EDP Sciences: Les Ulis, France, 2017; Volume 123. [Google Scholar]
  51. Alemayehu, D.B.; Jeng, Y.R. Three-Dimensional Finite Element Investigation into Effects of Implant Thread Design and Loading Rate on Stress Distribution in Dental Implants and Anisotropic Bone. Materials 2021, 14, 6974. [Google Scholar] [CrossRef]
  52. Al-Wattar, T.A.A. Developing Equivalent Solid Model for Lattice Cell Structures Using Numerical Approaches. Ph.D. Thesis, Wright State University, Dayton, OH, USA, 2020. [Google Scholar]
  53. Alemayehu, D.B.; Todoh, M.; Huang, S.-J. Advancing 3D Dental Implant FEA: Incorporating Biomimetic Trabecular Bone with Varied Pore Sizes in Voronoi Lattices. J. Funct. Biomater. 2024, 15, 94. [Google Scholar] [CrossRef]
  54. Gharehbaghi, H.; Farrokhabadi, A. Experimental, Analytical, and Numerical Studies of the Energy Absorption Capacity of Bi-Material Lattice Structures Based on Quadrilateral Bipyramid Unit Cell. Compos. Struct. 2024, 337, 118042. [Google Scholar] [CrossRef]
  55. Guo, Z.; Hu, J.; Kong, Z. On Impact Loading of Voronoi Functional Graded Porous Structure. Mater. Today Commun. 2024, 38, 107765. [Google Scholar] [CrossRef]
  56. NTpology Software. Available online: https://www.ntop.com/ (accessed on 30 January 2024).
  57. Palmiyanto, M.H.; Surojo, E.; Ariawan, D.; Imaduddin, F. E-Glass/Kenaf Fibre Reinforced Thermoset Composites Fiiled with MCC and Immersion in a Different Fluid. Sci. Rep. 2022, 12, 20332. [Google Scholar] [CrossRef]
  58. Al, G.; Aydemir, D.; Kaygin, B.; Ayrilmis, N.; Gunduz, G. Preparation and Characterization of Biopolymer Nanocomposites from Cellulose Nanofibrils and Nanoclays. J. Compos. Mater. 2017, 52, 689–700. [Google Scholar] [CrossRef]
  59. Ervina, J.; Mariatti, M.; Hamdan, S. Mechanical, Electrical and Thermal Properties of Multi-Walled Carbon Nanotubes/Epoxy Composites: Effect of Post-Processing Techniques and Filler Loading. Polym. Bull. 2017, 74, 2513–2533. [Google Scholar] [CrossRef]
  60. Al-Ketan, O.; Rowshan, R.; Abu Al-Rub, R.K. Topology-Mechanical Property Relationship of 3D Printed Strut, Skeletal, and Sheet Based Periodic Metallic Cellular Materials. Addit. Manuf. 2018, 19, 167–183. [Google Scholar] [CrossRef]
  61. Cheng, X.Y.; Li, S.J.; Murr, L.E.; Zhang, Z.B.; Hao, Y.L.; Yang, R.; Medina, F.; Wicker, R.B. Compression Deformation Behavior of Ti-6Al-4V Alloy with Cellular Structures Fabricated by Electron Beam Melting. J. Mech. Behav. Biomed. Mater. 2012, 16, 153–162. [Google Scholar] [CrossRef] [PubMed]
  62. Li, N.; Liu, S.Z.; Wu, X.N.; Wang, J.Y.; Han, Y.S.; Zhang, X.C. Mechanical Characteristics of a Novel Rotating Star-Rhombic Auxetic Structure with Multi-Plateau Stages. Thin-Walled Struct. 2023, 191, 111081. [Google Scholar] [CrossRef]
  63. Wang, N.; Meenashisundaram, G.K.; Chang, S.; Fuh, J.Y.H.; Dheen, S.T.; Senthil Kumar, A. A Comparative Investigation on the Mechanical Properties and Cytotoxicity of Cubic, Octet, and TPMS Gyroid Structures Fabricated by Selective Laser Melting of Stainless Steel 316L. J. Mech. Behav. Biomed. Mater. 2022, 129, 105151. [Google Scholar] [CrossRef]
  64. Ashby, M.F. The Properties of Foams and Lattices. Philos. Trans. R. Soc. A Math. Phys. Eng. Sci. 2006, 364, 15–30. [Google Scholar] [CrossRef]
  65. Gibson, L.J. Cellular Solids. Mrs Bull. 2003, 28, 270–274. [Google Scholar] [CrossRef]
  66. Iantaffi, C.; Bele, E.; McArthur, D.; Lee, P.D.; Leung, C.L.A. Auxetic Response of Additive Manufactured Cubic Chiral Lattices at Large Plastic Strains. Mater. Des. 2023, 233, 112207. [Google Scholar] [CrossRef]
  67. Kechagias, S.; Oosterbeek, R.N.; Munford, M.J.; Ghouse, S.; Jeffers, J.R.T. Controlling the Mechanical Behaviour of Stochastic Lattice Structures: The Key Role of Nodal Connectivity. Addit. Manuf. 2022, 54, 102730. [Google Scholar] [CrossRef]
  68. Sahariah, B.J.; Namdeo, A.; Khanikar, P. Composite-Inspired Multilattice Metamaterial Structure: An Auxetic Lattice Design with Improved Strength and Energy Absorption. Mater. Today Commun. 2022, 30, 103159. [Google Scholar] [CrossRef]
  69. Habib, F.N.; Iovenitti, P.; Masood, S.H.; Nikzad, M. Fabrication of Polymeric Lattice Structures for Optimum Energy Absorption Using Multi Jet Fusion Technology. Mater. Des. 2018, 155, 86–98. [Google Scholar] [CrossRef]
  70. Miltz, J.; Ramon, O. Energy Absorption Characteristics of Polymeric Foams Used as Cushioning Materials. Polym. Eng. Sci. 1990, 30, 129–133. [Google Scholar] [CrossRef]
  71. Rahimidehgolan, F.; Altenhof, W. Compressive Behavior and Deformation Mechanisms of Rigid Polymeric Foams: A Review. Compos. Part B Eng. 2023, 253, 110513. [Google Scholar] [CrossRef]
  72. Maskery, I.; Aboulkhair, N.T.; Aremu, A.O.; Tuck, C.J.; Ashcroft, I.A. Compressive Failure Modes and Energy Absorption in Additively Manufactured Double Gyroid Lattices. Addit. Manuf. 2017, 16, 24–29. [Google Scholar] [CrossRef]
  73. Toksoy, A.K.; Güden, M. Partial Al Foam Filling of Commercial 1050H14 Al Crash Boxes: The Effect of Box Column Thickness and Foam Relative Density on Energy Absorption. Thin-Walled Struct. 2010, 48, 482–494. [Google Scholar] [CrossRef]
  74. Simpson, J.; Kazancı, Z. Crushing Investigation of Crash Boxes Filled with Honeycomb and Re-Entrant (Auxetic) Lattices. Thin-Walled Struct. 2020, 150, 106676. [Google Scholar] [CrossRef]
  75. Ashby, M.F.; Evans, T.; Fleck, N.A.; Hutchinson, J.W.; Wadley, H.N.G.; Gibson, L.J. Metal Foams: A Design Guide; Elsevier: Amsterdam, The Netherlands, 2000; ISBN 0080511465. [Google Scholar]
  76. Duan, Y.; Zhao, X.; Du, B.; Shi, X.; Zhao, H.; Hou, B.; Li, Y. Quasi-Static Compressive Behavior and Constitutive Model of Graded Foams. Int. J. Mech. Sci. 2020, 177, 105603. [Google Scholar] [CrossRef]
  77. Maiti, S.K.; Gibson, L.J.; Ashby, M.F. Deformation and Energy Absorption Diagrams for Cellular Solids. Acta Metall. 1984, 32, 1963–1975. [Google Scholar] [CrossRef]
  78. Haney, C.W.; Siller, H.R. Properties of Hyper-Elastic-Graded Triply Periodic Minimal Surfaces. Polymers 2023, 15, 4475. [Google Scholar] [CrossRef]
  79. Chen, R.; Wang, S.; Wu, Z.; Jia, Y.; Zhang, W.; Cao, B.; Song, X.; Ma, Q.; Li, C.; Du, J. Compressive Enhancement Gyroid Lattice with Implicit Modeling Implementation and Modified GA Model Property Prediction. Mater. Des. 2023, 232, 112153. [Google Scholar] [CrossRef]
  80. Vafaeefar, M.; Moerman, K.M.; Vaughan, T.J. Experimental and Computational Analysis of Energy Absorption Characteristics of Three Biomimetic Lattice Structures under Compression. J. Mech. Behav. Biomed. Mater. 2024, 151, 106328. [Google Scholar] [CrossRef] [PubMed]
  81. Zhao, M.; Liu, F.; Zhou, H.; Zhang, T.; Zhang, D.Z.; Fu, G. Effect of the Direction of the Gradient on the Mechanical Properties and Energy Absorption of Additive Manufactured Ti-6Al-4 V Functionally Graded Lattice Structures. J. Alloys Compd. 2023, 968, 171874. [Google Scholar] [CrossRef]
  82. Kladovasilakis, N.; Tsongas, K.; Tzetzis, D. Mechanical and FEA-Assisted Characterization of Fused Filament Fabricated Triply Periodic Minimal Surface Structures. J. Compos. Sci. 2021, 5, 58. [Google Scholar] [CrossRef]
  83. Lu, C.; Zhang, C.; Wen, P.; Chen, F. Mechanical Behavior of Al–Si10–Mg Gyroid Surface with Variable Topological Parameters Fabricated via Laser Powder Bed Fusion. J. Mater. Res. Technol. 2021, 15, 5650–5661. [Google Scholar] [CrossRef]
  84. Abou-Ali, A.M.; Al-Ketan, O.; Lee, D.W.; Rowshan, R.; Abu Al-Rub, R.K. Mechanical Behavior of Polymeric Selective Laser Sintered Ligament and Sheet Based Lattices of Triply Periodic Minimal Surface Architectures. Mater. Des. 2020, 196, 109100. [Google Scholar] [CrossRef]
  85. Miltz, J.; Gruenbaum, G. Evaluation of Cushioning Properties of Plastic Foams from Compressive Measurements. Polym. Eng. Sci. 1981, 21, 1010–1014. [Google Scholar] [CrossRef]
  86. Abou-Ali, A.M.; Lee, D.W.; Abu Al-Rub, R.K. On the Effect of Lattice Topology on Mechanical Properties of SLS Additively Manufactured Sheet-, Ligament-, and Strut-Based Polymeric Metamaterials. Polymers 2022, 14, 4583. [Google Scholar] [CrossRef] [PubMed]
  87. Zhang, J.; Liu, Y.; Babamiri, B.B.; Zhou, Y.; Dargusch, M.; Hazeli, K.; Zhang, M.-X. Enhancing Specific Energy Absorption of Additively Manufactured Titanium Lattice Structures through Simultaneous Manipulation of Architecture and Constituent Material. Addit. Manuf. 2022, 55, 102887. [Google Scholar] [CrossRef]
  88. Zheng, G.; Zhang, L.; Wang, E.; Yao, R.; Luo, Q.; Li, Q.; Sun, G. Investigation into Multiaxial Mechanical Behaviors of Kelvin and Octet-B Polymeric Closed-Cell Foams. Thin-Walled Struct. 2022, 177, 109405. [Google Scholar] [CrossRef]
Figure 1. Natural TPMS-like structures. (a) Gyroid patterns in butterfly wings: (i) Diagram of the butterfly sourced from [12]; (iiv) Scanning Electron Micrographs depicting the cross-sectional view of a butterfly wing scale, with (v) being adapted from [13]. (b) Unit cell of walled gyroid TPMS lattice. (c) Walled TPMS gyroid lattice structure.
Jmmp 08 00086 g001
Figure 2. Illustrates the TPMS gyroid, walled TPMS gyroid, and composite TPMS gyroid structures with a uniform cell size of 10 × 10 × 10 cubic millimeters and an overall dimension of 30 × 30 × 30 cubic millimeters (di) alongside the unit cell (ac). And a Computer-Aided Design (CAD) model of the composite TPMS gyroid with five distinct relative densities is presented (jn). 3D-printed blue PLA lattice structures are depicted (o,p) for visual reference. GTL: gyroid TPMS lattice; GWTL: gyroid walled TPMS lattice; and BSTL: Boolean subtracted composite TPMS lattice.
Jmmp 08 00086 g002
Figure 3. (a) The physical lattice specimen fabricated for mechanical compression testing, (b) The three-dimensional (CAD) model of the lattice structure with boundary conditions (BCs) configured for Finite Element Analysis (FEA), and (c) The Finite Element (FE) mesh representation of the lattice model.
Jmmp 08 00086 g003
Figure 4. Assembly combination using ANSYS SpaceClaim: top and bottom gripper with composite TPMS gyroid lattices at varied relative densities: (a) 14%; (b) 25%; (c) 33%; (d) 38%; (e) 54%.
Jmmp 08 00086 g004
Figure 5. This figure shows the following: (a) Unlatticed square crush box; (b) Composite TPMS gyroid lattices crush box; (c) Fine meshed latticed crush box using nTop; (d) Node extraction from FE volume mesh for applying BCs and Crash box-lower ram and crash box-upper ram interactions; (e) Parameters for simulation of latticed crush box impact.
Jmmp 08 00086 g005
Figure 6. Depicts the stress versus strain: (a) Solid cube PLA printed; (b) 54% composite lattice for three varied strain rates; (c) TPMS gyroid, walled TPMS gyroid, and composite TPMS gyroid (38% ρ*/ρs); (d) Composite TPMS gyroid for five varied ρ*/ρs.
Jmmp 08 00086 g006
Figure 7. Mechanical compression across strain stages in 3D-printed PLA lattices with variable relative densities.
Jmmp 08 00086 g007
Figure 8. Vertical buckling and horizontal bending collapse in composite TPMS gyroid lattice under mechanical compression testing and FEA deformation analysis.
Jmmp 08 00086 g008
Figure 9. Visualization of composite TPMS gyroid lattice structures, detailing mechanical properties and modeling: (a) Correlation among Young’s modulus, lattice plateau stress, and relative density; (b) Gibson–Ashby power fitting analysis illustrating the relationship between relative plateau stress and Young’s modulus as a function of relative density; (c) Modified Gibson–Ashby power fitting showing the dependency of relative plateau stress on relative Young’s modulus.
Jmmp 08 00086 g009
Figure 10. SEM images of five relative density FDM-printed composite TPMS gyroid structures in their original (undeformed) and mechanically compressed (deformed) states, captured at magnifications of 25× and 100×, respectively.
Jmmp 08 00086 g010
Figure 11. Show the mesh sensitivity study for CTL with a 54% relative density effect on engineering stress–strain response.
Jmmp 08 00086 g011
Figure 12. Illustrates stress–strain curves alongside their corresponding Finite Element Analysis (FEA) validations for the following: (a) The standard TPMS gyroid lattice, the walled TPMS gyroid lattice, and the composite TPMS gyroid lattice with a 38% relative density; (b) The five unique composite TPMS gyroid lattice structures with varying relative densities.
Jmmp 08 00086 g012
Figure 13. FEA simulation of composite TPMS gyroid lattices with variable relative densities across five different strain Stages under 3D-printed PLA lattices with variable relative densities.
Jmmp 08 00086 g013
Figure 14. Depicts the (undeformed) and (deformed) mechanical compression testing along with their corresponding simulations for five relative density FDM printed and FE meshed CAD models of the composite TPMS gyroid.
Jmmp 08 00086 g014
Figure 15. Illustrates the performance of five composite TPMS gyroid lattice structures, detailing (a) the cumulative energy absorption per unit volume in MJ/m3 as a function of engineering strain, (b) normalized cumulative energy absorption per unit volume versus normalized engineering stress, utilizing the bulk PLA elastic modulus, (c) energy absorption efficiency in relation to engineering strain, and (d) the ideality of energy absorption efficiency versus engineering strains.
Jmmp 08 00086 g015
Figure 16. The maximum energy absorption and corresponding densification strain in five composite TPMS Gyroid lattice structures subjected to mechanical compression.
Jmmp 08 00086 g016
Figure 17. Maximum von Mises stress contour result from simulation of Lattice Crash Box at an impact speed of 15,600 mm/s for 12.5 ms with the following relative densities: (a) 14%; (b) 25%; (c) 33%; (d) 38%; (e) 54%.
Jmmp 08 00086 g017
Figure 18. Maximum displacement contour result from simulation of Lattice Crash Box at an impact speed of 15,600 mm/s for 12.5 ms with the following relative densities:14%, 25%, 33%, 38%, and 54%.
Jmmp 08 00086 g018
Figure 19. This figure presents an analysis of five crash boxes, each constructed from a corresponding composite TPMS gyroid lattice structure, depicting (a) the relationship between force and displacement and (b) the variation of strain energy with respect to the time duration leading to the densification phase.
Jmmp 08 00086 g019
Table 1. List of symbols and their corresponding descriptions utilized in this study.
SymbolsDescriptions
ρ Density of the gyroid lattice structure, Kg/m3.
ρ P L A Density of the bulk materials from which the gyroid lattice is made, Kg/m3.
ρ * Volume fraction, or relative density, of the gyroid lattice; ρ . / ρ S
E Young’s modulus of gyroid lattice
E S Young’s modulus of the bulk materials from which the gyroid lattice is made.
E * Relative Young’s modulus of the Composite TPMS gyroid lattice, E . / E S
σ p l Plateau Stress of composite TPMS gyroid lattice structure
σ y The yield stress of the bulk materials from which the gyroid lattice is made.
σ * Relative plateau stress of the gyroid lattice
ε Effective strain of the gyroid lattice structure
σ l a t t Engineering Stress of composite TPMS gyroid lattice structure
pThe porosity of the composite lattice
ε D Densification strain of composite TPMS gyroid lattice
MCGMass of composite TPMS gyroid lattice, kg
WVEnergy absorption per volume of composite TPMS gyroid lattice, MJ/m3.
ηIdeal energy absorption efficiency of composite lattice.
γEfficiency of energy absorption by composite TPMS gyroid lattice.
CGibson–Ashby constant.
nGibson–Ashby exponent.
Table 2. Unit cell thickness of constituent gyroid lattice and relative density of corresponding novel lattice.
Thickness of Sheet TPMS Gyroid (mm)Thickness of Walled TPMS Gyroid (mm)Composite TPMS Gyroid (ρ./ρPLA.)
0.41.214%
0.31.025%
0.250.7533%
0.20.638%
0.10.154%
Table 3. Parameters for Fused Deposition Modeling (FDM) 3D printing of lattice specimens.
Printing ParametersValues
Printing speed50 mm/s
Printing temperature205 °C
Bed temperature65 °C
Infill100%
Extrusion width0.48 mm
Filament diameter1.75 mm
Raster angle45/−45
Table 4. Physical and Mechanical Properties of blue PLA filament.
PropertyValueTesting Conditions
Density1.2 g/cm3 @ 21.5 °CASTM D792-ISO
Young’s Modulus2636 ± 330 MPaASTM D638-ISO 527, Flat (X-Y)
Tensile Strength46.6 ± 0.9 MPaASTM D638-ISO 527, Flat (X-Y)
Elongation at Break1.90 ± 0.2%ASTM D638-ISO 527, Flat (X-Y)
Table 5. Experimental design for mechanical compression testing of composite TPMS gyroid lattices and solid PLA cubes.
LevelsRelative Density (%)Replica
Solid PLA Cube-3
GTL-3
WGTL-3
CTL1414%3
CTL2525%3
CTL3333%3
CTL3838%3
CTL5454%3
GTL: Conventional gyroid TPMS lattice; WGTL: Walled gyroid TPMS lattice; CTL: Composite TPMS lattice with rel. density range.
Table 6. Measured weight and calculated actual densities, relative densities, and porosities of the 3D-printed PLA gyroid lattice samples.
Lattice TypeMeasured Average Weight (g)Actual Density (g/cm3)Relative Density (%)Porosity (%)
GTL20.38 ± 2.50 × 10−20.75 ± 1.93 × 10−36139
WGTL13.08 ± 2.40 × 10−30.48 ± 4.10 × 10−43961
CTL144.69 ± 2.38 × 10−30.17 ± 9.00 ×10−51486
CTL 258.37 ± 1.87 × 10−20.31 ± 6.90 × 10−42575
CTL 3311.05 ± 2.06 × 10−20.41 ± 7.60 × 10−43367
CTL 3812.70 ± 2.10 × 10−20.47 ± 7.60 × 10−43862
CTL 5418.08 ± 2.51 × 10−20.67 ± 9.30 × 10−45446
Table 7. Percentage error between experimental and simulation results for Young’s modulus and plateau stress with corresponding standard deviation across different relative densities.
Elastic Modulus (MPa)Plastic Plateau (MPa)
Relative DensityExperimentSimulationError (%)ExperimentSimulationError (%)
14%6.34 ± 0.105.96 ± 0.16.050.36 ± 0.100.36 ± 0.10.21
25%32.24 ± 0.3530.10 ± 0.356.641.48 ± 0.351.48 ± 0.350.02
33%90.47 ± 1.0883.62 ± 1.127.574.43 ± 1.084.44 ± 1.120.35
38%93.66 ± 1.0887.27 ± 1.106.824.44 ± 1.084.45 ± 1.100.09
54%176.93 ± 3.75163.98 ± 3.557.328.83 ± 3.758.83 ± 3.550.03
Disclaimer/Publisher’s Note: The statements, opinions and data contained in all publications are solely those of the individual author(s) and contributor(s) and not of MDPI and/or the editor(s). MDPI and/or the editor(s) disclaim responsibility for any injury to people or property resulting from any ideas, methods, instructions or products referred to in the content.

