


Wire Electrical Discharge Machining of AISI304 and AISI316 Alloys: A Comparative Assessment of Machining Responses, Empirical Modeling and Multi-Objective Optimization

 ,
,  ,
, 
Abstract
:1. Introduction
2. Materials and Methods
2.1. Materials
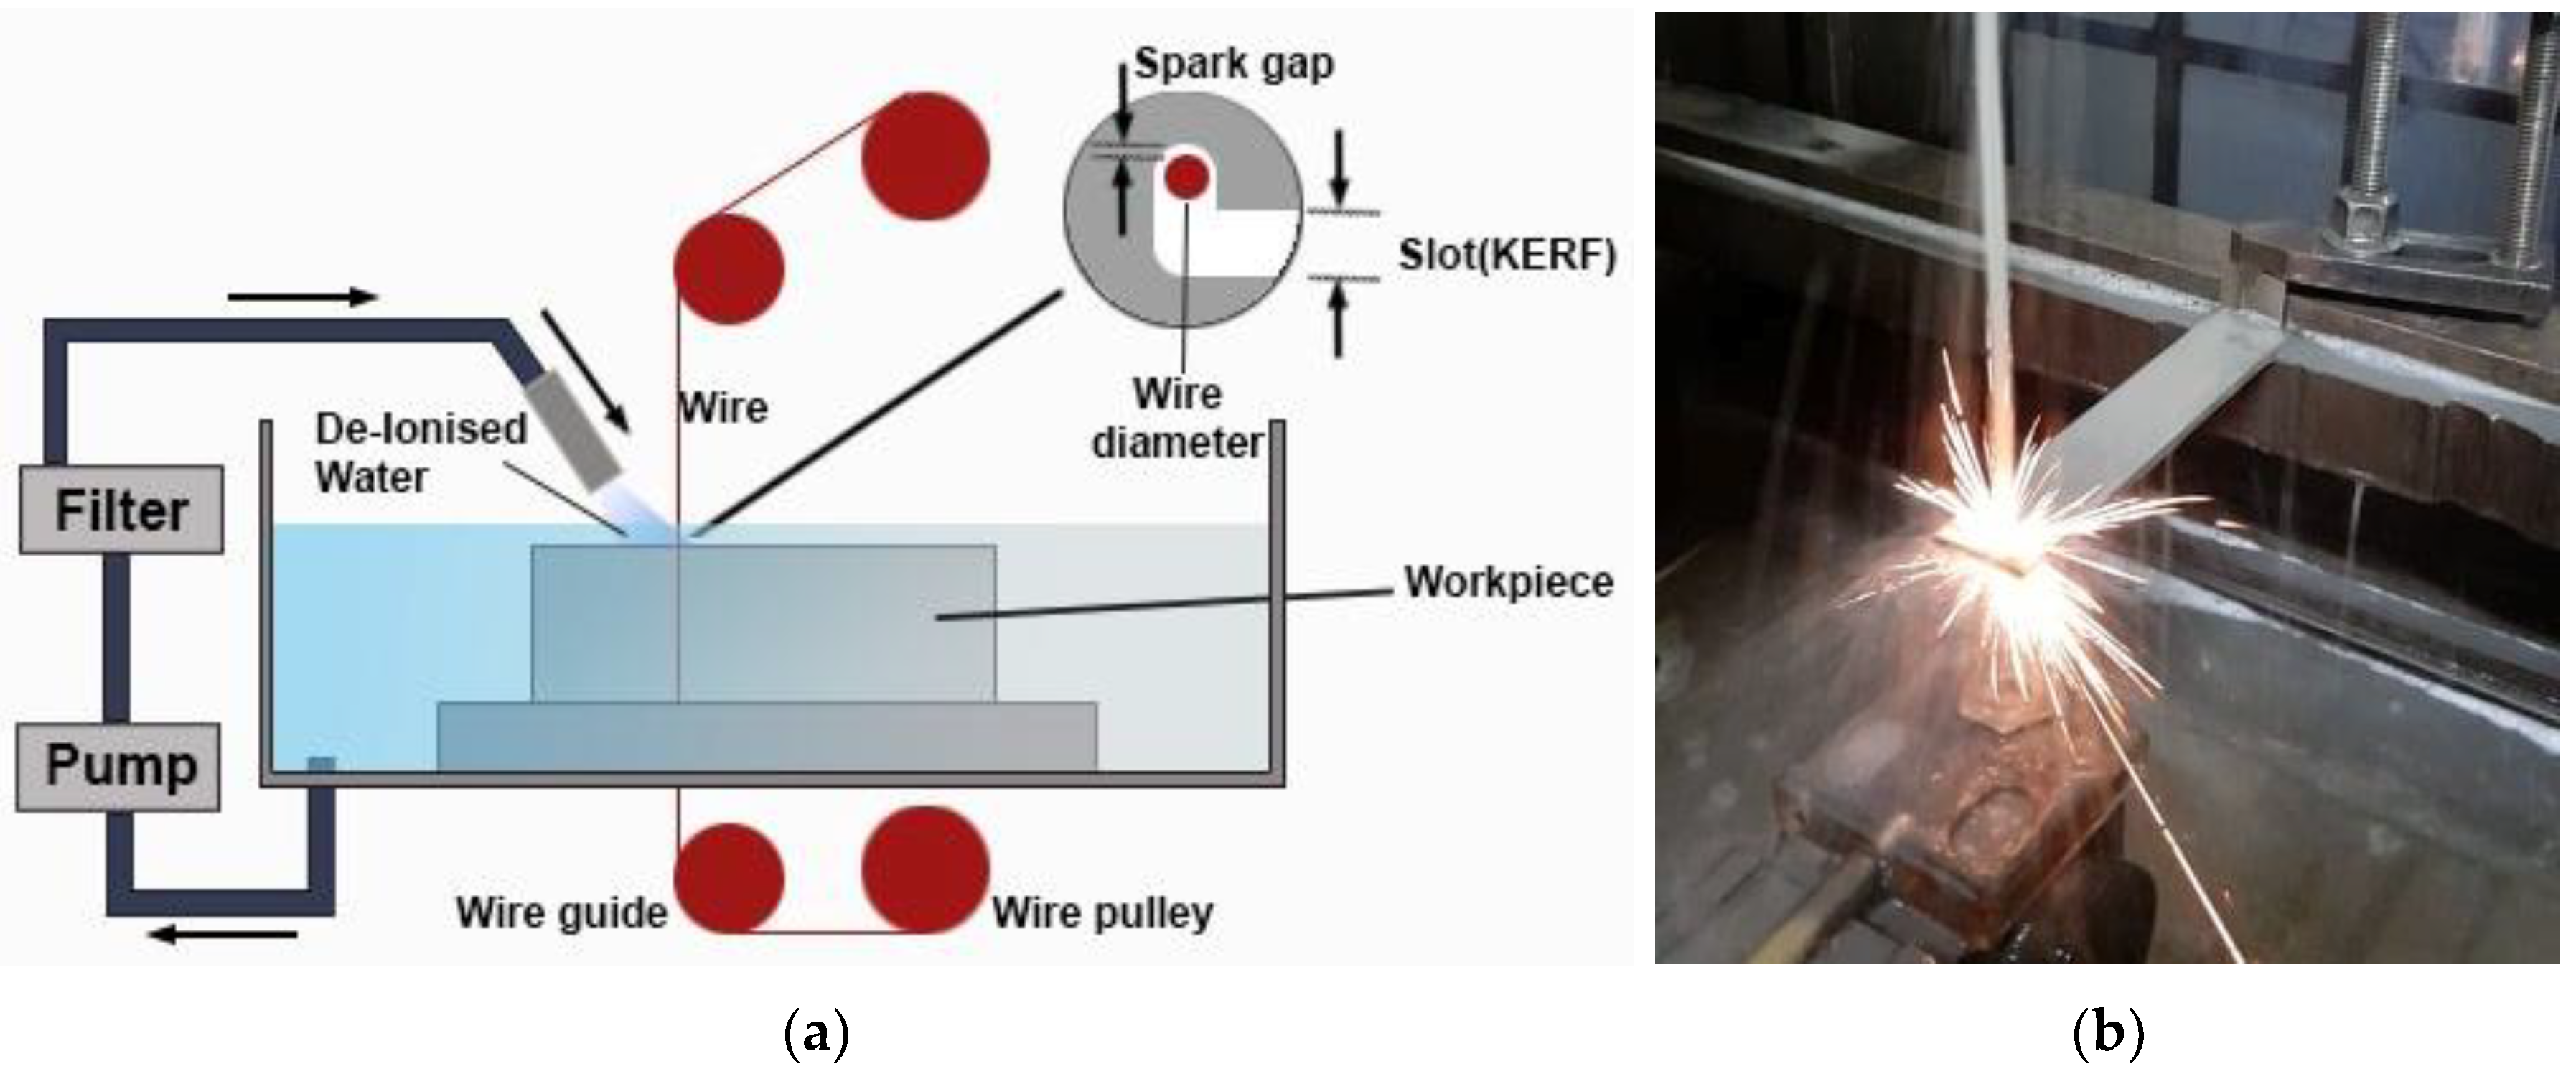
2.2. Equipment Setup
2.3. Design of Experiment
2.4. Measurement and Characterization
3. Results and Discussion
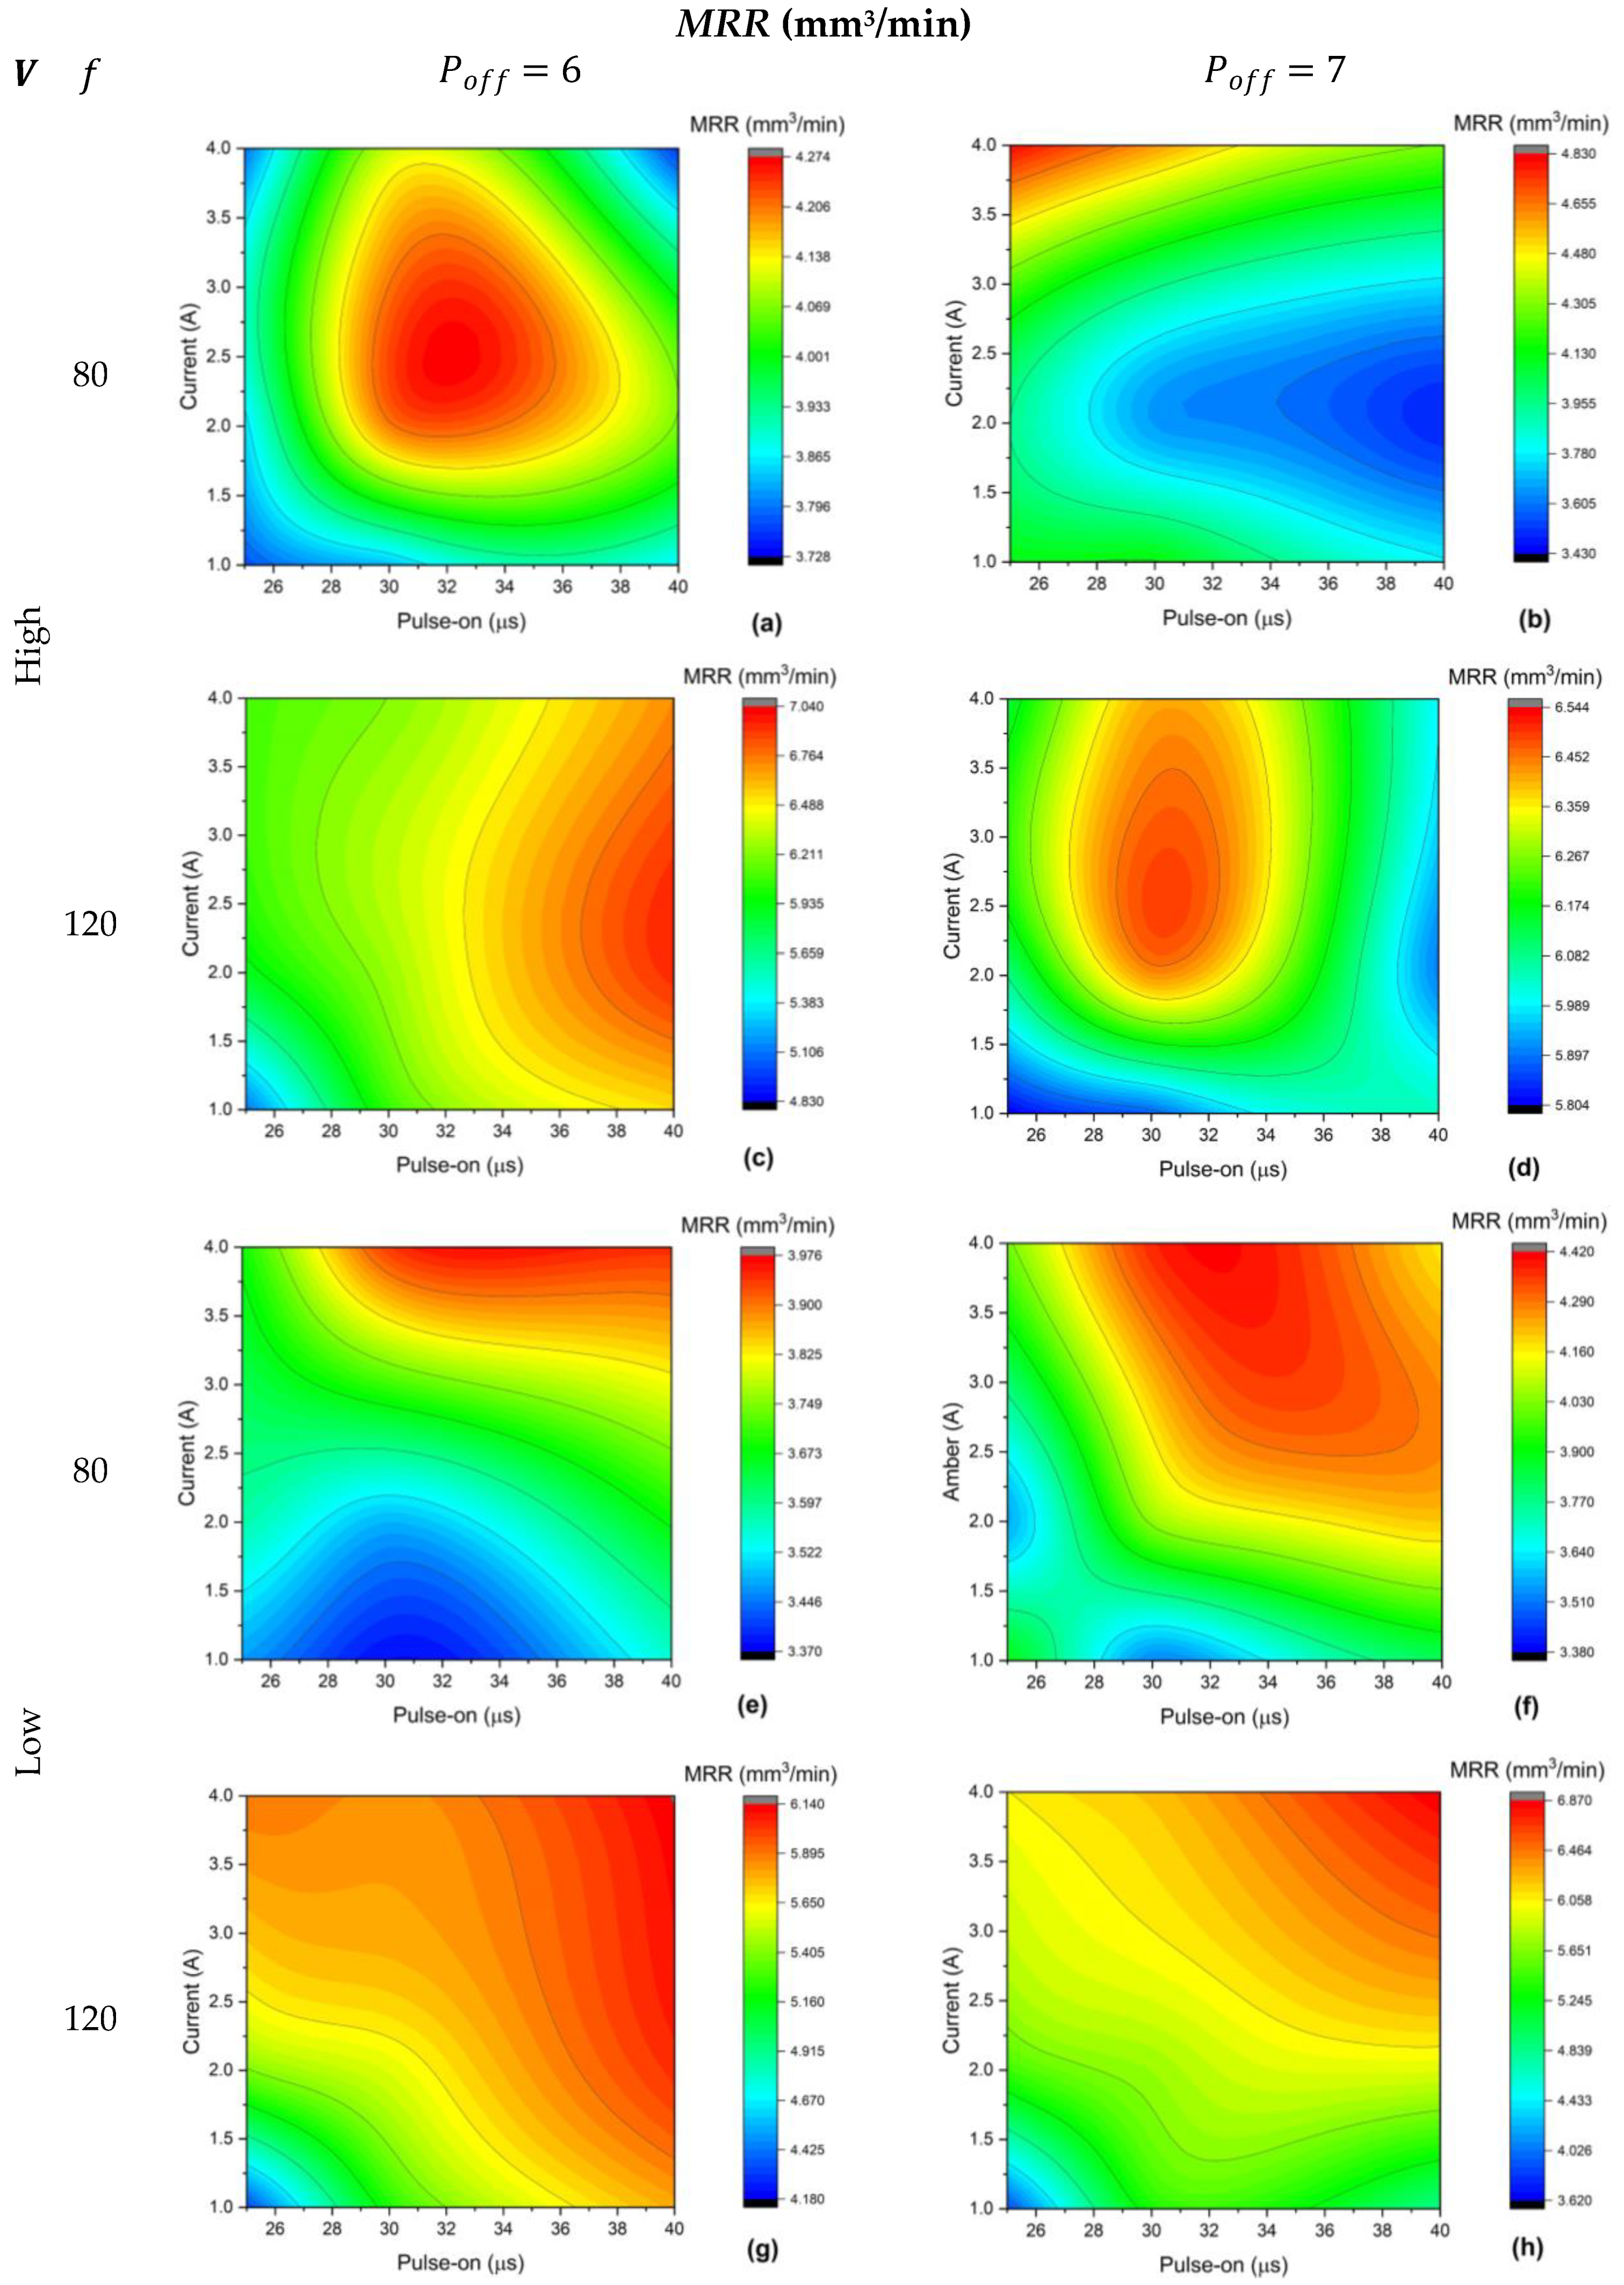
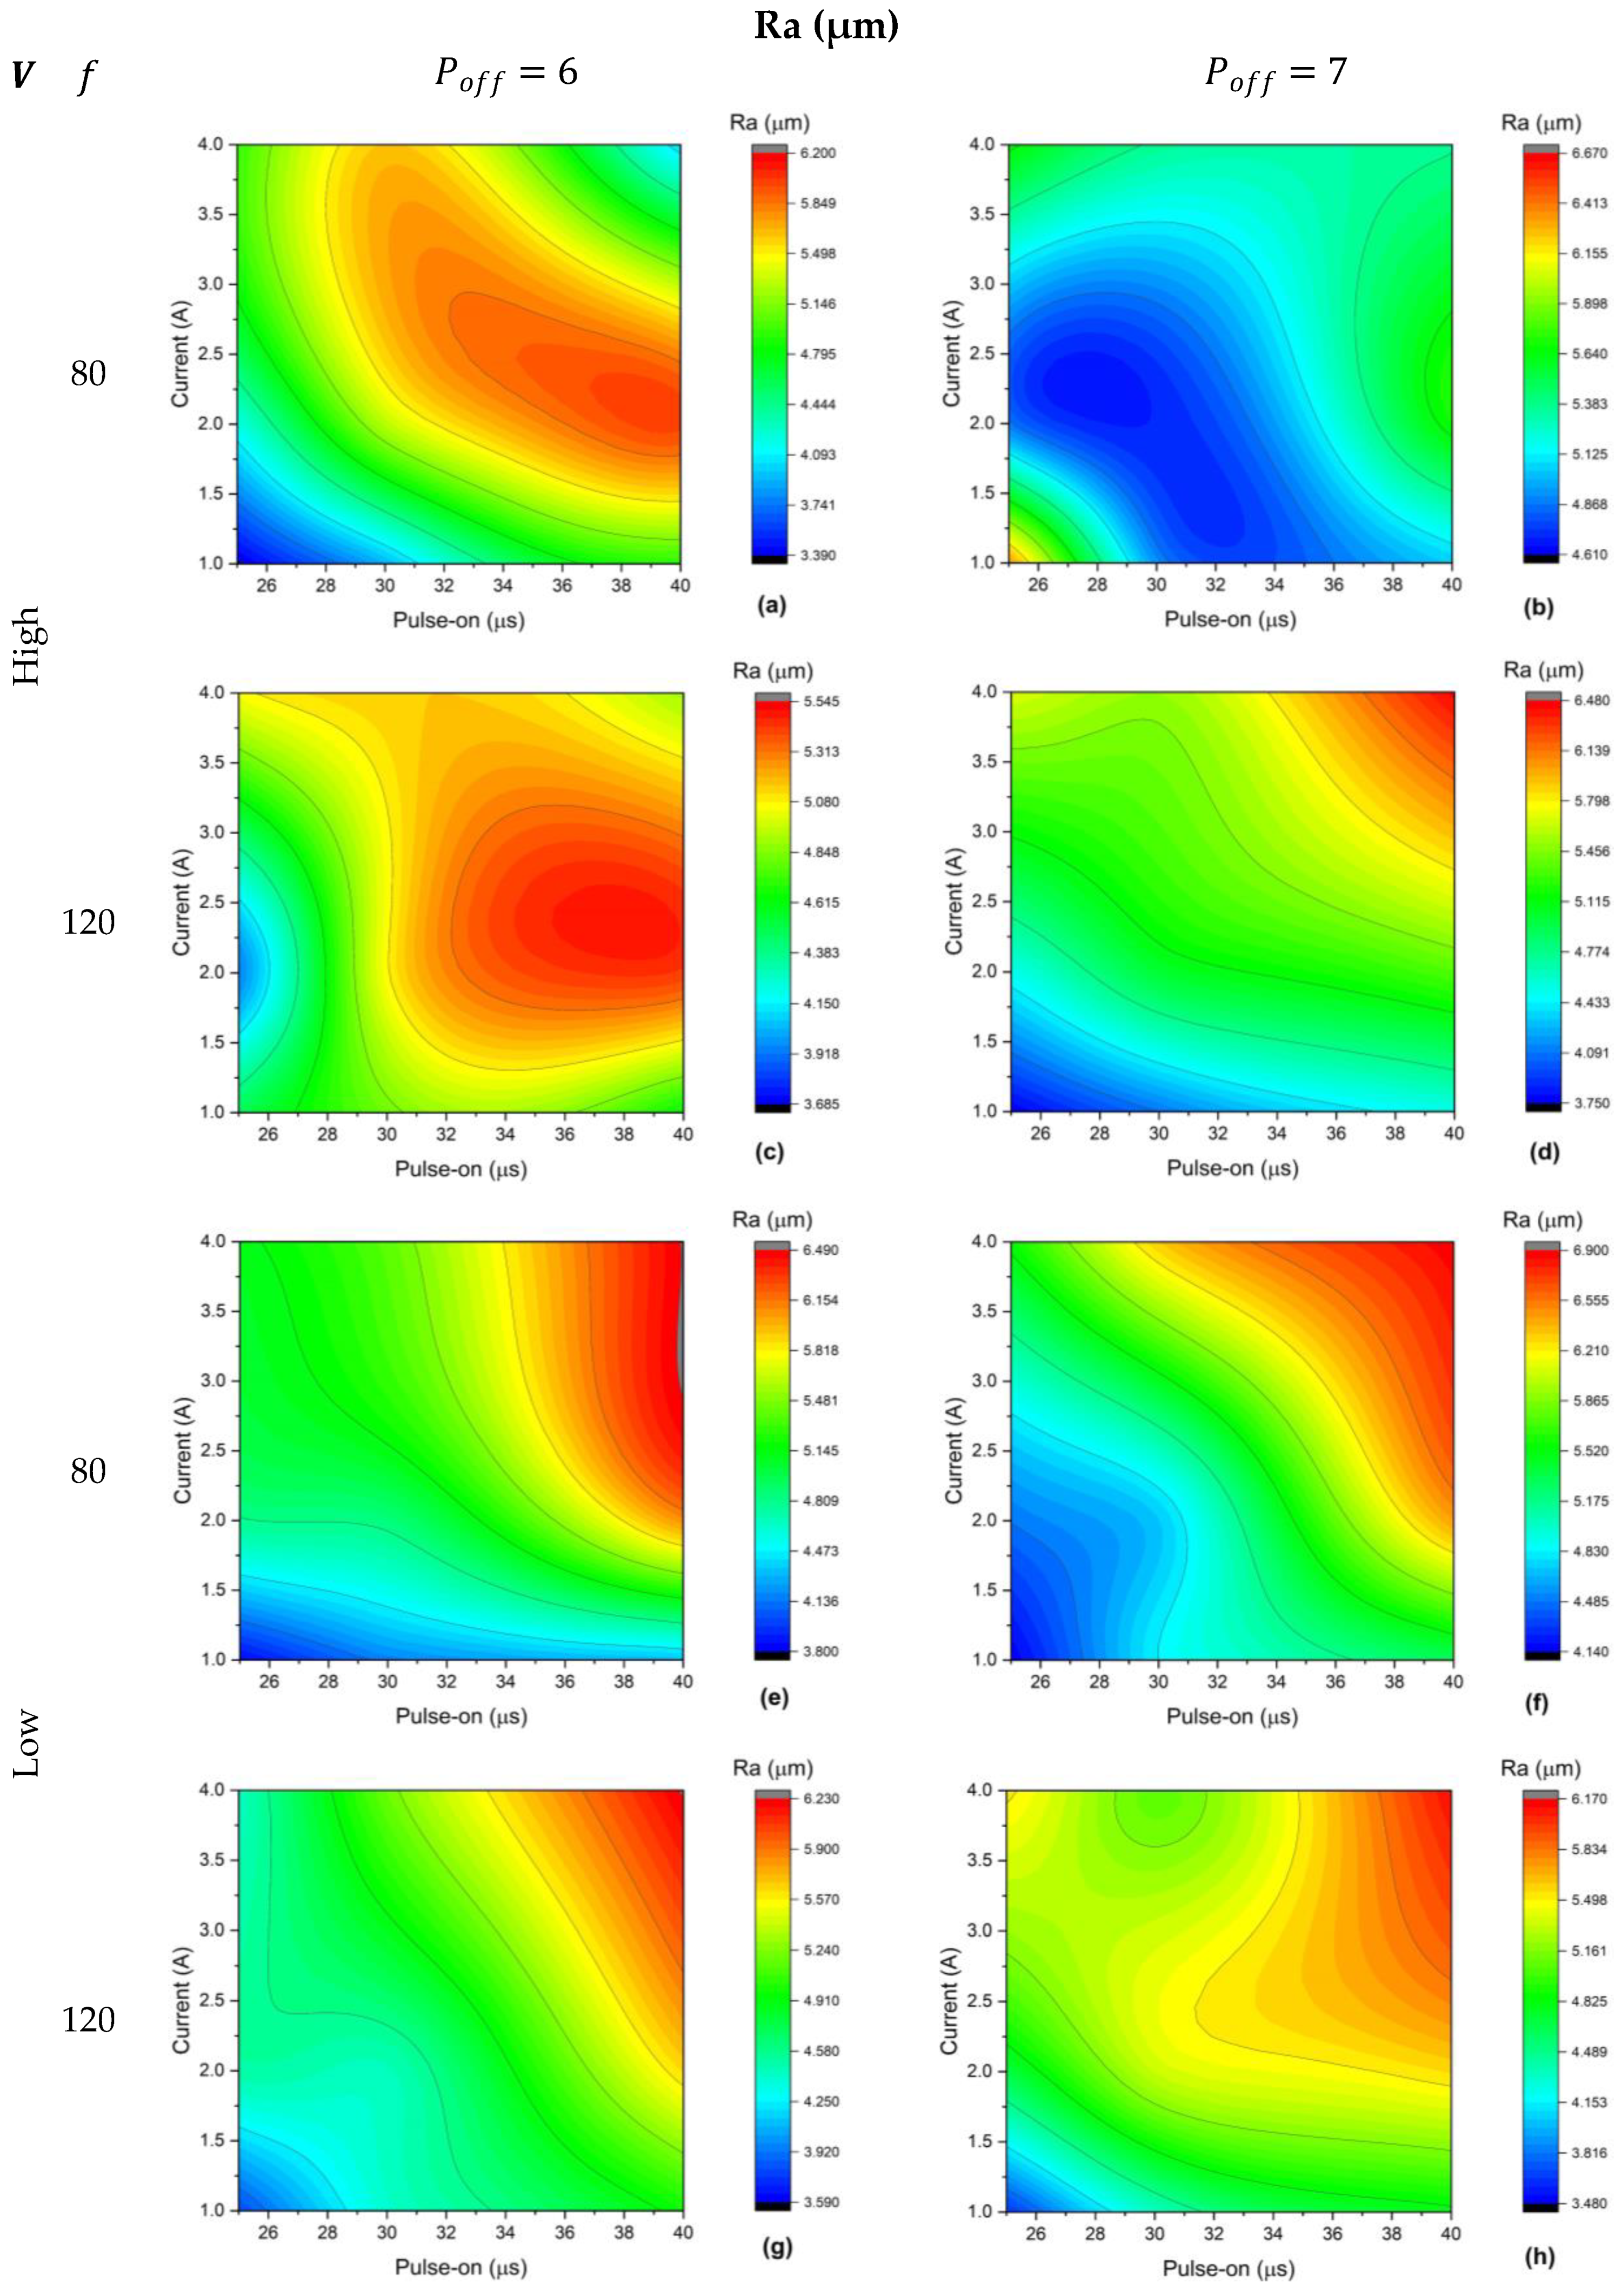
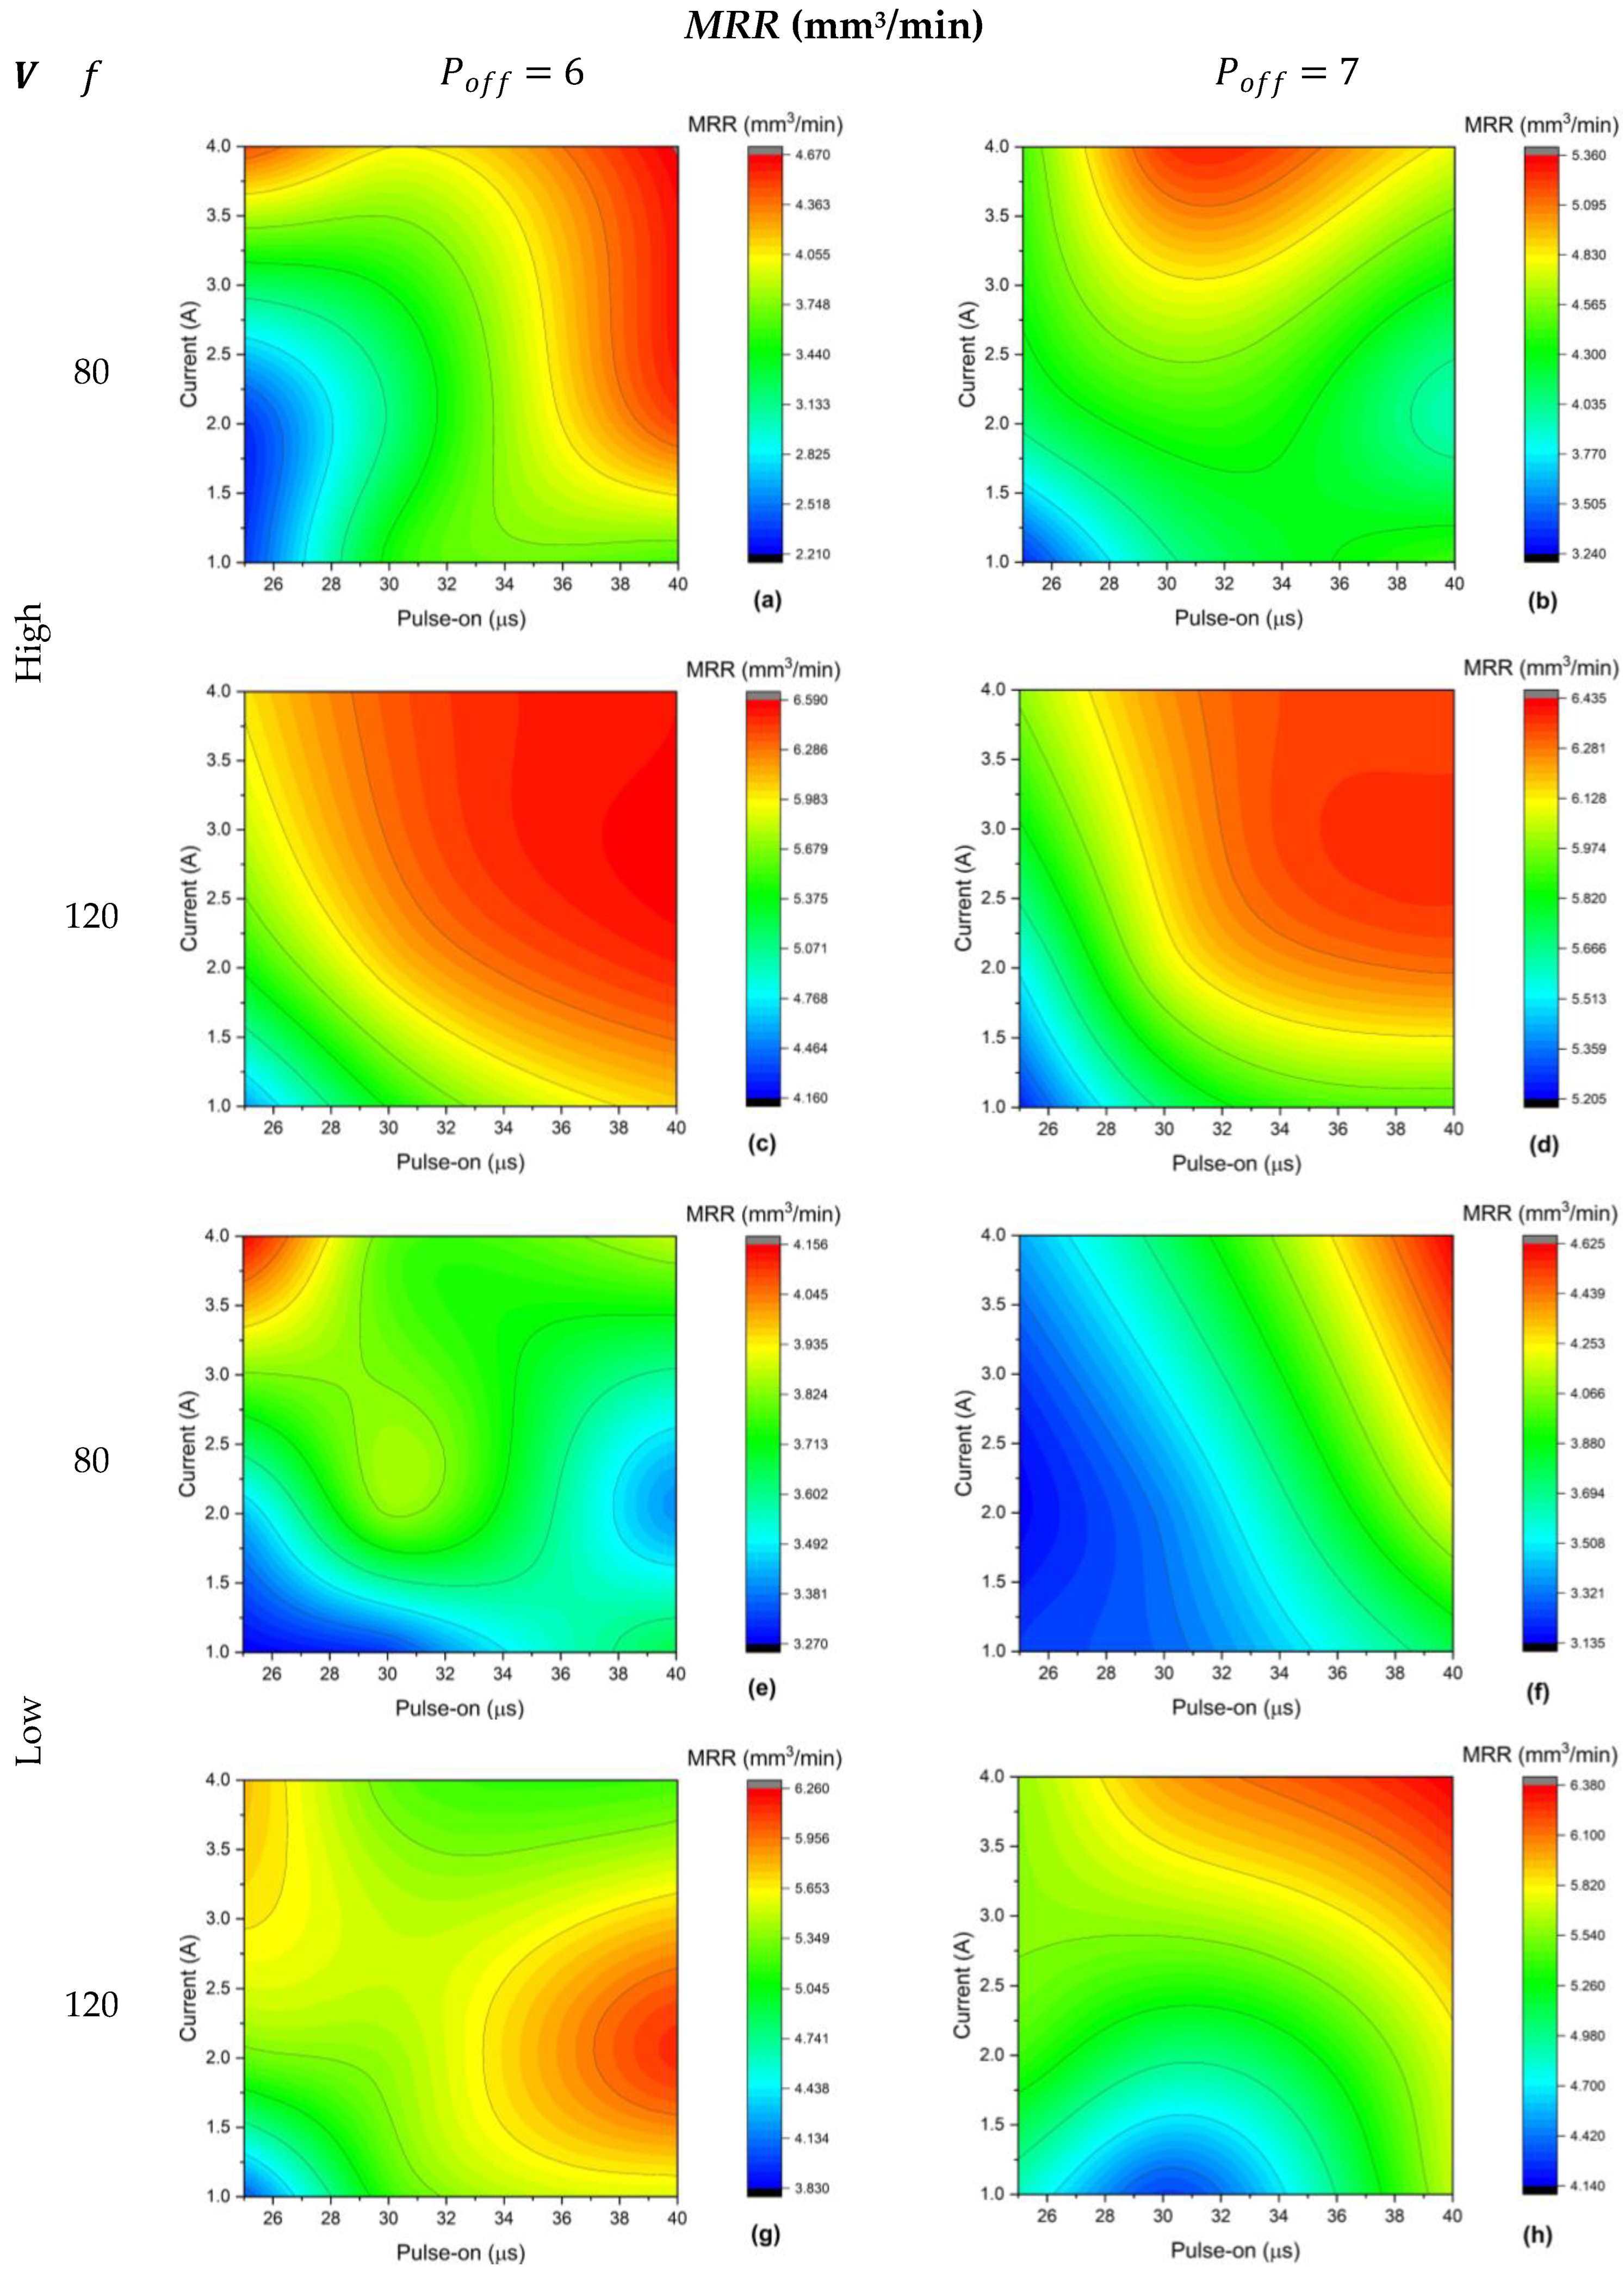
3.1. Experimental Results
3.2. Mathematical Model Regression
3.2.1. AISI 304 Model
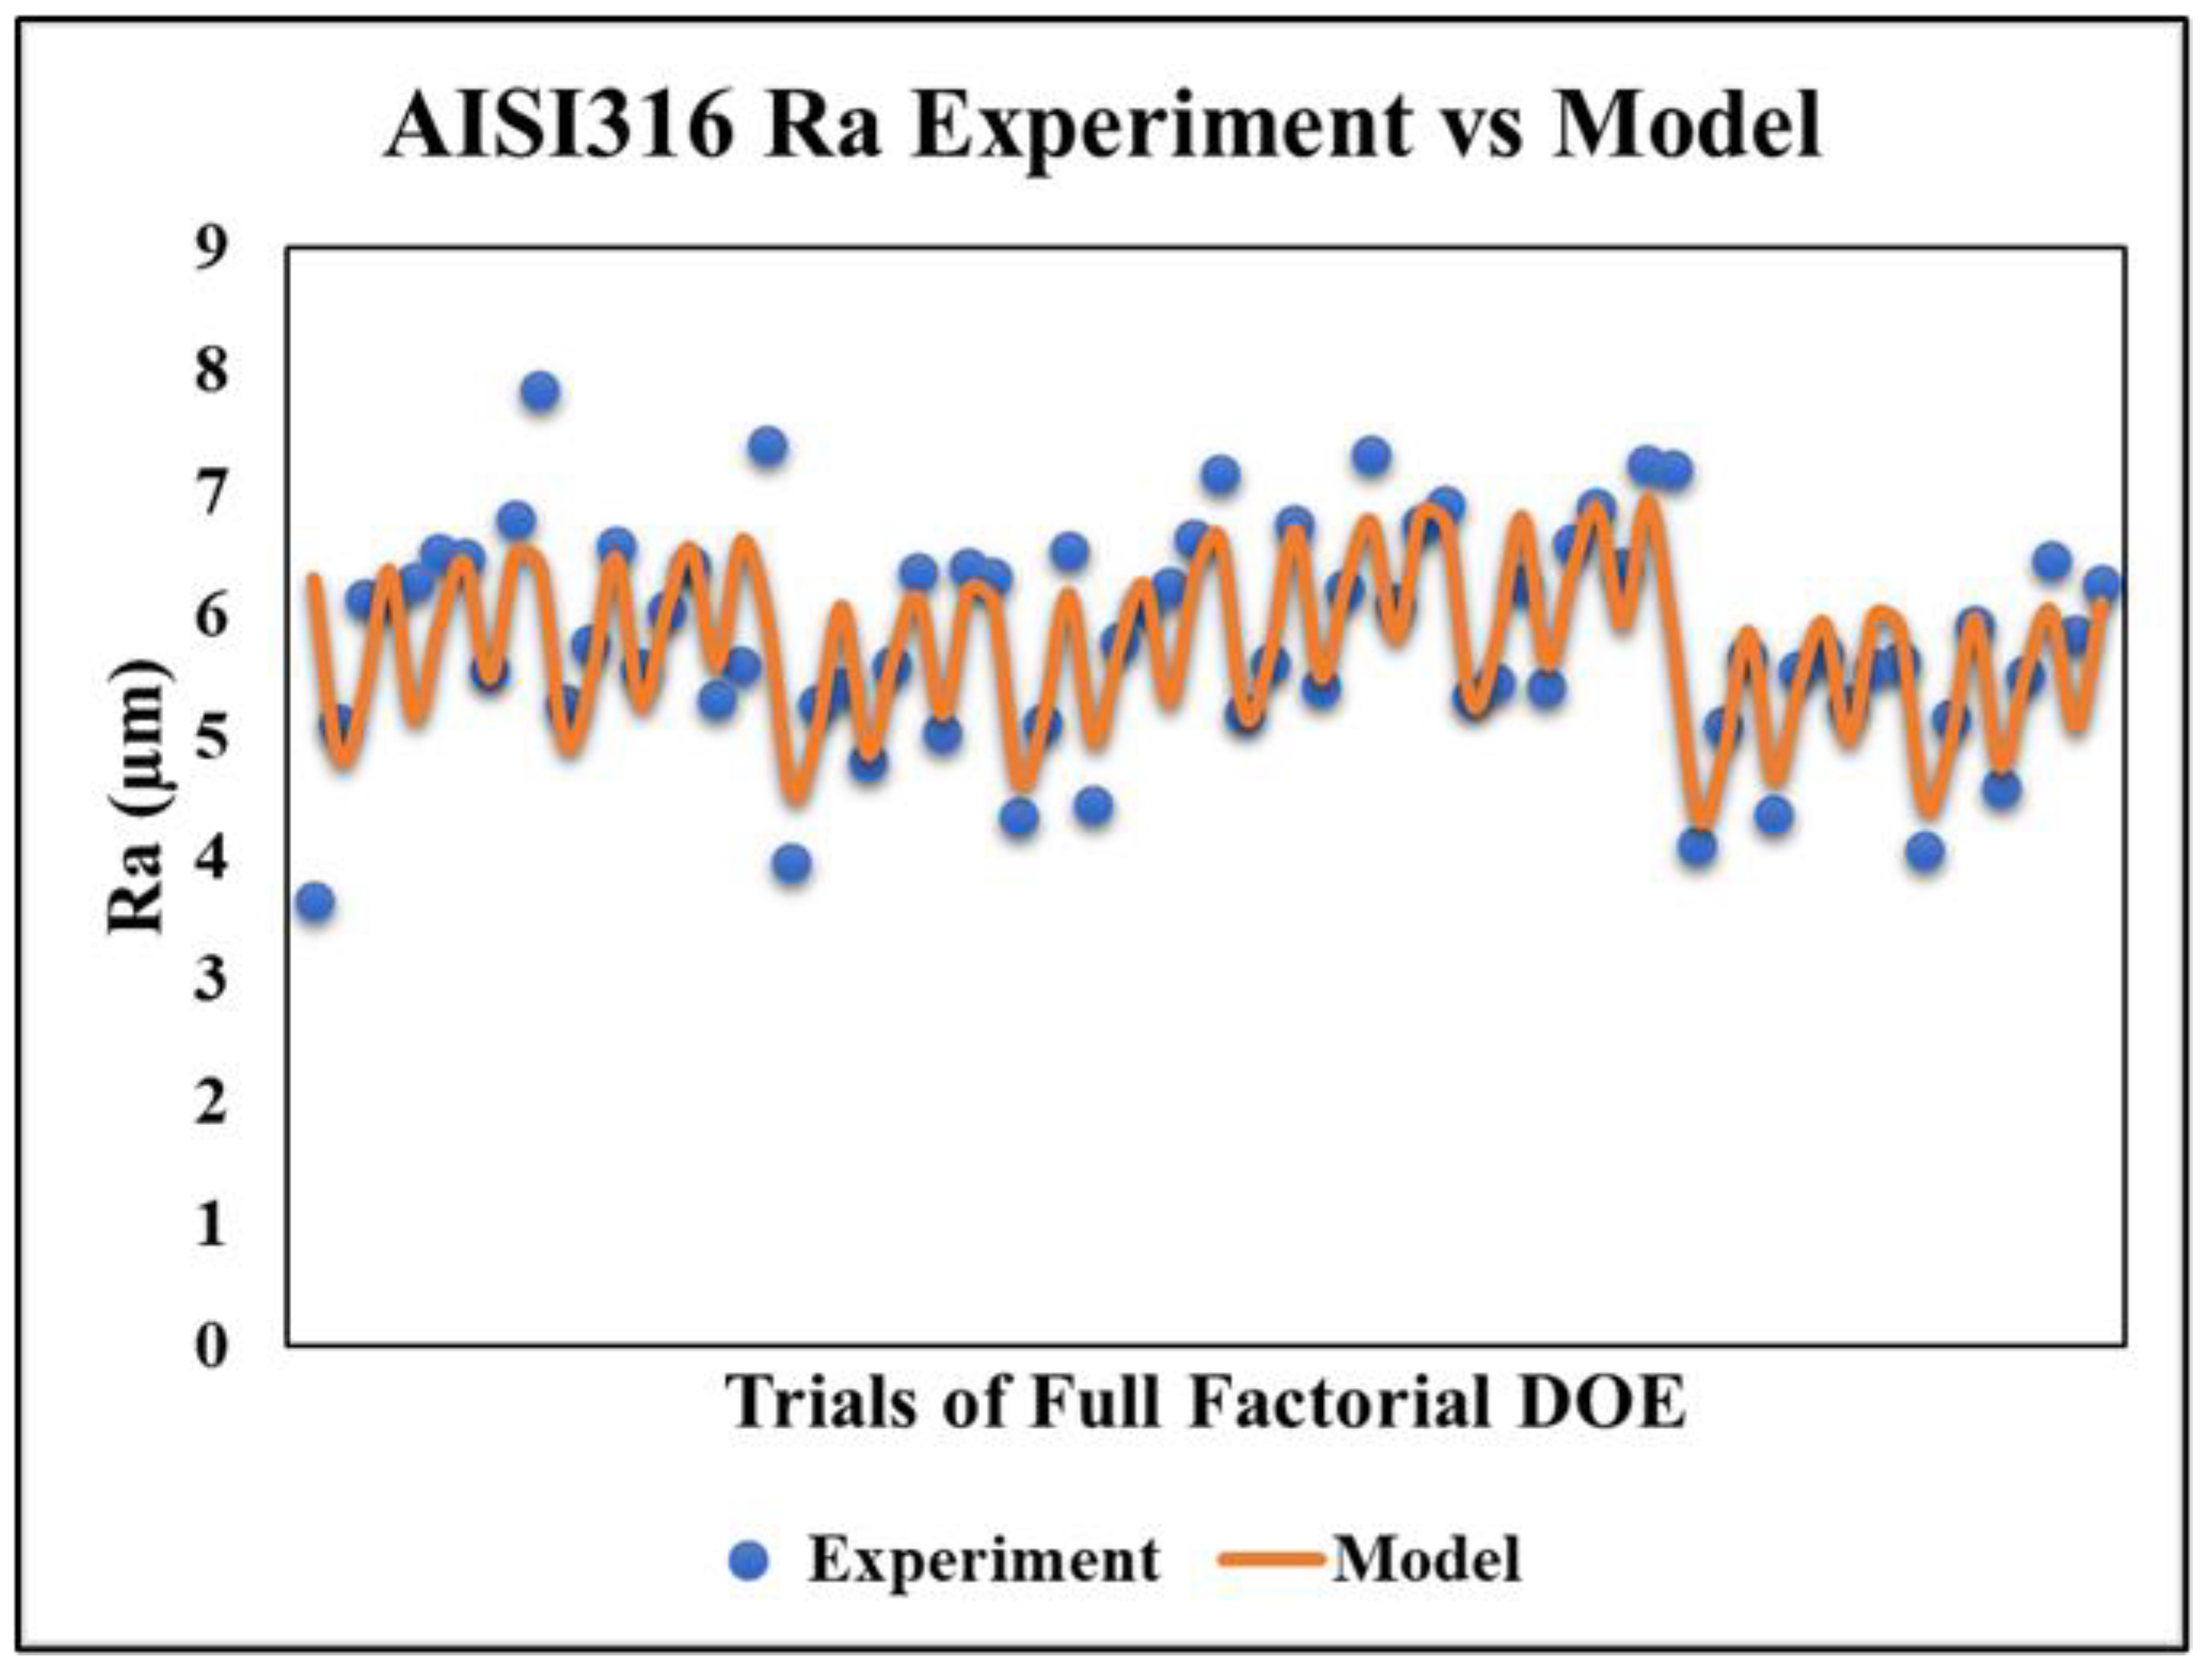
3.2.2. AISI 316 Model
3.3. Multi-Objective Optimization Results
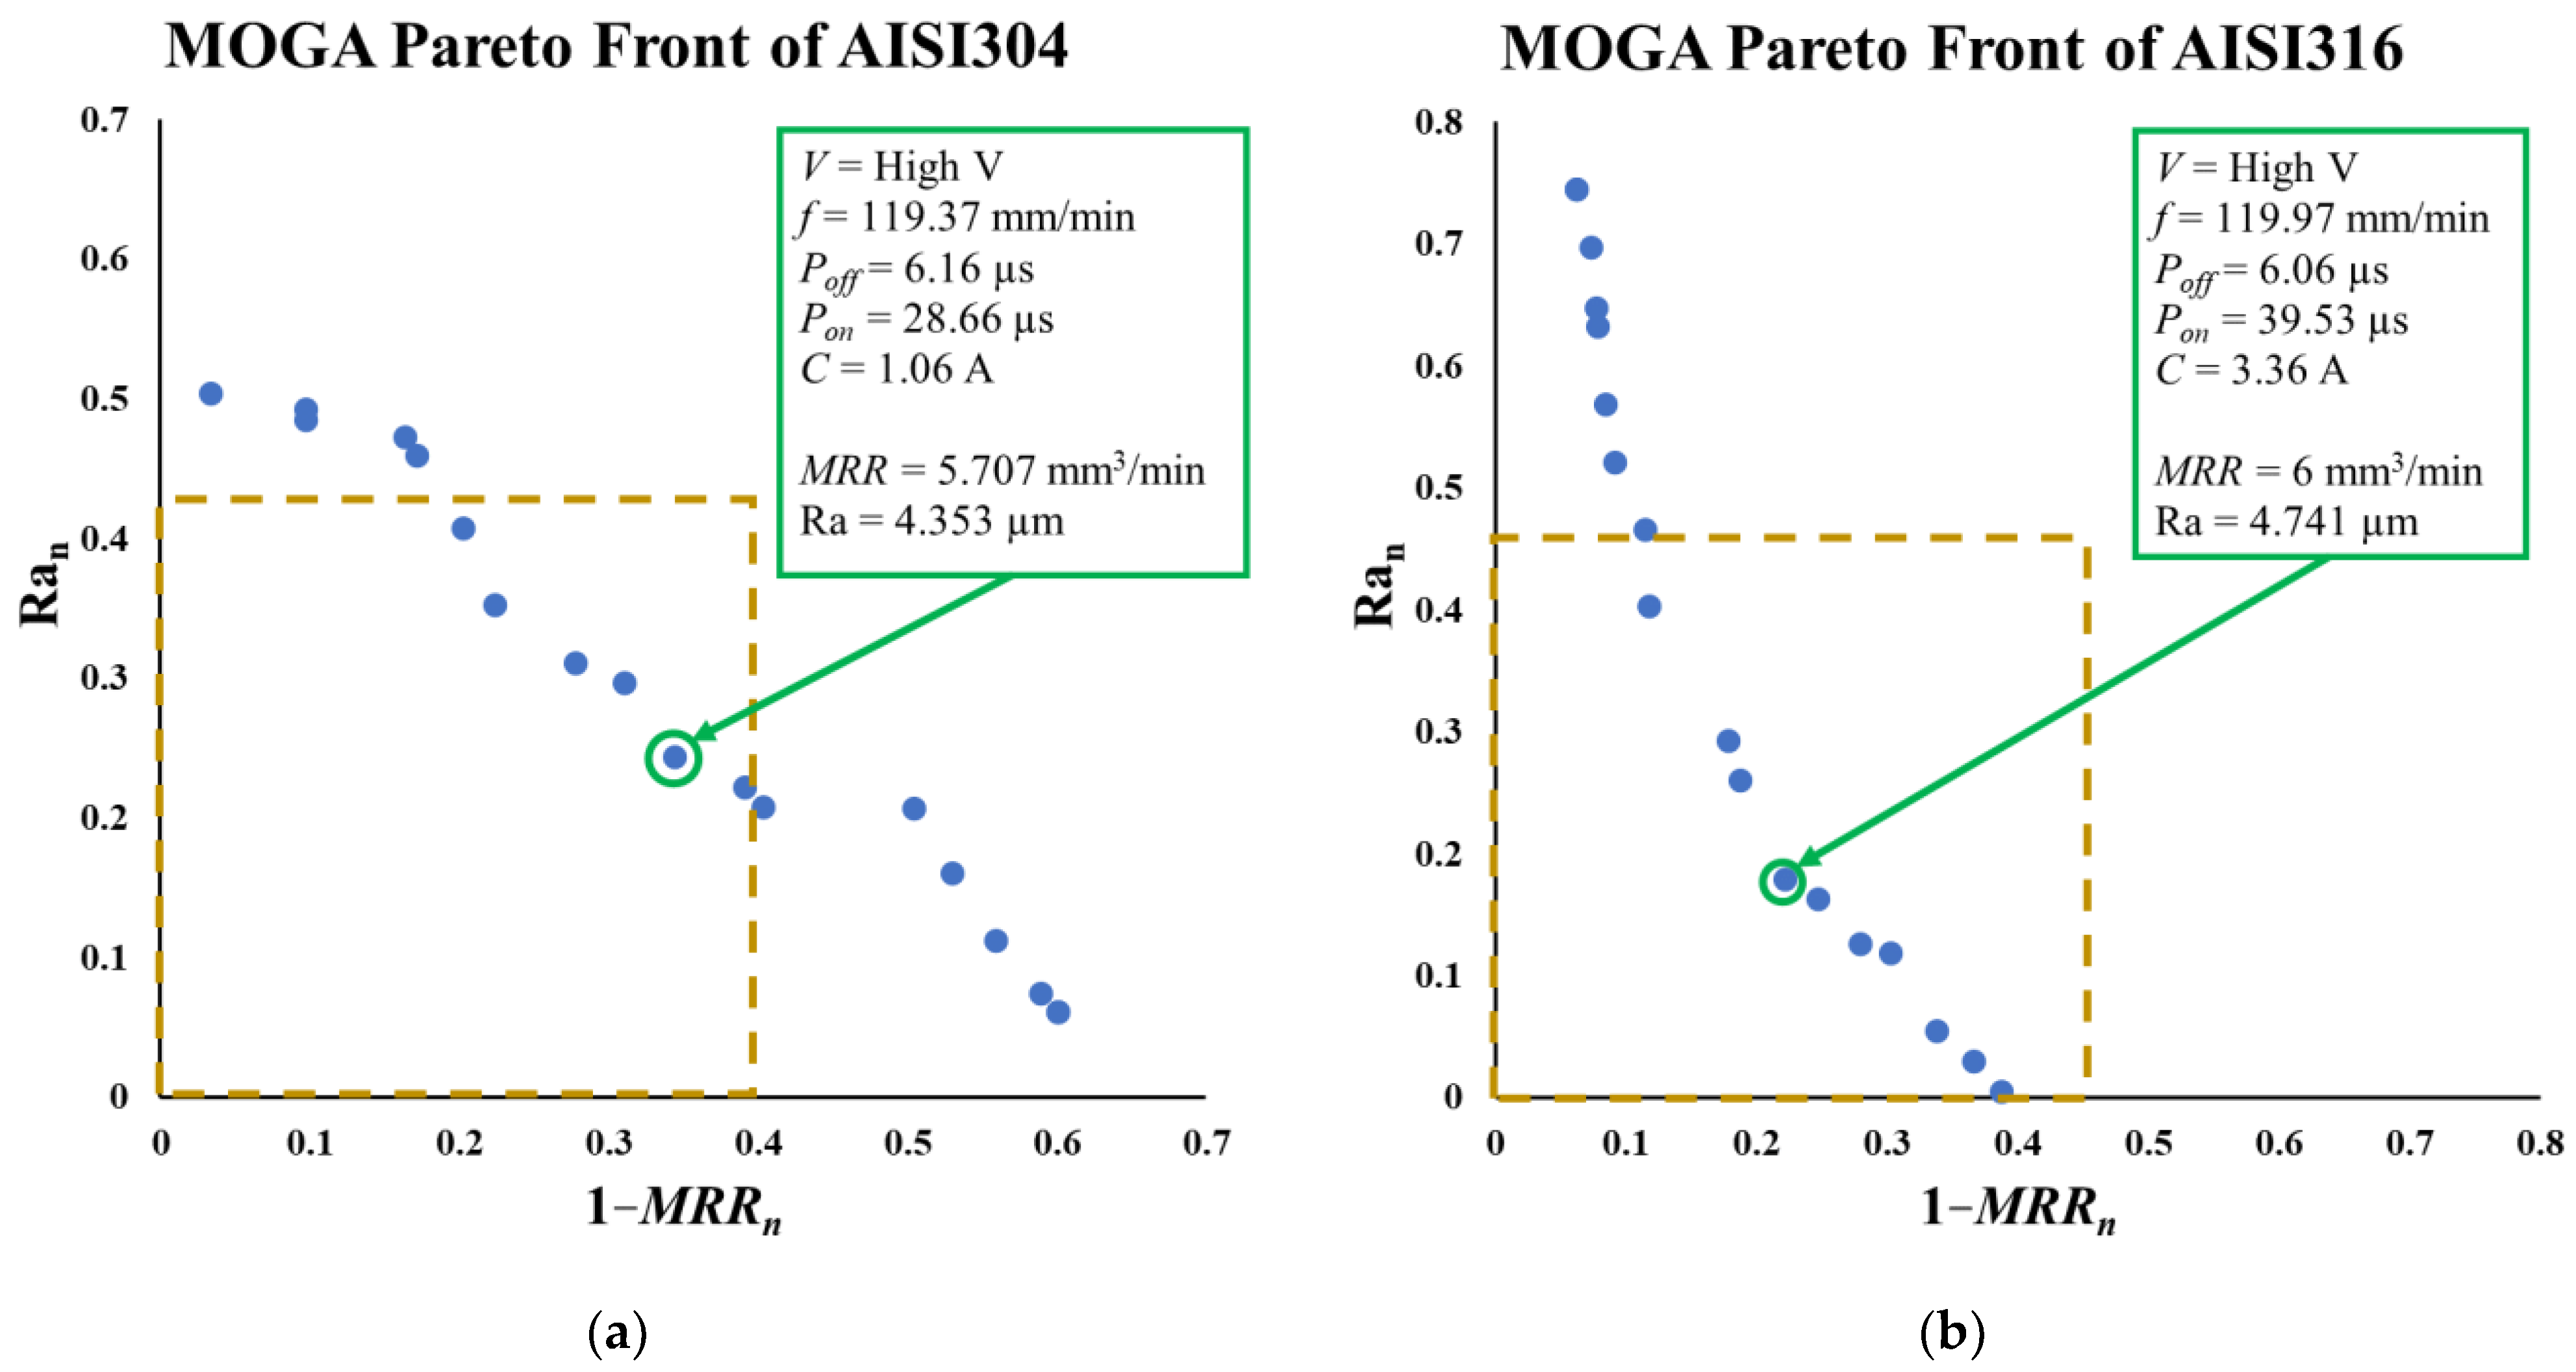
3.3.1. MOGA Model
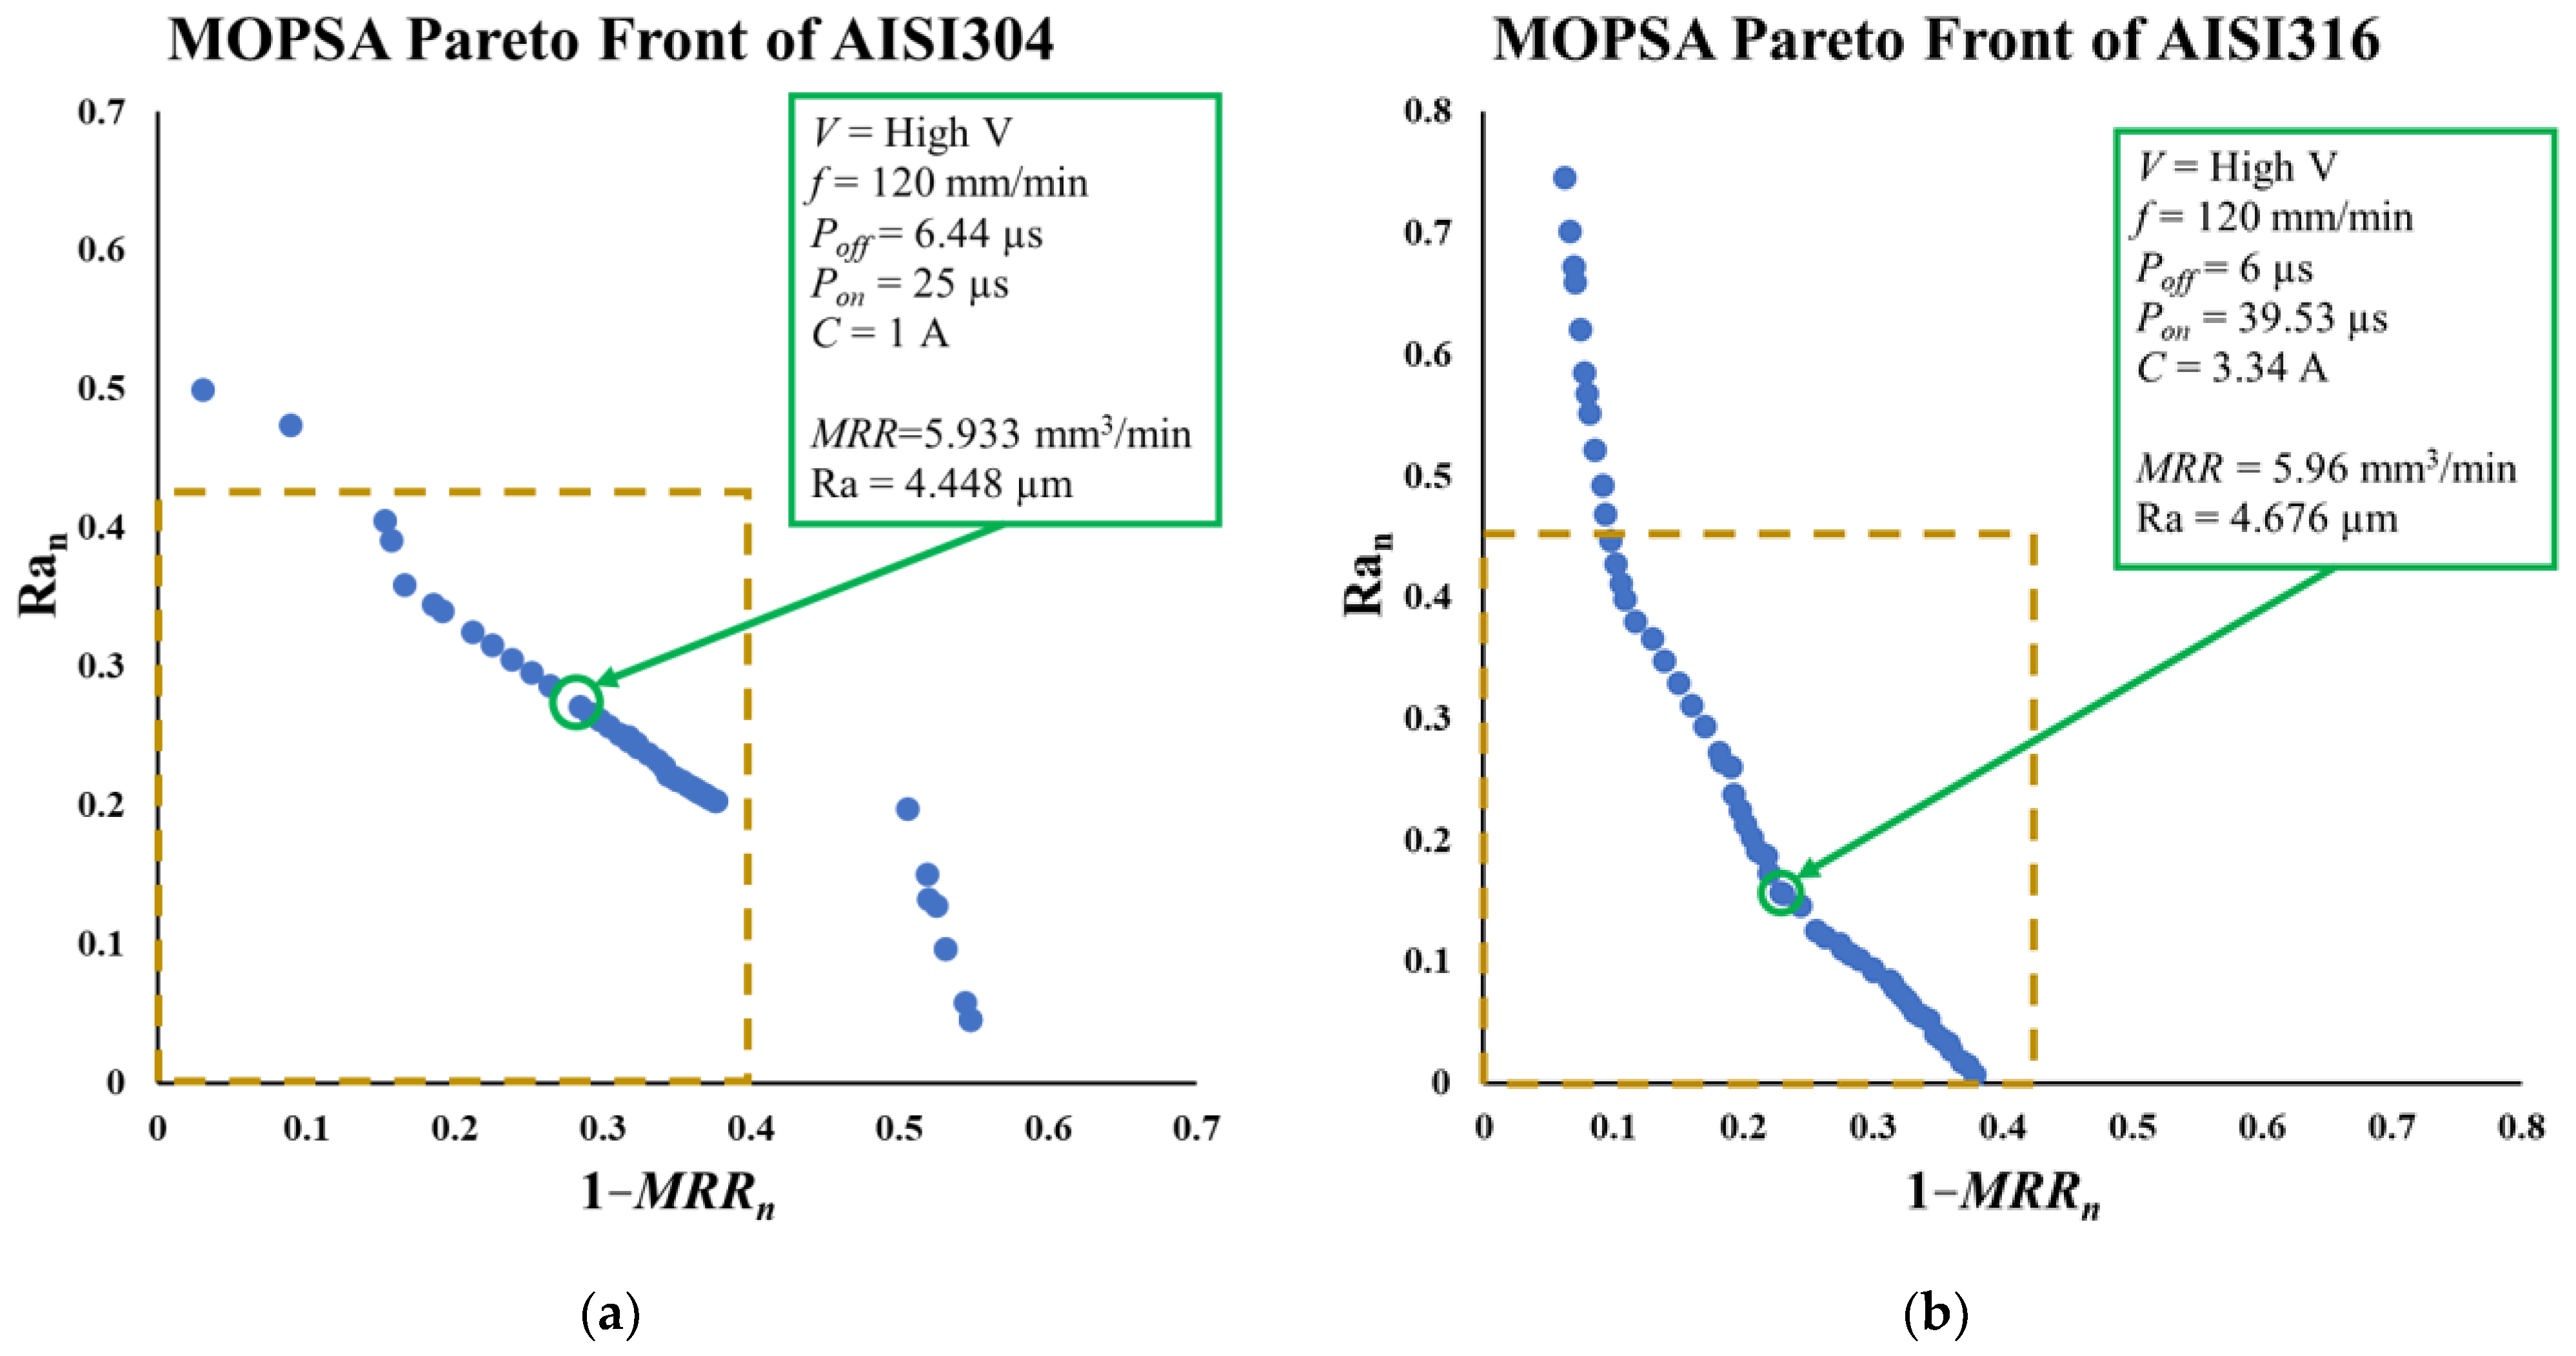
3.3.2. MOPSA Model
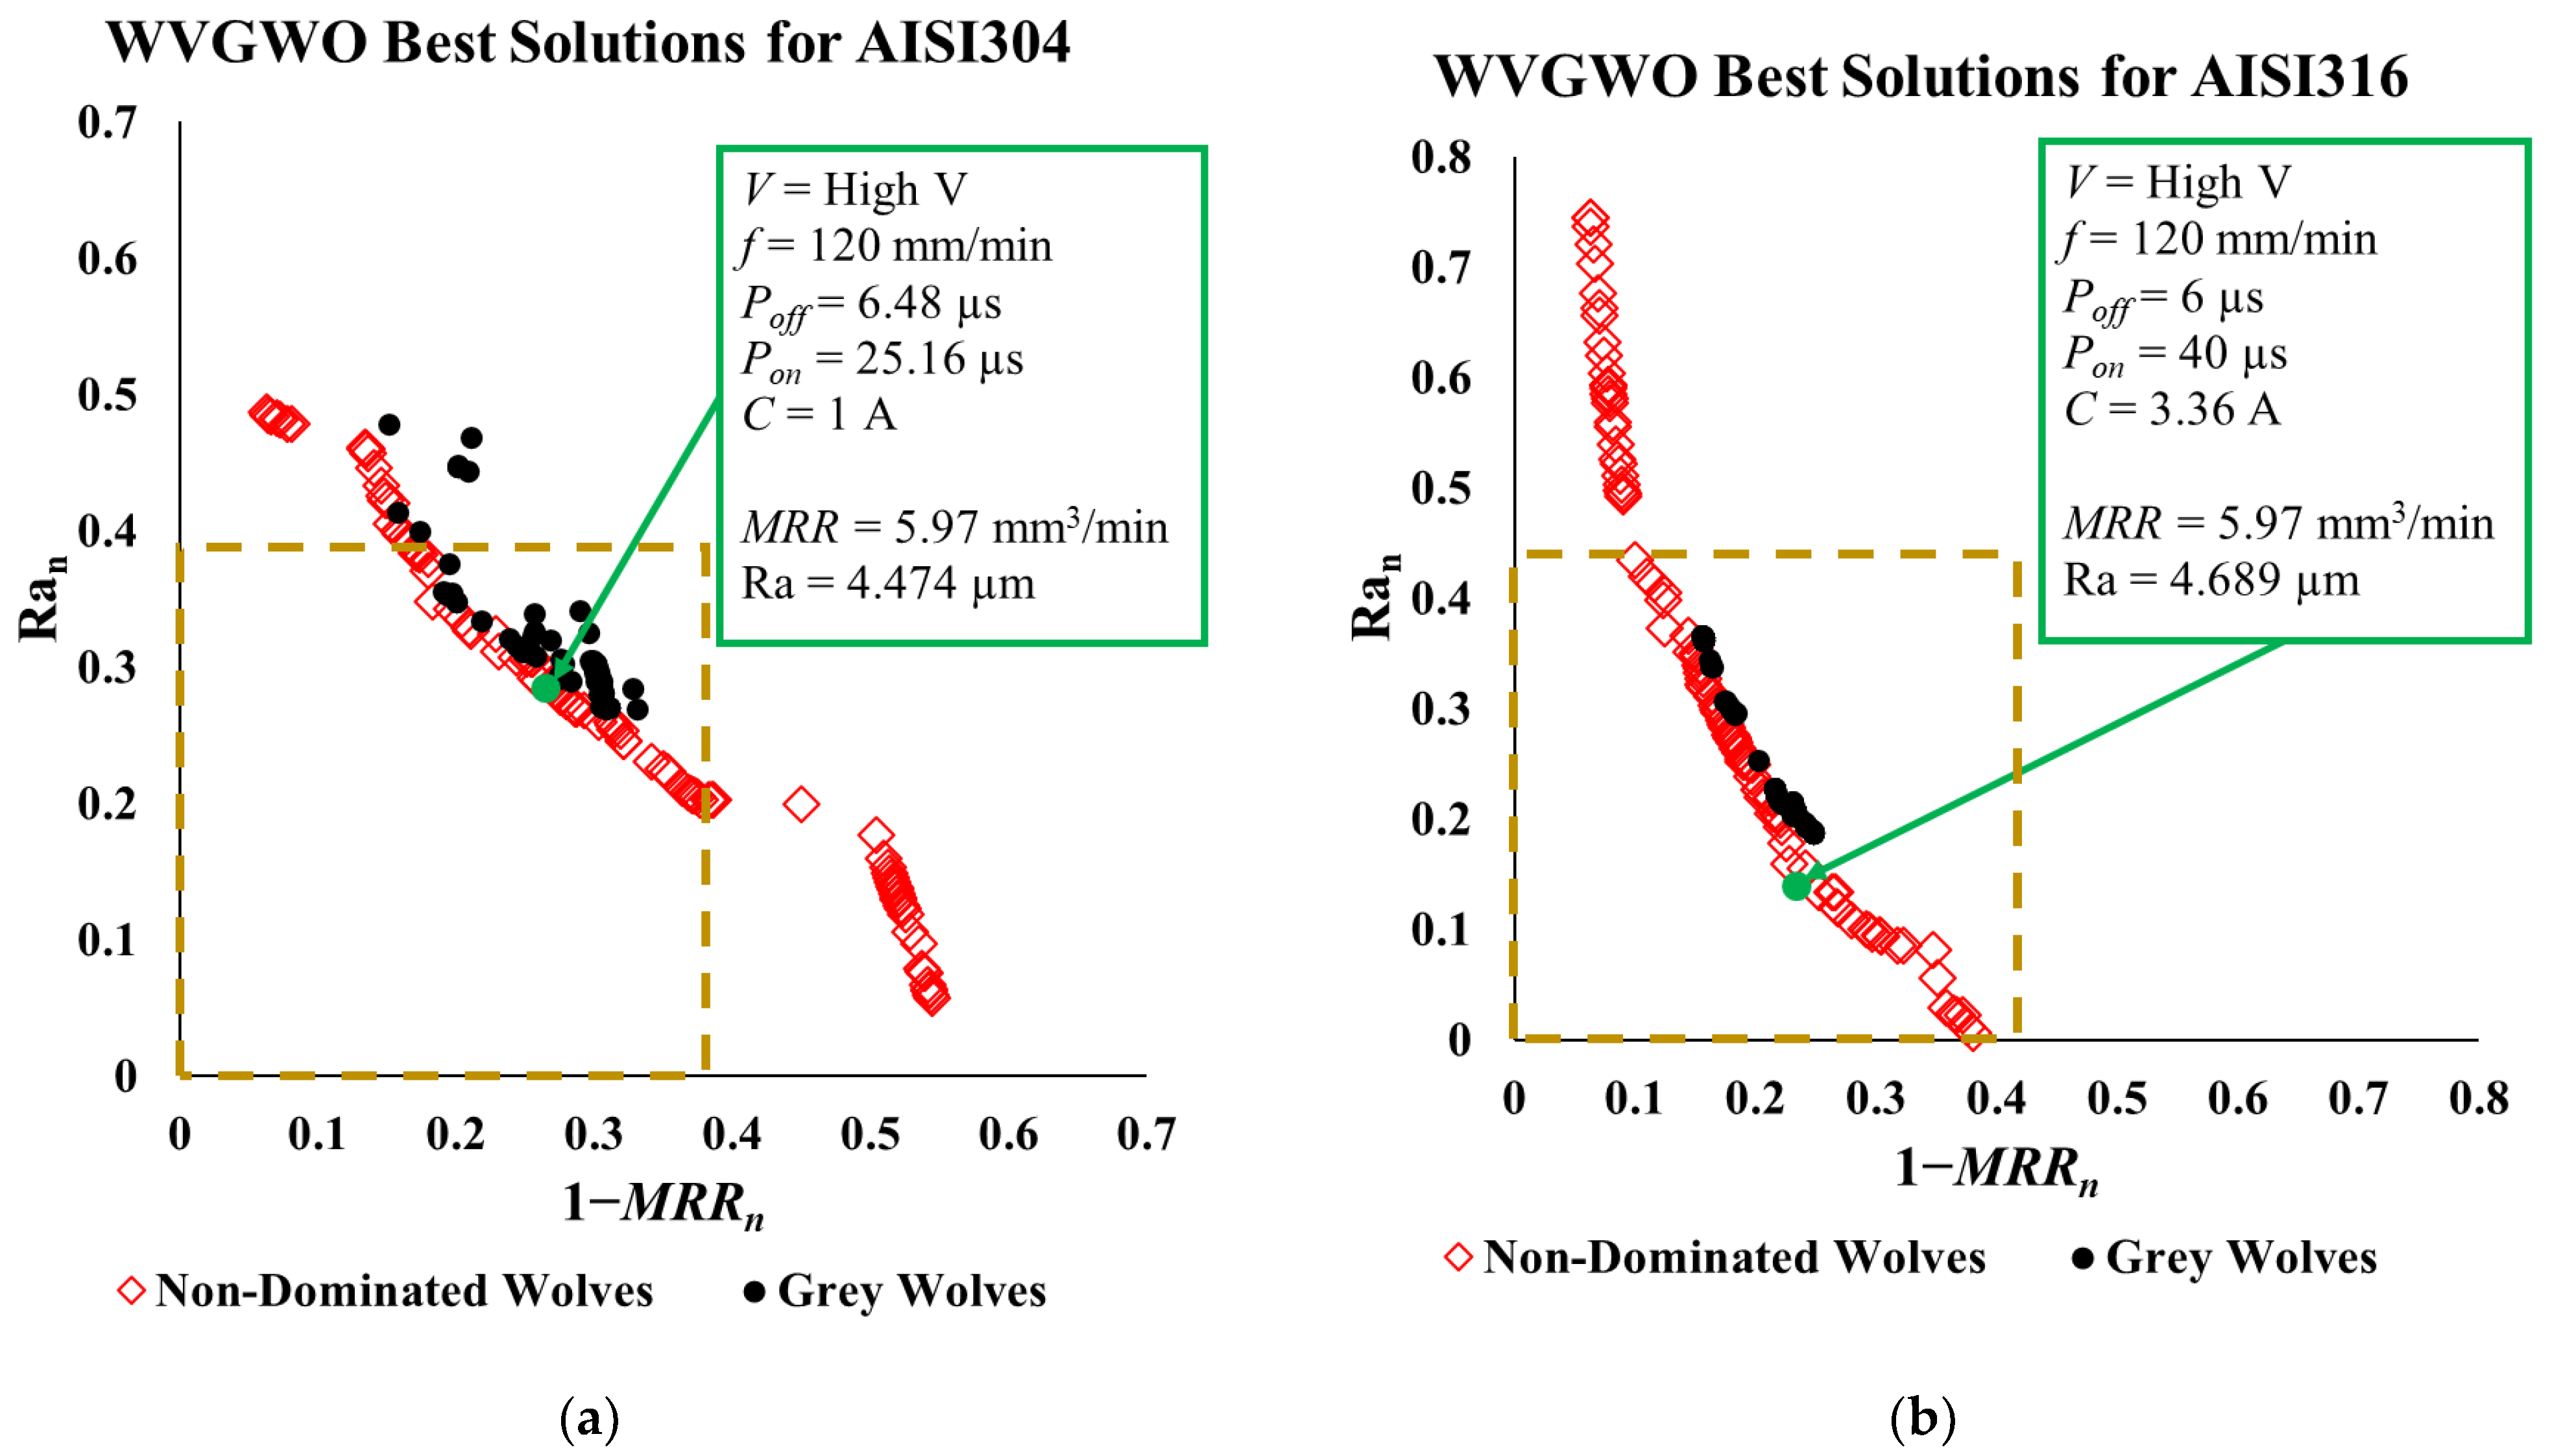
3.3.3. WVGWO Model
3.3.4. OOA Model
4. Conclusions
- Despite the fact that the WEDM process has a fuzzy proportion with the running parameters, the developed mathematical regression models represented the experimental results with small negligible errors that promote the models for optimization.
- The most influential parameters on both MRR and Ra are pulse-on time ( and current ().
- For the optimization model of AISI 304, the MOGA algorithm attained the best surface roughness at 4.353 µm, while the optimal MRR was obtained by the WVGWO at a value of 5.97 mm3/min. However, the MOPSA provided a trade-off multi-response solution as Ra = 4.448 µm (−2.18% from the optimal solution by the MOGA) and MRR = 5.933 mm3/min (−0.62% from the best solution by the WVGWO). The optimal parameters obtained by the MOPSA are high voltage, = 120 mm/min, = 6.44 µs, = 25 µs and = 1 A.
- Similarly, for the AISI 316 model, the optimal Ra of 4.61 µm is obtained by the OOA and the optimal MRR = 5.97 mm3/min by the WVGWO. Again, the MOPSA outperformed the other algorithms and resulted optimal MRR and Ra values of 5.96 mm3/min and 4.677 µm, respectively. In this case, the obtained optimal parameters by the MOPSA are high voltage, = 120 mm/min, = 6 µs, = 39.53 µs and = 3.43 A.
- The optimal solution by the WVGWO of both materials in Table 7 show that the machining of AISI 304 and AISI 316 have the same productivity of MRR = 5.97 mm3/min; however, AISI 304 has better surface roughness (Ra = 4.474 µm) than AISI 316 (Ra = 4.689 µm), making AISI 304 better by 4.58%.
- Obviously, the workpiece material’s thermo-physical properties play a great role in the influence of WEDM parameters on the responses in terms of MRR and Ra.
Author Contributions
Funding
Data Availability Statement
Conflicts of Interest
References
- Somashekhar, K.P.; Mathew, J.; Ramachandran, N. A feasibility approach by simulated annealing on optimization of micro-wire electric discharge machining parameters. Int. J. Adv. Manuf. Technol. 2012, 61, 1209–1213. [Google Scholar] [CrossRef]
- Gupta, K.; Jain, N.K. On surface integrity of miniature spur gears manufactured by wire electrical discharge machining. Int. J. Adv. Manuf. Technol. 2014, 72, 1735–1745. [Google Scholar] [CrossRef]
- Huang, J.T.; Liao, Y.S.; Hsue, W.J. Determination of finish-cutting operation number and machining-parameters setting in wire electrical discharge machining. J. Mater. Process. Technol. 1999, 87, 69–81. [Google Scholar] [CrossRef]
- Robert, F.; Prince, A.A.; Jac Fredo, A.R. Influence of wire electrical discharge machine cutting parameters on the magnetization characteristics of electrical steel laminations. Mater. Today Proc. 2022, 52, 746–750. [Google Scholar] [CrossRef]
- Sen, R.; Paul, S.; Choudhuri, B. Investigation on wire electrical discharge machining of AISI 304 stainless steel. Mater. Today Proc. 2022, 62, 1210–1214. [Google Scholar] [CrossRef]
- Chary, E.A.; Basha, S.U.A.; Dheeraj, Y.; Kumar, D.S. Taguchi optimization in machining dual-phase steel (DP980) with WEDM using brass wire. Mater. Today Proc. 2022, 62, 3416–3420. [Google Scholar] [CrossRef]
- Rao, M.; Vijayan, V.; Anil, A.; Rai, P.K.; Jain, N.R. Effect of wire electrode discharge machining process parameters on the surface roughness, hardness, and microstructure of the high carbon steels. Mater. Today Proc. 2021, 46, 2625–2629. [Google Scholar] [CrossRef]
- Pattnaik, S.; Sutar, M.K. Analysis of surface roughness of high carbon steel by WEDM. Mater. Today Proc. 2021, 44, 1765–1769. [Google Scholar] [CrossRef]
- Ishfaq, K.; Mufti, N.A.; Ahmed, N.; Mughal, M.P.; Saleem, M.Q. An investigation of surface roughness and parametric optimization during wire electric discharge machining of cladded material. Int. J. Adv. Manuf. Technol. 2018, 97, 4065–4079. [Google Scholar] [CrossRef]
- Naeim, N.; AbouEleaz, M.A.; Elkaseer, A. Experimental Investigation of Surface Roughness and Material Removal Rate in Wire EDM of Stainless Steel 304. Materials 2023, 16, 1022. [Google Scholar] [CrossRef]
- Ukey, K.; Sahu, A.R.; Gajghate, S.S.; Behera, A.K.; Limbadri, C.; Majumder, H. Wire electrical discharge machining (WEDM) review on current optimization research trends. Mater. Today Proc. 2023, in press. [Google Scholar] [CrossRef]
- Ghuge, N.; Sagare, S.; Pawar, S.; Kolambe, C.; Palande, D. Parameter optimization on WEDM machine of oil hardened nickel (Non-Shrinking) steel. Mater. Today Proc. 2022, 65, 3150–3160. [Google Scholar] [CrossRef]
- Ikram, A.; Mufti, N.A.; Saleem, M.Q.; Khan, A.R. Parametric optimization for surface roughness, kerf and MRR in wire electrical discharge machining (WEDM) using Taguchi design of experiment. J. Mech. Sci. Technol. 2013, 27, 2133–2141. [Google Scholar] [CrossRef]
- Sharma, S.; Vates, U.K.; Bansal, A. Parametric optimization in wire EDM of D2 tool steel using Taguchi method. Mater. Today Proc. 2021, 45, 757–763. [Google Scholar] [CrossRef]
- Rehman, M.; Khan, S.A.; Naveed, R. Parametric optimization in wire electric discharge machining of DC53 steel using gamma phase coated wire. J. Mech. Sci. Technol. 2020, 34, 2767–2773. [Google Scholar] [CrossRef]
- Nawaz, Y.; Maqsood, S.; Naeem, K.; Nawaz, R.; Omair, M.; Habib, T. Parametric optimization of material removal rate, surface roughness, and kerf width in high-speed wire electric discharge machining (HS-WEDM) of DC53 die steel. Int. J. Adv. Manuf. Technol. 2020, 107, 3231–3245. [Google Scholar] [CrossRef]
- Manjaiah, M.; Laubscher, R.F.; Kumar, A.; Basavarajappa, S. Parametric optimization of MRR and surface roughness in wire electro discharge machining (WEDM) of D2 steel using Taguchi-based utility approach. Int. J. Mech. Mater. Eng. 2016, 11, 7. [Google Scholar] [CrossRef]
- Guha, S.; Das, P.P.; Routara, B.C. Parametric optimization of wire electric discharge machining on AISI4140 alloy steel using regression analysis and grey-fuzzy approach. Mater. Today: Proc. 2021, 46, 4734–4740. [Google Scholar] [CrossRef]
- Asgar, M.E.; Singholi, A.K. A Review on Wire Electrical Discharge Machining of Advanced Conductive Materials. Int. Trans. J. Eng. 2021, 12A10Q, 110. [Google Scholar] [CrossRef]
- Patel, J.D.; Maniya, K.D. A Review on: Wire cut electrical discharge machining process for metal matrix composite. Procedia Manuf. 2018, 20, 253–258. [Google Scholar] [CrossRef]
- Slătineanu, L.; Dodun, O.; Coteaţă, M.; Nagîţ, G.; Băncescu, I.B.; Hriţuc, A. Wire Electrical Discharge Machining—A Review. Machines 2020, 8, 69. [Google Scholar] [CrossRef]
- Sharma, V.; Patel, D.S.; Jain, V.K.; Ramkumar, J. Wire electrochemical micromachining: An overview. Int. J. Mach. Tools Manuf. 2020, 155, 103579. [Google Scholar] [CrossRef]
- Sankar, V.A.; Suresh, P.; Sridharan, P.; Vignesh, R.; Gowtham, M. Mathematical and MATLAB based process optimization by simulated annealing algorithm for wire electrical discharge machining of EN31. Mater. Today Proc. 2021, 47, 6941–6946. [Google Scholar] [CrossRef]
- Sharma, N.; Khanna, R.; Gupta, R.D. WEDM process variables investigation for HSLA by response surface methodology and genetic algorithm. Eng. Sci. Technol. Int. J. 2015, 18, 171–177. [Google Scholar] [CrossRef]
- Zaman, U.K.U.; Khan, U.A.; Aziz, S.; Baqai, A.A.; Butt, S.U.; Hussain, D.; Siadat, A.; Jung, D.W. Optimization of Wire Electric Discharge Machining (WEDM) Process Parameters for AISI 1045 Medium Carbon Steel Using Taguchi Design of Experiments. Materials 2022, 15, 7846. [Google Scholar] [CrossRef]
- Kumar, A. Performance Analysis of Wire Electric Discharge Machining (W-EDM). Int. J. Eng. Res. 2012, 1, 4. [Google Scholar]
- Huang, J.T.; Liao, Y.S. Optimization of machining parameters of Wire-EDM based on Grey relational and statistical analyses. Int. J. Prod. Res. 2003, 41, 1707–1720. [Google Scholar] [CrossRef]
- Kumar, A.; Jagota, V.; Shawl, R.Q.; Sharma, V.; Sargam, K.; Shabaz, M.; Tanveer Khan, M.; Rabani, B.; Gandhi, S. Wire EDM process parameter optimization for D2 steel. Mater. Today Proc. 2021, 37 Pt 2, 2478–2482. [Google Scholar] [CrossRef]
- Sudharsan, S.; Arul, R.; Ajay, C.V.; Veerakumar, S. Multiple response optimization of WEDM parameters using grey relational method. Mater. Today Proc. 2022, 59, 305–308. [Google Scholar] [CrossRef]
- Chen, Z.; Zhou, H.; Yan, Z.; Han, F.; Yan, H. Machining characteristics of 65 vol.% SiCp/Al composite in micro-WEDM. Ceram. Int. 2021, 47, 13533–13543. [Google Scholar] [CrossRef]
- Kumar, N.; Kumari, S.; Abhishek, K.; Nandi, G.; Ghosh, N. Study on various parameters of WEDM using different optimization techniques: A review. Mater. Today Proc. 2022, 62, 4018–4024. [Google Scholar] [CrossRef]
- Cronin, K.; Cocker, R. Plant and Equipment|Materials and Finishes for Plant and Equipment. In Encyclopedia of Dairy Sciences; Elsevier: Amsterdam, The Netherlands, 2011; pp. 134–138. [Google Scholar] [CrossRef]
- Abbas, A.T.; Anwar, S.; Abdelnasser, E.; Luqman, M.; Qudeiri, J.E.A.; Elkaseer, A. Effect of Different Cooling Strategies on Surface Quality and Power Consumption in Finishing End Milling of Stainless Steel 316. Materials 2021, 14, 903. [Google Scholar] [CrossRef] [PubMed]
- Aalco-Ferrous and Non-Ferrous Metals Stockist, “Grade 304 Stainless Steel: Properties, Fabrication and Applications.” AZoM, Jul. 2023. Available online: https://www.azom.com/article.aspx?ArticleID=2867 (accessed on 20 July 2023).
- Conn, A.R.; Gould, N.I.M.; Toint, P. A Globally Convergent Augmented Lagrangian Algorithm for Optimization with General Constraints and Simple Bounds. SIAM J. Numer. Anal. 1991, 28, 545–572. [Google Scholar] [CrossRef]
- Goldberg, D.E.; Holland, J.H. Genetic Algorithms and Machine Learning. Mach. Learn. 1988, 3, 95–99. [Google Scholar] [CrossRef]
- Bratley, P.; Fox, B.L. Algorithm 659: Implementing Sobol’s quasirandom sequence generator. ACM Trans. Math. Softw. 1988, 14, 88–100. [Google Scholar] [CrossRef]
- Custódio, A.L.; Madeira, J.F.A.; Vaz, A.I.F.; Vicente, L.N. Direct Multisearch for Multiobjective Optimization. SIAM J. Optim. 2011, 21, 1109–1140. [Google Scholar] [CrossRef]
- Fleischer, M. The Measure of Pareto Optima Applications to Multi-objective Metaheuristics. In Evolutionary Multi-Criterion Optimization; Lecture Notes in Computer Science; Fonseca, C.M., Fleming, P.J., Zitzler, E., Thiele, L., Deb, K., Eds.; Springer: Berlin/Heidelberg, Germany, 2003; Volume 2632, pp. 519–533. [Google Scholar] [CrossRef]
- Mirjalili, S.; Mirjalili, S.M.; Lewis, A. Grey Wolf Optimizer. Adv. Eng. Softw. 2014, 69, 46–61. [Google Scholar] [CrossRef]
- Malik, M.R.S.; Mohideen, E.R.; Ali, L. Weighted distance Grey wolf optimizer for global optimization problems. In Proceedings of the 2015 IEEE International Conference on Computational Intelligence and Computing Research (ICCIC), Madurai, India, 10–12 December 2015; IEEE: Madurai, India, 2015; pp. 1–6. [Google Scholar] [CrossRef]
- Dehghani, M.; Trojovský, P. Osprey optimization algorithm: A new bio-inspired metaheuristic algorithm for solving engineering optimization problems. Front. Mech. Eng. 2023, 8, 1126450. [Google Scholar] [CrossRef]
- Abbas, A.T.; Al-Abduljabbar, A.A.; Alnaser, I.A.; Aly, M.F.; Abdelgaliel, I.H.; Elkaseer, A.A. Closer Look at Precision Hard Turning of AISI4340: Multi-Objective Optimization for Simultaneous Low Surface Roughness and High Productivity. Materials 2022, 15, 2106. [Google Scholar] [CrossRef]
- Abbas, A.T.; Al-Abduljabbar, A.A.; El Rayes, M.M.; Benyahia, F.; Abdelgaliel, I.H.; Elkaseer, A. Multi-Objective Optimization of Performance Indicators in Turning of AISI 1045 under Dry Cutting Conditions. Metals 2023, 13, 96. [Google Scholar] [CrossRef]
- Scott, D.; Boyina, S.; Rajurkar, K.P. Analysis and optimization of parameter combinations in wire electrical discharge machining. Int. J. Prod. Res. 1991, 29, 2189–2207. [Google Scholar] [CrossRef]


| Grade | Mn | C | S | P | Si | Ni | Cr | Mo | N | V | Fe |
|---|---|---|---|---|---|---|---|---|---|---|---|
| AISI 304 [10] | 2.00 | 0.08 | 0.03 | 0.045 | 0.75 | 8 | 18–20 | - | 0.10 | - | Balance |
| AISI 316 [33] | 1.97 | 0.077 | 0.005 | 0.0004 | 0.49 | 10.18 | 17.13 | 1.853 | - | 0.0615 | Balance |
| Property | AISI 304 | AISI 316 |
|---|---|---|
| Density (g/cm3) | 8.00 | 8.00 |
| Melting Point (°C) | 1450 | 1400 |
| Modulus of Elasticity (GPa) | 193 | 193 |
| Electrical Resistivity (Ω·m) | 0.72 × 10⁻⁶ | 0.74 × 10⁻⁶ |
| Thermal Conductivity (W/m·K at 100 °C) | 16.2 | 16.3 |
| Thermal Expansion (10−6/K at 100 °C) | 17.2 | 15.9 |
| Parameter | Levels | |||
|---|---|---|---|---|
| Voltage (), V | Low | High | ||
| Transverse feed (), mm/min | 80 | 120 | ||
| Pulse-off time (), µs | 6 | 7 | ||
| Pulse-on time (), µs | 25 | 30 | 40 | |
| Current intensity (), A | 1 | 2 | 4 | |
| Parameter | Levels | |||
|---|---|---|---|---|
| Voltage (), V | −1 | 1 | ||
| Transverse feed (), mm/min | −1 | 1 | ||
| Pulse-off time (), µs | −1 | 1 | ||
| Pulse-on time (), µs | −1 | −0.3333 | −1 | |
| Current intensity (), A | −1 | −0.3333 | −1 | |
| Model Item | Values |
|---|---|
| Number of Variables | 5 |
| Lower Bounds | |
| Upper Bounds | |
| Linear Inequality | |
| Linear Equality | |
| Initial Starting Point | |
| Objective Function 1 | Min (1−MRRn) |
| Objective Function 2 | Min (Ran) |
| Parameter | AISI 304 | AISI 316 |
|---|---|---|
| Voltage (), V | High | High |
| Transverse feed (), mm/min | 120 | 120 |
| Pulse-off time (), µs | 6.38 | 6 |
| Pulse-on time (), µs | 26.85 | 39.97 |
| Current intensity (), A | 1 | 3.16 |
| Material removal rate (MRR), mm3/min | 5.886 | 5.89 |
| Surface roughness (Ra), µm | 4.427 | 4.61 |
| Model | AISI 304 | AISI 316 | ||||||||||||
|---|---|---|---|---|---|---|---|---|---|---|---|---|---|---|
| MRR | Ra | MRR | Ra | |||||||||||
| MOGA | High | 119.37 | 6.16 | 28.66 | 1.06 | 5.707 | 4.353 | High | 119.97 | 6.06 | 39.53 | 3.36 | 6 | 4.741 |
| MOPSA | High | 120 | 6.44 | 25 | 1 | 5.933 | 4.448 | High | 120 | 6 | 39.53 | 3.34 | 5.96 | 4.677 |
| WVGWO | High | 120 | 6.48 | 25.16 | 1 | 5.97 | 4.474 | High | 120 | 6 | 40 | 3.36 | 5.97 | 4.689 |
| OOA | High | 120 | 6.38 | 26.85 | 1 | 5.886 | 4.427 | High | 120 | 6 | 39.97 | 3.16 | 5.89 | 4.61 |
Disclaimer/Publisher’s Note: The statements, opinions and data contained in all publications are solely those of the individual author(s) and contributor(s) and not of MDPI and/or the editor(s). MDPI and/or the editor(s) disclaim responsibility for any injury to people or property resulting from any ideas, methods, instructions or products referred to in the content. |
© 2023 by the authors. Licensee MDPI, Basel, Switzerland. This article is an open access article distributed under the terms and conditions of the Creative Commons Attribution (CC BY) license (https://creativecommons.org/licenses/by/4.0/).
Share and Cite
Aboueleaz, M.A.; Naeim, N.; Abdelgaliel, I.H.; Aly, M.F.; Elkaseer, A. Wire Electrical Discharge Machining of AISI304 and AISI316 Alloys: A Comparative Assessment of Machining Responses, Empirical Modeling and Multi-Objective Optimization. J. Manuf. Mater. Process. 2023, 7, 194. https://doi.org/10.3390/jmmp7060194
Aboueleaz MA, Naeim N, Abdelgaliel IH, Aly MF, Elkaseer A. Wire Electrical Discharge Machining of AISI304 and AISI316 Alloys: A Comparative Assessment of Machining Responses, Empirical Modeling and Multi-Objective Optimization. Journal of Manufacturing and Materials Processing. 2023; 7(6):194. https://doi.org/10.3390/jmmp7060194
Chicago/Turabian StyleAboueleaz, Mona A., Noha Naeim, Islam H. Abdelgaliel, Mohamed F. Aly, and Ahmed Elkaseer. 2023. "Wire Electrical Discharge Machining of AISI304 and AISI316 Alloys: A Comparative Assessment of Machining Responses, Empirical Modeling and Multi-Objective Optimization" Journal of Manufacturing and Materials Processing 7, no. 6: 194. https://doi.org/10.3390/jmmp7060194
APA StyleAboueleaz, M. A., Naeim, N., Abdelgaliel, I. H., Aly, M. F., & Elkaseer, A. (2023). Wire Electrical Discharge Machining of AISI304 and AISI316 Alloys: A Comparative Assessment of Machining Responses, Empirical Modeling and Multi-Objective Optimization. Journal of Manufacturing and Materials Processing, 7(6), 194. https://doi.org/10.3390/jmmp7060194