Article

A Geometry-Dependent Void Closure Model Considering Void Deformation and Orientation Changes during Hot Metal Formation

1
Department of Mechanical Engineering, Sogang University, Seoul 04107, Republic of Korea
2
Hanwha Aerospace Co., Ltd., 319 Pangyo-ro, Bundang-gu, Seongnam 13488, Republic of Korea
*
Author to whom correspondence should be addressed.
J. Manuf. Mater. Process. 2023, 7(3), 117; https://doi.org/10.3390/jmmp7030117
Submission received: 22 May 2023 / Revised: 16 June 2023 / Accepted: 19 June 2023 / Published: 20 June 2023
(This article belongs to the Special Issue Advances in Material Forming)

Abstract

:
In this paper, a void closure model applicable to the general hot forming process has been proposed. Through the representative volume element (RVE) method, the influences of void shape, orientation, and stress state on void closure tendency were analysed. The void closure model was established so that it could consider these cross effects. The model calculates the changing void radius and orientation during deformation by considering the rate of change of the parameters affecting void deformation with respect to the effective strain. The model predicted the void closure tendency well on the RVE scale and predicted the void closure adequately in a multi-stage process with random voids. The results were compared with the stress-triaxiality-based (STB) model, which showed that the void closure model proposed in this study is applicable in general situations. A cogging process was analysed, and the degree of void closure at the end of each pass was compared with the calculated results of the void closure model. For the experimental verification of the proposed model, spherical and ellipsoid voids were placed in a rectangular specimen, and the radii of the voids after compression were measured. The measurement results were compared with the calculation results of the proposed model.

1. Introduction

A large ingot produced from the casting process has voids caused by gas and shrinkage porosities. These voids weaken and degrade the material and can lead to catastrophic failure of the component during its service [1]. A hot forging process is a frequently used procedure to close the voids of the as-cast material to improve the mechanical properties of components. In addition, since the metal components need a high qualification to be used in aerospace, transportation, and energy applications, it is important to ensure that the voids are closed from the hot forging process. Therefore, understanding how voids deform during hot forging is vital to ensure the final product’s quality.
A representative volume element (RVE) approach by means of finite element analysis (FEA) is one of the major approaches to analysing the deformation behaviour of voids during the hot forging process. Since the actual voids are small and randomly distributed throughout the ingot, it is impossible to establish a model that contains real voids for the FEA [2], which is why the RVE approach is widely used. The RVE approach is used to find the correlation between macroscopic stresses and strains and the deformation of the voids. Based on this RVE approach, numerous studies have been conducted on void closure behaviour. Zhang et al. [3] predicted the volume of the void with the function of the stress triaxiality and effective strain. Since the Norton power law, in which the stress is expressed by the strain rate only, was adopted as the flow stress model in their study, the model cannot be used for materials that show strain hardening or softening behaviour. Chen et al. [4] proposed a neural network model to predict void closure in the cold rolling process. The neural network model was trained to predict the reduction of the void diameter with 64 sets of FE analyses, and it showed a good correlation with the simulation results. However, the model has a limitation in that it can only be utilised in the cold rolling process.
Saby et al. [5] constructed an RVE model with real void shapes from 3D images taken using computed microtomography. They proposed a simple model that predicts the void volume change with stress triaxiality and the equivalent strain rate. They compared the void closure behaviour between RVE models with real void shapes and RVE models with equivalent ellipsoid voids that ideally mimicked real voids. Xie et al. [6,7] characterized the shape of voids captured using high-resolution micro-X-ray-computed tomography ( μ XCT) by categorizing them as spheres, ellipsoids, or polyhedra. Through this characterization, they demonstrated that most micro-porosities in structural steels can be characterized as polyhedra. Gravier et al. [8,9] classified the shapes of voids within aluminium materials captured through microtomography and proposed a model to predict void closure behaviour during hot rolling processes.
Feng and Cui [10] analysed the void closure of viscous materials under large compressive deformation. They obtained a semi-analytical function for the void evolution of the linear viscous materials. A semi-analytical function was developed for the nonlinear viscous materials and was fitted for different initial void shapes and loading conditions. They applied the model to a multi-stage forging process and showed that it could be used when the load direction changed. The models listed above consider the initial shape and orientation of the voids before deformation begins. However, the voids continue to change shape and orientation during deformation, and the deformation history of the voids affects how they deform.
Understanding the influence of the stress state during deformation is important, since a void deforms differently when the stress history differs Chen et al. [11,12]. From most studies on void closure behaviour, stress triaxiality was considered the major factor affecting void closure. The hydrostatic integral parameter Q is a famous parameter used to predict void closure empirically [13]. The parameter Q is defined as the integral of the stress triaxiality η with the equivalent strain ε ¯ as follows:
Q = 0 ε ¯ η d ε ¯ .
Based on the parameter Q concept, a stress-triaxiality-based (STB) model Q was proposed by Saby [14]. The STB model describes the void volume increment Δ V as a function of the triaxiality and the equivalent strain increment Δ ε ¯ as follows:
Δ V V 0 = K c η Δ ε ¯ ,
where K c is a model parameter, and V 0 is the initial void volume. However, the model does not consider the geometry characteristic of the void, which makes it hard to be employed for multi-step forging processes. To overcome this con of the model, Saby et al. [15] proposed a model that considers the geometry and orientation parameters. The geometry and orientation parameters could be calibrated from RVE simulations with different initial void shapes and orientations. Based on the STB model, numerous forms of void volume evolution functions were proposed [16,17,18,19].
Besides empirical models, an analytical approach is frequently adopted to predict void closure behaviour. One of the famous analytical models is the void growth model proposed by Gurson [20]. Based on the Gurson model that was modified by Tvergaard [21], Ragab [22] derived a function to evaluate the volumetric strain rate of a spherical void as follows:
1 E ˙ V ˙ V = 3 2 q 1 q 2 sinh 3 2 q 2 η ,
where V ˙ is the volumetric strain rate of the void, V is the void volume, E ˙ is the macroscopic equivalent strain rate, and q 1 and q 2 are the model constants. Similarly to the empirical model, numerous models were developed based on the Gurson–Tvergaard model [2,23].
Void closure models that consider the geometrical features of the pores have been previously studied. Saby et al. [24] proposed a model based on the geometrical properties in the hot forming process. They proposed a void closure model that considers the initial void geometry by defining a directional cosine to the main compression direction and orientation of the void and a dimensionless void radius. The model considers the closure tendency that depends on the initial geometry of the voids, but, since it only considers the initial void geometry, the void geometry during deformation is not considered.
This study proposes a void closure model that is applicable to the whole forging process based on stress triaxiality, as well as the void geometry parameters, radius, and orientation. The RVE was used to determine the effect of the stress state on the void closure behaviour, and the model coefficients were fitted from the analysis results. The model was applied to the upsetting and multi-stage compression processes for cylinder and rectangular bar specimens, respectively, and the void volume ratios calculated from the FEA and the void closure model were compared to verify the applicability of the proposed model to the overall forging process. In addition, random void geometries were modelled for the multi-stage compression process to verify whether the model could accordingly predict the closure tendency of ellipsoid void geometries and random void geometries, which were compared with the STB model. A cogging process was performed, and the degree of void closure at the end of each pass was compared with the calculated results of the model to verify that the proposed model adequately predicted the degree of void closure when applied to the actual process.

2. Description of the Meso-Scale Approach

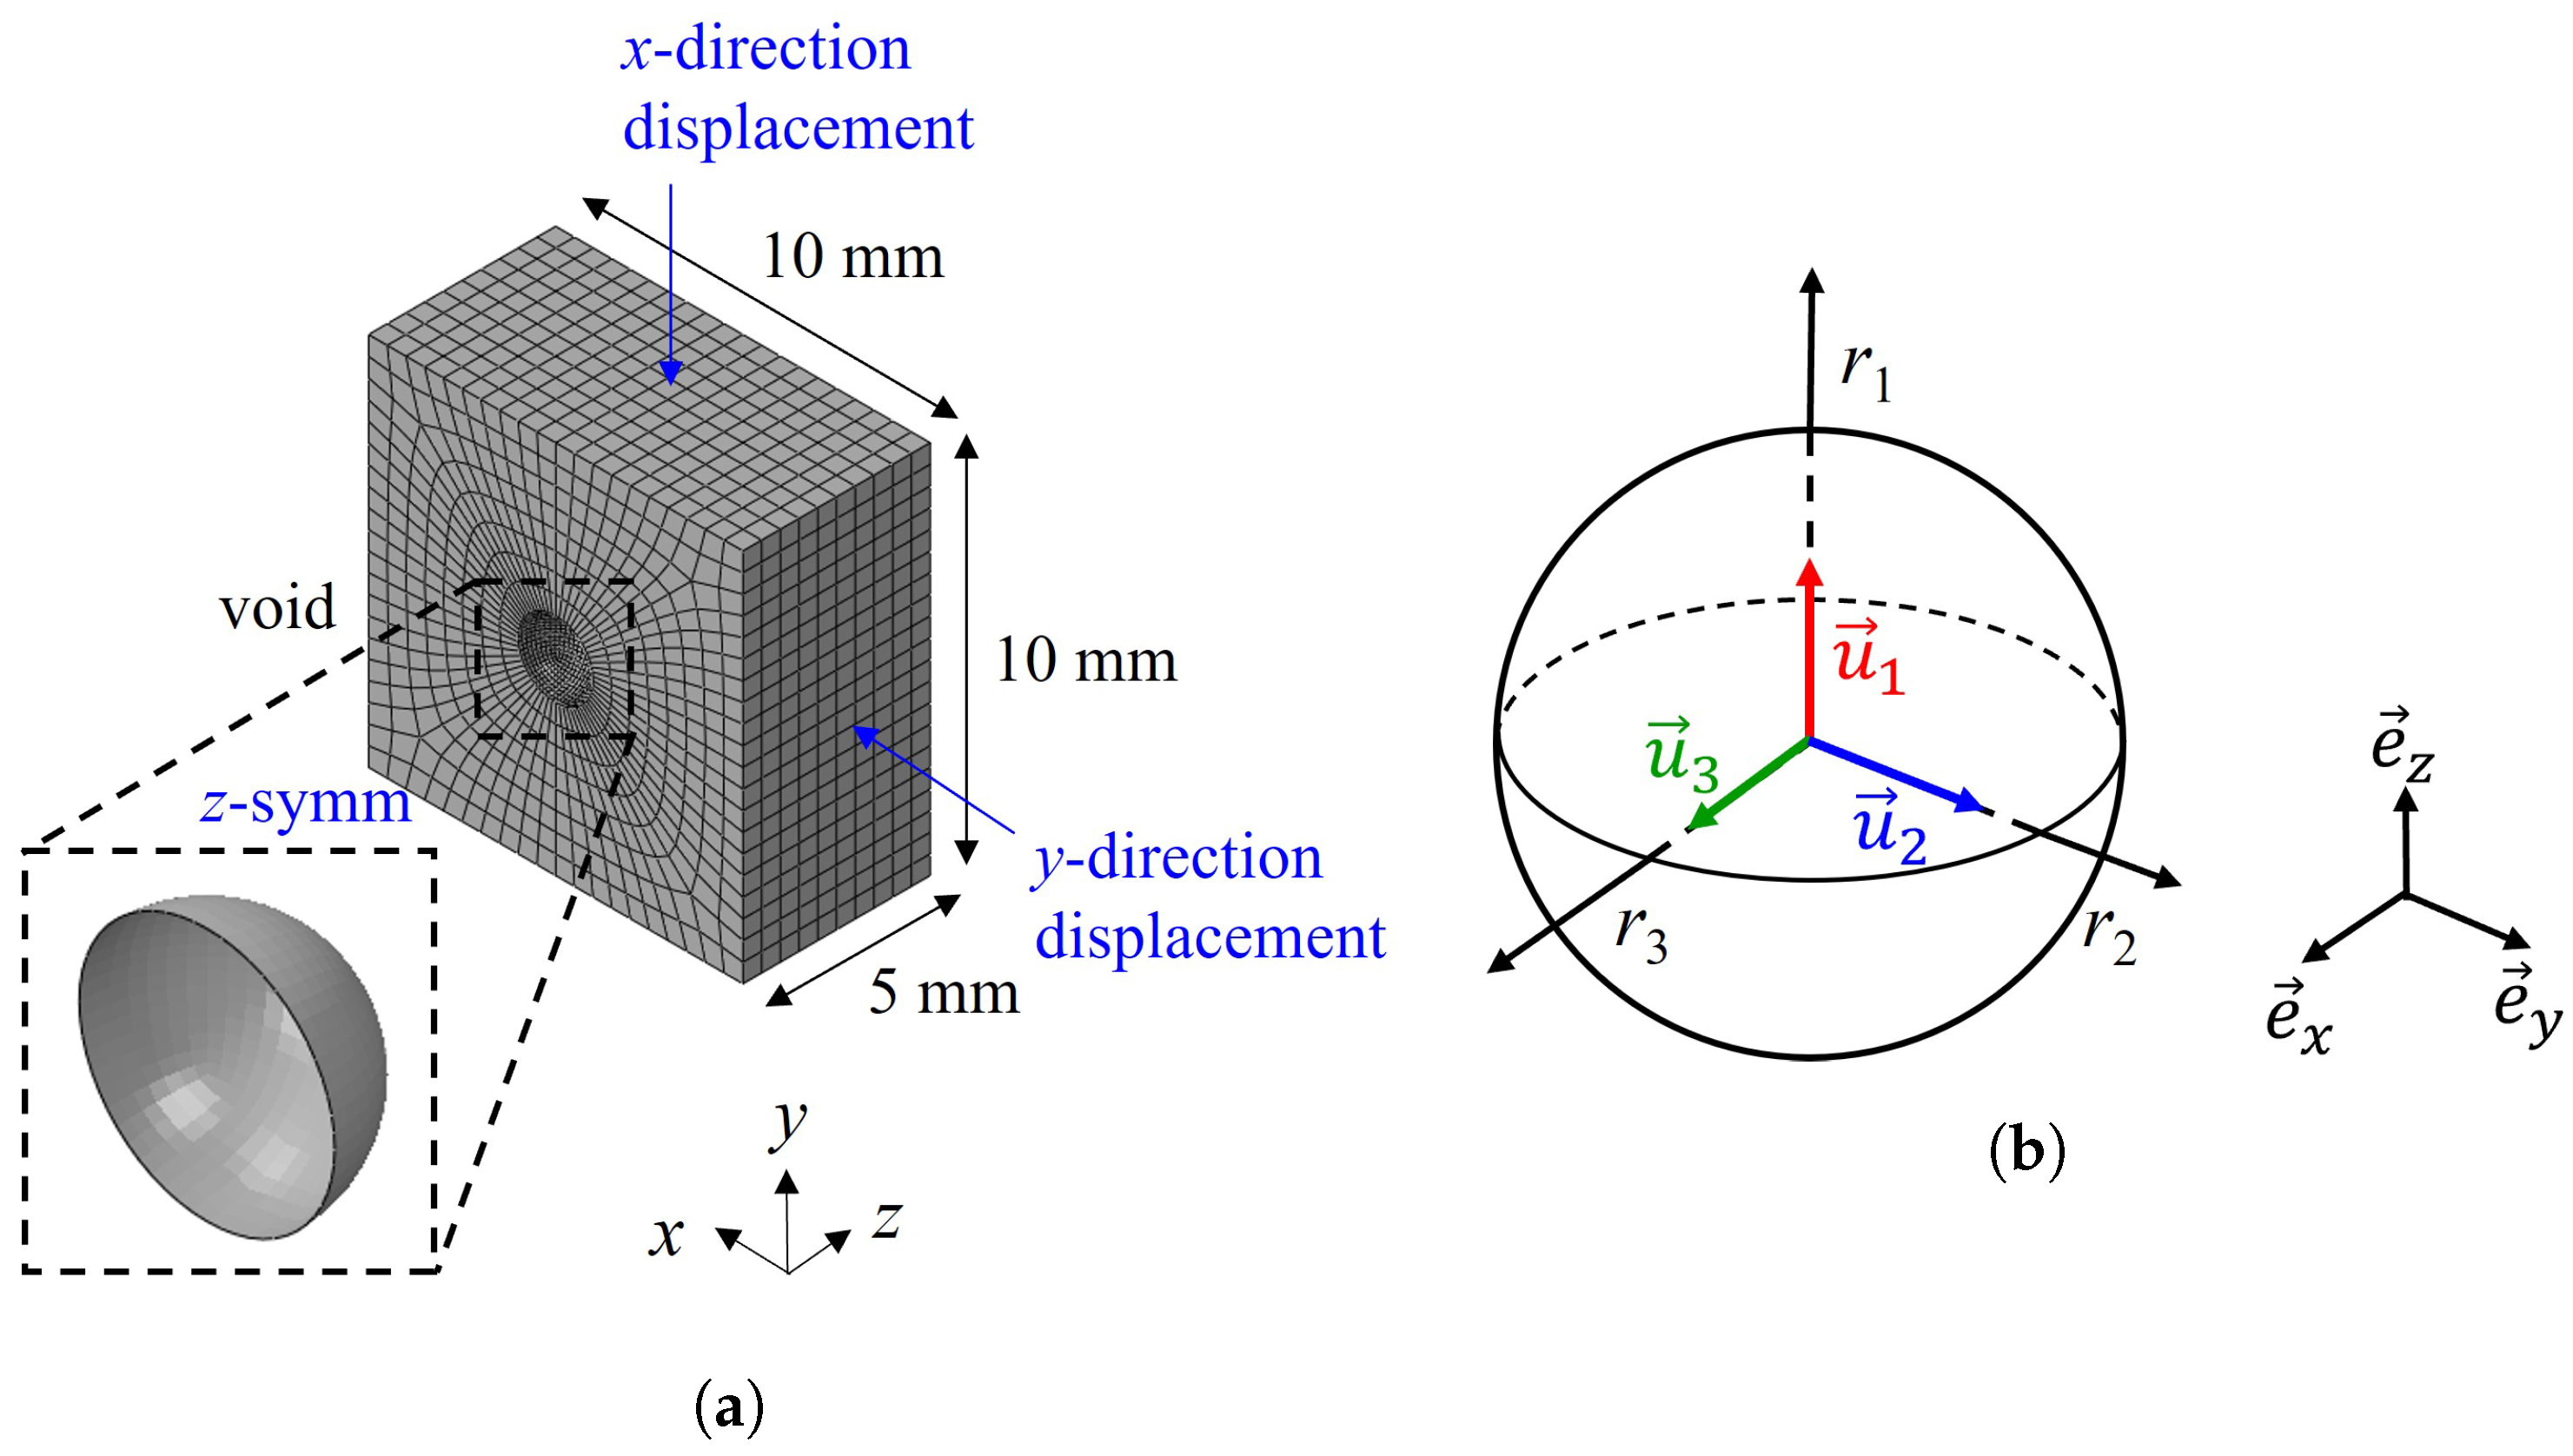
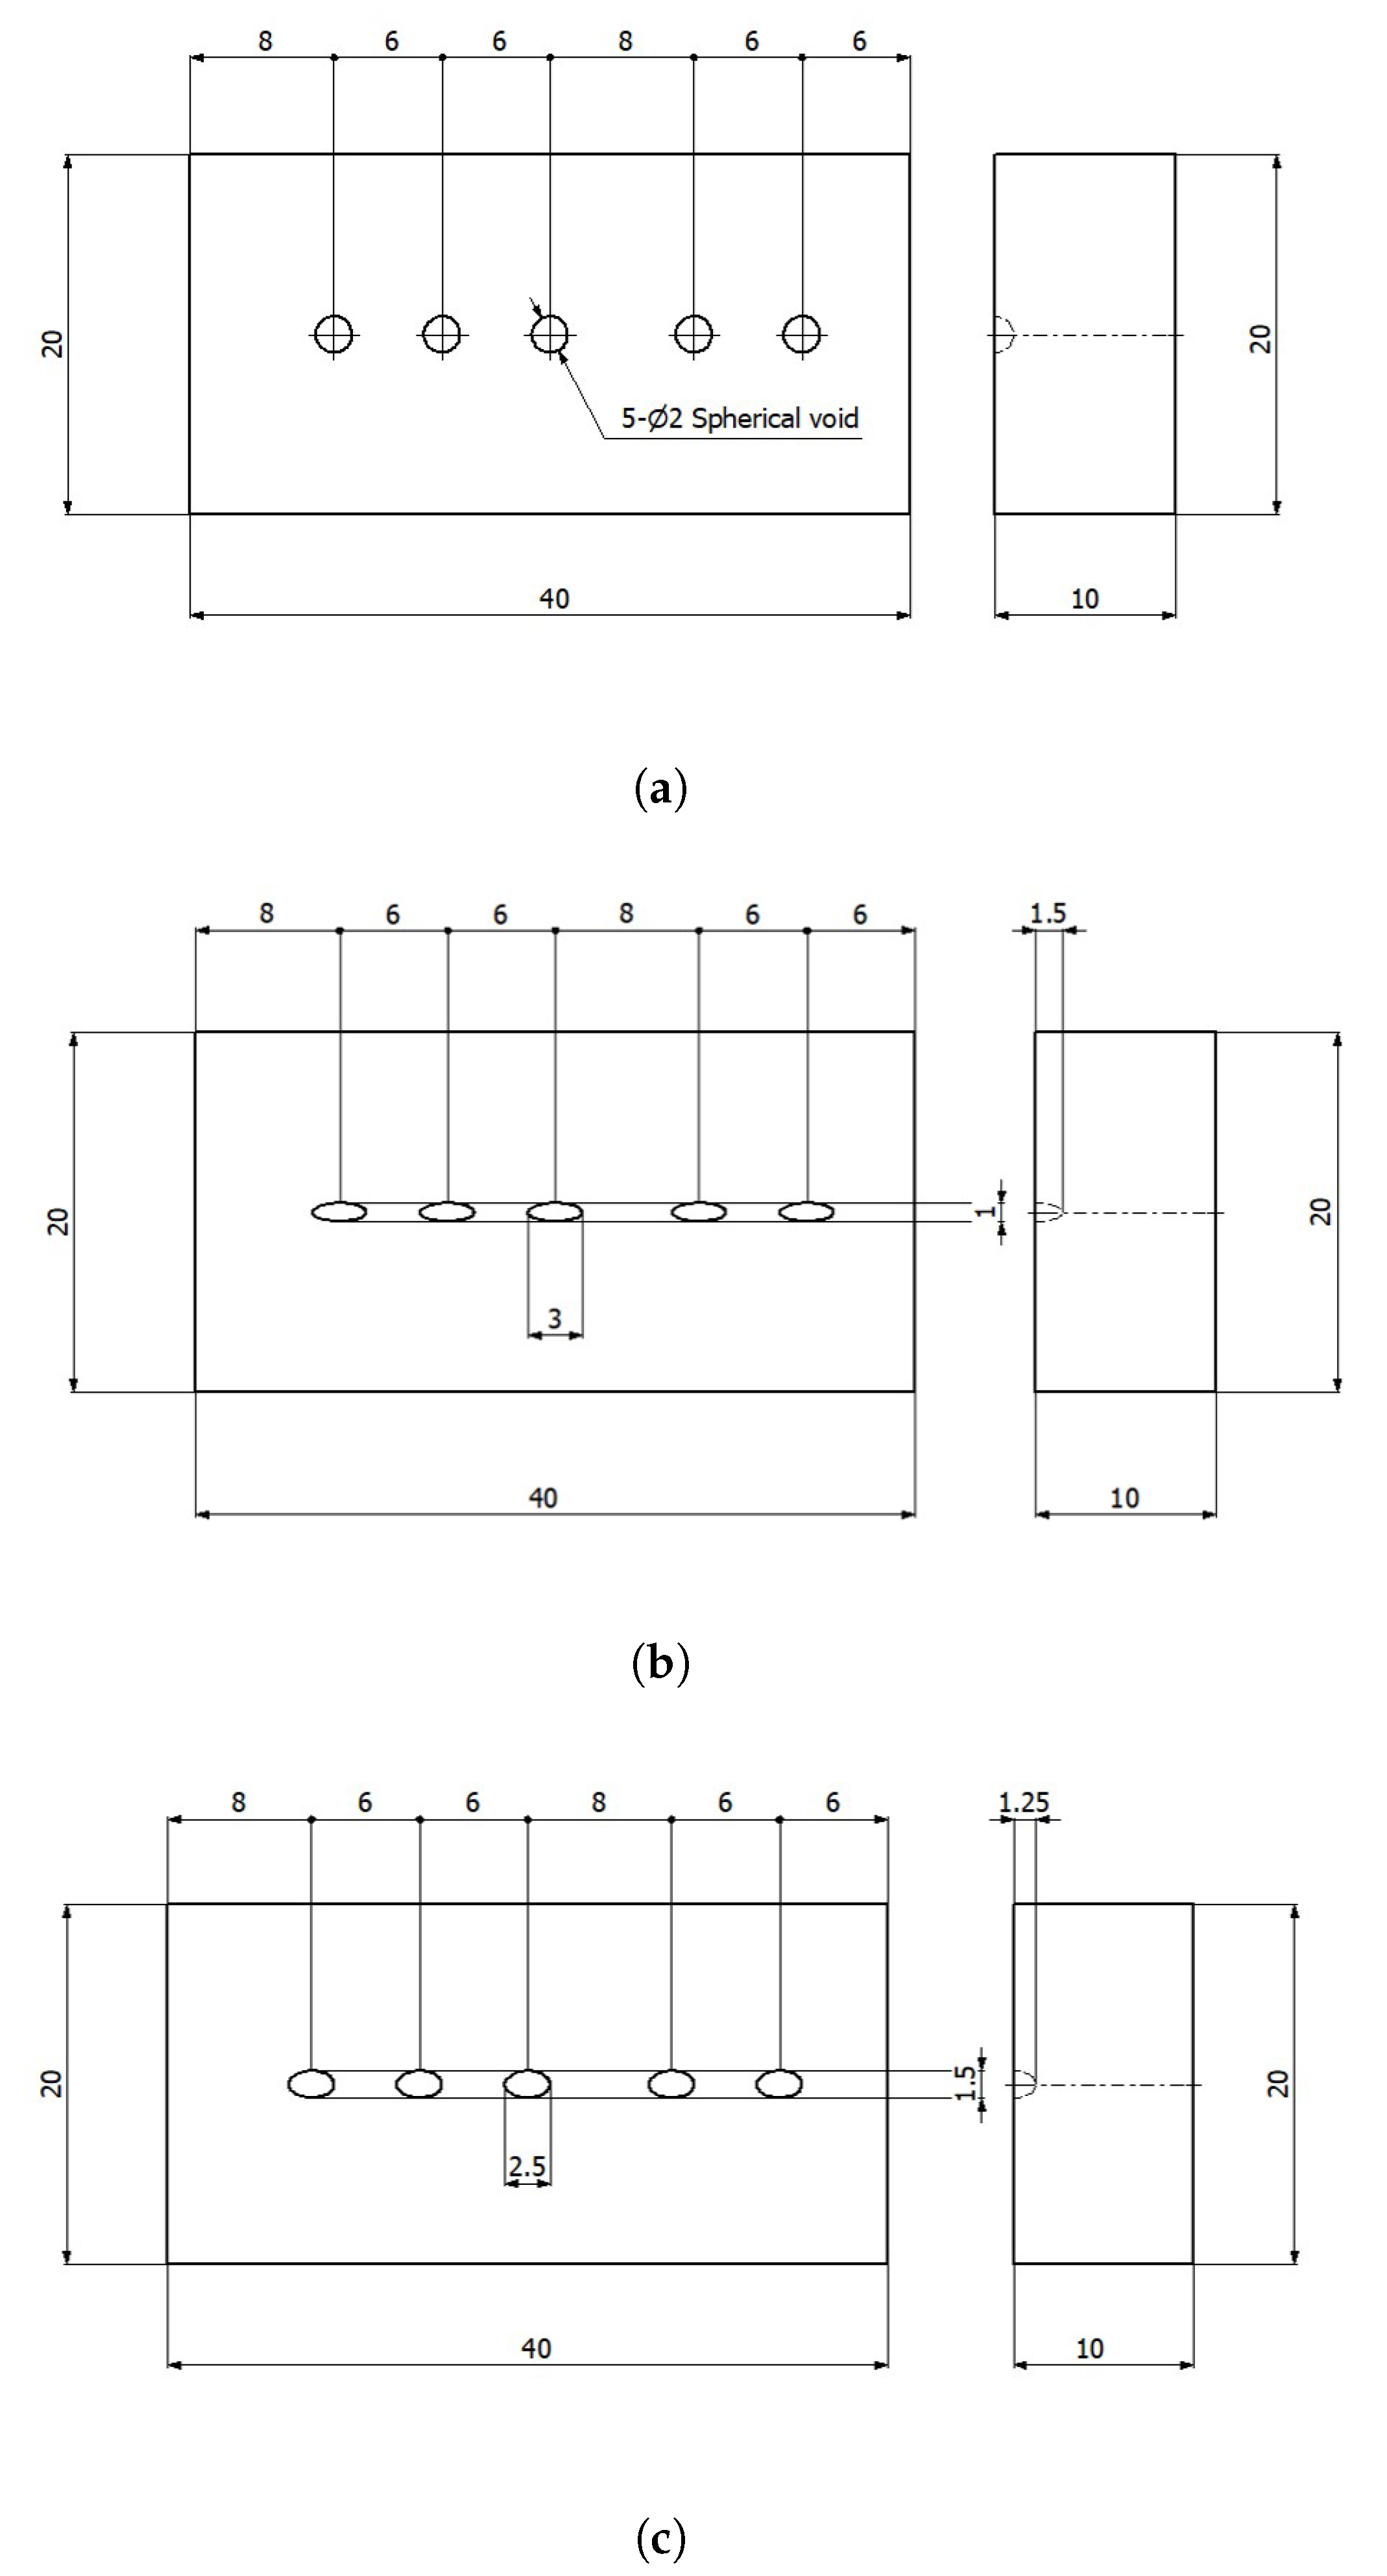
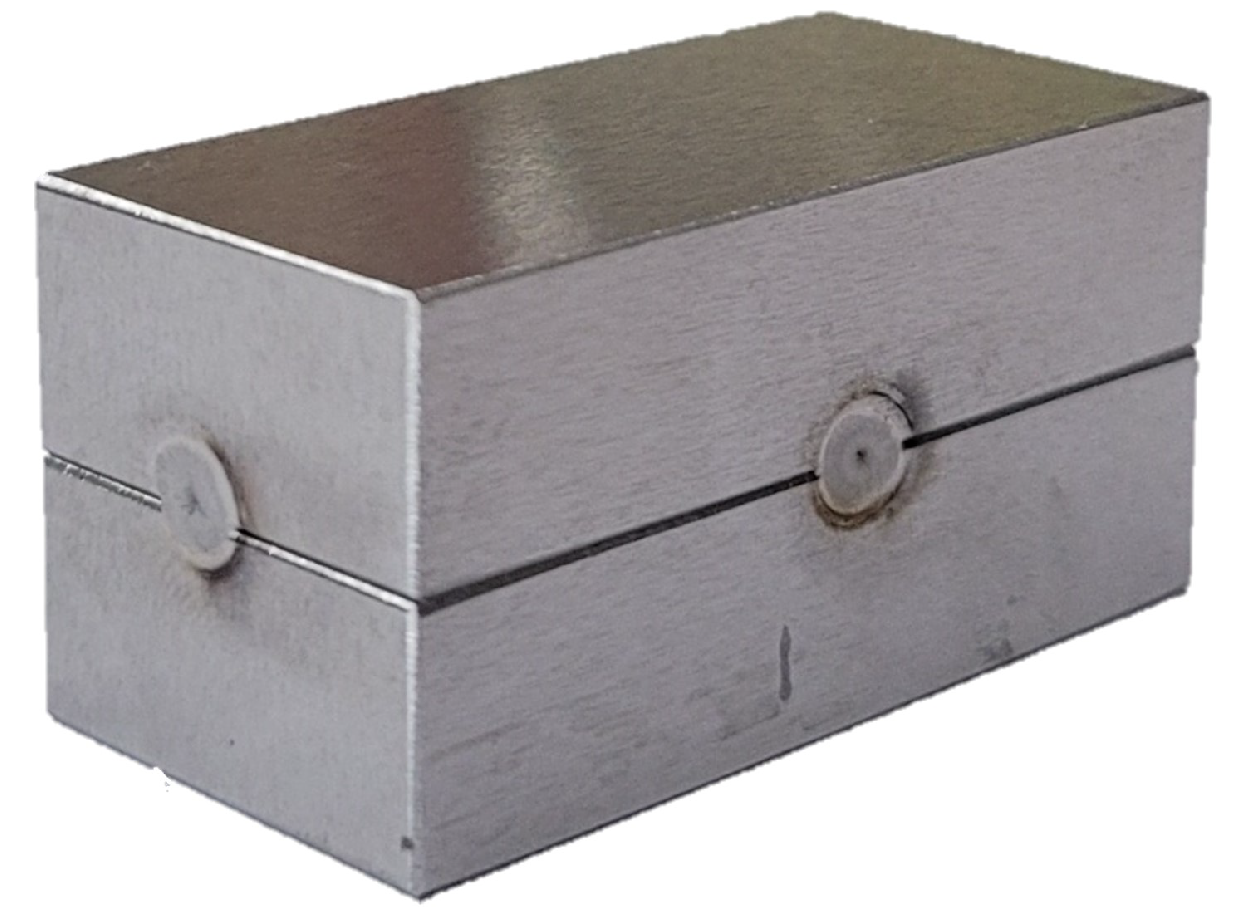
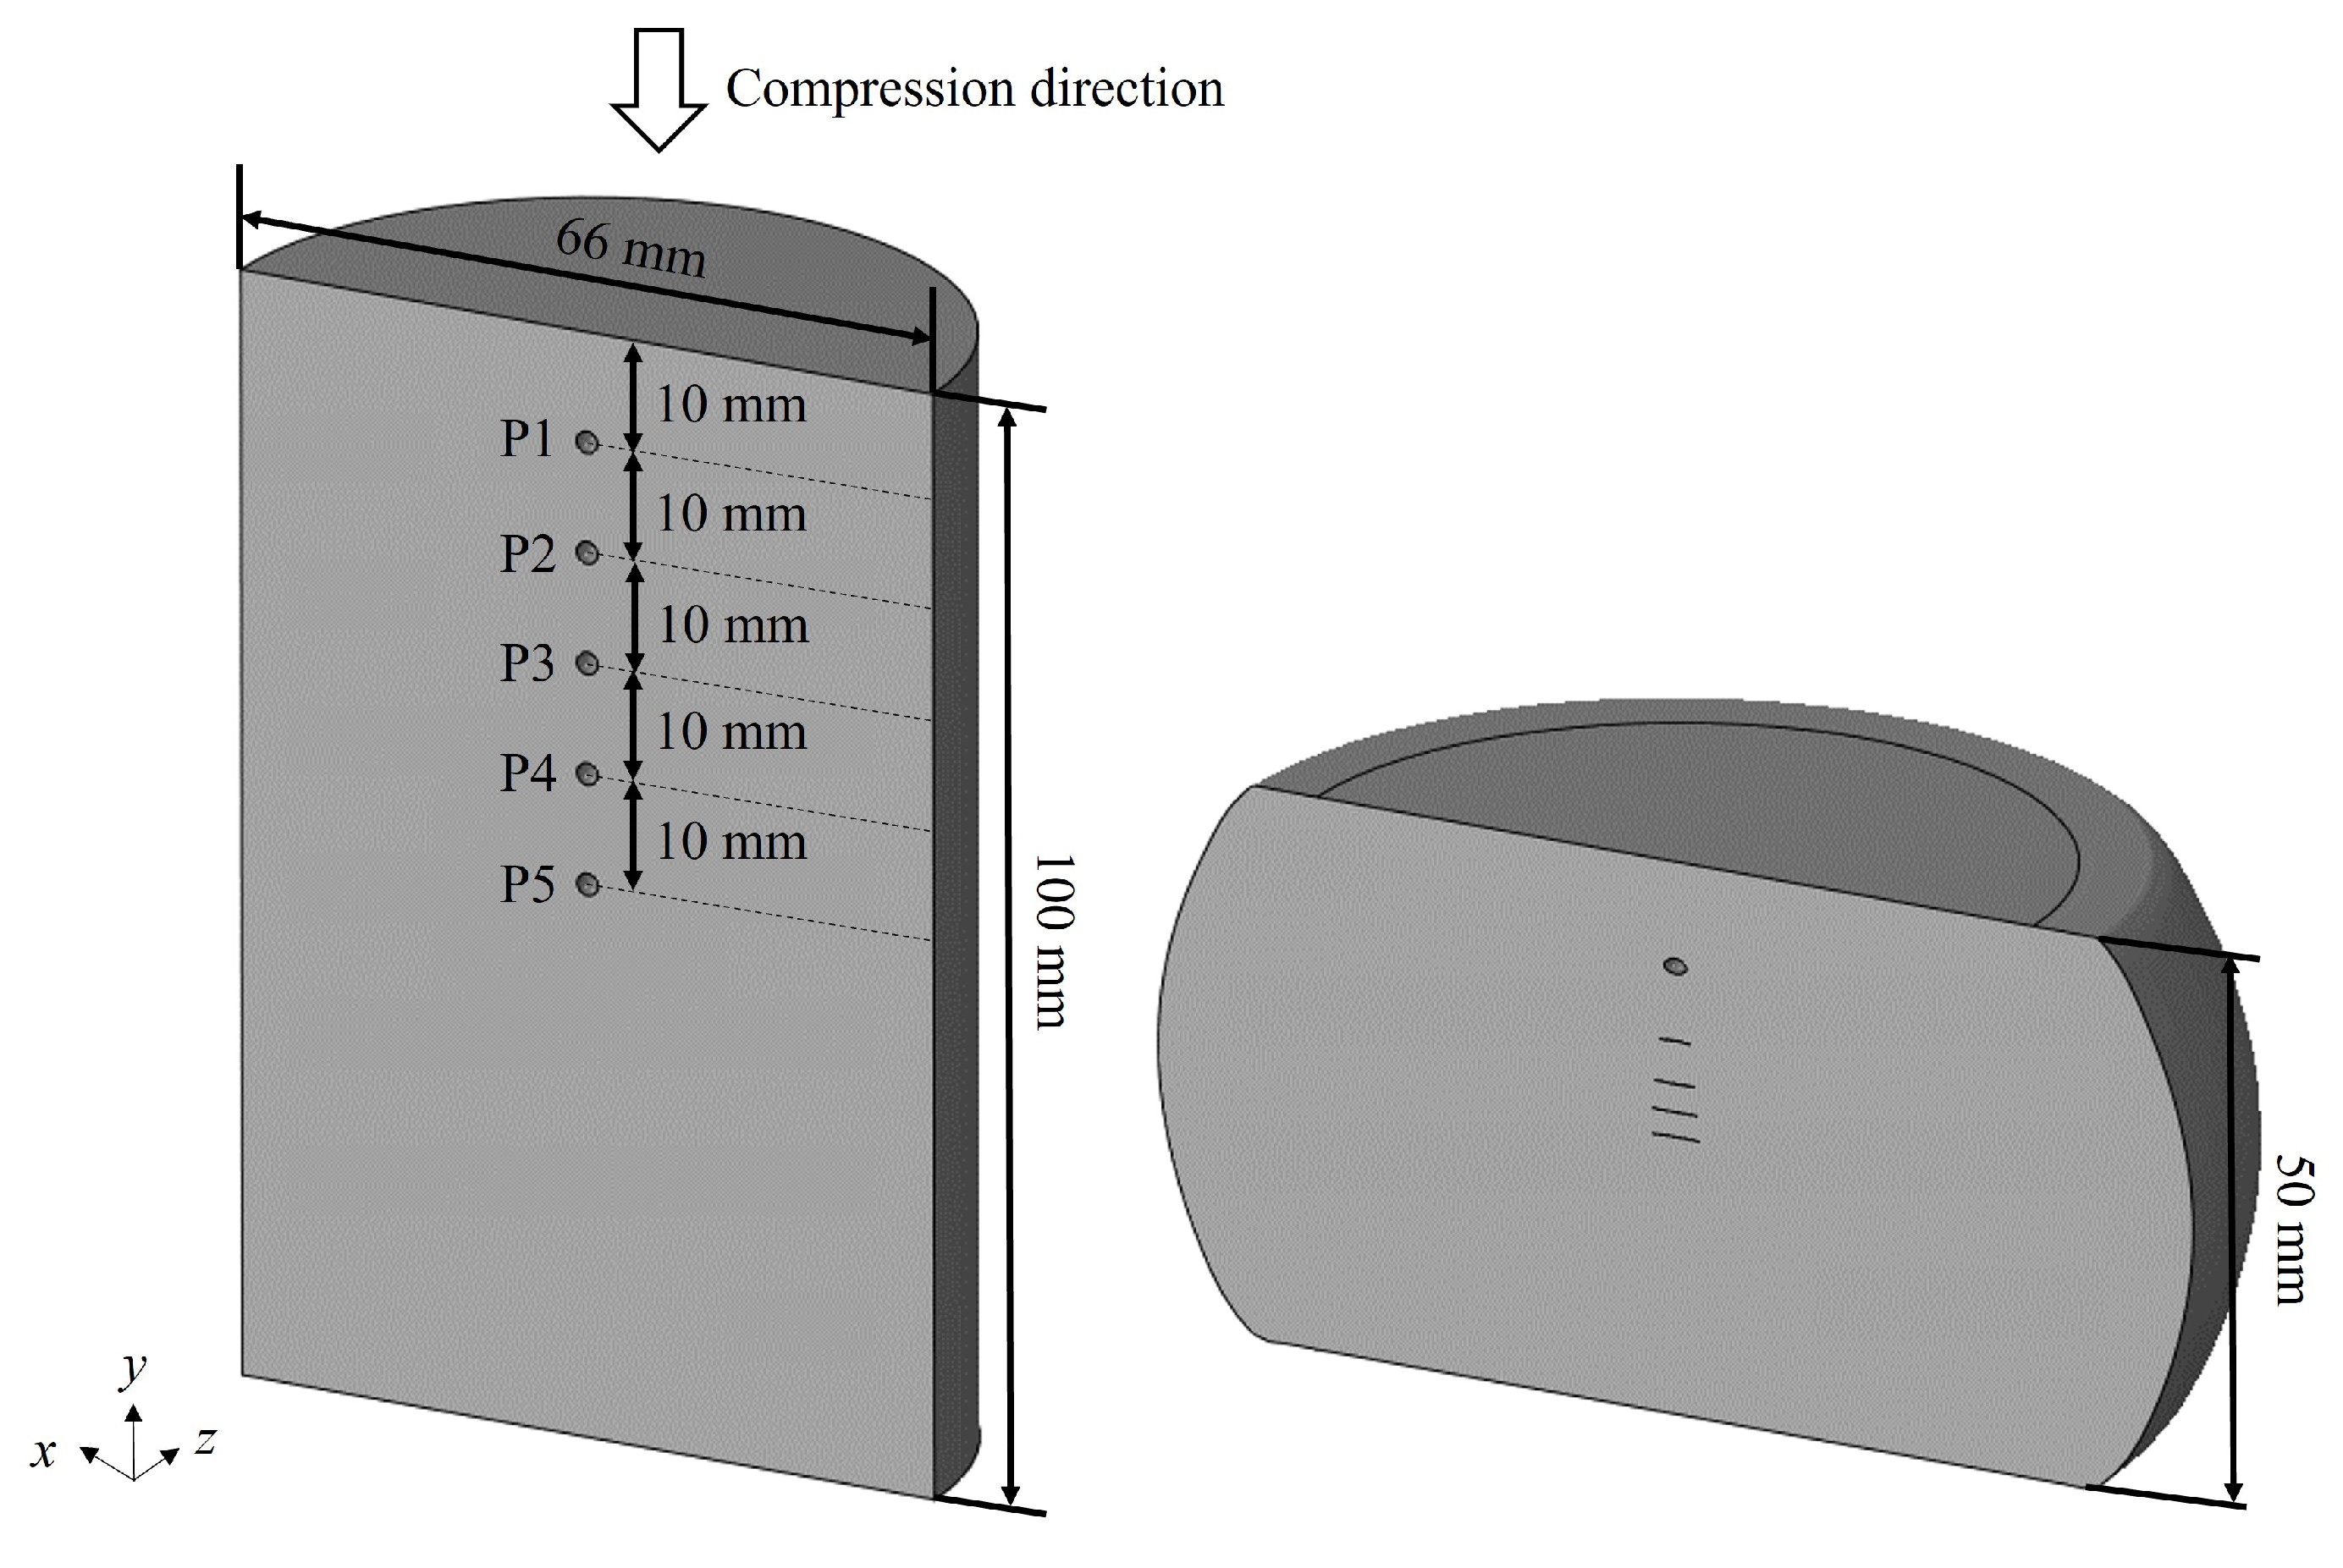
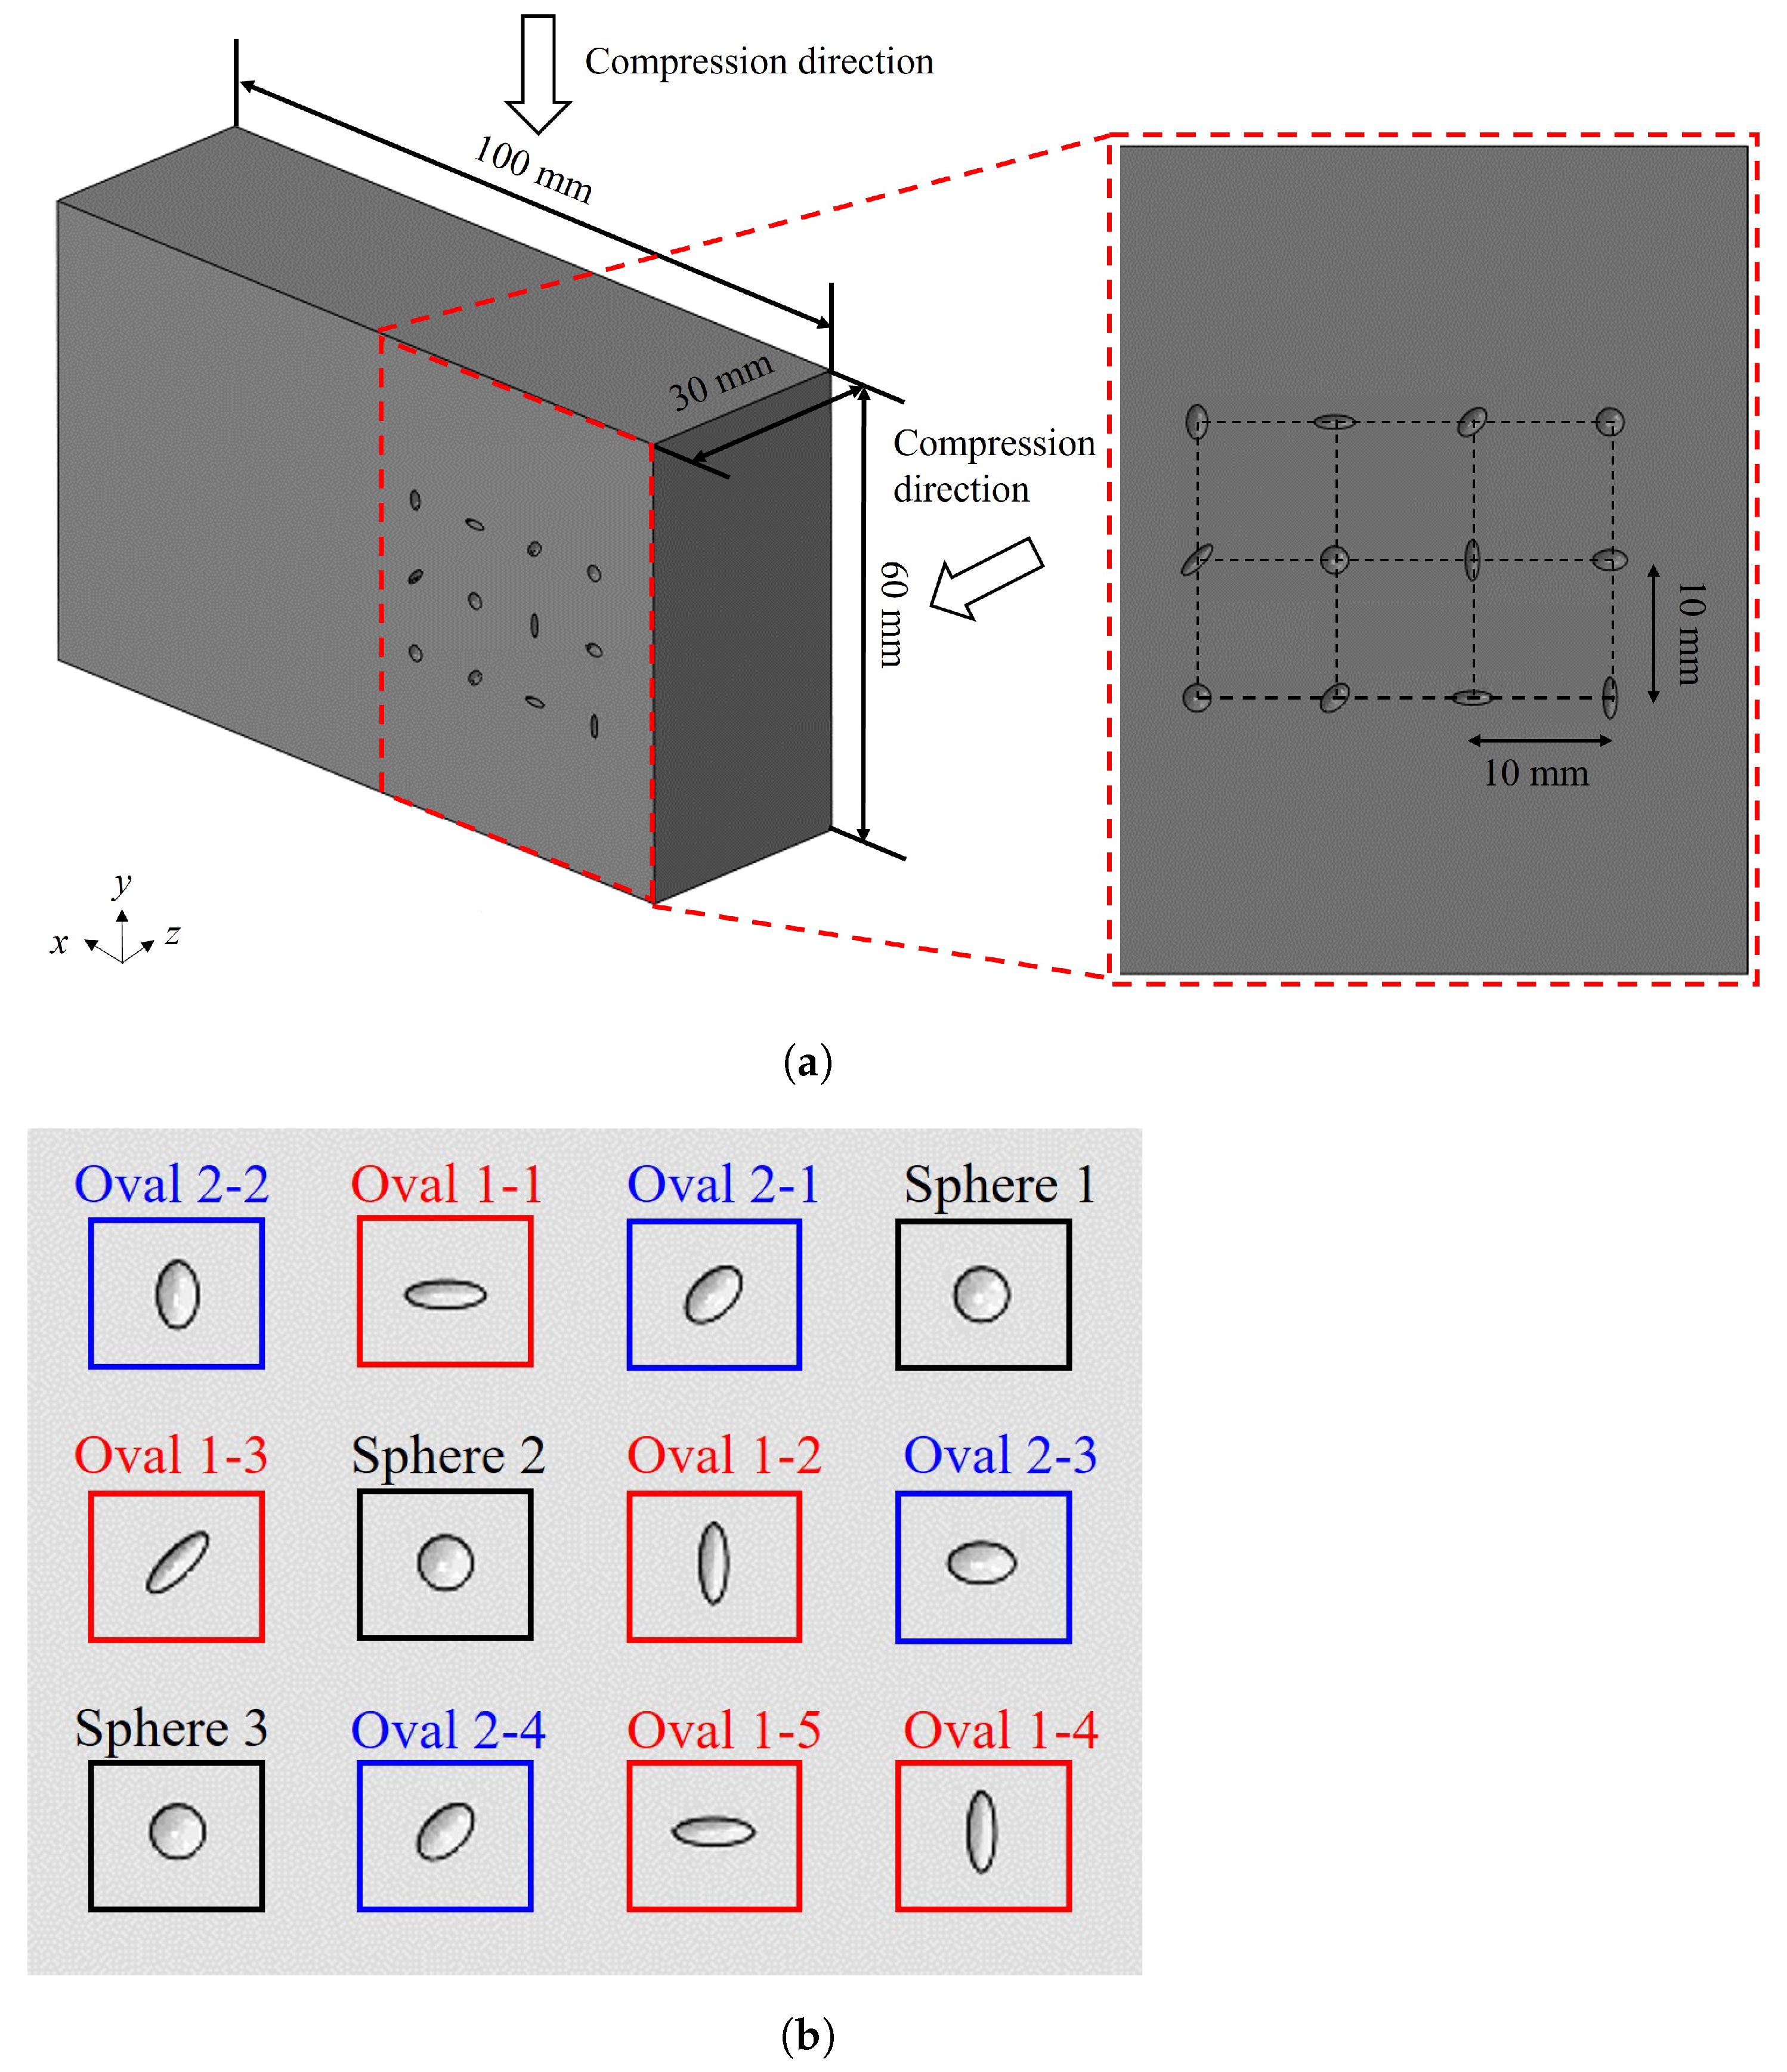
2.1. Representative Volume Element

Numerous studies have stated that the void affects the material flow of the narrow region nearby, and the deformation of the void is a local phenomenon [10]. In addition, it is impossible to model all of the voids in the material, since these are tiny, large in number, and distributed irregularly. These characteristics make a representative volume element (RVE) an appropriate approach for investigating void closure behaviour. Therefore, the RVE was utilised to analyse the void closure behaviour in the hot forging processes. The geometry of the RVE adopted in this study is a parallel-piped rectangular with a hemisphere at the centre of the domain, as shown in Figure 1a. The symmetry condition was given to the z plane, and the displacement boundary conditions were given in the x and y directions. The domain size of the RVE model was set as 10 mm × 10 mm × 5 mm. The void radii in each direction are denoted as r 1 , r 2 and r 3 , as described in Figure 1b. The domain size was determined from the work of Wang and Dong [2], wherein they indicated that the domain size is large enough to exclude the effect of the void in macroscopic deformation behaviour when the domain size is greater than 6 or 7 times the void radius.
A spherical and two ellipsoid shapes were considered as the initial void shapes in the RVE simulations as follows: (1) a spherical void with a radius of 1 mm ( r 1 = r 2 = r 3 = 1 mm), (2) an ellipsoid with radii of 1.5 mm in the x and z directions and 0.5 mm in the y direction ( r 1 = r 3 = 1.5 mm, r 2 = 0.5 mm), and (3) an ellipsoid with radii of 1.25 mm in the x and z directions and 0.75 mm in the y direction ( r 1 = r 3 = 1.25 mm, r 2 = 0.75 mm). The shapes of each void are depicted in Figure 2. In this paper, the voids are named with their initial shapes as (1) Regular Spherical, (2) Ellipsoid 1, and (3) Ellipsoid 2. In addition, ellipsoid voids rotated by 45° and 90° in the z direction have been considered.
FEA was conducted to determine the correlation between the void volume and the macroscopic strain of the RVE with the commercial software Abaqus. Mesh tests were performed to determine the mesh size in the void region. The mesh size was gradually reduced from 0.2 mm to 0.08 mm to assess the influence on the mesh sensitivity, and the results are presented in Figure 3. The void closure tendency converged when the mesh size reached 0.1 mm. Based on these findings, the mesh size in the void region was set to 0.1 mm, and the mesh size in other regions was set to 0.5 mm, as depicted in Figure 1a. The analysis was conducted using reduced-integration hexahedral elements (C3D8R). M50 bearing steel was selected as the forging material. The material properties of M50 steel were obtained from the work of Park et al. [25]. The material was assumed to follow von Mises yield criterion with the associated flow rule and isotropic hardening. Only one void was modelled in the RVE domain, since it was assumed that there were no interactions between the voids.

2.2. Boundary Conditions

The deformation behaviour of the void is different according to the ratio of the applied stress and the shape of the void. The void shape is one of the crucial factors, especially in multi-step hot forging processes that involve changes in the loading direction.
The stress ratio was considered with a stress triaxiality η = σ H / σ ¯ , which is the ratio of the hydrostatic stress σ H and the equivalent stress σ ¯ . Since the compressive stress is the dominant stress state in typical forging processes [26], and the compressive stress is the primary factor in void closure behaviour [27], the range of the triaxiality was set as from 0.05 to 0.66 .
The macroscopic equivalent plastic strain and triaxiality were calculated through the following procedure. The elastic strains were neglected in the procedure, since the plastic strains are much larger than the elastic strains. Let the displacement boundary conditions be given so that the macroscopic logarithmic strain rates of the RVE in the x and y directions become the constants ε ˙ x and ε ˙ y , respectively. The displacement u in the direction i can be expressed by the function of time t and the macroscopic logarithmic strain rate ε ˙ as the following equation:
u i = l 0 , i exp ( ε ˙ i t ) 1 ,
where the subscript i denotes the direction (x and y), and l 0 , i is the original length of the RVE in the direction i. The displacement boundary conditions were given based on Equation (4). Assuming that the RVEs exhibit isochoric deformation in the macroscopic scale, the macroscopic logarithmic strain rate in the z direction is ε ˙ z = ε ˙ x + ε ˙ y . Since the RVE was set to be free in the z direction, the stress in the z direction was zero ( σ z = 0 ). The principal components of the deviatoric stress tensor s can be expressed by the Cauchy stress tensor components as follows.
s x = 2 3 σ x 1 3 σ y s y = 2 3 σ y 1 3 σ x s z = 1 3 ( σ x + σ y ) = ( s x + s y ) .
The hydrostatic stress σ H can be expressed with the deviatoric stress by summing the first and second equations in Equation (5) as follows.
σ H = s x + s y .
The effective stress σ ¯ is defined as follows.
σ ¯ = 3 2 s x 2 + s y 2 + s z 2 = 3 s x 2 + s y 2 + s x s y .
From the associated flow rule, the ratio of strain rates is equal to the ratio of the deviatoric stresses. Therefore, the stress triaxiality can be expressed with ε ˙ x and ε ˙ y as follows:
η = σ H σ ¯ = ε ˙ x + ε y ˙ 3 ε ˙ x 2 + ε ˙ y 2 + ε ˙ x ε ˙ y .
The stress triaxiality of the RVE for the given macroscopic logarithmic strain rates was calculated with Equation (8).

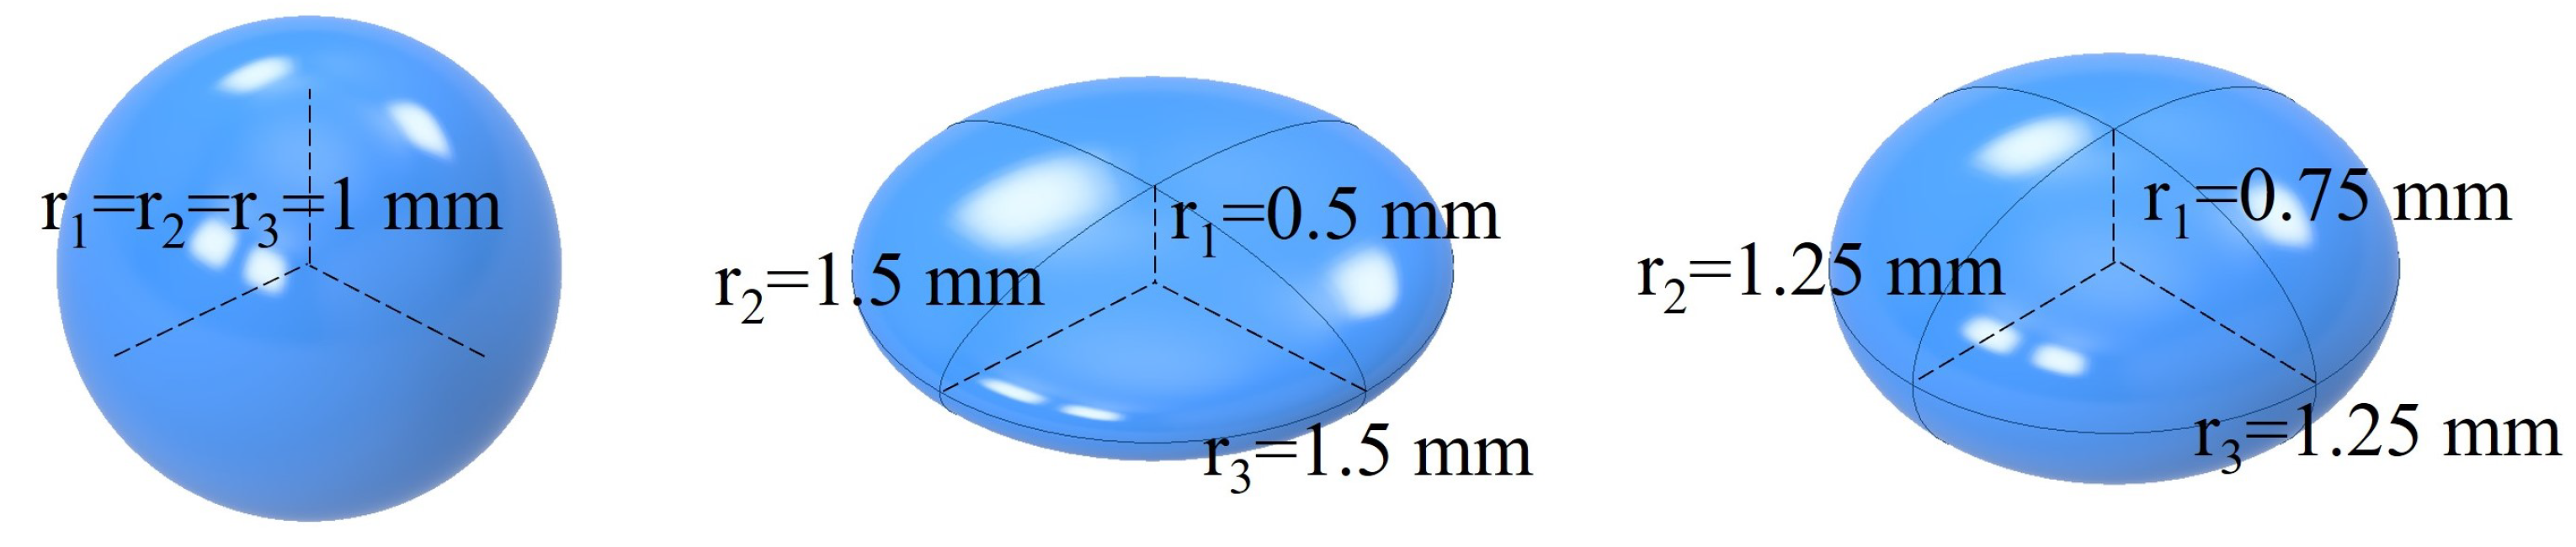
2.3. Equivalent Ellipsoid

When the void deforms, the definitions of the orientation and the radii are ambiguous, since it does not have a specific shape during the deformation. Therefore, the definitions are needed to consider the radii and the orientation quantitatively. In this study, the equivalent ellipsoid concept was adopted to define the radii and the orientation of the voids during the deformation.
An ellipsoid with the radii a, b, and c is described in the spherical coordinate system as follows:
ρ 2 sin 2 θ cos 2 φ a 2 + ρ 2 sin 2 θ sin 2 φ b 2 + ρ 2 cos 2 θ c 2 1 = 0 ,
where ρ , θ , and φ are the radius, polar, and azimuthal angles, respectively. When the principal directions are rotated by the angles α , β , and γ along the z, y, and x axes, the rotation matrix R is described as follows:
R = cos α cos β cos α cos β sin γ sin α cos γ cos α sin β cos γ + sin α sin γ sin α cos β sin α sin β sin γ + cos α cos γ sin α sin β cos γ cos α sin γ sin β cos β sin γ cos β cos γ .
A point x on the ellipsoid is rotated according to the following equation:
x r = R T x ,
where x r is the point described in the rotated axes.
For a given void shape, it was assumed to follow two properties: (1) the sum of the distances between the nodal points and the surface of the ellipsoid is minimal, and (2) the volumes of the ellipsoid and the void are the same. An objective function f was constructed to deduce the equivalent ellipsoid for a given void shape as follows:
f ( a , b , c , α , β , γ ) = 1 N i = 1 N ( ρ x ) i ( ρ ellp ) i ρ x 2 + K V void V ellp V void 2 ,
where N is the total number of the nodes of the void in the RVE, ρ x is the distance between the node of the void and the origin of the coordinate system, ρ ellp is the distance between the surface of the ellipsoid and the origin of the coordinate system, V void is the void volume in the RVE, and V ellp is the volume of the ellipsoid. K is the penalty coefficient used to ensure the second property of the equivalent ellipsoid, and it was set to 10 6 . The equivalent ellipsoid for a given void shape was deduced by solving the minimisation problem for Equation (12) using the L-BFGS-B algorithm [28].

3. Void Closure Model

The deformation behaviour of voids is determined by the shape and stress state of the voids. In particular, the angle between the orientation of the voids and the direction of deformation is a critical variable that influences their deformation behaviour. Saby et al. [24] took this factor into account by utilising the direction cosine of the principal compression direction for the orientation of voids. The direction cosine of the principal compression direction was calculated as follows:
p i = u i · e 1 2 ,
where p i is the direction cosine, u i is the direction to the radius r i of the ellipsoid ( r 1 r 2 r 3 ), and e 1 is the principal compression direction, which can be determined from the strain rate tensor. The normalised volume and radii were defined as follows:
V * = V / V 0
r i * = r i / V 0 3 ,
where the superscript ∗ denotes the normalised value.
Saby et al. [24] predicted the volume change of voids by constructing the normalised void volume as a quadratic function of effective strain and formulating the coefficients of the quadratic function as polynomials of the stress triaxiality, dimensionless void radius, and direction cosine. In the model, only the initial conditions occurring in the voids were considered to predict the volume change. However, the radius and orientation of voids continuously change at every moment during deformation, and calculating these values is crucial for predicting void deformation in complex situations. In this study, the rate of change of effective strain for the parameters influencing void deformation was considered to calculate the changing void radii and orientations during deformation.
The rates of change of the normalised volume, radii, and orientation were described by the cubic functions as follows:
V ε ¯ = A V + B V ε ¯ + C V ε ¯ 2 + D V ε ¯ 3 r 1 ε ¯ = A r 1 + B r 1 ε ¯ + C r 1 ε ¯ 2 + D r 1 ε ¯ 3 r 2 ε ¯ = A r 2 + B r 2 ε ¯ + C r 2 ε ¯ 2 + D r 2 ε ¯ 3 α ε ¯ = A α + B α ε ¯ + C α ε ¯ 2 + D α ε ¯ 3 ,
where A, B, C, and D are the coefficients of the cubic function, and the subscripts denote the parameters. r 3 was excluded, since it can be determined from r 1 , r 2 , and V . In the 3D stress state, the triaxiality and Lode angle are the major parameters that represent the stress state. Early void closure models often considered stress triaxiality only. However, recent studies have revealed that the Lode angle is also a significant parameter influencing void deformation behaviour [2,16,17,19]. In this study, the model coefficients in Equation (16) were expressed as polynomial functions of the triaxiality, Lode angle, shape parameters, and direction cosine as follows:
A = i = 1 3 j = 0 2 k = 0 1 l = 0 1 a j k l η k ( 1 + cos θ ) l q i j p i B = i = 1 3 j = 0 2 k = 0 1 l = 0 1 b j k l η k ( 1 + cos θ ) l q i j p i C = i = 1 3 j = 0 2 k = 0 1 l = 0 1 c j k l η k ( 1 + cos θ ) l q i j p i D = i = 1 3 j = 0 2 k = 0 1 l = 0 1 d j k l η k ( 1 + cos θ ) l q i j p i ,
where q i represents the shape parameters, which are defined as q 1 = r 1 , q 2 = r 2 , and q 3 = V , θ is the Lode angle, and a, b, c, and d are the coefficients of the polynomial function. The void radii and orientation can be calculated by integrating Equation (16). The integration can be done using a first-order Taylor series expansion as follows:
V i + 1 = V i * + V ε ¯ Δ ε ¯ r 1 i + 1 = r 1 * i + r 1 ε ¯ Δ ε ¯ r 2 i + 1 = r 2 i + r 2 ε ¯ Δ ε ¯ α i + 1 = α i + α ε ¯ Δ ε ¯ ,
where the subscripts i and i + 1 denote the current and updated states, respectively. The void parameters are not only functions of the effective strain, but also of the stress and each parameter itself, so they require integration involving partial derivative terms for each parameter. However, assuming that the influence of the effective strain is dominant, the integration is performed as shown in Equation (18). The coefficients in Equations (16) and (17) can be derived from RVE analysis considering various initial void shapes, orientations, and stress states.

4. Results and Discussion

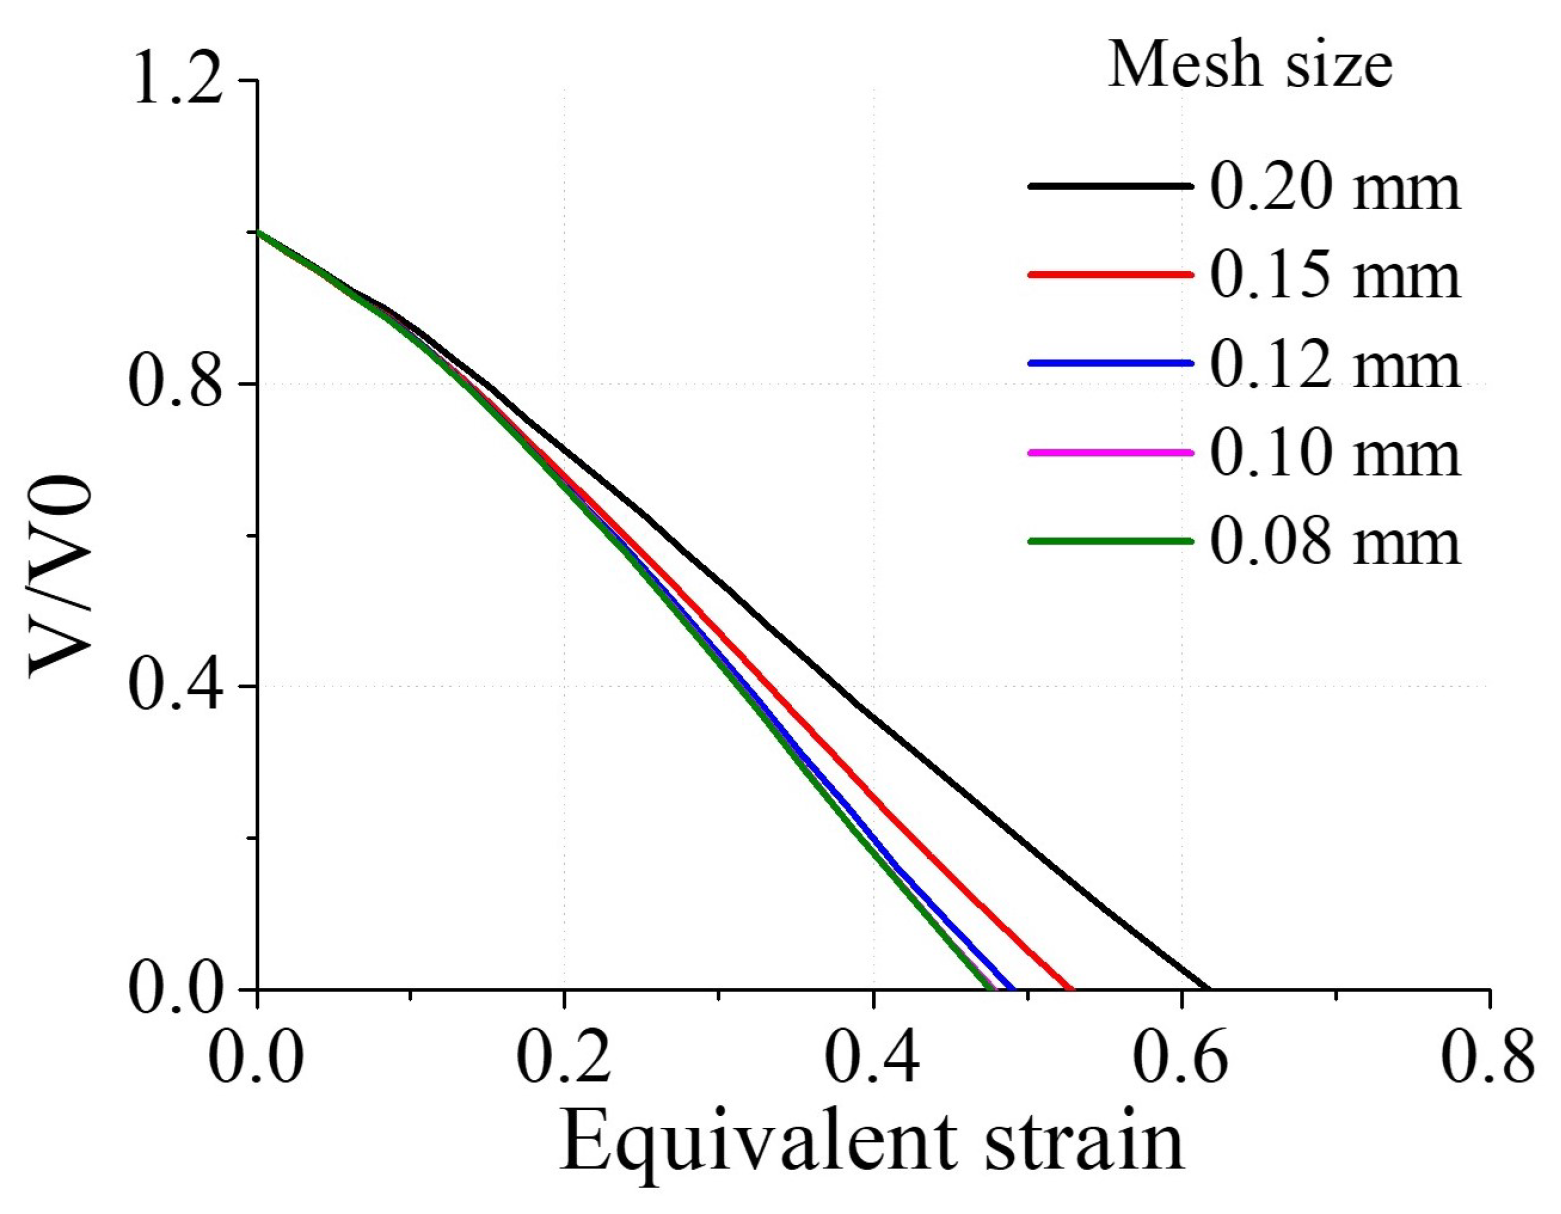
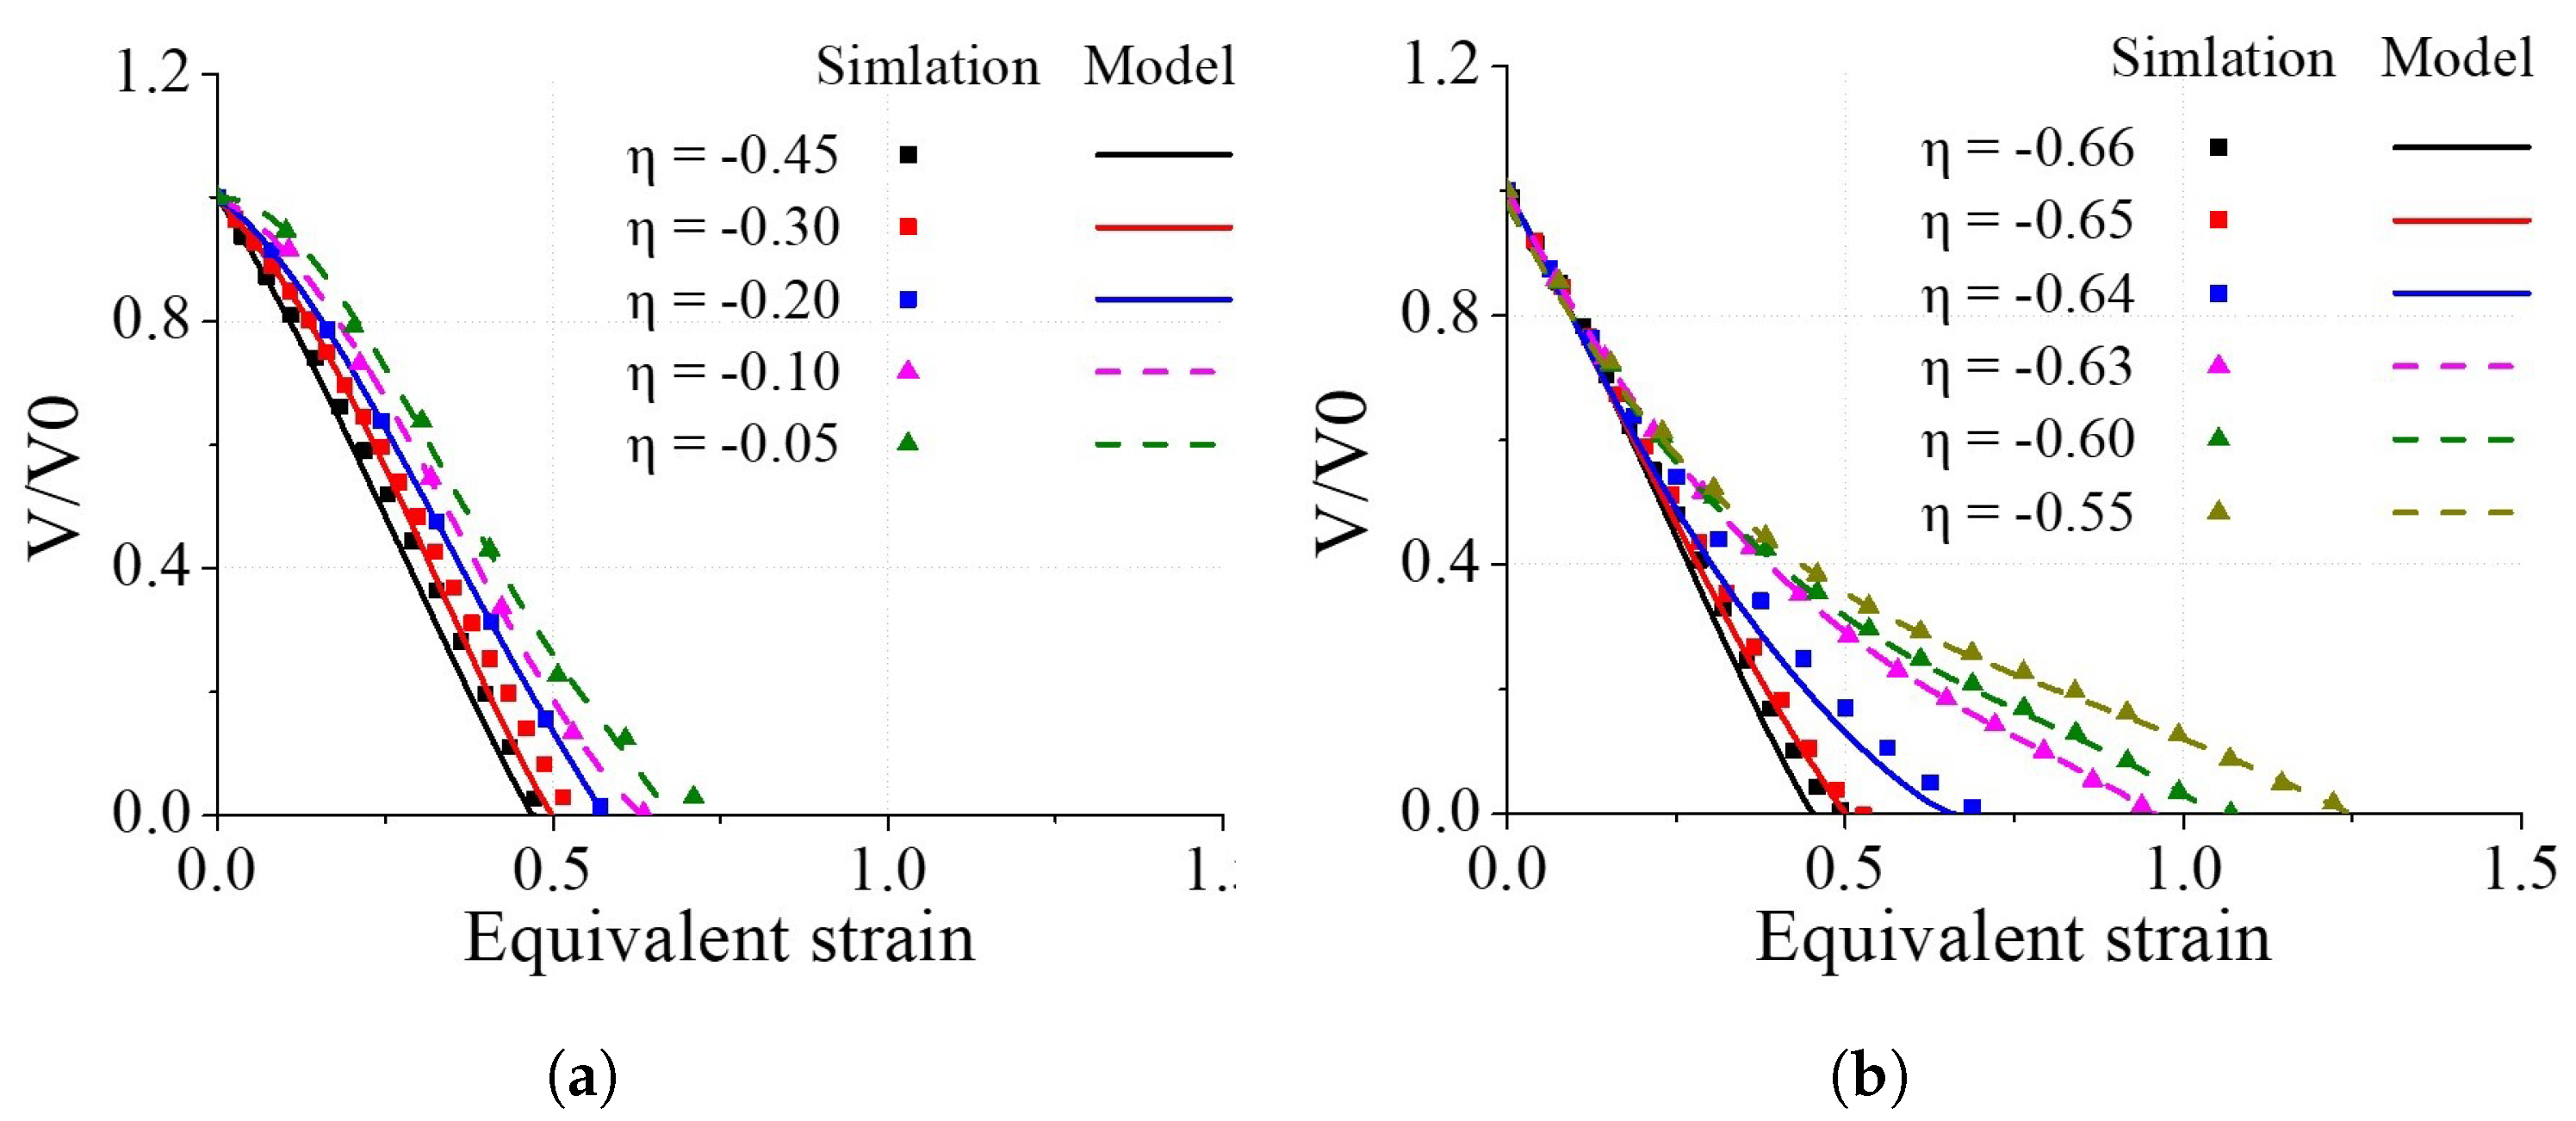
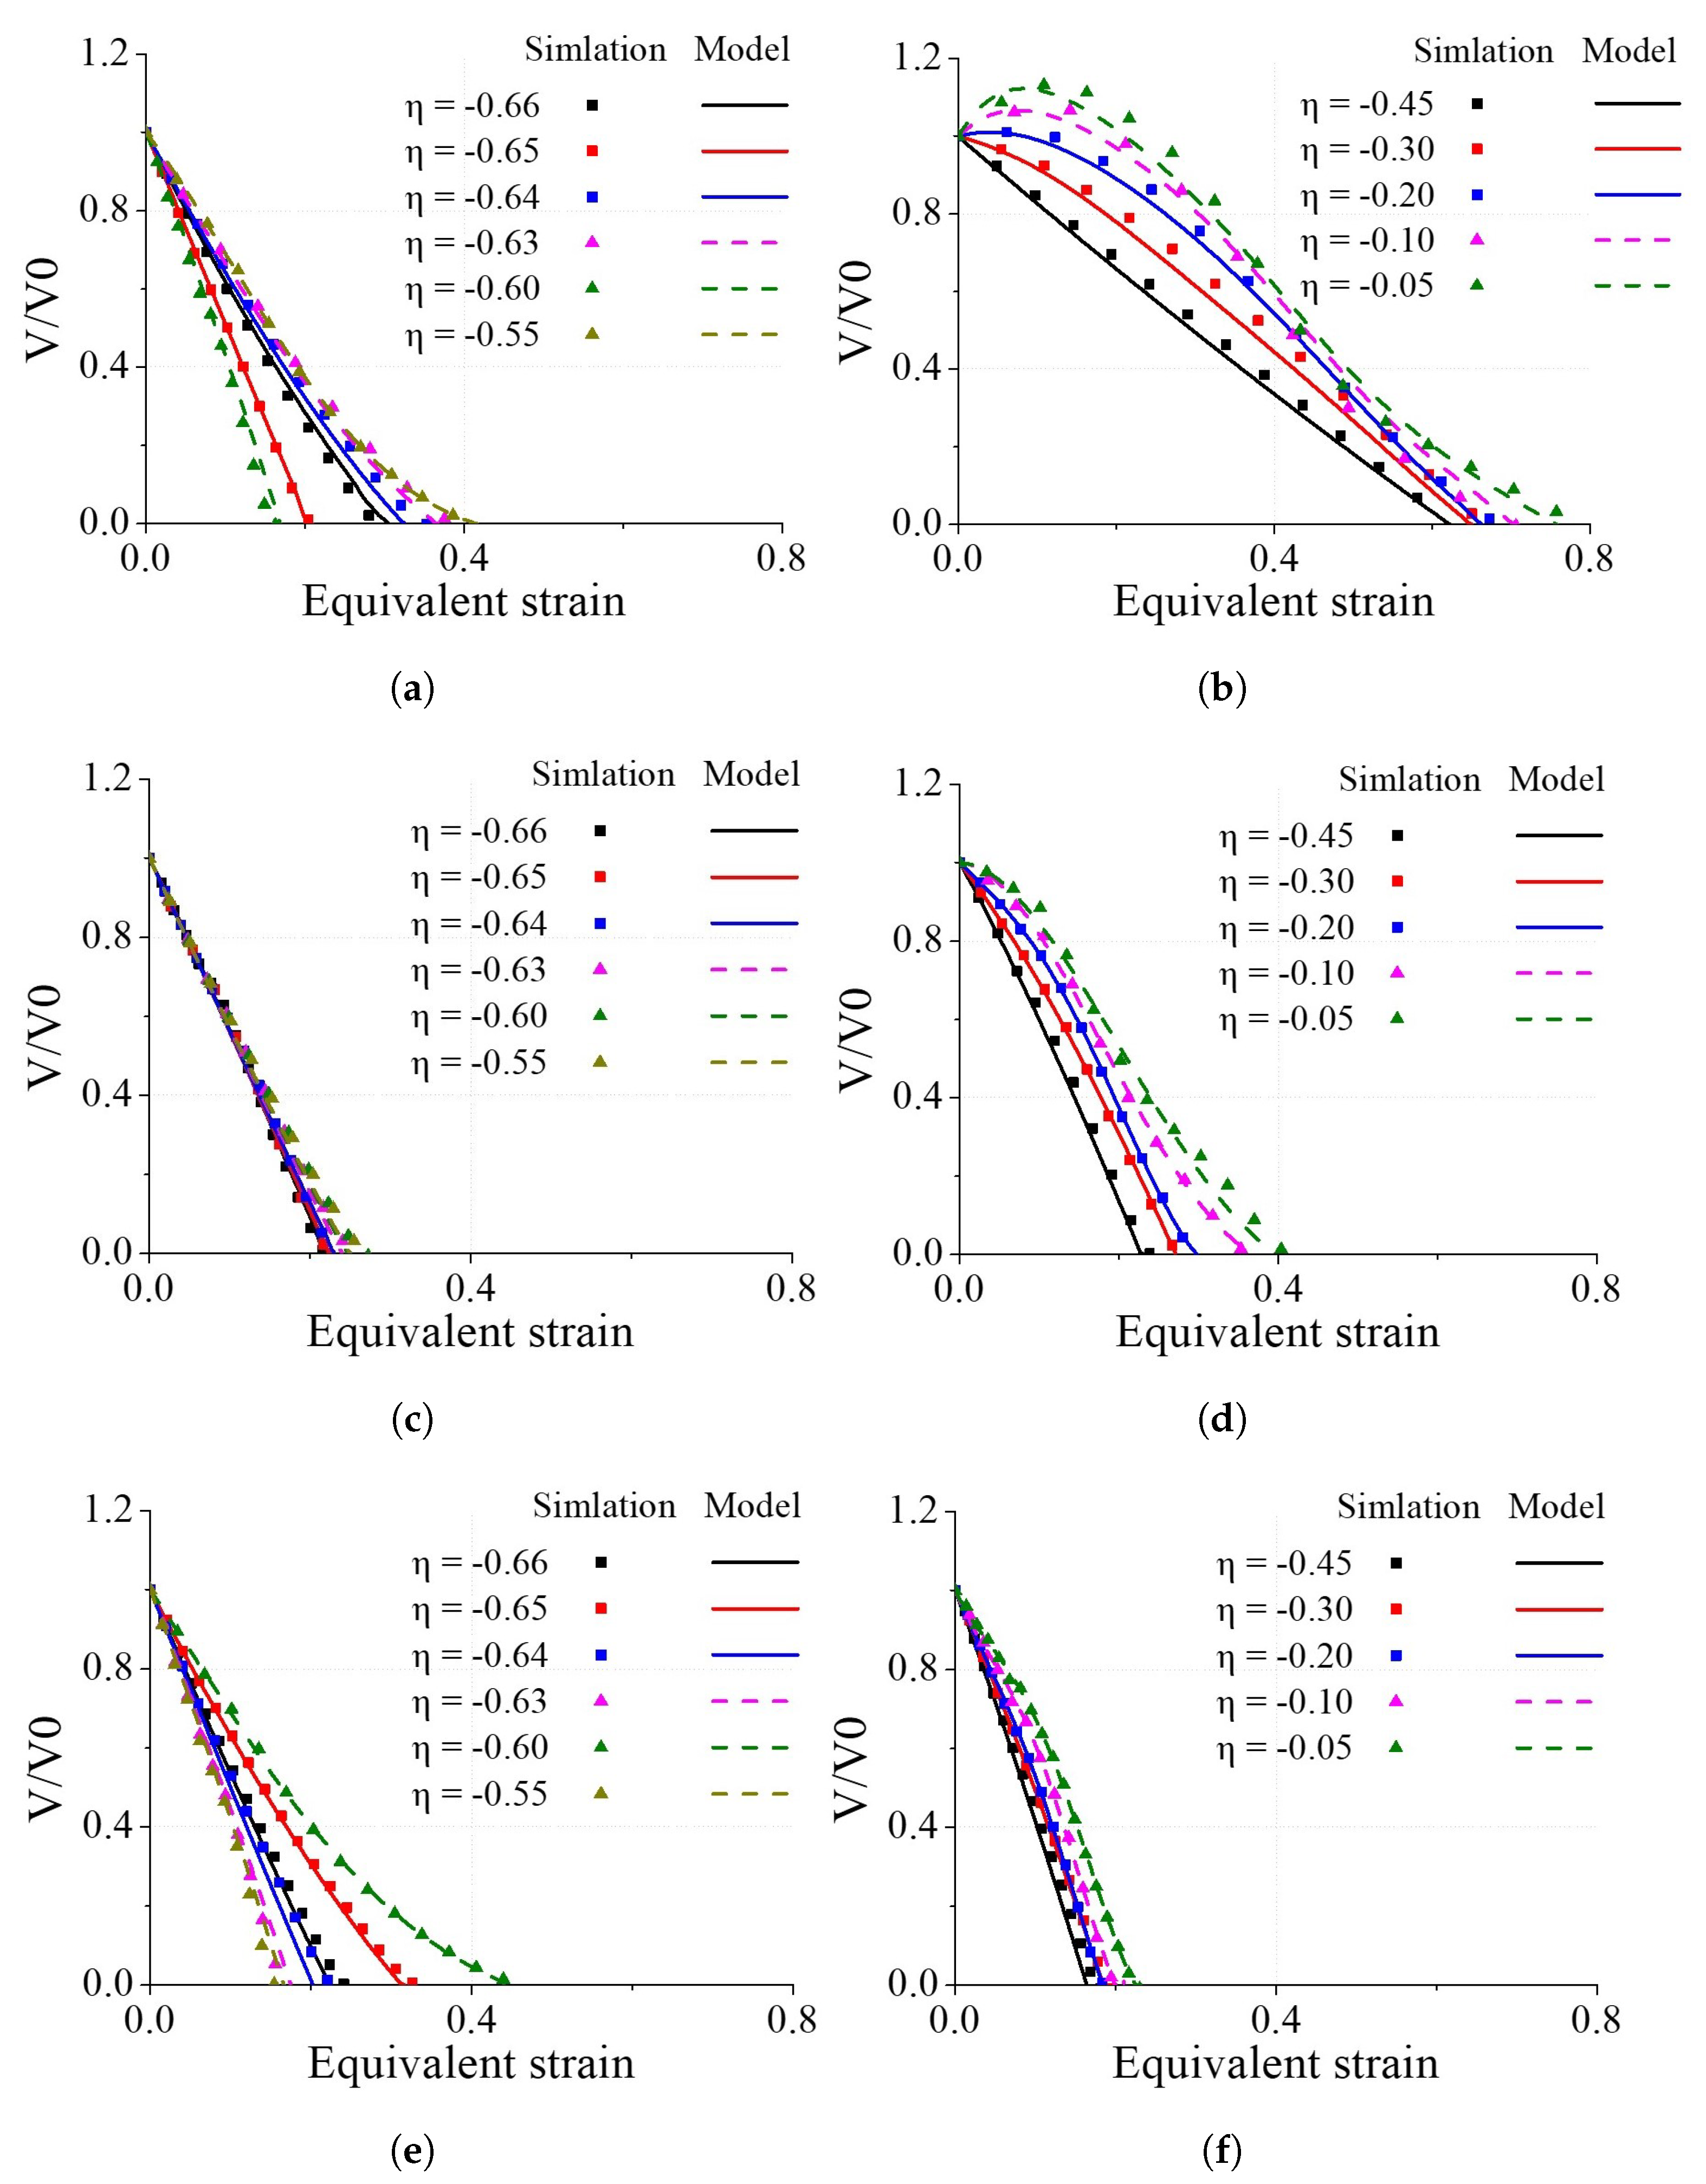
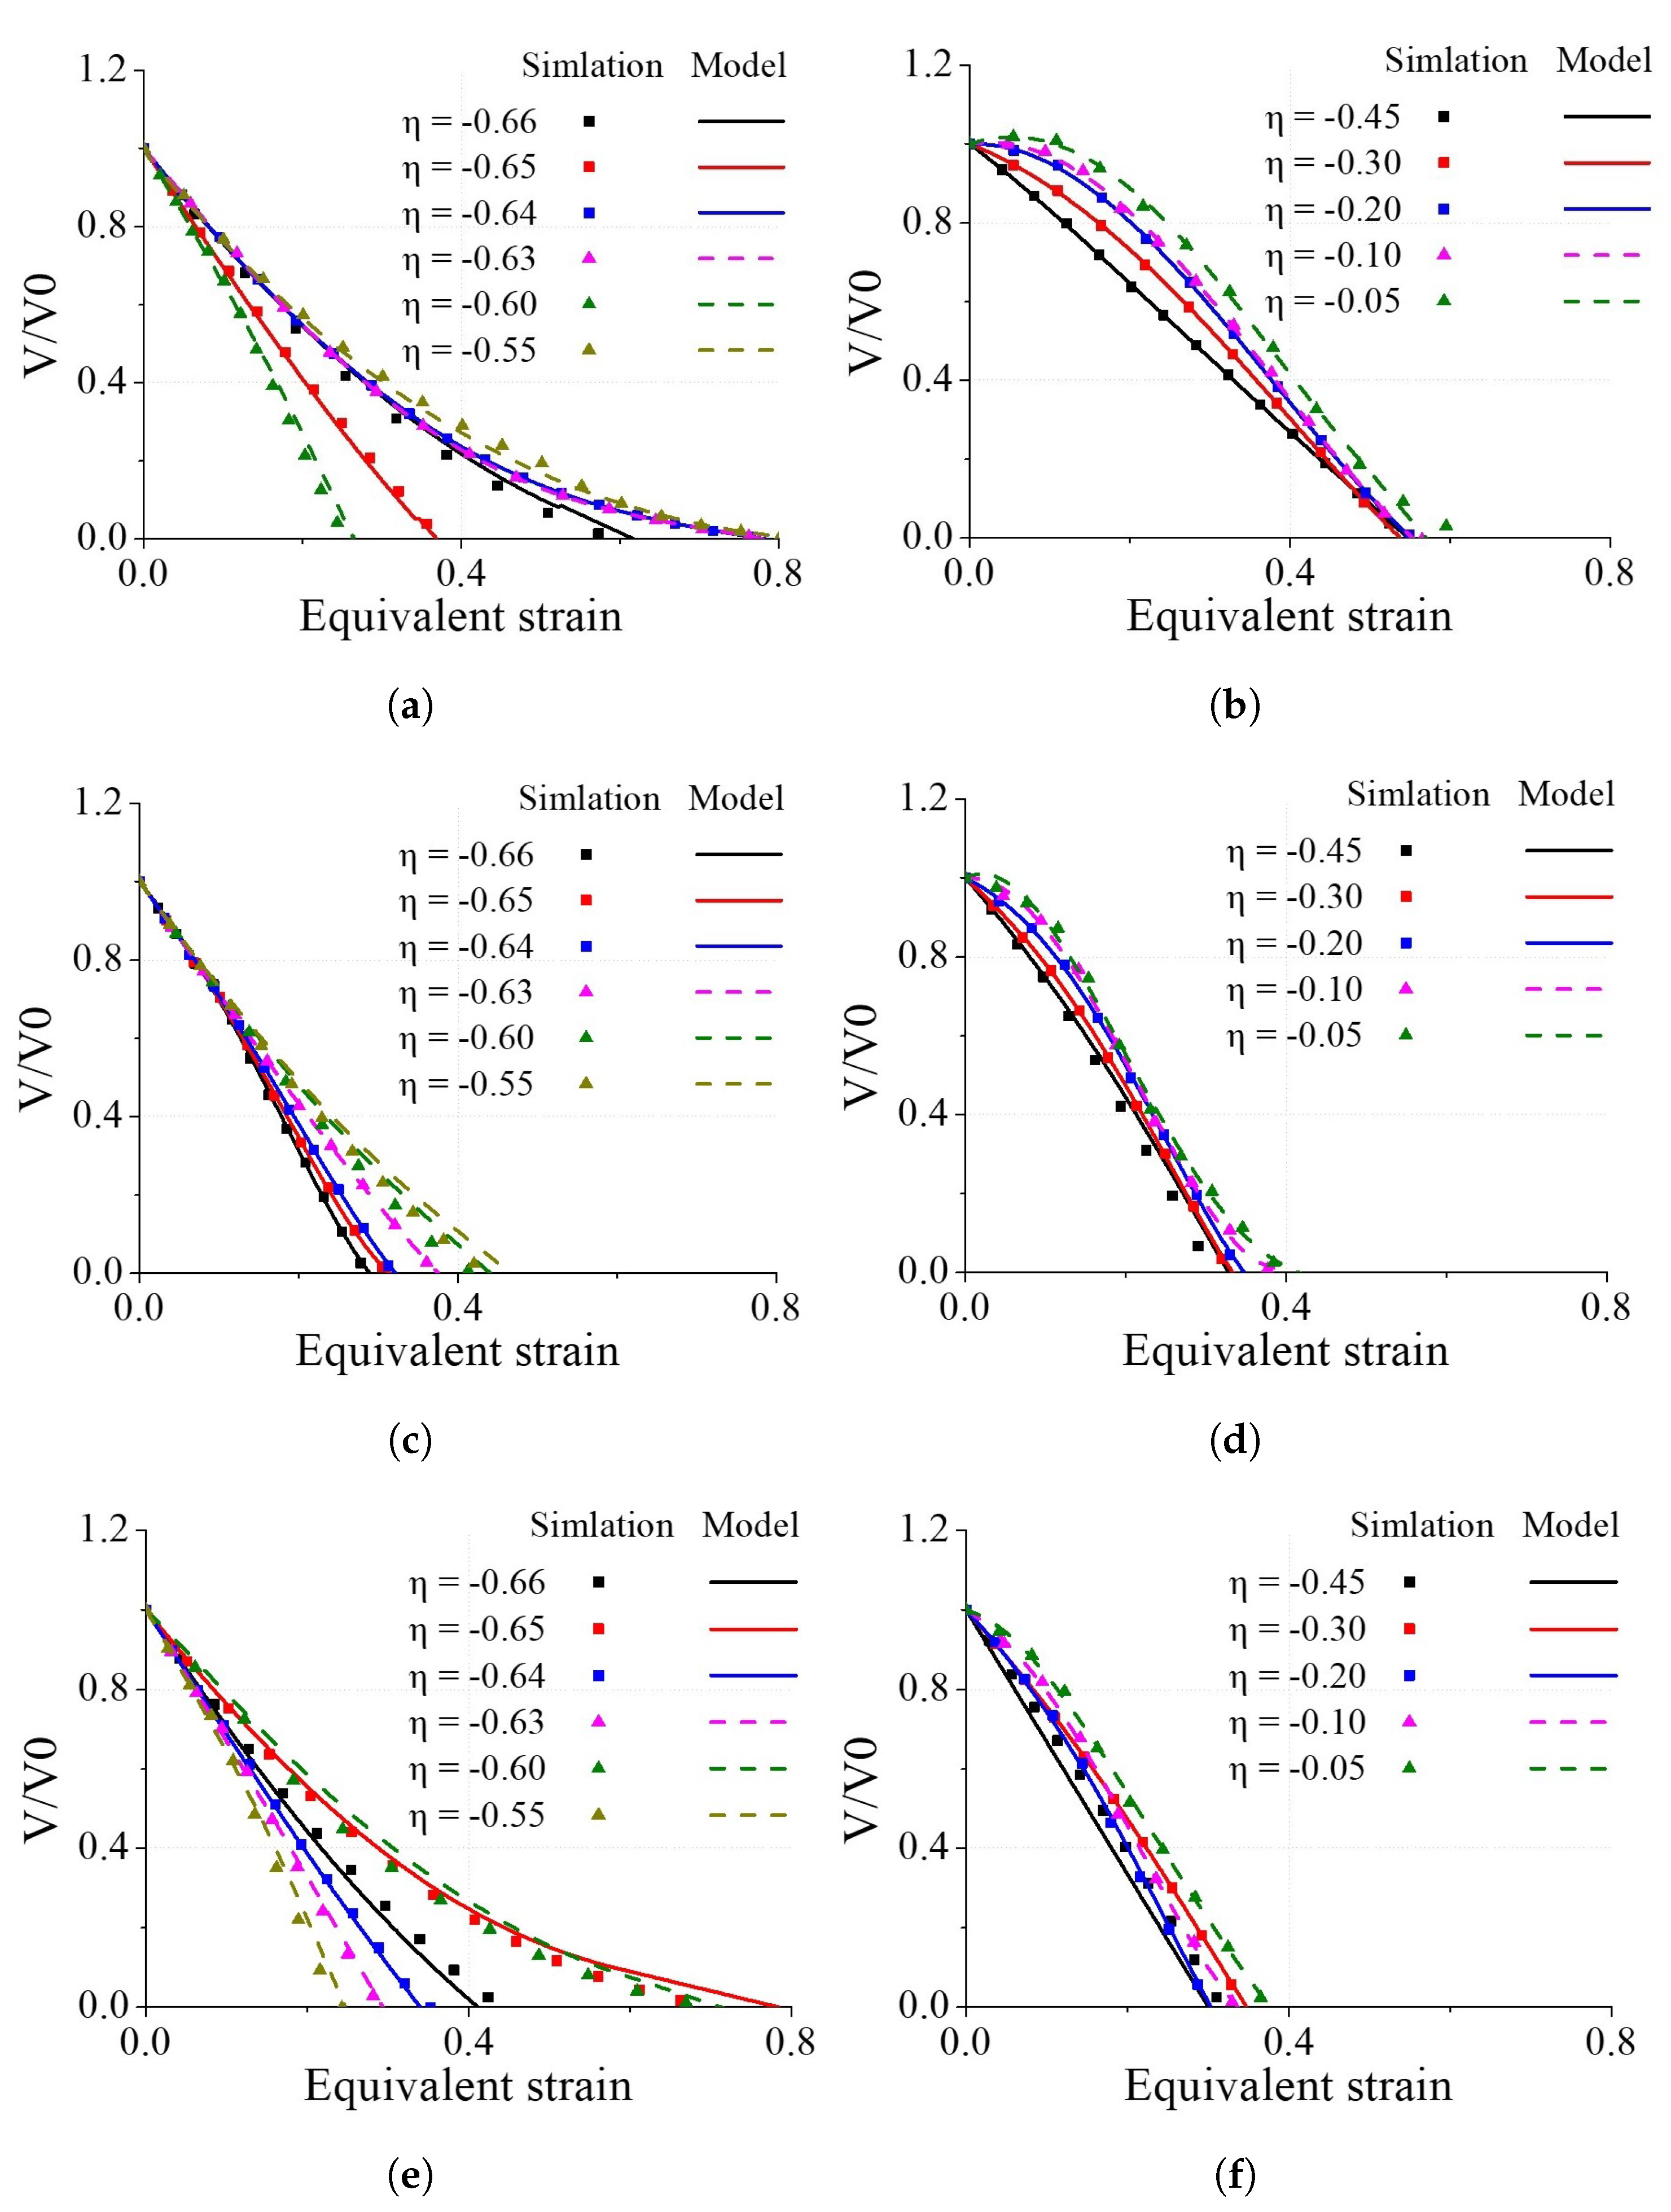
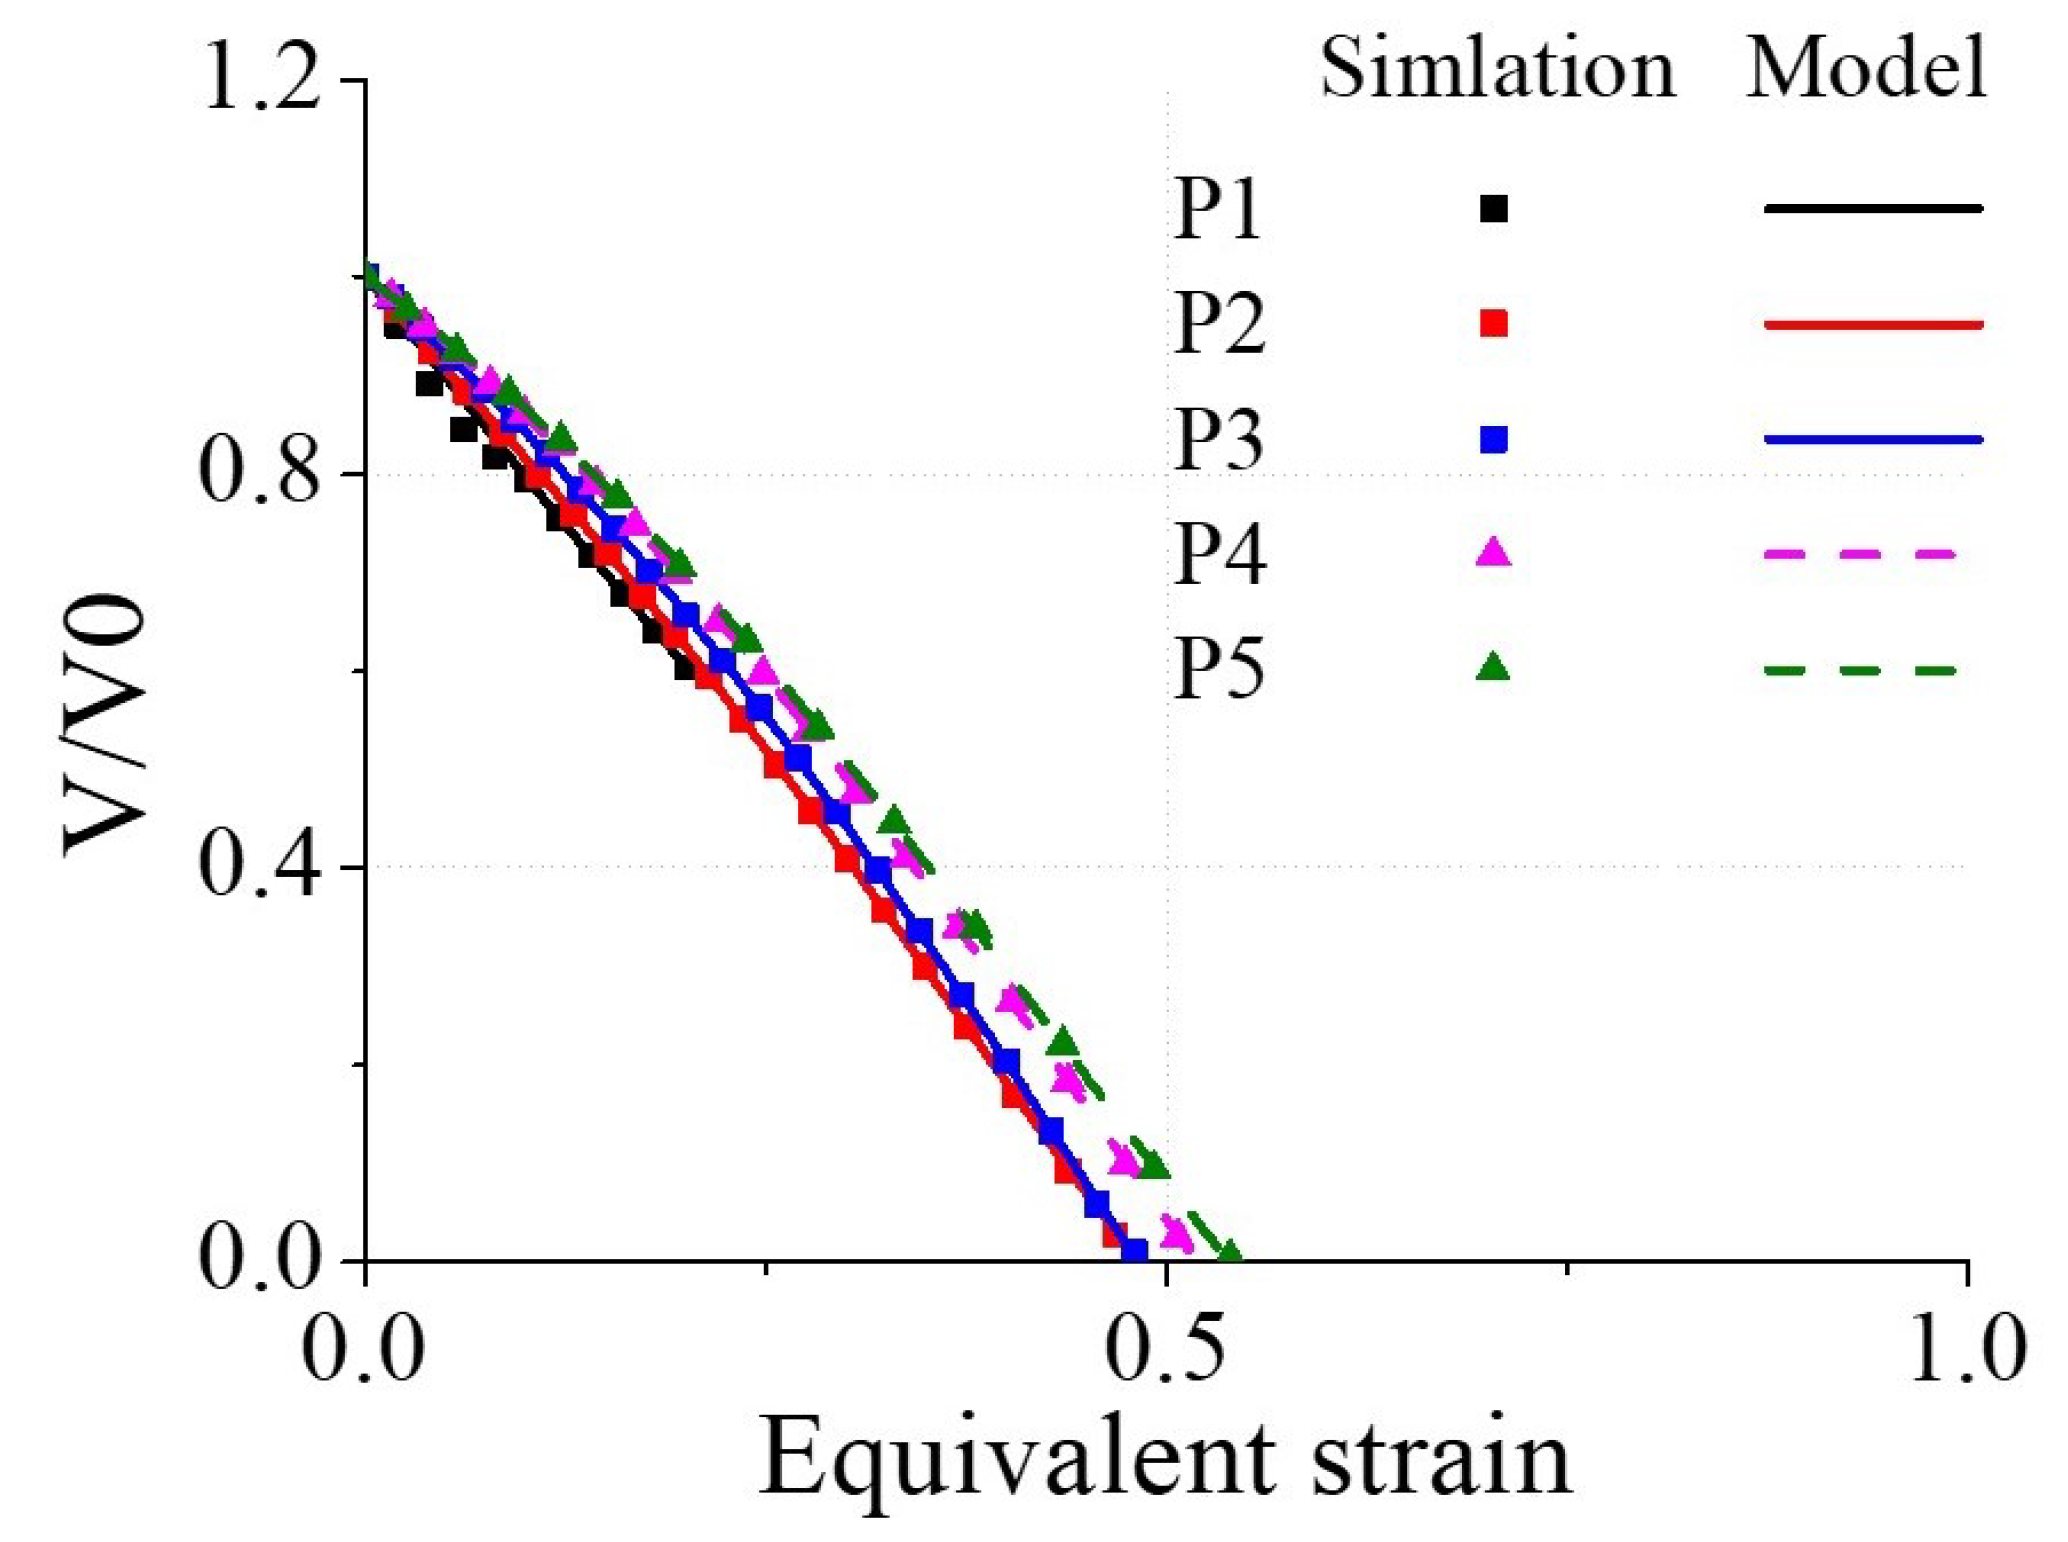
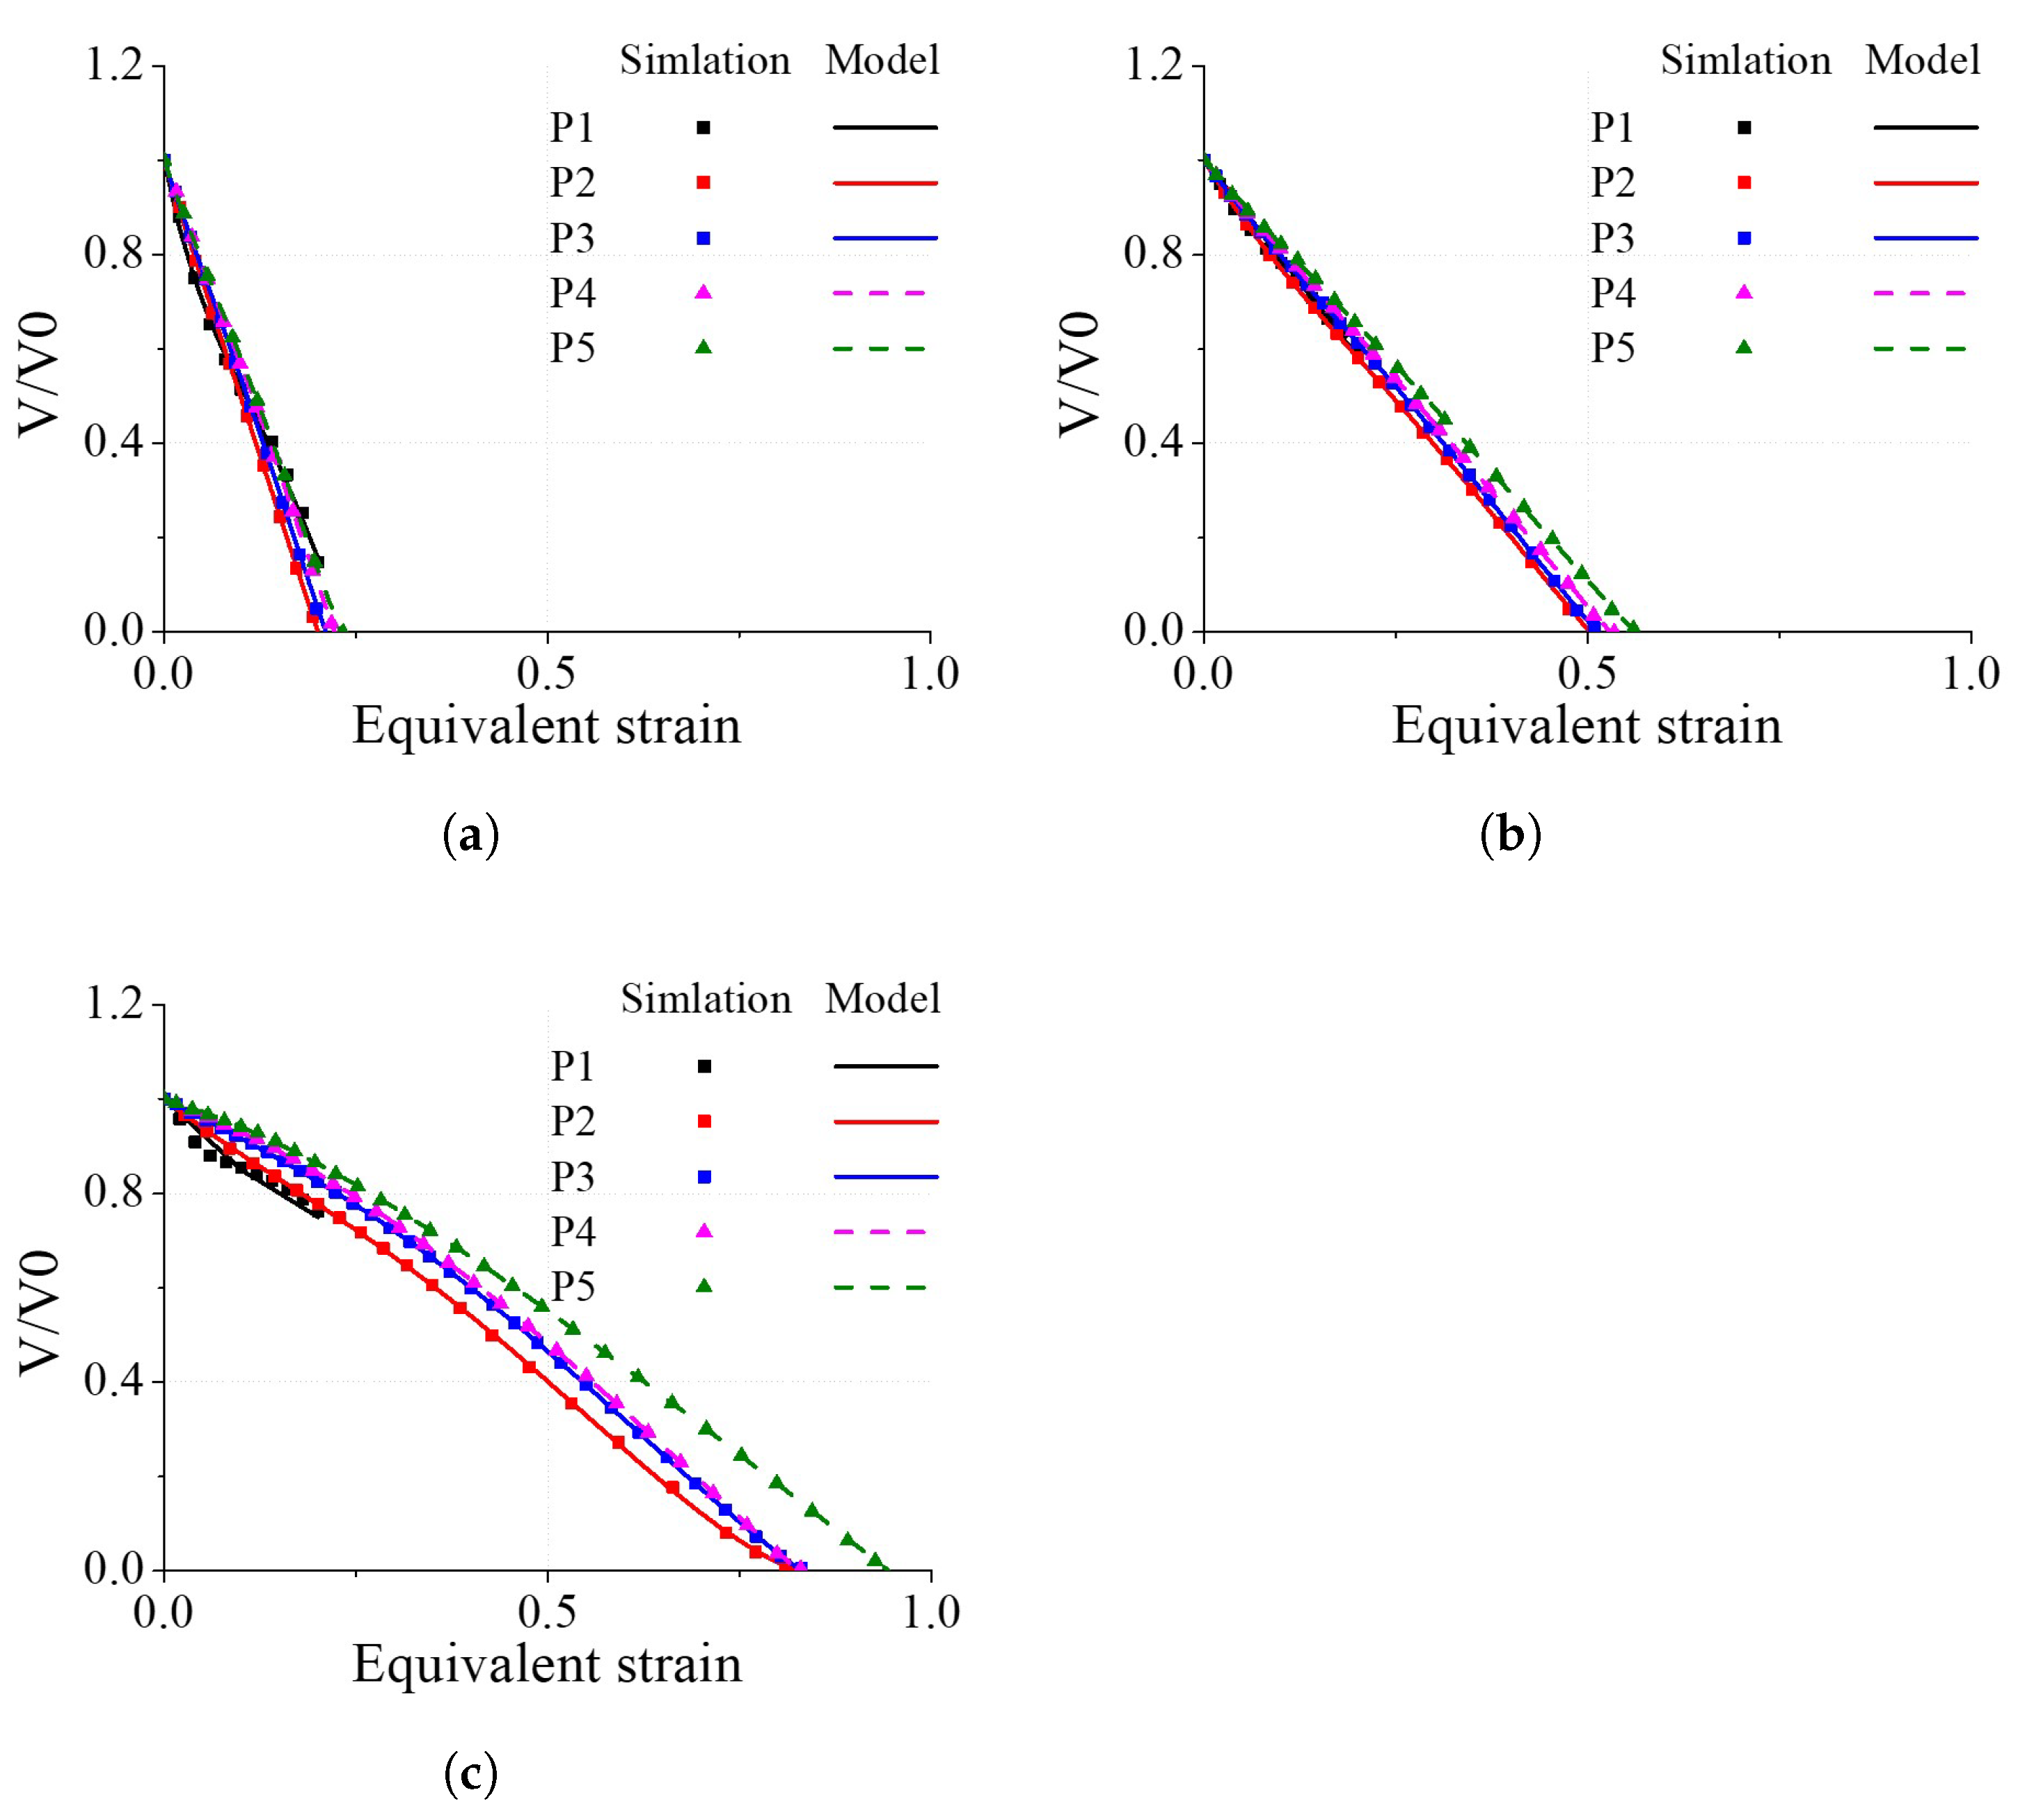
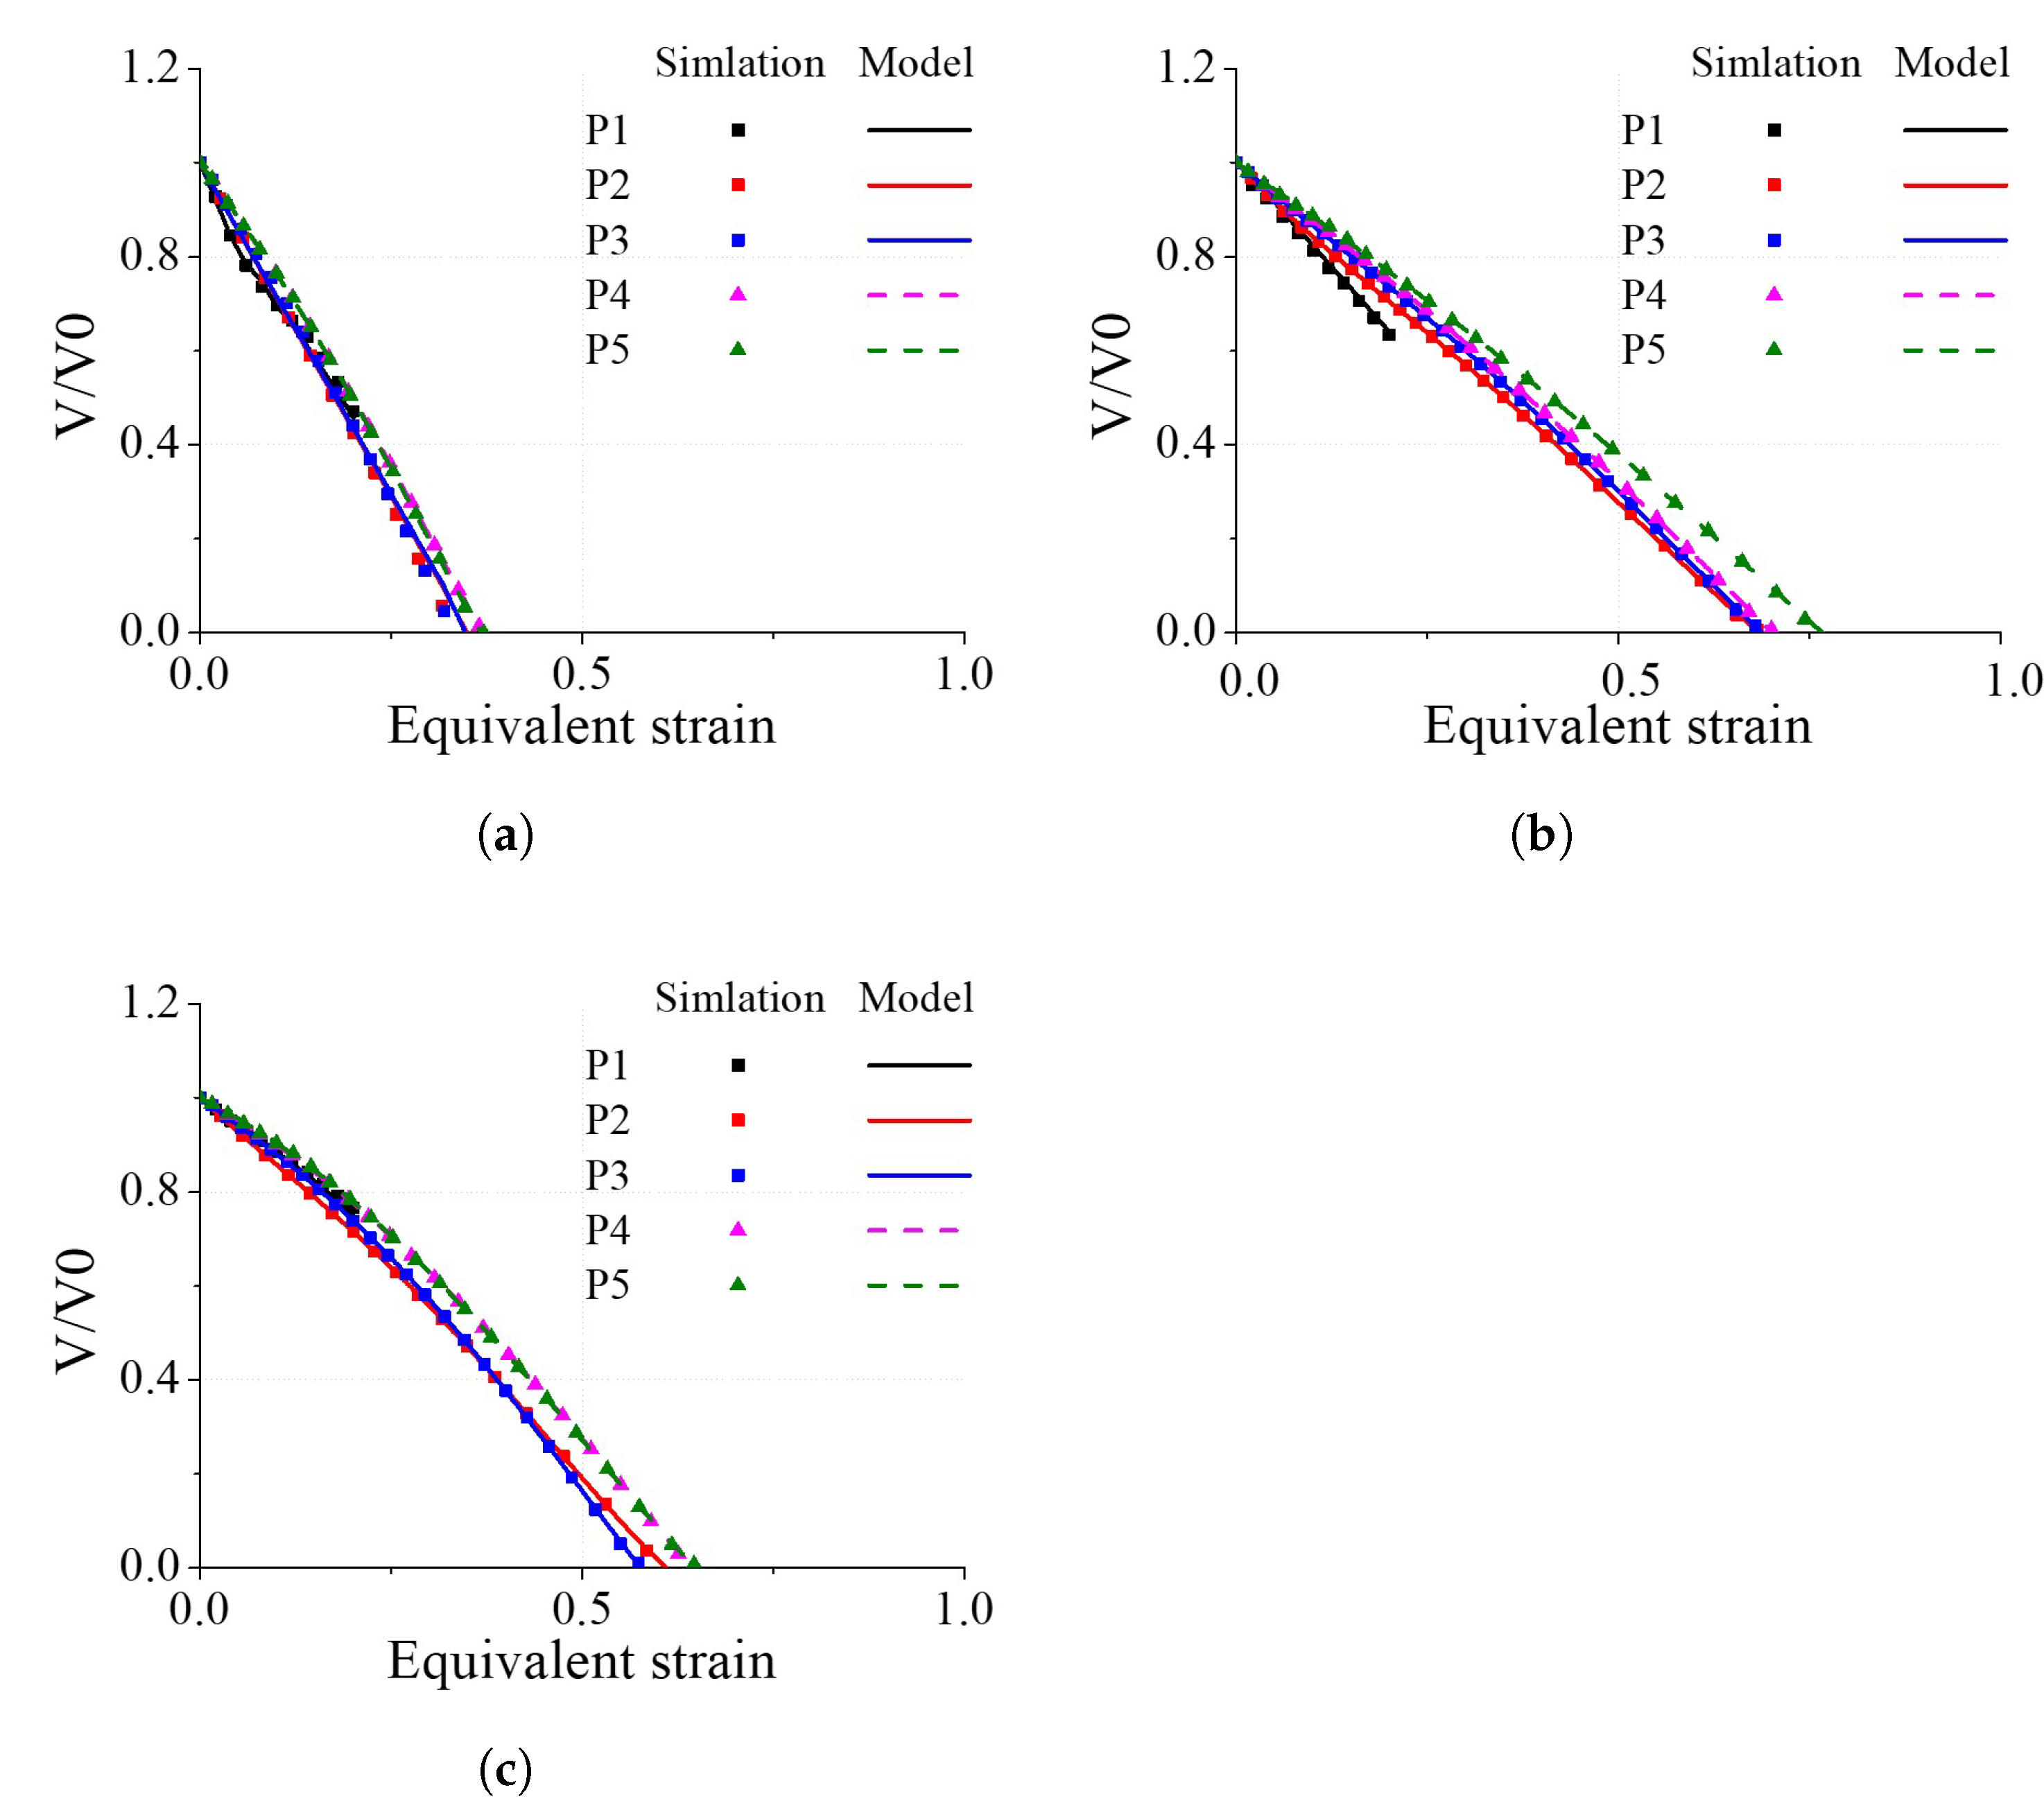
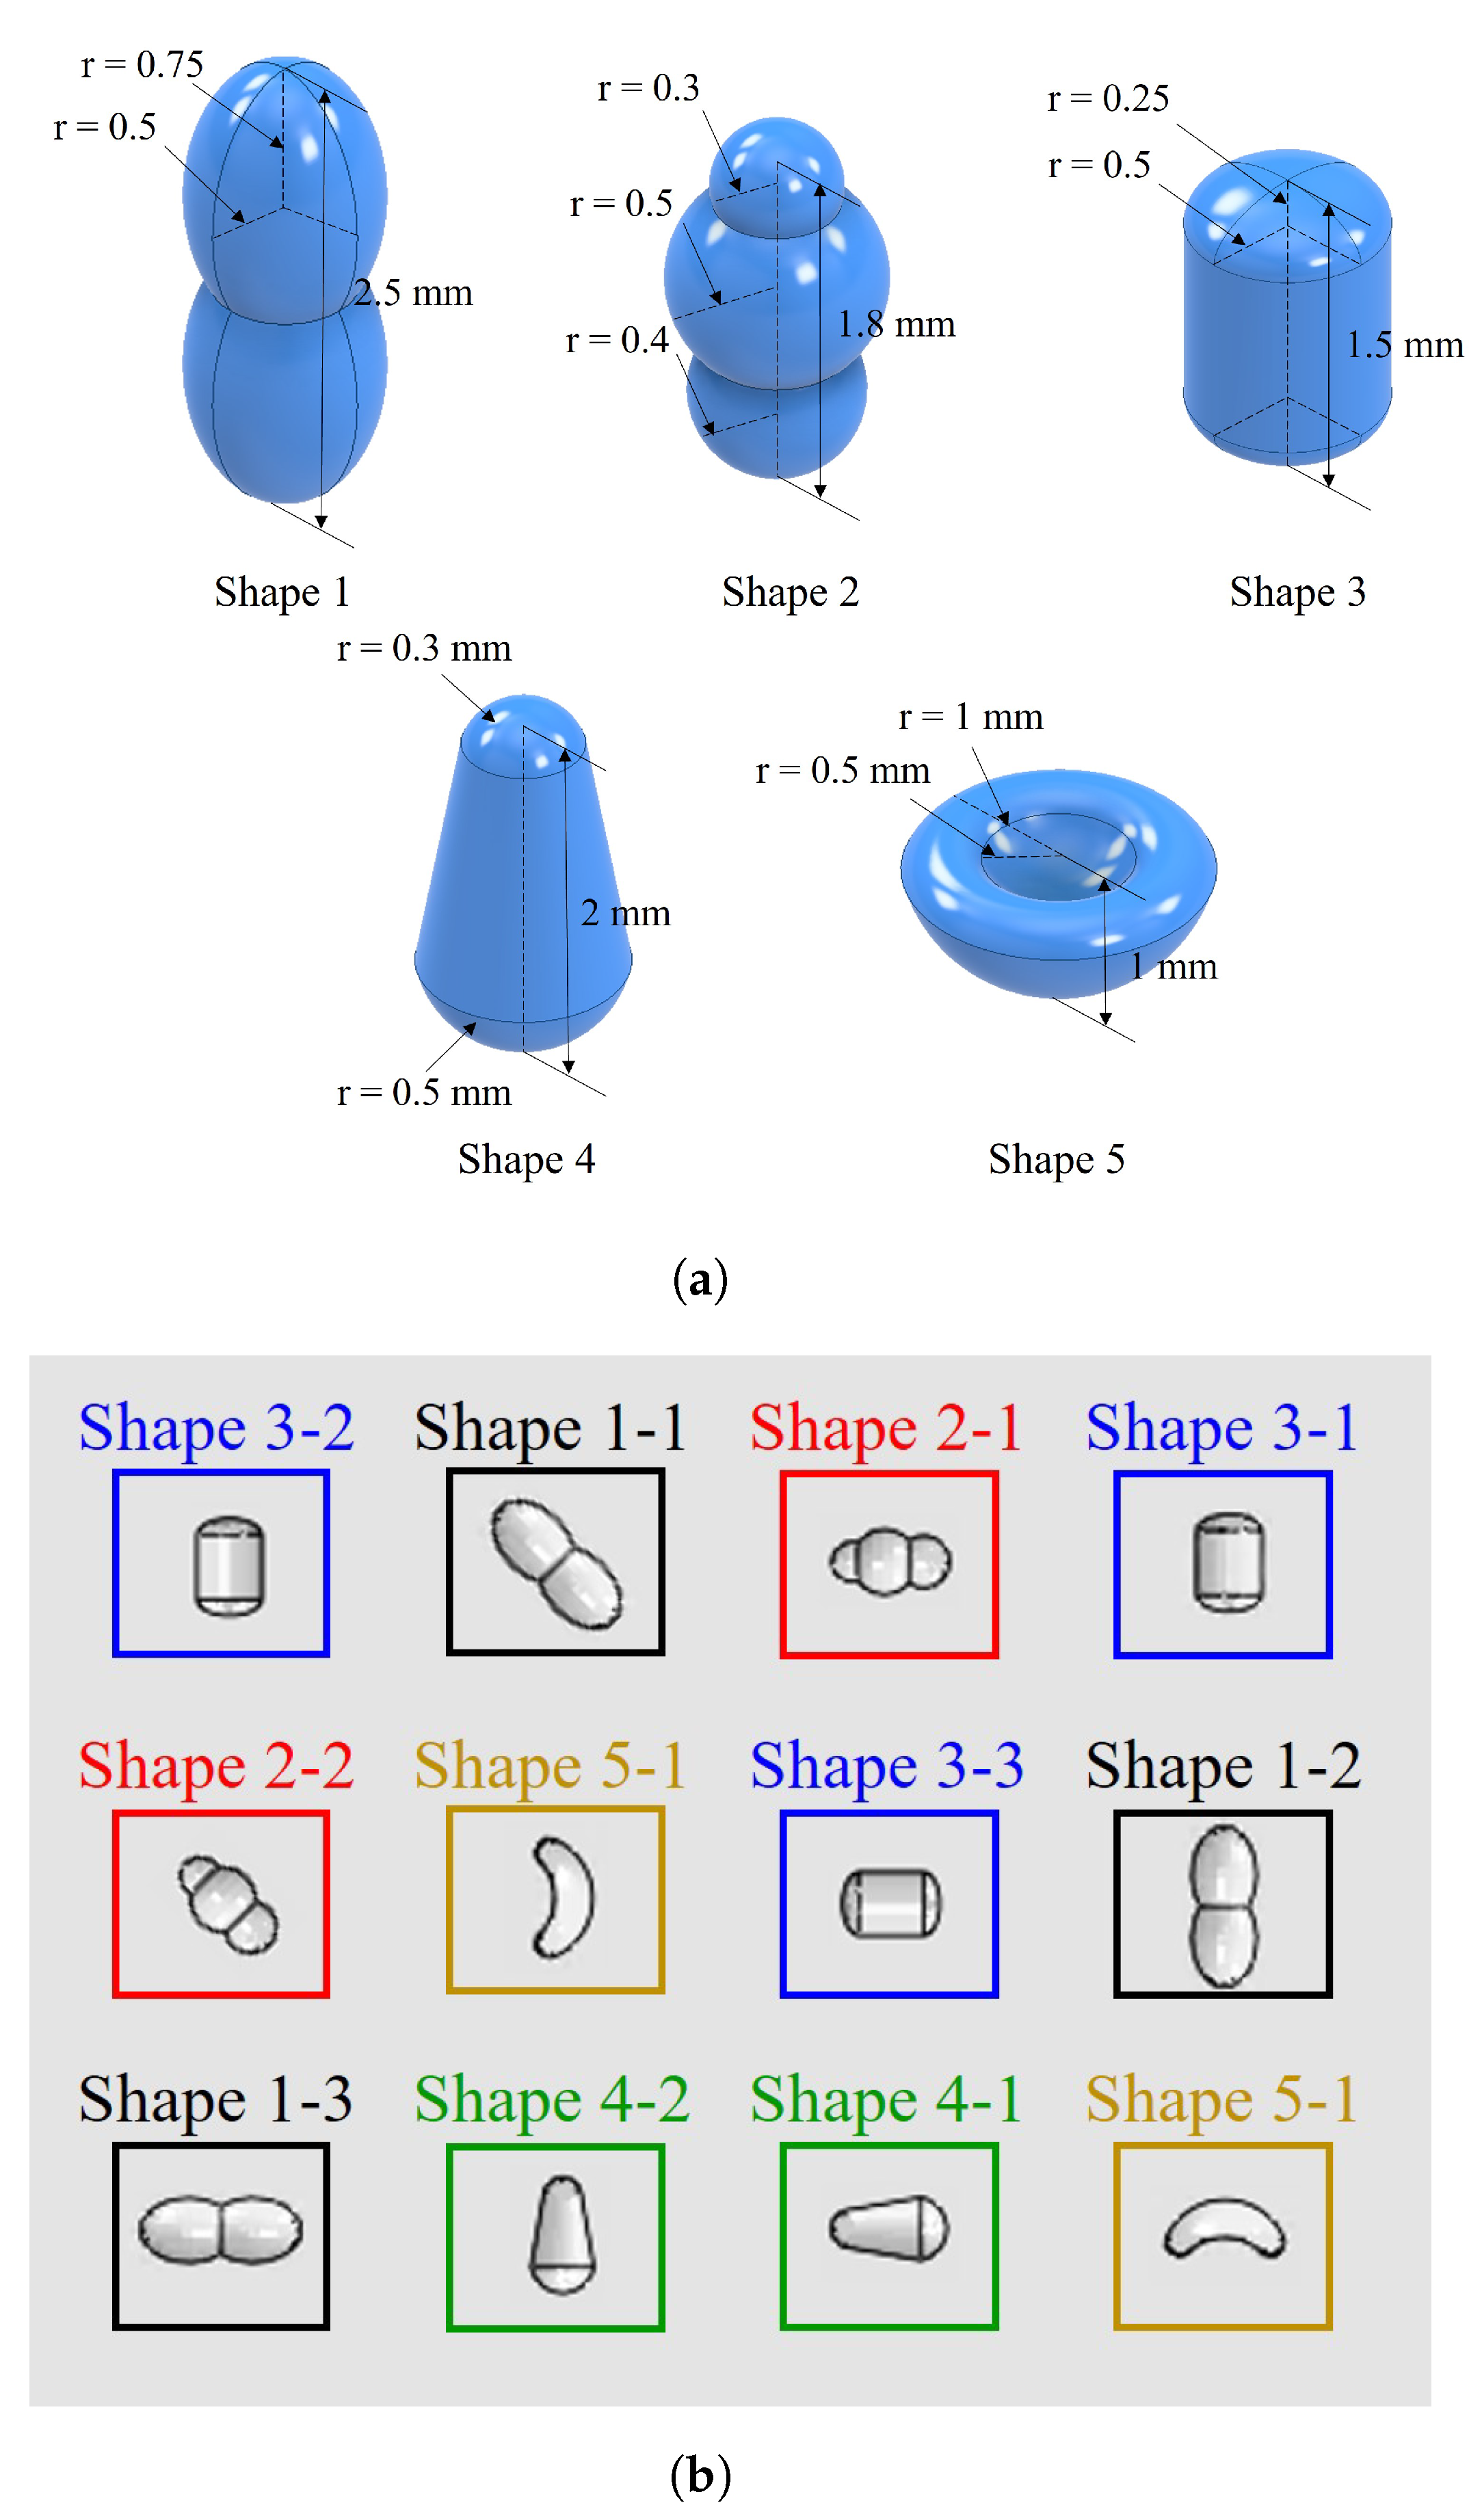
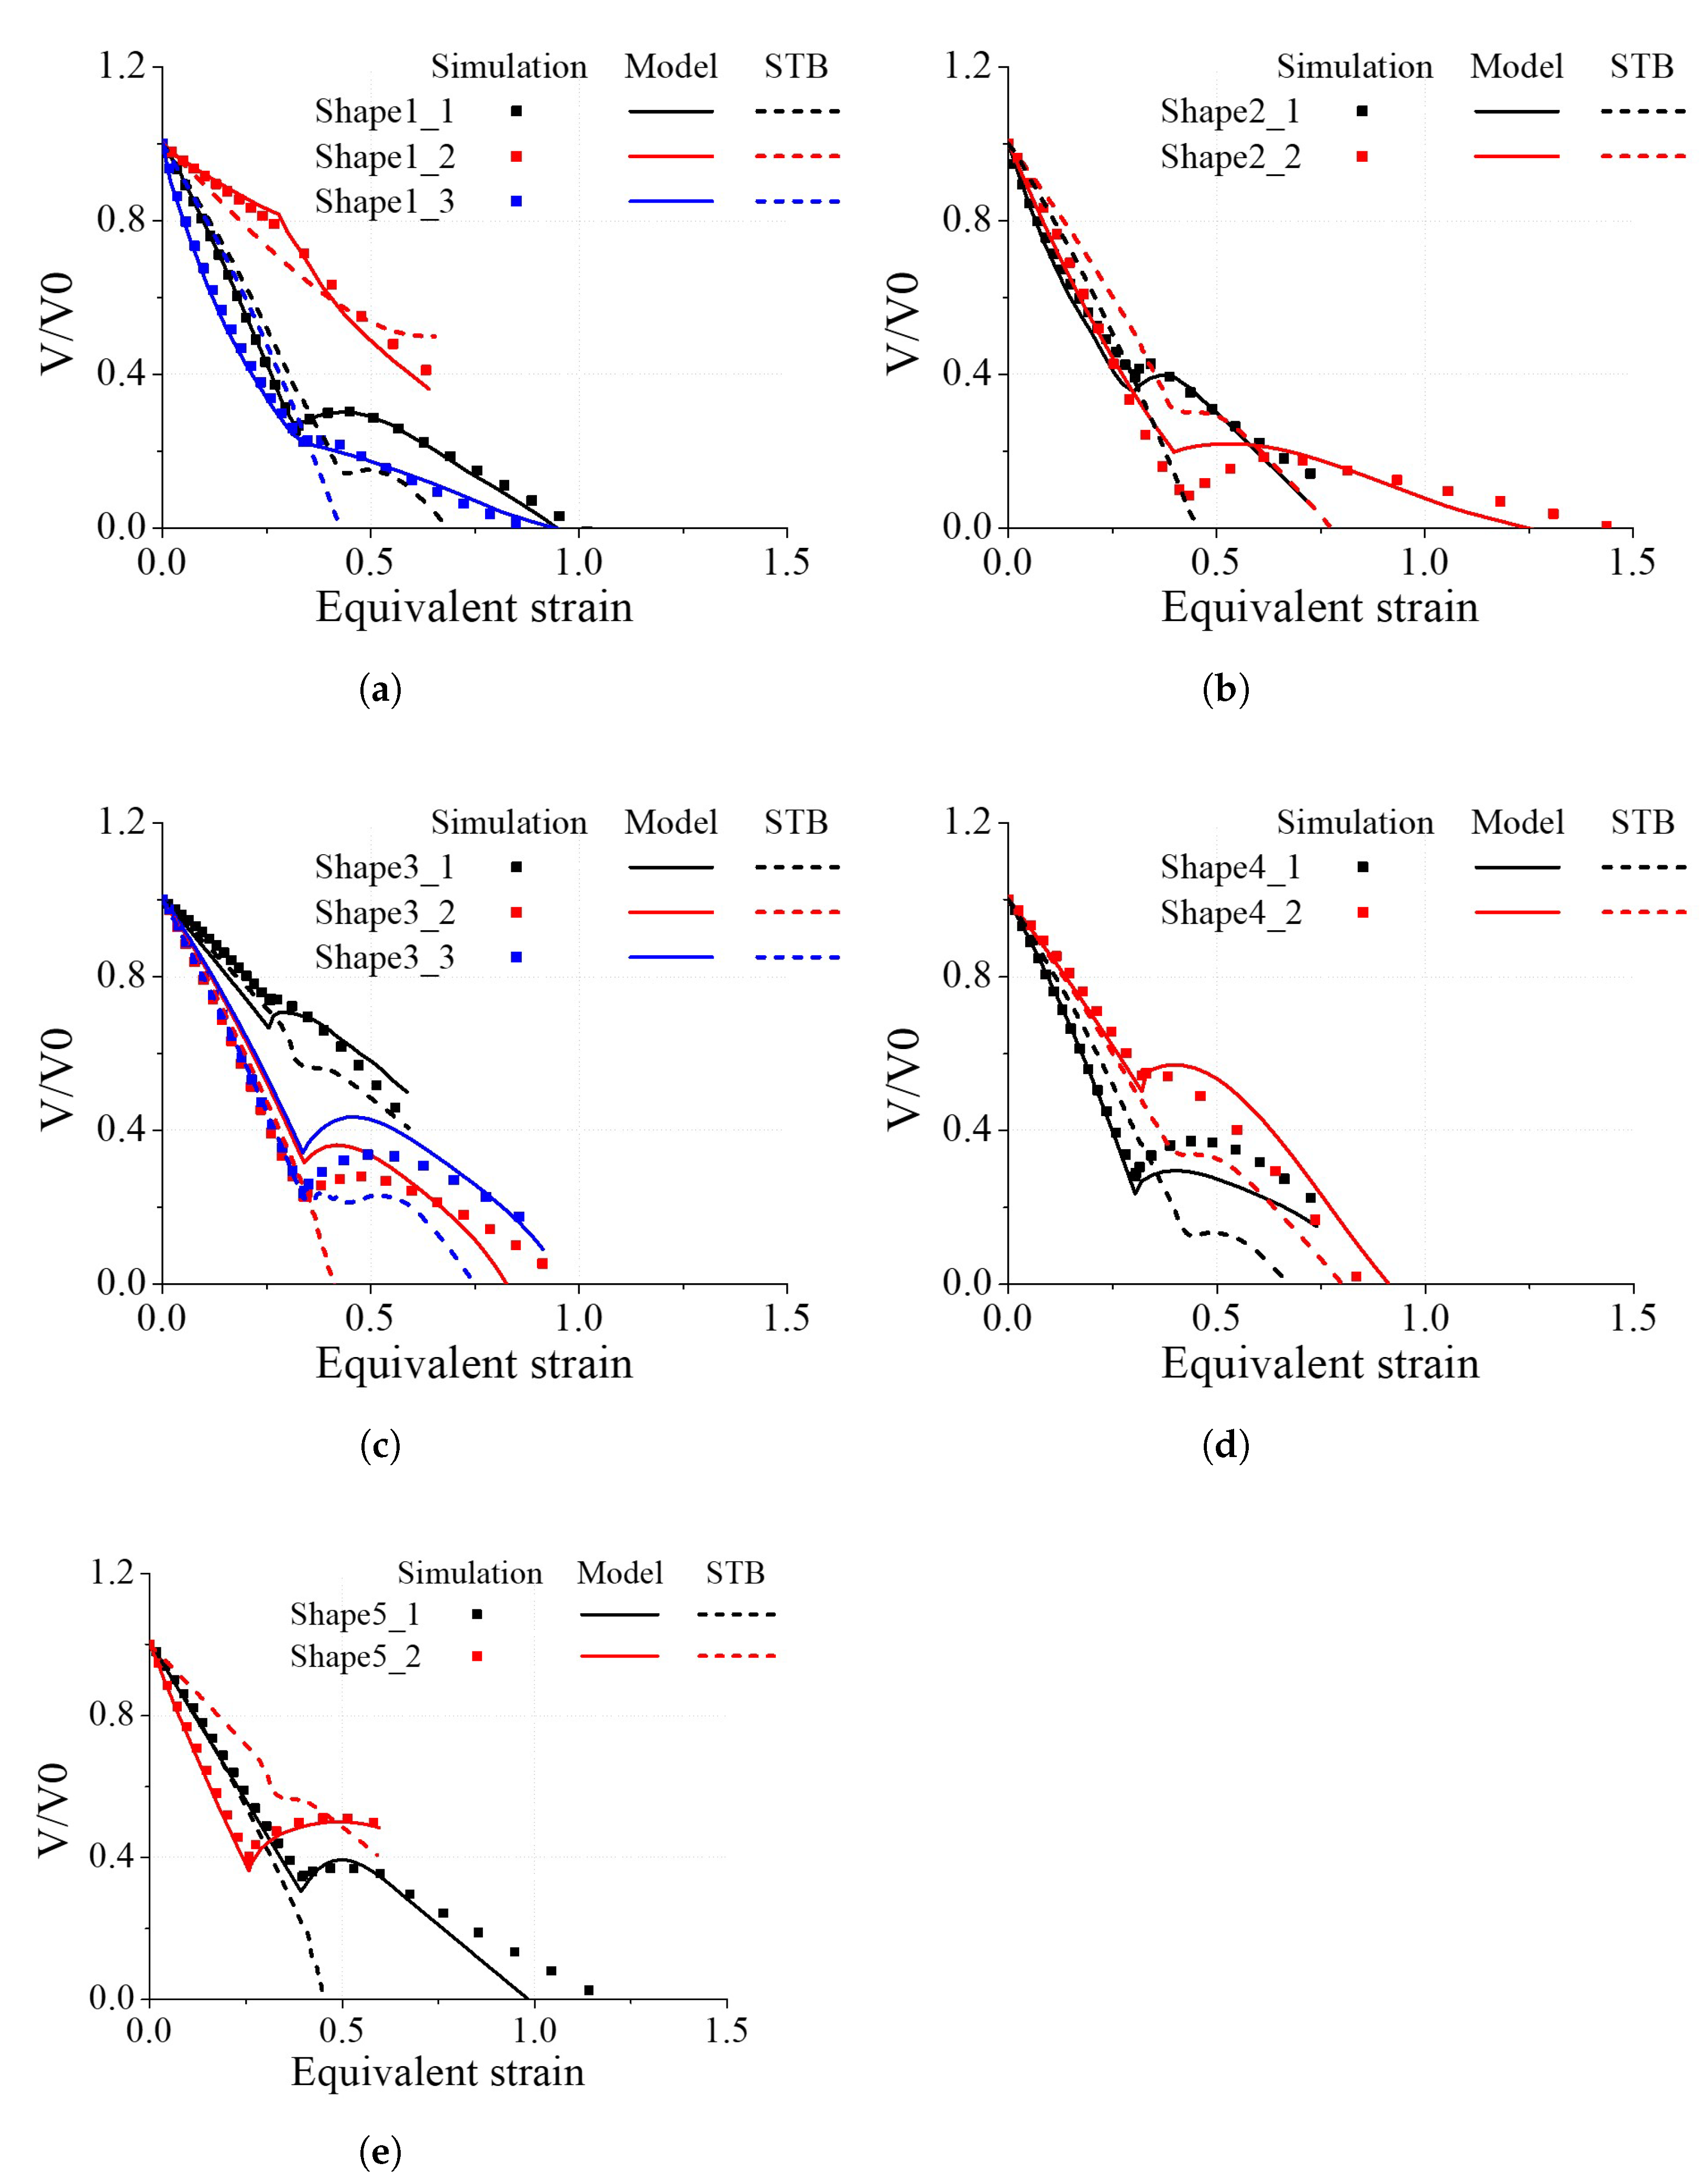
4.1. Void Closure Model Coefficients from RVE Analyses

The RVE analyses described in Section 2 were conducted to determine the coefficients of the void compression model. From the analysis results, the rates of change of the dimensionless void volume and effective strain for the void radius were calculated. The coefficients in Equation (17) were determined through a least square fitting. There were 12 coefficients obtained for each parameter, and fitting was performed for each parameter individually. The derived coefficients are presented in Table A1.
To evaluate the accuracy of the derived void compression model, a comparison was made between the volumes of the voids calculated from the mesh of the RVE and the volumes of the voids calculated using the void compression model. The comparison results for the spherical voids are shown in Figure 4. It was observed that void closure improved as the stress triaxiality decreased, regardless of the Lode angle. The rate of void closure was found to be more sensitive to stress triaxiality when the Lode angle was greater than 0. When the stress triaxiality was 0.66 , the void was completely closed at an effective strain of approximately 0.48 , while, at 0.55 , closure occurred at 1.25 . In contrast, when the Lode angle was less than 0, the influence of stress triaxiality was relatively small. At a stress triaxiality of 0.45 , the void closed at an effective strain of 0.48 . However, at 0.05 , closure occurred at 0.75 , thus indicating that the influence of stress triaxiality was greater when the Lode angle was greater than 0.
The comparison results for Ellipsoid 1 are shown in Figure 5. Figure 5a,b depict the cases where the major axis aligned parallel to the x-axis, while Figure 5c,d represent the cases forming a 45° angle, and Figure 5e,f show the cases forming a 90° angle. Similarly to the spherical voids, it was observed that the influence of stress triaxiality on void closure was greater when the Lode angle was greater than 0, even for this ellipsoidal shape. Unlike the spherical voids, however, having lower stress triaxiality did not necessarily result in faster void closure. This is because the principal compression direction changes from the major axis to the minor axis, or vice versa, as the stress triaxiality varies. In the case shown in Figure 5a, where the major axis aligned parallel to the x-axis and the Lode angle was greater than 0, there was a phenomenon where the void closure rate decreased for a certain void volume, which depended on the stress triaxiality. This trend was particularly pronounced for the stress triaxiality values of 0.64 and 0.63 . In the case depicted in Figure 5b, where the Lode angle was less than 0, there was a phenomenon where the void volume initially increased and then decreased for specific stress triaxiality values. This was particularly evident for the case with a stress triaxiality of 0.05 . The deformation characteristics when the void volume briefly increased indicated that the compression was significant along the major axis of the ellipsoid, with minimal deformation occurring along the other axis. In cases exhibiting similar deformation patterns, it was observed that the void closure rate was slower during the initial deformation compared to the later stages. For the case where the major axis of the ellipsoid formed a 45° angle with the x-axis, the void closure rate was higher than that for the spherical voids. The influence of stress triaxiality on the void closure rate was opposite to that of the spherical voids, with a smaller impact when the Lode angle was greater than 0. When the major axis formed a 90° angle, the influence of stress triaxiality on the void closure rate was similar to that of the spherical voids, wherein it was more pronounced when the Lode angle was greater than 0.
The comparison results for Ellipsoid 2 are shown in Figure 6. Similarly to Figure 5, Figure 6a,b depict the cases where the major axis aligned parallel to the x-axis, Figure 6c,d represent the cases forming a 45° angle, and Figure 6e,f show the cases forming a 90° angle. Overall, the void closure behaviour exhibited a similar trend to Ellipsoid 1, with the influence of stress triaxiality and the Lode angle varying with the angle of the major axis. Furthermore, as discussed for Ellipsoid 1, there was no clear correlation between stress triaxiality and the void closure rate. In the case shown in Figure 6b, where the major axis aligned parallel to the x-axis, and the Lode angle was less than 0, as with Ellipsoid 1, there was a phenomenon where the void volume initially increased for specific stress triaxiality values. However, compared to Ellipsoid 1, where the void volume increase reached a maximum of 18%, for Ellipsoid 2, with smaller aspect ratios, this limited the void volume increase to 5%. The calculated void volume ratios from the RVE analysis results and the void compression model exhibited strong correlations. Remarkably, the model accurately captured the increasing trend of the void volume.

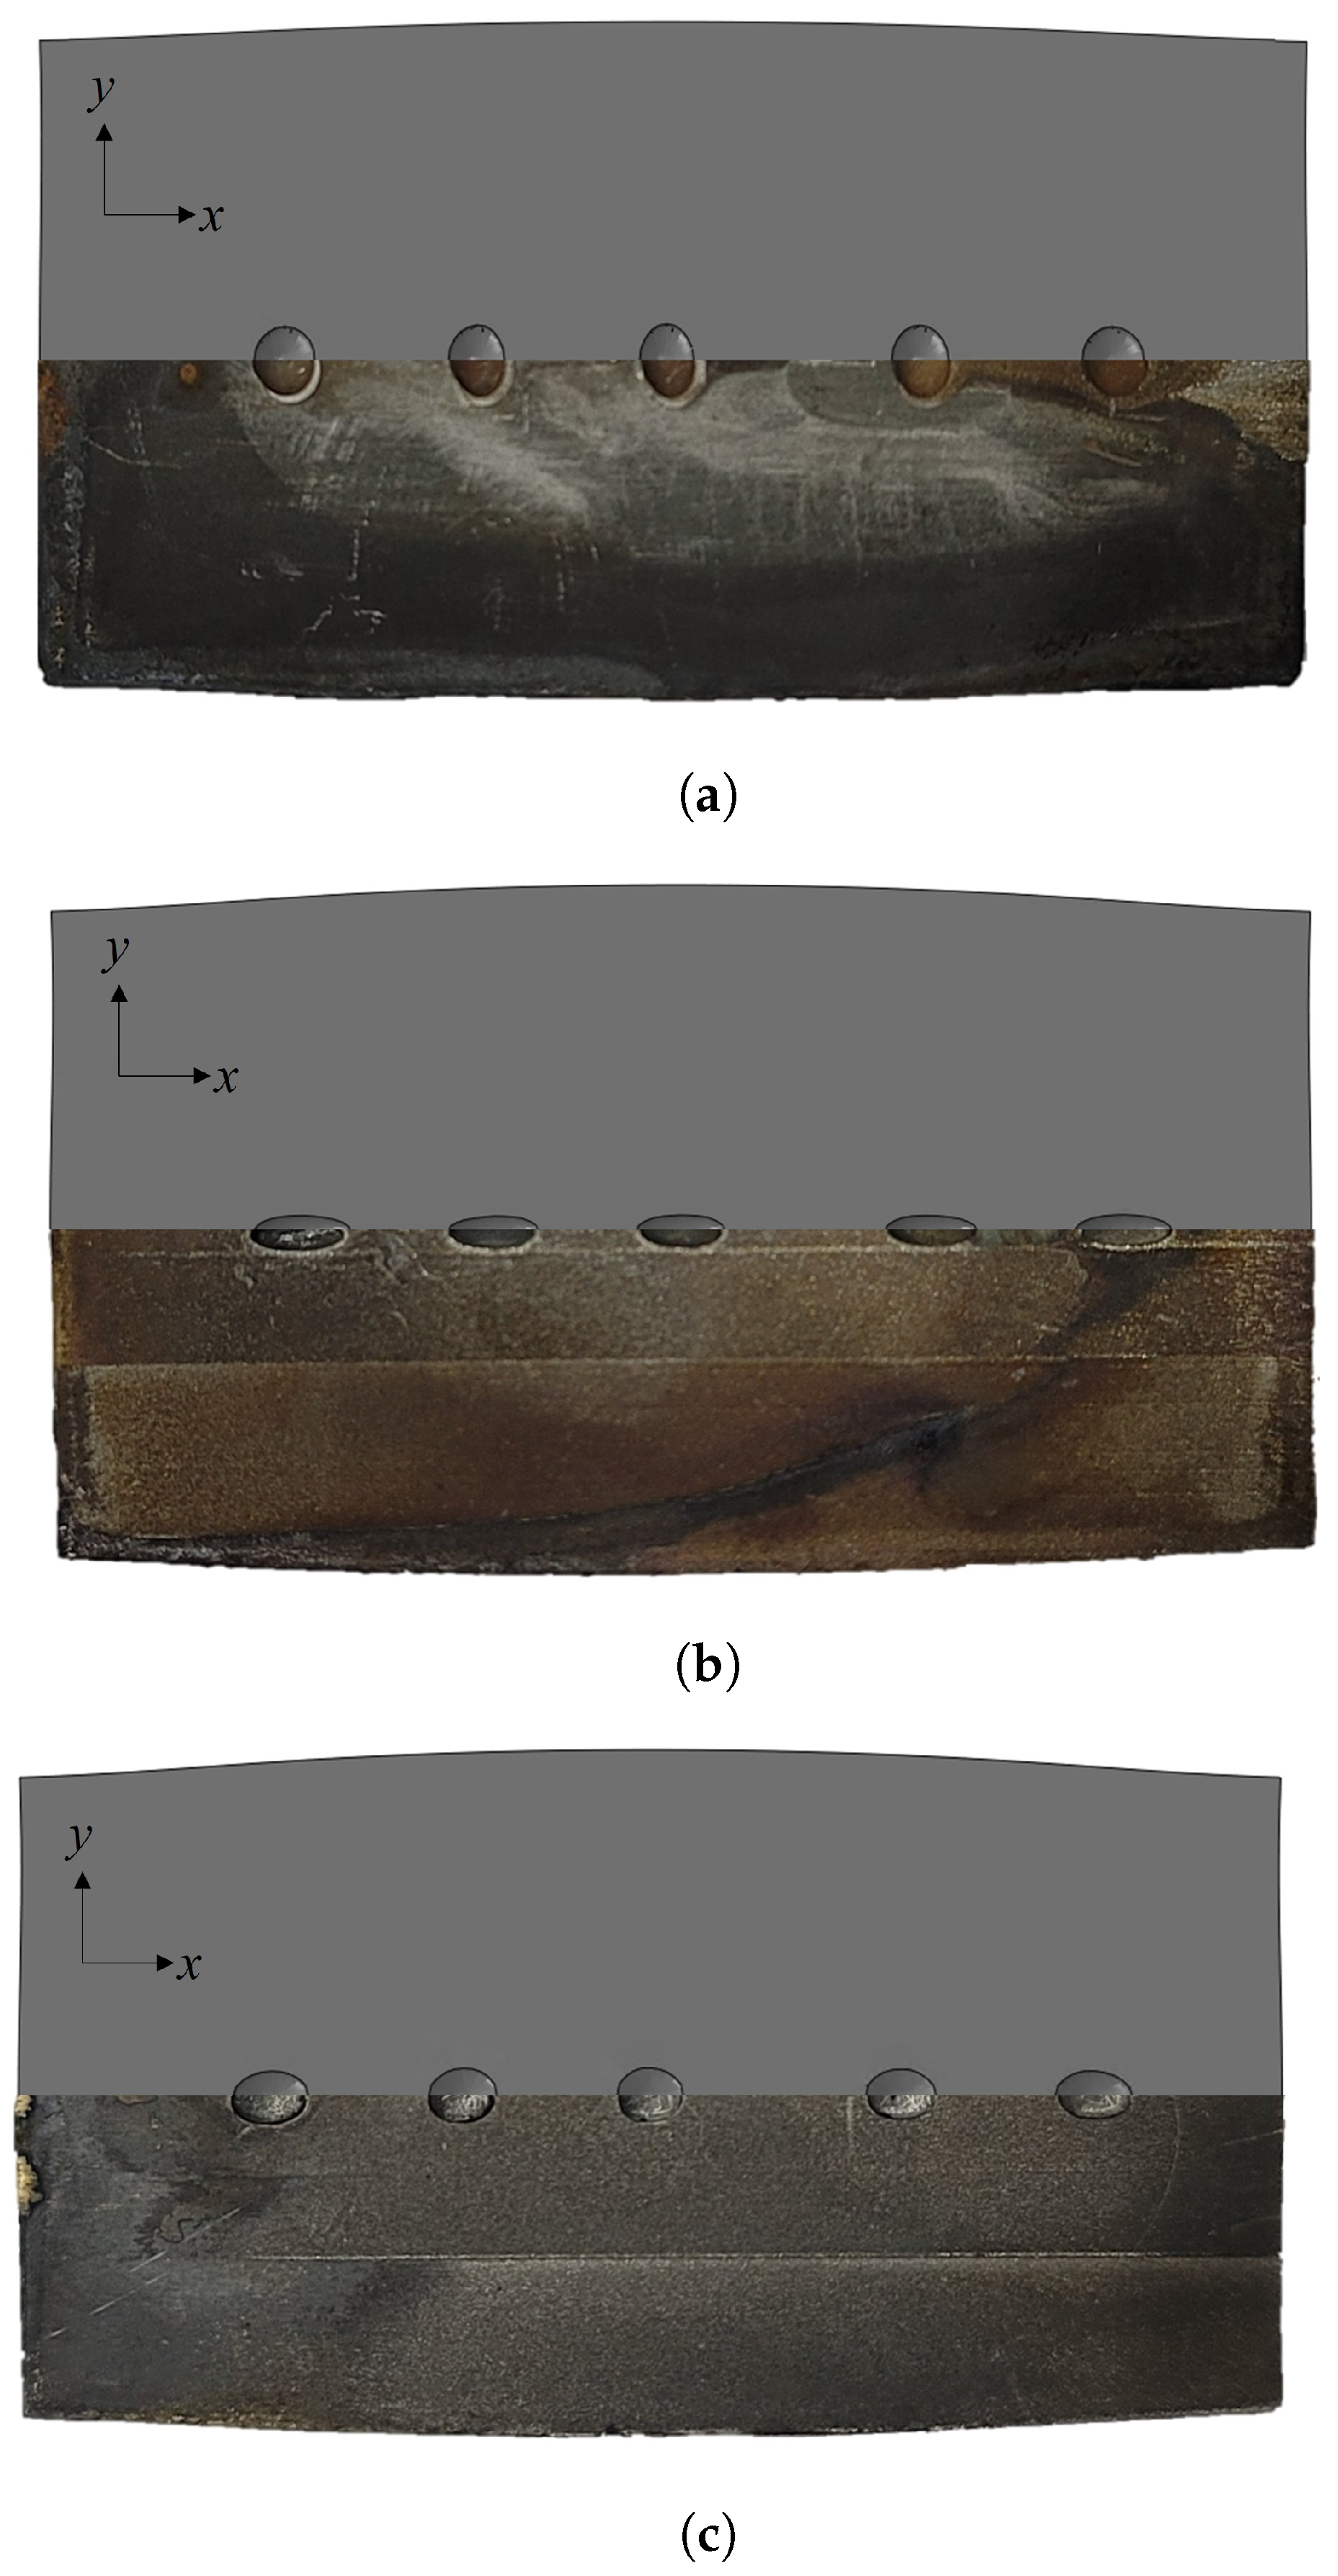
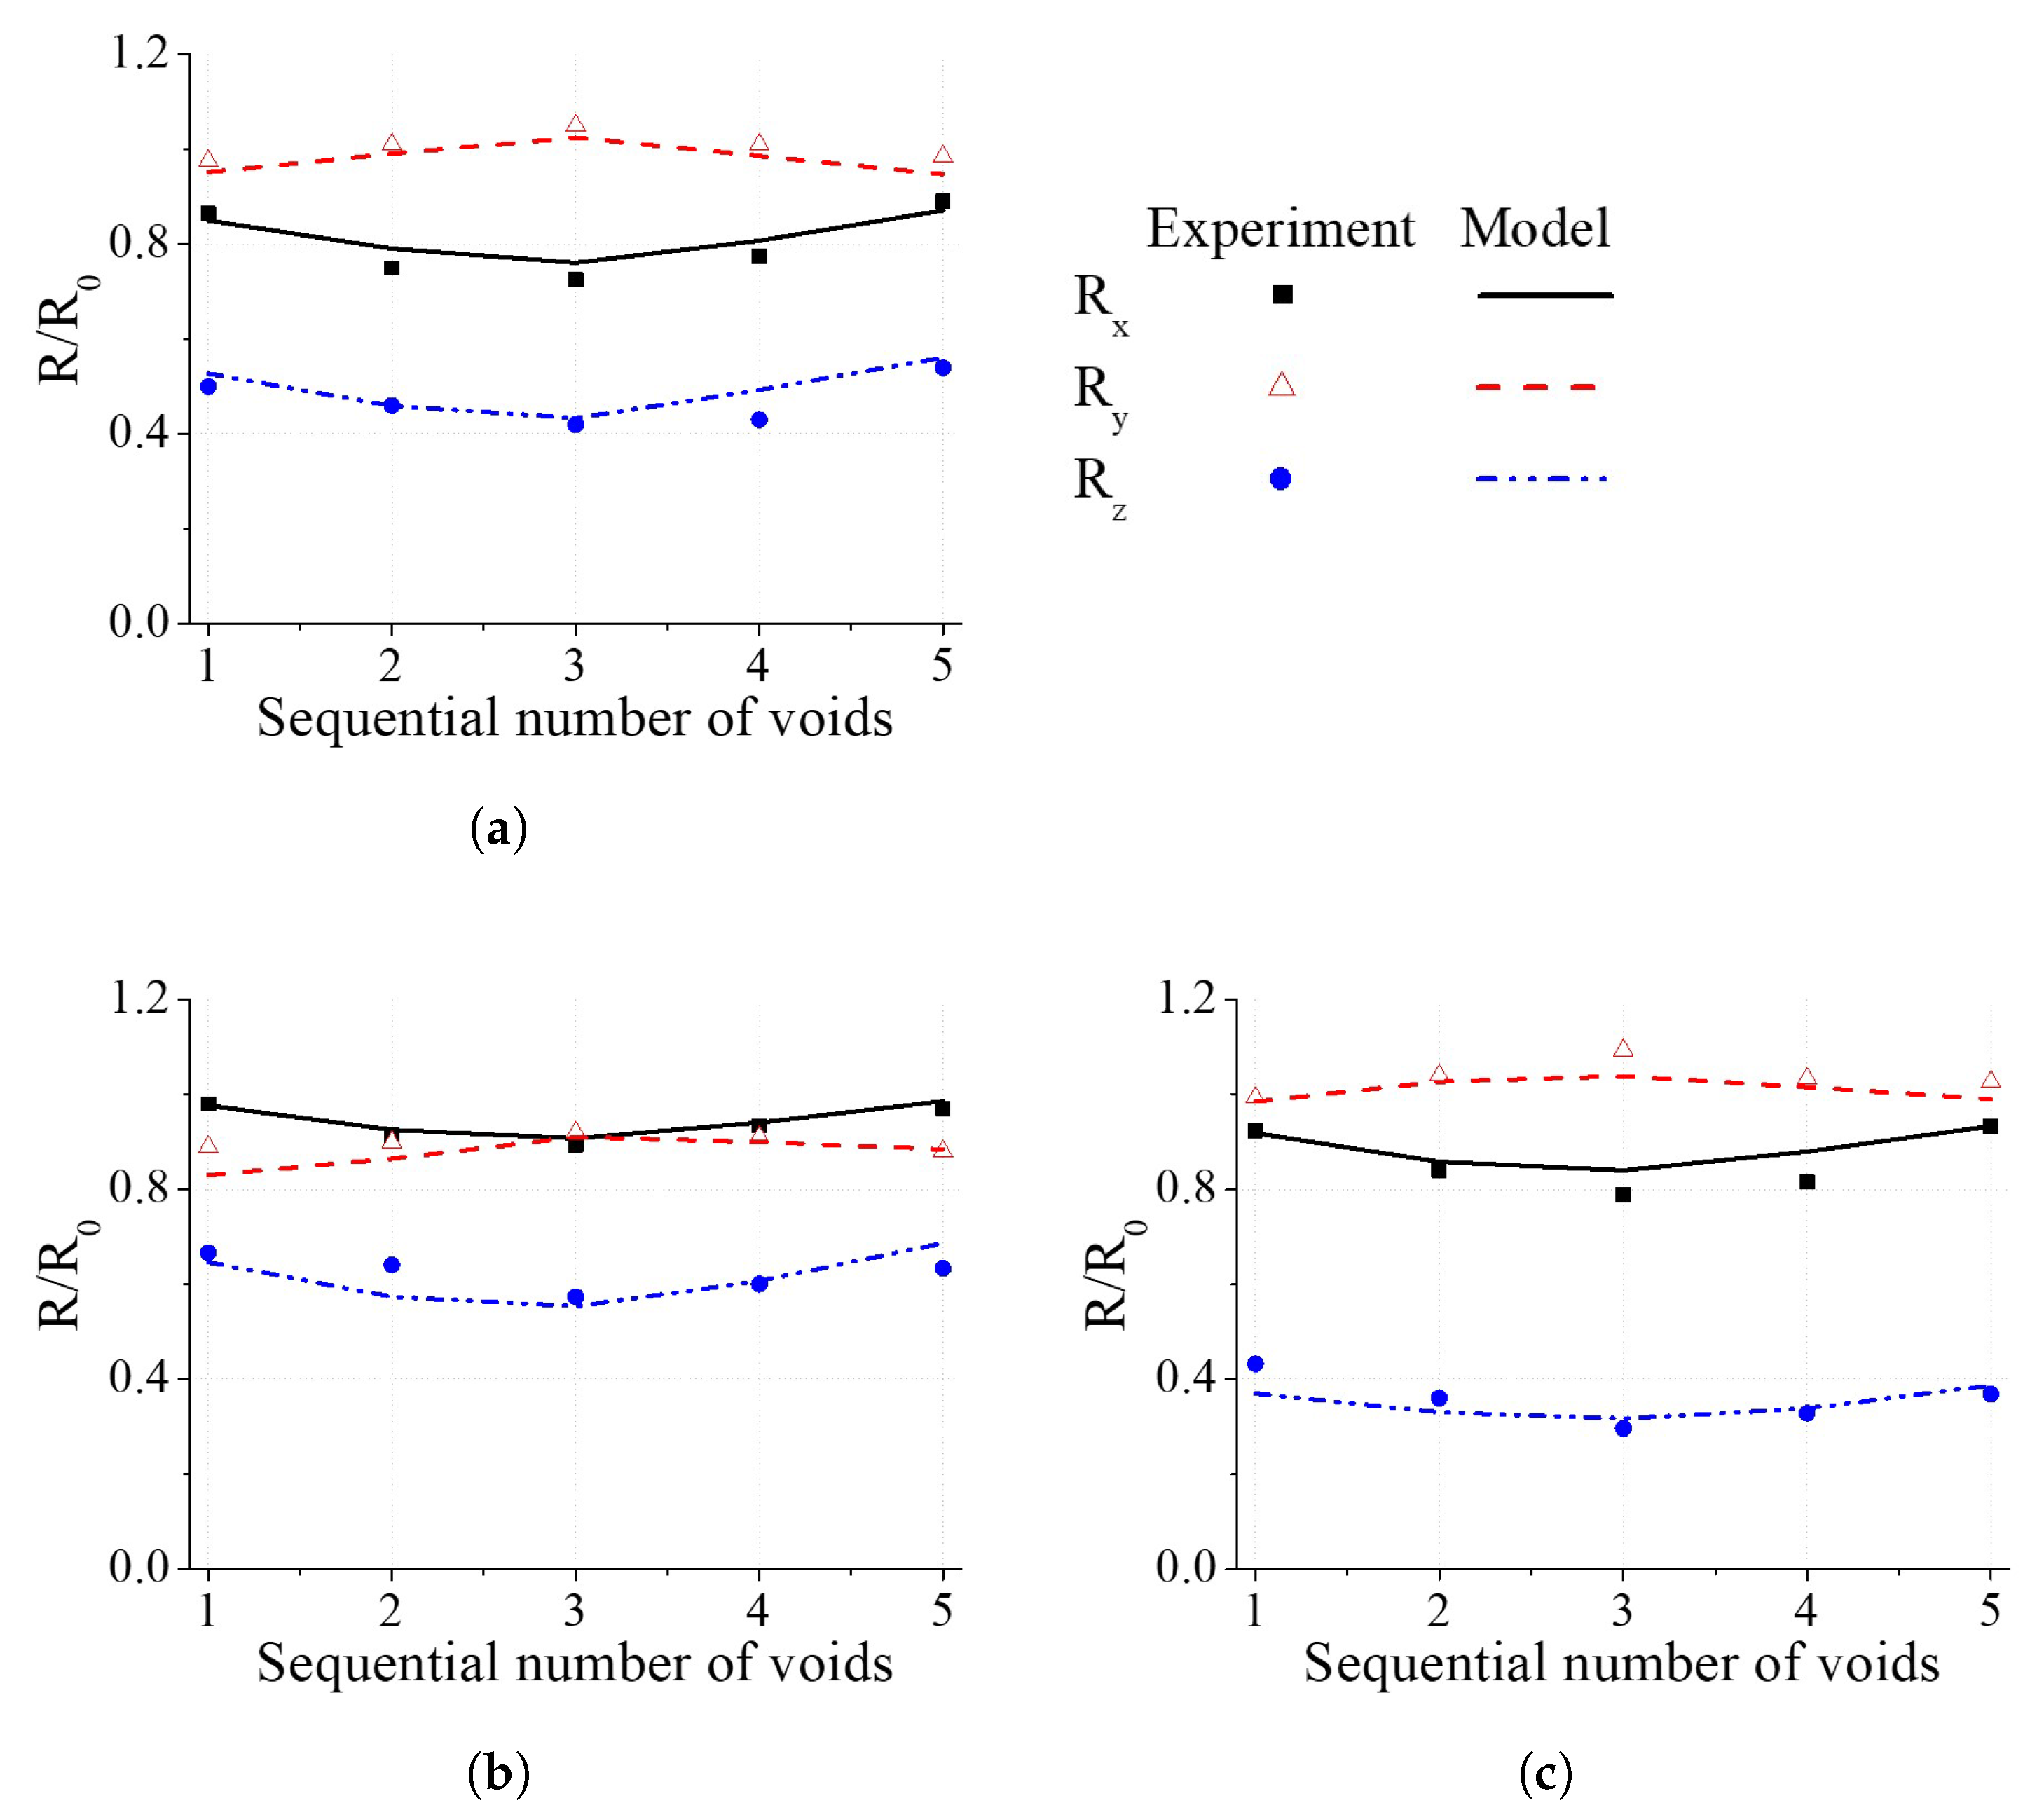
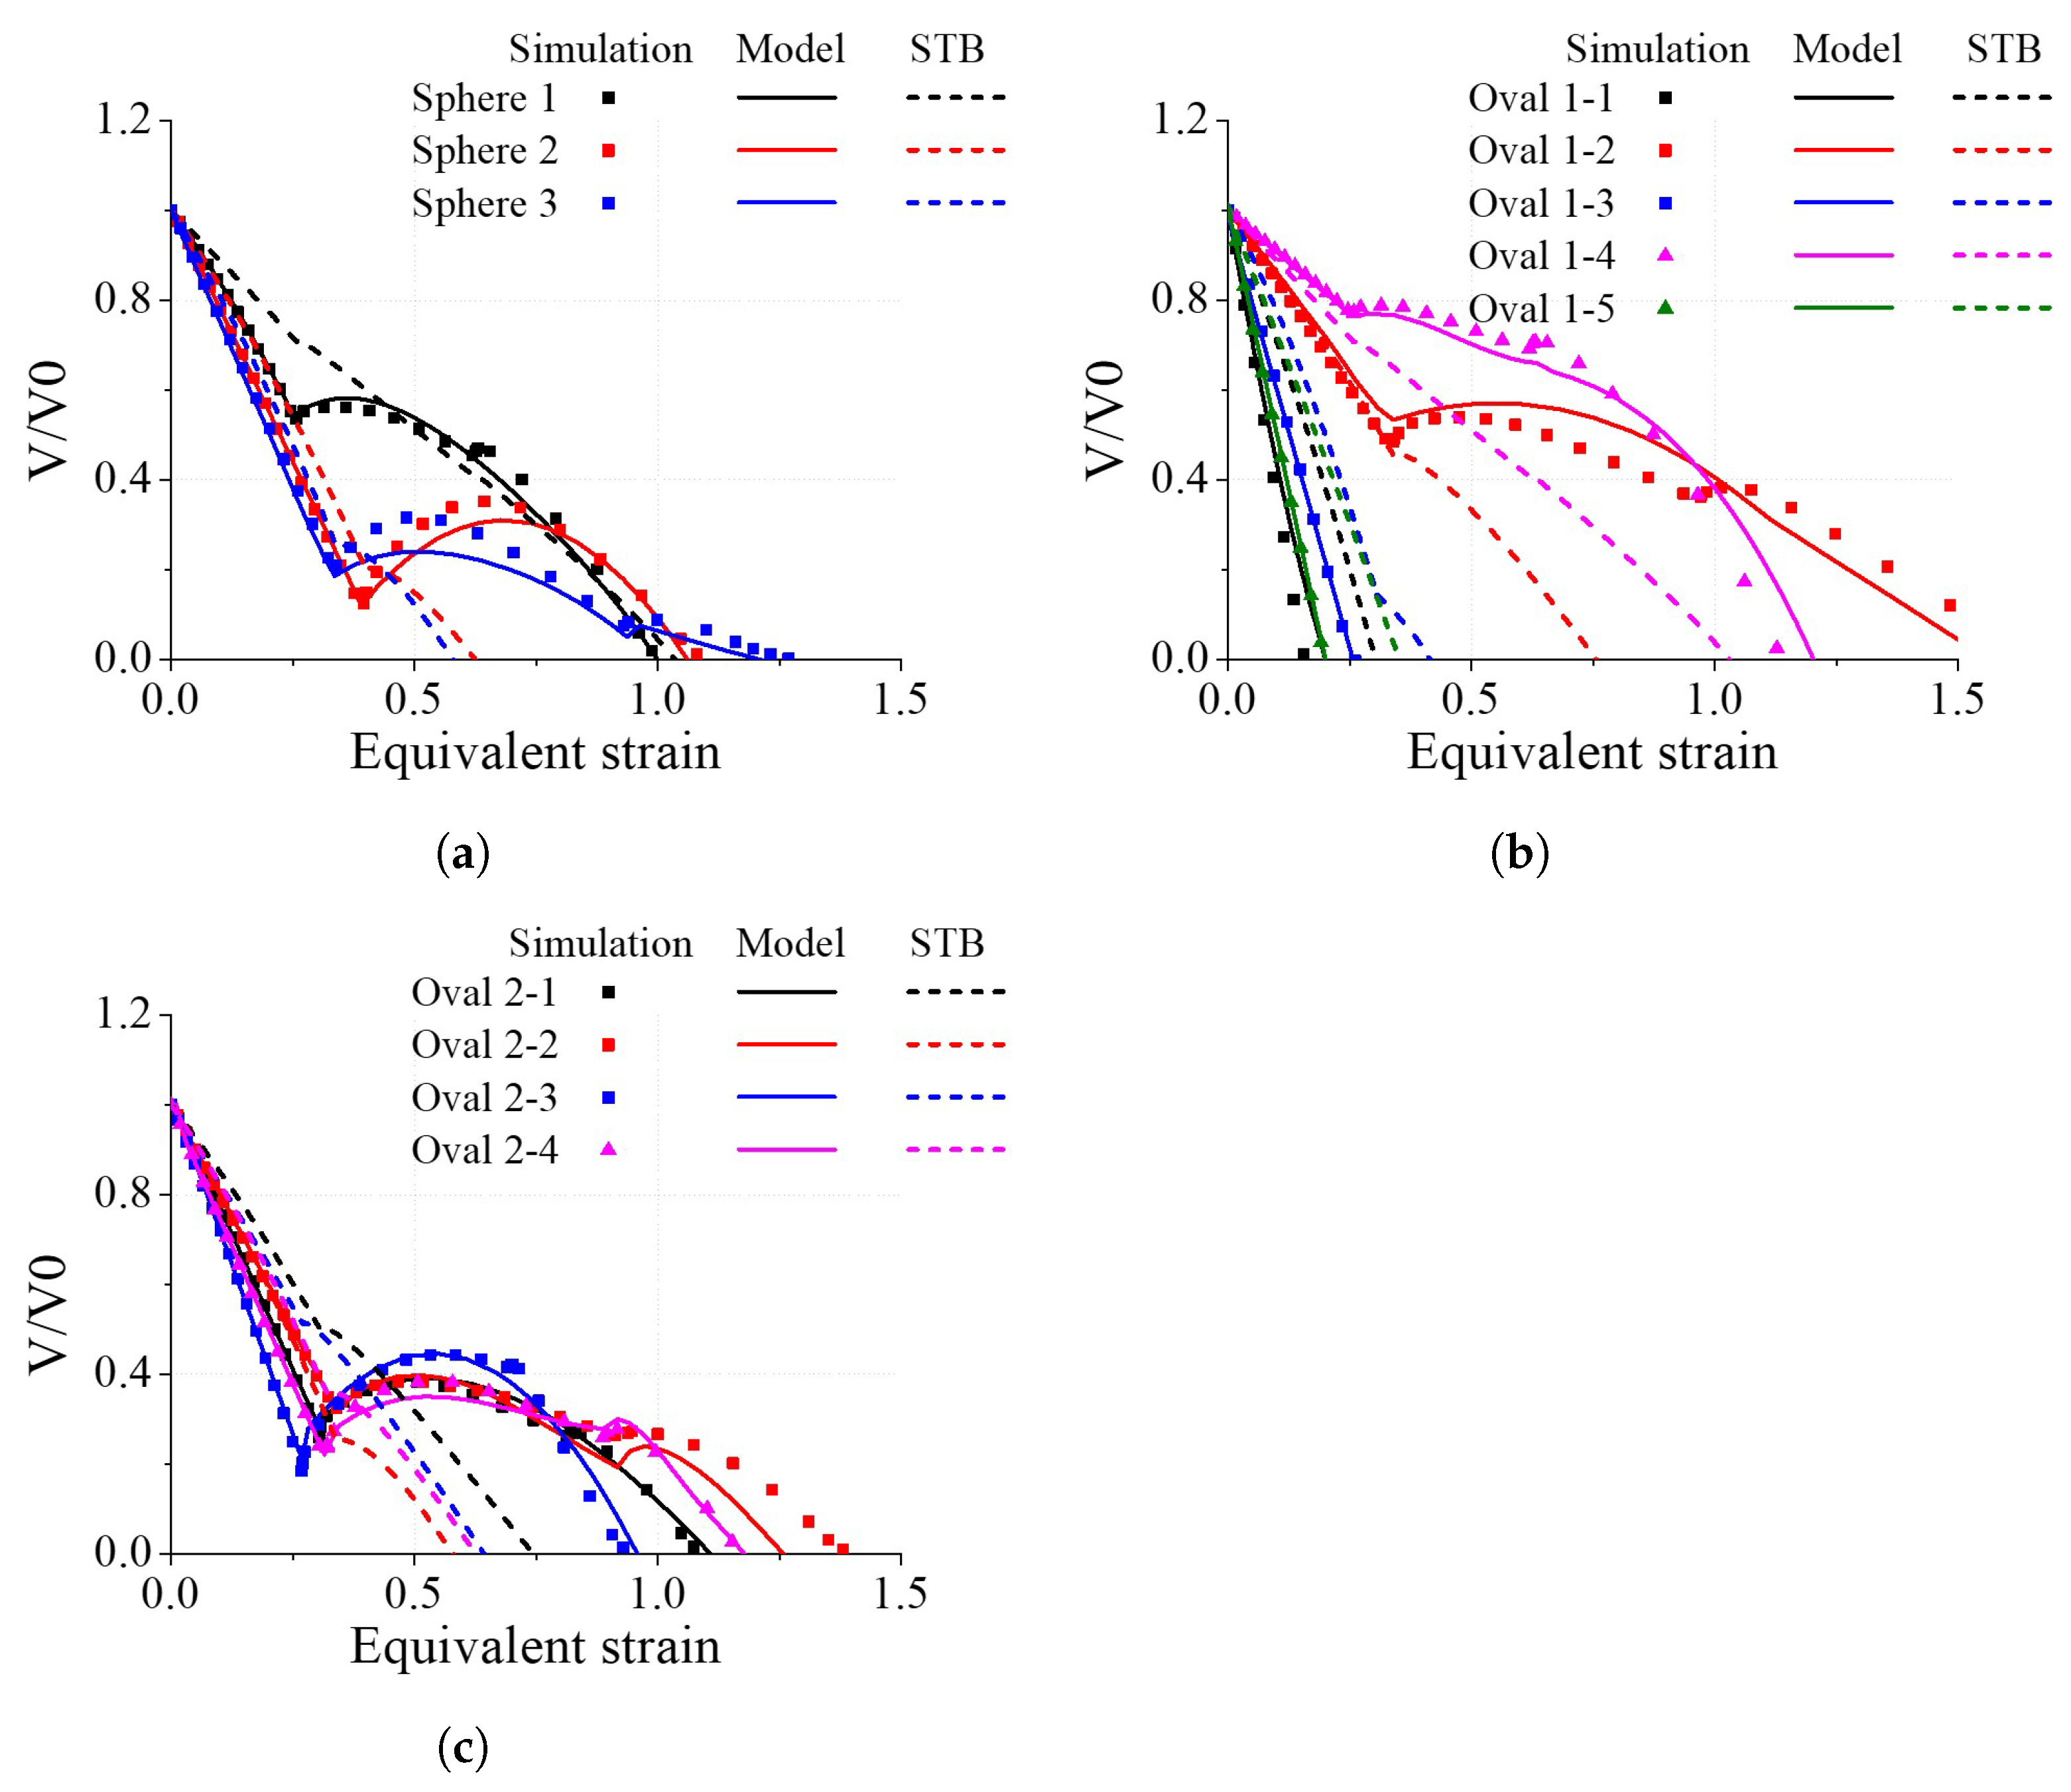
4.2. Experimental Verification of the Void Closure Model

To experimentally validate the void closure model, specimens were prepared with a rectangular shape with the size of 40 × 20 × 10 mm 3 , as shown in Figure 7. The contact surface of the specimen was designed to have hemispherical voids. The specimen was prepared by welding two specimens, as depicted in Figure 8. Each specimen contained five voids of the three mentioned shapes: Regular Spherical, Ellipsoid 1, and Ellipsoid 2. The specimens were compressed in the z direction at a rate of 10 mm/min until the initial height was reduced by 17.5%. The specimens were made of M50 bearing steel, as mentioned in Section 2.1.
Compression analysis was performed using FEA, and the comparison results are shown in Figure 9. The comparison of the shapes between the experimental and analytical results indicates that the voids deformed very similarly. The post-deformation radii ratios from the experiment and the void closure model are plotted in Figure 10. After compression, the radii primarily decreased, with the most significant reduction observed in the compression direction (the z-direction), while the radii in the y-direction slightly increased. The increase in the y-directional radius was due to barrelling caused by friction during compression. The average error between the experimentally measured results and the results calculated by the model was 3.8%, thus indicating that the model accurately predicted the void closure behaviour in the experimental environment.

4.3. Void Closure Behaviour in an Upsetting Process

An upsetting process is a commonly used operation in various forging processes. In this study, the closure behaviour of the voids was analysed using the void compression model when a cylindrical billet was freely forged into a flat shape. The billet size was set to have a diameter of 66 mm and a height of 100 mm, as shown in Figure 11. Five voids were modelled with the centres positioned at the centres of circular cross-sections and spaced at intervals of 10 mm from the height centres. The voids were named P1, P2, …, and P5 from the topmost void near the upper part. Similarly to Section 4.1, three different shapes (Regular Spherical, Ellipsoid 1, Ellipsoid 2) and three orientations were considered for the voids. The FEA was performed until a compression ratio of 50% was reached in the vertical direction, and the simulation was conducted with half symmetry to account for the symmetry of deformation. A friction coefficient of 0.5 was assigned between the die and the cylindrical billet.
Figure 12 illustrates the closure tendencies of the spherical voids based on their locations. For spherical voids, it was observed that the closure behaviour was similar for all voids. Most voids were completely closed when the effective strain reached approximately 0.5. However, it is noteworthy that the void at the P1 location did not close completely. The P1 location is the closest to the die surface among all the void locations, and it experiences the strongest influence of friction. As a result, the deformation near the P1 location was constrained, and it received less deformation. The effective strain remained at around 0.2 when the overall compression reached 50%, and the void volume ratio also stabilised at around 60%.
The closure tendencies of the Ellipsoid 1 void are presented in Figure 13. Figure 13a represents the case where the minor axis of the ellipsoid aligned parallel to the compression direction. In this case, the Ellipsoid 1 voids closed when the effective strain reached approximately 0.25. when compared to the spherical voids that closed at an effective strain of around 0.5, the closure rate of the voids in the direction of the minor axis of the ellipsoid was higher. At the end of compression, the void volume ratio at the P1 location was 13%, thus indicating that complete closure did not occur. In the case where the major axis of the ellipsoid formed a 45° angle with the x-axis, as shown in Figure 13b, the voids closed completely when the effective strain reached approximately 0.5. When the major axis of the ellipsoid formed a 90° angle with the x axis, the principal compression direction aligned parallel to the major axis, thus resulting in the highest required effective strain for the void closure. In the case of upsetting, unlike in the RVE analysis, there was no initial increase in the void volume.
The volume ratio changes of the voids in the shape of Ellipsoid 2 are shown in Figure 14. When the major axis of the ellipsoid aligned parallel to the x-axis or formed a 45° angle, the void closure rate was lower compared to Ellipsoid 1. However, in the case where it formed a 90° angle, the closure rate was faster. This is due to the fact that Ellipsoid 2 had a shorter major axis but smaller aspect ratios compared to Ellipsoid 1. Additionally, similarly to previous cases, the void at the P1 location did not close completely. The calculation of the void volume ratio in the upsetting process showed that the void compression model appropriately predicted the deformation patterns of the voids in the upsetting process.

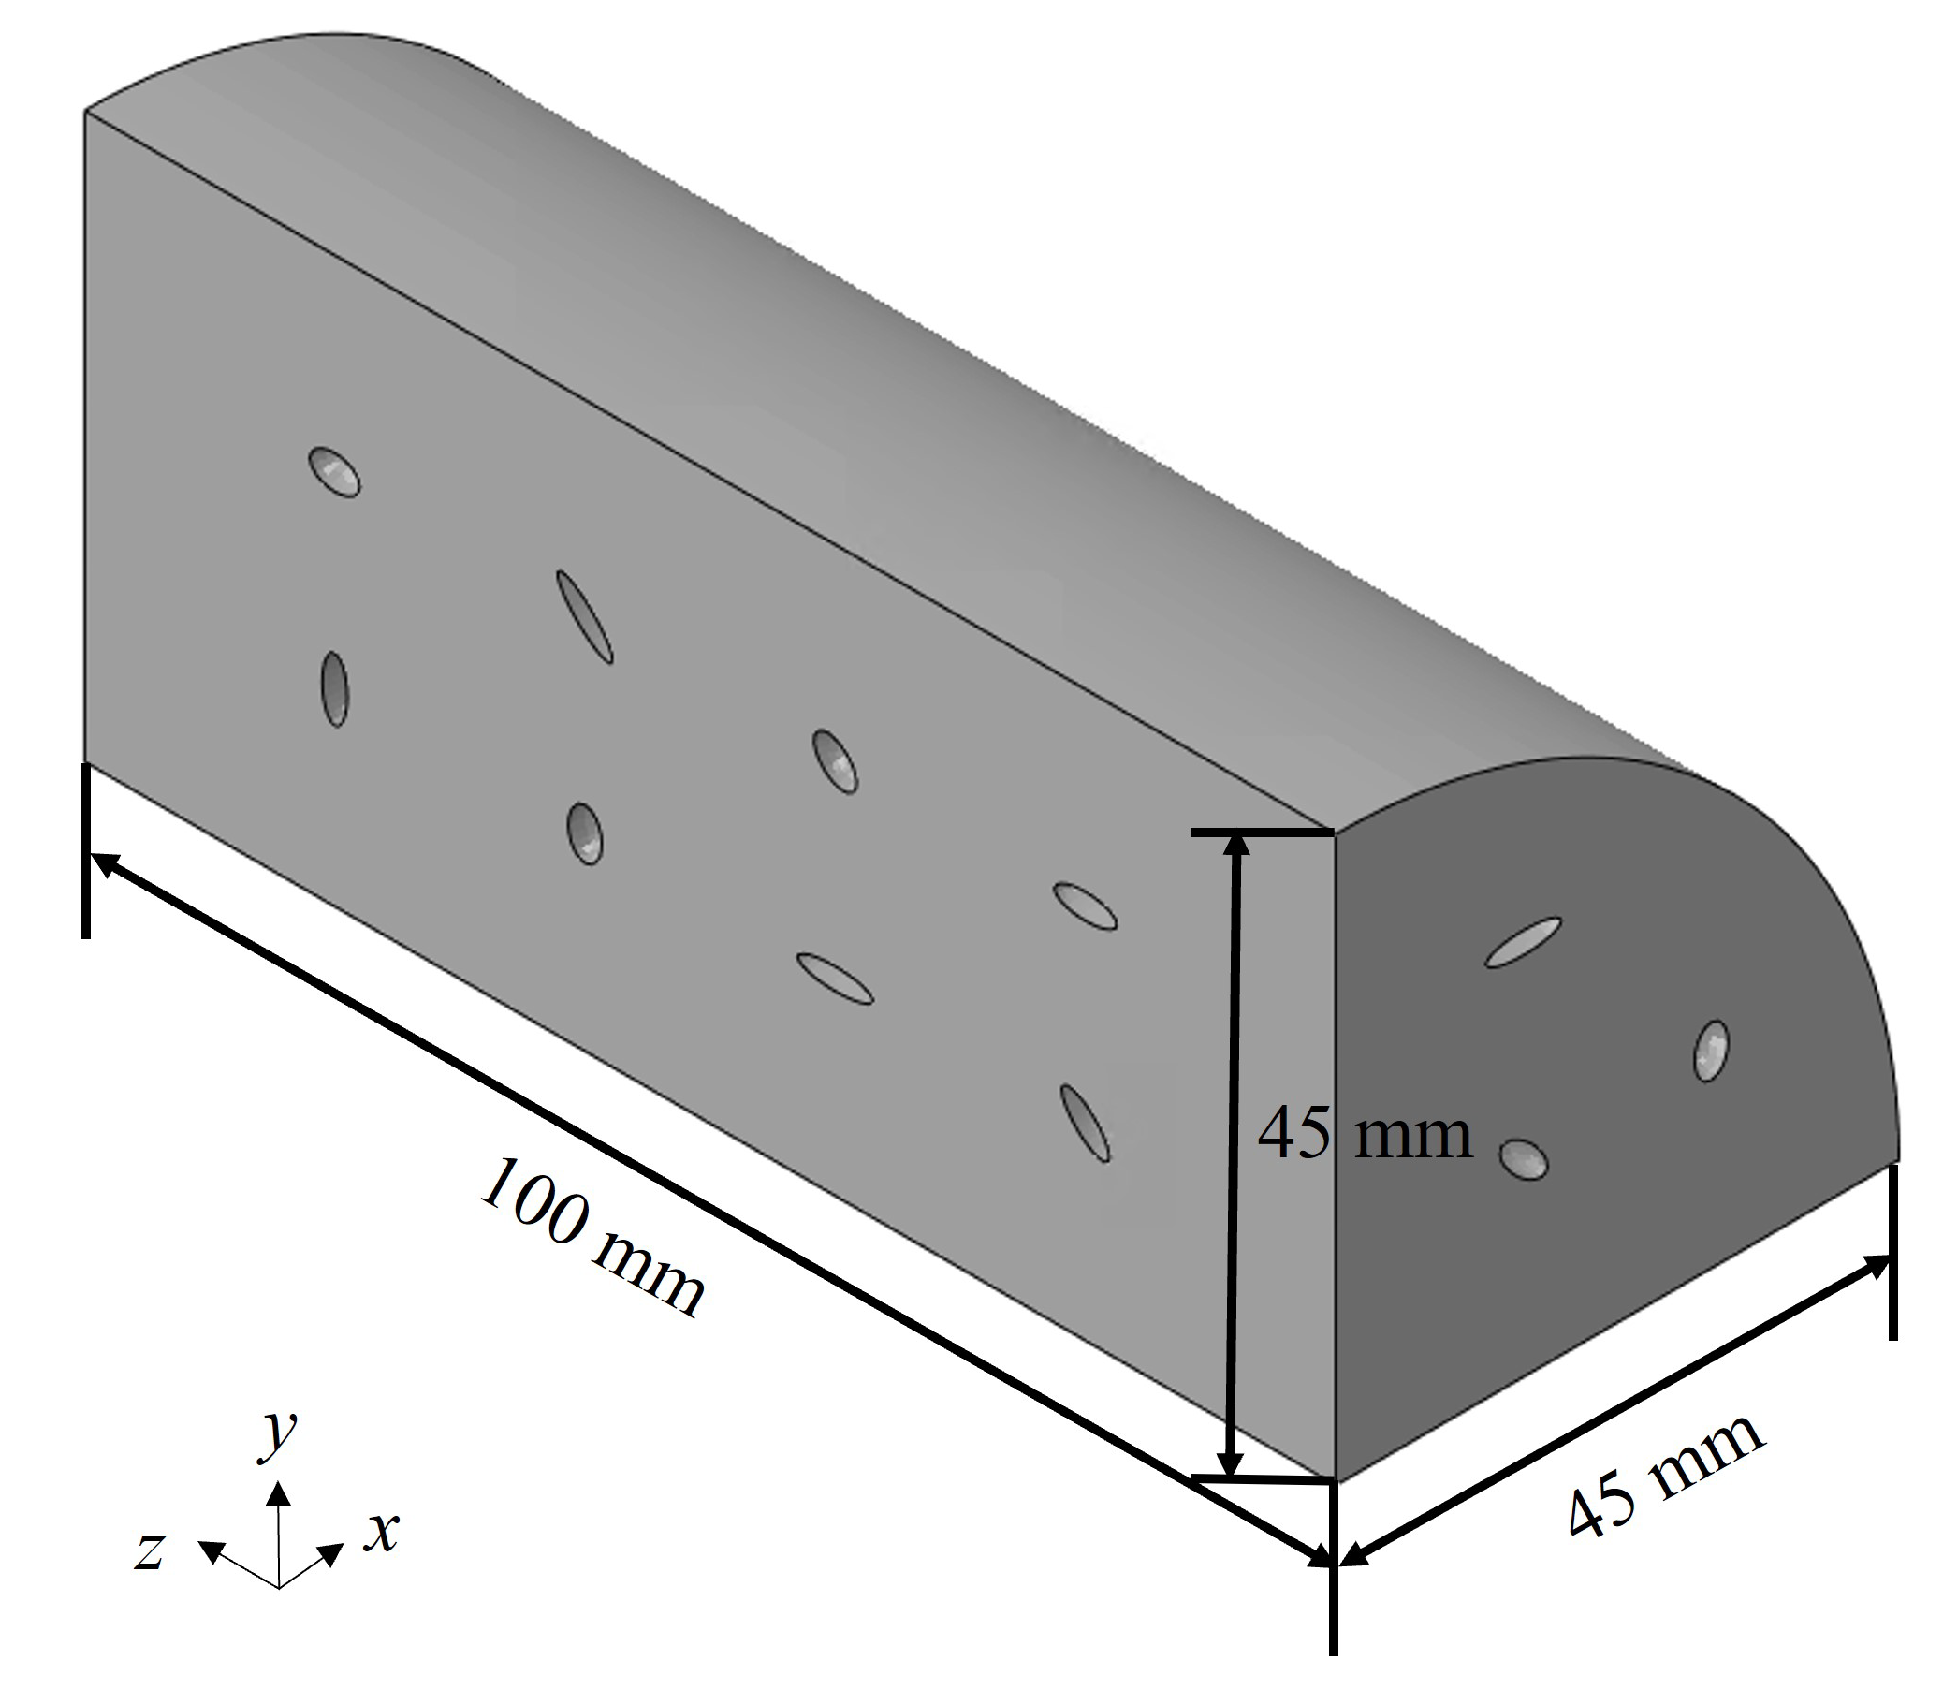
4.4. Void Closure Behaviour in Multi-Stage Compression of a Rectangular Bar

Some forging processes involve compressing the material in multiple directions, and a representative process with such characteristics is the cogging process. A multi-stage compression analysis was performed on a rectangular bar to demonstrate the applicability of the void closure model in multi-directional processes. The void closure behaviour was calculated using the void compression model. Additionally, the void volume ratios calculated using the STB model expressed in Equation (2) and the void compression model proposed in this study were compared.
The initial size of the rectangular bar was set to be 30 × 60 × 100 mm 3 , as shown in Figure 15a. A total of 12 voids were modelled to be symmetrically positioned on the z plane, with a horizontal and vertical spacing of 10 mm. Compression was applied alternately in the x and y directions, with a displacement of 6 mm for three cycles, following the y, x, and y axis. Symmetric boundary conditions were imposed in the z direction. Each void shape and name is depicted in Figure 15b, with the Regular Spherical, Ellipsoid 1, and Ellipsoid 2 voids arranged in different orientations.
As per the given conditions, the changes in the void volume ratio for different shapes and positions in the multi-stage forging of the rectangular bar, along with the volume ratio calculations using the void closure model and STB model, are presented in Figure 16. When the compression direction changed before the voids were completely closed, the void volume ratio showed a tendency to increase and then decrease. This is attributed to the expansion of the voids in a direction perpendicular to the compression direction, followed by compression in the expanded radius direction. This result is consistent with the deformation pattern observed in some of the RVE results from Section 4.1. Even in cases where the void volume ratio significantly increased and then decreased, such as the Oval 2-3 case in Figure 16b, the void closure model accurately captured these variations in the volume ratio calculations. However, the notable difference between the STB and void closure models is in their abilities to capture such trends. As observed in most cases, both models accurately predicted the void volume ratios until the first compression cycle. However, when the compression direction changed, and the void volume increased, and the STB model failed to calculate the deformation behaviour of the voids accurately. For example, in the Oval 2-2 case in Figure 16b, while the void closure model was able to calculate the changes in the void volume ratio due to the change in the compression direction, the STB model predicted similar behaviour to the first compression cycle, even in the second compression cycle. This occurs when the stress triaxiality does not vary significantly despite the change in compression direction and was observed in all cases except for a few where the voids closed during the first compression. This demonstrates the applicability of the void closure model, even when the compression direction changes and the void volume ratio increases and then decreases during the process.

4.5. Void Closure Behaviour of Randomly Shaped Voids

In reality, voids do not have perfect spherical or ellipsoidal shapes but exhibit random shapes. Therefore, the void closure model must accurately predict the void volume ratios for random-shaped voids to predict the void closure behaviour in real processes accurately. The deformation-induced void volume ratios were calculated for five random void shapes, as shown in Figure 17a, to demonstrate whether the proposed void closure model possessed this capability. The shape and compression conditions of the material with voids were set to be the same as in the multi-stage compression process of the rectangular bar in Section 4.4, and the positions and labels of the voids for each shape are indicated in Figure 17b. Additionally, the void volume ratios calculated using the STB model described in Equation (2) and the proposed void closure model were compared.
Figure 18 presents the volume ratio variations of the randomly shaped voids according to their positions and the volume ratio calculations using the void closure model and STB model for each position. Even for randomly shaped voids, there were cases where the void volume ratios increased and then decreased when the compression direction was changed. The void closure model could appropriately calculate the void volume ratios, even in cases where such behaviour occurred. Similar to the case of the ellipsoidal voids, the major difference between the STB model and the void closure model was evident in their abilities to capture such behaviour. Until the first compression completion, the STB and void closure models adequately predicted the void volume ratios. However, when the compression direction was changed, and the void volume increased, the STB model failed to accurately predict the void deformation behaviour. For instance, in the case of Shape 3-2 shown in Figure 18c, the void closure model calculated the change in the void volume ratio. In contrast, the STB model predicted similar behaviour to the first compression, where the void immediately closed. Similar cases were observed in Shape 1-3 in Figure 18a, Shape 2-1 in Figure 18b, and Shape 5-2 in Figure 18e, which were consistent with the results obtained when changing the compression direction for the ellipsoidal voids. This indicates that, while the STB model is applicable to processes with a consistent compression direction, a model that considers the compression direction, void deformation behaviour, and orientation at each moment of deformation should be employed for processes where the compression direction changes. Moreover, the void closure model accurately predicted the void volume ratio variations during deformation for random void shapes, thereby demonstrating its applicability to a wide range of processes compared to the STB model.

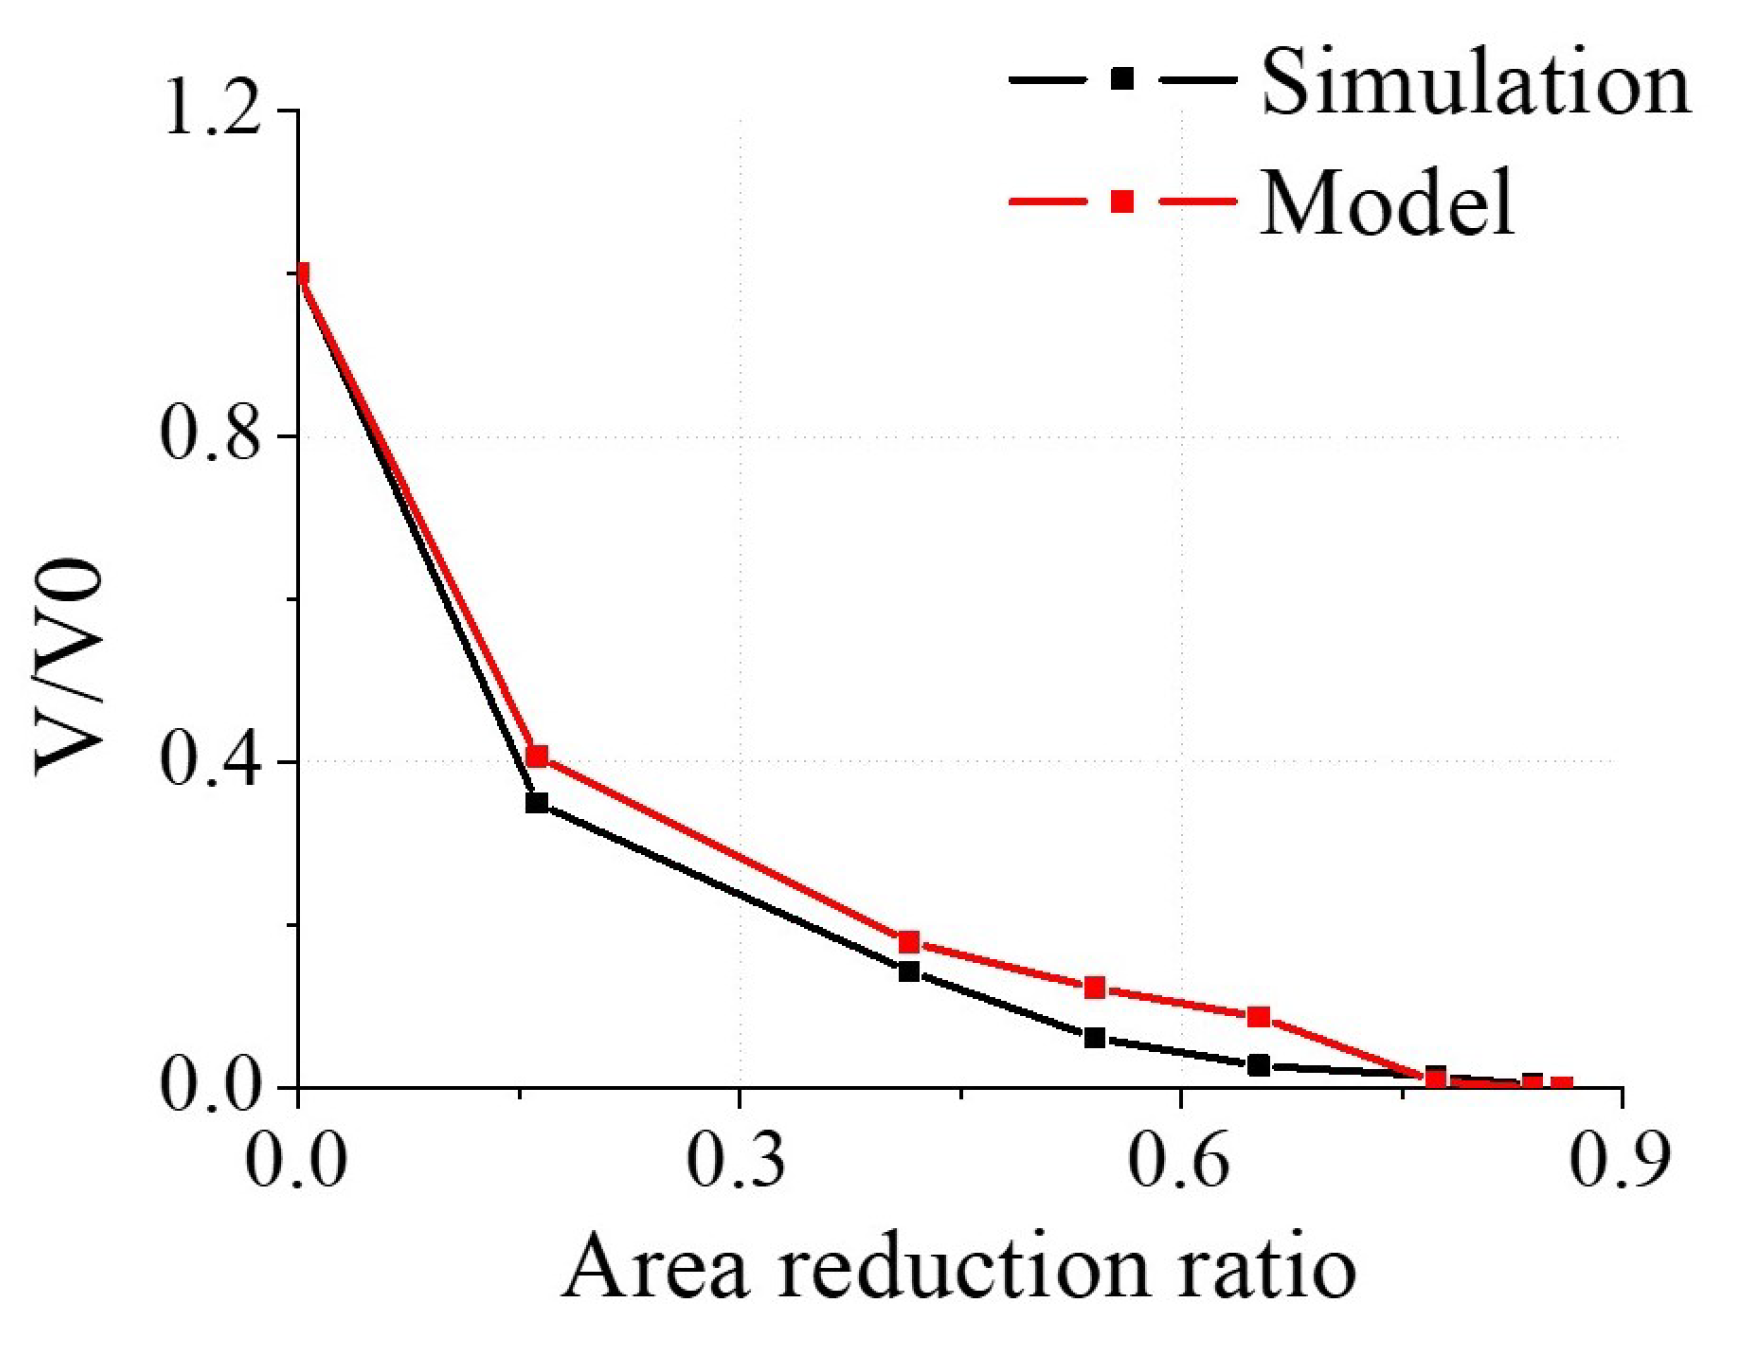
4.6. Application to the Cogging Process

The cogging process is an open die forging process performed to enhance the mechanical properties of a material by refining its grain structure and eliminating internal defects [29,30,31,32,33]. In the cogging process, a billet is positioned between two dies, and the billet is repeatedly rotated and compressed between the dies to reduce its cross-sectional area and achieve a specific cross-sectional shape, such as circular, rectangular, or octagonal [34]. This compression is applied repeatedly along the length of the material, thus resulting in elongation in the longitudinal direction. Billets produced through the cogging process are commonly used to manufacture large forged components, such as turbine rotors in aerospace engines. The void closure model could provide criteria for determining the extent of defect elimination during the process, thereby improving the efficiency of cogging process design. In this study, the proposed void closure model was applied to the cogging process to verify its ability to calculate the extent of void closure in the process accurately.
The initial size of the cylindrical billet in the cogging process was set to have a diameter of 90 mm and a height of 100 mm, as shown in Figure 19. The voids were modelled to be symmetrically distributed in the x, y, and z planes, with eight voids in each of the x and y planes and three voids in the z plane. Additionally, the total volume of the voids was set to be 0.2% of the total volume of the billet. Three different ellipsoidal void shapes were modelled with varying orientations and arranged accordingly. Boundary conditions were applied in the x and y directions, wherein we alternated between y and x compression for 28 passes. Symmetric conditions were applied in the x, y, and z directions. The parameters for each pass in the cogging process are described in Table 1. Each pass involved two compressions in the y and x directions. The cogging process design program, NSM Billetizing 1.3, which incorporated the proposed void closure model, was used as a reference for the cogging process.
The cogging process was performed on the cylindrical billet under the given conditions, and the volume ratio change of the entire void at the end of each pass and the volume ratio calculation results using the void closure model are shown in Figure 20. By the completion of Pass 5, most of the voids were closed, and it can be observed that the void closure behaviour was appropriately predicted by the model until the closure point. This demonstrates the applicability of the void closure model in the cogging process.

5. Conclusions

In this study, a void closure model applicable to the general hot forming process was proposed. The influence of void shape, orientation, and stress state on void closure was analysed through representative volume element (RVE) analysis, and experimental validation of the void closure model was conducted. The compression of cylindrical billets, forging rectangular billets, and cogging processes were performed to validate the model’s effectiveness further. Based on these investigations, the conclusions are drawn as follows:
  • Through RVE analysis, it was observed that void closure behaviour differed depending on the Lode angle when considering the same void shape and orientation. Additionally, in most cases, it was observed that voids tended to close more effectively as the triaxiality decreases.
  • In some cases, there was a lack of significant correlation between the closure behaviour of the voids and the triaxiality. In these cases, it was observed that the compression displacement of the ellipsoidal voids had a more considerable influence compared to the triaxiality.
  • It was observed that, when the compression amount was significant along the major axis of the void while minimal deformation occurred along the minor axis, an increase in the initial void volume was observed. Additionally, in the case of multi-stage compression of a rectangular bar, an increase in void volume was observed when the compression direction was changed.
  • When the proposed void closure model was applied to the compression of cylindrical billets, forging of rectangular billets, and cogging processes, it successfully predicted the void volume changes during the processes. In particular, it was able to predict complex behaviours, such as an increase in void volume. Furthermore, the model was able to predict the void closure behaviour of voids with random shapes.

Author Contributions

Conceptualization, N.K.; Methodology, J.K., J.P. and N.K.; Software, J.K. and Y.K.; Validation, J.K. and J.P.; Formal Analysis, J.K., Y.K. and J.P.; Investigation, J.K. and J.P.; Resources, H.K. and N.K.; Data Curation, J.K. and J.P.; Writing—Original Draft Preparation, J.K.; Writing—Review and Editing, J.K. and N.K.; Visualisation, J.K., Y.K. and J.P.; Supervision, N.K.; Project Administration, N.K. and H.K.; Funding Acquisition, N.K. All authors have read and agreed to the published version of the manuscript.

Funding

This work was supported by the Technology Innovation Program (RS-2023-00256058) funded By the Ministry of Trade, Industry, and Energy (MOTIE, Republic of Korea).

Data Availability Statement

Not applicable.

Conflicts of Interest

The authors declare no conflict of interest.

Appendix A

The derived coefficients of the void closure model are presented in the following table.
Table A1. Derived coefficients of the void closure model.
a 000 a 001 a 010 a 011 a 100 a 101 a 110 a 111 a 200 a 201 a 210 a 211
V * 4.97 5.39 16.68 11.61 9.06 16.31 43.86 31.02 1.24 8.52 39.03 15.23
r 1 * 0.11 2.33 3.04 3.67 5.41 8.40 9.67 11.73 7.32 6.37 9.84 7.88
r 2 * 0.43 1.12 0.63 2.37 4.79 6.42 6.49 10.01 6.85 6.76 6.80 9.29
α 0.55 1.87 1.62 2.46 3.08 9.65 0.51 12.09 3.35 8.21 0.85 10.37
b 000 b 001 b 010 b 011 b 100 b 101 b 110 b 111 b 200 b 201 b 210 b 211
V * 18.50 32.74 96.40 56.26 80.02 94.83 207.86 133.06 73.77 24.38 117.71 53.70
r 1 * 15.27 16.20 21.15 20.74 46.07 97.78 111.65 163.66 22.31 89.72 84.15 158.27
r 2 * 46.65 60.81 127.58 120.66 120.07 198.25 408.49 414.14 77.20 167.18 323.67 358.44
α 2.49 23.71 20.15 23.32 35.47 111.46 30.55 123.07 40.45 72.49 1.77 77.09
c 000 c 001 c 010 c 011 c 100 c 101 c 110 c 111 c 200 c 201 c 210 c 211
V * 107.80 72.88 249.52 121.21 439.46 189.65 805.74 314.10 320.37 236.27 871.72 177.37
r 1 * 35.15 41.82 59.49 63.47 7.51 349.63 362.01 498.57 14.90 322.27 341.27 644.99
r 2 * 108.19 170.75 343.47 348.63 10.73 428.34 625.83 973.02 117.62 158.11 18.92 341.47
α 15.23 74.14 34.75 80.43 66.72 298.34 12.67 382.68 86.56 38.60 134.62 62.18
d 000 d 001 d 010 d 011 d 100 d 101 d 110 d 111 d 200 d 201 d 210 d 211
V * 102.60 61.71 221.00 114.98 318.10 101.57 800.51 314.37 76.60 326.75 1275.85 83.58
r 1 * 17.79 30.84 34.83 49.36 78.06 284.41 99.11 533.87 50.68 159.01 163.30 102.50
r 2 * 56.27 102.97 189.43 208.33 203.13 21.53 276.37 57.17 171.83 687.85 1332.28 1605.69
α 13.38 54.65 10.10 65.78 3.47 62.6 2.12 94.96 37.58 73.65 161.71 101.25

References

  1. Dudra, S.P.; Im, Y.T. Analysis of void closure in open-die forging. Int. J. Mach. Tools Manuf. 1990, 30, 65–75. [Google Scholar] [CrossRef]
  2. Wang, X.; Dong, X. A void evolution model accounting for stress triaxiality, Lode parameter and effective strain for hot metal forming. Int. J. Mech. Sci. 2020, 168, 105309. [Google Scholar] [CrossRef]
  3. Zhang, X.X.; Cui, Z.S.; Chen, W.; Li, Y. A criterion for void closure in large ingots during hot forging. J. Mater. Process. Technol. 2009, 209, 1950–1959. [Google Scholar] [CrossRef]
  4. Chen, J.; Chandrashekhara, K.; Mahimkar, C.; Lekakh, S.N.; Richards, V. Void closure prediction in cold rolling using finite element analysis and neural network. J. Mater. Process. Technol. 2011, 211, 245–255. [Google Scholar] [CrossRef]
  5. Saby, M.; Bernacki, M.; Roux, E.; Bouchard, P.O. Three-dimensional analysis of real void closure at the meso-scale during hot metal forming processes. Comput. Mater. Sci. 2013, 77, 194–201. [Google Scholar] [CrossRef]
  6. Xie, J.; Zhang, R.; Liu, T.; Zhou, C.; Jia, L.J. Effect of initial void shape on void growth of structural steels based on micromechanical RVE models. J. Mater. Civ. Eng. 2022, 34, 04022010. [Google Scholar] [CrossRef]
  7. Xie, J.; Zhang, R.; Liu, T.; Zhou, C.; Gu, T.; Chen, B.; Chen, Y.; Jia, L.J. Growth of random polyhedral void in structural steel based on micromechanical RVE simulations. Adv. Eng. Softw. 2023, 175, 103344. [Google Scholar] [CrossRef]
  8. Gravier, P.; Mas, F.; Barthelemy, A.; Boller, E.; Salvo, L.; Lhuissier, P. Pore closure in thick aluminum plate: From industrial hot rolling to individual pore observation. J. Mater. Process. Technol. 2022, 303, 117509. [Google Scholar] [CrossRef]
  9. Gravier, P.; Mas, F.; Barthelemy, A.; Boller, E.; Salvo, L.; Lhuissier, P. Mechanisms and kinetics of pore closure in thick aluminum plate. J. Mater. Process. Technol. 2022, 303, 117499. [Google Scholar] [CrossRef]
  10. Feng, C.; Cui, Z. A 3-D model for void evolution in viscous materials under large compressive deformation. Int. J. Plast. 2015, 74, 192–212. [Google Scholar] [CrossRef]
  11. Chen, F.; Zhao, X.; Chen, H.; Ren, J. Void closure behavior during plastic deformation using the representative volume element model. Appl. Phys. A 2020, 126, 1–13. [Google Scholar] [CrossRef]
  12. Chen, F.; Zhao, X.; Chen, H.; Ren, J. Void-closure behavior and a new void-evolution model for various stress states. Mater. Technol. 2021, 55, 105–113. [Google Scholar] [CrossRef]
  13. Tanaka, M.; Ono, S.I.; Tsuneno, M. A numerical analysis of void crushing during side compression of round bar by flat dies. J. Jpn. Soc. Technol. Plast. 1987, 28, 238–244. [Google Scholar]
  14. Saby, M. Understanding and Modeling of Void Closure Mechanisms in Hot Metal Forming Processes. Ph.D. Thesis, Ecole Nationale Supérieure des Mines de Paris, Paris, France, 2013. [Google Scholar]
  15. Saby, M.; Bernacki, M.; Bouchard, P.O. Understanding and modeling of void closure mechanisms in hot metal forming processes: A multiscale approach. Procedia Eng. 2014, 81, 137–142. [Google Scholar] [CrossRef]
  16. Chbihi, A.; Bouchard, P.O.; Bernacki, M.; Muñoz, D.P. Influence of Lode angle on modelling of void closure in hot metal forming processes. Finite Elem. Anal. Des. 2017, 126, 13–25. [Google Scholar] [CrossRef]
  17. Zhang, Q.; Niu, L.; Liang, Z.; Cao, M.; Zhou, T. A porosity closure model considering stress triaxiality ratio and Lode stress parameter. J. Mater. Process. Technol. 2020, 286, 116824. [Google Scholar] [CrossRef]
  18. Gouverneur, M.; Bailly, D.; Hirt, G. Investigation on the Influence of Shear on Void Closure in Open-Die Forging Processes. Steel Res. Int. 2022, 93, 2200327. [Google Scholar] [CrossRef]
  19. Niu, L.; Zhang, Q. A void closure model based on hydrostatic integration and the Lode parameter for additive manufacturing AlSi10Mg. J. Manuf. Process. 2022, 73, 235–247. [Google Scholar] [CrossRef]
  20. Gurson, A.L. Continuum theory of ductile rupture by void nucleation and growth: Part I—Yield criteria and flow rules for porous ductile media. J. Eng. Mater. Technol. 1977, 99, 2–15. [Google Scholar] [CrossRef]
  21. Tvergaard, V. Material failure by void growth to coalescence. Adv. Appl. Mech. 1989, 27, 83–151. [Google Scholar]
  22. Ragab, A. Application of an extended void growth model with strain hardening and void shape evolution to ductile fracture under axisymmetric tension. Eng. Fract. Mech. 2004, 71, 1515–1534. [Google Scholar] [CrossRef]
  23. Harris, N.; Shahriari, D.; Jahazi, M. Development of a fast converging material specific void closure model during ingot forging. J. Manuf. Process. 2017, 26, 131–141. [Google Scholar] [CrossRef]
  24. Saby, M.; Bouchard, P.O.; Bernacki, M. A geometry-dependent model for void closure in hot metal forming. Finite Elem. Anal. Des. 2015, 105, 63–78. [Google Scholar] [CrossRef]
  25. Park, J.; Han, B.; Kwon, H.; Kim, N. Numerical Simulation of Crack Condition in Forging Products of M50 Bearing Steel Based on Processing Map Theory. Metals 2023, 13, 921. [Google Scholar] [CrossRef]
  26. Vaz, M., Jr.; de Santi, N., Jr.; Verran, G.; de Souza Neto, E. Numerical and experimental assessment of ductile fracture in tensile and compressive-dominant processes. J. Mater. Process. Technol. 2006, 177, 300–303. [Google Scholar] [CrossRef]
  27. Chen, K.; Yang, Y.; Shao, G.; Liu, K. Strain function analysis method for void closure in the forging process of the large-sized steel ingot. Comput. Mater. Sci. 2012, 51, 72–77. [Google Scholar] [CrossRef]
  28. Liu, D.C.; Nocedal, J. On the limited memory BFGS method for large scale optimization. Math. Program. 1989, 45, 503–528. [Google Scholar] [CrossRef] [Green Version]
  29. Kim, N.; Oh, I.Y.; Han, S.W.; Kim, J.H.; VanTyne, C.J.; Moon, Y.H. Advanced disk-forging process in producing heavy defect-free disk using counteracting dies. Int. J. Mater. Form. 2021, 14, 281–291. [Google Scholar] [CrossRef]
  30. Kim, P.; Chun, M.; Yi, J.; Moon, Y. Pass schedule algorithms for hot open die forging. J. Mater. Process. Technol. 2002, 130, 516–523. [Google Scholar] [CrossRef]
  31. Choi, S.; Chun, M.; Van Tyne, C.; Moon, Y. Optimization of open die forging of round shapes using FEM analysis. J. Mater. Process. Technol. 2006, 172, 88–95. [Google Scholar] [CrossRef]
  32. Lee, Y.; Lee, S.; Van Tyne, C.; Joo, B.; Moon, Y. Internal void closure during the forging of large cast ingots using a simulation approach. J. Mater. Process. Technol. 2011, 211, 1136–1145. [Google Scholar] [CrossRef]
  33. Hibbe, P.; Hirt, G. Analysis of the bond strength of voids closed by open-die forging. Int. J. Mater. Form. 2020, 13, 117–126. [Google Scholar] [CrossRef]
  34. Kim, N.; Ko, D.C.; VanTyne, C.J.; Han, S.W.; Abolhasani, D.; Moon, Y.H. Innovative square cogging to enhance void closure efficiency during forging of continuously cast round blooms. Int. J. Mater. Form. 2022, 15, 63. [Google Scholar] [CrossRef]
Figure 1. (a) The geometry, boundary conditions, and the FE mesh of the RVE and (b) the definition of radii and orientation of the void in the canonical basis ( e x , e y , e z ) .
Jmmp 07 00117 g001
Figure 2. Initial void shapes considered in the RVE simulations. The voids are named as Regular Spherical, Ellipsoid 1, and Ellipsoid 2 from left.
Jmmp 07 00117 g002
Figure 3. Void volume change with respect to the element size in the void region.
Jmmp 07 00117 g003
Figure 4. Comparison of the void volumes calculated from RVE analyses and the void closure model for the regular spherical void. (a) θ 0 ; (b) θ < 0 .
Jmmp 07 00117 g004
Figure 5. Comparison of void volumes calculated from RVE analyses and the void closure model for Ellipsoid 1 void. (a) major and x-axes were parallel, and θ 0 ; (b) major and x-axes were parallel, and θ < 0 ; (c) major and x-axes formed 45°, and θ 0 ; (d) major and x-axes formed 45°, and θ < 0 ; (e) major and x-axes formed 90°, and θ 0 ; (f) major and x-axes formed 90°, and θ < 0 .
Jmmp 07 00117 g005
Figure 6. Comparison of void volumes calculated from RVE analyses and the void closure model for Ellipsoid 2 void. (a) major and x-axes were parallel, and θ 0 ; (b) major and x-axes were parallel, and θ < 0 ; (c) major and x-axes formed 45°, and θ 0 ; (d) major and x-axes formed 45°, and θ < 0 ; (e) major and x-axes formed 90°, and θ 0 ; (f) major and x-axes formed 90°, and θ < 0 .
Jmmp 07 00117 g006
Figure 7. Schematic of the specimens. (a) Regular Spherical. (b) Ellipsoid 1. (c) Ellipsoid 2.
Jmmp 07 00117 g007
Figure 8. Welded specimen.
Jmmp 07 00117 g008
Figure 9. Comparison of the void shapes after compression from FEA and experiment. (a) Regular Spherical. (b) Ellipsoid 1. (c) Ellipsoid 2.
Jmmp 07 00117 g009
Figure 10. Comparison of the void shapes after compression from FEA and experiment. (a) Regular Spherical. (b) Ellipsoid 1. (c) Ellipsoid 2.
Jmmp 07 00117 g010
Figure 11. Cylinder upsetting model and the shape after 50% compression.
Jmmp 07 00117 g011
Figure 12. Comparison of void volumes calculated from FEA and the void closure model for the Regular Spherical void in the upsetting process.
Jmmp 07 00117 g012
Figure 13. Comparison of void volumes calculated from FEA and the void closure model for the Ellipsoid 1 void in the upsetting process. (a) major and x axes were parallel; (b) major and x axes formed 45° angle; (c) major and x axes formed 90° angle.
Jmmp 07 00117 g013
Figure 14. Comparison of void volumes calculated from FEA and the void closure model for the Ellipsoid 2 void in the upsetting process. (a) major and x axes were parallel; (b) major and x axes formed 45° angle; (c) major and x axes formed 90° angle.
Jmmp 07 00117 g014
Figure 15. (a) The multi-stage compression analysis model and (b) the shapes and name of each void.
Jmmp 07 00117 g015
Figure 16. Comparison of void volumes calculated from FEA and the void closure model in the multi-stage compression process. (a) Sphere. (b) Oval 1. (c) Oval 2.
Jmmp 07 00117 g016
Figure 17. (a) The shapes of the random voids and (b) the location and name of each void.
Jmmp 07 00117 g017
Figure 18. Comparison of void volumes calculated from FEA and the void closure model for the random voids in the multi-stage compression process. (a) Shape 1. (b) Shape 2. (c) Shape 3. (d) Shape 4. (e) Shape 5.
Jmmp 07 00117 g018
Figure 19. Cylinder shape billet utilised in the cogging process.
Jmmp 07 00117 g019
Figure 20. Void volume change with respect to the element size in the void region.
Jmmp 07 00117 g020
Table 1. The cogging process pass schedule.
InitialPass 1Pass 2Pass 3Pass 4Pass 5Pass 6Pass 7
Cross-section size [mm]∅90 73 × 73 61 × 61 54 × 54 47 × 47 47 × 47 38 × 38 32 × 32
Angle of rotation [°]-90909090909090
Area reduction ratio00.160.420.540.650.770.840.86
Disclaimer/Publisher’s Note: The statements, opinions and data contained in all publications are solely those of the individual author(s) and contributor(s) and not of MDPI and/or the editor(s). MDPI and/or the editor(s) disclaim responsibility for any injury to people or property resulting from any ideas, methods, instructions or products referred to in the content.

