Article

Theoretical Analysis of Rolling Force during Cold Rolling with Roll Crossing and Shifting System

1
Department of Mechanical Engineering, Islamic University of Madinah, Madinah 41411, Saudi Arabia
2
School of Mechanical, Materials and Mechatronics Engineering, University of Wollongong, Wollongong 2522, Australia
3
Central Metallurgical Research and Development Institute (CMRDI), Cairo 11421, Egypt
4
Department of Chemical Engineering, Islamic University of Madinah, Madinah 41411, Saudi Arabia
*
Author to whom correspondence should be addressed.
J. Manuf. Mater. Process. 2023, 7(3), 104; https://doi.org/10.3390/jmmp7030104
Submission received: 22 March 2023 / Revised: 11 May 2023 / Accepted: 17 May 2023 / Published: 24 May 2023
(This article belongs to the Special Issue Advances in Material Forming)

Abstract

:
A precise prediction of the rolling force is critical to ensure the quality of the final product, especially in the cold rolling of thin strips. Based on this, a new mathematical model is developed to work out the rolling force when considering the roll crossing angle and work roll shifting values at speed ratios of 1.1, 1.2 and 1.3. An iterative method was used to indicate the contact area shape, from which the rolling force was automatically calculated using the Matlab™ code for the cases of work roll cross angles of 0.5° and 1°. Experimental measurements and analysis were carried out to validate the theoretical calculations. The result shows that the theoretical analysis and experimental results are in good agreement, which indicates that the developed theoretical model can predict the rolling force well with a consideration of roll crossing during the cold rolling process.

1. Introduction

Cold rolling of thin strips changes the thickness of a strip via reduction by compressive pressure exerted by rotating rolls at approximately room temperature [1,2,3]. The cold rolling process results in changes to significant material properties, e.g., improvements in strength and the achievement of evenly-reduced thickness. Modern continuous cold rolling production lines use shape-control milling to meet the manufacturers’ requirements of strip shape and surface finish [4,5,6]. The key aim of rolling is to reduce strip thickness. In the cold strip-rolling process, the most imperative parameter is the rolling force. The accuracies of strip thickness distribution and flatness are directly related to the rolling forces encountered. Precise prediction of rolling forces plays a significant role in pre-setting the crucial initial control parameters of the cold rolling production system. Current tandem cold rolling mills are controlled by a computerised control system, and are often completely automated. The automation system requires a wide range of parameter inputs for controlling the rolling progress effectively. Among these parameters, the most important ones are those which determine the rolling forces in the rolling process [7,8,9]. For these reasons, calculating rolling forces accurately, by means of mathematical models, is the most important function of computer-based rolling control systems. The calculation model of rolling force consists of several sub-component models, such as the roll flattening radius model, the rolling force model, the coefficient of friction (μ) model and material deformation resistance (K) model. The combined effect of all these models affects the calculation accuracy of the rolling force. A two-dimensional differential model was derived to express the rolling pressure in the roll bite under equilibrium conditions, and Tselikoy subsequently proposed a solution through a consideration of Coulomb’s law of friction with the arc of contact substituted for its chord [10].
For the modelling of the cold rolling of a thin strip, Fleck et al. [11] analysed the roll pressure distribution in the no-slip zone via a consideration of the elastic deformation of the rolls, treating them as elastic half-spaces. Later, Le and Sutcliffe modified the conversion equation by adding a new element for modelling to obtain a pressure distribution in the neutral zone, in which the pressure gradient and shear stress were linked with the roll slope. This combination facilitated the incorporation of other effects such as the friction models with the final change in roll shape [12]. Jiao et al. analysed the rolling force and the roll flattening radius of a five-stand tandem cold mill using the iterative method during online process control [8]. Several researchers have proposed analytical models to calculate the rolling force of crossed-pair hot rolling mills [13,14]. Other researchers have investigated strip profiles in asymmetrical cold rolling, investigating the influence of work roll crossing and roll shifting on the rolling force using both numerical and experimental methods [15,16,17,18]. Also, in the rolling process, finite element methods have been widely used to simulate and investigate the process. This is a powerful numerical technique for solving complex engineering problems. Jiang et al. analysed the rolling force and rolling torque in the strip rolling process and considered the effect of friction variation on the roll bite [19]. They compared their numerical results with the experimental results and demonstrated good agreement [19,20]. Hsu et al. established a rigid-plastic FE code combined with a realistic friction model to analyse the lubricant flow and determine the hydrodynamic friction stress within a billet–roll interface. Their work developed predictions of the rolling force, rolling torque and outlet velocity ratios which could be obtained with high accuracy during a lubricated cold rolling process [21]. For the hot rolling of aluminium, Shahani et al. applied a coupled thermal visco-plastic finite element code to estimate the effects of initial slab thickness, thickness reduction ratio, friction coefficient and rolling speeds on the hot rolling process [22]. For the cold rolling of steel plates, Devarajan et al. applied a two-dimensional elastic-plastic finite element model to study the influence of roll diameter and rolling speed on residual stress and contact pressure in cold rolling of plate steel [23]. Moreover, for thicker sections of material (slab rolling) Liu et al. developed a three-dimensional elastic–plastic finite element model to describe the metal flow in slab rolling [24]. Very good agreement was demonstrated between the forecasted metal flow and the experimentally measured data, accurately tracking the profile evolution of the workpiece with different types of reductions, and width and thickness ratios.
There are several published models for calculating rolling force, including the Bland–Ford–Hill model, the Hitchcock or roll-flattening model, the coefficient of friction and deformation resistance model [25,26,27,28]. None of these models take into consideration the influences of rolling process parameters such as the work roll crossing angle and work roll shifting on rolling force. Roll crossing angle and work roll shifting are increasingly being used for reducing rolling force and improving strip profiles [15]. However, no previous studies have been reported that develop a theoretical basis for calculating rolling force considering the effects of roll crossing angle and work roll shifting. As a result, applications of WRC and WRS have previously been limited to computer-based systems.
In this study, we propose a new mathematical model to calculate rolling force taking into account the roll crossing angle and work roll shifting system effects, as illustrated in Figure 1. A theory for calculating the rolling force considering the effect of WRC and WRS is developed considering speed ratios of 1.1, 1.2 and 1.3. The concept is shown schematically followed by the development of an iterative method for calculating rolling force. The equations for evaluating the unit pressure and contact area used in this study wetr obtained from [29]. The corresponding calculations were performed with Matlab codes. Three different speed ratios were generated from the Matlab codes. The calculation process consisted of several steps, as shown in the flow chart of the whole program in Figure 2. In the case of roll crossing angle, the contact length was calculated (without consideration of work roll flattening). The coefficient of friction (µ) was calculated by assuming it for the speed ratios of 1.1, 1.2, and 1.3 and hence the coefficient delta ( δ ) and external friction effect coefficient (n) could be obtained. At the end, the rolling force and the contact length were calculated with consideration of the flattening of the work rolls.

2. Mill Testing and Experimental Procedure

The experimental tests were performed on a 4-high Hille 100 rolling mill modified to be used as a roll crossing and shifting system. The detailed specification for the test mill is given in Table 1.

3. Theoretical Analysis of Rolling Force Considering Roll Crossing with Asymmetric Rolling System

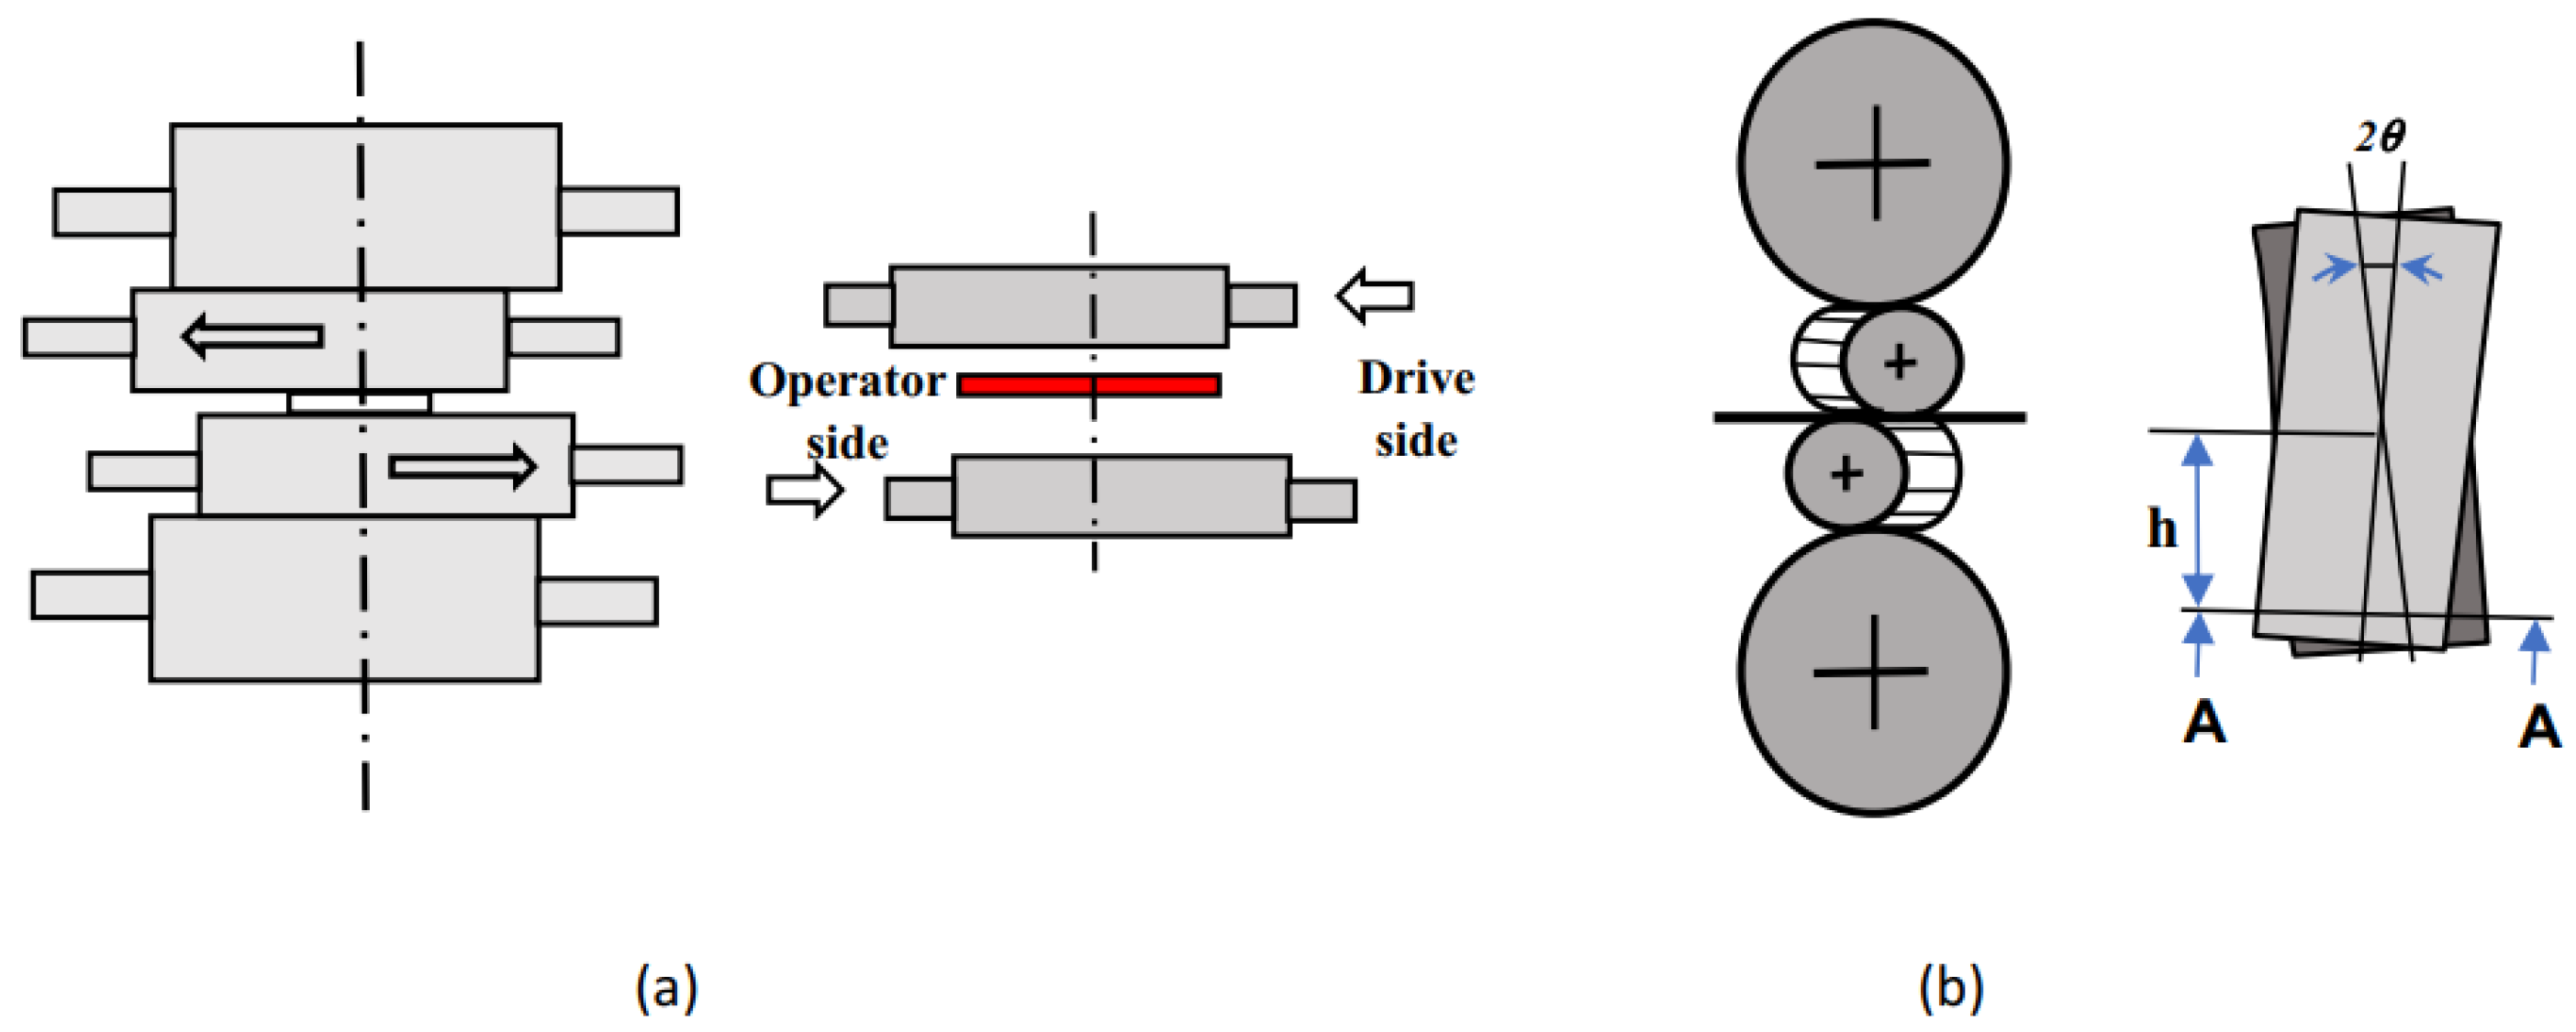
3.1. Rolls Crossing Method

The roll crossing method changes the area of roll contact, which gradually changes the rolling force during work roll rotation from 0 to 1°. Figure 3a represents the schematic of the roll crossing contact areas. As the roll crossing angle increases from 0 to 1°, the contact area decreases, as represented by ABCD. Figure 3b depicts a quarter of the total contact area. For a specific work roll crossing angle, the BAC triangle is in contact when roll crossing is considered during the rolling process. As the roll crossing angle changes, point B moves along length AD. Accordingly, to identify a 0.5° or 1° work roll crossing angle, length AD can be divided into 100 parts as shown in Figure 3c. In the case of a 0.5° work roll crossing angle, the 15th increment of AD is used to represent the location of B. At the same time, in the case of a 1° work roll crossing angle, the 27th increment of AD is used to represent the location of B. Both the 15th and 27th increments match the experimental results for 0.5° and 1° roll crossing angles respectively.

3.1.1. Calculation of Rolling Force Steps

The calculation of rolling force is performed in 5 steps as described below.
Step 1: calculate the unit pressure [29].
  • Compute the coefficient δ which is related to the μ and roll diameter and Δ h , and can be expressed as
    δ = μ 2 × D 1 × D 2 D 1 + D 2 Δ h
2.
Calculate the reduction ratio (%) value as follows:
ε = Δ h h 1
3.
Obtain the n value from equation “ n = P K ” based on the relationship between the external friction effect coefficient (n), the μ , the work rolling diameter and the amount of thickness reduction, as shown in the Table 2 [30].
4.
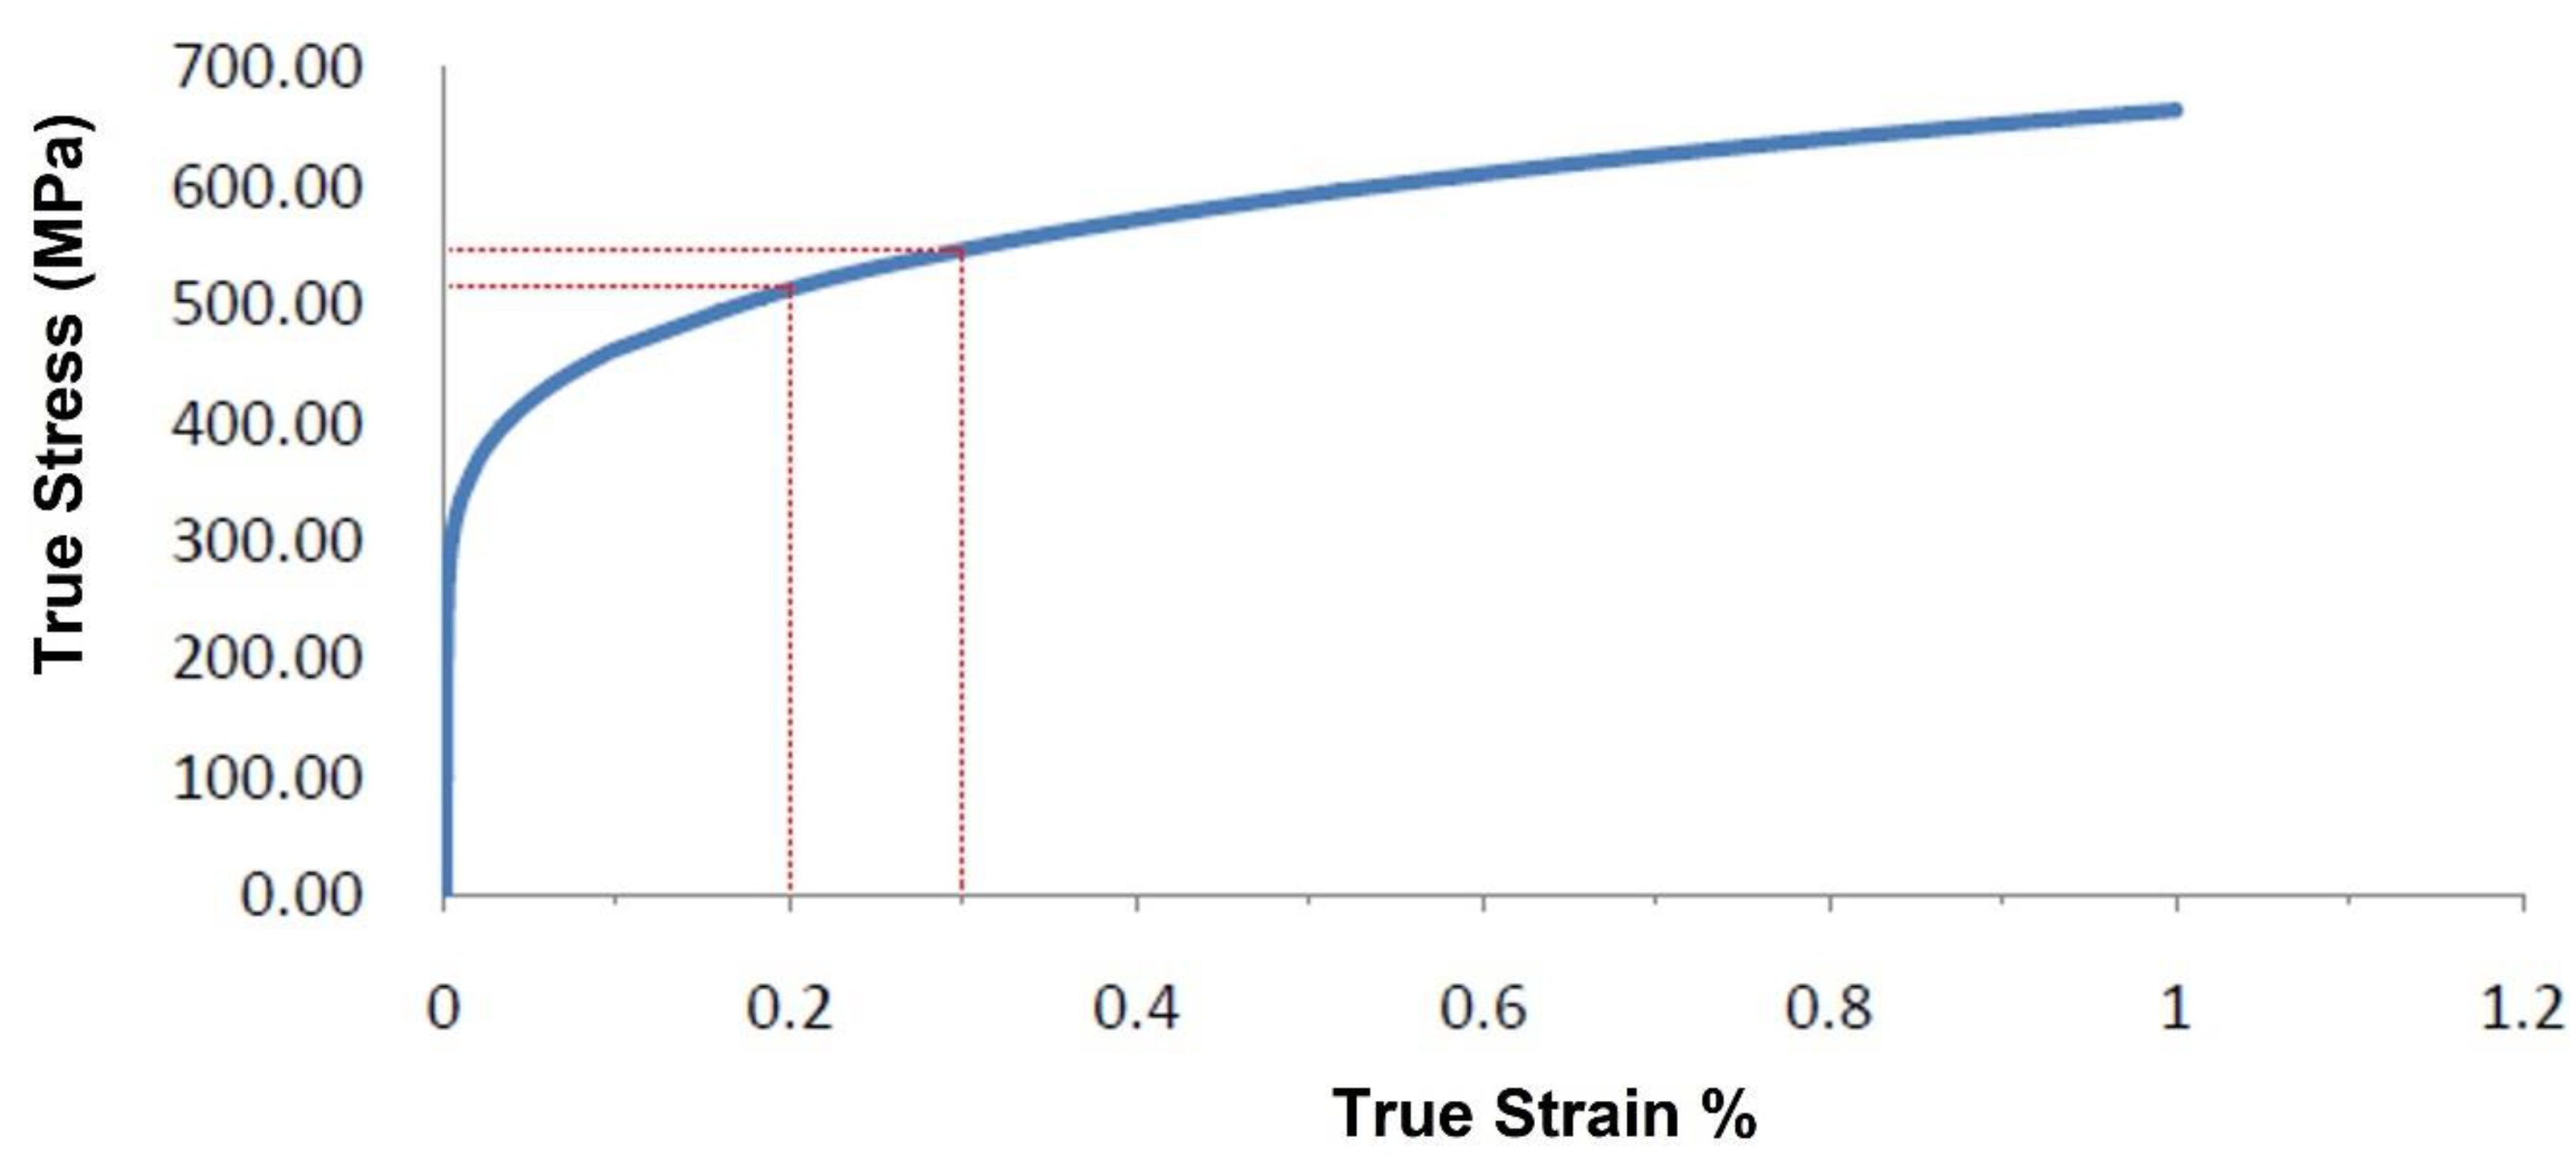
Check the material yield stress through a tensile test for low-carbon steel alloys as shown in Figure 4.
5.
Calculate the constrained yield stress, K, using Equation (3):
K = 1.15 × σ
6.
Finally, calculate the unit pressure using Equation (4).
p = K × n
Step 2: calculate the contact area based on Hertz contact theory [30].
The elastic deformation of work rolls is initially ignored, and then the contact area is obtained as shown in Equation (5):
a = w 1 + w 2 2 D 1 × D 2 D 1 + D 2 Δ h
Step 3: calculate the rolling force for the case of work roll shifting using Equation (6):
P = l × a × p / L
Step 4: calculate the contact area (for cases with a roll crossing) using the iteration method, as explained in Section 3.1.2.
Step 5: Finally, calculate the rolling force.
Calculate the rolling force for the case of roll crossing with Equation (7):
P 1 = a 1 × p

3.1.2. Iteration Method for Calculating the Theoretical Rolling Force (without Consideration of Flattening)

For the case of a speed ratio of 1.1, a 20% reduction, and a 80 mm strip width, for example, the contact length can be calculated using Equation (8):
L = 2 R 1 R 2 R 1 + R 2 Δ h = D 1 D 2 D 1 + D 2 Δ h
where D1 and D2 are the diameters of the top and bottom work rolls, respectively, Δ h is the difference between the entry and the exit thickness, and hence, L = 1.8147 mm , A C = 40 mm and A D = 1 2 L = 1.8147 2 = 0.9074 mm ,
where, l is the contact length without roll crossing, AC is the half-strip width, and AD is the half-contact length. The total contact area without roll crossing = 1.8147 × 80 = 145.176   m m 2 .
AB15 = (AD/100) × 15 = (0.9074/100) × 15 = 0.1365 mm (for a 0.5° work roll crossing angle), and AB27 = 0.2457 mm (for a 1° work roll crossing angle). Then, the curve representing the shape of the real contact area is obtained based on Matlab curve fitting (see Figure 5) using the following function to generate incremental data for the B location along AD:
X = linspace (0.1365, 0, 9);
x = [0.1365, 0] = [0.1365, 0.1194, 0.1023, 0.0852, 0.0681, 0.051, 0.034, 0.017, 0]
y = [0, 40] = [0, 5, 10, 15, 20, 25, 30, 35, 40]
Then, the mathematical expression of the curve can be obtained as shown in Equation (9), which fits the real shape of the contact area:
F = @ ( x ) 43.26 e 13.49 x f ( x ) = 43.26 e 13.49 x
In order to obtain the area of the four corners, the integration method is used using Matlab as follows:
A = quad (F, 0, 0.1365) × 4 = 2.6982 × 4 = 10.7928 mm2
Finally, the contact area for a 0.5° roll crossing angle can be calculated by subtracting the area of the four corners from the total contact area, as shown below:
A = 145.176 − 10.7928 = 134.3832 mm2
Then, by running the Matlab code, Figure 6 and Figure 7, which represent the relationship between the rolling force and the location of point B for 0.5° and 1° work roll crossing angles, respectively, are obtained. It can be seen from both figures that the calculation of the rolling force converges after point B reaches the location of ~0.57 mm and ~0.75 mm for 0.5° and 1° WRCs respectively. Therefore, the theoretical value of the rolling force for a 0.5° roll crossing angle is ~83.2 KN, as can be seen in Figure 6. However, the rolling force for a 1° roll crossing angle is ~76.8 KN, as shown in Figure 7.

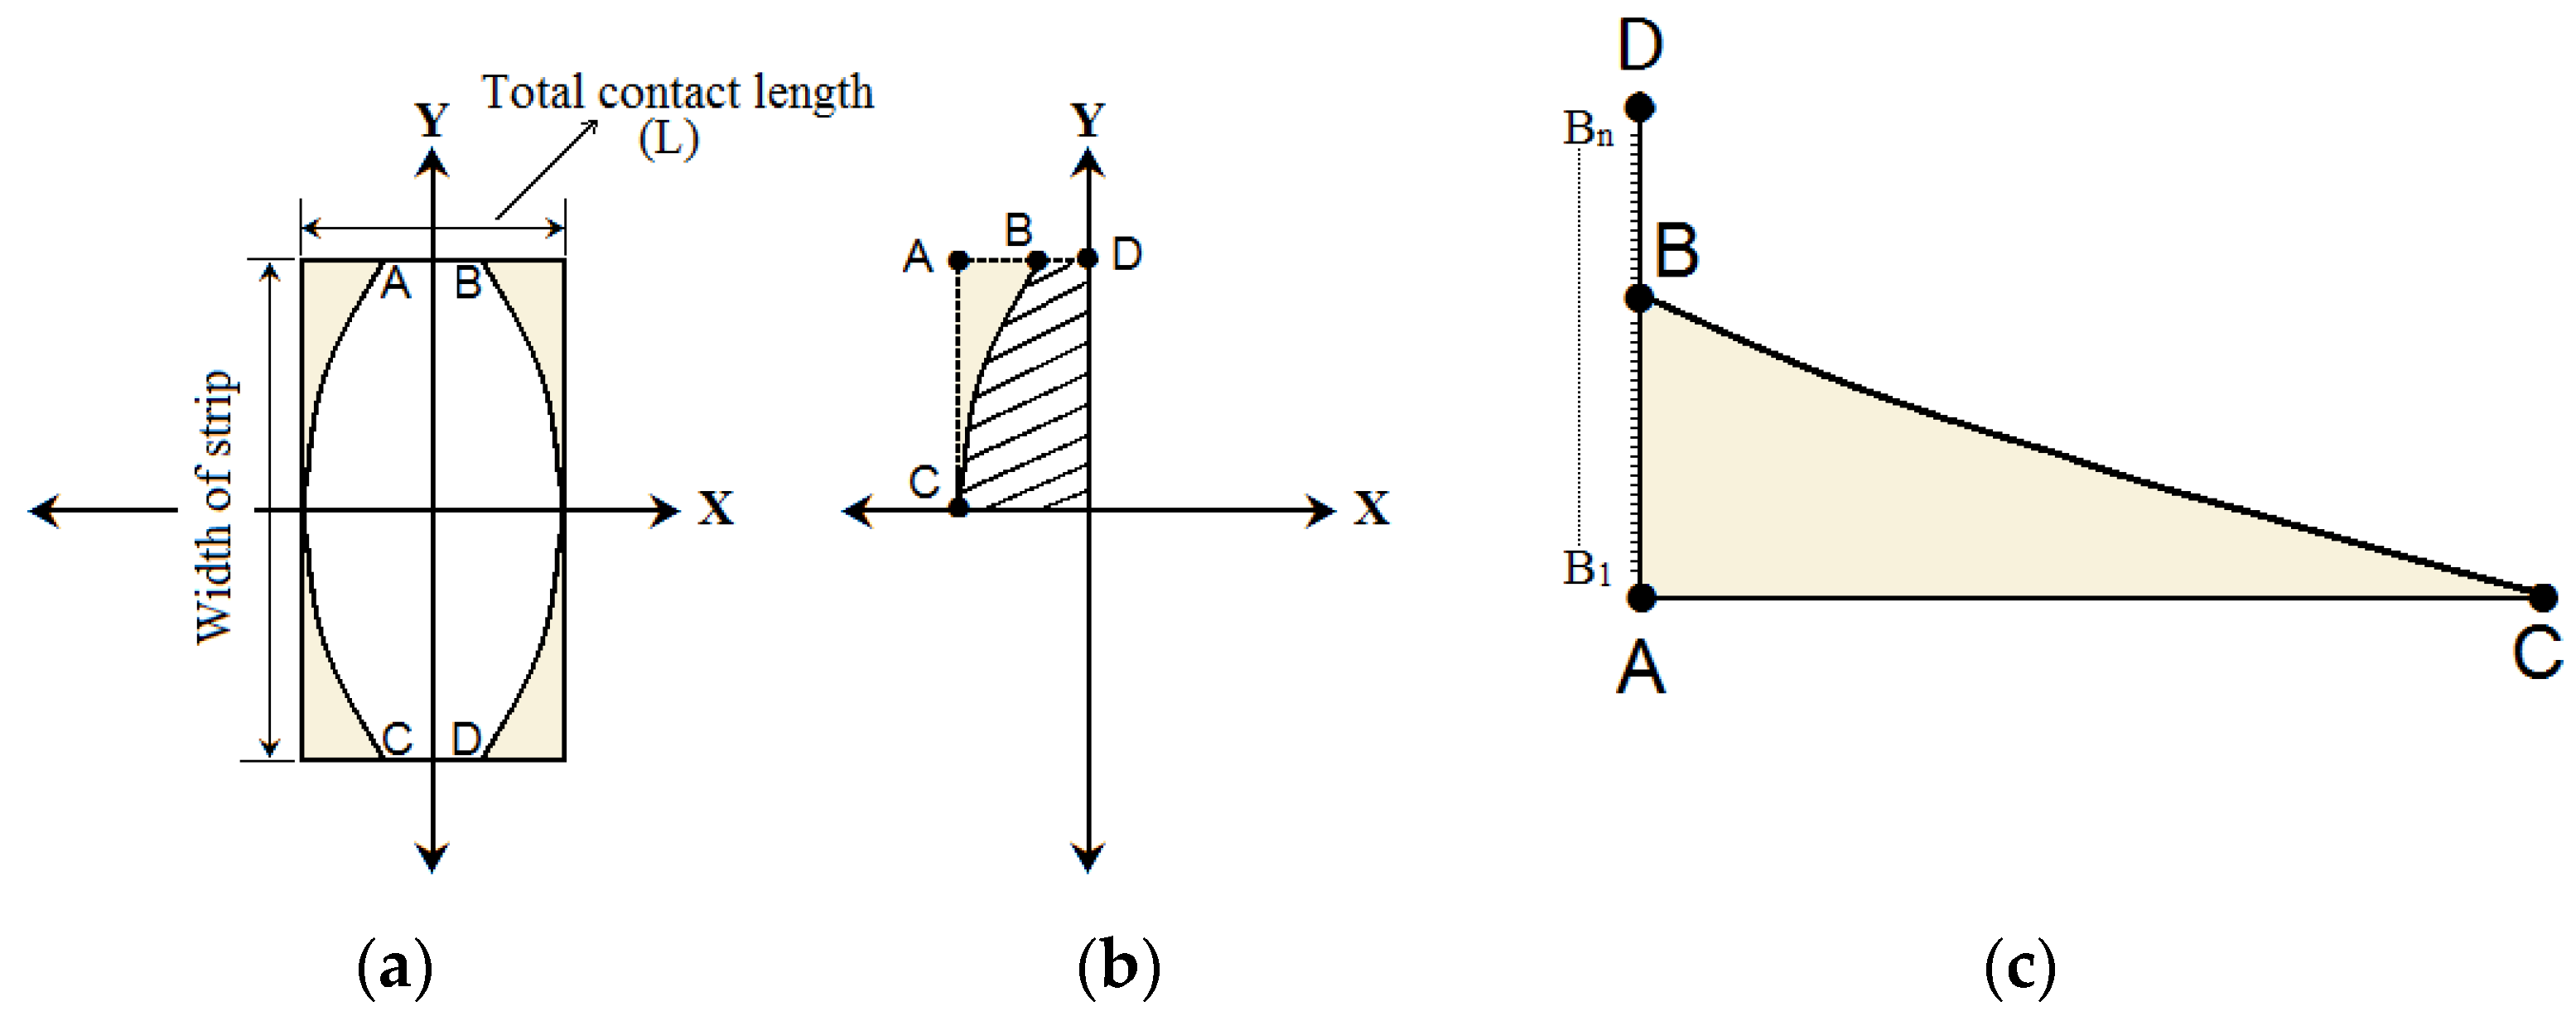
3.1.3. Calculating the Contact Length (with Consideration of Deflection)

Adapting Equations (10)–(14) [31,32] to different cases with different diameters and reductions, the contact length for each case of speed ratios (1.1, 1.2, and 1.3) and reductions (20 and 30%) can be obtained.
l = R Δ h + ( A x 0 ) 2 + A x 0
A = 0.0057 0.0045 + ε + 1.6055
x 0 = 2 R + ( Δ 1 + Δ 2 ) = 2 R 1 R 2 R 1 + R 2 + ( Δ 1 + Δ 2 )
Δ 1 = 4 P w 1 + w 2 × 1 V r o l l 2 π E r o l l = 4 P 2 b × 1 V r o l l 2 π E r o l l
Δ 2 = 4 P w 1 + w 2 × 1 V r o l l 2 π E r o l l = 4 P 2 b × 1 V s t r i p 2 π E s t r i p
where l is the contact length, Δ 1 is the deflection of the work rolls, Δ 2 is the spring back of the strip, P is the rolling force (without deflection), E is the elastic modulus, and A is the coefficient of Equation (10). Then, the rolling force with consideration of the flattening of the work rolls can be calculated following the same method as that described in Section 3.2.1 Figure 8 and Figure 9 show the relationship between the rolling force and the location of point B for 0.5° and 1° work roll crossing angles, respectively. It can be seen that the rolling force gradually converges to 101.5 KN for a 0.5° work roll crossing angle, and to 93.7 KN for a 1° roll crossing angle as point B reaches the location of 0.59 mm and 0.92 mm, respectively, which indicates that the rolling force decreases by about 8 KN as the roll crossing angle increases from 0.5° to 1°.

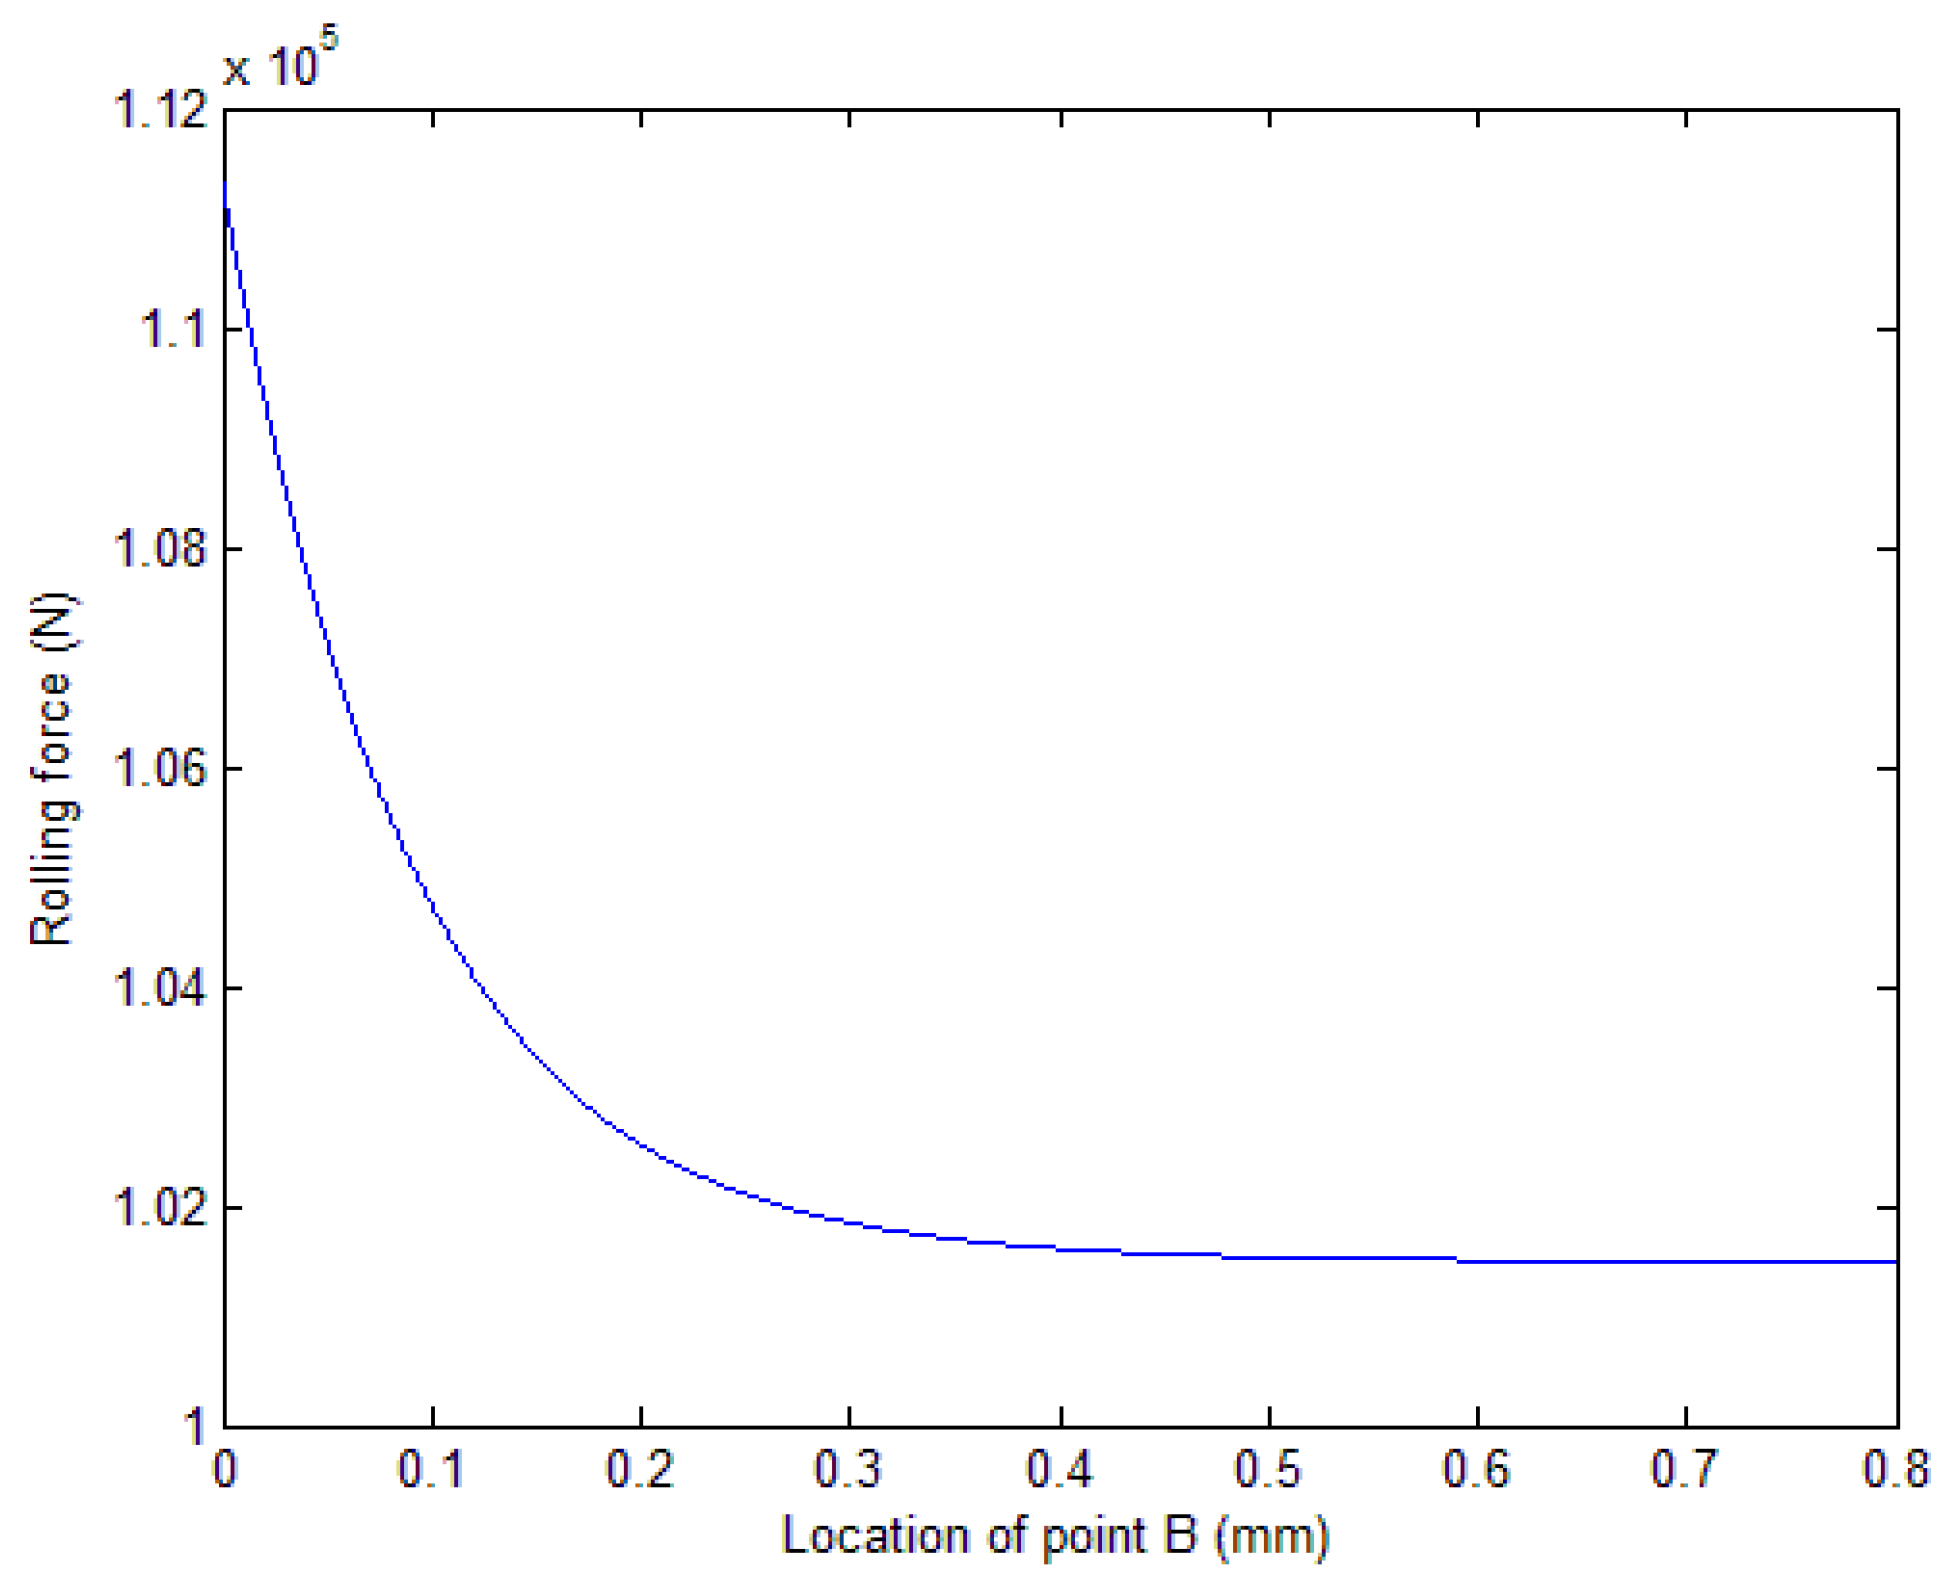
3.2. The Mathematical Verification of Convergence of the Calculation

In order to verify the Matlab results, pure mathematical calculations were performed to compare the convergence of the calculations.

3.2.1. Difference between Two Calculations for the Area of the Four Corners (mm2)

For the case of a speed ratio of 1.1, a 20% reduction, and a 80 mm strip width, the mathematical expression of the shape of the contact area was obtained by Matlab curve fitting as shown in Equation (10), the general form of which can be expressed as
f ( x ) = a e b x
where e is the mathematical constant which = 2.71828 [33]. Then, by applying Equation (15) alongside Equation (9), Equation (16) can be obtained:
F = @ ( x ) 43.26 e 13.49 x f ( x ) = 43.26 e 13.49 x
With the iteration method, the value of x is gradually defined as 0 and slowly increased in the subsequent calculation until the n-th iteration as illustrated in Equation (17):
x 1 = 0 x 2 = x 1 + Δ x 3 = x 1 + 2 Δ x 4 = x 1 + 3 Δ x n = x 1 + ( n 1 ) Δ
where Δ = 0.0001.
Therefore, the area of one corner at the nth and (n + 1)th iterations can be obtained following the calculations below:
F ( n ) = 0 x n f ( x ) = 43.26 13.49 e 13.49 x 0 x n = 43.26 13.49 e 13.49 x 0 0.0001 ( n 1 ) 43.26 13.49 e 13.49 0.0001 ( n 1 ) 43.26 13.49 e 13.49 0 = 3.20682 e 0.001349 ( n 1 ) + 3.20682 1
F ( n + 1 ) = 43.26 13.49 e 13.49 x 0 0.0001 ( n + 1 ) 1 = 43.26 13.49 e 13.49 x 0 0.0001 n = 3.20682 e 0.001349 n + 3.20682
The error between two calculations of the area of one corner is obtained as shown in Equation (20).
ε 1 = F n + 1 F n = 3.20682 e 0.001349 n + 3.20682 3.20682 e 0.001349 ( n 1 ) + 3.20682 = 3.20682 e 0.001349 n + 3.20682 e 0.001349 n e 0.001349 = e 0.001349 n 3.20682 + 3.20682 e 0.001349
Substituting the value of e =2.71828,
e 0.001349 n 0.00433
when n = 1000,
e 0.001349 1000 0.00433 = e 1.349 0.00433 F ( n + 1 ) F ( n ) = 0.0011236 F ( n + 1 ) F ( n ) 4 ( 4 c o r n e r s ) = 0.004494
To sum up, when n = 1000, the difference of the total area of the four corners is 0.0045 mm2, as shown in Figure 10.

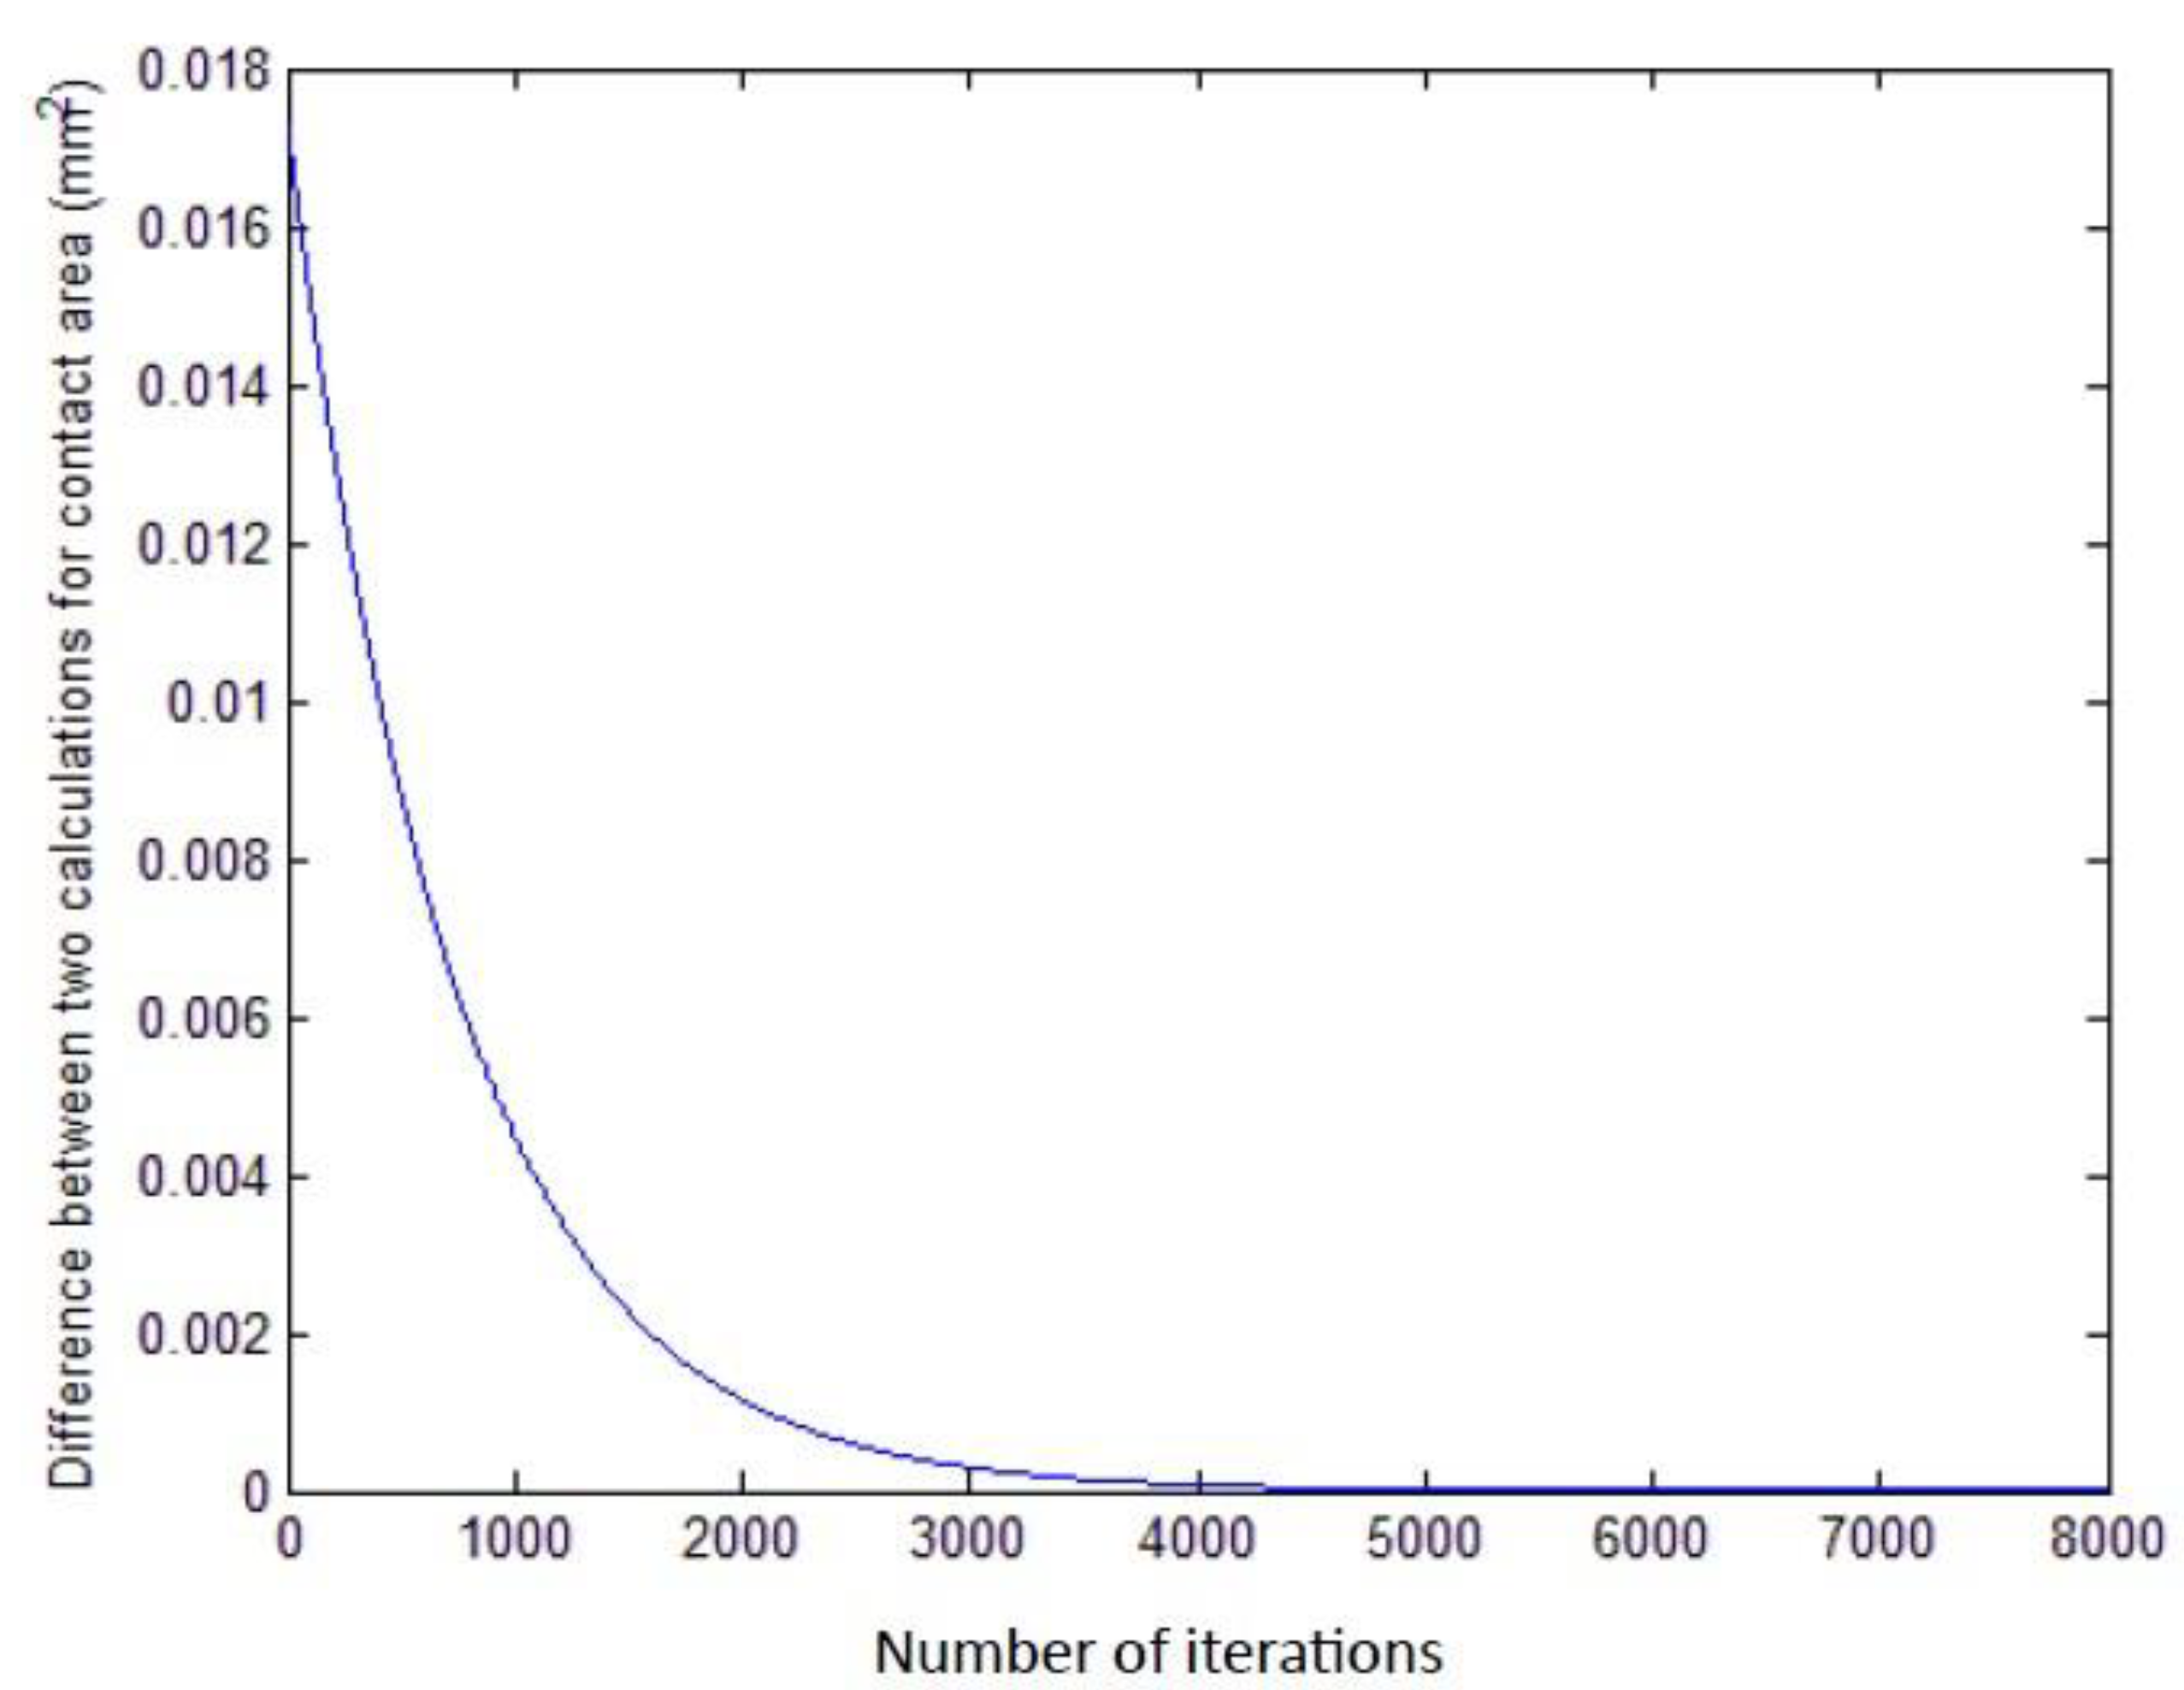
3.2.2. Difference between Two Calculations for Contact Areas (mm2)

To calculate the difference between two calculations for contact areas, for example, for a speed ratio of 1.1, a 20% reduction, and a 80 mm strip width, Equation (21) is used.
ε 2 = a r e a ( n + 1 ) a r e a ( n ) = 145.176 4 F ( n + 1 ) 145.176 4 F ( n ) = 4 F ( n + 1 ) + 4 F ( n ) = 4 F ( n + 1 ) 4 F ( n ) = 4 0.0011236 = 0.004494
Figure 11 shows the difference between two calculations for contact areas.
It can be seen from Figure 12 that the difference between two calculations for the contact area is 0.004494, which is exactly the same as the difference between two calculations for the area of the four corners, which means that ε 2 = ε 1 .

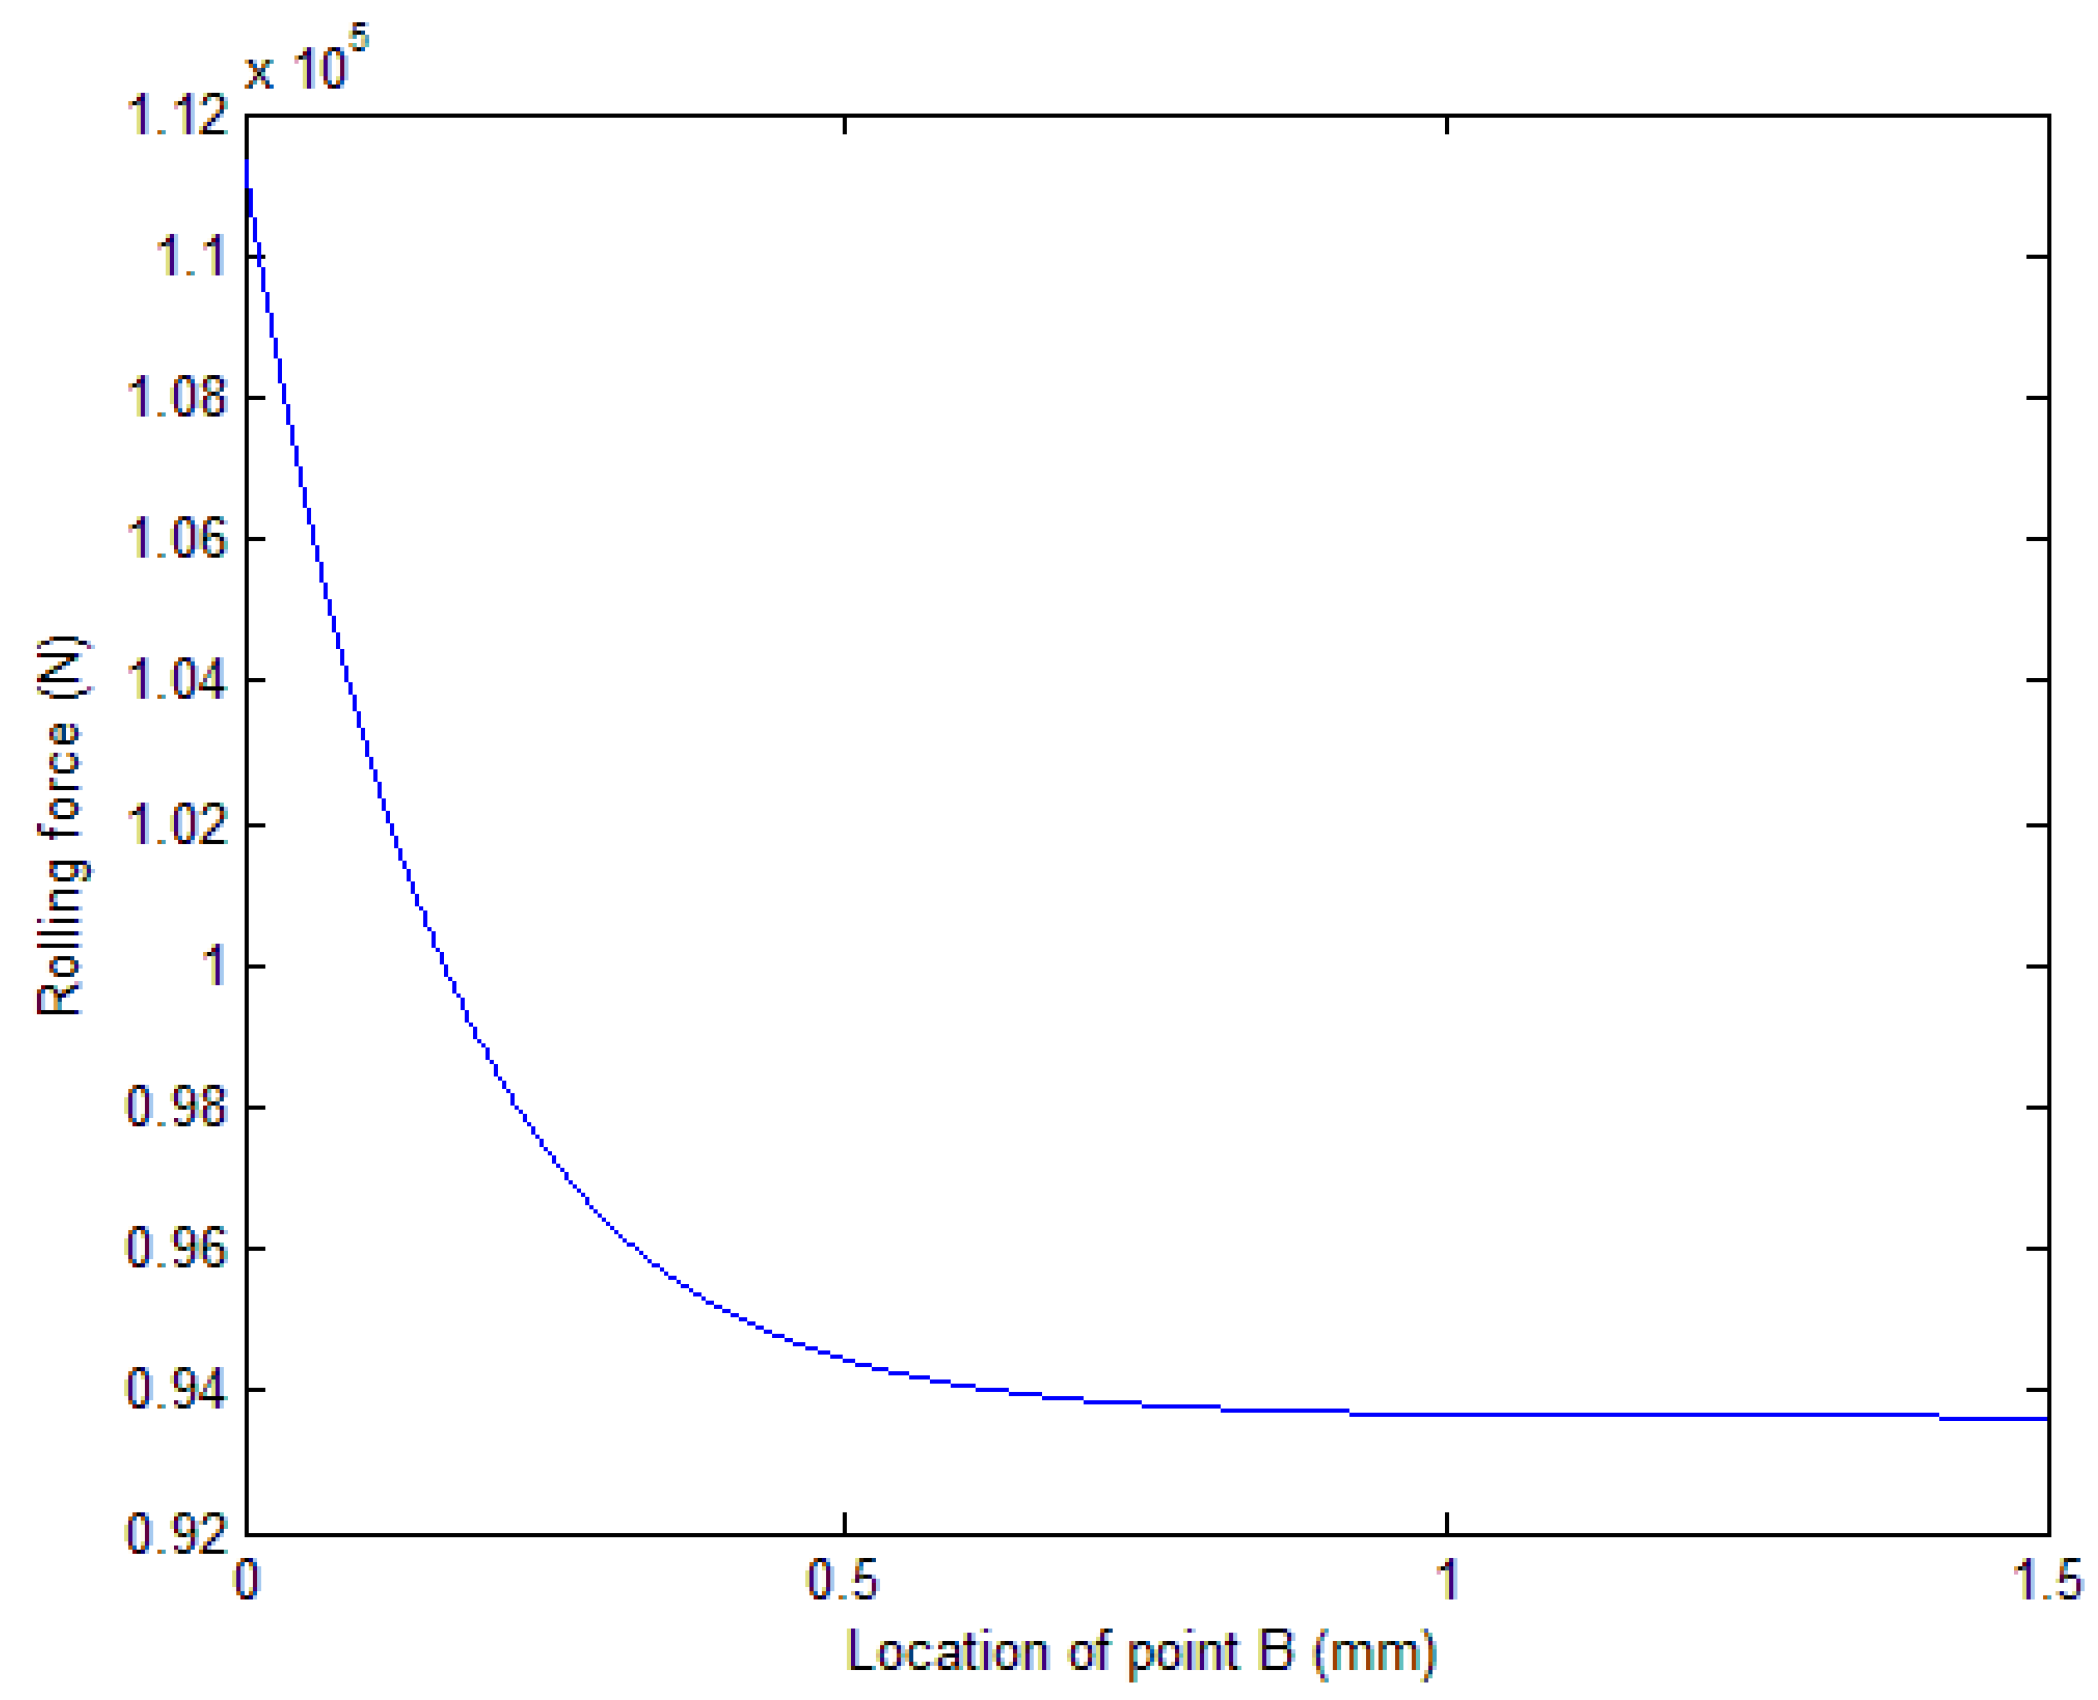
3.2.3. Difference between Two Calculations for Rolling Force (N)

Similarly, for the case of a speed ratio of 1.1, a 20% reduction, and a 80 mm strip width, the difference between two calculations for rolling force can be determined using Equation (23).
ε 3 = P 1 ( n + 1 ) P 1 ( n ) = p x   9.80665 x   a r e a ( n + 1 ) p x   9.80665 x   a r e a ( n ) = p x   9.80665 x a r e a ( n + 1 ) a r e a ( n + 1 ) = p x   9.80665 x   4 x F ( n + 1 ) F ( n + 1 ) = K x   n x   9.80665 x   4 x F ( n + 1 ) F ( n + 1 ) = 1.15 x   y 0 9.80665 x   n x   9.80665 x   4 x F ( n + 1 ) F ( n + 1 ) = 1.15 x   520 x   1.05 x   4 x F ( n + 1 ) F ( n + 1 ) = 1.15 x   520 x   1.05 x   4 x   0.00433 x   e 0.001349 n = 10.87523 e 0.001349 n
where P1 is the rolling force, p is the unit pressure, K is the constraint yield stress, y0 is the yield stress, and n is the coefficient.
When n = 1000
ε 3 = 2.8221
It can be seen that ε 3 (2.8221) is in an agreement with the error calculated by Matlab, as shown in Figure 12.

4. Results and Discussion

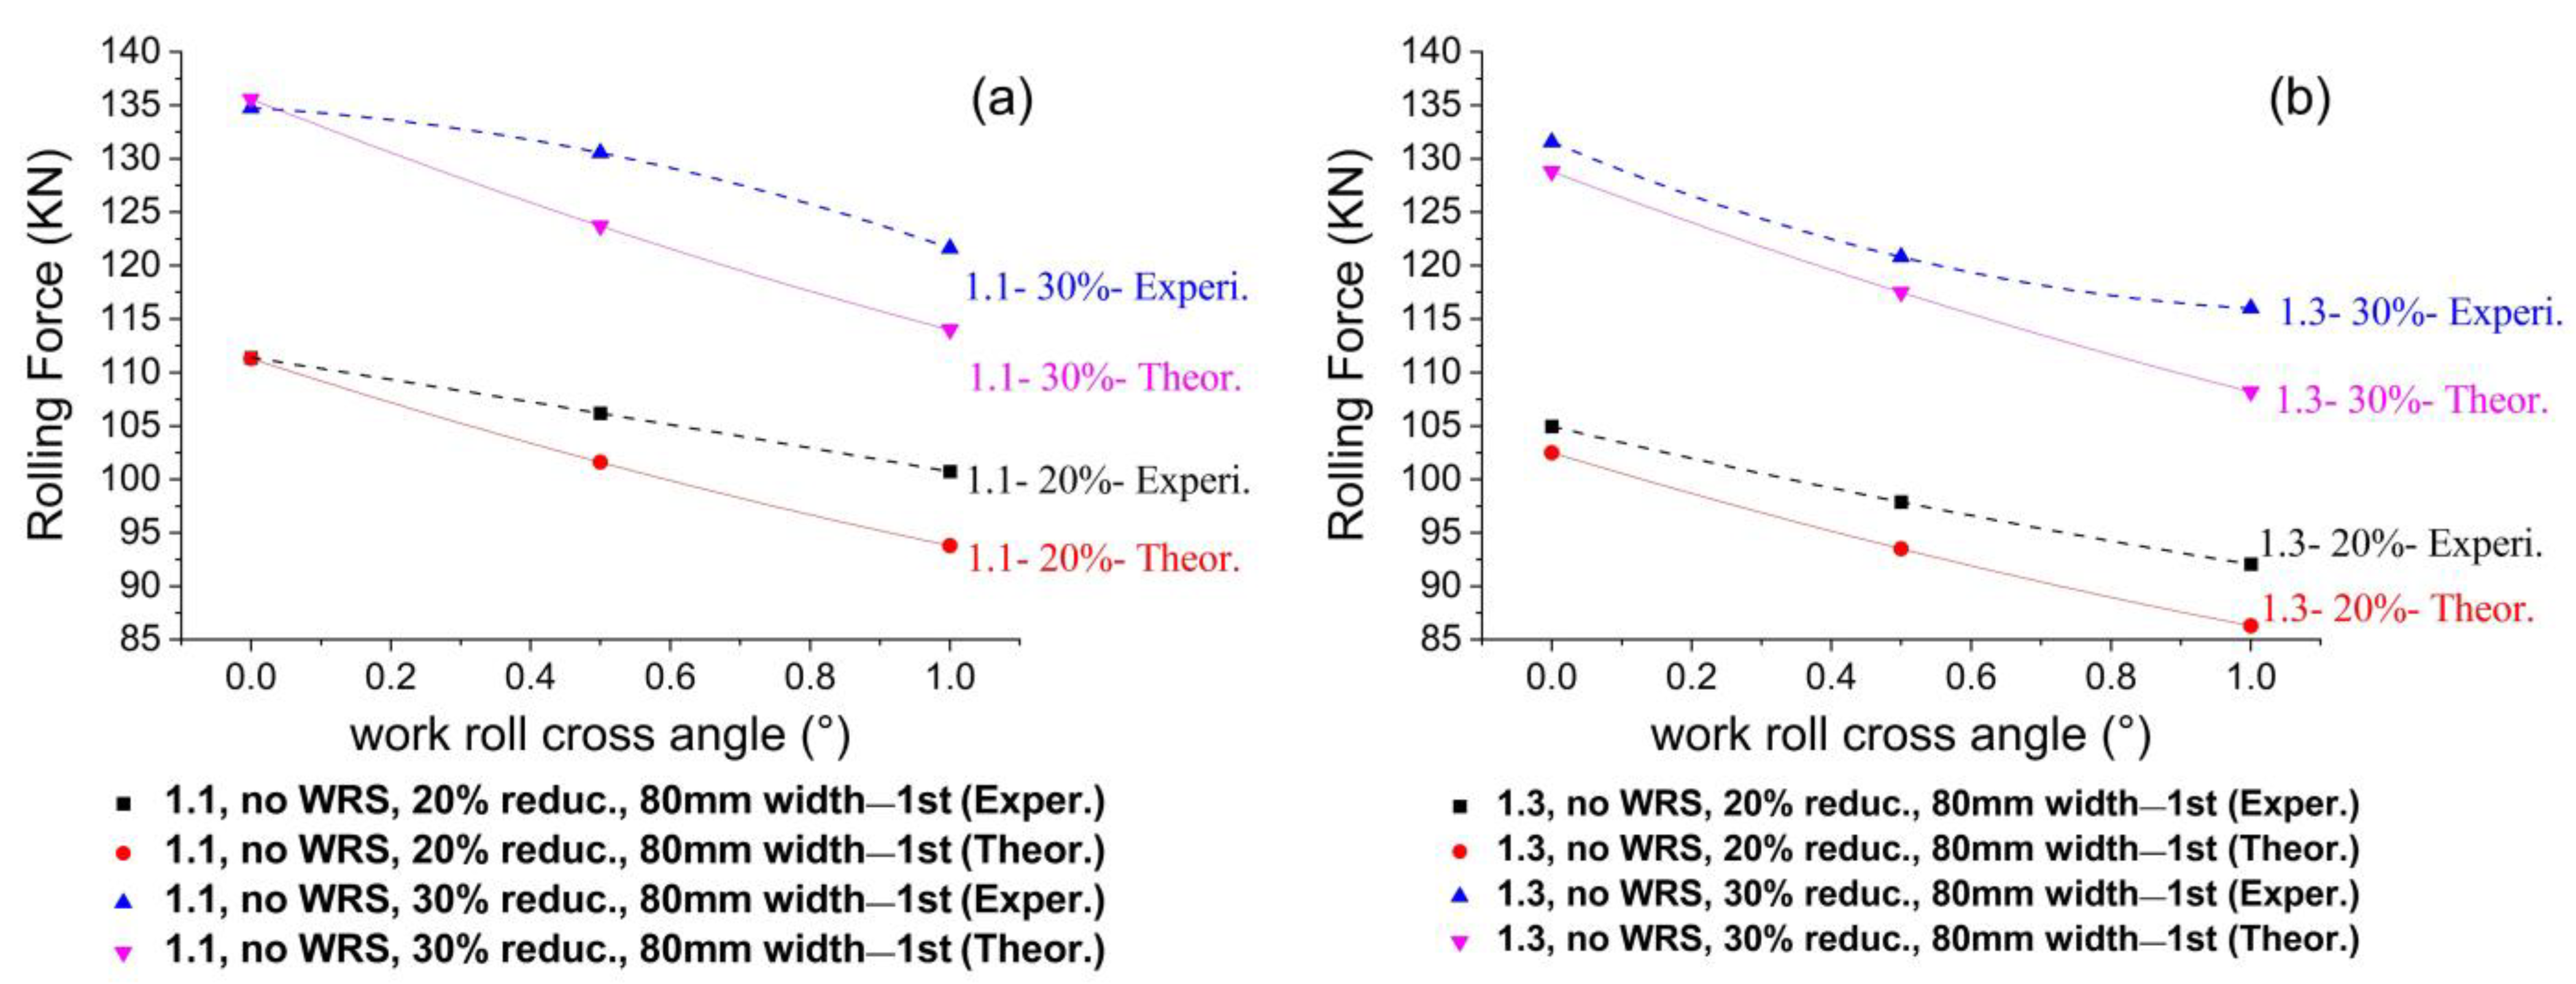
4.1. Calculated Rolling Force Compared to Experimental Rolling Force

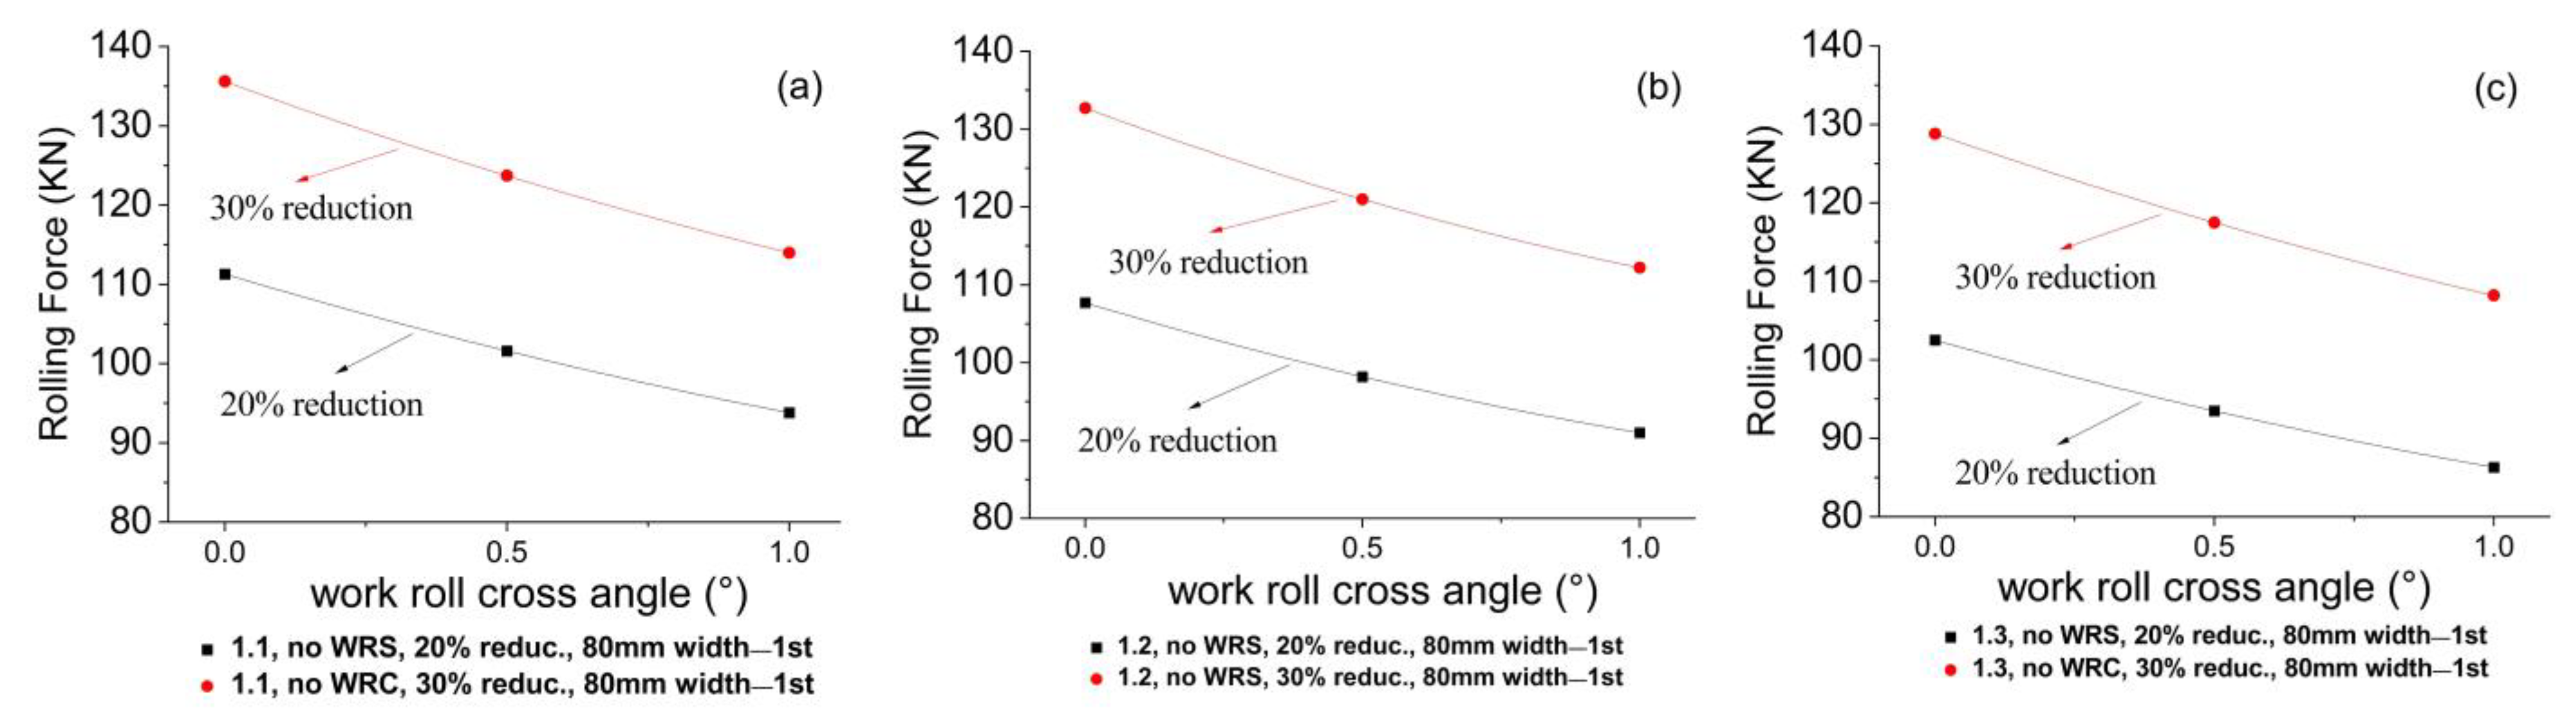
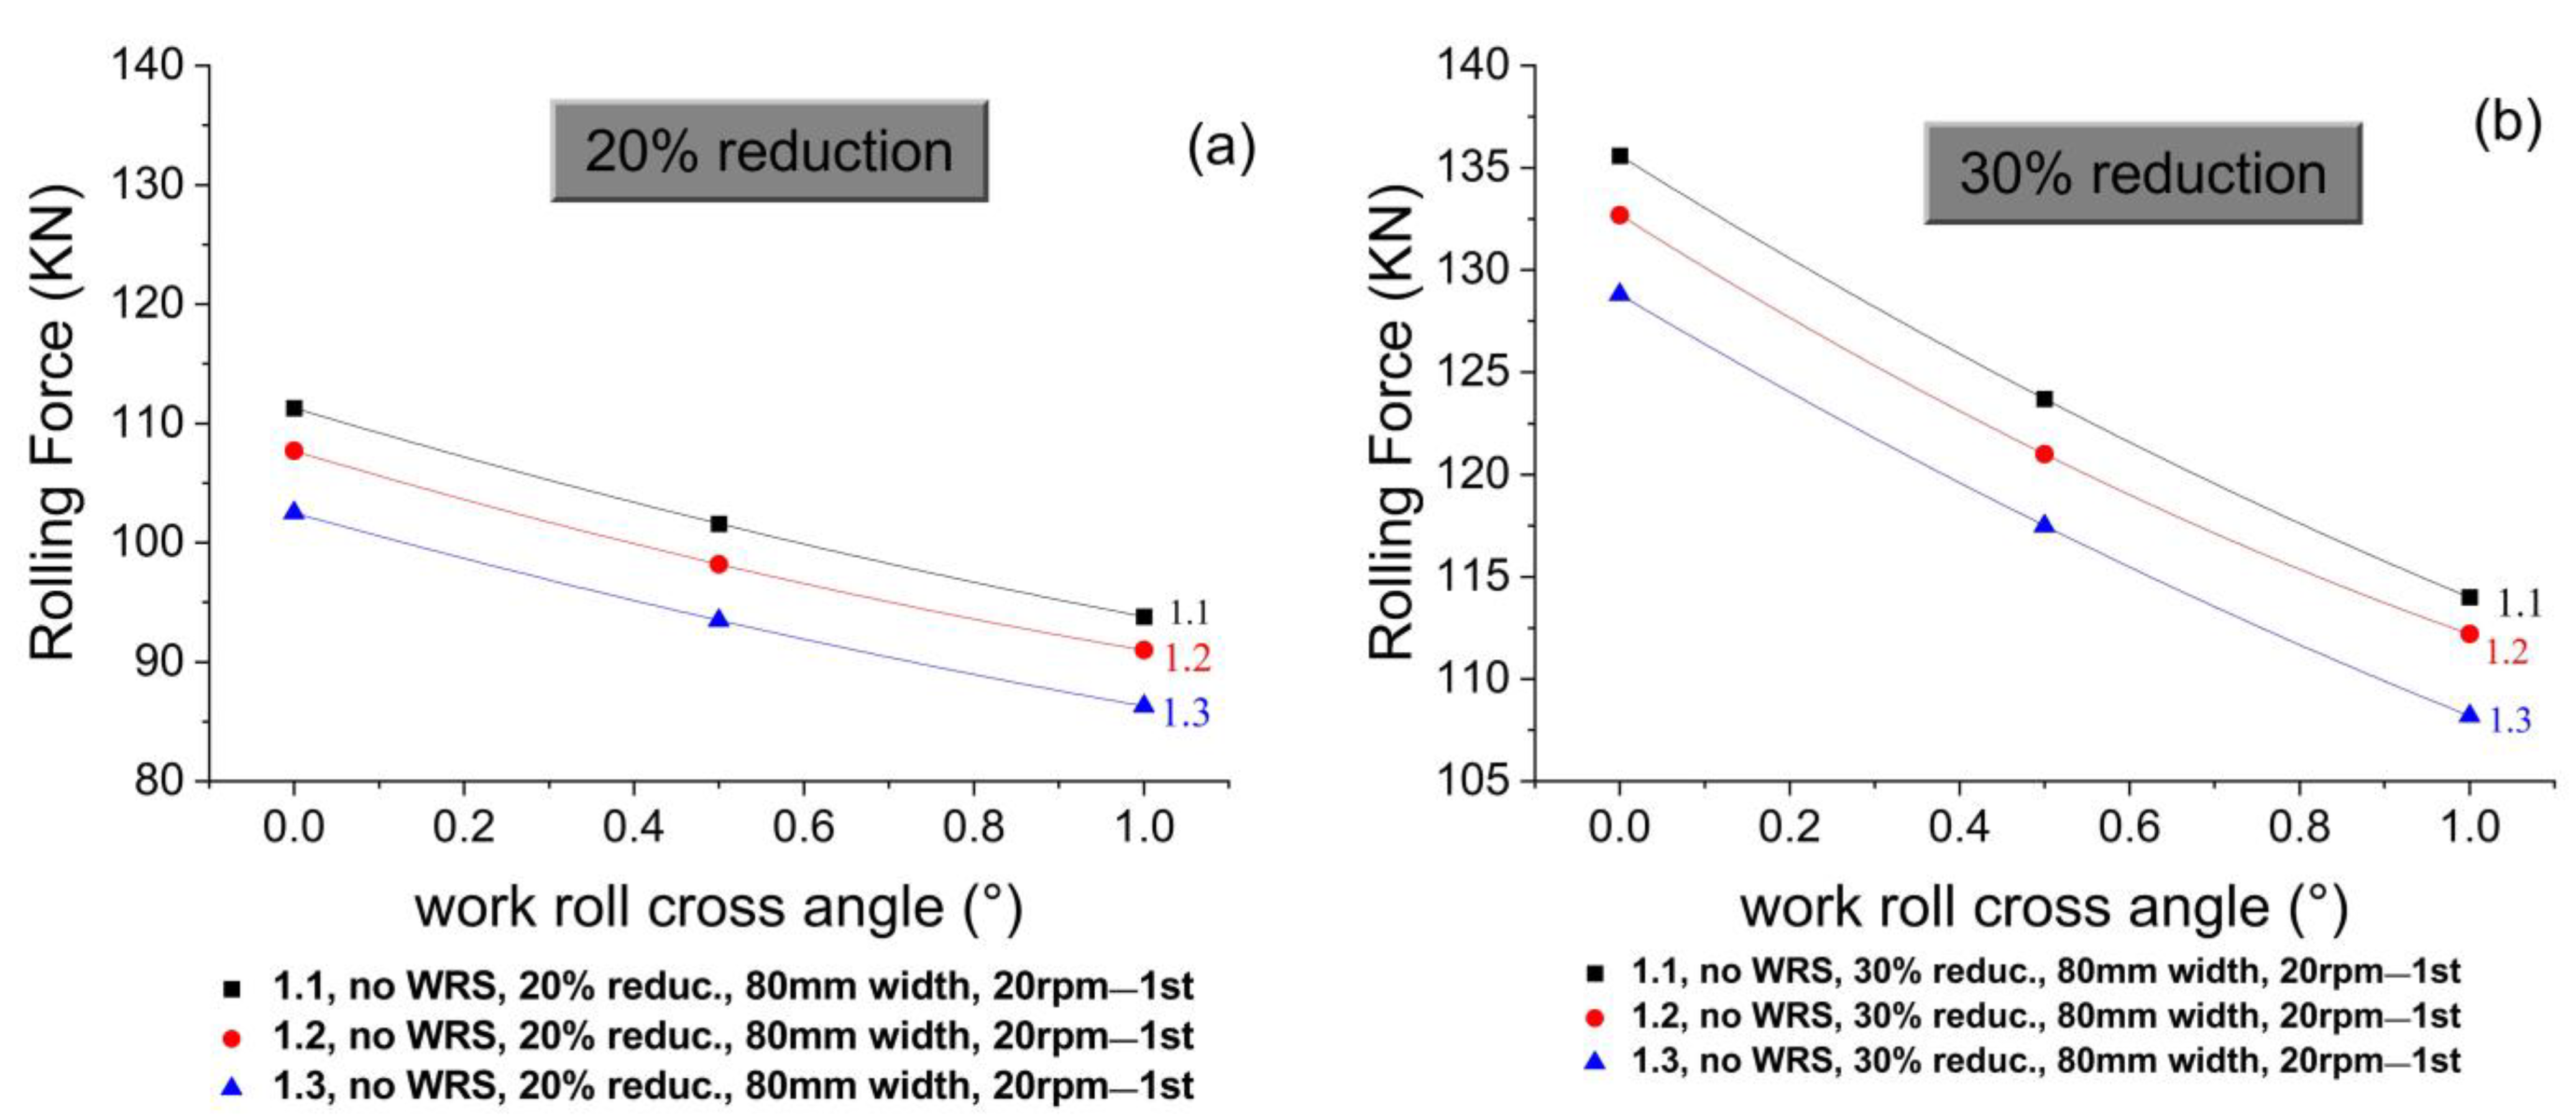
4.1.1. Effect of 1.1 Speed Ratio on Theoretical Rolling Force

Figure 13 shows a comparison between the effect of the roll crossing angle and work roll shifting value on the theoretical rolling force. The rolling force was observed to decrease when the work roll crossing and work roll shifting were combined. However, the rolling force reduction was more significant in the case of the work roll crossing angle. When the work roll shifting value increases, the rolling force reduced by about 9 kN (Figure 13a). However, this reduction in the rolling force increased in the case of a roll crossing angle by about 17 kN. Additionally, with the higher roll crossing angle (1°) and higher work roll shifting value (8 mm), the reduction in the rolling force became more significant, as shown in Figure 13b. This might be a result of reducing the contact area between the work roll and the strip. Furthermore, when there was axial side shifting of the work rolls, the rolling force distribution between the rolls changed. This action affected the overall rolling force and reduced it. Additionally, the work roll shifting method can help avoid asymmetrical roll wear by causing the rolling force to be reduced.

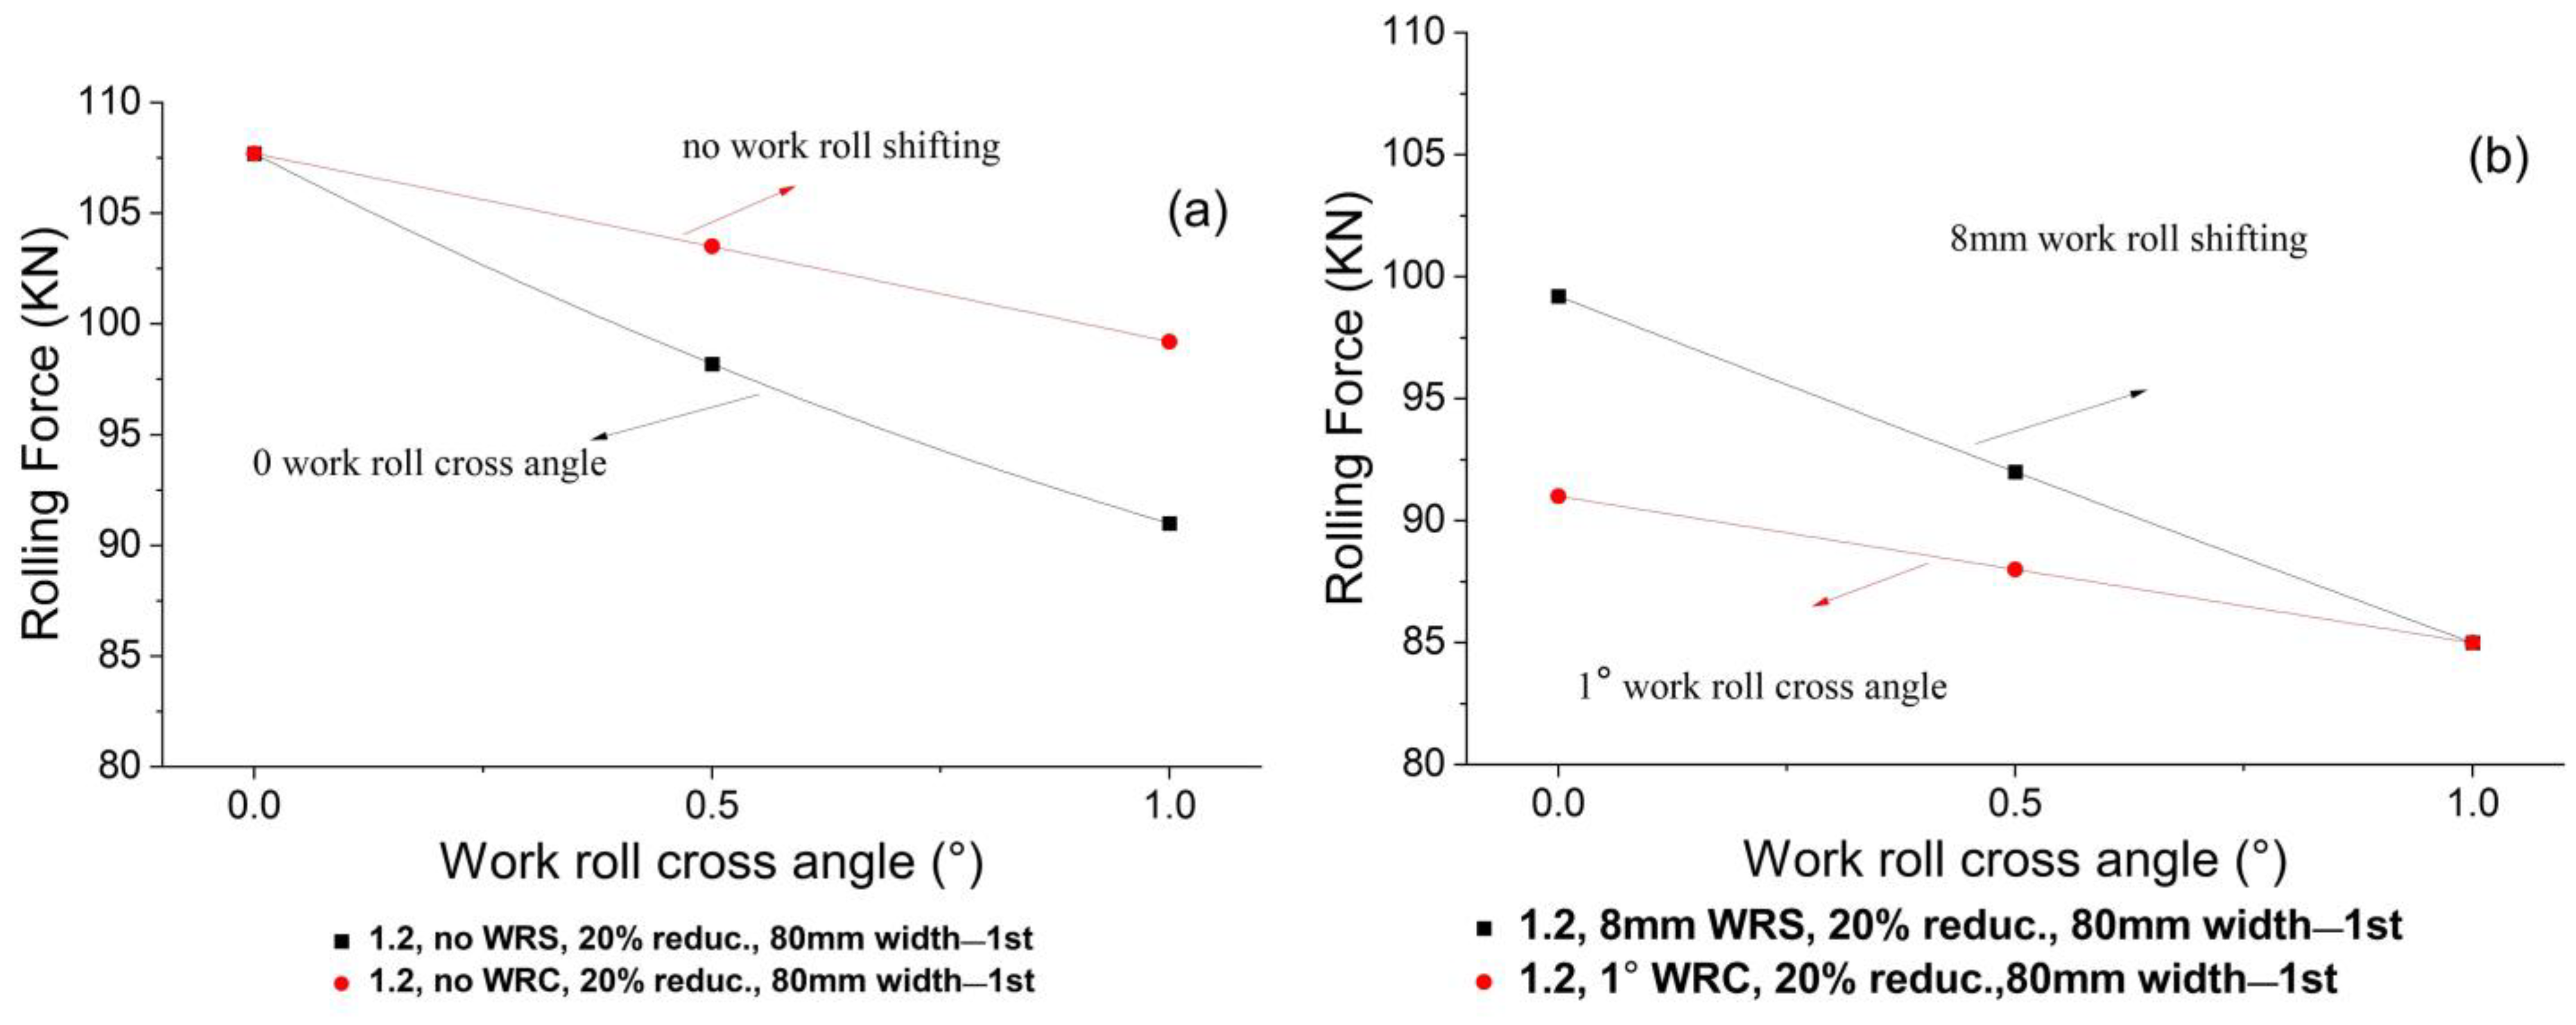
4.1.2. Effect of 1.2 Speed Ratio on the Theoretical Rolling Force

Under the effect of a 1.2 speed ratio, the rolling force that was required with no work roll shifting and no roll crossing was ~108 kN. This rolling force decreased as the roll crossing angle and work roll shifting values increased, as shown in Figure 14a. In the case of increasing the roll crossing angle and work roll shifting value to 1° and 8 mm, respectively, the required rolling force dropped to about 85 kN, as shown in Figure 13b, which means that the rolling force decreased by about 22 kN by increasing the roll crossing angle and work roll shifting. This is because the roll crossing angle can adapt the gap between the upper and lower work rolls, which leads to a reduction in the overall rolling force. Furthermore, in the case of increasing the work roll shifting value, the contact area between the upper and the lower work rolls decreases, so that less rolling force is applied on the top and bottom work rolls, which then reduces the total rolling force.

4.1.3. Effect of 1.3 Speed Ratio on the Theoretical Rolling Force

The effect of a speed ratio of 1.3 on rolling force is shown in Figure 15. Figure 15a shows the effect of no roll crossing and no work roll shifting values on the rolling force. The rolling force is found to be decreased by about 16 kN as the roll crossing angle increases from 0 to 1°. As the work roll shifting value increases from 0 to 8 mm, the rolling force decreases by about 8 kN. Either due to an increase in the work roll crossing angle to 1° or work roll shifting value to 8 mm (Figure 15b), the rolling force is significantly decreased. This shows that as the roll crossing angle increases, a uniform roll gap distribution throughout the contact area is obtained resulting in low resistance to the transverse flow of the material. Increasing the work roll shifting value produces a uniform distribution of rolling force; however, it does not reduce the rolling force as much as it does roll crossing. Moreover, the reason behind the reduction in the rolling force as the roll crossing angle increases is the existence of the cross-shear region which significantly reduces the rolling force.

4.1.4. Effect of Reduction Ratio on Theoretical Rolling Force

Figure 16a–c shows the effect of reduction ratio on rolling force at various work roll crossing angles and at 1.1, 1.2 and 1.3 speed ratios, respectively. It can be seen that the rolling force is higher for the higher reduction (30%) than that for the 20% reduction for the three cases of speed ratios. This is attributed to the large rolling force that is required to deform the material with a 30% reduction. Therefore, an increase in the reduction ratio does not significantly reduce the rolling force. For the same reduction, the rolling force drops significantly with an increase in the roll crossing angle from 0 to 1°. This means that increasing the roll crossing angle can create a uniform roll gap distribution that helps to reduce the rolling force during cold strip rolling.

4.1.5. Effect of Asymmetrical Rolling Process; 1.1 and 1.2 vs. 1.3 on the Theoretical Rolling Force

Figure 17a,b shows the effect of the roll crossing angle on the rolling force at different rolling speed ratios with no work roll shifting. It can be seen that with an increase in the roll crossing angle, the rolling force decreases dramatically for speed ratios of 1.1, 1.2 and 1.3 at both 20 and 30% reductions. Moreover, the rolling force decreases by about 5 kN as the speed ratio increases from 1.1 and 1.2 to 1.3 for both reductions (20 and 30%). This shows that as the difference between the upper and the lower work roll diameters increases, the speed ratio increases, and as the speed ratio increases, the cross shear region increases; hence, the rolling force significantly decreases.

4.1.6. Comparison of Theoretical Rolling Force with Experimental Rolling Force

For the purpose of model validation, the actual rolling force was measured through experimental work and compared with the theoretical rolling force. Figure 18a,b shows the comparison of the measured rolling force with that predicted through theoretical modelling under the roll crossing system at speed ratios of 1.1 and 1.3, and for 20 and 30% reductions, respectively. For the 1.1 speed ratio and a 30% reduction, the rolling forces were about 135 kN for both the theoretical and experimental conditions, without work roll shifting. When the roll crossing angle increased from 0 to 1° and the experimental rolling force decreased to 120 kN, while the theoretical rolling force decreased to about 115 kN. In the case of a 20% reduction without work roll shifting, the experimental and theoretical rolling forces were the same value of 112 kN. On the other hand, when the work angle increased to 1°, a deviation of the theoretical rolling force from experimental rolling forces occurred; it was 95 kN for the theoretical force and 100 kN for the experimental results.
Similar results were obtained at a 1.3 speed ratio. The rolling forces decreased as the roll crossing angle increased from 0 to 1° in the theoretical as well as experimental results. There is a good agreement between the theoretical and experimental results, as can be seen in Figure 18a,b. Therefore, during the asymmetrical cold rolling of a thin strip, the theoretical rolling force calculation method can reasonably predict and validate the rolling force with a consideration of roll crossing and work roll shifting.

5. Conclusions

The study resulted in the work roll shifting value increasing from 0 to 8 mm when the angle of roll crossing increased from 0 to 1°. Moreover, in the asymmetrical rolling process, the theoretical rolling force was decreased. The results prove that the roll crossing system has a greater effect on the rolling force than the work roll shifting system does.
It was found that when the speed ratio increased, the rolling force reduced. The speed ratio of 1.3 led to a decrease in the rolling pressure on the work rolls. In the case of asymmetrical cold rolling of thin strips, the developed theoretical model is a good tool with which to predict the rolling force, when roll crossing and shifting are considered. Finally, the work proves that there is a good agreement between the measured and theoretical rolling forces.

Author Contributions

Conceptualisation, A.A. and H.T.; methodology, H.T. and Z.J.; software, A.A.; validation, A.A., H.T. and H.A.; formal analysis, H.A.; investigation, F.Q. and Z.J.; resources, Z.J.; data curation, A.A.; writing—original draft preparation, A.A. and F.Q.; writing—review and editing, E.R.I.M.; visualisation, F.Q.; supervision, H.A.; project administration, E.R.I.M.; funding acquisition, E.R.I.M. All authors have read and agreed to the published version of the manuscript.

Funding

This research received no external funding.

Data Availability Statement

Not applicable.

Acknowledgments

The authors would like to express their appreciation for the support provided by the Scientific Research Deanship, Islamic University of Madinah, with Tamayyuz (2) grant number 658.

Conflicts of Interest

The authors declare that they have no known competing financial interests or personal relationships that could have appeared to influence the work reported in this paper.

Nomenclature

WRC, WRSThe work roll crossing combined with roll shifting for asymmetrical and symmetrical rolling mills
PCThe pair-cross mill, in which the backup roll and work roll axes of each top and bottom are crossed
h1Entry thickness of the strip, (mm)
h2Exit thickness of the strip, (mm)
pUnit pressure normally acting on the strip surface from the roll, (MPa)
PRoll-separating force, (N)
w1, w2Entry and exit width of rolled strip, (mm)
D1, D2The diameter of the top and bottom work rolls respectively, (mm)
µCoefficient of friction
R 1 , R 2 Radii of the upper and lower rolls respectively, (mm)
Δ h The difference between the entry and the exit thickness, (mm)
δ Coefficient delta
ε Reduction ratio, (%)
K, σ Constrained yield stress and yield stress, respectively, (MPa)
nExternal friction effect coefficient
L Total contact length between the work roll and the strip (without work roll crossing angle and work roll shifting), (mm)
l Contact length between top and bottom work rolls in case of shifting, (mm)
P 1 Theoretical rolling force, (N)
a 1 Contact area calculated from the iteration method, (mm2)
AD½ of the contact length between the work roll and the strip, (mm)
AC½ of the strip width, (mm)
Δ 1 Deflection of the work rolls, (mm)
Δ 2 Spring-back of the strip, (mm)
V Poisson’s ratio

References

  1. Wang, Q.; Li, J.; Wang, X.; Yang, Q.; Wu, Z. Evaluation Method and Application of Cold Rolled Strip Flatness Quality Based on Multi-Objective Decision-Making. Metals 2022, 12, 1977. [Google Scholar] [CrossRef]
  2. Yang, L.; Jiang, Z.; Zhang, Y.; Yu, H. High precision recognition and adjustment of complicated shape details in fine cold rolling process of ultra-thin wide strip. J. Manuf. Process. 2018, 35, 508–516. [Google Scholar] [CrossRef]
  3. Ren, Z.-K.; Xiao, H.; Yu, C.; Wang, J. Experimental study on transverse displacement of the metal during cold thin strip rolling. Procedia Eng. 2017, 207, 1326–1331. [Google Scholar] [CrossRef]
  4. Elahi, S.A.; Forouzan, M.R. Increasing the chatter instability speed limit in cold strip rolling using wavy layered composite plates as a damper. Thin-Walled Struct. 2019, 137, 19–28. [Google Scholar] [CrossRef]
  5. Boemer, D.; Carretta, Y.; Laugier, M.; Legrand, N.; Papeleux, L.; Boman, R.; Ponthot, J.P. An advanced model of lubricated cold rolling with its comprehensive pilot mill validation. J. Mater. Process. Technol. 2021, 296, 117175. [Google Scholar] [CrossRef]
  6. Shen, S.; Guye, D.; Ma, X.; Yue, S.; Armanfard, N. Multistep networks for roll force prediction in hot strip rolling mill. Mach. Learn. Appl. 2022, 7, 100245. [Google Scholar] [CrossRef]
  7. Zheng, G.; Yang, Z.; Cao, R.; Zhang, W.; Li, H. Adaptive learning prediction on rolling force in the process of reversible cold rolling mill. In Proceedings of the Intelligent Robotics and Applications: 5th International Conference, Montreal, QC, Canada, 3–5 October 2012; pp. 66–75. [Google Scholar]
  8. Shan, W.; Chen, Y.; Wang, X.; Yu, C.; Wu, K.; Han, Z. Nonlinear Dynamic Characteristics of Deep Groove Ball Bearings with an Improved Contact Model. Machines 2023, 11, 340. [Google Scholar] [CrossRef]
  9. Radionov, A.A.; Petukhova, O.I.; Ian, N.; Erdakov, I.N.; Karandaev, A.S.; Boris, M.; Loginov, B.M.; Khramshin, V.R. Developing an Automated System to Control the Rolled Product Section for a Wire Rod Mill with Multi-Roll Passes. J. Manuf. Mater. Process. 2022, 6, 88. [Google Scholar] [CrossRef]
  10. Tselikov, A. Present state of theory of metal pressure upon rolls in longitudinal rolling. Stahl 1958, 18, 434–441. [Google Scholar]
  11. Fleck, N.A.; Johnson, K.L.; Mear, M.E.; Zhang, L.C. Cold rolling of foil. Proc. Inst. Mech. Eng. 1992, 206, 119–131. [Google Scholar] [CrossRef]
  12. Le, H.; Sutcliffe, M. A robust model for rolling of thin strip and foil. Int. J. Mech. Sci. 2001, 43, 1405–1419. [Google Scholar] [CrossRef]
  13. Wang, X.S.; Peng, Y.; Xu, L.P.; Liu, H.M. A 3-D differential method for solving rolling force of PC hot strip mill. J. Iron Steel Res. Int. 2010, 17, 36–39. [Google Scholar] [CrossRef]
  14. Han, J.; Cheng, Q.; Hu, P.; Xing, H.; Li, S.; Ge, S.; Hua, X.; Hu, B.; Zhang, W.; Wang, K. Finite Element Analysis of Large Plastic Deformation Process of Pure Molybdenum Plate during Hot Rolling. Metals 2023, 13, 101. [Google Scholar] [CrossRef]
  15. Aljabri, A.; Jiang, Z.Y.; Wei, D.B.; Wang, X.D.; Tibar, H. Thin strip profile control capability of roll crossing and shifting in cold rolling mill. Mater. Sci. Forum 2014, 773–774, 70–78. [Google Scholar] [CrossRef]
  16. Aljabri, A.; Jiang, Z.; Wei, D. Analysis of thin strip profile during asymmetrical cold rolling with roll crossing and shifting mill. Adv. Mater. Res. 2014, 894, 212–216. [Google Scholar] [CrossRef]
  17. Aljabri, A.; Jiang, Z.Y.; Wei, D.B.; Wang, X.D.; Tibar, H. Modeling of thin strip profile during cold rolling on roll crossing and shifting mill. In Proceedings of the 8th Pacific Rim International Congress on Advanced Materials and Processing, Waikoloa, HI, USA, 4–9 August 2013; Springer: Berlin/Heidelberg, Germany, 2013; pp. 3001–3007. [Google Scholar]
  18. Aljabri, A.; Jiang, Z.; Wei, D. Analysis of thin strip profile by roll crossing and shifting in asymmetrical cold rolling. Int. J. Mod. Phys. B 2015, 29, 1540032. [Google Scholar] [CrossRef]
  19. Jiang, Z.; Tieu, A. A 3-D finite element method analysis of cold rolling of thin strip with friction variation. Tribol. Int. 2004, 37, 185–191. [Google Scholar] [CrossRef]
  20. Wójcik, Ł.; Pater, Z.; Bulzak, T.; Tomczak, J.; Lis, K. A Comparative Analysis of the Physical Modelling of Two Methods of Balls Separation. Materials 2021, 14, 7126. [Google Scholar] [CrossRef]
  21. Jacobs, L.J.M.; van Dam, K.N.H.; Wentink, D.J.; de Rooij, M.B.; van der Lugt, J.; Schipper, D.J.; Hoefnagels, J.P.M. Effect of asymmetric material entrance on lubrication in cold rolling. Tribol. Int. 2022, 175, 107810. [Google Scholar] [CrossRef]
  22. Shahani, A.; Setayeshi, S.; Nodamaie, S.A.; Asadi, M.A.; Rezaie, S. Prediction of influence parameters on the hot rolling process using finite element method and neural network. J. Mater. Process. Technol. 2009, 209, 1920–1935. [Google Scholar] [CrossRef]
  23. Devarajan, K.; Marimuthu, K.P.; Ramesh, A. FEM analysis of effect of rolling parameters on cold rolling process. Bonfring Int. J. Ind. Eng. Manag. Sci. 2012, 2, 35. [Google Scholar]
  24. Babajamali, Z.; Khabaz, M.K.; Aghadavoudi, F.; Farhatnia, F.; Eftekhari, S.A.; Toghraie, D. Pareto multi-objective optimization of tandem cold rolling settings for reductions and inter stand tensions using NSGA-II. ISA Trans. 2022, 130, 399–408. [Google Scholar] [CrossRef] [PubMed]
  25. Jiao, Z.J.; Liu, X.; Bu, J. Study of Rolling Force Calculation Models for Cold Rolling Process. Adv. Mater. Res. 2011, 154–155, 882–885. [Google Scholar] [CrossRef]
  26. Lu, X.; Sun, J.; Li, G.; Wang, Q.; Zhang, D. Dynamic analysis of vibration stability in tandem cold rolling mill. J. Mater. Process. Technol. 2019, 277, 47–57. [Google Scholar] [CrossRef]
  27. Wang, J.; Jiang, Z.Y.; Tieu, A.K.; Liu, X.H.; Wang, G.D. A method to improve model calculation accuracy of process control in tandem cold mills. In Proceedings of the 2007 2nd IEEE Conference on Industrial Electronics and Applications (ICIEA 2007), Harbin, China, 23–25 May 2007. [Google Scholar]
  28. Wang, J.; Jiang, Z.Y.; Tieu, K.; Liu, X. Adaptive calculation of deformation resistance model of online process control in tandem cold mill. J. Mater. Process. Technol. 2005, 162, 585–590. [Google Scholar] [CrossRef]
  29. Hao, P.; Liu, Y.; Wang, Z.; Wang, T.; He, D.; Huang, Q.; Wang, Z. Analysis of force and deformation parameters in corrugated clad rolling. Int. J. Mech. Sci. 2023, 243, 108042. [Google Scholar] [CrossRef]
  30. Zhao, Z. Metal Plastic Deformation and Rolling Theory; Metallurgical Industry Press: Beijing, China, 1980. [Google Scholar]
  31. Su, F.; Jiang, J.; Chen, T. An Accurate Mathematical Model of Roll Flattened Arc Length. Acta Metall. Sin. 1984, 1, 17. [Google Scholar]
  32. Qu, F.; Jiang, Z.; Wei, D.; Chen, Q.; Lu, H. Study of micro flexible rolling based on grained inhomogeneity. Int. J. Mech. Sci. 2017, 123, 324–339. [Google Scholar] [CrossRef]
  33. Mathematical Constant. Available online: https://en.wikipedia.org/wiki/Mathematical_constant (accessed on 15 October 2022).
Figure 1. Schematic diagram of the roll crossing angle and work roll shifting system: (a) work roll shifting system; (b) work roll crossing system.
Jmmp 07 00104 g001
Figure 2. Flow chart of calculation flow of prediction model.
Jmmp 07 00104 g002
Figure 3. Simplified schematic of (a) total contact areas for work roll cross angle in the roll gap, (b) a quarter of the total contact area, and (c) point B location along length AD.
Jmmp 07 00104 g003
Figure 4. Relationship between true strain and true stress for low-carbon steel.
Jmmp 07 00104 g004
Figure 5. Graph of the real contact area shape generated from Matlab.
Jmmp 07 00104 g005
Figure 6. Relationship between the rolling force and the location of point B for a 0.5° work roll crossing angle.
Jmmp 07 00104 g006
Figure 7. Relationship between the rolling force and the location of point B for a 1° work roll crossing angle.
Jmmp 07 00104 g007
Figure 8. Relationship between the rolling force and the location of point B for a 0.5° work roll crossing angle.
Jmmp 07 00104 g008
Figure 9. Relationship between the rolling force and the location of point B for a 1° work roll crossing angle.
Jmmp 07 00104 g009
Figure 10. Relationship between the difference of two calculations for the area of four corners and the number of iterations.
Jmmp 07 00104 g010
Figure 11. Relationship between the difference of two calculations for the contact area and the number of iterations.
Jmmp 07 00104 g011
Figure 12. Relationship between the difference of two calculations for the rolling force and the number of iterations.
Jmmp 07 00104 g012
Figure 13. Graphs showing the effect of work roll crossing angle and work roll shifting value on theoretical rolling force; (a) low WRC and WRS, and (b) high WRC and WRS.
Jmmp 07 00104 g013
Figure 14. Graphs showing the effect of a 1.2 speed ratio of the WRC to WRS value on rolling force; (a) low WRC and WRS, and (b) high WRC and WRS.
Jmmp 07 00104 g014
Figure 15. Graphs showing the effect of a 1.3 speed ratio of the WRC to WRS value on rolling force; (a) low WRC and WRS, and (b) high WRC and WRS.
Jmmp 07 00104 g015
Figure 16. Graphs showing the effect of (a) speed ratio of 1.1, (b) speed ration of 1.2, and (c) speed ratio of 1.3 on rolling force at reduction ratio of 20% vs. 30%.
Jmmp 07 00104 g016
Figure 17. Graphs showing the effect of different speed ratios on rolling force for (a) 20% reduction, and (b) 30% reduction.
Jmmp 07 00104 g017
Figure 18. Graphs showing the comparison between the theoretical rolling force and experimental rolling force at different reduction ratios of 20 and 30% for a (a) speed ratio of 1.1, and (b) a speed ratio of 1.3.
Jmmp 07 00104 g018
Table 1. Specification for the 4-high Hille 100 rolling mill.
Mill systemWork roll crossing and shifting
Cross angle 0–1.5°
Shifting value 0–8 mm
Work rollDiameter for upper work roll = 63 mm, lower work roll = 69 mm, length = 250 mm
Backup roll Diameter = 228 mm, length = 250 mm
Rolling force 0–1500 kN
Rolling torque0–13 kN m
Table 2. Values of coefficients delta and n value for reductions of 20 and 30%.
Speed Ratio Value   of   μ δ (20%) δ (30%) n Value (20%)n Value (30%)
1.10.092.311.891.051.03
1.20.082.11.71410.99
1.30.071.801.530.9450.95
Disclaimer/Publisher’s Note: The statements, opinions and data contained in all publications are solely those of the individual author(s) and contributor(s) and not of MDPI and/or the editor(s). MDPI and/or the editor(s) disclaim responsibility for any injury to people or property resulting from any ideas, methods, instructions or products referred to in the content.

