Article

Influence of Wire Arc Additive Manufacturing Beads’ Geometry and Building Strategy: Mechanical and Structural Behavior of ER70S-6 Prismatic Blocks

Mechanical Engineering Department, The American University in Cairo, Cairo 11835, Egypt
*
Author to whom correspondence should be addressed.
J. Manuf. Mater. Process. 2023, 7(1), 3; https://doi.org/10.3390/jmmp7010003
Submission received: 30 November 2022 / Revised: 19 December 2022 / Accepted: 21 December 2022 / Published: 24 December 2022
(This article belongs to the Special Issue Advances in Metal Additive Manufacturing/3D Printing)

Abstract

:
Wire arc additive manufacturing (WAAM) with high deposition rates has attracted industry interest for the demonstrated economic production of medium-to-large-scale metallic components. The structural integrity and mechanical properties of the built parts depend on the selection of the optimum deposition parameters and the tool path strategy. In this study, an alternate orthogonal deposition strategy was employed. The influence of the beads’ geometry and the associated heat input on the mechanical and structural behavior of mild steel (ER70S-6) were investigated. The influence of the bead width (BW) and the overlapping percentage (OP) between the adjacent beads on the average and layer-by-layer hardness of the blocks along the building direction were evaluated. Tensile strength was also characterized. The alternate orthogonal building strategy enhanced the geometrical uniformity of the built blocks and the microstructural isotropy along the building direction. Increasing the BW increased the total heat input per bead per layer, which significantly reduced the hardness and tensile strength of the built blocks by 19% and 17% compared to 8% and 7% when increasing the OP, respectively. Total heat input, number of heating cycles, and cooling rates triggered the phases formed, and their morphologies along the building direction were also characterized.

1. Introduction

Wire Arc Additive Manufacturing (WAAM) is a robotic-controlled additive manufacturing (AM) process that is composed of a welding wire feed (WF) stock. The electric arc, as a source of energy, melts the feeding wire while building the product bottom-up layer by layer. Gas metal arc welding (GMAW), plasma arc welding (PAW), and gas tungsten arc welding (GTAW) are types of WAAM that produce high deposition rates of 1–4 kg/h. WAAM products are associated with low capital cost compared to powder feed (PF) methods, as well as manufacturing medium-to-large products compared to PF processes at the expense of high resolution [1,2,3]. GMAW uses either inert or active gas or a mixture of both for shielding during the welding process. Controlling process parameters such as current intensity (I), voltage (V), wire feed speed (WFS), travel speed (TS), wire diameter, gas flow rate, wire composition, substrate thickness, and tool path strategy have significant influence on the product integrity, microstructure, and mechanical properties. Through a combination of these parameters, it is possible to create defect-free welding and fully integrated products with tailored mechanical and microstructural properties [4].
WAAM, as a versatile process, can be implemented in manufacturing innovative designs, incorporating new features, or creating functionally graded materials (FGM). To achieve this, controlling the deposition process, optimizing the process parameters, and assessing the integrity of the produced parts must be performed prior to the production of new parts [5,6]. For most WAAM applications, steel is adopted as a core material in industrial parts such as flanges, structural reinforcing beams, node joints, and pipe fittings and couplings [3,6].
ER70S-6 carbon manganese steel was selected, along with ER2209 (A duplex stainless steel alloy), as a potent FGM for marine risers, as studied by Chandrasekaran et al. [7]. The use of this FGM alloy resulted in significant improvements for corrosion resistance. The results were 12 times higher than the conventional carbon manganese alloy. In addition, higher strength was associated with the formation of martensitic phases [7]. Dirisu et al. [8] investigated the enhancement of the fatigue life of parts subjected to severe dynamic loading in different applications. Employing a combination of WAAM and subsequent rolling for the fabrication of mild steel (ER70S-6) parts resulted in fatigue life, surface waviness, and strength enhancements. This produced parts that can serve in different applications in the as-deposited state [8].
Although WAAM has proven its ability for producing parts with high integrity compared to PF processes, microstructural anisotropy remains one of the drawbacks similar to that of the PF systems. Due to the cyclic heating of the deposited metal, microstructural features such as bands formed between the deposited layers in the building direction (Z-axis) and dendritic-structured zones with detrimental microsegregations affect the overall mechanical and microstructural homogeneity [9]. This anisotropy is not significant when depositing multilayer single-bead mild steel (ER70S-6) parts with a height less than 10 mm. However, by increasing the overall heat input, resulting in lower cooling rates, a higher degree of anisotropy in the mechanical properties emerges as a consequence [1,10]. Furthermore, the deposition strategy is a critical parameter for controlling the part’s geometry, as the final surface corrugations and irregularities control the subsequent material waste associated with the postdeposition surface finishing process.
The high cooling rates at the start of each bead, due to the low substrate’s temperature, result in low penetration and larger bead dimensions (width and height) than the average predesigned bead values [11]. On the contrary, much higher penetration takes place at the end of the bead due to the lower cooling rate and heat build-up, which results in higher penetration and lower bead height than the average [12]. This geometrical inhomogeneity and irregularity in the part’s height are not only detrimental to the product’s geometry, but also to the microstructure of the deposited metal and the induced welding defects [12].
For further improvement of the geometrical accuracy and the poor surface quality resulting from its large heat input, hybrid additive/subtractive integrated robotic controlled systems have provided a substantial solution to this limitation [13]. However, to further enhance the geometrical accuracy, it is paramount to control the bead’s geometry, which is governed by the bead’s width and height, as well as measuring the beads’ OP between the neighboring deposited. The bead’s geometry is a critical parameter for WAAM, since it influences not only the part’s integrity and uniformity, but also the thickness of subtracted material at the surface finish stage. Additionally, the bead’s width and OP are a direct reflection of the total heat input during deposition, i.e., the wider the bead and/or the higher the OP between the adjacent beads, the higher the heat input.
In this study, the influence of the bead’s geometry and the associated deposition parameters on the mechanical and microstructural behavior of mild steel (ER70S-6) were investigated [13]. To minimize and control the geometrical and microstructural inhomogeneity, an orthogonal deposition of alternating starts and ends was employed for the building strategy of the prismatic blocks. The influence of the bead’s geometry and the associated heat input on the mechanical and structural behavior of mild steel (ER70S-6) were investigated. Influence of the bead width (BW) and the overlapping percentage (OP) between the adjacent beads on the average hardness and the layer-by-layer hardness of the blocks along the building direction were evaluated. Tensile strength was also characterized.

2. Materials and Methods

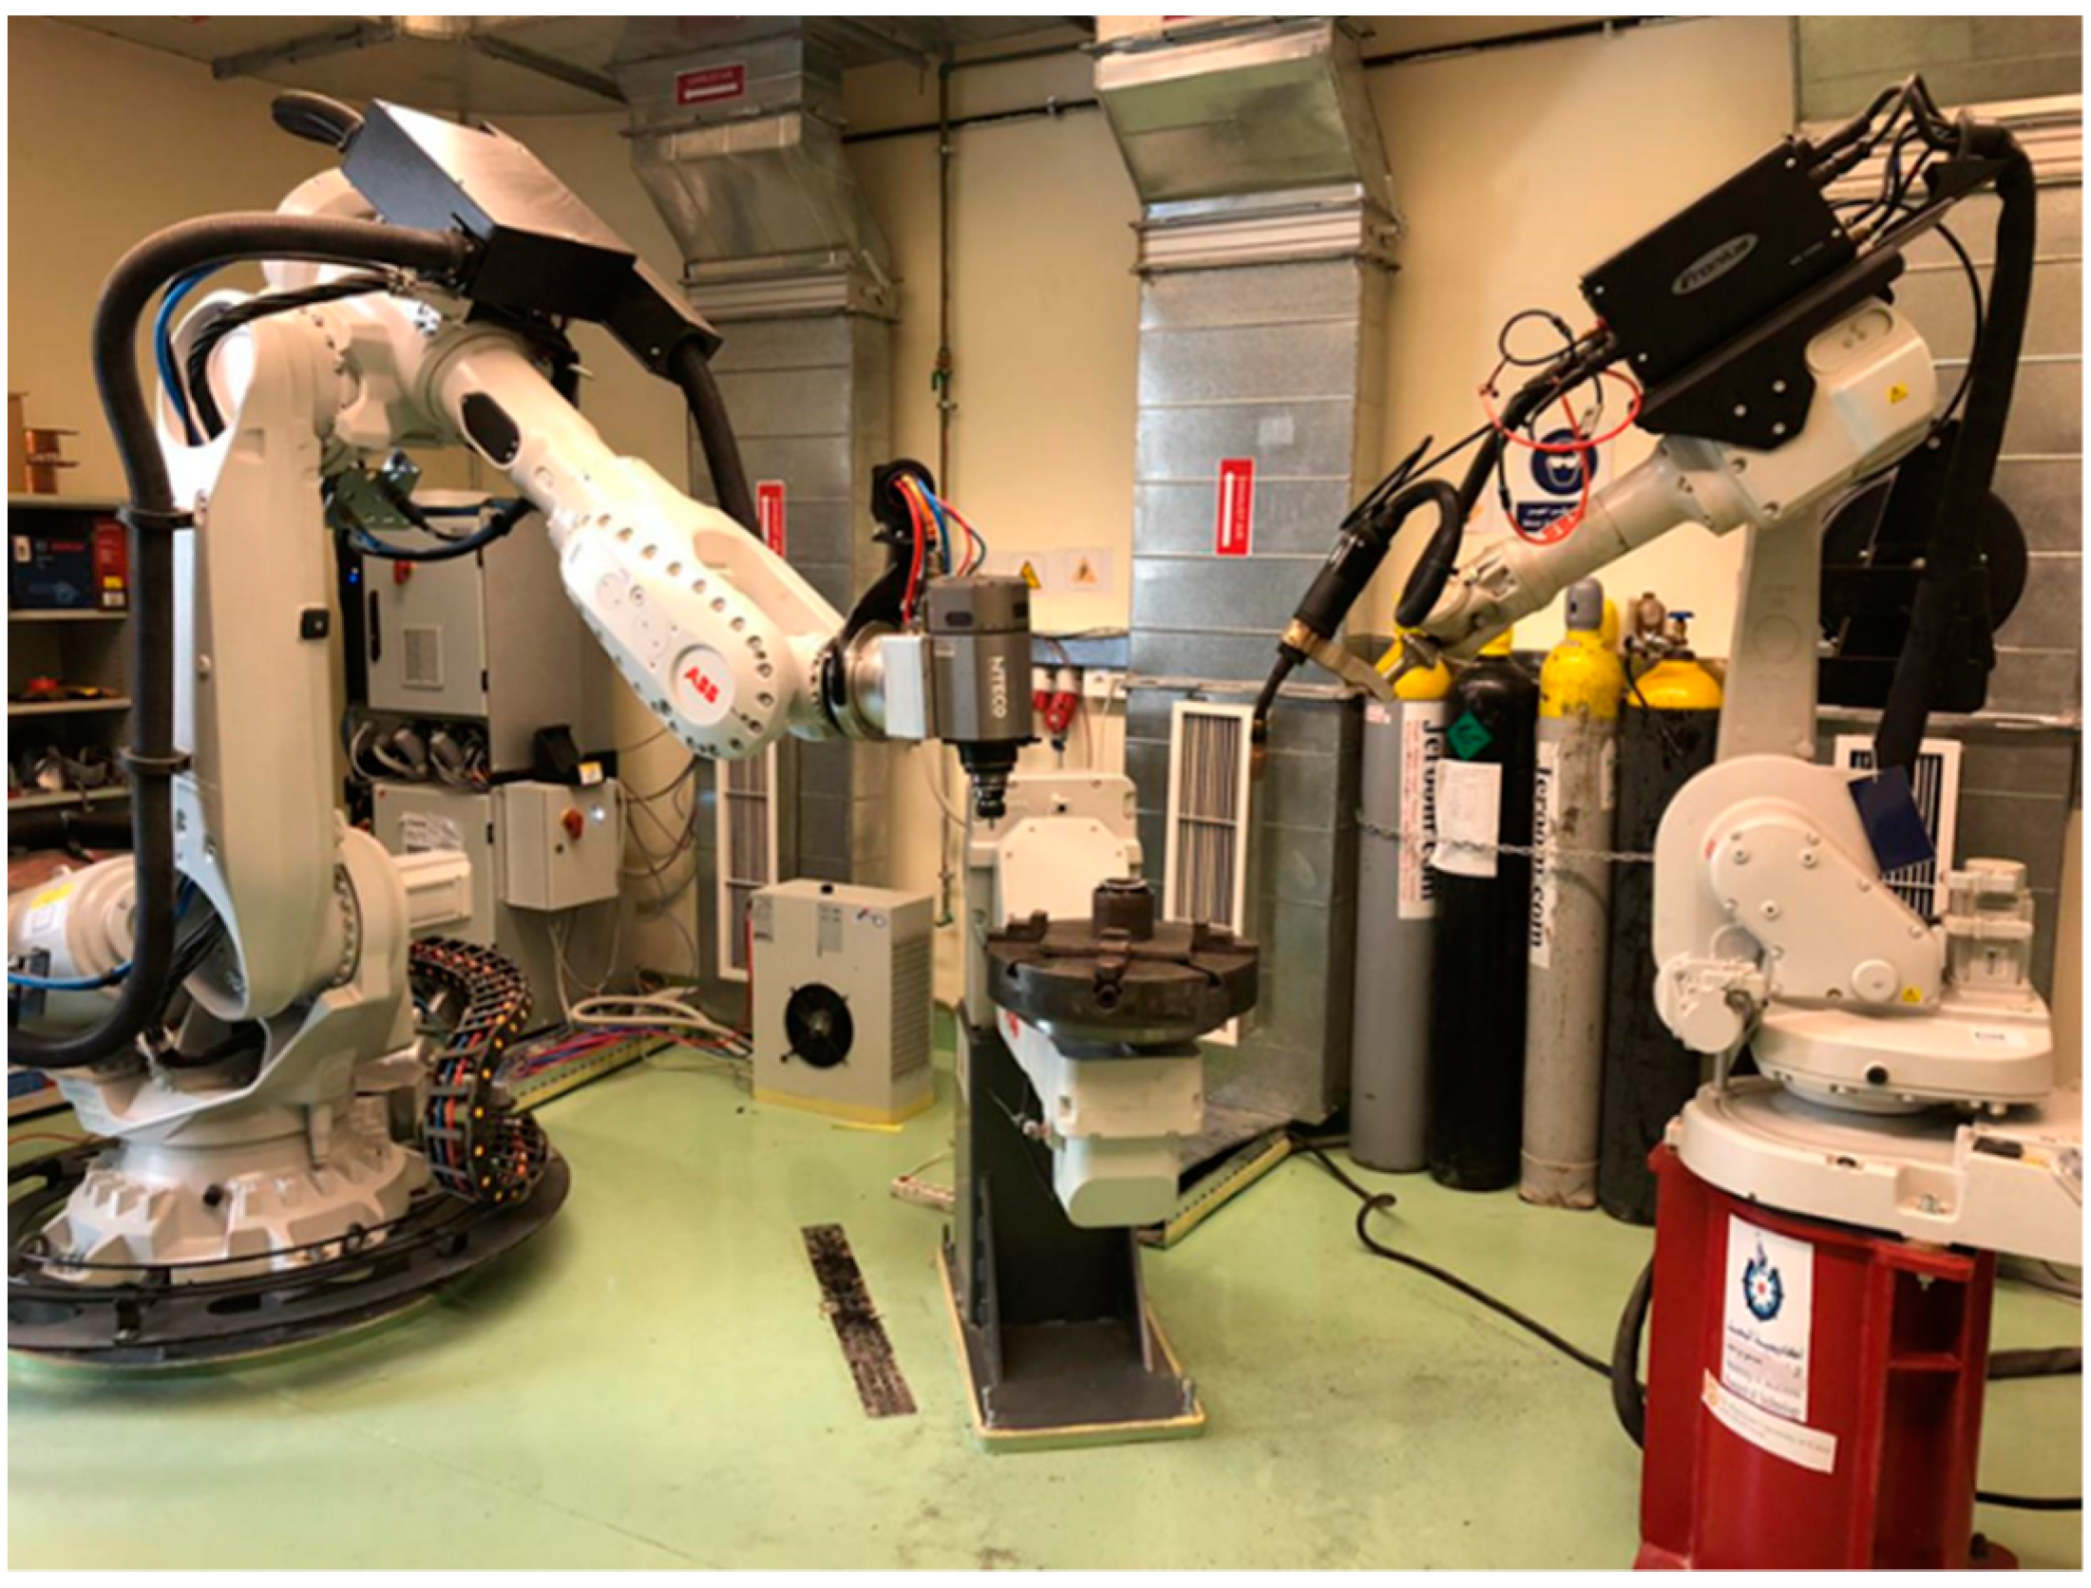
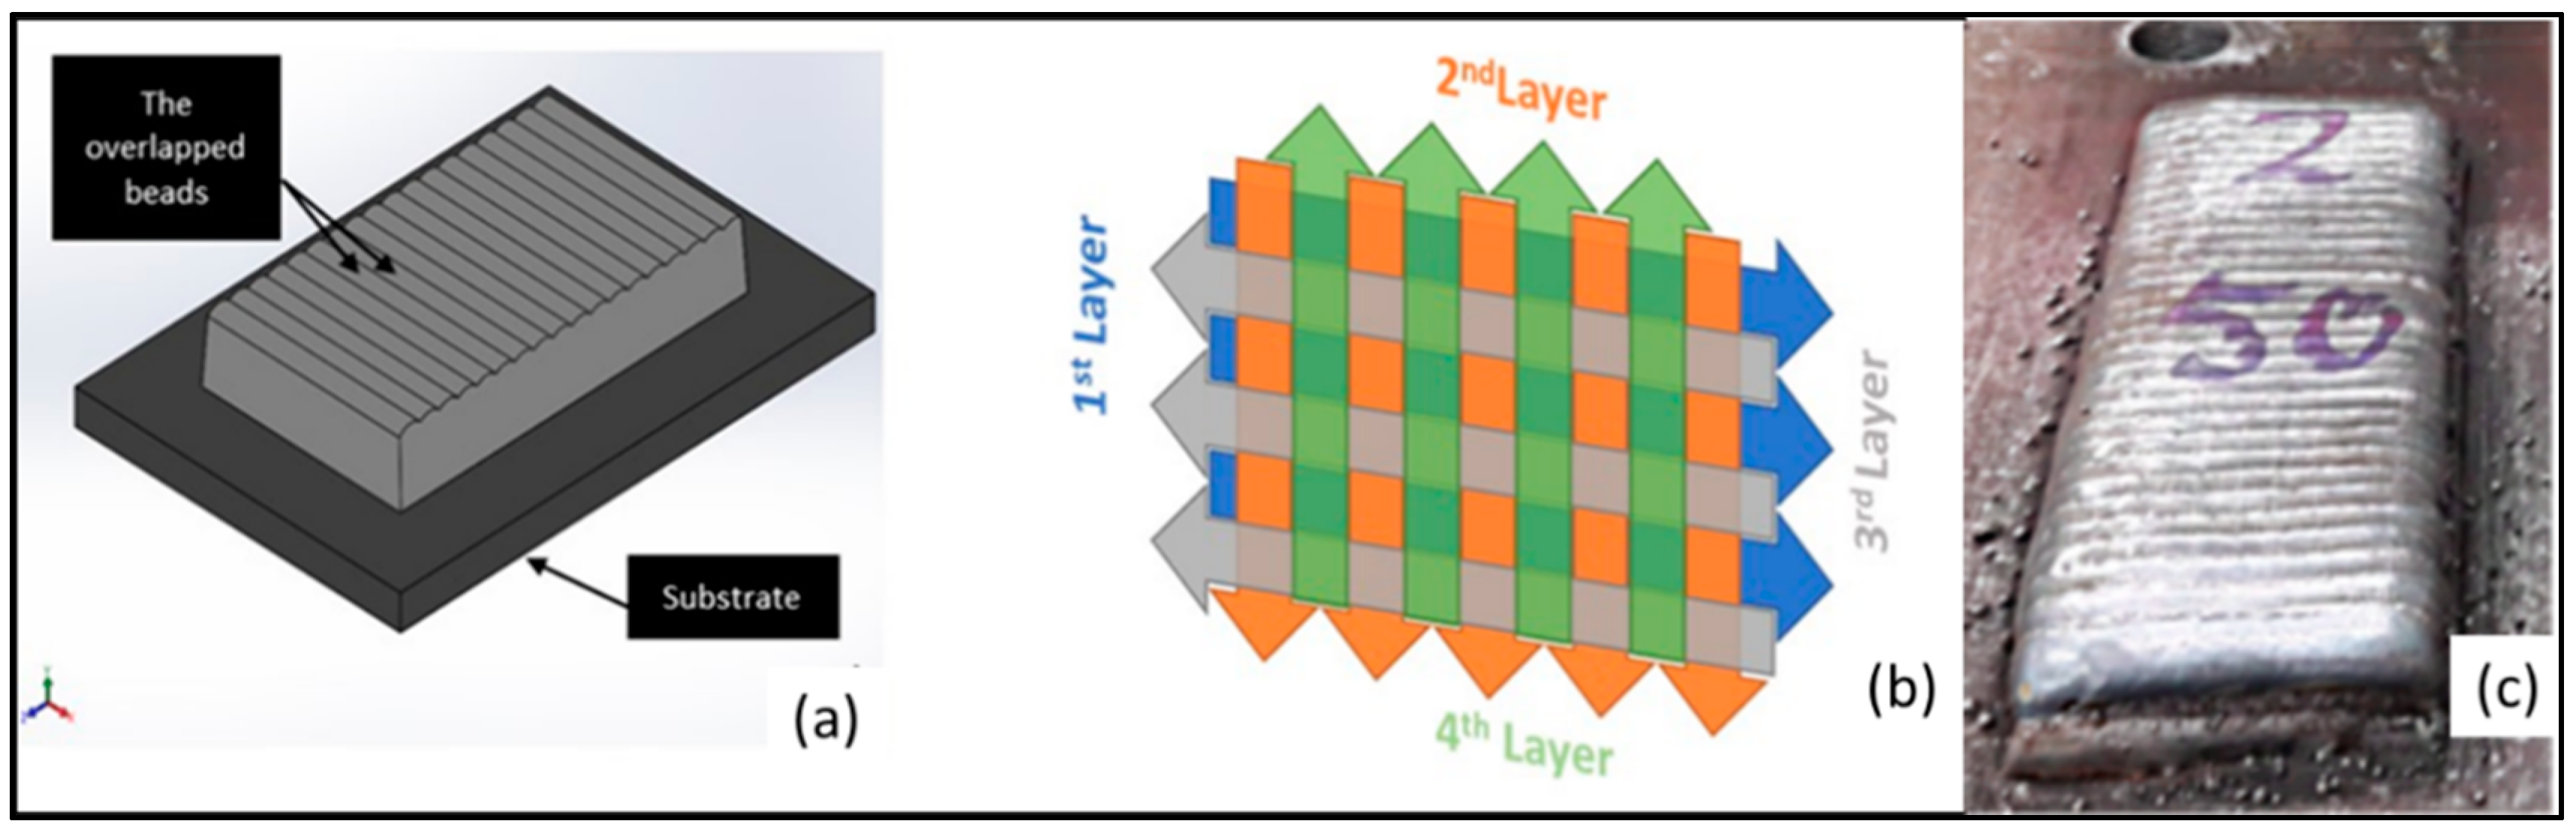
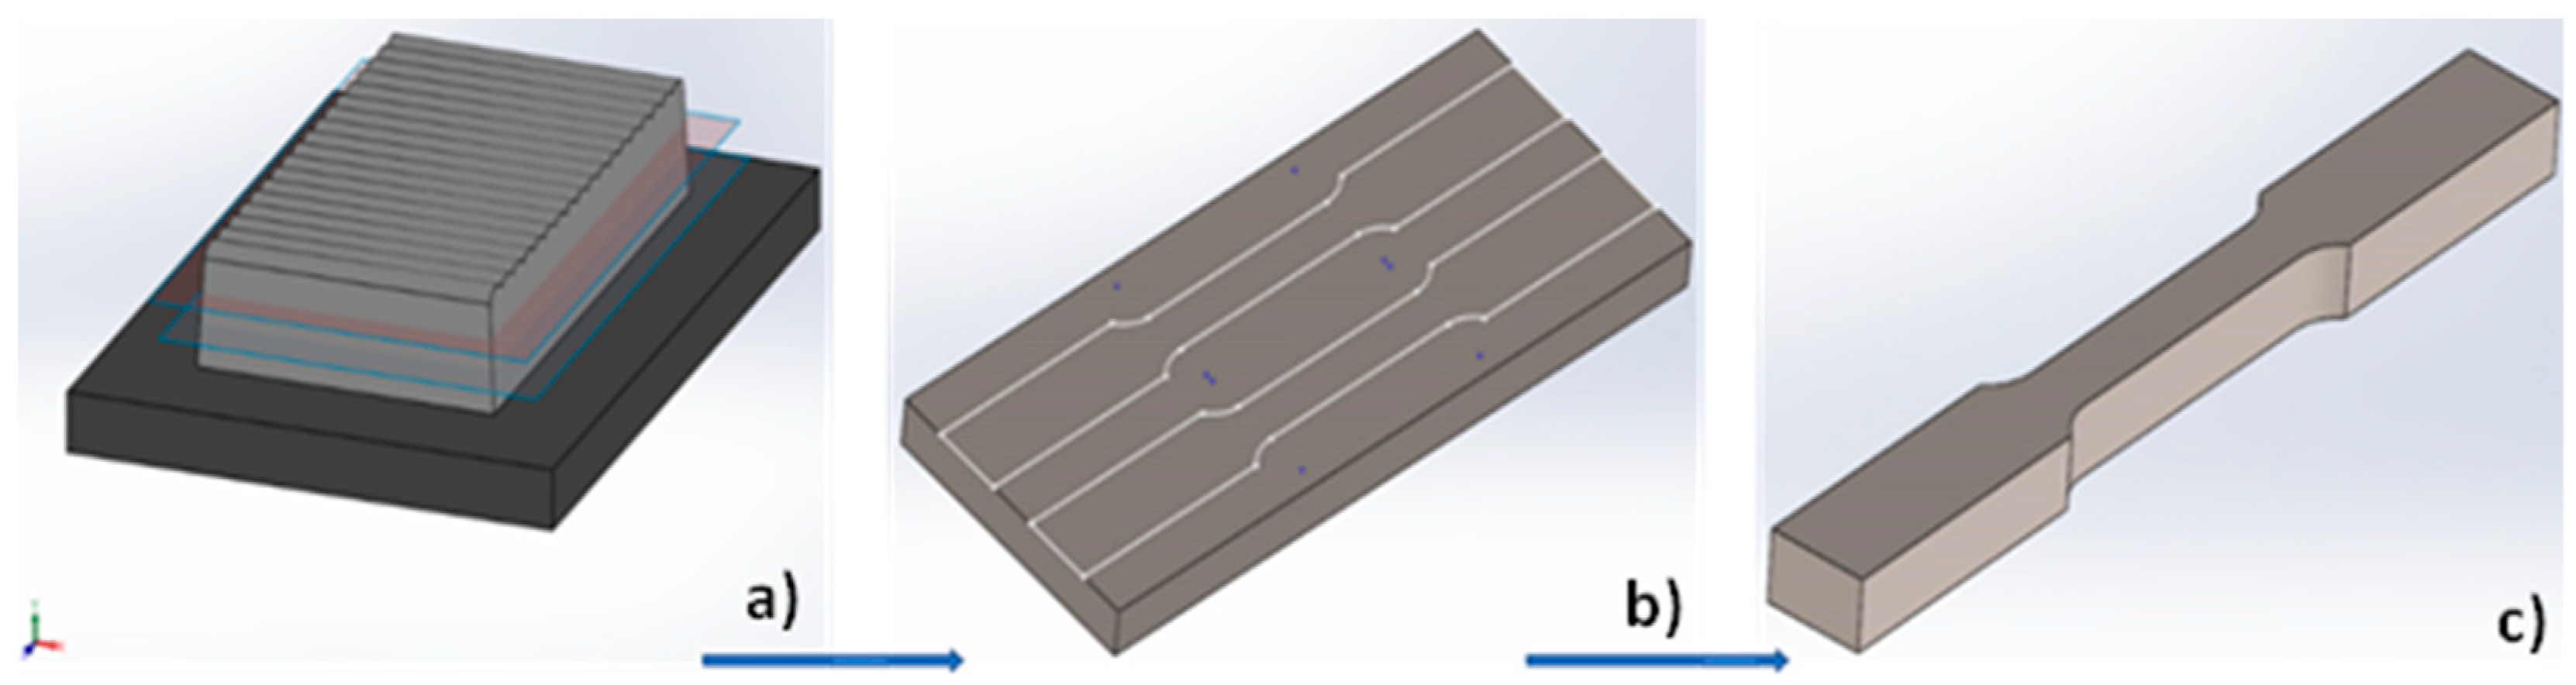
Material Used and Building Strategy

ER70S-6 copper-coated mild steel wire, 1.2 mm in diameter was used. The typical chemical composition of the low-carbon steel wire, as reported in AWS A5.18 standards [14], is listed in Table 1.
The prismatic blocks were built using gas metal arc welding (GMAW) process. A Fronius TransPuls Synergic 4000 power source and a welding torch connected to IRB 1600-6/1.45 ABB robotic arm were employed. Figure 1 shows the additive/subtractive robotic-controlled manufacturing system, Additive Manufacturing Centennial Lab (AMCL) at the American University in Cairo. Local shielding of (82% of argon and 18% of CO2) gas mixture was used with a constant flow rate of 15 L/min. The substrate used was ST37-2 steel plates with dimensions of 250 mm × 200 mm × 15 mm. The plates were clamped to the welding table using steel bolts and nuts. Prismatic blocks 113±1 mm in length and 43 ± 1 mm in width (Figure 2a) were deposited using different bead dimensions (5, 7, and 9 mm). The prismatic blocks were built using 4 layers deposited orthogonally with alternate starts and ends, as shown in Figure 2b. Figure 2c shows a picture for the as-WAAM-ed blocks. The 1st and the 3rd layers were deposited parallel to the long side of the block, while the 2nd and 4th layers were deposited parallel to the short side of the block (width), as shown in Figure 2b. The 4 layers were deposited based on alternating starts layer-by-layer along the building direction. The overlapping percentage (OP) is defined as a percentage value of the BW. The number of deposited beads is dependent on the block width, BW, and OP (Figure 3).
Deposition parameters were selected based on a prior-optimized deposition envelope for building uniform and integral beads. Table 2 summarizes the deposition parameters used for the selected beads’ dimensions and the total heat input associated with the bead’s geometry. The calculated heat input (Equation (1)) in Table 2 is a function of the welding power (current × voltage), the welding speed (WS), and an estimate process efficiency of 0.8, as it has been established over the years. The nozzle-to-workpiece distance was maintained at 12 mm. ID designation, listed in Table 3, was given to 9 combinations of BW and OPs to be investigated. Additionally, forced air cooling was used to reduce the interpass temperature of the material to ≤120 °C, as recommended by Spencer et al. for controlling the surface geometry and minimizing the residual stresses as well [15].
H e a t   I n p u t   ( Q ) = P r o c e s s   E f f i c i e n c y ( η )   V o l t a g e   ( V ) C u r r e n t   ( A ) W e l d i n g   S p e e d   ( W S )
Equation (1). Heat input of GMAW.

3. Characterization and Testing Techniques

3.1. Mechanical Properties Characterization

Macrohardness testing of the blocks was conducted on the four deposited layers using Zwick/Roell (ZHU) at a 3 kg (29.42 N) load (HV3) over a dwell time of 10 s. Similarly, hardness measurements were carried out on ground and polished sections, represented in Figure 4b.
For the five conditions (130, 140, 150, 230, and 330), additional blocks were built for mechanical and structural characterization. For tensile testing, specimens were cut at the mid-height of the blocks. Figure 5 shows the block where tensile specimens were cut using Wire-EDM. The specimen’s dimensions were chosen according to the ASTM E8/E8M-09 standard. The tensile test was performed using a universal testing machine MTS 810 hydraulic test frame with a 500 kN capacity, at a constant strain rate of 2 mm/min.
Reported values by Xie et al. for ultimate tensile strength (UTS) and yield strength (YS) of the 316L stainless steel were higher for vertical specimens as opposed to horizontal specimens, due to the anisotropy inherent in the WAAM process [16]. This variation could also be influenced by grain orientation, heat input, directionality of heat flow, layer stacking, and thermal gradient attained during the deposition process of WAAM-ed parts [17,18]. Therefore, tensile samples were cut along the length of the prismatic steel blocks. The tensile specimens were cut along the central zone of the block to guarantee the inclusion of both longitudinal and transverse successive deposited layers, as shown in Figure 5.
Furthermore, analysis of the fracture surfaces of the tensile specimens at constant OP (130, 230, and 330) was carried out using Neoscope (JCM-6000 Plus) JEOL Benchtop Scanning Electron Microscope (SEM). High-resolution images at magnifications of 22× and 1500× were extracted to characterize the fracture surface features and analyze the failure of the tested samples at each welding condition.

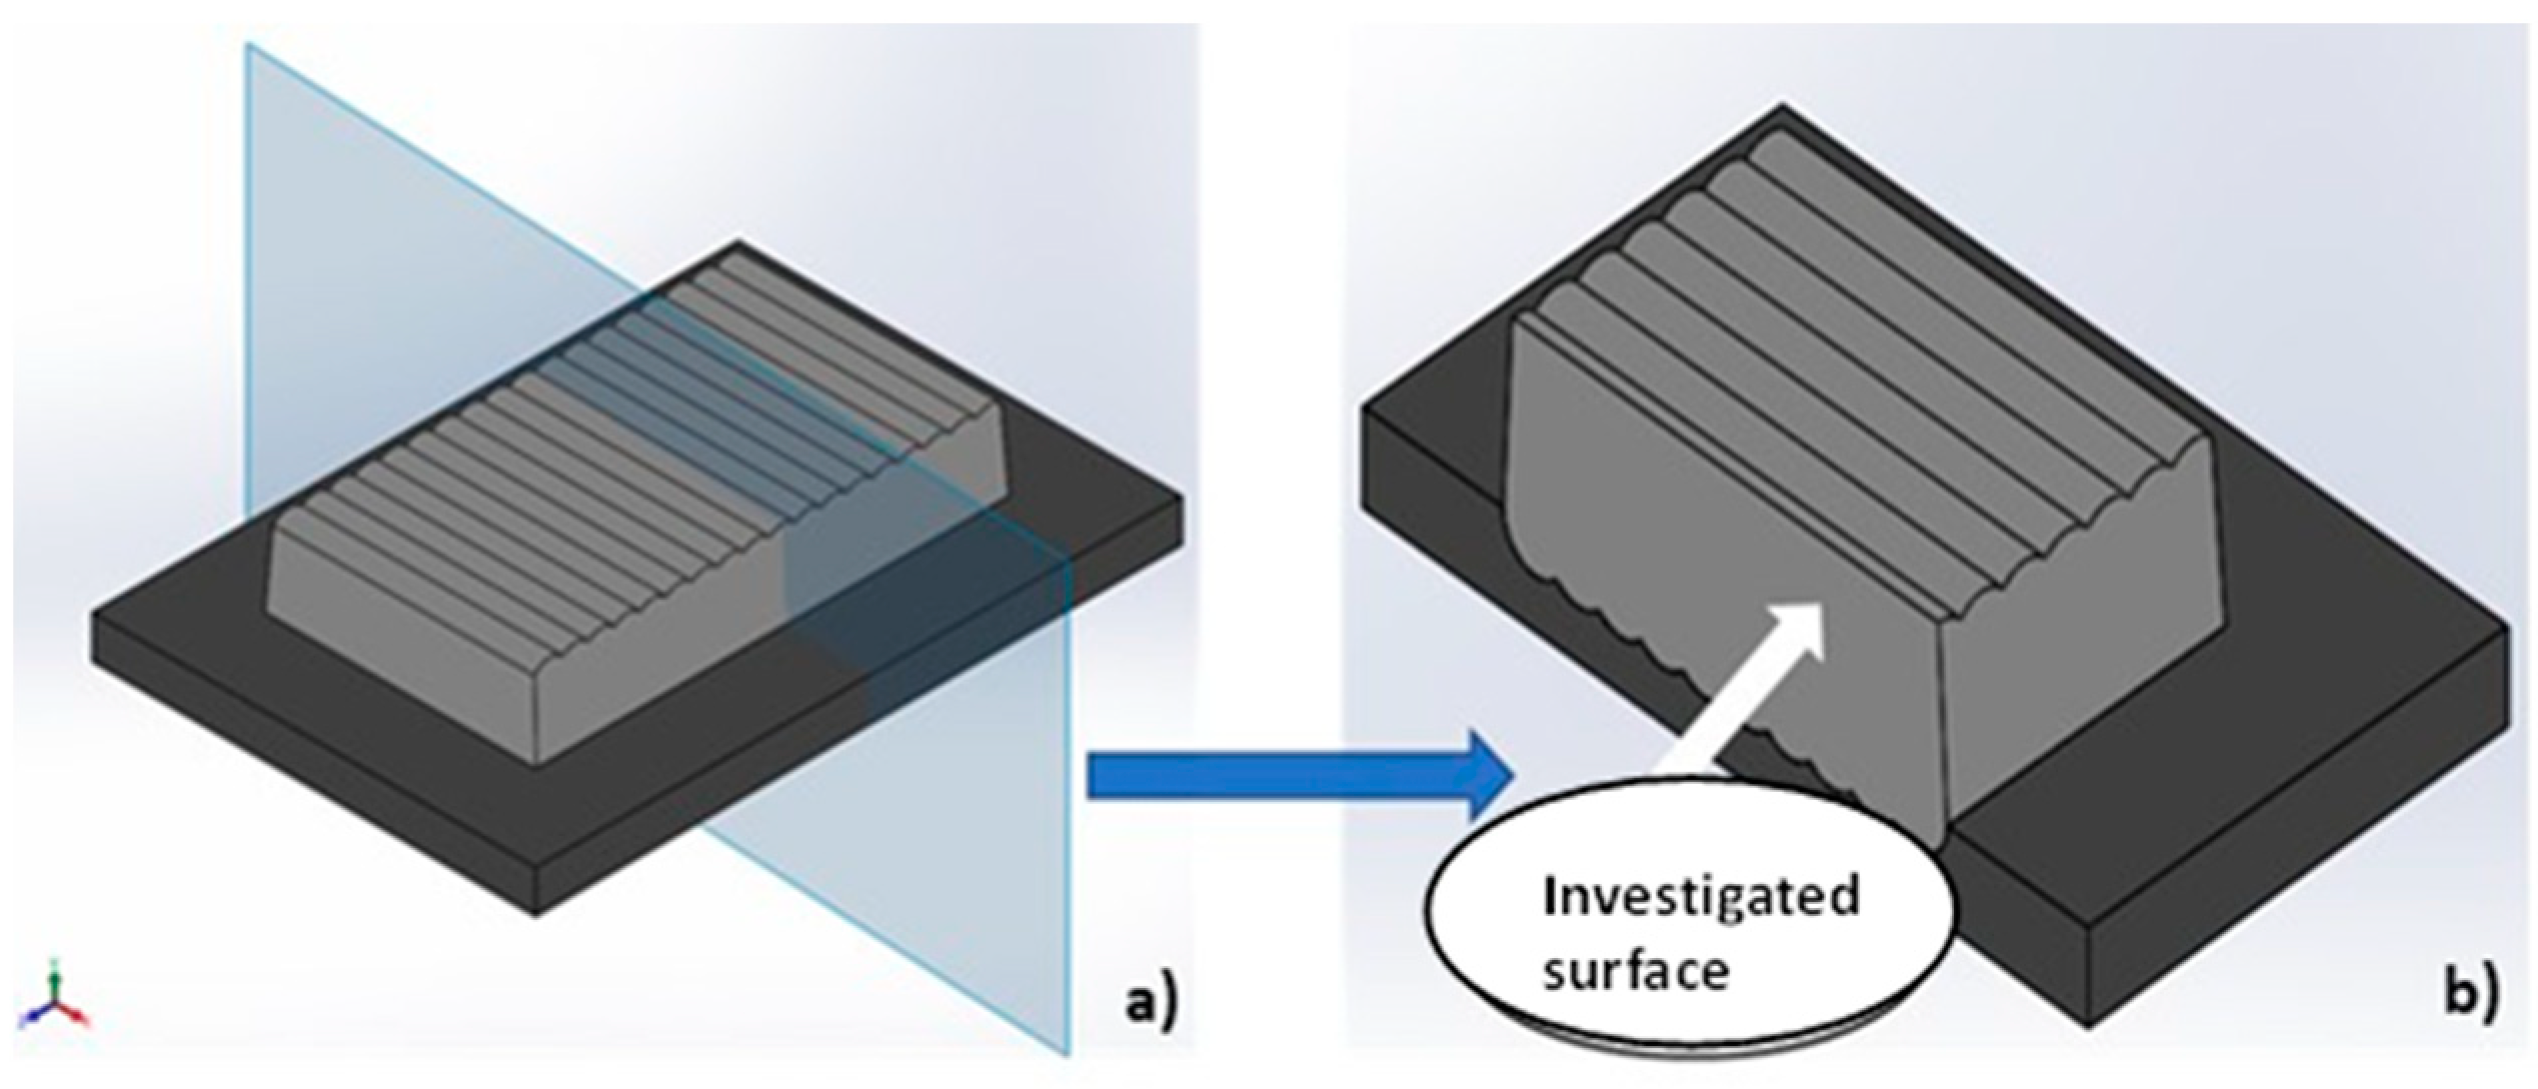
3.2. Microstructural Evolution

To characterize the meso- and microstructural evolution of the built blocks as a function of the increased bead width, the prismatic blocks were sectioned perpendicular to the block length using Wire-EDM, as shown in Figure 5. All samples were ground and polished using 0.5 µm alumina suspension. A ZEISS Axio Imager 2 Optical Microscope (OM) with stage positioner was used to facilitate the development of panoramic views for the deposited parallel and orthogonal beads along the building direction.

4. Results and Discussion

4.1. Mechanical Behavior

In the following section, the influence of the OP at a constant BW of 5 mm (130, 140, and 150) on the mechanical behavior of the built blocks is investigated. The OP that displays the highest hardness and tensile properties will be selected for the second stage, where the influence of the bead width will be investigated at a constant OP. From Figure 2c, it is clear that the deposited blocks have uniform ends both in the longitudinal and transverse directions, which indicates that the alternate orthogonal deposition strategy has achieved the targeted geometrical uniformity compared to the parallel strategies [11,12].

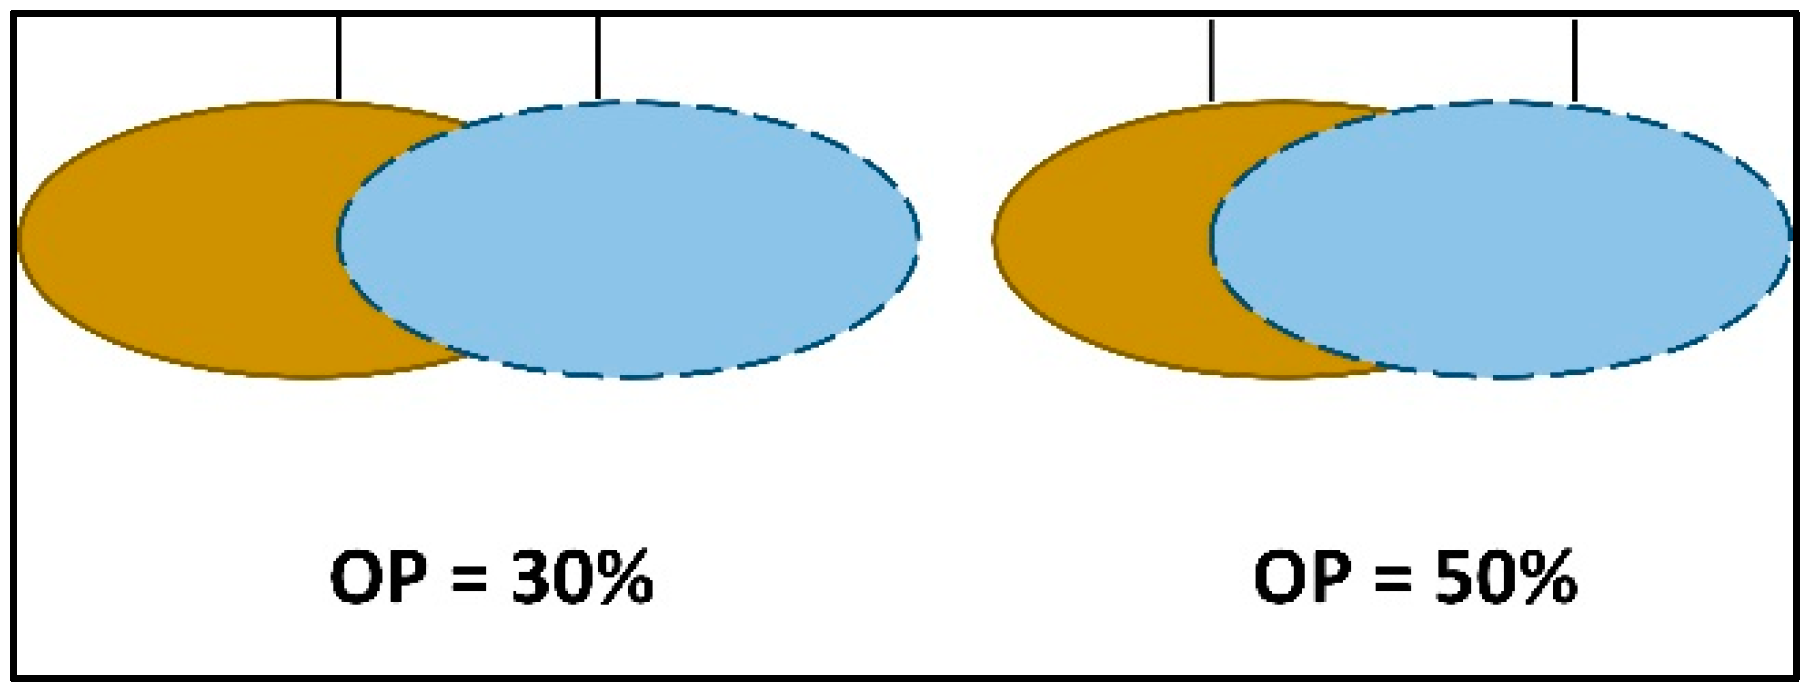
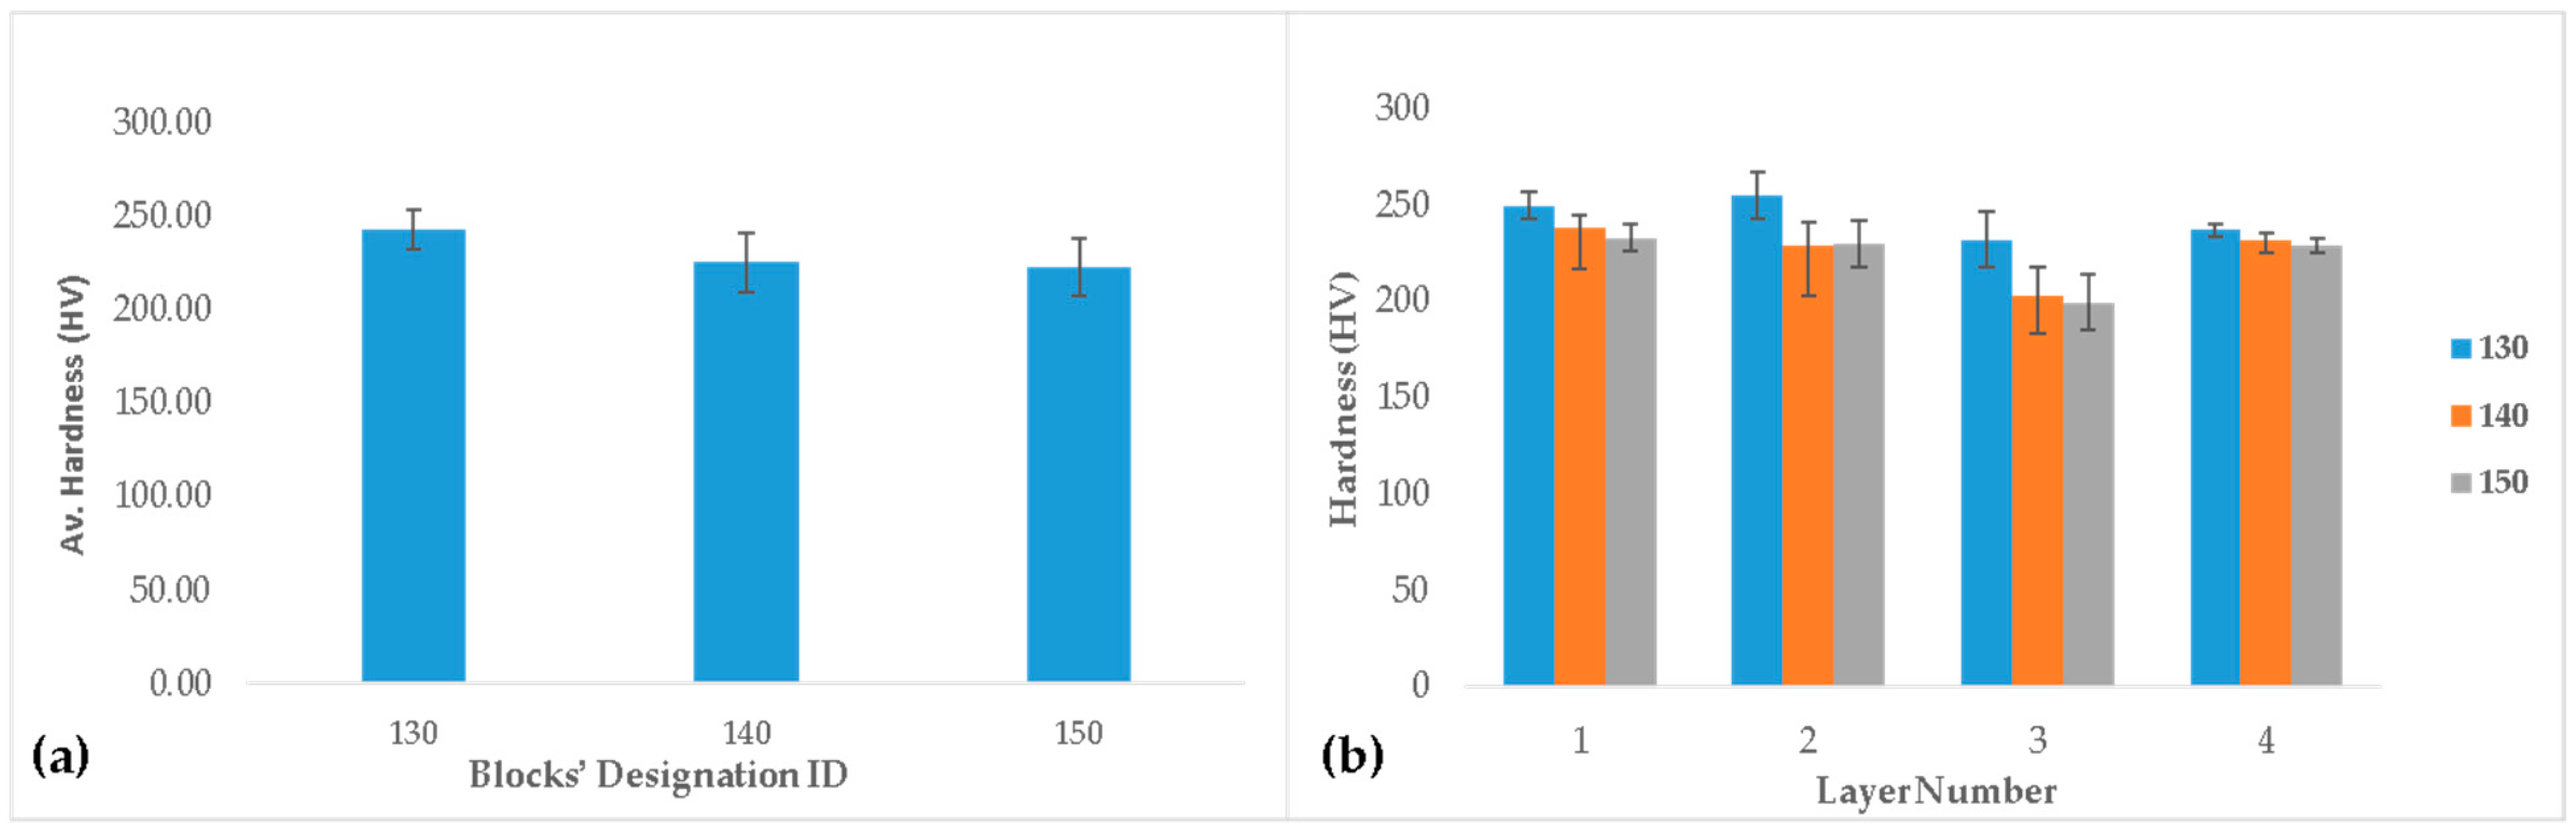
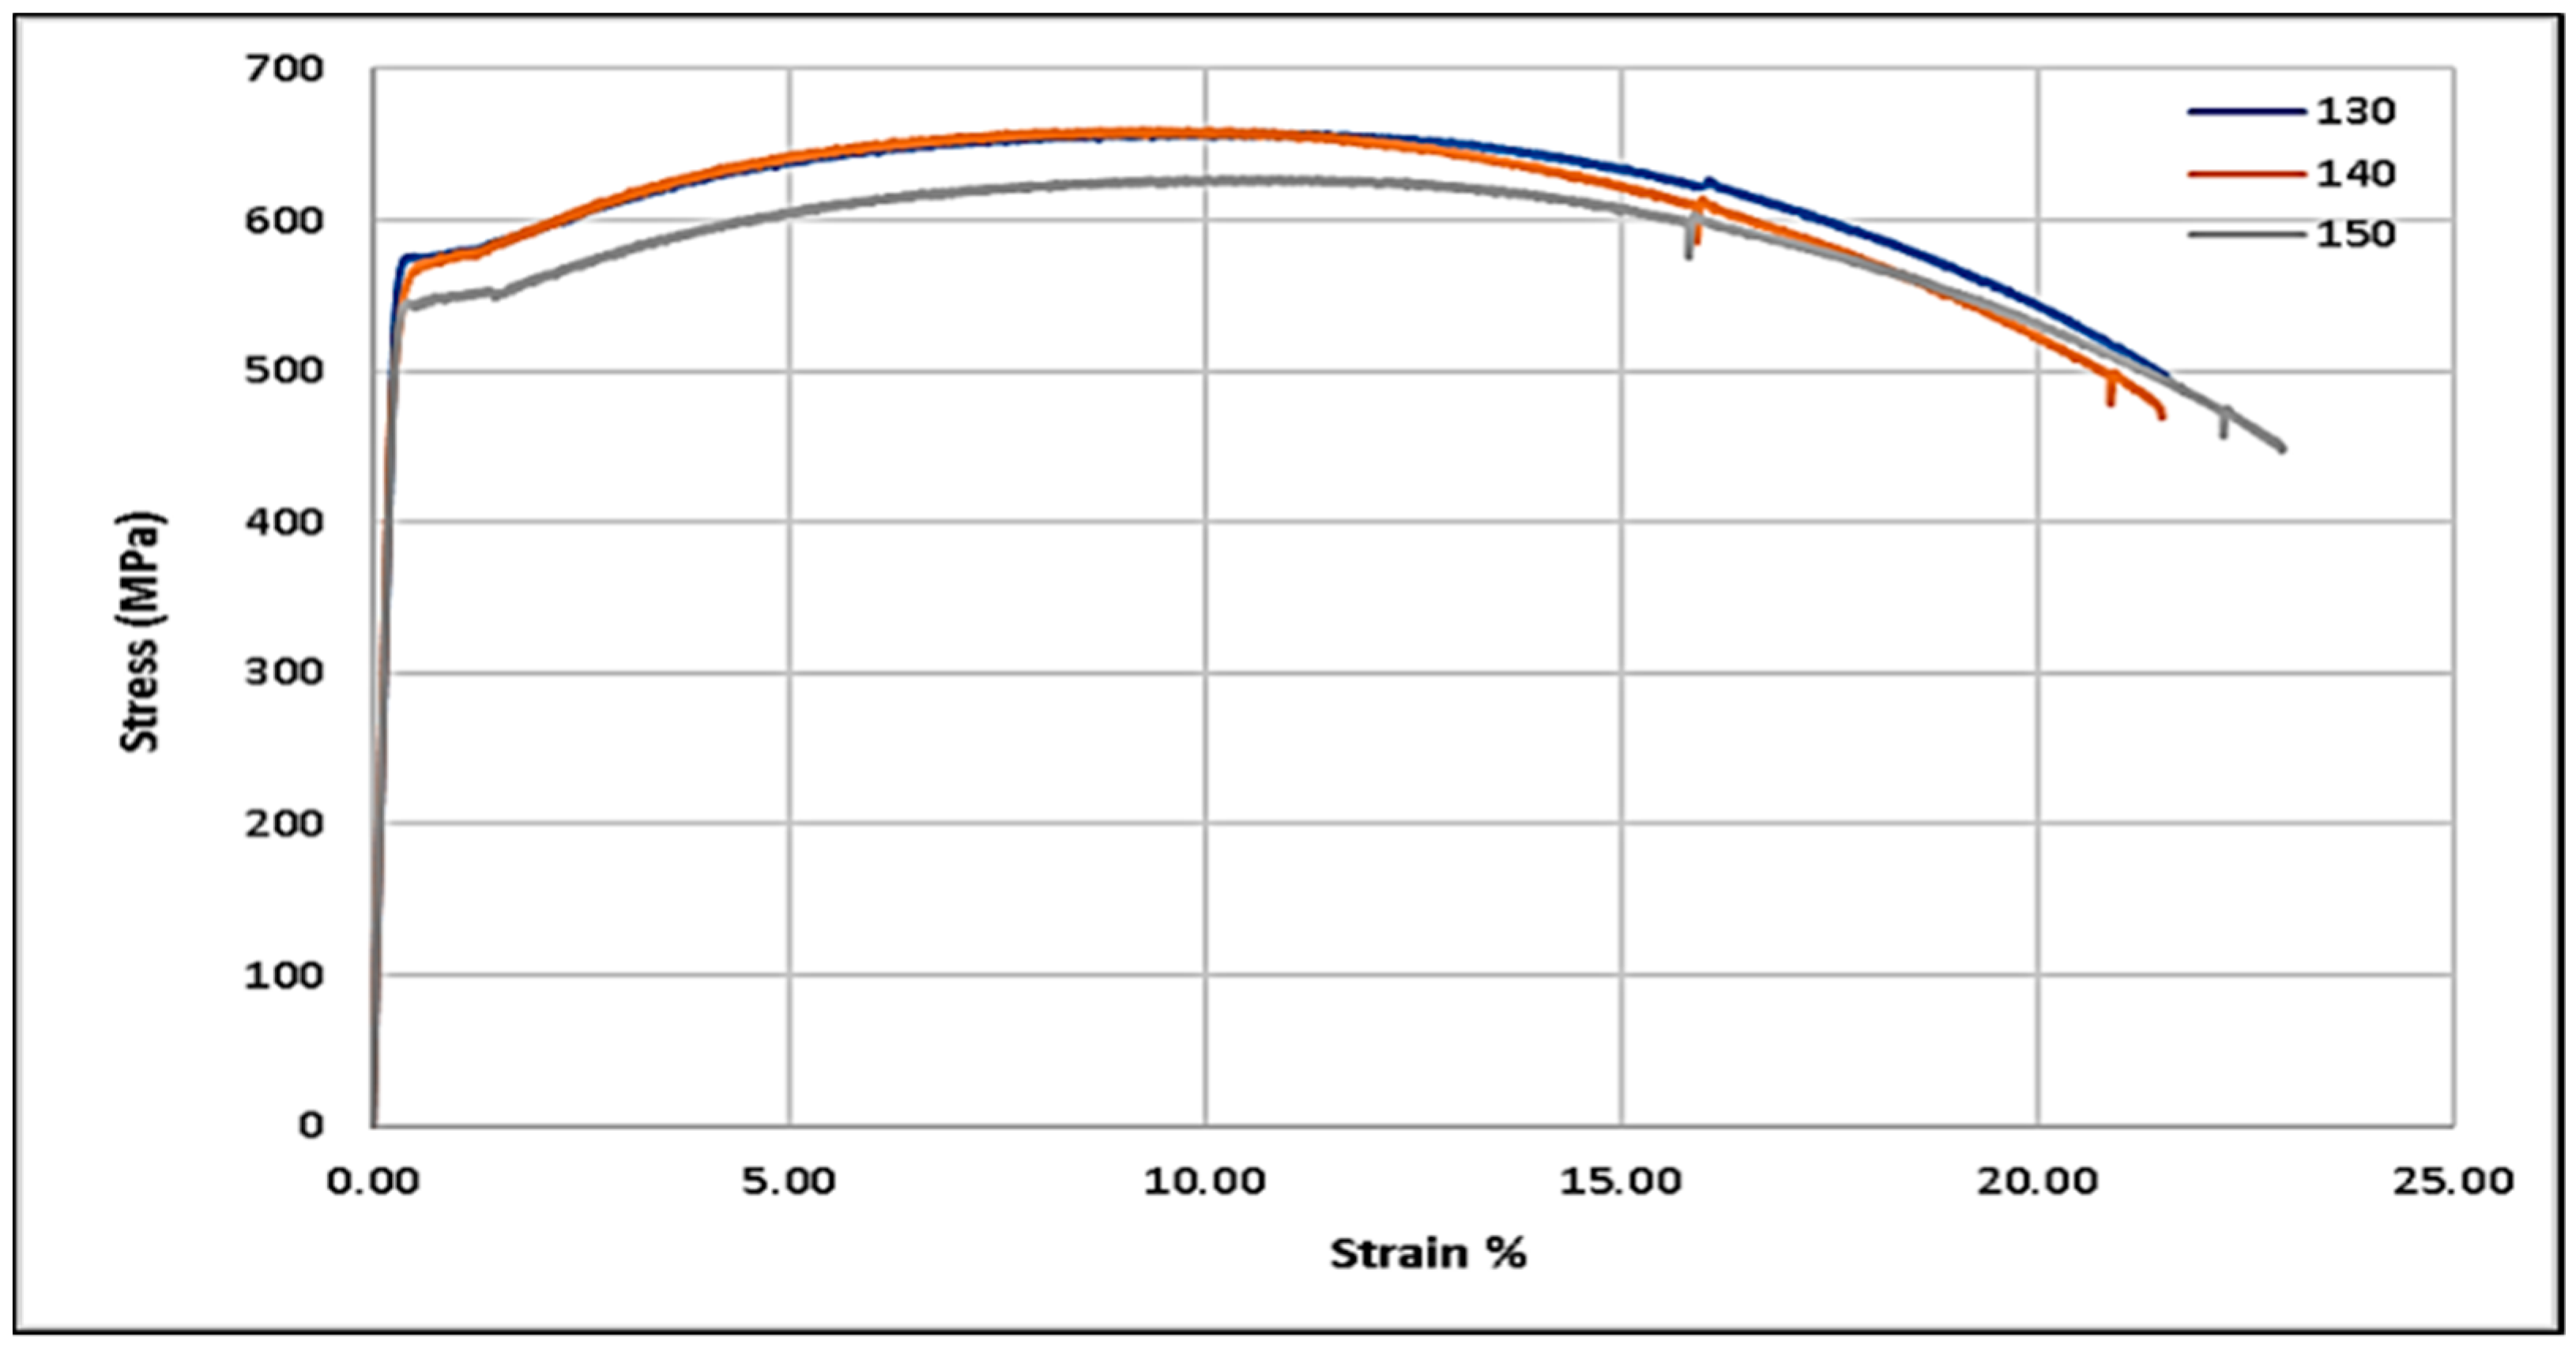
4.1.1. Influence of Beads’ Overlapping Percentage (OP) at a Constant BW of 5 mm

Figure 6 displays bar charts for the hardness variation at a constant BW of 5 mm and increasing OP between the adjacent beads (30, 40, and 50%). The average hardness (Figure 6a) of the 30% OP exhibited the highest values among the other overlapping distances. Hardness values of 243.56, 225.58, and 222.85 HV were recorded for OPs of 30, 40, and 50%, respectively. An increase of 10% in the OP at constant BW resulted in a 7.4% decrease in the block average hardness, followed by a 1.3% drop only for the 50% OP.
Figure 6b displays the hardness variation layer by layer along the building direction for the three building conditions. It is clear that the first layer exhibits the highest hardness values compared to the second, third, and fourth. The first layer is subjected to ultrahigh cooling rates compared to the successive layer due to the thermal shock induced by the substrate’s very low temperature, and hence an increased thermal gradient. The tempering effect induced by the successive layers was high enough to overcome the ultrahigh rate of cooling that occurred at the first layer–substrate interface. The second and third layers were deposited at a layer temperature of 120 °C, which reduced the temperature gradient, and hence lowered the cooling rates. This explains the reduced hardness in the second and third layers. However, the second layer still retains higher hardness when compared to the third layer due to the shorter heat cycles (fewer heating times) associated with the deposition in the transverse direction of the block, and thus induces less overall heat input in comparison with the third layer (longitudinal deposition direction). For the third layer, prolonged heating times in the longitudinal direction contributed to the relative drop in hardness values due to the reduced cooling rates [17,19]. An increase in the hardness in the fourth layer could be explained by the fact that the fourth layer is the last deposited one that has been subjected to a one heating cycle and not multiple, compared to the lower layers, in addition to the fact of the lower heat input induced with the deposition in the transverse direction of the block.
Increasing the OP between adjacent beads increases the number of deposited beads per layer to accommodate the preselected block dimensions; hence, more heating cycles and longer heating time per layer will occur. The influence of OP on the layer-by-layer hardness is revealed to be the lowest for the second and third layers and the highest for the first and fourth layers. The complex interaction of the orthogonal deposition strategy, the number of heating cycles per layer, and the number of heating cycles along the building direction produce lower hardness in the second and third layers compared to the first and fourth layers.
Figure 7 displays the tensile behavior of the blocks built at a constant BW of 5 mm and increasing OP between the adjacent beads (30, 40, and 50%). It is clear that the yield and ultimate tensile strength are highest for the 130 and 140 compared to the 150 built blocks. The UTS for the 130 and 140 blocks exhibited almost the same value of 660 MPa at about 22% elongation, while that of 150 was 628 MPa at 23% elongation. The higher the OP, the higher the heating cycles associated with the increased number of deposited beads per layer. This results in an overall softening effect, which reduces strength and increases ductility (150 condition) [17,20].
Table 4 lists the number of beads deposited per layer both for the longitudinal (first and third) and the transverse (second and fourth) layers as a function of the OP at a constant BW of 5 mm (130, 140, and 150) and as a function of BW at constant OP of 30% (130, 230, and 330). Despite the fact that more beads were deposited along the transverse length of the block, the overall heat input was less than that accumulated along the longitudinal direction. At a constant BW (5 mm), even though all the blocks were subjected to the same heat input, as a function of the welding parameters (same power and travel speed), increasing the OP from 30% to 50% resulted in increase in the heat cycles by 15% and 38% in the longitudinal direction versus 15% and 36% in the transverse direction. The relative drop in hardness, as a function of increasing the OP, can be attributed to the softening effect, and hence the relatively lower cooling rates associated with the excess number of reheating cycles.

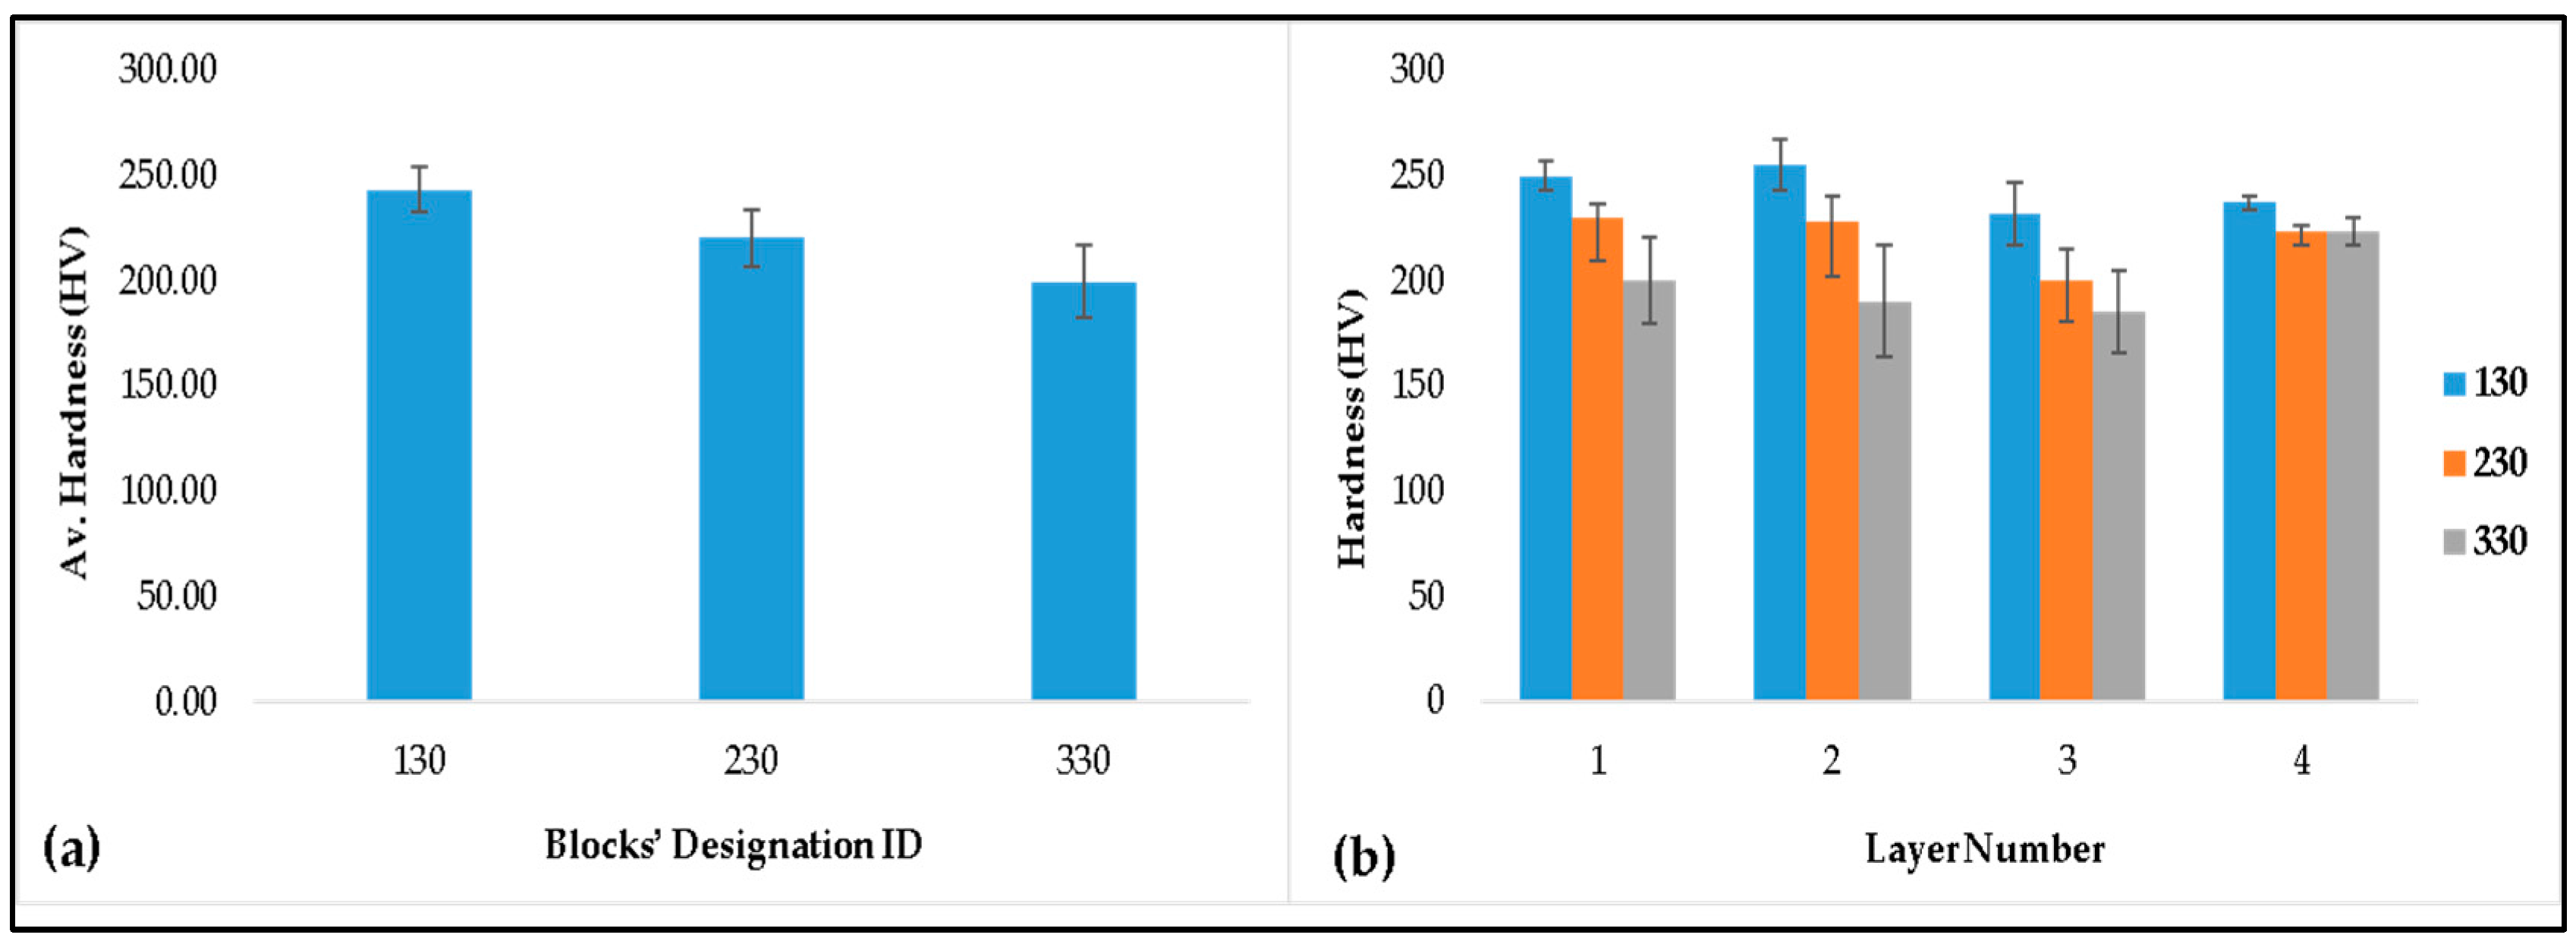
4.1.2. Influence of Bead Width (BW) at a Constant Bead Overlapping Percentage (OP) of 30%

As deducted from the hardness and tensile testing in the previous section, the OP of 30% resulted in the highest hardness, yield strength, and ultimate tensile strength in comparison with the 40% and 50%. Hence, characterization was carried out for the deposited 130, 230, and 330 to investigate the influence of BW at a constant OP of 30%. Hardness was measured on the transverse sections cut at the middle of the deposited prismatic blocks, as shown in Figure 4b. Figure 8a displays the average hardness values for the three conditions measured along the building direction passing through the four layers. The average hardness values decrease from 243.6 to 199.85 HV with the increase in BW. This can be explained by the increase in overall heat input with the increase in BW, which results in a tempering effect due to the low cooling rates, as discussed in the previous section [17,20]. The influence of increasing the BW on the block’s average hardness was much higher than that of increasing the OP.
Figure 8b compares the measured hardness for all deposited beads at each layer. The general trend, as apparent from the layer-by-layer analysis, is that the hardness values are the lowest for the third layer for all three conditions independent of the BW. Moreover, the first layer displays the highest hardness, followed by a decrease going through the second and third layers. The first layer for 230 and 330 displayed higher hardness than the second and third layers despite being subjected to more cycles of heating and cooling. This can be attributed to the higher cooling rate induced by the cold substrate on the deposited first layer. The tempering effect of the thermal cycles induced by the three successive layers was not high enough to overcome the acquired hardening. Although the number of deposited beads per layer decreased with BW by 23% and 38% in the longitudinal layers, and by 27% and 42% in the transverse layers (Table 4), the total heat input increased by 183% and 272%, respectively (Table 2). This explains the dominating effect of the total heat input on the reduced hardness values as a function of increasing the BW from 5 to 9 mm.
The second layer for all three conditions showed a hardness value higher than the third one. This can be explained by the difference in deposition strategies between the subsequent layers. The second layer is deposited in the transverse direction, where the deposition length is much shorter than the longitudinal direction. Shorter deposition length led to shorter heating time. Despite the fact that more beads are deposited along the transverse length of the block (Table 4), the overall heat input is less than that accumulated along the longitudinal direction.
The fourth layer is subjected to only one heating cycle, where the generated heat during deposition is dissipated either by conduction to the substrate layers or by convection to the surrounding air. This could result in relatively higher cooling rates compared to the second and third layers, resulting in increased hardness values. Furthermore, the fourth layer is deposited in the transverse direction, similar to the second layer, resulting in shorter heating time per bead (along the block width). This could decrease the overall heat input that produced a faster cooling rate and consequently resulted in an increase in the exhibited hardness.
Figure 9 displays the stress–strain diagram for the built blocks at a constant OP as a function of the BW. In general, the three WAAM-ed conditions revealed tensile behavior of sound, integral built blocks. These measured values are higher than the values reported in the AWS A5.18/A5.18M standard [14], which exhibited a UTS of 480 MPa at an elongation of 22%. However, the reported results lie within in the acceptable ranges for the WAAM-ed ER70S-6, as reported in [17,21,22].
The ultimate tensile strength (UTS) for the 130 block was 660 MPa at about 22% elongation while the 230 and 330 were 590 and 560 MPa at 28.5 and 26.6% elongation, respectively. The recorded UTS results agree with the measured hardness values (Figure 10a). The measured UTS and yield strength (YS) for the three conditions were higher than those reported by Tripathi et al. [23], who built a single-bead hollow block, as opposed to the alternate orthogonal four-layer solid blocks implemented in this study. The variation in deposition strategies might have influenced the mechanical strength differently. For 130 and 230, the heat input increased as result of the decrease in welding speed from 11 to 6 mm/s, respectively, while maintaining the same current and voltage. For the 330 block, the increase in heat input is associated with the increase in voltage and current and the decrease in welding speed. Therefore, increasing the BW increases the overall heat input and hence reduces strength and increases ductility due to the tempering effect produced by lower cooling rates. The correlation between the obtained UTS and the total heat input agrees with the findings of Duarte et al. [24].
Although there is a slight difference in UTS values for 230 and 330, 330 displays relatively lower strength than 230. It is suggested that the higher heat input (330) associated with the higher tempering effect along the building direction is expected to coarsen the grains and phases. The cooling rate is also known to have a significant effect on the nucleated phases and their sizes in steels [24]. This will be explained in the following section. Increasing the BW from 5 to 9 mm increased the total heat input per bead per layer, which significantly reduced the UTS of the build blocks by 17% compared to 7% when increasing the OP from 30 to 50%, respectively. Conversely, the ductility increased by 4% compared to 16% with increasing OP and BW, respectively. This indicates that the increased total heat input induced by the BW has a higher effect on the mechanical behavior of the built blocks compared to the increased number of heating cycles/layers associated with increasing the OP.

4.2. Fracture Behavior

Figure 10 shows SEM images for the fracture surfaces of the tensile samples for 130 (Figure 10a,b), 230 (Figure 10c,d), and 330 (Figure 10e,f) at low and high magnifications. Low-magnification images (Figure 10a,c,e) revealed lower ductility for 130 (Figure 10a) compared to 230 (Figure 10c) and 330 (Figure 10e), which was evident by the smaller central cups associated with large shear lips. Higher-magnification images revealed typical ductile failure features manifested by the formed dimples. Blocks built using the smallest BW of 5 mm (130 condition) showed the finest dimple sizes compared to the wider beads 230 and 330, as shown in Figure 10d,f. The larger the BW, the coarser the dimples, which agrees with the tensile behavior displayed in Figure 10. The fracture surfaces also revealed fine spherical porosities (red circles), microvoids (yellow circles), and secondary cracking (blue ovals), similar to the findings of [22]. No evidence for tear ridges was observed in the fracture surfaces of the three conditions. According to Tripathi et al. [23], who tested ER70S-6 low-carbon steel samples cut horizontally similar to this study, tear ridges were only observed for the samples that were sliced horizontally (perpendicular to the building direction) in a single-bead wall. Tensile samples cut parallel to the building direction showed no evidence for tear ridges. They explained this behavior by the facilitated fast cleavage fracture by crack propagation mechanism parallel to interlayer interfaces. It is suggested that the orthogonal alternate deposition strategy employed for the building of the blocks provided a uniform distribution of the stress along the gage length, which prevented the formation of the tear ridges during fracture [23].

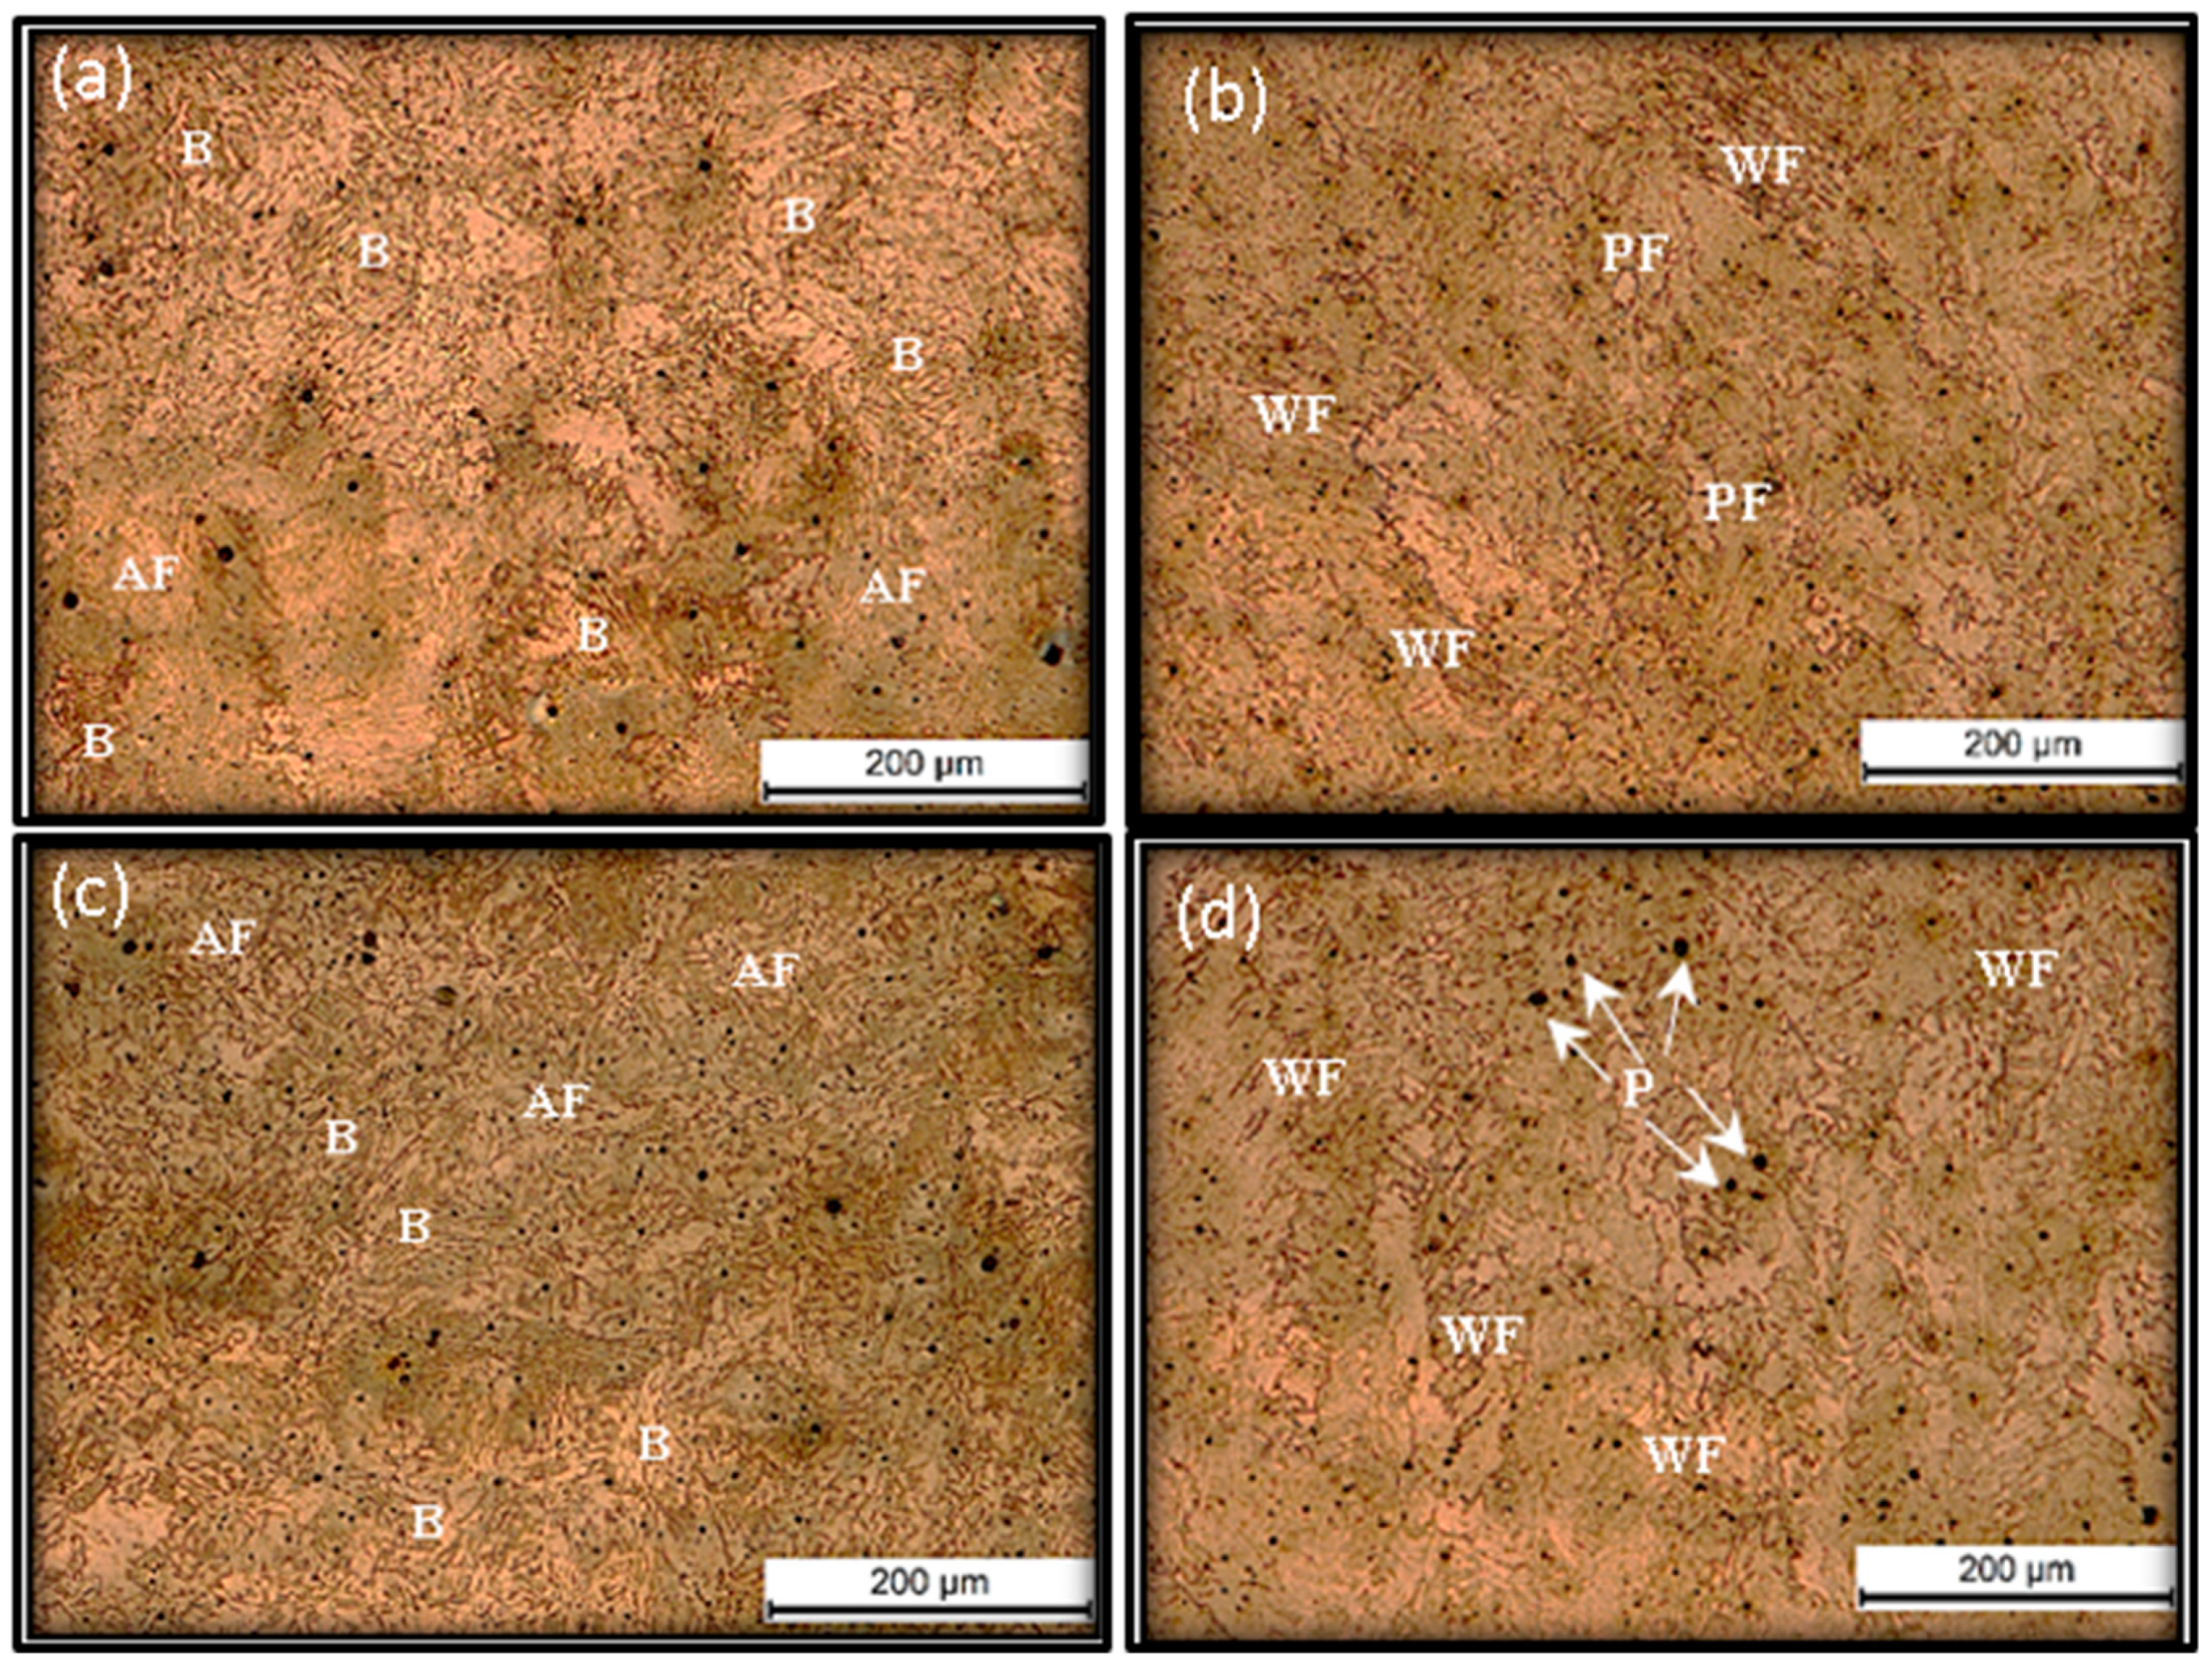
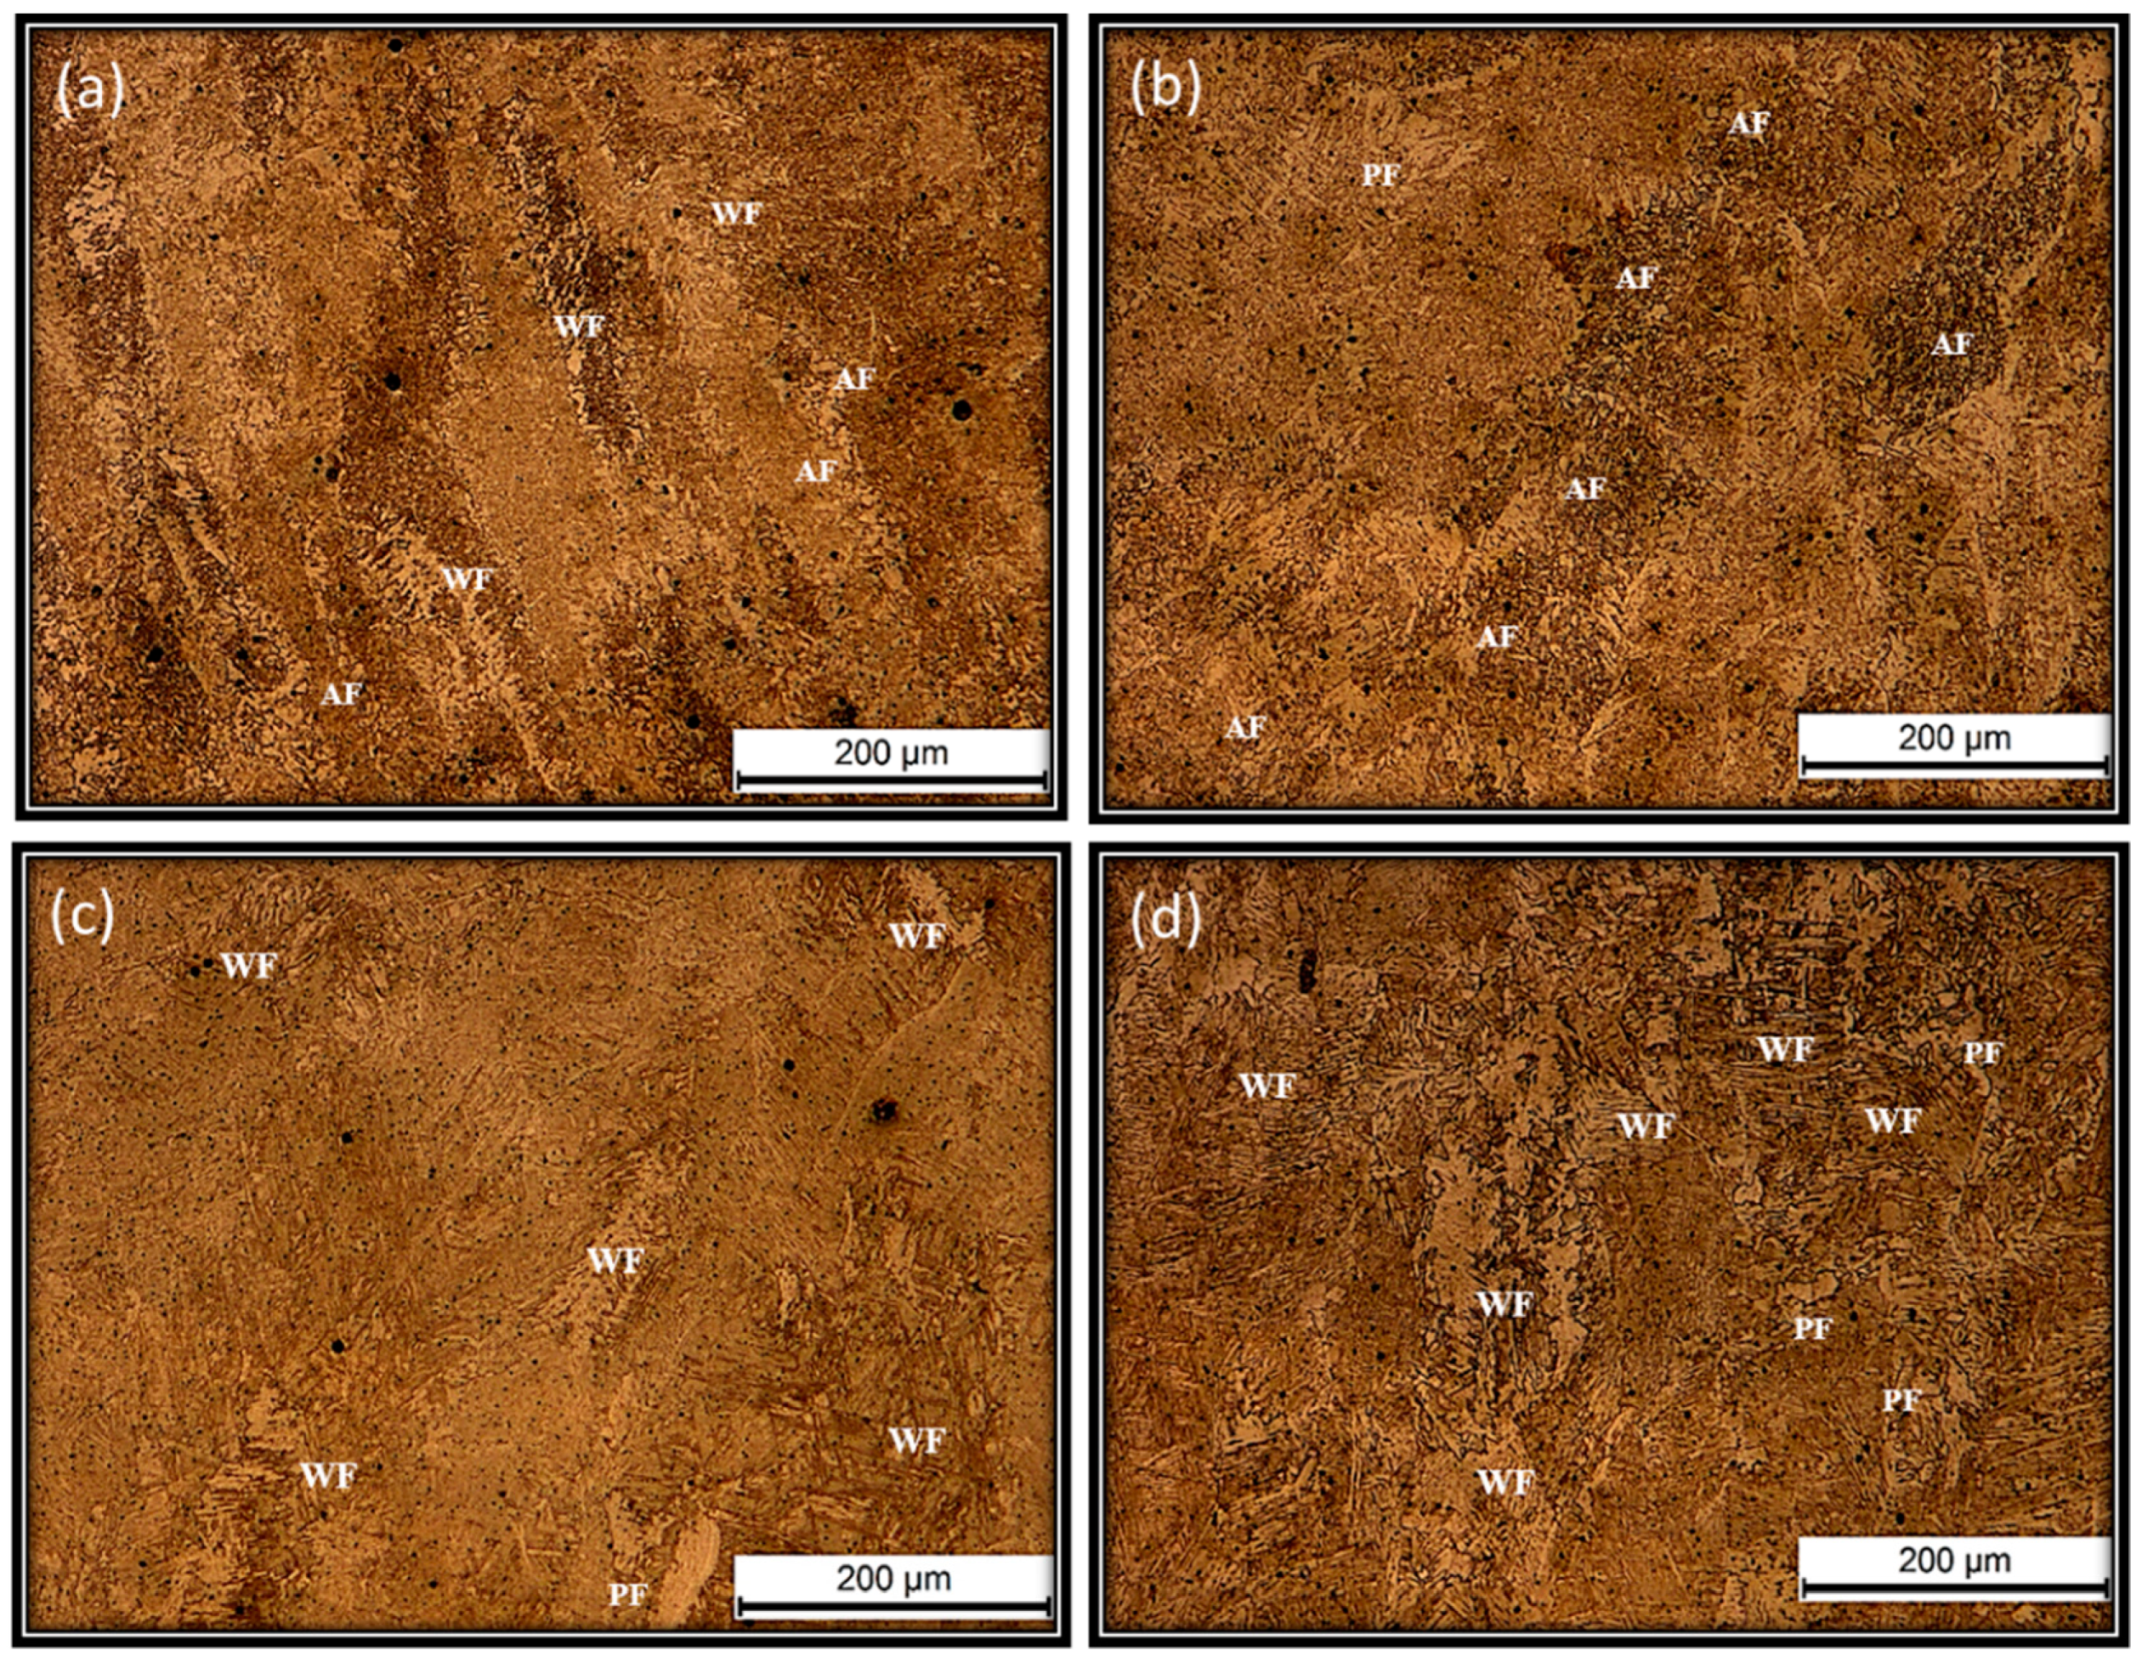
4.3. Microstructural Evolution

For demonstration purposes, the evolved microstructure depicts the influence of the OP at a constant BW. Figure 11a–c is presented for 130, 140, and 150, respectively. This will be followed by a detailed discussion for the microstructural evolution for 130, 230, and 330 and its relation to the displayed mechanical behavior.

4.3.1. Influence of Overlapping Percentage (OP)

Sections were taken through the cross section, as shown in Figure 4a, and the panoramic view shown in Figure 11 represents two successive layers along the building direction. It is worth noting that the first and third layers represent the cross-sectional view of the beads deposited longitudinally (L), and the second and fourth layers represent the beads deposited transversely (T). From the displayed images, neither cracks nor a lack of fusion defects were detected, which reflects the proper selection of the tool path strategy (orthogonal alternate) and welding parameters suitable for building prismatic blocks with the required beads’ geometries.
According to Ghaffari et al. [21], there are four microstructural zones formed within the adjacent beads within each deposited layer in the WAAM ER70S-6. The zones are the melt pool center (equiaxed grains), the melt pool boundary, and two heat-affected zones (HAZ). The size and coexistence of those distinct zones along with the microstructural phases depend on the deposition strategy, i.e., the directionality of the deposited beads and the investigated samples. Therefore, those zones should be clear in the longitudinal layers rather than in the transverse ones. In addition, the heat input, OP, interpass temperature, thermal cycles, and the cooling rates are expected to have a strong influence on the morphology and types of phases formed within the four zones. This explains the variation in the developed microstructure of the built block in the current work compared to those described by Ghaffari et al. [21]. Investigation of the microstructure of the built blocks within the melt pool center, representing the diffusion zone (DZ) within the substrate (Figure 11), reveals the formation of directionally solidified columnar grains growing along the building direction where there is a decreasing temperature gradient. A relatively high degree of turbulence in the melt pool zone resulted in a nonuniform orientation of the columnar grains within the overlapping zone between the two adjacent beads. This can be attributed to the influence of reheating cycles, which increased with the increase in the bead’s OP. Finer equiaxed grains formed with the DZ between the L and T layers. This is clarified in Figure 11a for 130.
For the equally cut sections, the increase in OP (30, 40 and 50%) can be manifested by the unclear boundaries between the melt pool and the increased number of beads as shown in Figure 11a,b,c respectively. Additionally, the higher the OP, the higher the heat input per layer and hence, the higher the penetration depth in the layer below (Deeper DZ). The deeper DZ results in smearing of the boundaries between successively deposited layers [19].
An anisotropic structure can be observed across the deposited blocks as a result of complex reheating cycles and different cooling rates across the layers. However, the degree of anisotropy was minimized by the orthogonal alternate deposition strategy, which limited the directional solidification along the building direction. This agrees with the interlayer hardness values displayed in Figure 8b. Despite the use of a maximum interlayer temperature of 120 °C, the increase in OP was associated with a decrease in the cooling rate, and hence a smaller aspect ratio for the formed (coarser) columnar grains.

4.3.2. Influence of Bead Width (BW)

Figure 12a,b display panoramic images for sections cut along the building direction and perpendicular to the length (Figure 4a) of the built prismatic blocks using the low-heat-input (130) and high-heat-input (330) conditions. In this case, the four layers are represented for both conditions. The penetration depth of the beads depends on the overall heat input, which is dictated by other bead characteristics such as BW, height, and OP. This can be observed when comparing the panoramic images for the 130 and 330 built blocks using 5 mm and 9 mm BW at 30% OP, as shown in Figure 12a and Figure 12b, respectively. From the displayed images, no macrodefects or lack of fusion defects were detected, which is indicative of the integrity of the processed blocks and the successful choice of the deposition parameters, shielding gas, and cooling rates. Within the same area investigated, 130 displayed about 3.5 beads in the longitudinal layers, while 330 displayed less than three beads, as displayed in Figure 12a,b. It is worth noting that the directionally solidified columnar grains formed within the molten pool (DZ-1) are predominantly growing upwards for the first layer. This could be explained by the experienced higher cooling rates associated with a large temperature gradient at the cold substrate. This effect decreases in the deposited successive layers. The turbulent solidification zone forms between overlapping beads within the same layer, as shown in the first longitudinal layer in Figure 12a within the green dashed line.
It is also clear that the higher the heat input, associated with the wider bead (330), the deeper the penetration in the substrate and the larger the diffusion zone (DZ) between any two deposited layers (Figure 12b). Moreover, the identification of the transition zones between the successive layers was very difficult for 330. This can be attributed to the higher heat input, which results in deeper and wider penetration of the deposited layer smearing out the DZ [25]. Furthermore, the 330 microstructure (Figure 12b) manifested the influence of higher heat input more than 130 (Figure 12a), as observed in HAZ formed in the substrate below the DZ of the first layer.
As reported by A.S. Yildiz et al. [26], the microstructural variations and phases formed are fully dependent on the cooling rates encountered during the deposition process. This is not only governed by the heat input per unit length, but also by the resultant beads’ geometry and the nature of the interfaces formed between the deposited beads, which influence the nucleated phases and their morphologies. ER70S-6 processed via WAAM is known to be composed mainly of pearlite and ferrite, with partial constituents such as acicular ferrite, bainite, and transformed martensite, as reported in [17,21,23].
Porosity can result from the shielding gas and the atmosphere [27]. These defects can be detrimental to the mechanical properties, corrosion, and fatigue resistance of the steels [28]. Those defects, in addition to grain coarsening in the HAZ, can be attributed to repeated thermal cycles, an unsuitable selection of parameters, and a turbulent molten metal pool [17]. From the displayed panoramic images, the built blocks were almost free from porosities and microvoids, which is indicative of the optimal selection of the suitable deposition parameters, as shown in Figure 12a,b for 130 and 330.
Higher-magnification images shown in Figure 13 show the phases formed in the second (a, b) and third (c, d) layers for the 130 and 330 built blocks, respectively. The images reveal the formation of finer grains and phases for the lower-heat-input (130) built blocks (Figure 13a,c). This is in addition to the evident nucleation of bainite, which was not evident in the 150 built blocks (Figure 13b,d) for the second and third layers, respectively. It is clear that bainite formation dominates the structure of the intermediate layers.
Figure 14 provides a comparative study for the influence of high heat input (330) to the low-heat-input (130) conditions at a constant 30% OP. Figure 14a,c (130) and Figure 14b,d (330) show the microstructure developed for the DZ-1 (first layer) and the fourth layers. It is demonstrated that the higher the heat input (330) associated with wider beads (Figure 14b,d) results in coarser grains, both for the DZ-1 and fourth layers. For DZ-1 (Figure 14a,c), the columnar grains reveal the formation of fine WF and AF structures induced by the relatively low heat input. On the other hand, higher heat input formed acicular ferrite grains growing within relatively coarse columnar grains. The fourth layer revealed ultrafine WF compared to the coarser WF observed for 130 and 330, which is due to the relatively lower heat input associated with the thinner bead (Table 2).
Investigation of the formed phases along the building direction revealed the formation of Widmanstatten ferrite (WF), acicular ferrite (AF), polygonal ferrite (PF), pearlite, and bainite phases (Figure 13 and Figure 14). Cooling rates and heating cycles have a strong influence on the type, size, and distribution of the phases formed along the building direction. For 130 (Figure 14a), AF and WF can be observed within the columnar grains of DZ-1 of the first layer with the substrate, while a combination of bainite and AF was formed in the successive layers, including the second and third layers (Figure 13a,c).
The fourth layer showed evidence for the formation of increased fine WF with scattered acicular and polygonal ferrite (Figure 14c). This is indicative of the relatively higher cooling rate associated with fewer heating cycles for the last deposited layer. The formation of fine WF in the first and fourth layers explains the increased hardness values reported (Figure 8). The formation of WF at DZ-4 in the fourth layer is indicative of the critical cooling rate of austenite through the A3 line. According to Bodnar and Hansen [29], the higher the volume fraction of WF, the higher the yield and tensile strength. Furthermore, the volume fraction of WF increases with the increase in the grain size of the austenite and the increase in the cooling rate during the transformation range [29]. This explains the increased hardness (Figure 8a), yield, and ultimate tensile strength (Figure 9) of 130 compared to 230 and 330.
On the other hand, increasing the BW to 9 mm (330) reveals that the acicular ferrite dominated the phase formation within the columnar grains, and there is no evidence for the formation of WF within DZ-1 (Figure 14b). Fine AF is observed within DZ-1 and DZ-4 between the third and fourth layers, while WF and PF structures are evident in the second and third layers associated with scattered coarse pearlite (Figure 13b,d), while the fourth layer revealed the formation of WF within columnar grains, which dominated the microstructure.

5. Conclusions

In this study, an investigation of the bead width (BW) and overlapping percentage (OP) between the adjacent beads and their influence on the mechanical behavior and the structural evolution for multilayered alternate orthogonal built blocks via WAAM was carried out. The following can be concluded:
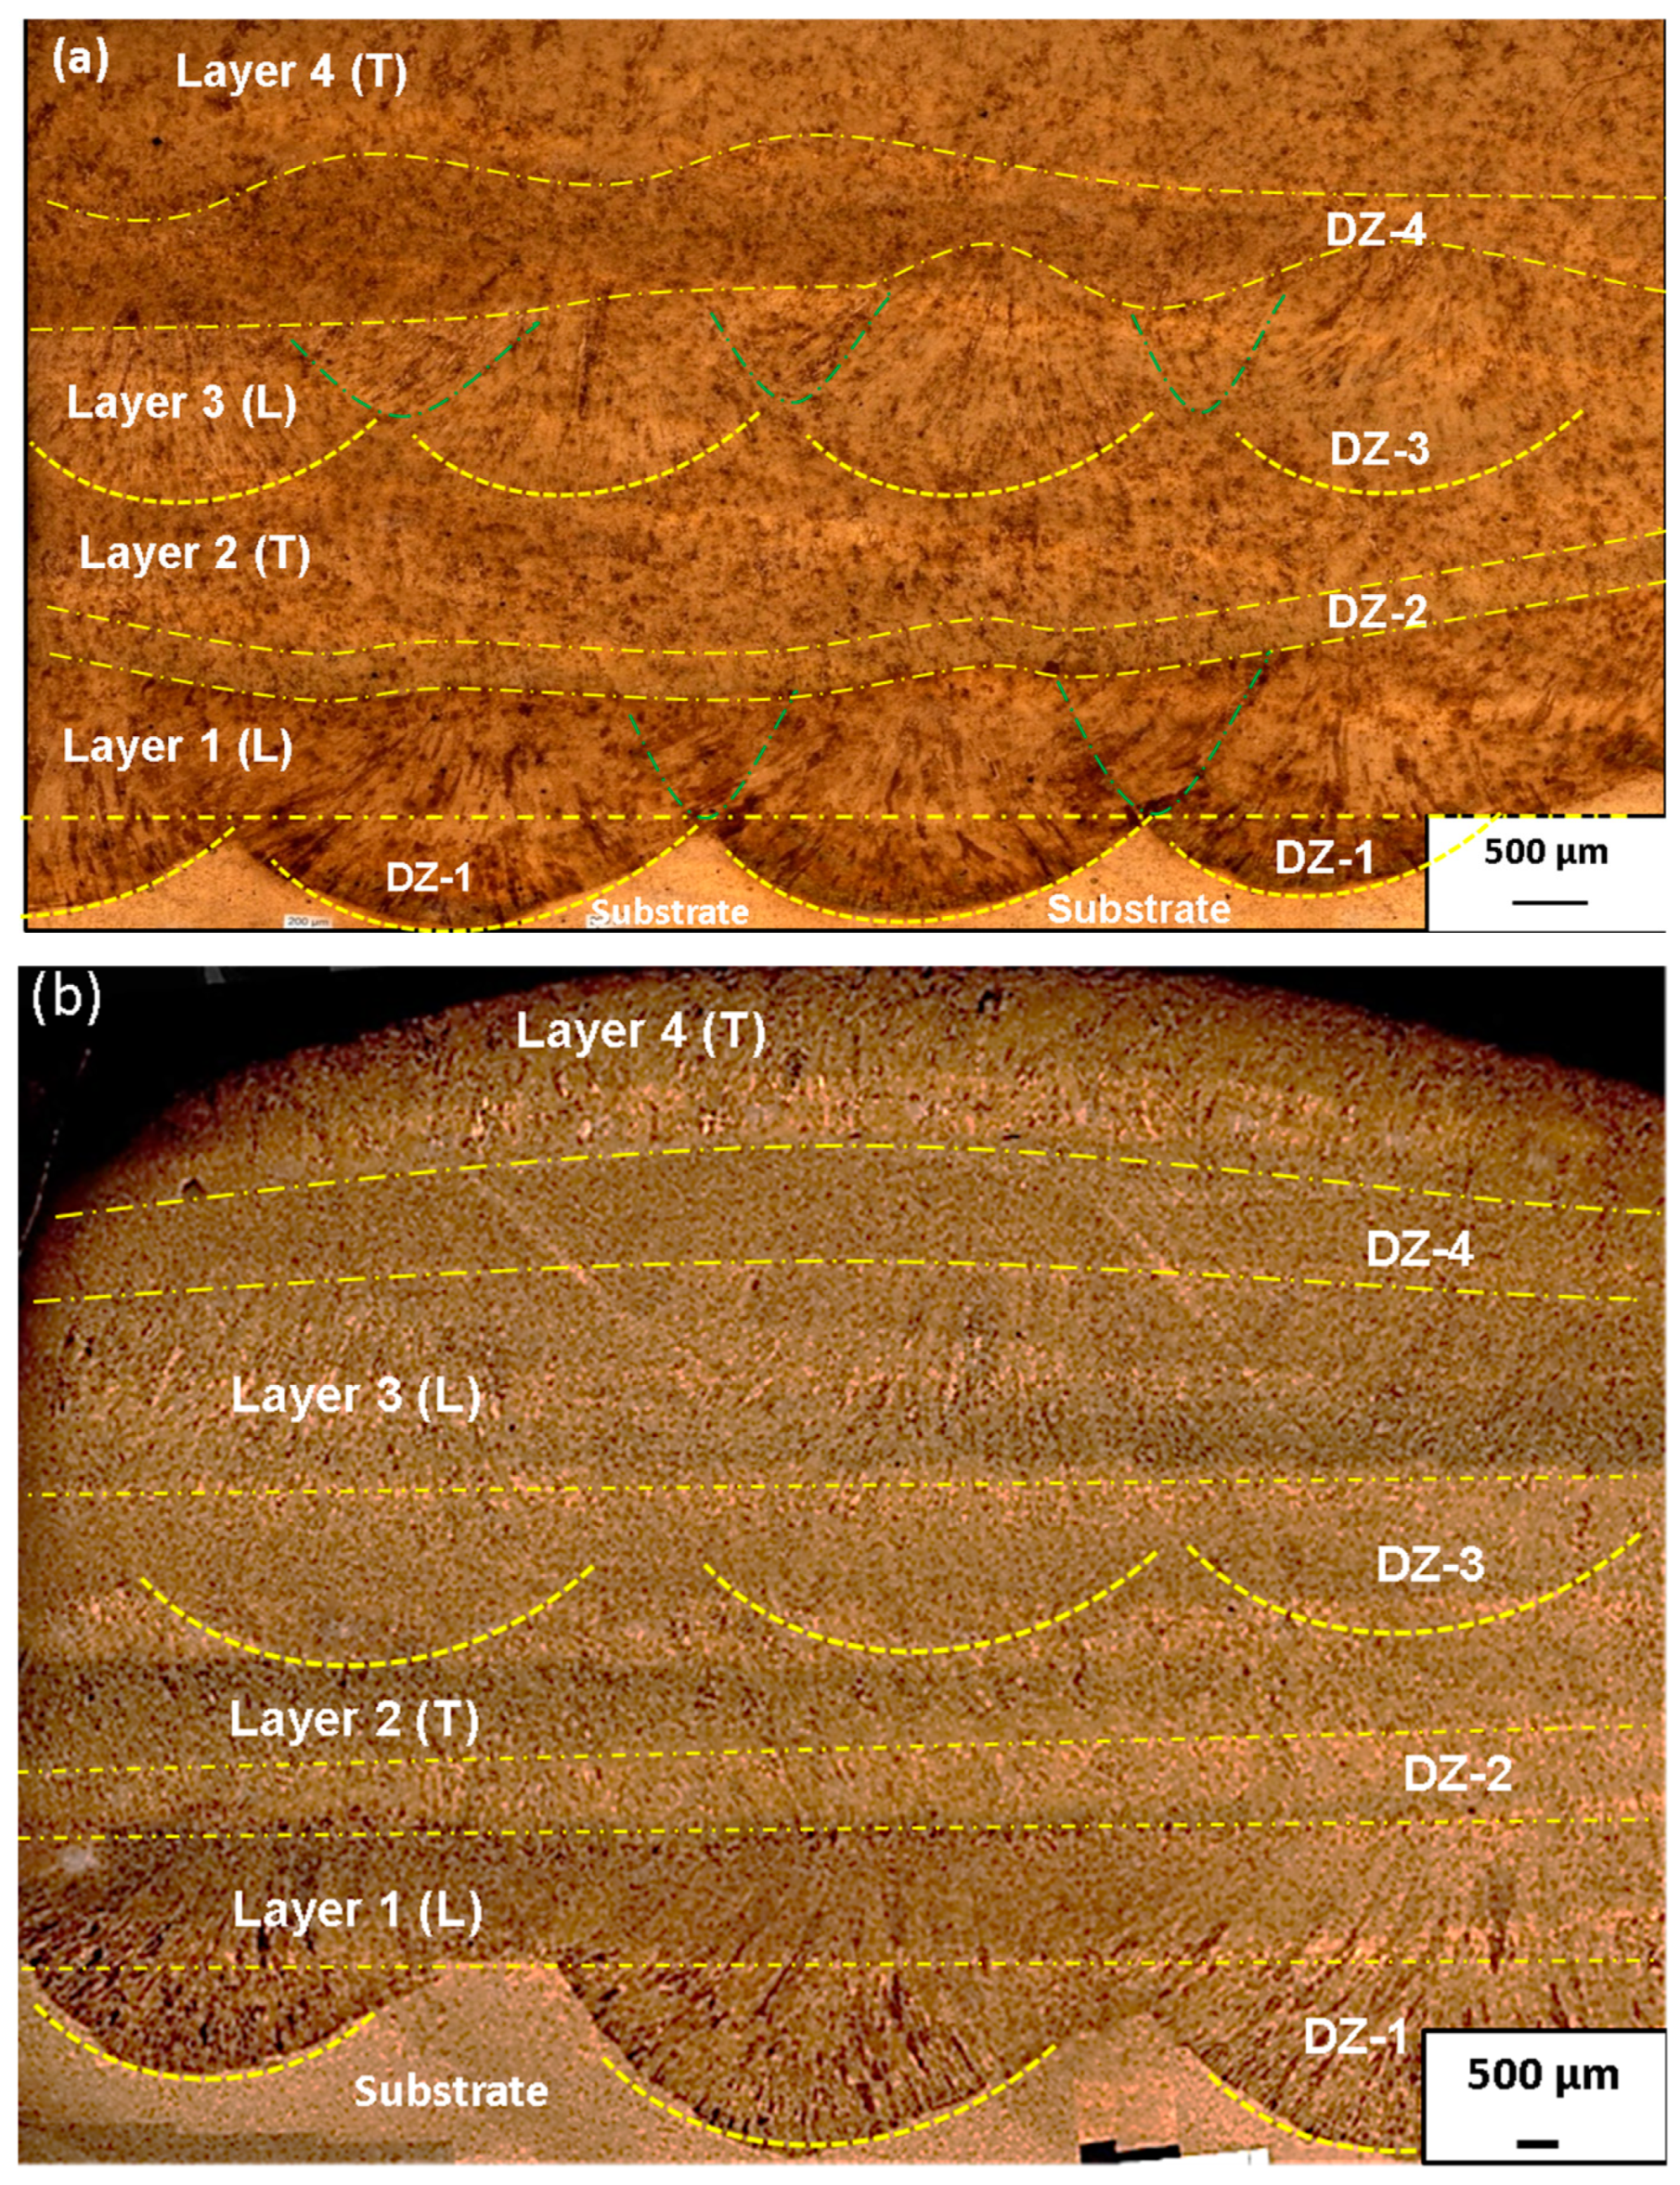
  • The alternate orthogonal deposition strategy eliminates the geometrical inhomogeneity and minimizes the degree of anisotropy, which reflects positively on hardness distribution along the building direction and the tensile properties.
  • Increasing the total heat input associated with increasing the BW has a higher influence on the mechanical behavior of the build blocks compared to the increasing number of heating cycles/layers associated with increasing the OP.
  • The heat input per layer, number of heating cycles per bead along the building direction, and the cooling rates strongly influenced the phases and their morphology.
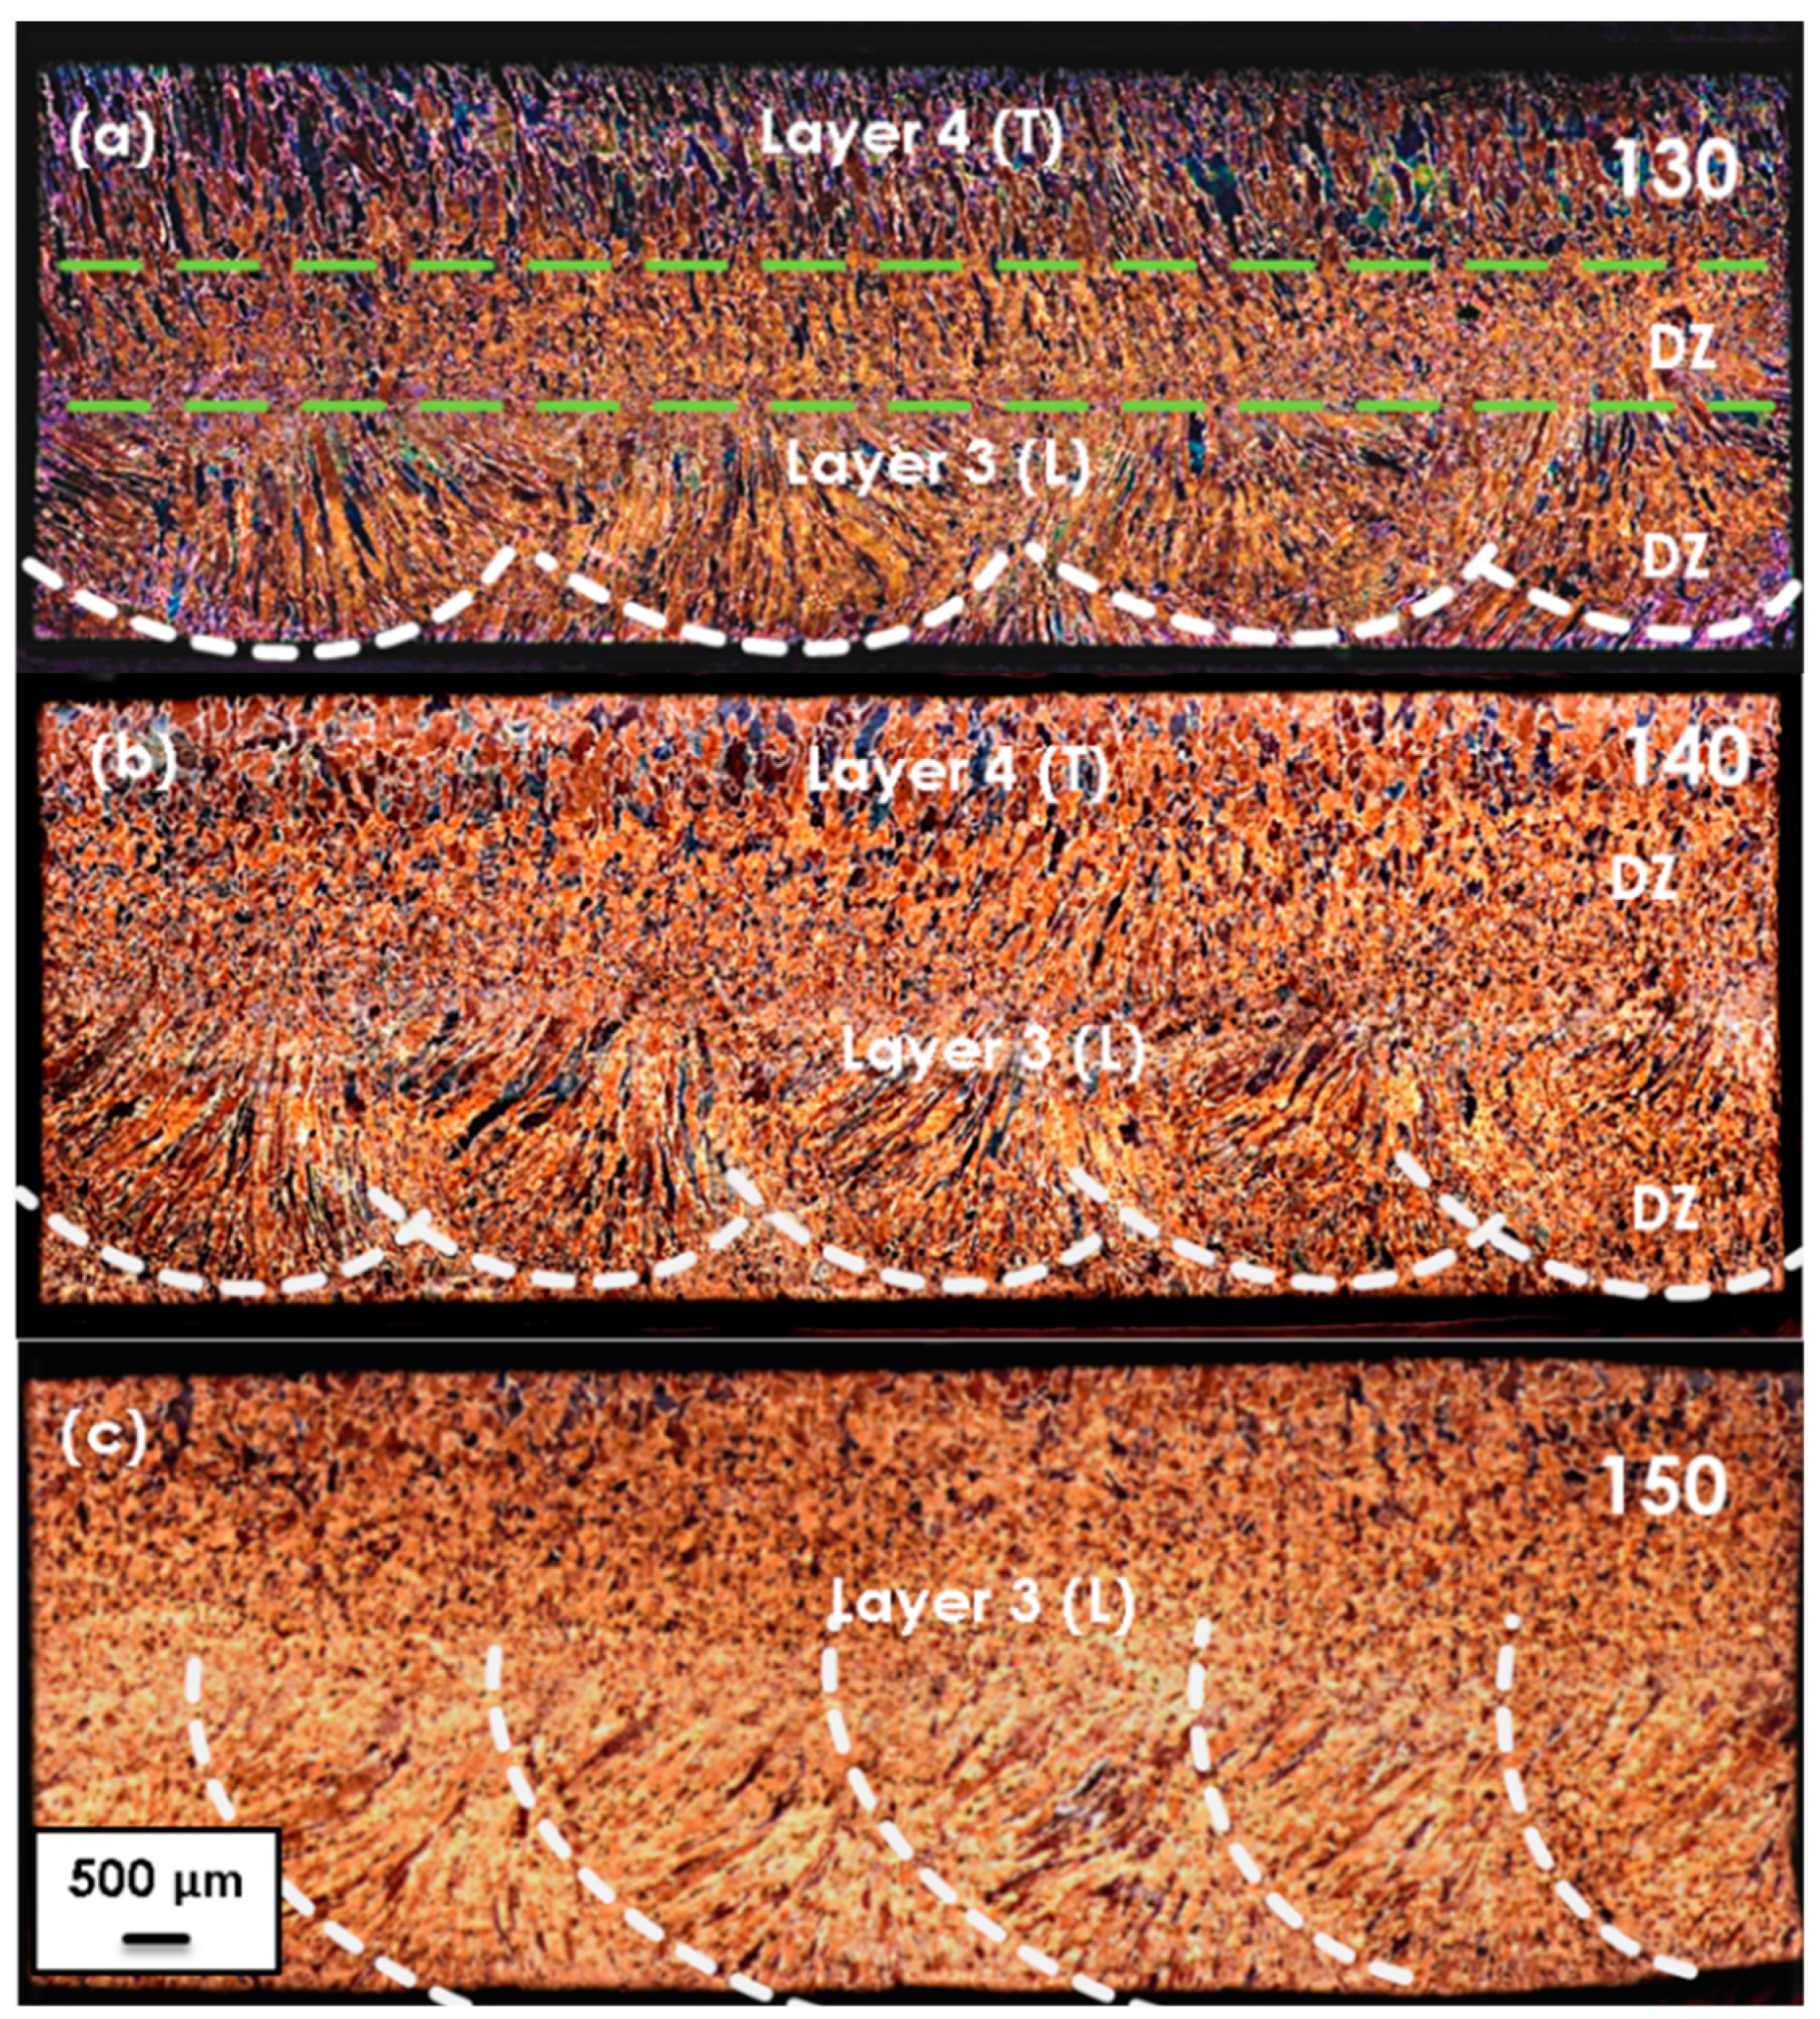
    • Lower heat input (thinner bead) forms fine Widmanstatten ferrite (WF) at the boundaries of the transforming austenite in the first and fourth layers, and bainite in the second and third layers, indicative of the variation in cooling rates.
    • Acicular ferrite dominated the structure of the higher heat input (wider beads) at the first layer, while relatively coarse WF and polygonal ferrite dominated the structure of the successive layers along the building direction.
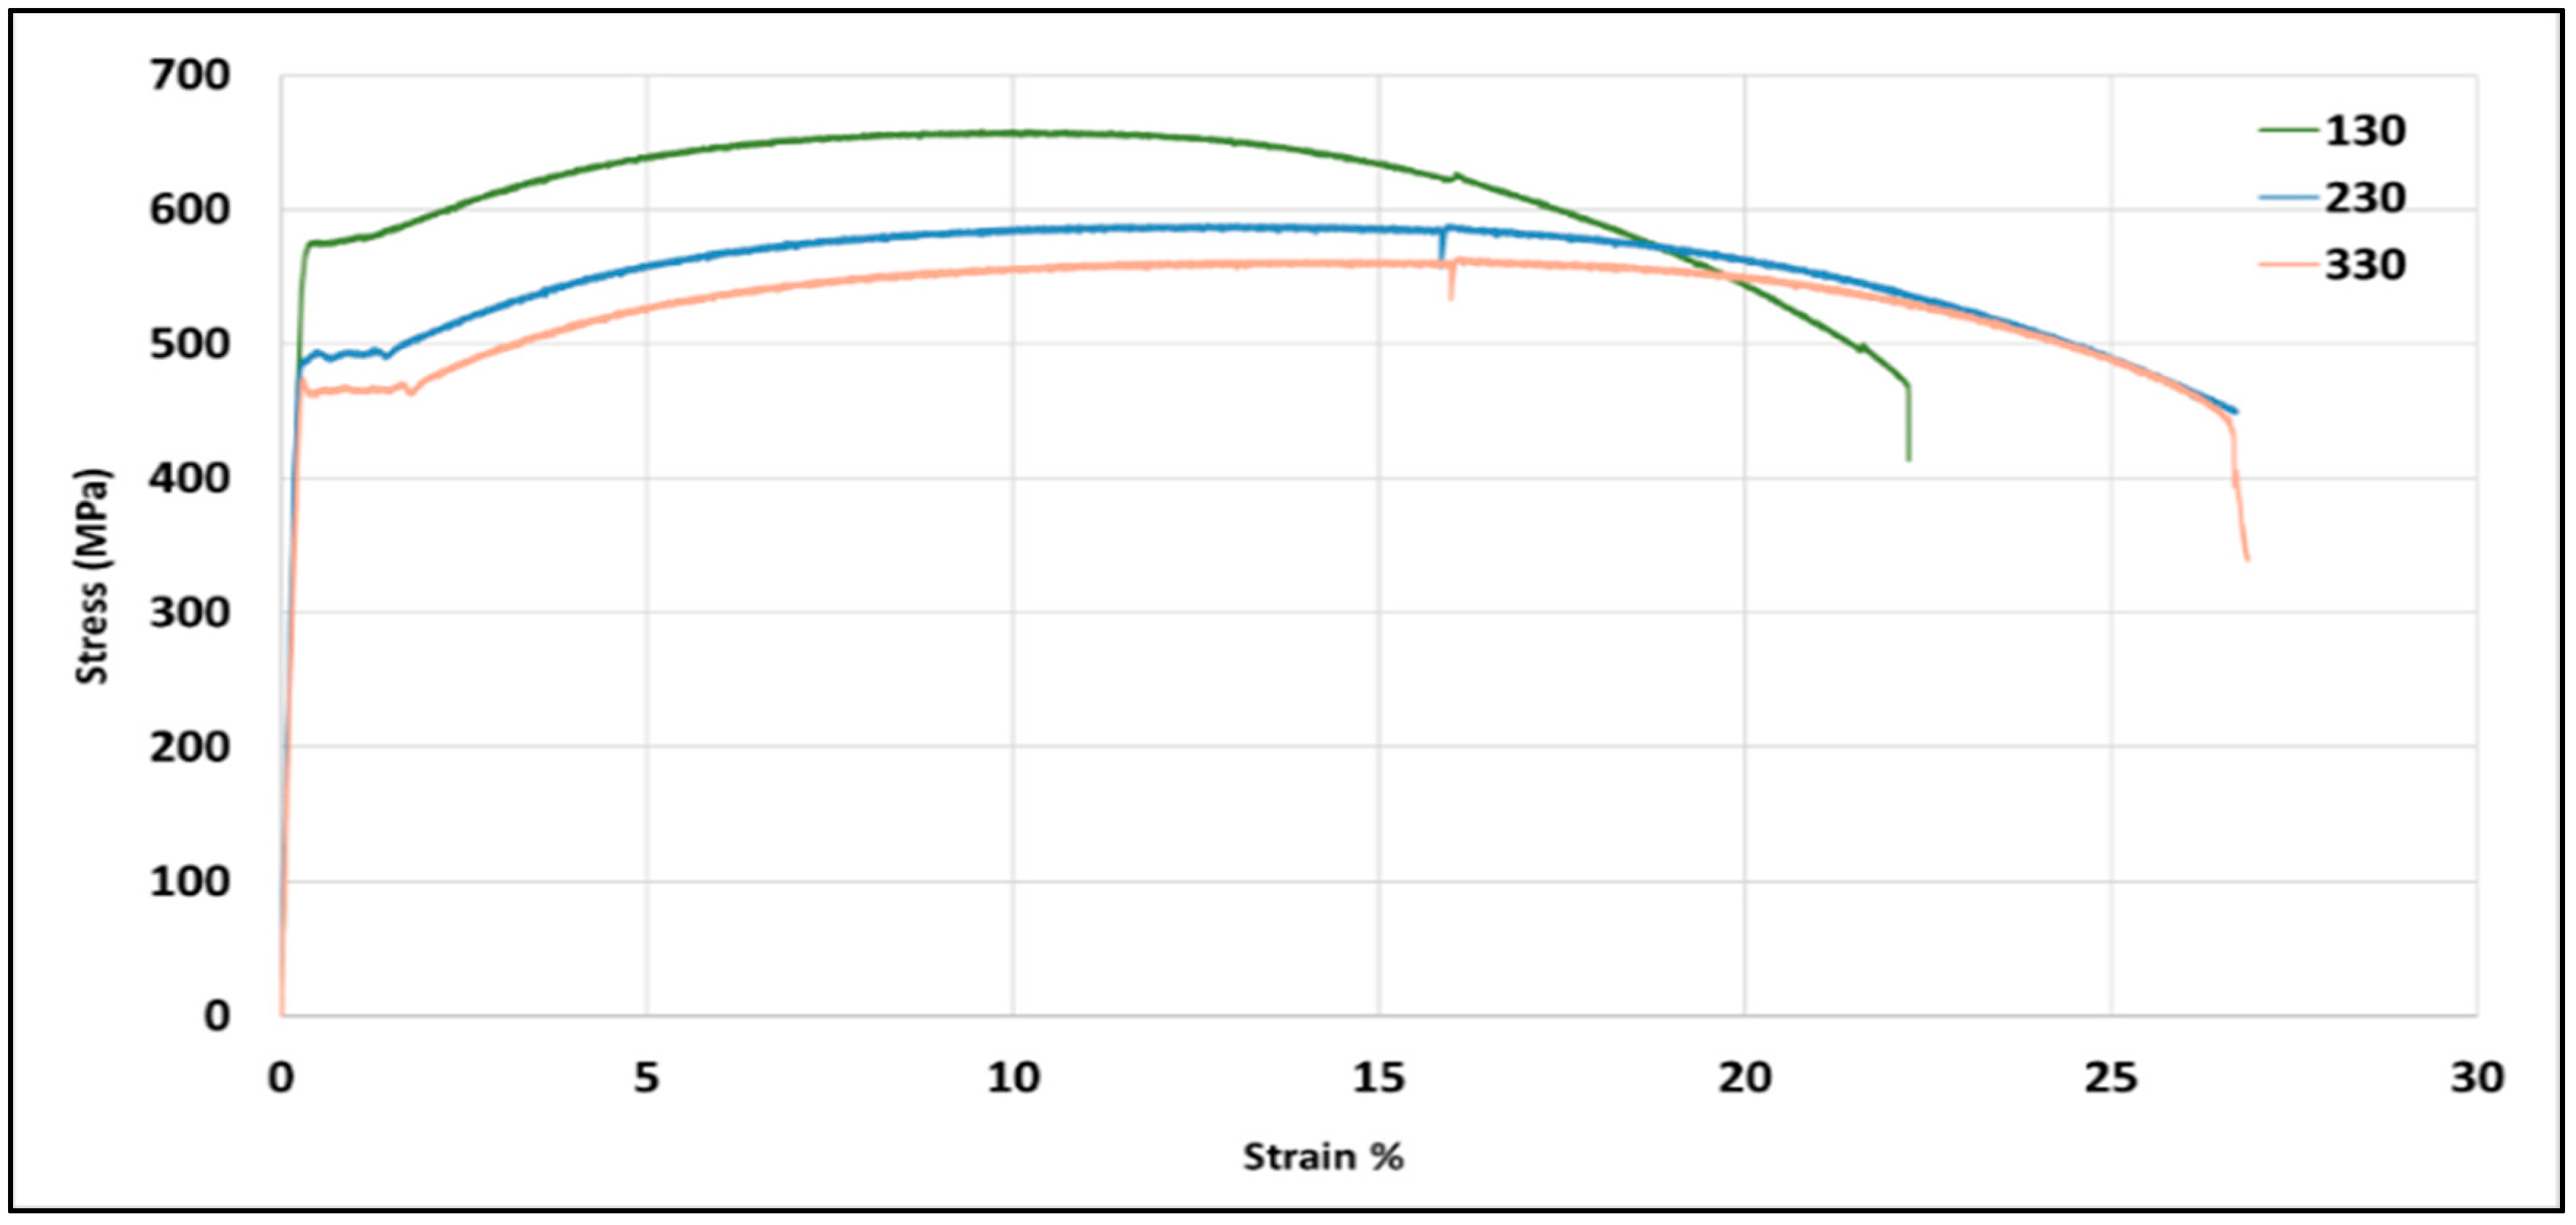
    • The volume fraction increases in WF associated with faster cooling rates during the phase transformation explain the increased hardness, yield, and ultimate tensile strength of the thinner bead (130) compared to the wider ones (230 and 330).

Author Contributions

Conceptualization, H.G.S.; data curation, A.E., S.S. and H.G.S.; formal analysis, A.E., O.O. and H.G.S.; funding acquisition, H.G.S.; investigation, A.E. and H.G.S.; methodology, A.E., S.S. and H.G.S.; project administration, H.G.S.; resources, H.G.S. and O.O.; supervision, H.G.S.; validation, O.O. and H.G.S.; visualization, H.G.S.; writing—original draft, A.E., O.O., S.S. and H.G.S.; writing—review and editing, A.E., O.O. and H.G.S. All authors have read and agreed to the published version of the manuscript.

Funding

This research was funded by the American University in Cairo.

Data Availability Statement

Data is unavailable due to privacy or ethical restrictions.

Acknowledgments

Authors of this work would like to acknowledge the Yousef Jamil Sciences and Technology center for facilitating the use of the FESM and BTSEM. The team would like to acknowledge the effort of Engs. Jaylan Elhalawany in supporting the researchers and for providing the necessary training to the research assistants.

Conflicts of Interest

The authors declare no conflict of interest.

References

  1. Haden, C.V.; Zeng, G.; Carter, F.M.; Ruhl, C.; Krick, B.A.; Harlow, D.G. Wire and Arc Additive Manufactured Steel: Tensile and Wear Properties. Addit. Manuf. 2017, 16, 115–123. [Google Scholar] [CrossRef]
  2. Reddy, S.; Kumar, M.; Panchagnula, J.S.; Parchuri, P.K.; Kumar, S.S.; Ito, K.; Sharma, A. A New Approach for Attaining Uniform Properties in Build Direction in Additive Manufactured Components through Coupled Thermal-Hardness Model. J. Manuf. Process. 2019, 40, 46–58. [Google Scholar] [CrossRef]
  3. Srivastava, M.; Rathee, S.; Tiwari, A.; Dongre, M. Wire Arc Additive Manufacturing of Metals: A Review on Processes, Materials and Their Behaviour. Mater. Chem. Phys. 2023, 294, 126988. [Google Scholar] [CrossRef]
  4. Kumar, S.; Singh, R. Optimization of Process Parameters of Metal Inert Gas Welding with Preheating on AISI 1018 Mild Steel Using Grey Based Taguchi Method. Meas. J. Int. Meas. Confed. 2019, 148, 106924. [Google Scholar] [CrossRef]
  5. Lockett, H.; Ding, J.; Williams, S.; Martina, F. Design for Wire + Arc Additive Manufacture: Design Rules and Build Orientation Selection. J. Eng. Des. 2017, 28, 568–598. [Google Scholar] [CrossRef] [Green Version]
  6. Chaturvedi, M.; Scutelnicu, E.; Rusu, C.C.; Mistodie, L.R.; Mihailescu, D.; Subbiah, A.V. Wire Arc Additive Manufacturing: Review on Recent Findings and Challenges in Industrial Applications and Materials Characterization. Metals 2021, 11, 939. [Google Scholar] [CrossRef]
  7. Chandrasekaran, S.; Hari, S.; Amirthalingam, M. Wire Arc Additive Manufacturing of Functionally Graded Material for Marine Risers. Mater. Sci. Eng. A 2020, 792, 139530. [Google Scholar] [CrossRef]
  8. Dirisu, P.; Supriyo, G.; Martina, F.; Xu, X.; Williams, S. Wire plus Arc Additive Manufactured Functional Steel Surfaces Enhanced by Rolling. Int. J. Fatigue 2020, 130, 105237. [Google Scholar] [CrossRef]
  9. Xu, X.; Ganguly, S.; Ding, J.; Guo, S.; Williams, S.; Martina, F. Microstructural Evolution and Mechanical Properties of Maraging Steel Produced by Wire + Arc Additive Manufacture Process. Mater. Charact. 2018, 143, 152–162. [Google Scholar] [CrossRef]
  10. Sridharan, N.; Noakes, M.W.; Nycz, A.; Love, L.J.; Dehoff, R.R.; Babu, S.S. On the Toughness Scatter in Low Alloy C-Mn Steel Samples Fabricated Using Wire Arc Additive Manufacturing. Mater. Sci. Eng. A 2018, 713, 18–27. [Google Scholar] [CrossRef]
  11. Xiong, J.; Yin, Z.; Zhang, W. Forming Appearance Control of Arc Striking and Extinguishing Area in Multi-Layer Single-Pass GMAW-Based Additive Manufacturing. Int. J. Adv. Manuf. Technol. 2016, 87, 579–586. [Google Scholar] [CrossRef]
  12. Rodrigues, T.A.; Duarte, V.; Miranda, R.M.; Santos, T.G.; Oliveira, J.P. Current Status and Perspectives on Wire and Arc Additive Manufacturing (WAAM). Materials 2019, 12, 1121. [Google Scholar] [CrossRef] [PubMed] [Green Version]
  13. Li, Y.; Su, C.; Zhu, J. Comprehensive Review of Wire Arc Additive Manufacturing: Hardware System, Physical Process, Monitoring, Property Characterization, Application and Future Prospects. Results Eng. 2022, 13, 100330. [Google Scholar] [CrossRef]
  14. AWS A5.18/A5.18M; Specification for Low-Alloy Steel Electrodes and Rods for Gas Shielded Arc Welding. American National Standards Institute: Miami, FL, USA, 2005; ISBN 0-87171-014-5.
  15. Spencer, J.D.; Dickens, P.M.; Wykes, C.M. Rapid Prototyping of Metal Parts by Three-Dimensional Welding. Proc. Inst. Mech. Eng. Part B J. Eng. Manuf. 1998, 212, 175–182. [Google Scholar] [CrossRef]
  16. Xie, B.; Xue, J.; Ren, X. Wire Arc Deposition Additive Manufacturing and Experimental Study of 316l Stainless Steel by Cmt + p Process. Metals 2020, 10, 1419. [Google Scholar] [CrossRef]
  17. Dirisu, P.; Ganguly, S.; Mehmanparast, A.; Martina, F.; Williams, S. Analysis of Fracture Toughness Properties of Wire + Arc Additive Manufactured High Strength Low Alloy Structural Steel Components. Mater. Sci. Eng. A 2019, 765, 138285. [Google Scholar] [CrossRef]
  18. Rosli, N.A.; Alkahari, M.R.; bin Abdollah, M.F.; Maidin, S.; Ramli, F.R.; Herawan, S.G. Review on Effect of Heat Input for Wire Arc Additive Manufacturing Process. J. Mater. Res. Technol. 2021, 11, 2127–2145. [Google Scholar] [CrossRef]
  19. Xu, F.; Lv, Y.; Liu, Y.; Shu, F.; He, P.; Xu, B. Microstructural Evolution and Mechanical Properties of Inconel 625 Alloy during Pulsed Plasma Arc Deposition Process. J. Mater. Sci. Technol. 2013, 29, 480–488. [Google Scholar] [CrossRef]
  20. Wen, D.; Long, P.; Li, J.; Huang, L.; Zheng, Z. Effects of Linear Heat Input on Microstructure and Corrosion Behavior of an Austenitic Stainless Steel Processed by Wire Arc Additive Manufacturing. Vacuum 2020, 173, 109131. [Google Scholar] [CrossRef]
  21. Ghaffari, M.; Vahedi Nemani, A.; Rafieazad, M.; Nasiri, A. Effect of Solidification Defects and HAZ Softening on the Anisotropic Mechanical Properties of a Wire Arc Additive-Manufactured Low-Carbon Low-Alloy Steel Part. Jom 2019, 71, 4215–4224. [Google Scholar] [CrossRef]
  22. Rafieazad, M.; Ghaffari, M.; Vahedi Nemani, A.; Nasiri, A. Microstructural Evolution and Mechanical Properties of a Low-Carbon Low-Alloy Steel Produced by Wire Arc Additive Manufacturing. Int. J. Adv. Manuf. Technol. 2019, 105, 2121–2134. [Google Scholar] [CrossRef]
  23. Tripathi, U.; Saini, N.; Mulik, R.S.; Mahapatra, M.M. Effect of Build Direction on the Microstructure Evolution and Their Mechanical Properties Using GTAW Based Wire Arc Additive Manufacturing. CIRP J. Manuf. Sci. Technol. 2022, 37, 103–109. [Google Scholar] [CrossRef]
  24. Duarte, V.R.; Rodrigues, T.A.; Schell, N.; Santos, T.G.; Oliveira, J.P.; Miranda, R.M. Wire and Arc Additive Manufacturing of High-Strength Low-Alloy Steel: Microstructure and Mechanical Properties. Adv. Eng. Mater. 2021, 23, 1–9. [Google Scholar] [CrossRef]
  25. Murugan, N.; Parmar, R.S. Effects of MIG Process Parameters on the Geometry of the Bead in the Automatic Surfacing of Stainless Steel. J. Mater. Process. Technol. 1994, 41, 381–398. [Google Scholar] [CrossRef]
  26. Yildiz, A.S.; Davut, K.; Koc, B.; Yilmaz, O. Wire Arc Additive Manufacturing of High-Strength Low Alloy Steels: Study of Process Parameters and Their Influence on the Bead Geometry and Mechanical Characteristics. Int. J. Adv. Manuf. Technol. 2020, 108, 3391–3404. [Google Scholar] [CrossRef]
  27. Gao, C.; Chen, X.; Su, C.; Chen, X. Location Dependence of Microstructure and Mechanical Properties on Wire Arc Additively Manufactured Nuclear Grade Steel. Vacuum 2019, 168, 108818. [Google Scholar] [CrossRef]
  28. Ron, T.; Levy, G.K.; Dolev, O.; Leon, A.; Shirizly, A.; Aghion, E. The Effect of Microstructural Imperfections on Corrosion Fatigue of Additively Manufactured ER70S-6 Alloy Produced by Wire Arc Deposition. Metals 2020, 10, 98. [Google Scholar] [CrossRef] [Green Version]
  29. Bodnar, R.L.; Hansen, S.S. Effects of Austenite Grain Size and Cooling Rate on Widmanstätten Ferrite Formation in Low-Alloy Steels. Metall. Mater. Trans. A 1994, 25, 665–675. [Google Scholar] [CrossRef]
Figure 1. A picture for the additive/subtractive robotic-controlled manufacturing system, AMCL, the American University in Cairo.
Jmmp 07 00003 g001
Figure 2. Schematics representing (a) prismatic block; (b) beads’ building tool path strategy; and (c) picture of the as-WAAM-ed blocks.
Jmmp 07 00003 g002
Figure 3. A schematic showing cross sections for the 30 and 50% overlapping beads.
Jmmp 07 00003 g003
Figure 4. Schematic representation showing the microstructural evolution and hardness measurements scenario: (a) cut section at the middle of the WAAM prismatic block; (b) microstructural evolution and hardness testing along the building direction.
Jmmp 07 00003 g004
Figure 5. Tensile specimen extraction: (a) location of specimens on the block thickness; (b) two specimens of each block; (c) tensile specimen.
Jmmp 07 00003 g005
Figure 6. Bar charts displaying the hardness values. (a) Average values and (b) layer-by-layer values for the 130, 140, and 150 built blocks.
Jmmp 07 00003 g006
Figure 7. Stress–strain diagram comparing the average behavior of the tensile testing of 130, 140, and 150.
Jmmp 07 00003 g007
Figure 8. Bar charts displaying the hardness values. (a) Average values and (b) layer-by-layer values for the 130, 230, and 330 built blocks.
Jmmp 07 00003 g008
Figure 9. Stress–strain diagram comparing the average behavior of the tensile testing of 130, 230, and 330.
Jmmp 07 00003 g009
Figure 10. SEM for the WAAM-ed prismatic blocks built at: (a,b) 130 (5 mm); (c,d) 230 (7 mm); (e,f) 330 (9 mm) at a constant OP (30%), respectively. Gas porosity—red circles; microvoids—yellow circles; secondary cracks—blue ovals.
Jmmp 07 00003 g010
Figure 11. OM panoramic images for the prismatic blocks deposited at constant BW of (5 mm) and OPs of: (a) 30%; (b) 40%; (c) 50%. Diffusion zone—DZ, longitudinal layer—L, transverse layer—T.
Jmmp 07 00003 g011
Figure 12. OM panoramic images for the WAAM-ed prismatic blocks built at (a) 130 (5 mm); (b) 330 (9 mm) at a constant OP (30%). Diffusion zone—DZ, longitudinal layer—L, transverse layer—T; green dashed lines represent turbulent zones.
Jmmp 07 00003 g012
Figure 13. OM images for WAAM-ed prismatic blocks built at (a,c) Block 130; (b,d) Block 330 for the 2nd and 3rd layers, respectively.
Jmmp 07 00003 g013
Figure 14. OM images for WAAM-ed prismatic built blocks at (a,c) Block 130; (b,d) Block 330 for the DZ-1 and 4th deposited layers, respectively.
Jmmp 07 00003 g014
Table 1. Wire chemical composition [14] (All single values are maximums).
AlloyFeCCrNiMoMnSiPSVCu
ER70S-6Balance0.06–0.150.150.150.151.40–1.850.80–1.150.0250.0350.030.5
Table 2. Welding parameters.
Bead NumberingBead DimensionsWelding ParametersHeat Inputs [J/mm]
Width [±0.5 mm]Height [±0.2 mm]Voltage [V]Current [A]WFS [m/min]WS [mm/s]
151.617.8164411212.3
272.217.816446389.2
393191904.75577.6
Table 3. Built blocks’ designation.
Bead Width (BW-mm)Overlapping Percentage (OP-%)ID
530130
540140
550150
730230
740240
750250
930330
940340
950350
Table 4. Number of beads per longitudinal/transverse layer.
LayerBead Width/No. of Beads/Layer
130 (5 mm)140 (5 mm)150 (5 mm)230 (7 mm)330 (9 mm)
Longitudinal131518108
Transverse3338452419
Disclaimer/Publisher’s Note: The statements, opinions and data contained in all publications are solely those of the individual author(s) and contributor(s) and not of MDPI and/or the editor(s). MDPI and/or the editor(s) disclaim responsibility for any injury to people or property resulting from any ideas, methods, instructions or products referred to in the content.

