Article

Friction Resistance of Uncured Carbon/Epoxy Prepregs under Thermoforming Process Conditions: Experiments and Modelling

by
David Aveiga
1,2,
David Garoz Gómez
3,
Davide Mocerino
2,*,
Bernardo López-Romano
4 and
Carlos González
1,2
1
Department of Materials Science, E.T.S. Ingenieros de Caminos, Universidad Politécnica de Madrid, 28040 Madrid, Spain
2
IMDEA Materials Institute, c/Eric Kandel 2, 28906 Getafe, Spain
3
Instituto de Fusión Nuclear—Guillermo Velarde, Universidad Politécnica de Madrid, 28006 Madrid, Spain
4
Fundación para la Investigación, Desarrollo y Aplicación de Materiales Compuestos (FIDAMC), 28906 Getafe, Spain
*
Author to whom correspondence should be addressed.
J. Manuf. Mater. Process. 2023, 7(1), 14; https://doi.org/10.3390/jmmp7010014
Submission received: 17 November 2022 / Revised: 22 December 2022 / Accepted: 28 December 2022 / Published: 1 January 2023

Abstract

:
The numerous prepreg characteristics benefit industries like the aerospace and automotive ones, producing a wide range of high-performance components for primary or secondary applications. Parts production is usually assisted by a thermoforming process in which the prepreg is heated and reshaped employing a moulding system. The ply-ply and ply-tool sliding behaviours in the Thermoforming govern the defects generation, such as wrinkles, making its study a crucial step. This work analyses ply-ply and ply-tool friction coefficients for UD AS4/8552 Carbon/Epoxy prepreg. A pull-out test method was employed to determine the friction coefficients at different velocities, pressures, and temperatures related to the thermoforming process conditions, supplying a detalied report of friction parameters and mechanisms. The measurements of the interlaminar resin layer thickness and the surface roughness geometry resulted respectively in a range of 11–14 μm and 3–4 μm were taken into account in the Lubrication Theory approach to developing an analytical model. Based on the Stribeck curve and Reynolds equation for a viscous fluid, the developed model accurately predicts friction coefficients for prepreg composite materials in the process and contact conditions mentioned below.

1. Introduction

The application of fibre-reinforced composites (FRC) (particularly polymer-matrix composites) as structural materials has grown continuously during the last 50 years owing to their unique combination of low density, high stiffness and strength, as well as toughness [1]. To keep these growing applications, improving their manufacturability to increase production rates while reducing defects and rejected parts is essential. The aircraft industry has paid particular attention to automated layup processes using prepregs for subsequent autoclave consolidation and dry fabrics for injection processes. However, automated techniques are generally restricted to relatively simple geometries, including nearly flat in the case of automated tape laying (ATL) or curved surfaces with automated fibre placement (AFP) [2,3]. Manufacturing complex shape parts, including frames and stringers, typically requires intensive hand layup (HLU) or hot-forming techniques starting with flat fresh laminates.
Mechanical presses or pneumatic bladders can carry out the hot-forming of fresh prepregs. During the simultaneous application of the temperature (below curing temperature) and the external pressure, relative sliding between the plies of the fresh laminate is permitted, enabling an easy adaptation of the laminate to the geometry configuration imposed by the tool. However, because of the inextensibility of the prepreg material in the fibre direction, its adaptation to complex geometries results in manufacturing defects, typically wrinkles [4,5]. These defects, as shown in [6,7,8], determine the final mechanical properties of the part, as well as its durability, causing up to ≈40% strength knock-down [9,10]. Wrinkle defects in composite manufacturing can be originated from two phenomena: shear between plies [11,12] during forming and slipping between plies [13,14] during consolidation [15]. As described in [16,17], friction resistance plays a critical role in the formation of wrinkling defects for both wrinkle mechanisms: inter-ply shear (slippage), ply-tool interaction and ply-ply slipping [14], leading to process-induced deformations and decreasing the part quality.
Several works in the literature regarding friction focused on thermoset unidirectional (UD) [18,19,20,21,22,23], thermoplastic UD plies [24,25,26,27], impregnated wovens [15,28,29,30], and dry fibres [31]. The study of friction, in addition to the different materials used, is generally focused on two types of contact: the ply-ply [22] and ply-tool contacts. According to the ply-ply contact the studies are usually focused on the evaluation of the shear forces in order to find a dependence between these forces and the production condition [32], including the influence of the resin layers on the lubrication regime [19].The last type of friction, ply-tool, is approached in two ways in the literature: directly by friction between the ply and tool during thermo-forming [33] and consolidation. Furthermore, the objective of studying the ply-tool interaction is to characterise the shear stresses near the tool [16,34,35,36].
In this work, the friction resistance between ply-ply and ply-tool is experimentally evaluated and analysed using the pull-out test for different temperatures, velocities, and pressures to represent the conditions of the forming manufacturing process thermoset prepregs. It is relevant to emphasise that our study is focused on the forming stage, never reaching curing temperatures and assuming the resin does not undergo any curing reaction during the friction tests. A friction model was formulated employing the Lubrication theory since the presence of a thin resin layer, acting as lubrication, was spotted in between the prepreg plies. Furthermore, the Reynolds equation was used to calculate the value of pressure distribution inside the found resin layer and to describe the friction mechanism during the thermoforming process. The model uses parameters derived from surface roughness observations with microscopical techniques. A Stribeck curve as a function of the Hersey number was built as a strategy to relate the friction coefficients with the process conditions. The model also generates a friction curve in the hydrodynamic lubrication regime to be compared with the experimental curve for validation.

2. Characterisation of the Frictional Behaviour

Pull-out tests are commonly used in composite engineering to evaluate the friction behaviour of thermoset or thermoplastics prepregs [15,18,23]. The test consists of the extraction by a tensile force of a prepreg sheet from two stationary rigid plates enabling the concurrent application of pressure and temperature. The pulling prepreg sheet can be clamped between two surfaces representing either the metal prepreg-tool or prepreg-prepreg contact. The method is flexible and can be easily adapted to different materials configurations and temperatures [37,38,39,40]. Most of the pull-out tests in the literature differ on how the clamping pressure is introduced and the methods used to guarantee a homogeneous action.

2.1. Prepreg Material

Hexply® AS4/8552 UD carbon prepreg sheets produced by Hexcel® with a nominal thickness of 0.221 mm and fibre volume fraction of 57% were cut in coupons of 300 × 45 mm and were used for friction tests placing the most extended dimension parallel to the fibre and pull-out direction. It is well-known that the friction coefficient changes with velocity, clamping pressure and temperature, i.e., viscosity [20,22,23,38]. The viscosity of the 8552 epoxy resin is shown in Figure 1d, including the numerical fitting in the temperature region of interest (40 °C and 60 °C).

2.2. Experimental Set-Up

A general view of the testing apparatus developed in our departments based on fixtures for similar tests [18,19,20,41] is presented in Figure 1a. It is comprised of two simultaneous actuators controlling the vertical pulling and horizontal clamping forces applied, F and N, respectively. The system is mounted on an Instron universal testing frame for pulling the prepreg sheets. At the same time, the clamping force is introduced by a mechanical fixture driven by a compressed air cylinder (Compact Bore 100, Stroke 0100 by Metal Work Iberica S.A.®, Barbera del Valles, Spain). A set of four stainless steel guide bars were used to maintain clamping plates parallel during the load application. The clamping plates were machined on 6082 aluminium, where four cartridge heaters were inserted. Each cartridge heater contained a thermocouple in the middle position used to control the temperature of the test with a Eurotherm EFit SCR Power System. A supplementary thermocouple was placed on the surface of each clamping plate to check the effective temperature of the tests. An ulterior time of 30 min was waited to stabilize the temperature of the aluminium plate. The pneumatic cylinder was controlled with a PID-controlled servo-valve connected to the air-compressed line. The loads F and N were measured using two Instron 100 and 10 kN load cells, respectively.
Figure 1b,c show the two configuration of the set-up to perform prepreg-tool or prepreg-prepreg contact experiments. For the ply-ply tests, the aluminium plates are covered with prepreg sheets wider enough to keep the friction coupon in constant contact with the prepreg. The cover and sample fibres have the same orientation. The prepreg samples were also maintained at room temperature for at least 1 h before the tests to unfreeze and climate them.
In this study, the clamping pressure p, temperature T and pulling speed U ˙ were 0.5, 1, 2 bars, 40 and 60 °C and 1, 3, 5 and 10 mm/min, respectively. These test settings were chosen since they are the standard at which this specific material is thermally formed. At least five valid tests were performed for each of the conditions described to get statistical values of the frictional behaviour resulting in a total of 240 friction tests.
Before the tests, a procedure was carried out to guarantee uniformity of the clamping pressure. Such a procedure consisted of clamping the prepreg material sheet between the metal plates and inserting a set of eight pouch pressure sensors (Flexiforce A201 by Tekscan™Inc., Highway Norwood, MA, USA). The five correction screws machined in the aluminium plate were manipulated, fastening or losing, until the voltage signals of the eight sensors were similar within the experimental scatter. The calibration procedure was carried out daily, setting the clamping pressure to an expected value.

2.3. Test Results

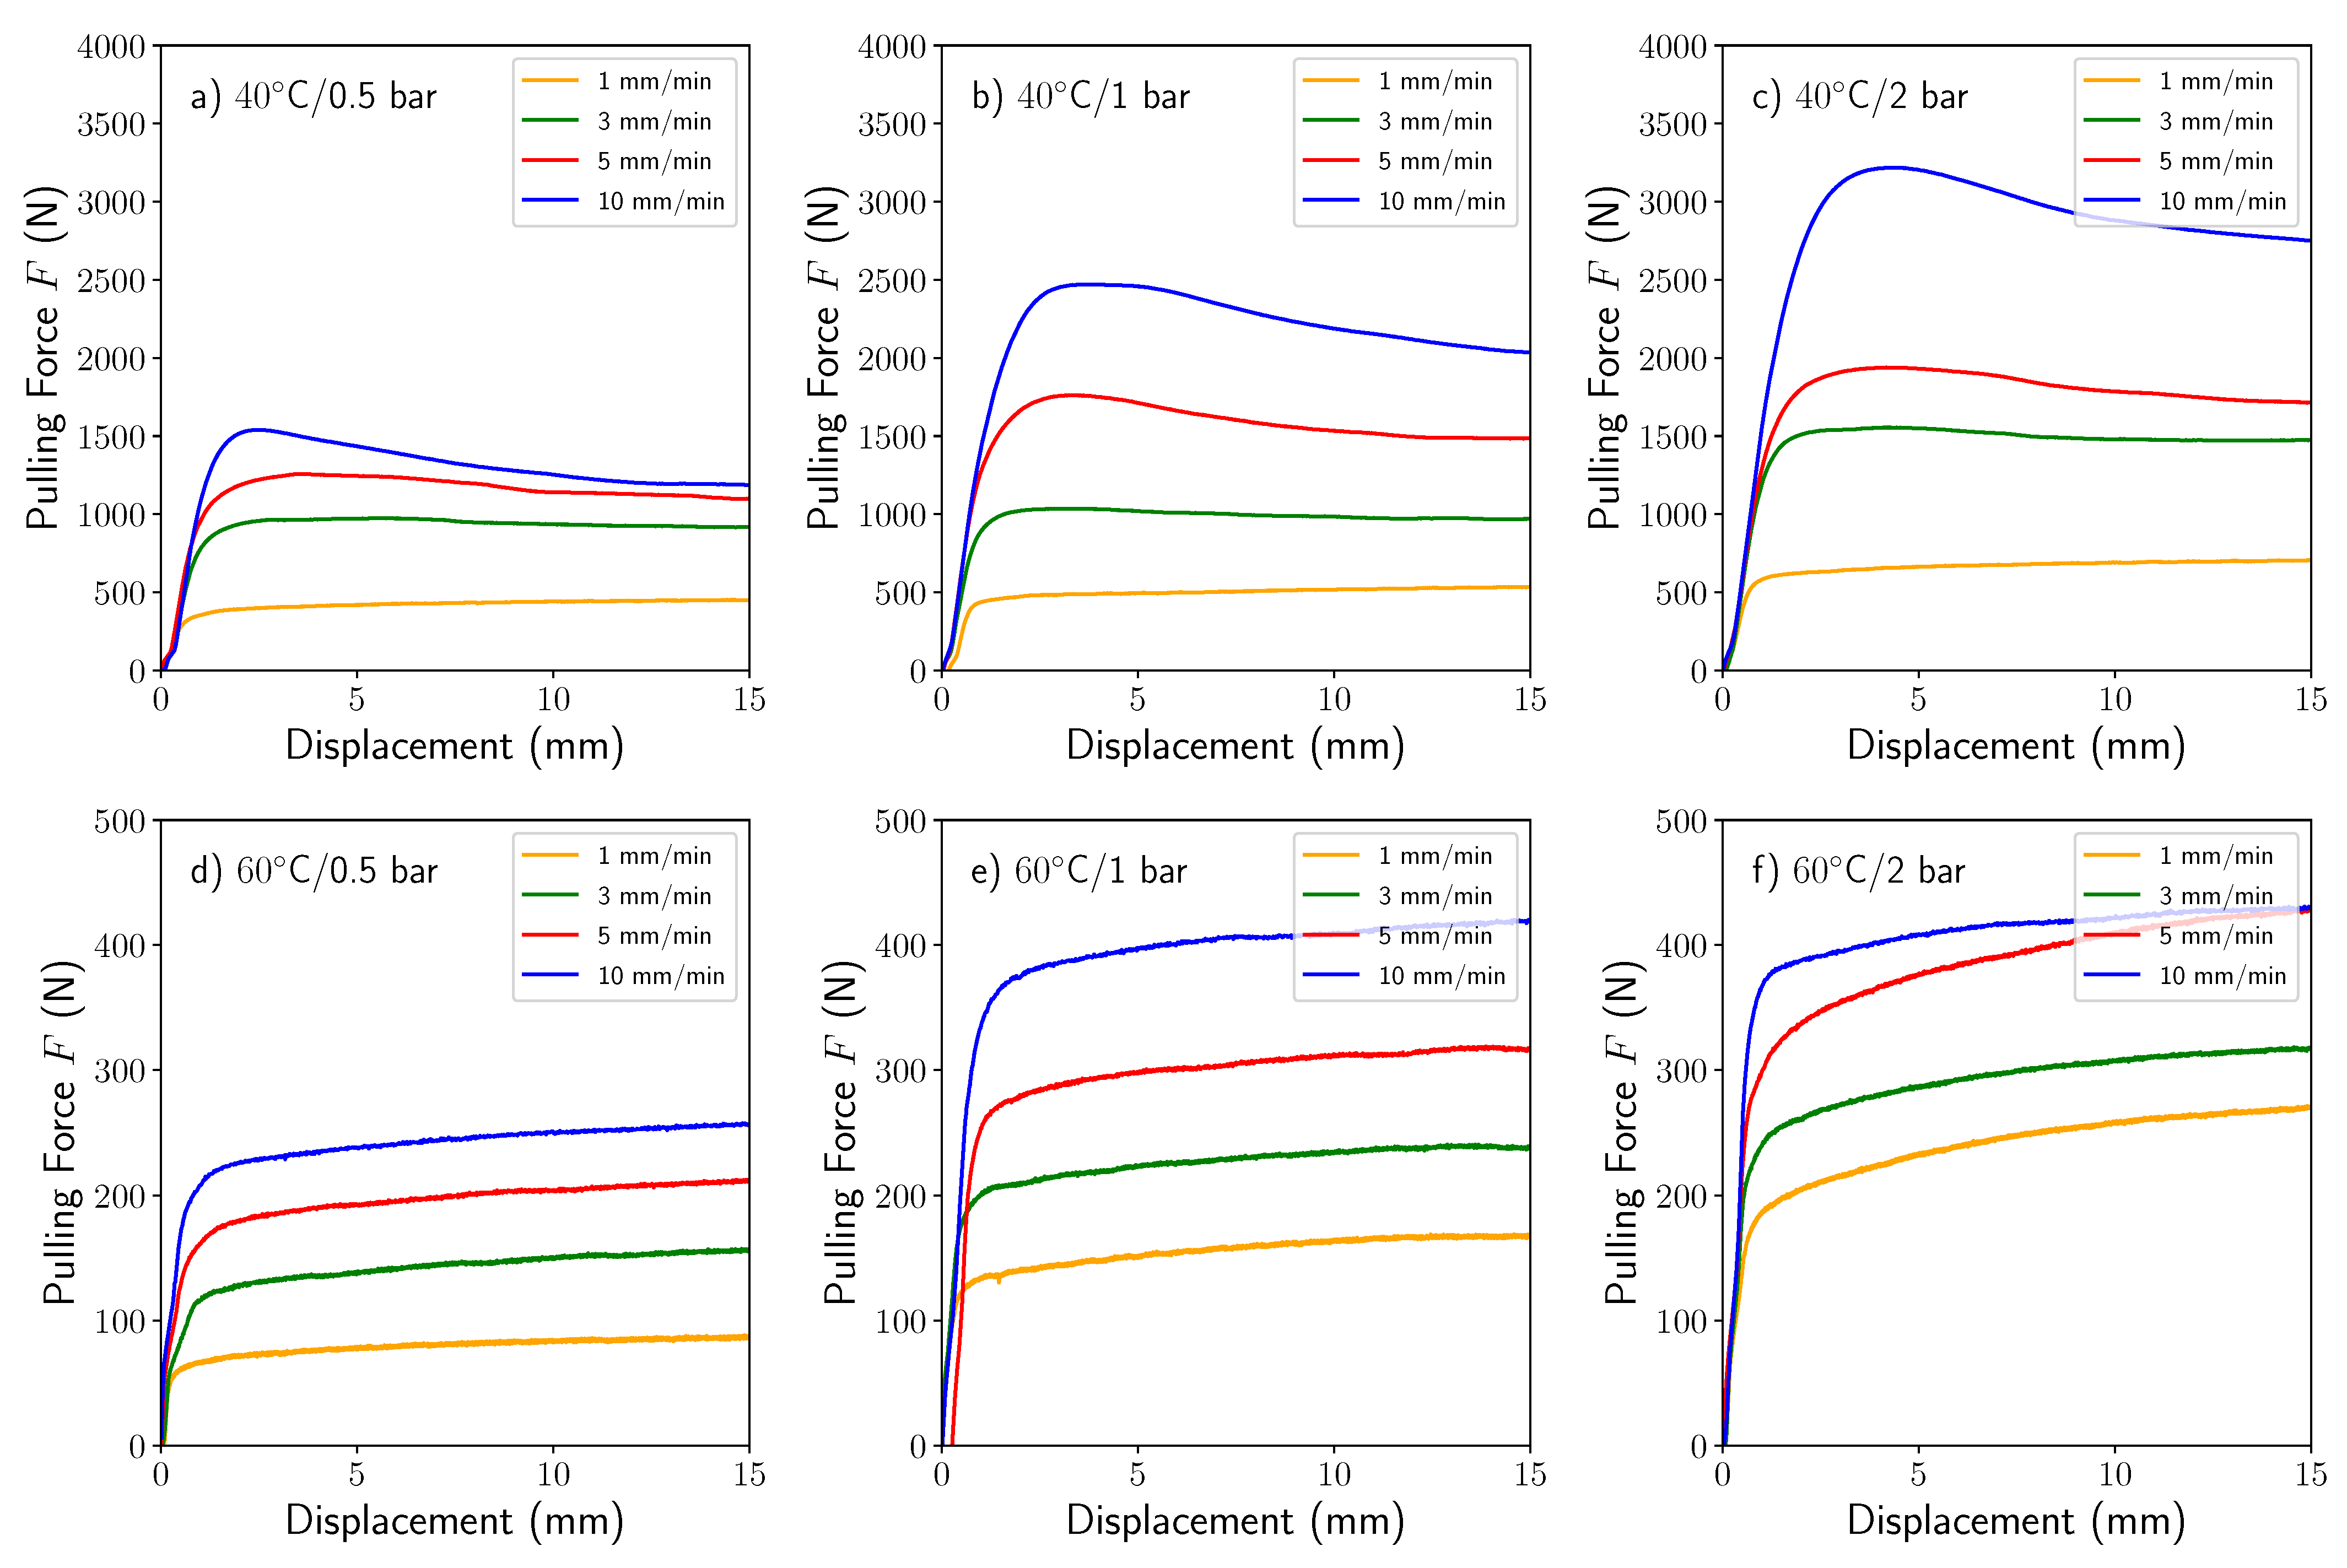
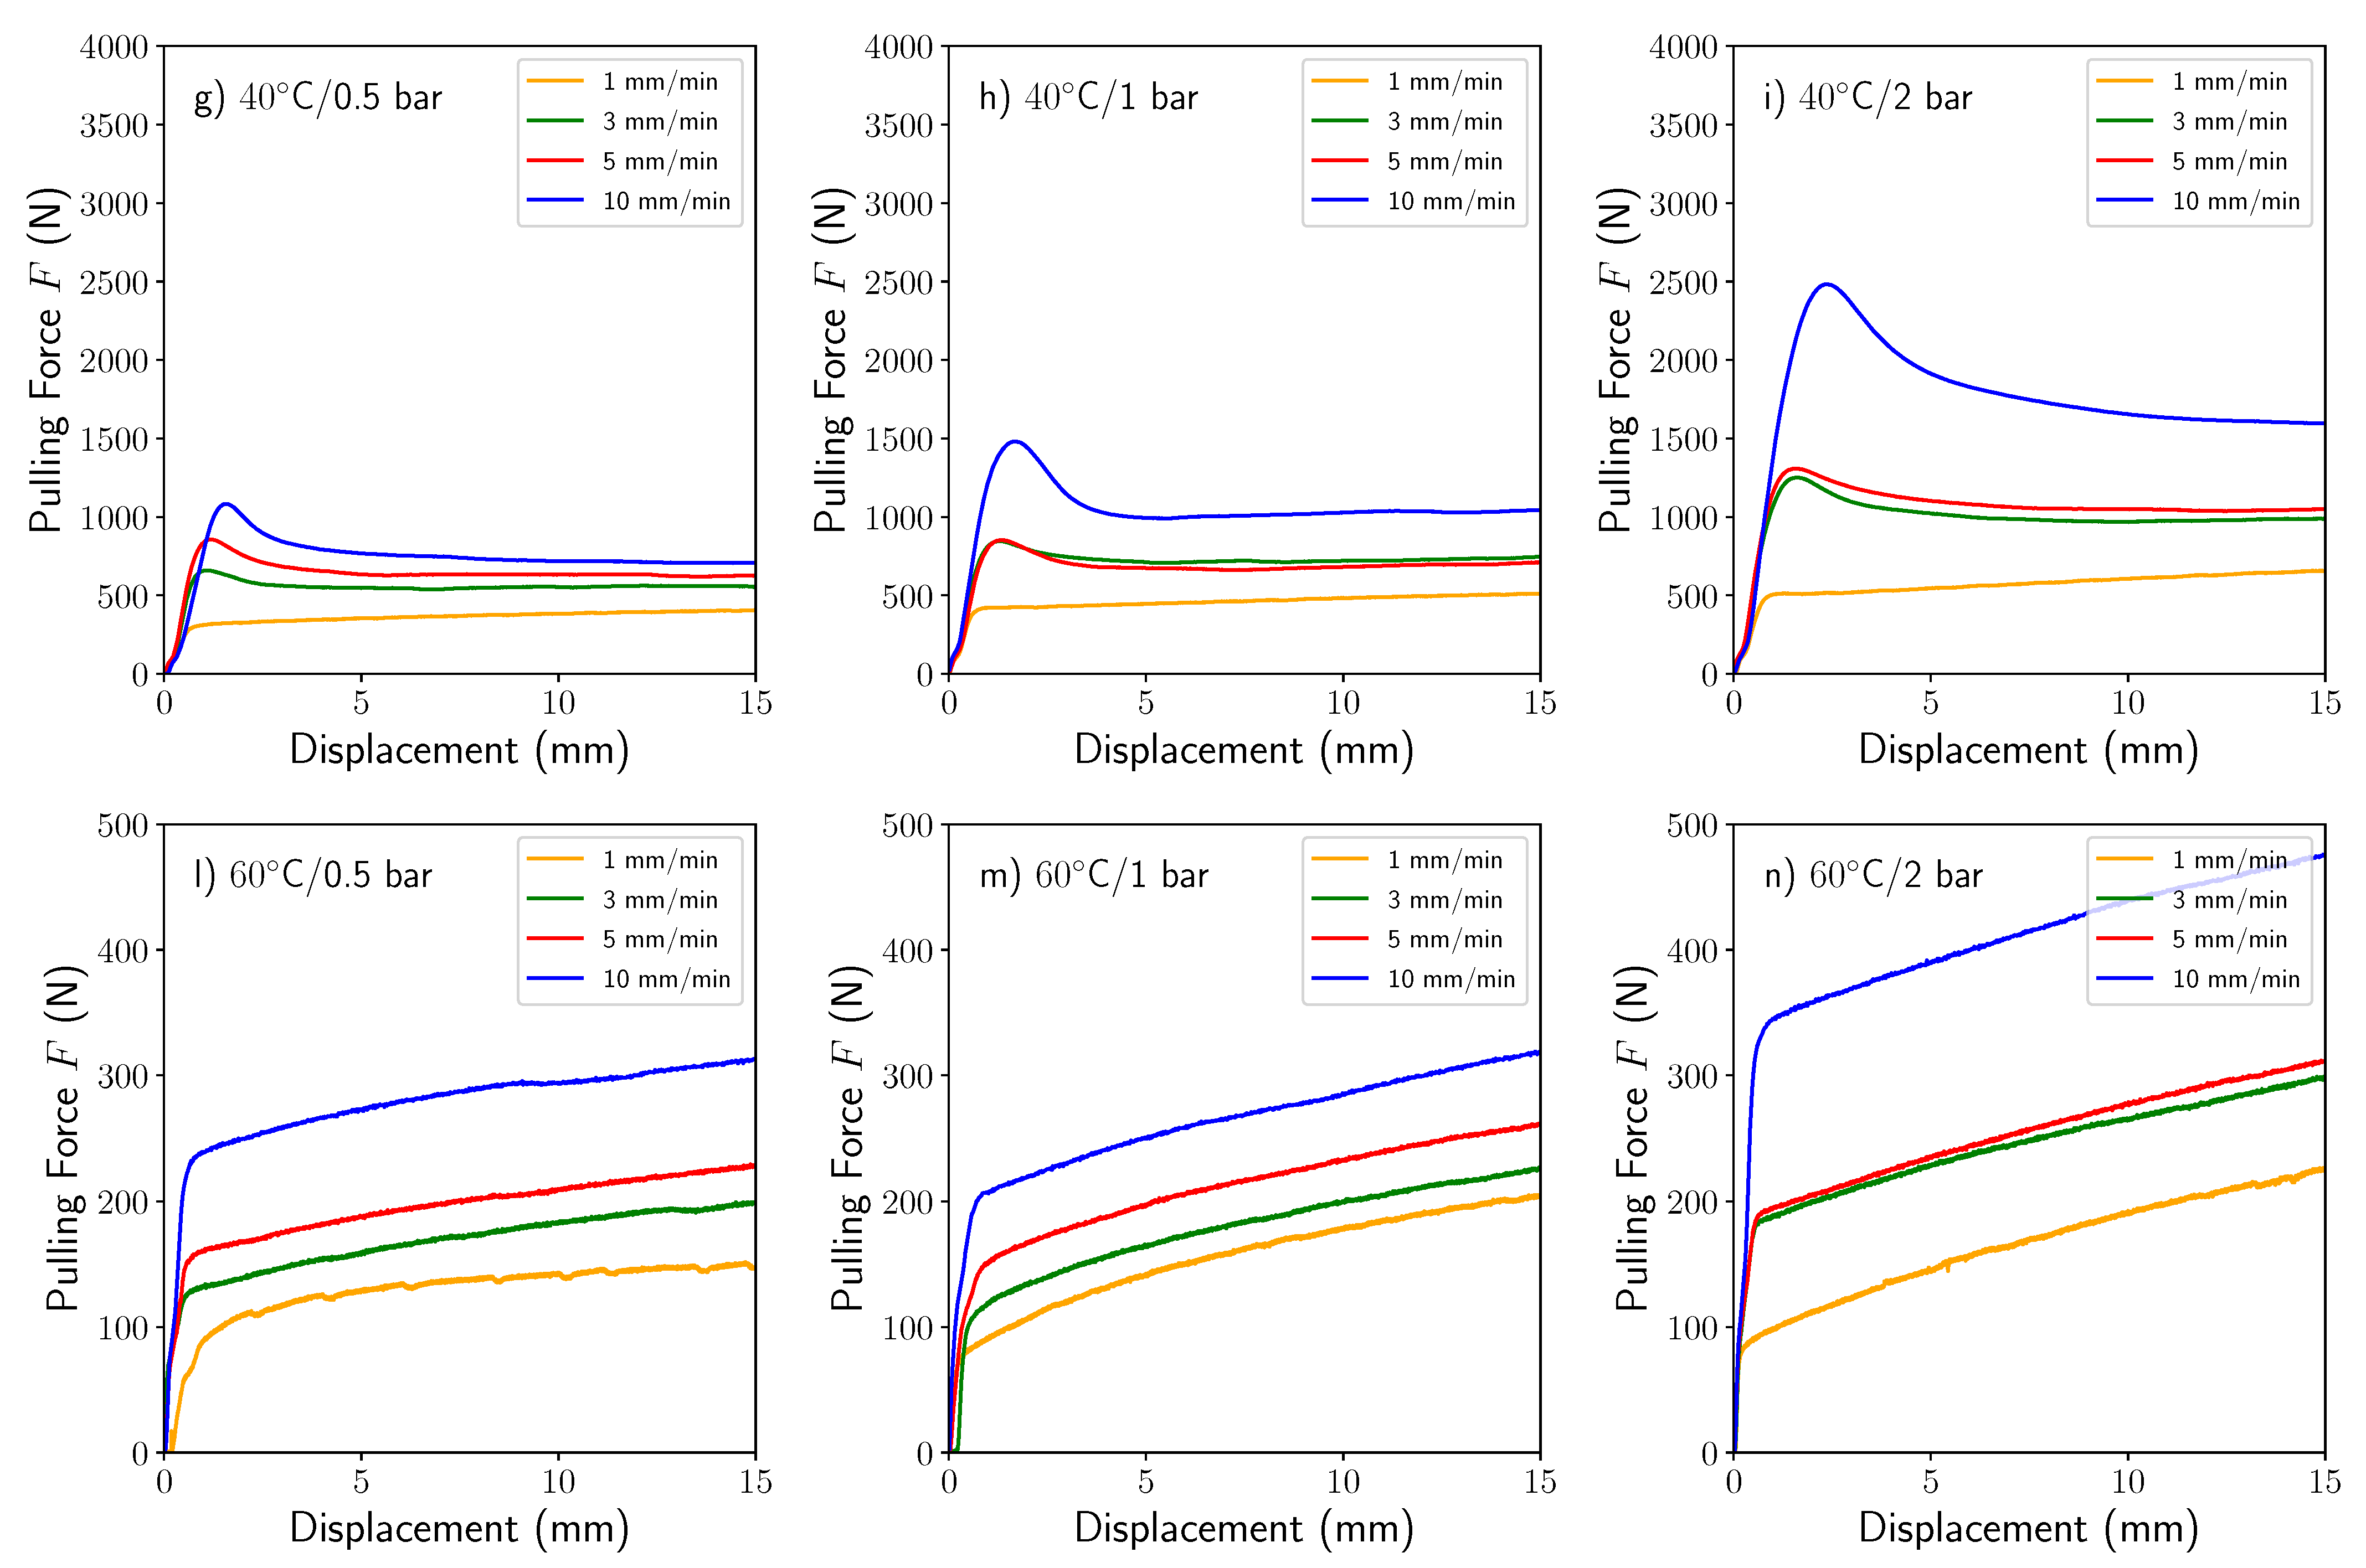
The representative load-displacement curves F U corresponding to the tests carried out to measure the prepreg-prepreg friction for the experimental conditions previously described are gathered in Figure 2. The shape of the F U curves exhibits an initial linear increase of the pulling force up to an onset point in which specimen relative sliding started. After that point, the specimen was continuously extracted up to load stabilisation.
The results obtained for the two different temperatures had similar shapes but with smooth transitions of the F U curves during the whole test. In both cases, the effect of temperature and velocity strongly influences the shape of the curves suggesting a film-sliding friction mechanism. As expected, the increase in the temperature decreased the pull-out forces while increasing the pulling velocity produced the opposite behaviour. It is important to mention that the pressure also modifies the pull-out force increasing the value when pressure increases. The corresponding curves of the prepreg-tool tests were similar to those obtained for prepreg-prepreg contact and were omitted in the paper for clarity.
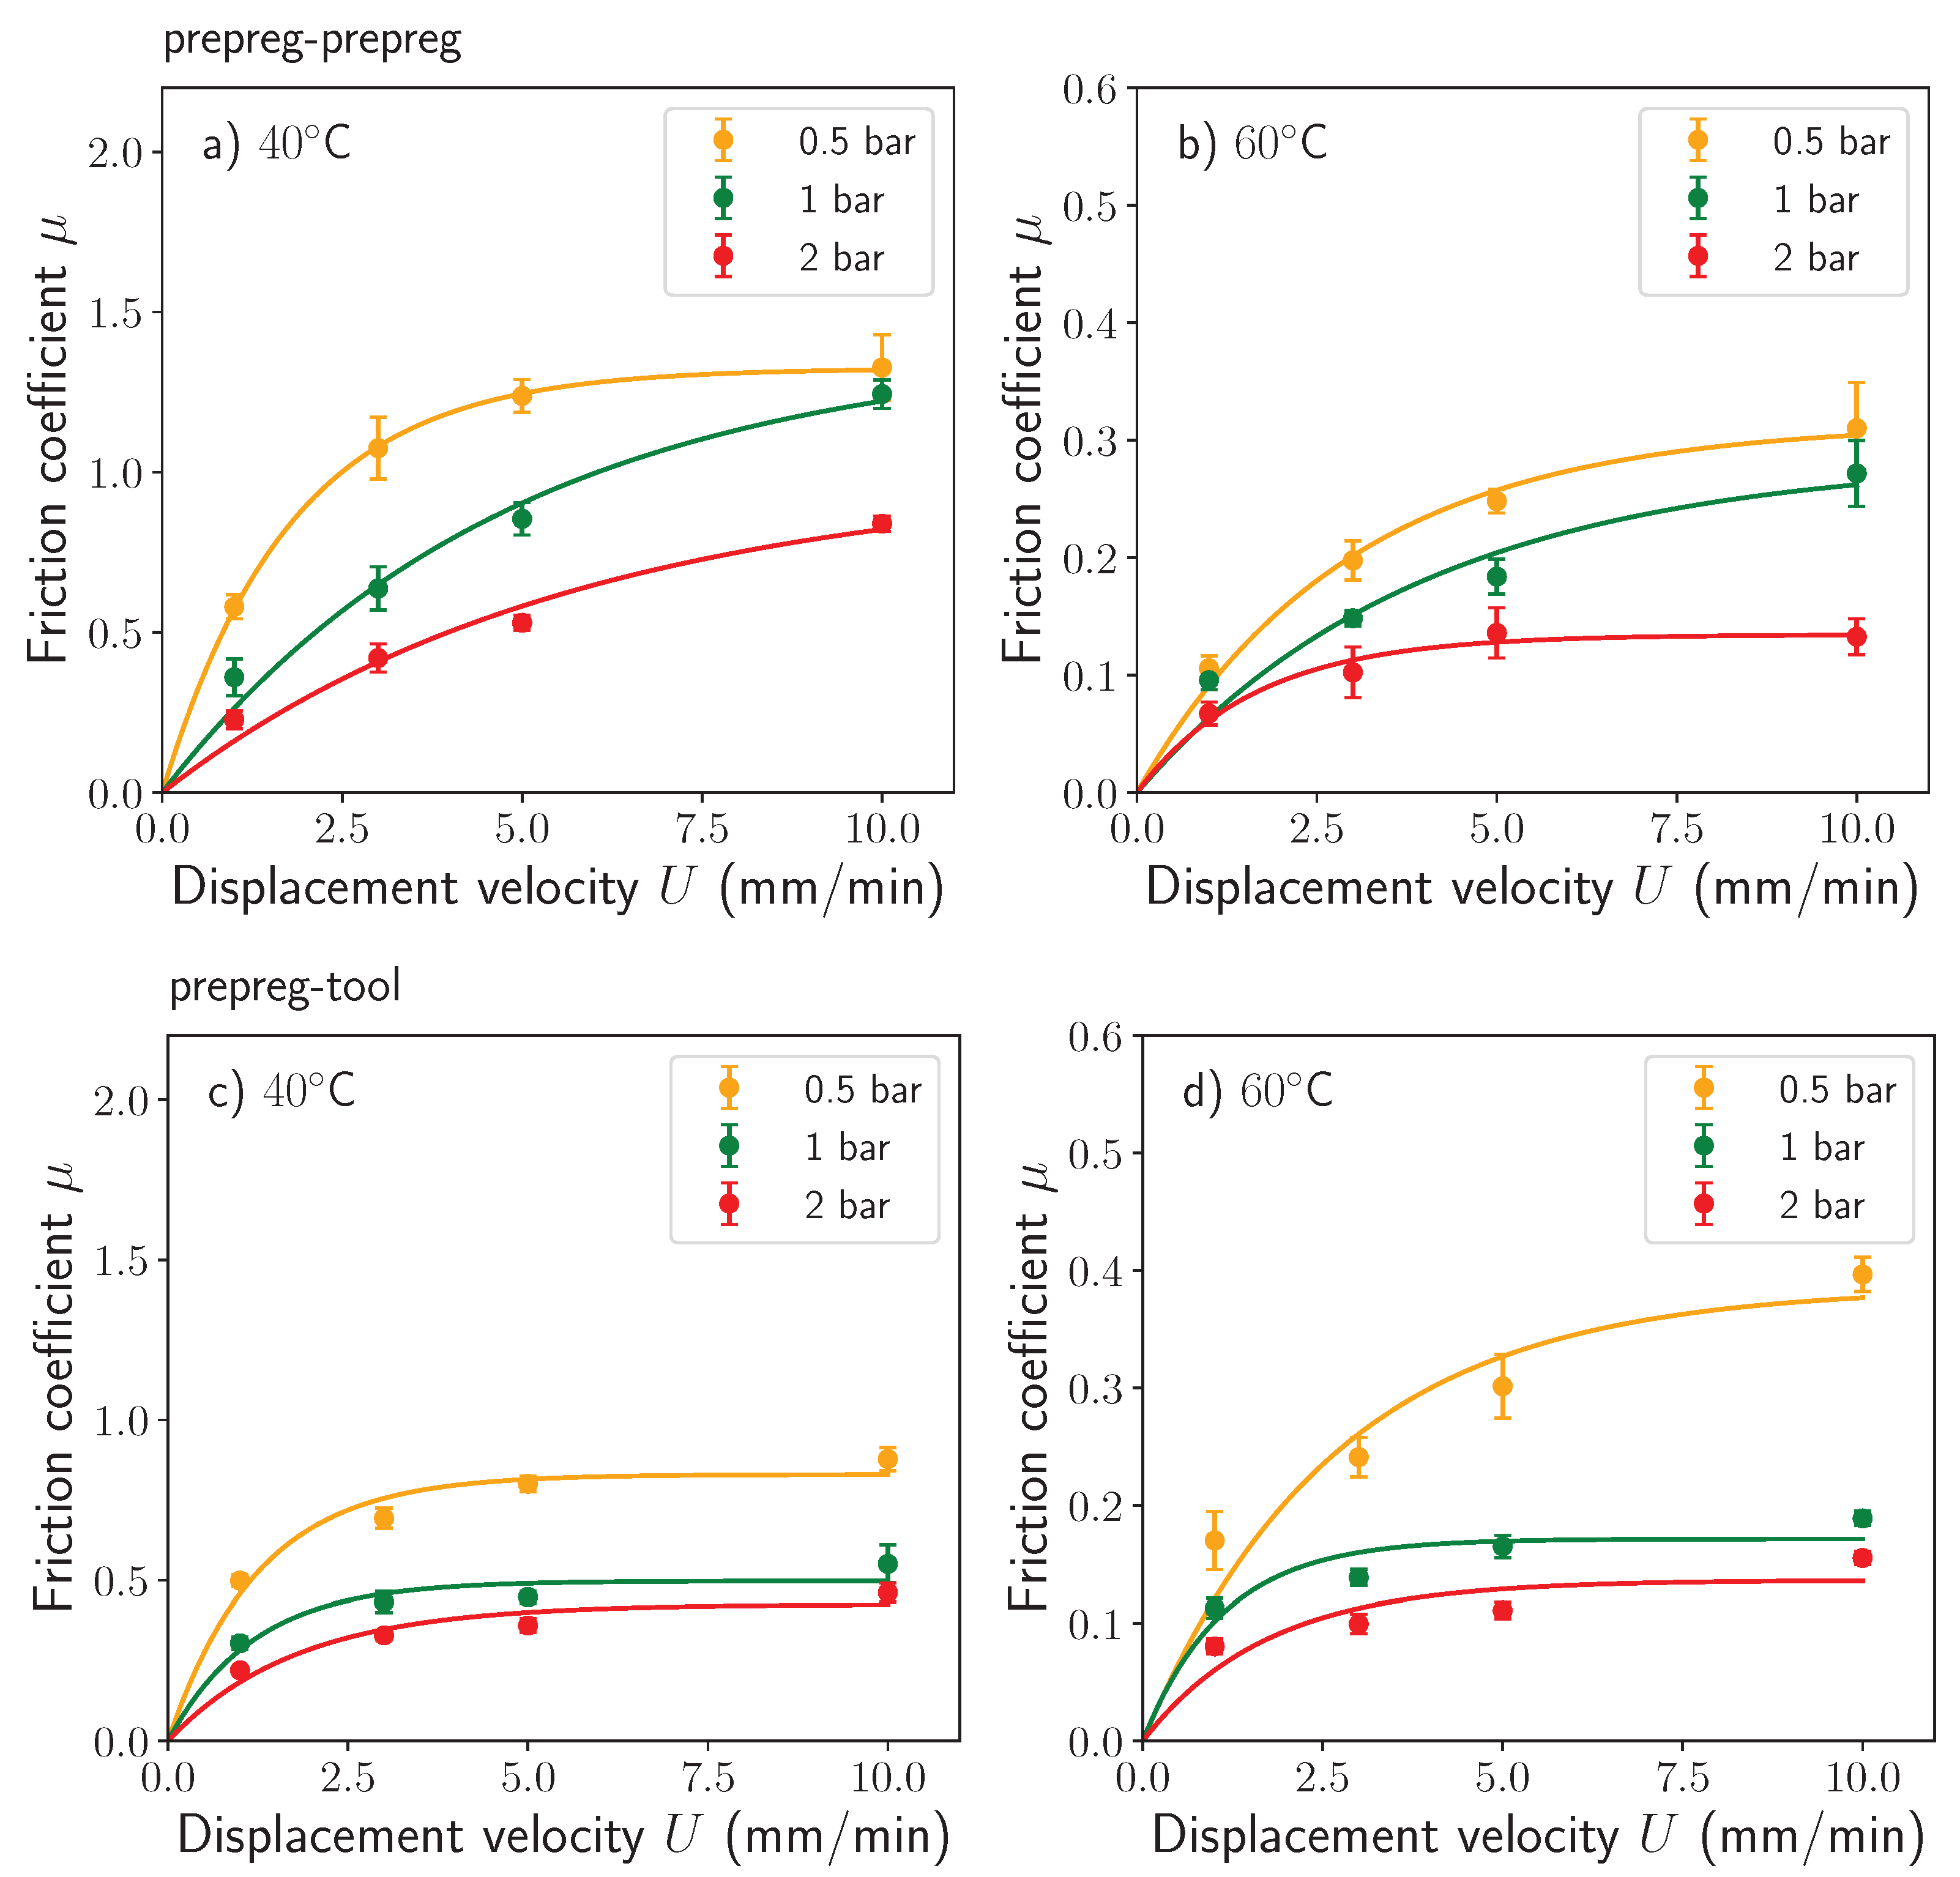
The friction coefficient was obtained as the ratio μ = F / 2 N where F stands for the applied pulling force, and N is the normal clamping force. The factor of two used in the latter expression is because the contact surface of the pull-out specimen with the gripping system is double. The friction coefficient was calculated when the pulling load was sufficiently stabilised in the displacement range of the tests. The friction coefficient μ as a function of the pulling velocity U ˙ is presented in Figure 3 for the prepreg-prepreg and prepreg-tool configurations. Table 1 gathers a summary of the prepreg-prepreg and prepreg-tool contact friction coefficients for the combination of the abovementioned variables with their corresponding standard deviation.
When increasing the applied clamping pressure, the friction coefficient decreased considerably for both types of contacts (e.g., ≈1.75 for 0.5 bar and ≈1.00 for 2.0 bar for prepreg-prepreg contact) being this effect partially explained by the decrease of surface roughness with the increasing clamping pressure [19]. However, as shown in the force-displacement F U curves in Figure 2, the friction coefficient is, to an extent, sensitive to the pulling velocity. For velocities larger than 5 mm/min, the friction coefficient remains almost constant and only pressure produced a significant effect. Such behaviour is consistent with a lubricated regime where viscosity effects play a significant role. The lubricated regime is associated with the presence of a resin film between the plies and is defined by the ratio of the theoretical film to the roughness of the surfaces in contact as [42]
λ = h m i n σ 1 2 + σ 2 2
where σ 1 and σ 2 are the surface roughness amplitudes in two principal directions and h m i n the thickness of the sliding layer. If λ > 3 , it will be possible to consider a whole lubricating regime where the resin film completely separates the surface. Conversely, when λ < 3 , there is physical contact between surfaces. Thus, from a simple examination of prepreg surfaces after testing, it was clear that our testing regime is almost dominated by film sliding.

3. Characterisation of the Contact Surfaces

Contact between two rubbing surfaces is classified as lying between two opposite regimes. Firstly, the boundary lubrication (BL) regime is understood as the contact between the two surfaces in which the solid surface roughness contacts fully transmit the forces. Secondly, Elastohydrodynamic lubrication (EHL) sliding is defined as the regime in which a lubricant film separates the two contact surfaces with friction controlled by the film thickness and the rheological properties of the film [43]. Between both regimes, mixed lubrication (ML) considers that the fluid film penetrates inside the solid contacts, so both types of load transfer can be possible [44].
The Stribeck theory was proposed to analyse the friction data in prepregs [22,24,33]. According to this theory, friction is dependent on a single variable called Hersey number H collecting the effects of clamping pressure p, velocity U ˙ , and temperature through the polymer viscosity η ( T , p , . . . ) , as stated by the following mathematical expression
H = η U ˙ p
The initial formulation of the Hersey number for a journal-bearing geometry proposed it as a non-dimensional number. Although, this parameter has been employed in different case studies acquiring practical dimensions. For our case study, the Hersey number is dimensional with units of length.
The dynamic viscosity η plays a key role during friction dominated by film sliding. The 8552 epoxy resin manufacturer, Hexcel, provided the data sheet with viscosity values as a function of temperature. An Arrhenius law was employed to adjust the viscosity to the temperature values of interest for this study as follows:
η ( T ) = B exp ( C R T )
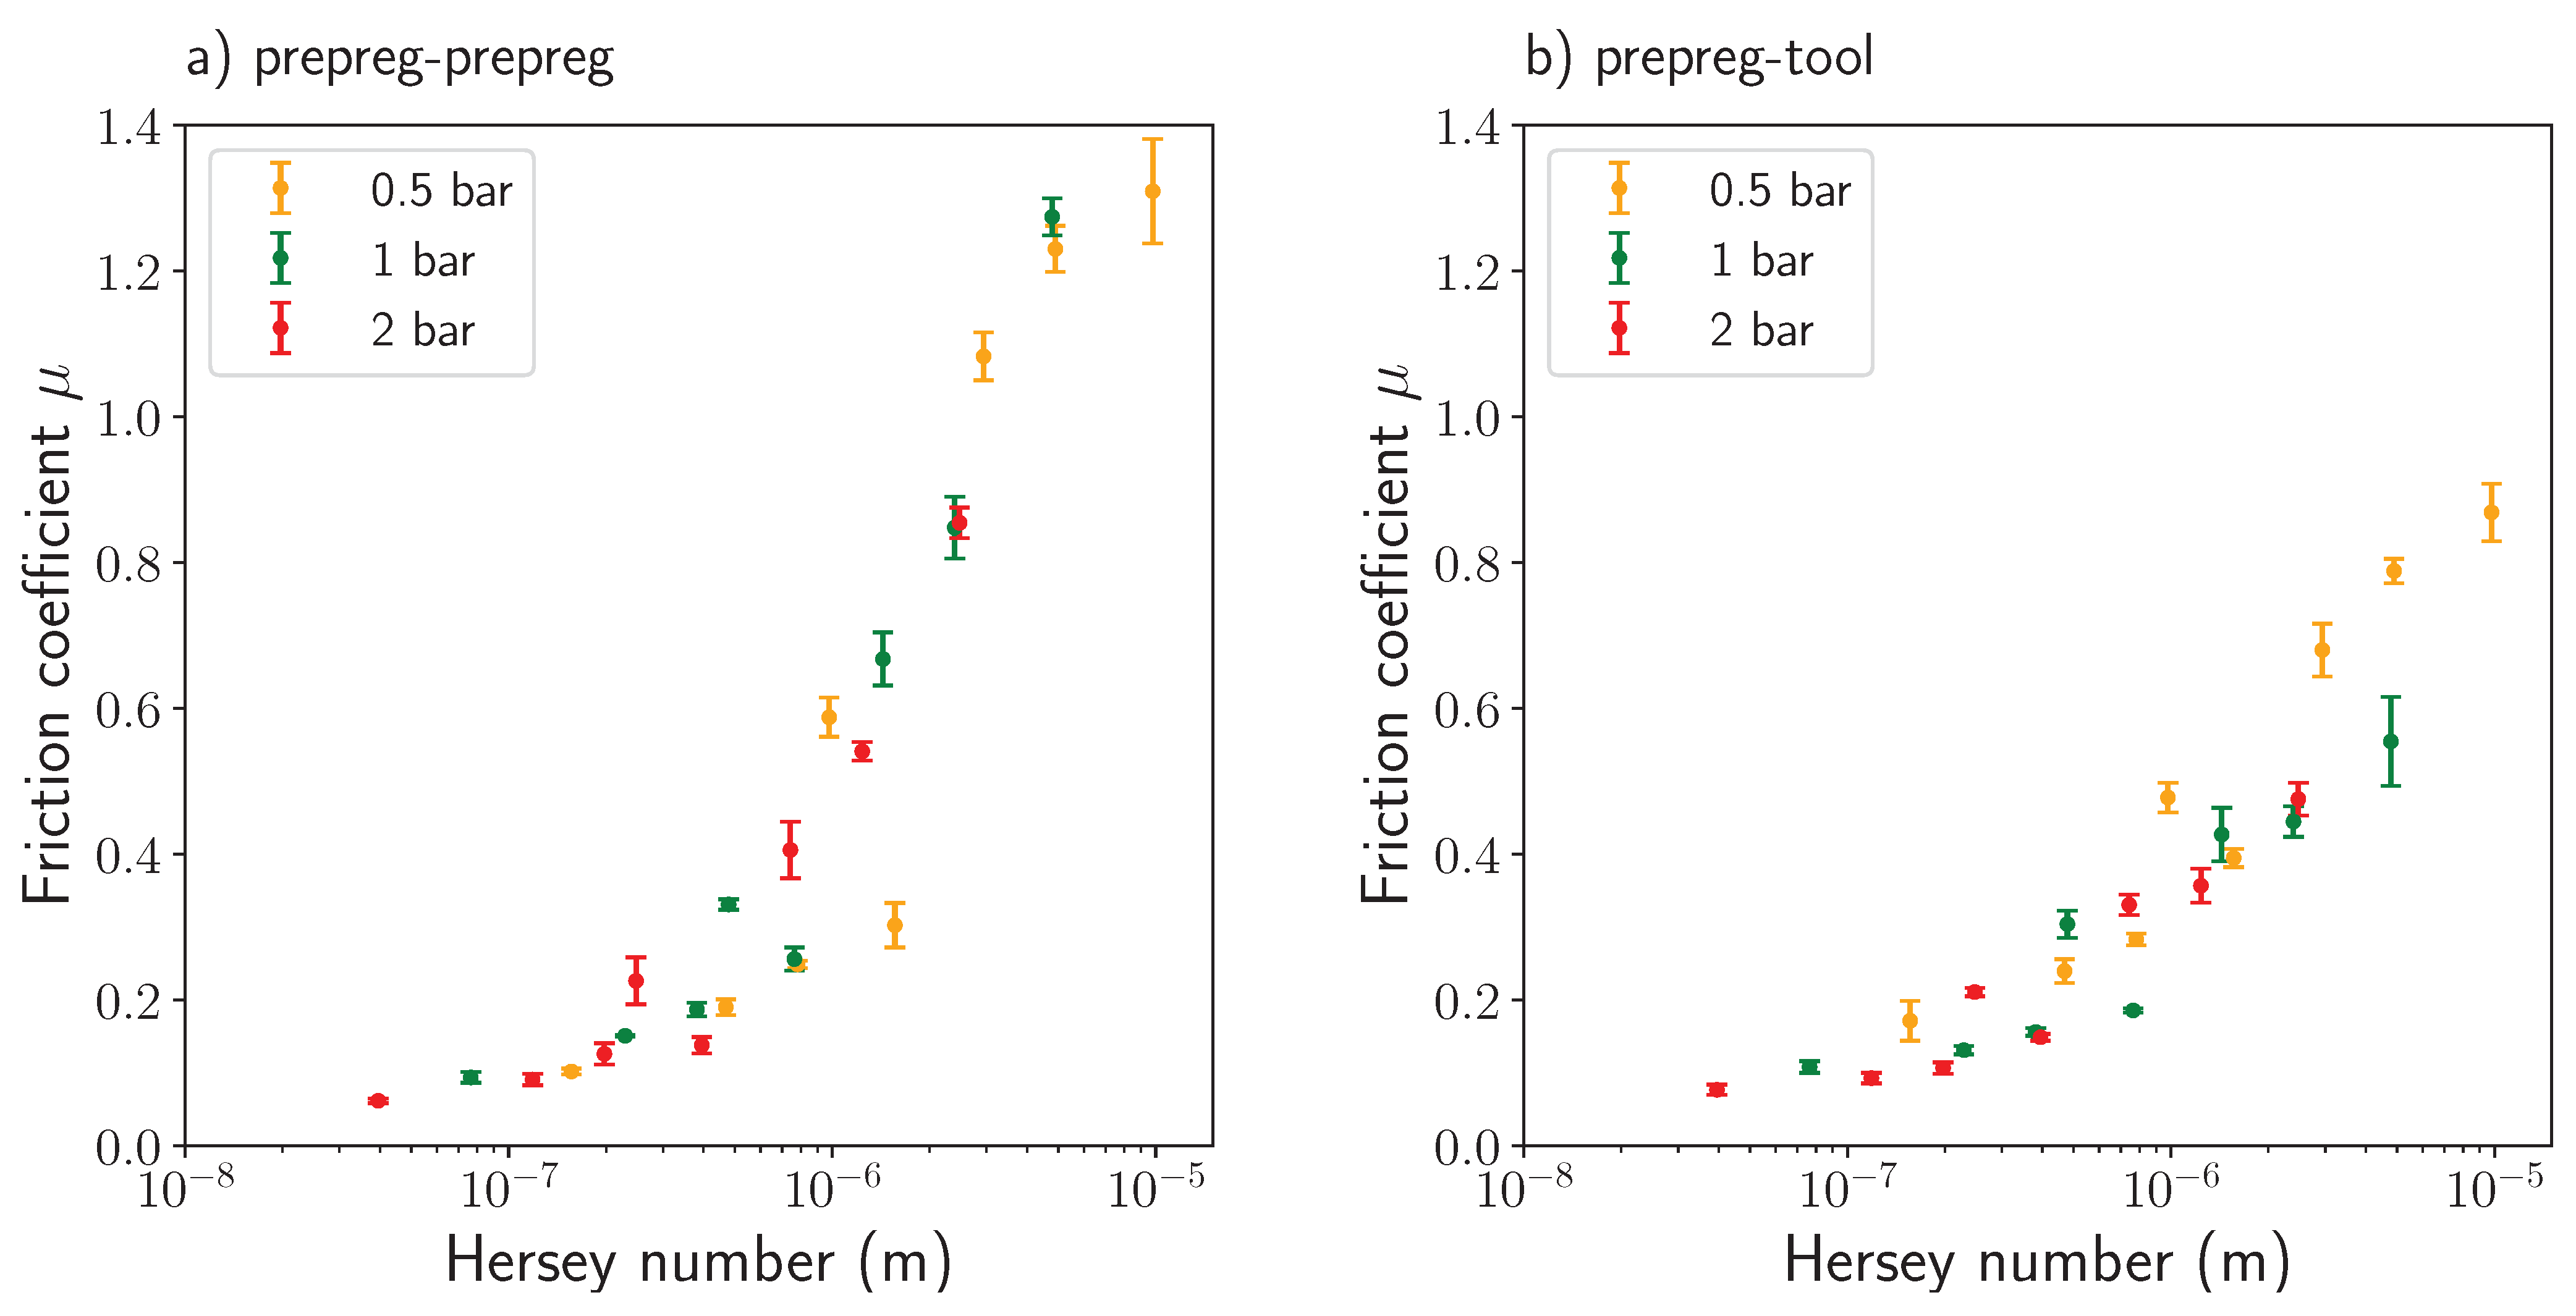
where the coefficients of the fitting are B = 2.06× 10 10 Pa · s and C = 7.94× 10 4 J/mol, see Figure 1d. Figure 4 summarises the results of the friction coefficient dependence with the Hersey number obtained for all the frictional tests performed for the prepreg-prepreg and prepreg-tool contact. The minimum friction coefficient measured ( 0.06± 0.003 for prepreg-prepreg and 0.07± 0.007 for prepreg-tool contact, respectively) was obtained for tests carried out at the maximum temperature (minimum viscosity), the maximum pressure (2 bars) and the minimum sliding speed (1 mm/min). Similarly, the maximum coefficient recorded corresponded to minimum temperature tests with the lowest pressure and maximum displacement rate ( 1.31± 0.07 and 0.86± 0.04 ). In both cases, the Hersey number variation ranged two orders of magnitude Δ H 5 · 10 7 5 · 10 5 m.

Surface Examination

Once the friction tests were completed, some samples were submitted for diverse analysis. Firstly, using the KLA Tencor D-500 profilometer, the surface roughness profile was obtained. No less than five measurements were made parallel to the fibre direction in different regions of the sample. A certain amount of friction samples suffered imperfections after the friction events, i.e., ply undulations, ply ruptures, and fibre breakage, limiting the performance of the profilometer and leaving some regions unexplored. Only specimens tested at 40 °C and 60 °C at a sliding speed of 1 mm/min and clamping pressure of 0.5 bar were used for the roughness measurements since they showed better surface integrity.
The R a roughness was obtained as the average value of the profile height deviations from the mean line of the surface geometry. No significant differences between contact types and testing conditions were measured for the R a roughness. Table 2 shows the average value for all the specimens considered where the similarity of the values suggests the existence of a lubrication film smoothing the surface asperities and influencing the calculated roughness. These measurements assumed a roughness value of 3.5 μm as a representative value for forward formulations.
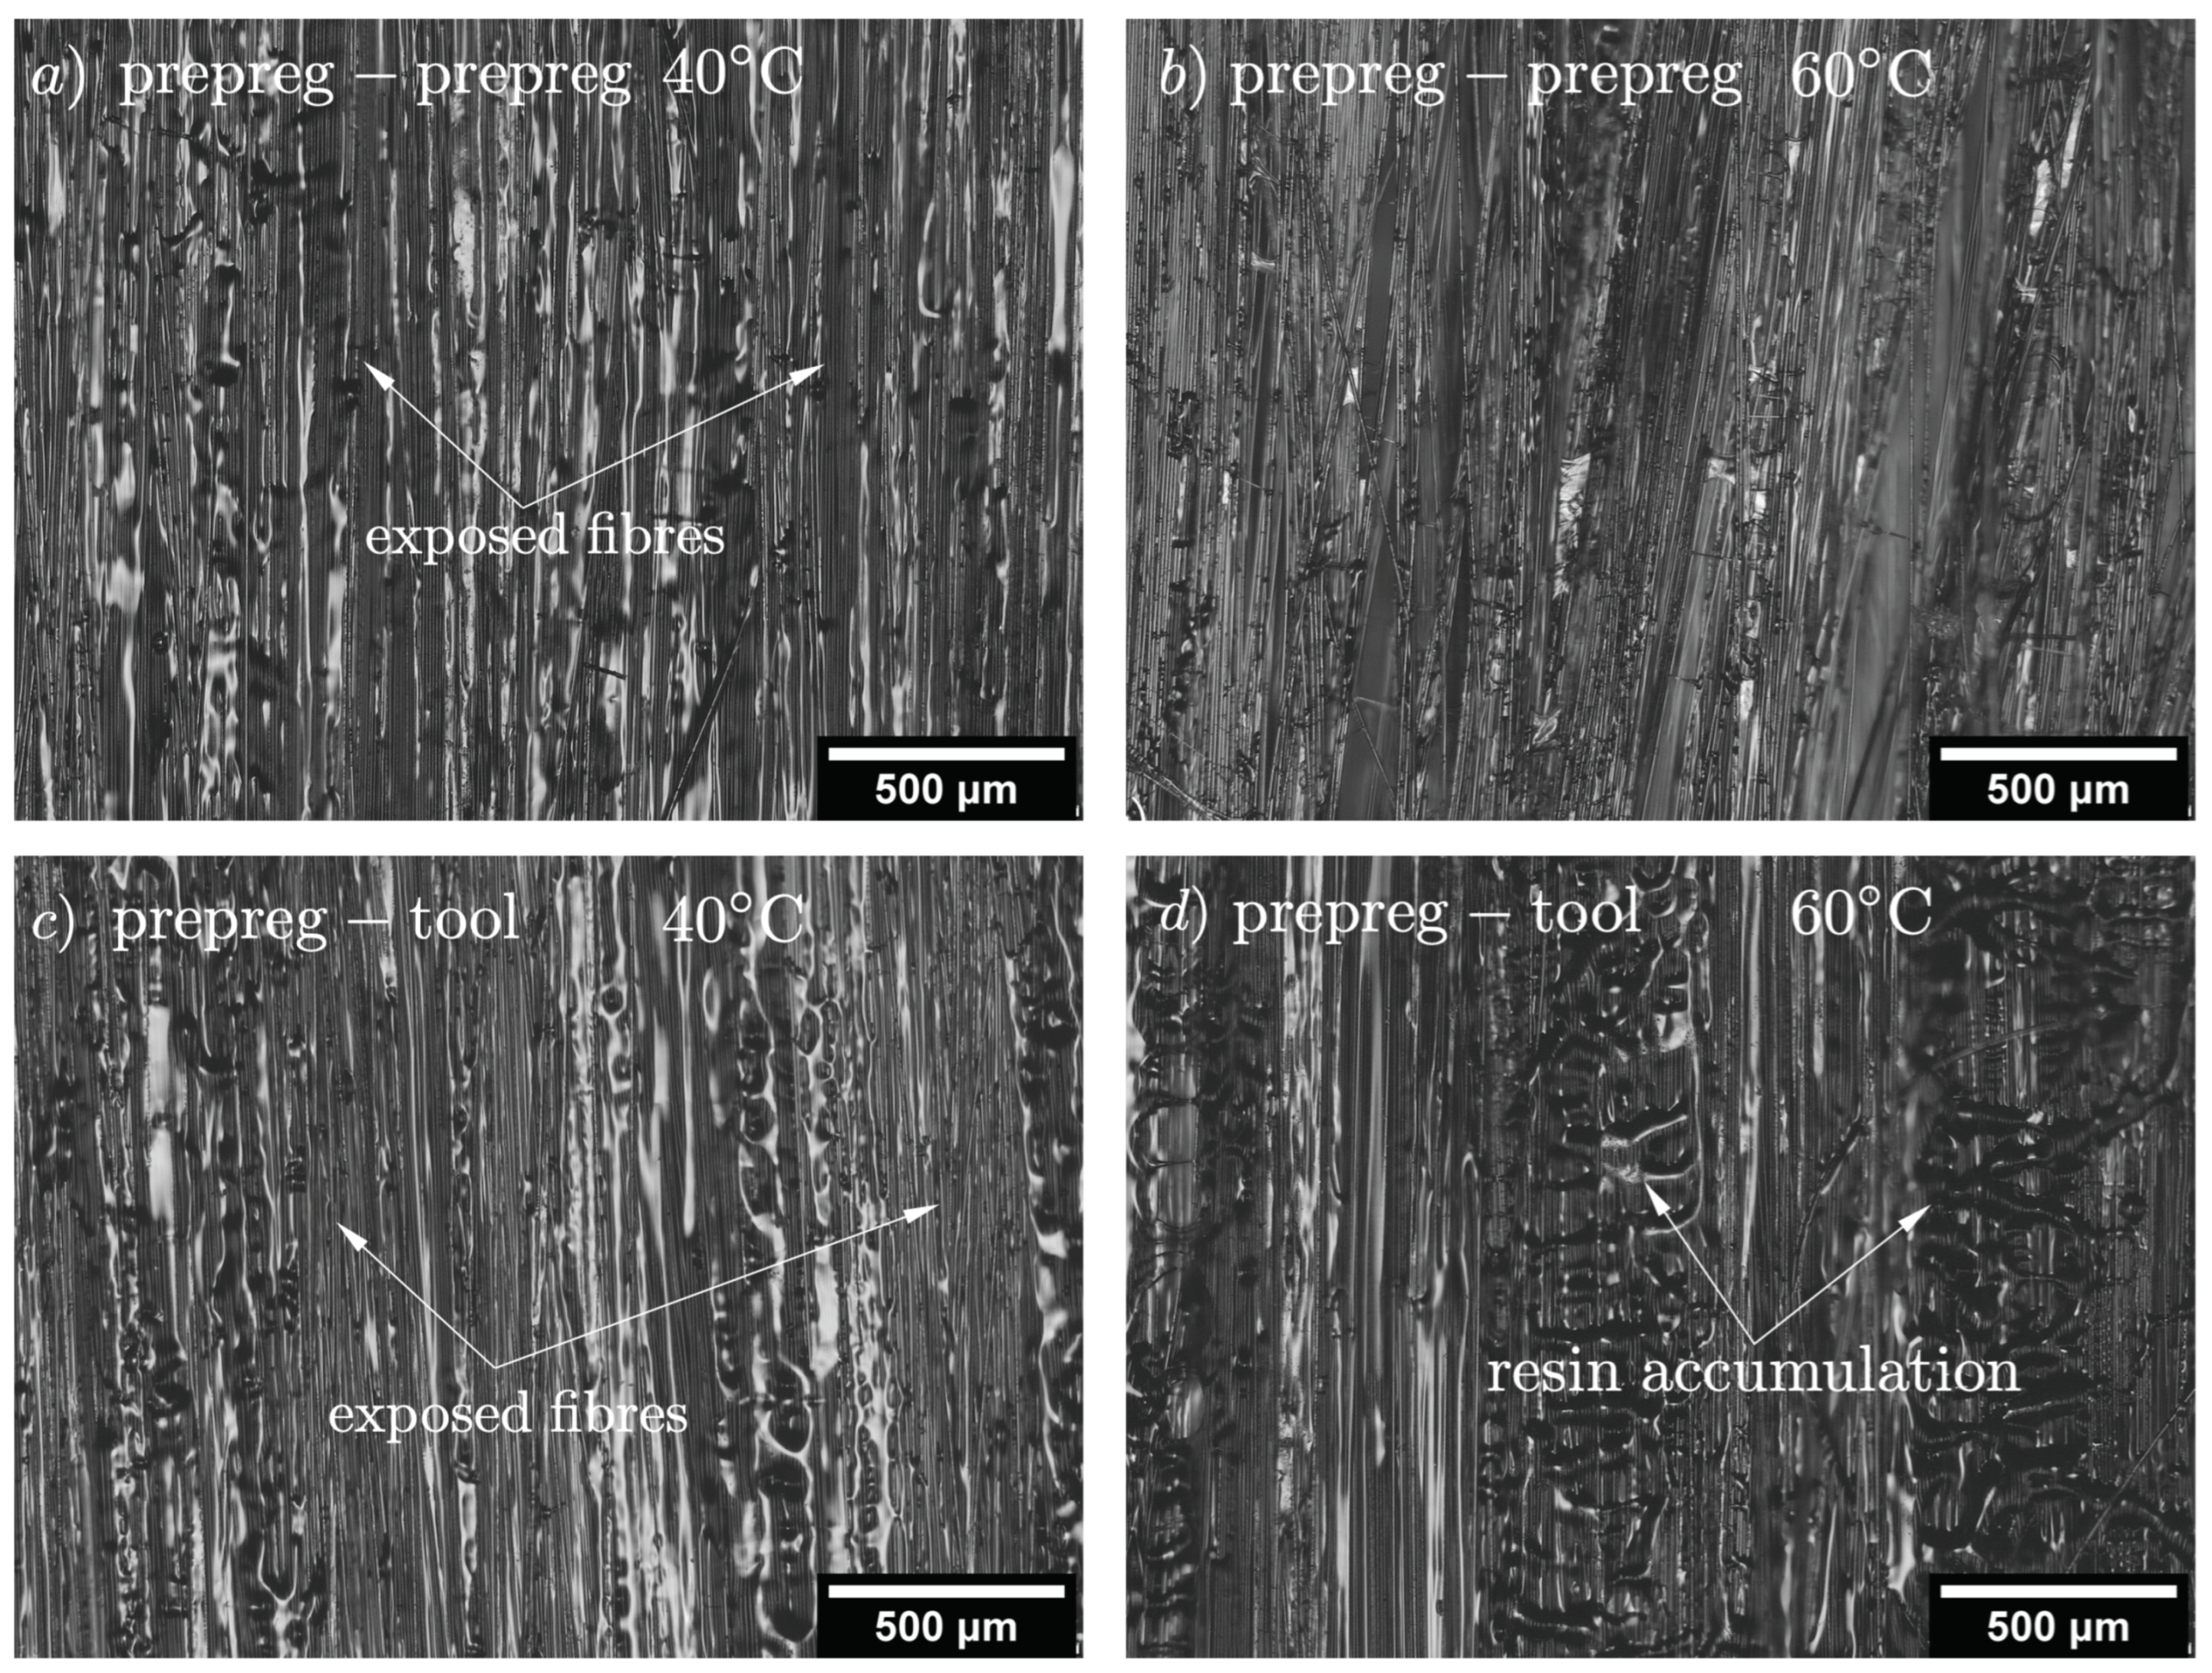
Optical micrographs (Olympus BX51) were used to visualise the surface alteration after the friction. The analysis revealed resin-rich regions distributed while others appear uncovered with the fibres directly exposed (Figure 5). When observing the resin accumulation regions, a pattern of resin waves along the fibre direction can be identified by the naked eye in many surface regions, showing uneven distribution. Due to the inability to comprehensively measure and explore the rough surface morphology, a representative wavelength value of 64 μm was selected from the regions where it was possible to measure.
Furthermore, a deeper study was conducted through Scanning Electron Microscopy (SEM Apreo 2S LoVac) and X-ray computed tomography XCT. [ 0 ° ] 8 prepreg laminates were prepared to resemble the state of the specimen at specific pressure and temperature combinations. Metallic plates, with an equivalent weight corresponding to a pressure of 0.5, 1, and 2 bars, were placed over the surface of the square rectangles. The coupons were introduced inside an environmental chamber at 40 °C and 60 °C for four entire days. This soft curing of the specimens was meant for freezing the material microstructure, including the lubrication film. Such conditions were only approximations of the actual situation of the prepreg contact surfaces during a real test. XCT images were acquired using a General Electric (former Phoenix) Nanotom 160 kV tomograph with a Hamamatsu 7942-25SK (2K × 2K) detector and a nano focus X-ray tube with a molybdenum target. The target was installed during the scans, in nano focus mode 1, without adding any additional filter. The voltage and current of the X-ray tube for acquisition were set to 60 kV and 200 μA, respectively. Around 1800 radiographs were obtained for a complete 360° rotation in each tomographic inspection. The exposure time was set at 500 ms, taking nine images to make each radiography and lasting ≈2.5 h for each tomogram acquisition. Due to the relative position between the sample and the detector, a pixel size of 1.5 μm/pixel was achieved. The XCT scans were reconstructed using Phoenix datos|X 2.0 reconstruction v2.2.1 software by General Electric Sensing & Inspection Technologies and manipulated with ImageJ [45]. A cross-sectional view of the XCT reconstruction is presented in Figure 6a.
The film layer separation between two adjacent prepreg plies was clearly detected in the XCT images. The semi-preg fibre bundles within the different layers are observed as dark grey regions in the XCT and were indicative of the prepreg laminate’s consolidation level when using the pressure-temperature cycle. The interlayer resin film can also be observed in the XCT reconstruction with a reasonably homogeneous thickness with an intricated geometry attributed to the fibre and fibre bundle rugosity. However, the resolution level obtained with the XCT was judged not enough for quantitative calculations, so SEM micrographs were used for this purpose. The interlayer thickness can be drastically reduced in poor resin regions with fibres close to each other. A representative cross-section acquired with the SEM is presented in Figure 6b. The thickness of the interlayer region was measured in a set of positions along the fibre direction, and the mean values and standard deviations are gathered in Figure 6c. The results showed an averaged interlaminar resin film of ≈12 μm. Regions with less or more resin accumulations were used in the measurement to enhance representativeness. The effect of the pressure on the interlaminar film thickness was negligible at room temperature. However, it was more evident as the temperature increased with the viscosity reduction, probably indicating light resin bleeding during testing operations.

4. Modelling

Lubrication Theory

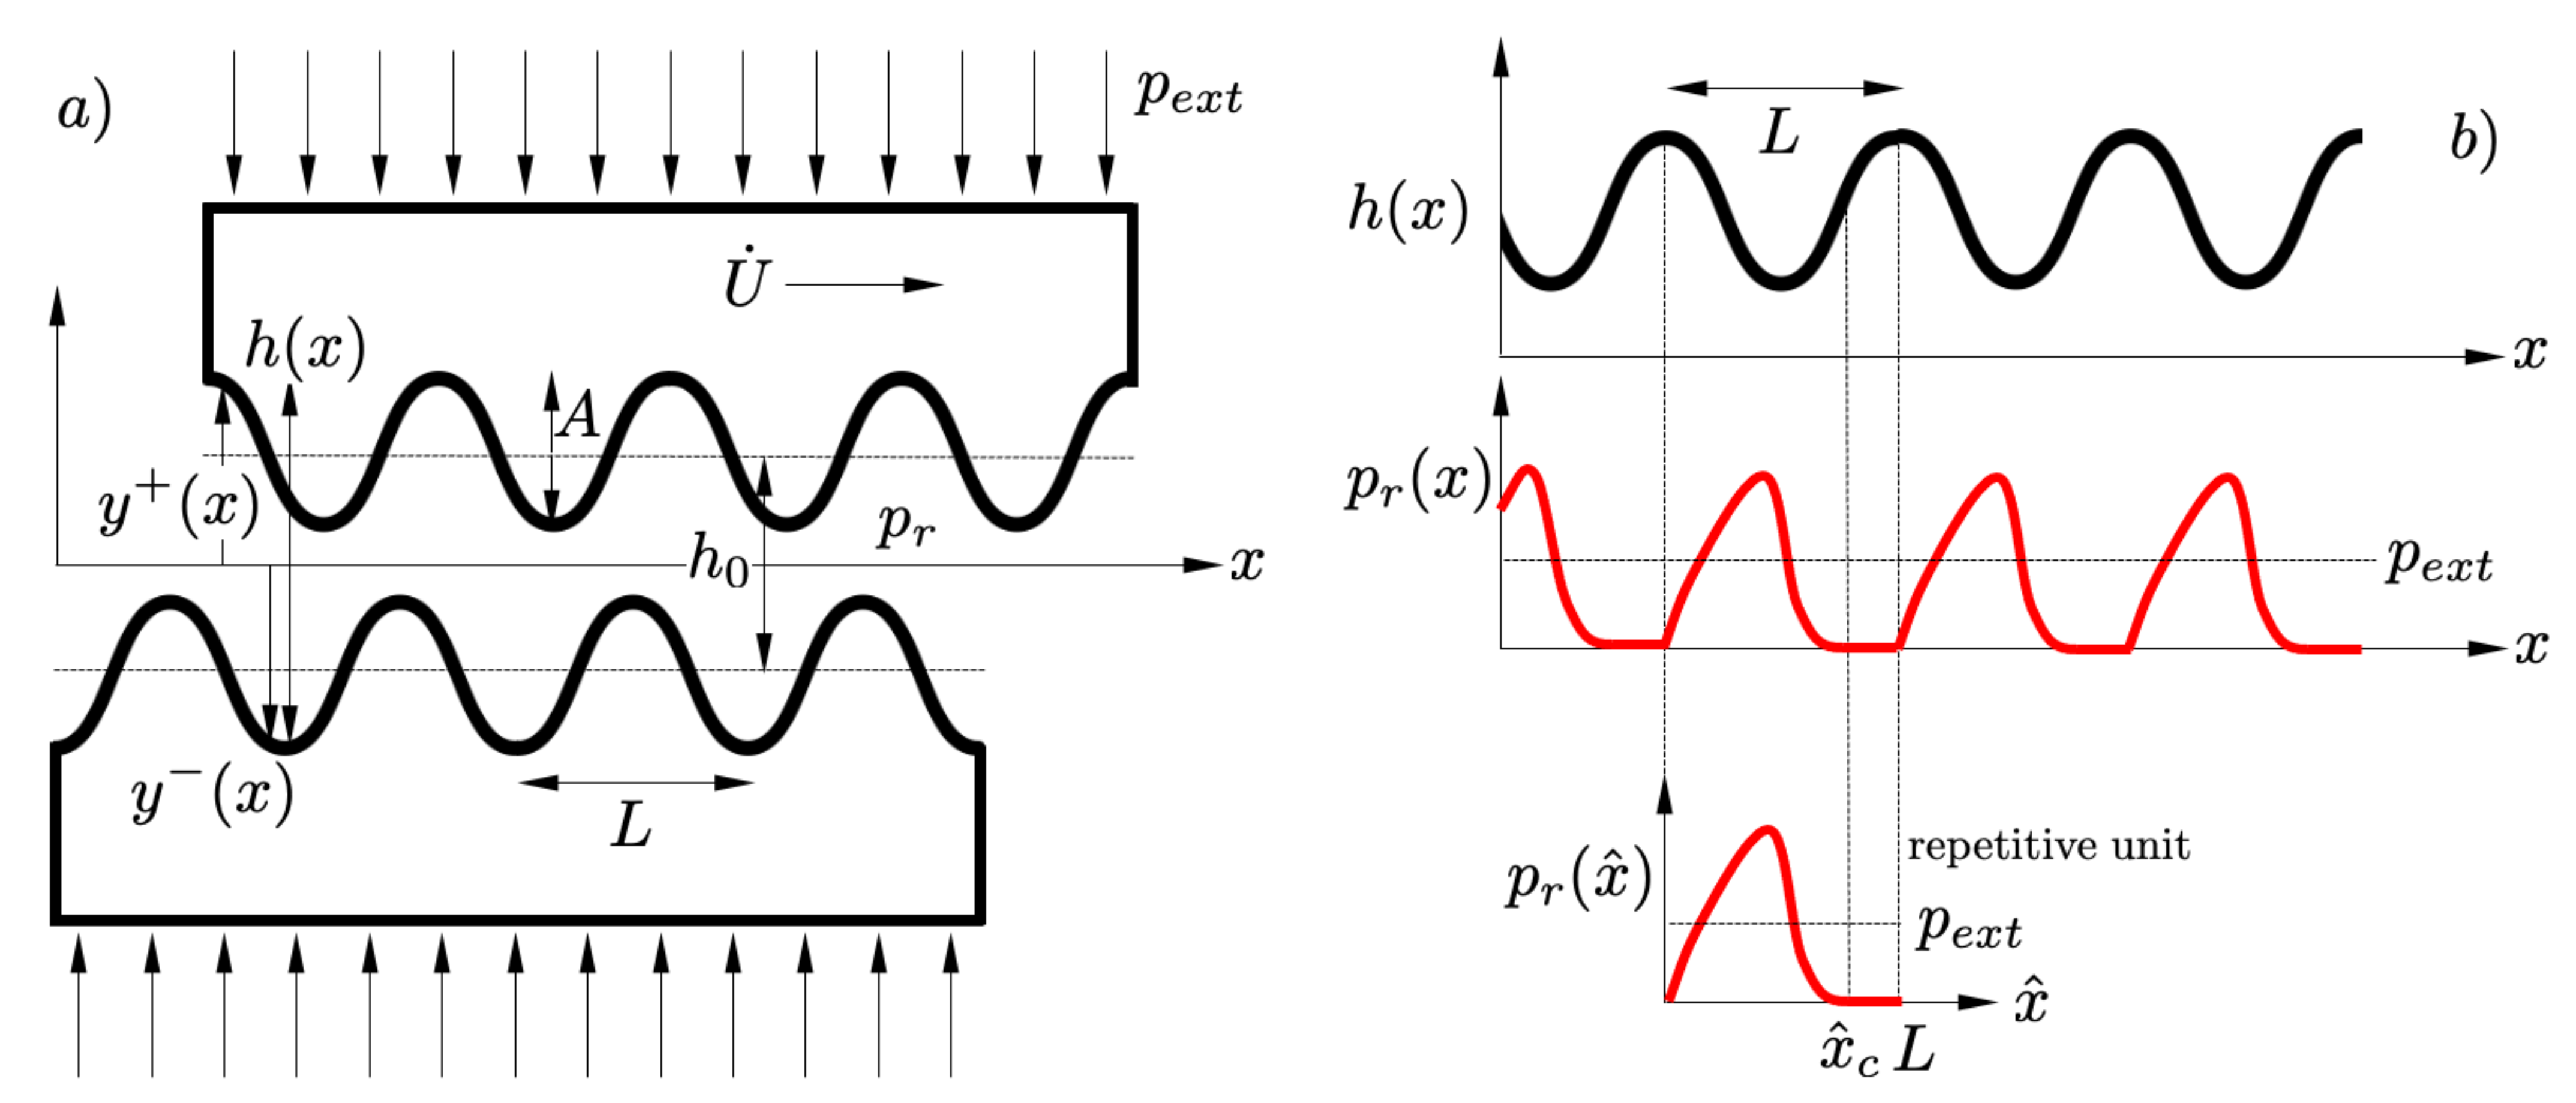
The friction process in the range of the experimental data was modelled using the lubrication theory [46]. The geometry of the rough surface of the prepreg ply was modelled as a sinusoidal function [47], as sketched in Figure 7 where:
y + ( x ) = h 0 2 + A cos ( 2 π x L )
y ( x ) = h 0 2 A cos ( 2 π x L + δ )
In this expression, A stands for the wave amplitude, L is its wavelength, and h 0 / 2 is half of the total average thickness of the resin layer. The fibre direction is aligned with the x axis in Figure 7a. The roughness measurement estimated the amplitude A of the rough surface, while the optical images were used to characterise the roughness wavelength L. The same amplitude and wavelength were used for all the calculations irrespective of the testing conditions (temperature, velocity and pressure). In the case of prepreg-prepreg contact, it can be assumed that both waves are equal but delayed with a phase angle δ [ 0 , 2 π ] . Therefore, the thickness of the resin layer can be calculated by subtracting y + ( x ) y ( x ) as
h ( x ) = h 0 + 2 A 0 cos δ cos ( 2 π x L + δ )
Assuming that the upper part of the model slides respecting the lower at a rate given by U ˙ , the resin pressure inside the layer is developed according to the Reynolds theory. Without loss of generality, the resin pressure distribution p r in the sliding length can be studied by analysing a repeating unit in the domain x ^ [ 0 , L ] , see Figure 7b.
Under these assumptions, the pressure distribution p r ( x ^ ) is governed by the one-dimensional Reynolds equation according to
x ^ ( h 3 η p r x ^ ) = 6 U ˙ h x ^
This differential equation is solved with two zero pressure boundary conditions at the edges p r ( x ^ = 0 ) = p r ( x ^ = x c ) = 0 . The point x ^ = x c is also known as the cavitation point at which the gradient of pressure becomes null; therefore, its spatial derivative is p r / x ^ = 0 .
The total averaged external pressure acting on the resin can be computed by integration of the pressure distribution over the domain p ¯ r = 0 L p r ( x ^ ) d x ^ and due to equilibrium conditions it should be equal to the applied external pressure p ¯ r = p e x t . Given the applied external pressure p e x t , the Reynolds equation’s solution is obtained using a finite difference scheme. The details of the discretisation of the Reynolds equation can be found in Appendix A. The model calculations start by assuming the cavity thickness h 0 , the wave amplitude and length A and L as inputs. For the given thickness h 0 , the cavitation point x ^ c is first determined iteratively by solving the Reynolds equation until the condition p r / x ^ = 0 is satisfied. The resin pressure field p r ( x ^ ) is calculated, and the averaged value is assumed as the external pressure applied p e x t . Afterwards, the shear stress distribution τ r ( x ^ ) is determined according to
τ r ( x ^ ) = η U ˙ h + h 2 p r x ^
being the averaged value τ ¯ r the results of its integration over the domain as τ ¯ r = 0 L τ r ( x ^ ) d x ^ . Lastly, the friction coefficient is determined as μ = τ ¯ r / p ¯ r as a function of the applied pressure, velocity and viscosity. The model outputs are summarised in terms of a curve with the dependence of the friction coefficient on the Hersey number as μ = μ ( H ) = μ ( η U ˙ / p ) . The model can also be applied for prepreg-tool contact by simply decreasing the amplitude in Equation (6) to half of the current prepreg-prepreg value, although the model’s sensitivity in this range is not remarkable.

5. Discussion

According to the formulation described in the previous section, the model inputs necessary were the wavelength L and the surface roughness or wave amplitude A. The first variable is estimated from a distance between the accumulated resin peaks observed on the prepreg surface after friction and the second value from the mean amplitude corresponding to the rough surface geometry. The respective values were set from the profilometry analysis and the optical microscope examinations (Table 2) to L ≈ 64 μm and A ≈ 3.5 μm. For the case of Ply-Tool, it was considered that the rough surfaces involved in the friction mechanism were the same as the other case since the experimental analyses presented similar outcomes. The range of resin layer thickness was h0 = [3–15 μm], covering the experimental values measured from the consolidated coupons presented in Figure 6c.
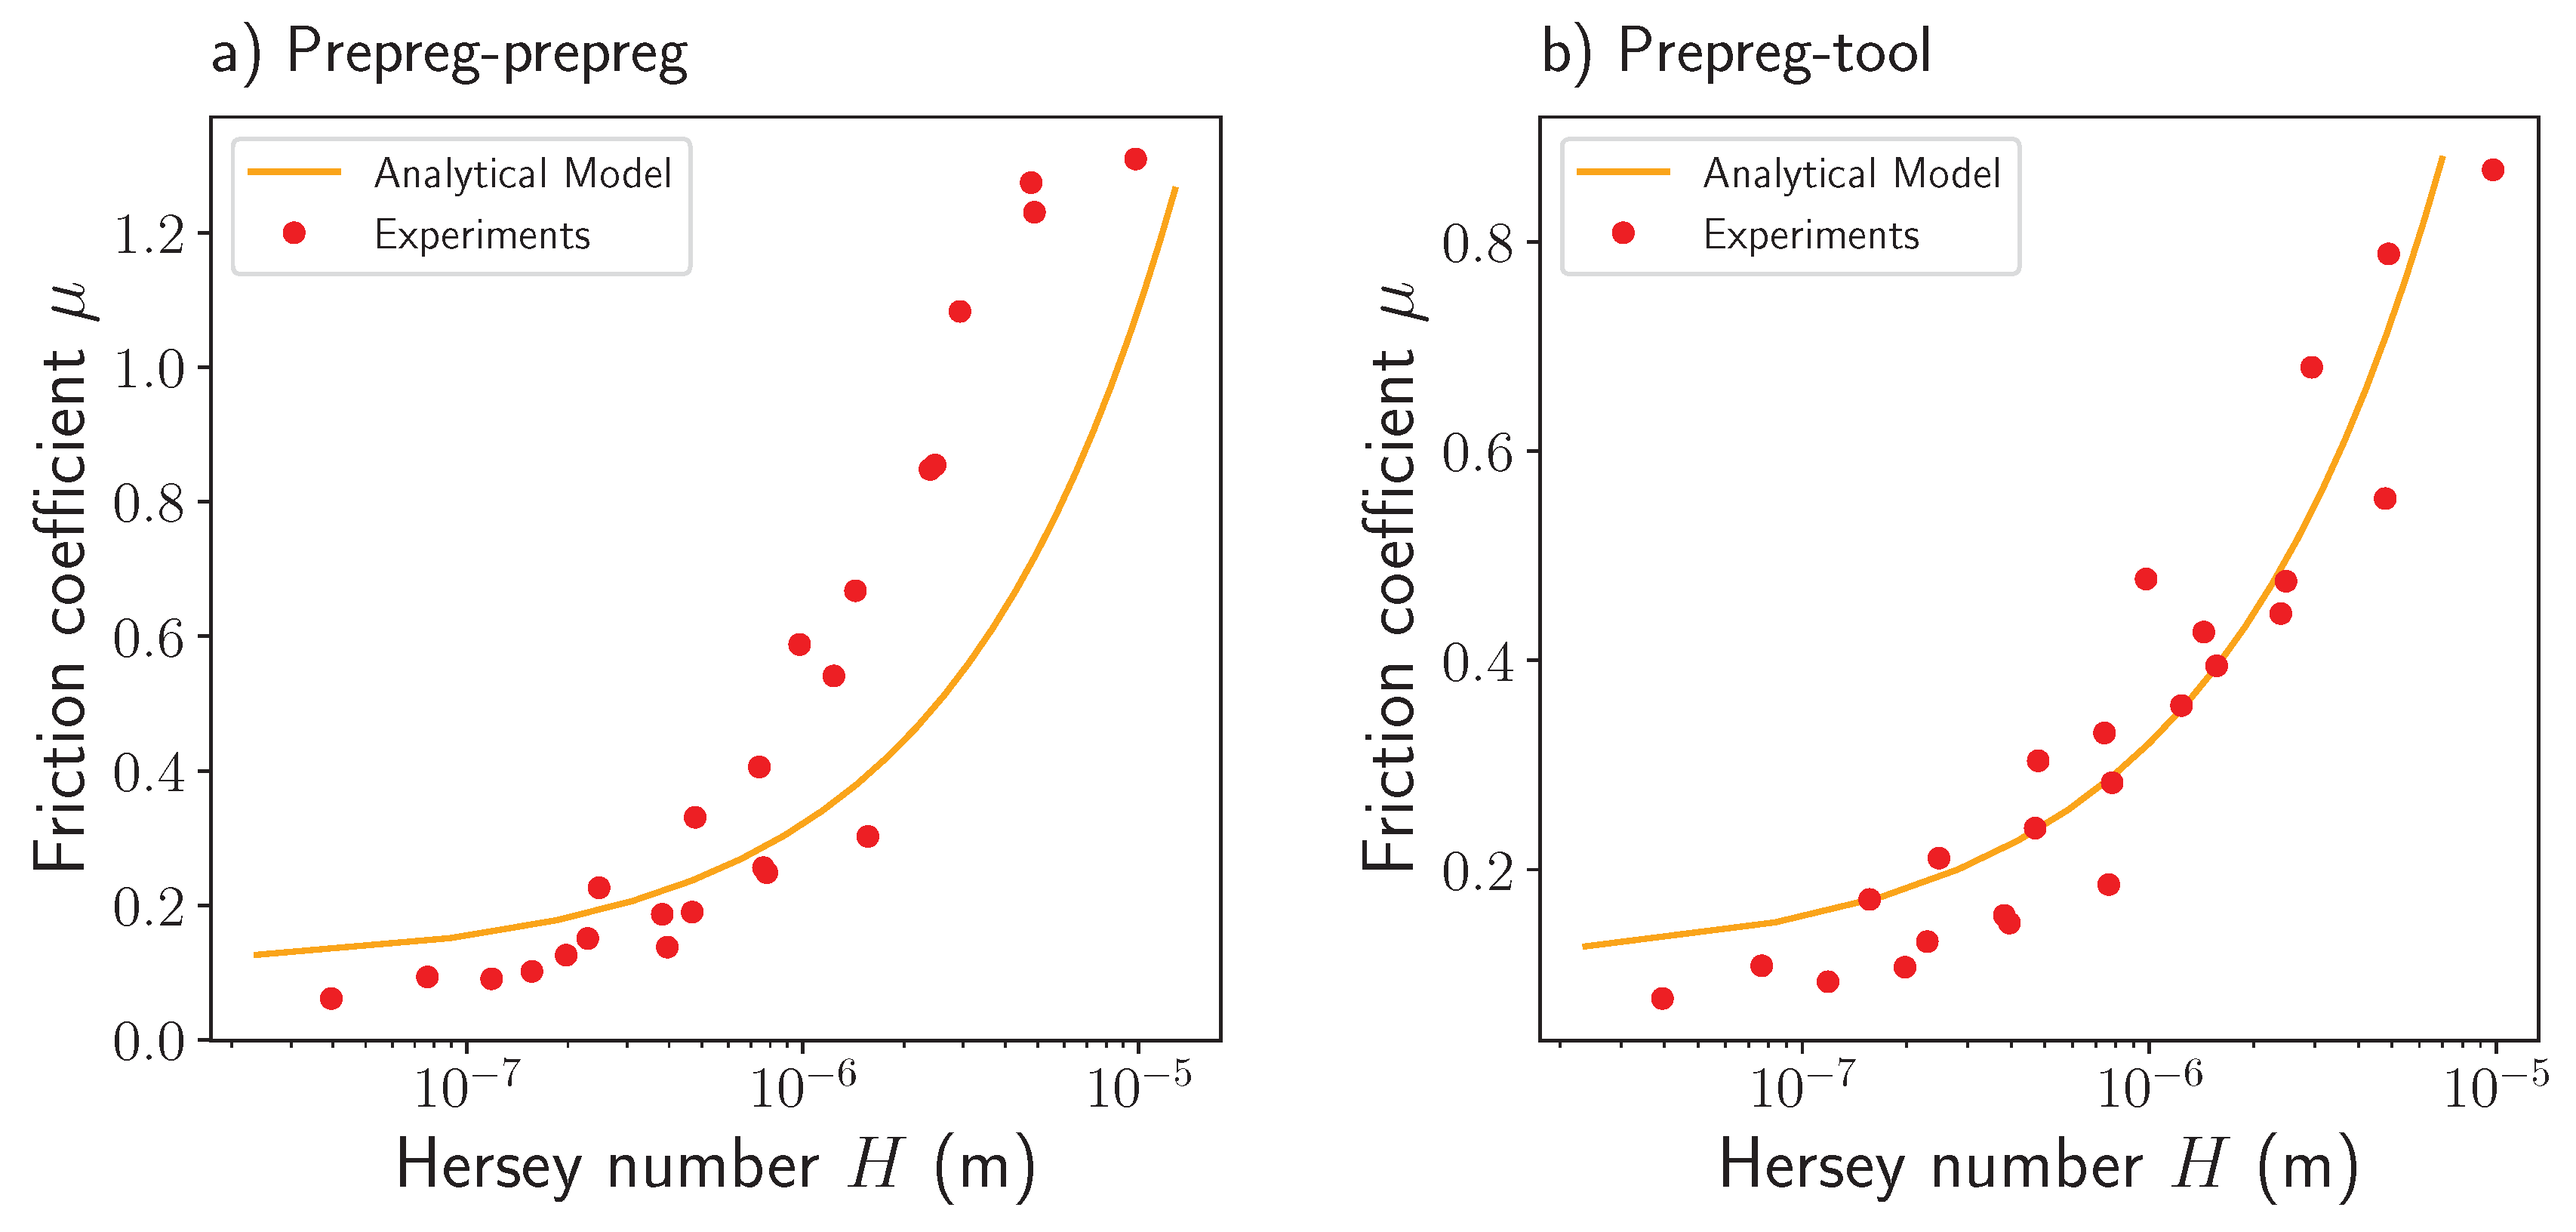
The predictions of the friction coefficient as a function of the Hersey number μ = μ ( H ) obtained using the baseline model parameters are presented in Figure 8a for prepreg-prepreg and Figure 8b prepreg-tool contacts. Each experimental case tested is represented by solid symbols, while the continuous line represents the analytical prediction with the Reynolds model. As shown, the model reasonably suits the experimental results for both cases with a slight discrepancy with the prepreg-prepreg contact case at high values of the Hersey number. The friction coefficients in this part of the curve correspond with the experiments carried out at 40 °C. At this temperature, the resin was less viscous and sliding can be interpreted as dry lubrication, producing an increase in the shear stress and, consequently, higher friction values [47,48]. This effect is not observed for the prepreg-tool case since the metal surface contains fewer asperities, allowing an easier slide and, therefore, lower friction value.
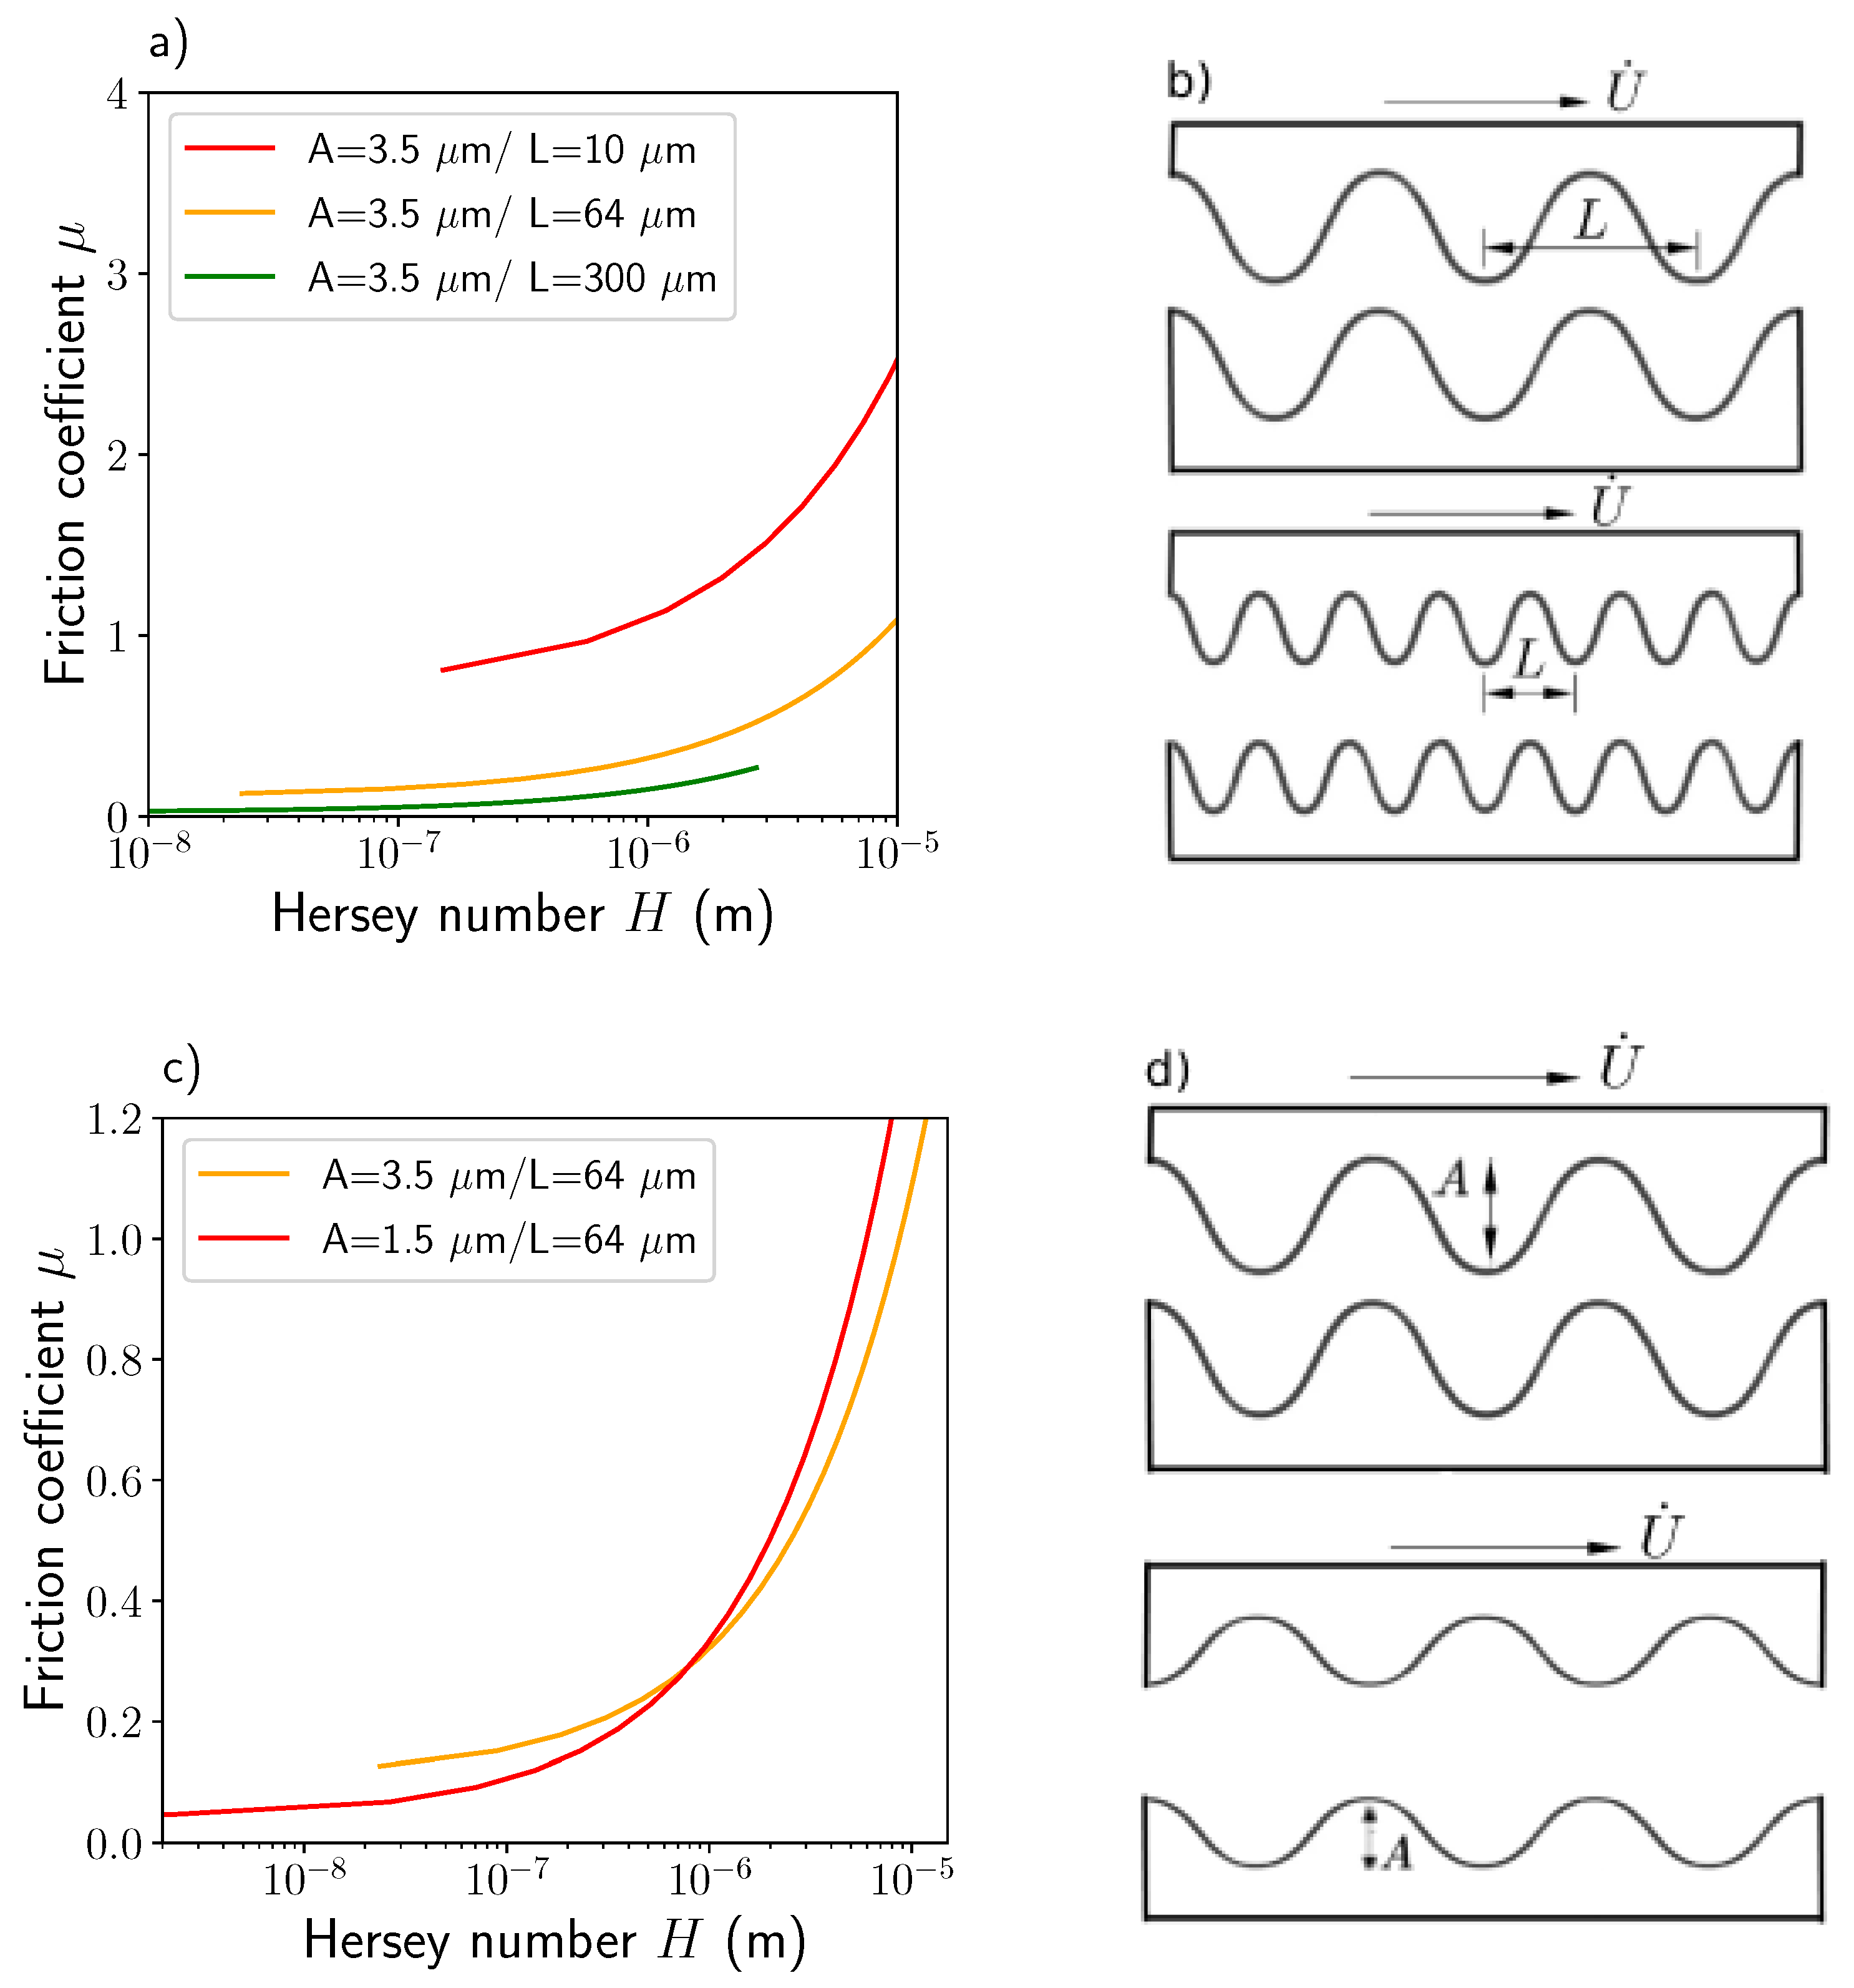
The model sensitivity to the input parameters was inspected by varying the values of wavelength L and roughness A. From Figure 9a can be concluded that a higher wavelength value L significantly reduce the friction coefficients. The resin build-up pressure p r due to the geometrical effects is less pronounced as L increases. The illustration presented in Figure 9b evidences this occurrence by representing the effect of having a high or low wavelength on the same rough surface. The presence of more resin accumulations (i.e., low wavelength value) restrains the slide between both surfaces. In comparison, fewer resin accumulations (i.e., high wavelength value) make the prepreg surface easier to pull out. On the other side, by changing the roughness value A, the curve tends to change the friction slope against the Hersey number. However, by exploring the scatter values observed in the roughness A (see Table 2), no significant variation was observed, see Figure 9c and the corresponding representative illustration Figure 9d.
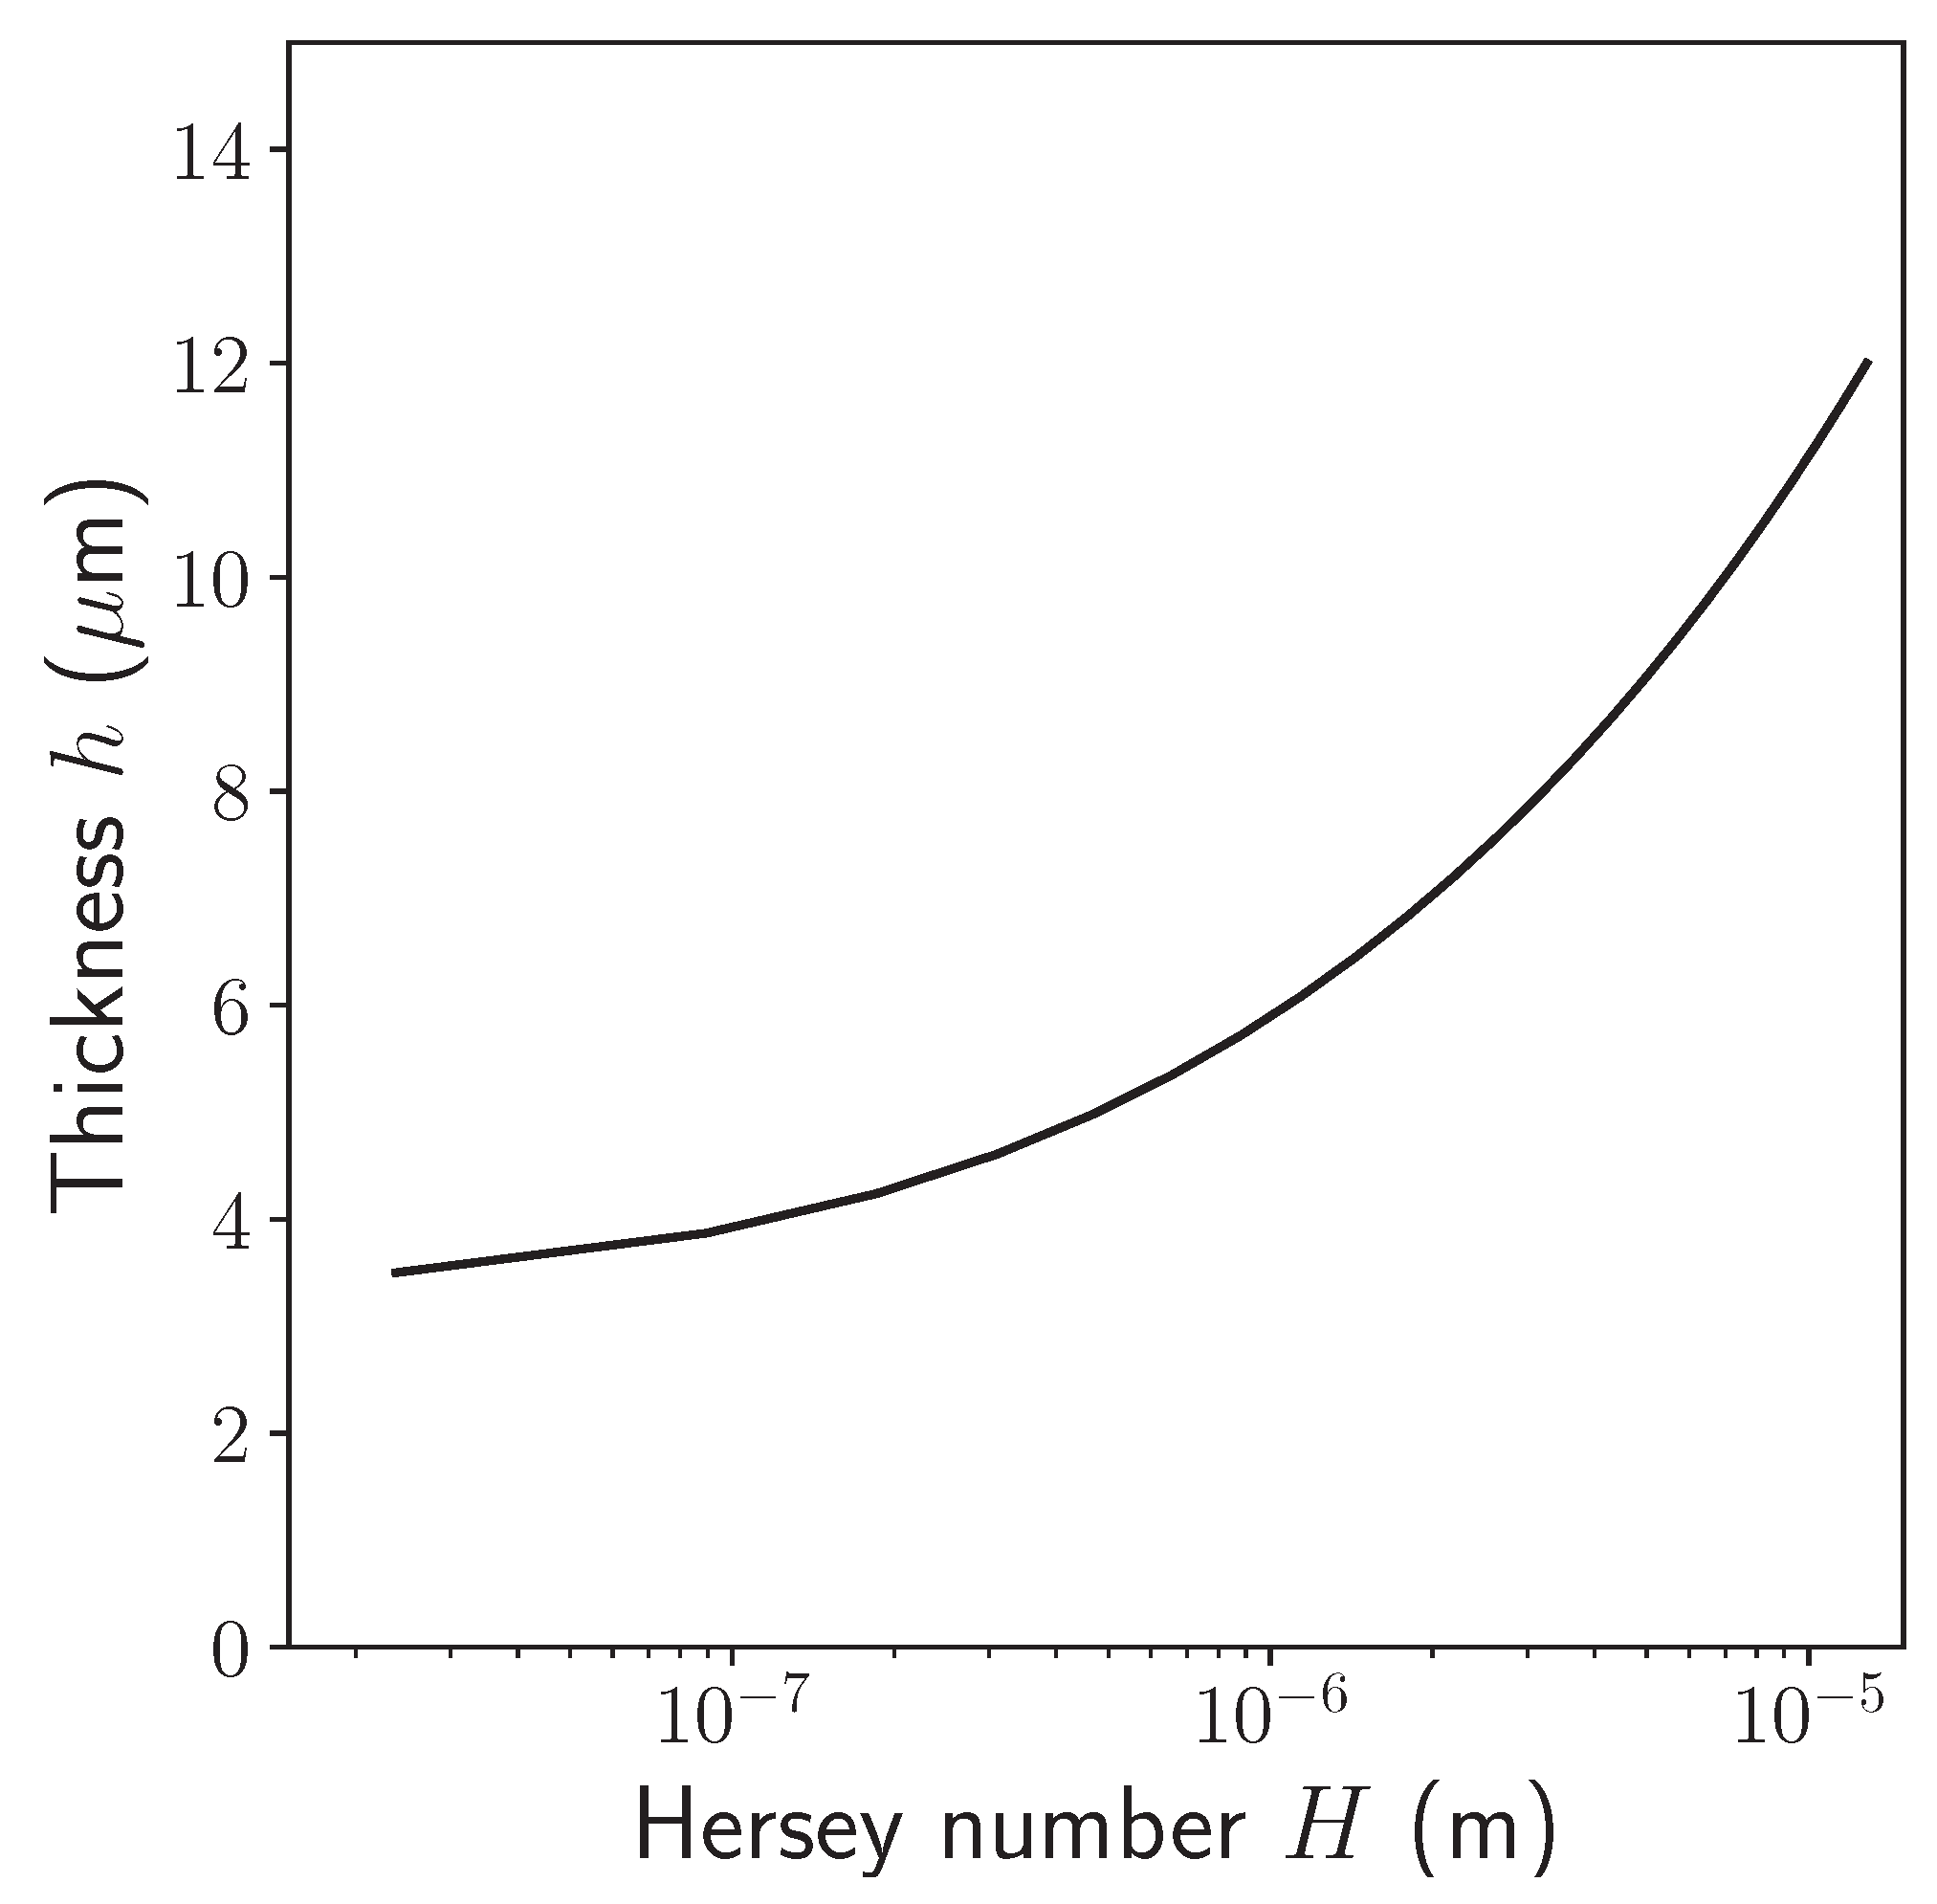
In addition to the analytical model’s estimation of friction coefficients and Hersey numbers, a range of resin layer thicknesses associated with a Hersey number is obtained as an auxiliary outcome of the model. The results are presented in Figure 10. This output can be employed to obtain the value of the parameters governing the phenomenon, i.e., the expected thickness of the equivalent sliding layer if the Hersey number is estimated.

6. Conclusions

The present work aimed to build a tool to predict friction coefficients for UD prepreg composite interactions between prepreg plies and between the prepreg ply and the tool. New measurements were performed employing pull-out tests for both cases considering actual process conditions resembling a fresh-prepreg thermoforming manufacturing process. After friction, several surface analyses and measurements were performed to relate the surface geometry to the friction response. X-ray computational tomography, profilometry, and optical and scanning electron microscopy supported the prepreg surface examination leading to a better understanding of the physical occurrences after a friction event. The analytical models employed are based on the lubrication theory and the Reynolds equation assisted by the Stribeck curve representation of friction regimes. The main conclusions of the work can be summarised as follow:
  • For a sort of temperatures, pressures, and velocities, a set of friction coefficients were obtained for uncured AS4/8552 UD prepreg composite. The friction mechanism observed was in accordance with the theoretical behaviour expected, e.g., by reducing viscosity with a temperature increment, low friction coefficients were measured. A better representation of these effects was built through a Stribeck curve which also helped to identify our friction case study within the hydrodynamic lubrication regime.
  • The prepreg surface examination after friction revealed geometrical characteristics like resin accumulations, exposed fibres and surface roughness which were quantified to contemplate the use of the lubrication theory. After applying microscopical techniques, we conclude that the resin layer between two prepreg plies acts as a lubrication layer. Therefore, the lubrication theory is reasonable for the phenomena explanation. The influence of this lubrication layer was taken into account in the model by quantifying its distribution and accumulation in terms of an equivalent sinusoidal shape with a given wavelength and roughness.
  • An analytical model was conceived with a basis on the lubrication theory and the Reynolds equation. The inputs of this model are the wavelength and amplitude of the resin accumulations detected on the prepreg surface. The model results showed that a good characterisation of the rough surface geometry of the prepregs allows the calculation of reliable friction coefficients through the formulation mentioned above. When comparing the model and experimental results, a slight divergence is observed in the prepreg-prepreg contact at 40 °C. The divergence at this temperature was understood as the effect of dry lubrication due to a dominant solid-to-fluid response of the resin. This divergence was not observed in the ply-tool case since the metal surface presents fewer asperities allowing a more smooth slide between the surfaces.
The findings of this work can provide a helpful tool to determine friction coefficients for various prepreg composite materials employed under different temperatures, velocities and clamping pressure conditions. A contribution to a better understanding of the frictional behaviour is given, expecting to support problem solutions in different manufacturing processes where this phenomenon is present and to participate in the search for more effective composite part production.

Author Contributions

Conceptualization, D.A., D.M. and C.G.; methodology, C.G. and D.G.G.; formal analysis, C.G., D.G.G. and D.M.; investigation, D.A. and D.M.; data curation, D.A.; writing—original draft preparation, D.A.; writing—review and editing, D.M., C.G., D.G.G. and B.L.-R.; supervision, C.G.; project administration, C.G.; funding acquisition, C.G. and B.L.-R. All authors have read and agreed to the published version of the manuscript.

Funding

The research leading to the results presented in this paper received funding from the Regional Government of Madrid through the research and innovation Innovation Hubs 2018 through the TEMACOM project (49.520635.9.18).

Institutional Review Board Statement

Not applicable.

Informed Consent Statement

Not applicable.

Data Availability Statement

Not applicable.

Acknowledgments

The authors would like to thank Andre Ritter, Angel Leon and Alex de Bruin for their useful discussions and input throughout the work and the anonymous reviewers for their comments that helped us improve the paper.

Conflicts of Interest

The authors declare no conflict of interest.

Correction Statement

This article has been republished with a minor correction to the existing affiliation information. This change does not affect the scientific content of the article.

Appendix A

The Reynolds equation is solved employing finite differences by discretising the x ^ domain between [ 0 , L ] with n divisions.
x ^ ( h 3 η p r x ^ ) = 6 U ˙ f ( x )
where f ( x ) = h x ^ is the analytical derivative of the cavity thickness function. The first and second derivatives of the equation were discretised using central differences leading to the following 3-point stencil
( 1 Δ x 2 + 3 f i 2 Δ x h i ) p i + 1 2 Δ x 2 p i + ( 1 Δ x 2 3 f i 2 Δ x h i ) p i 1 = 6 η U ˙ f i h i 3
The resulting linear equation system is constrained with the resin pressure at boundaries p r ( x ^ = 0 ) and p r ( x ^ c ) = 0 . The selection of x c is achieved iteratively until the additional cavitation condition is fulfilled p r ( x ^ c ) / x ^ = 0 . Pressure and shear stress for x ^ > x ^ c were assumed to be zero. Once x c is found, the thickness average cavity thickness h 0 is increased/decreased until the average pressure is equal to the external one. Then, the corresponding shear stress and the friction coefficient are computed for the given friction conditions (pressure, temperature and sliding velocity).

References

  1. González, C.; Vilatela, J.; Molina-Aldareguía, J.; Lopes, C.; LLorca, J. Structural composites for multifunctional applications: Current challenges and future trends. Prog. Mater. Sci. 2017, 89, 194–251. [Google Scholar] [CrossRef]
  2. Dhinakaran, V.; Surendar, K.; Riyaz, M.H.; Ravichandran, M. Review on study of thermosetting and thermoplastic materials in the automated fiber placement process. Mater. Today Proc. 2020, 27, 812–815. [Google Scholar] [CrossRef]
  3. Brasington, A.; Sacco, C.; Halbritter, J.; Wehbe, R.; Harik, R. Automated fiber placement: A review of history, current technologies, and future paths forward. Compos. Part C Open Access 2021, 6, 100182. [Google Scholar] [CrossRef]
  4. Boisse, P.; Colmars, J.; Hamila, N.; Naouar, N.; Steer, Q. Bending and wrinkling of composite fiber preforms and prepregs. A review and new developments in the draping simulations. Compos. Part B Eng. 2018, 141, 234–249. [Google Scholar] [CrossRef]
  5. Guzman-Maldonado, E.; Wang, P.; Hamila, N.; Boisse, P. Experimental and numerical analysis of wrinkling during forming of multi-layered textile composites. Compos. Struct. 2019, 208, 213–223. [Google Scholar] [CrossRef]
  6. Hsiao, H.M.; Daniel, I.M. Effect of fiber waviness on stiffness and strength reduction of unidirectional composites under compressive loading. Compos. Sci. Technol. 1996, 56, 581–593. [Google Scholar] [CrossRef]
  7. Garnich, M.R.; Karami, G. Finite element micromechanics for stiffness and strength of wavy fiber composites. J. Compos. Mater. 2004, 38, 273–292. [Google Scholar] [CrossRef]
  8. Potter, K.; Khan, B.; Wisnom, M.; Bell, T.; Stevens, J. Variability, fibre waviness and misalignment in the determination of the properties of composite materials and structures. Compos. Part A Appl. Sci. Manuf. 2008, 39, 1343–1354. [Google Scholar] [CrossRef]
  9. Bloom, L.D.; Wang, J.; Potter, K.D. Damage progression and defect sensitivity: An experimental study of representative wrinkles in tension. Compos. Part B Eng. 2013, 45, 449–458. [Google Scholar] [CrossRef]
  10. Karami, G.; Garnich, M. Effective moduli and failure considerations for composites with periodic fiber waviness. Compos. Struct. 2005, 67, 461–475. [Google Scholar] [CrossRef]
  11. Lightfoot, J.S.; Wisnom, M.R.; Potter, K. A new mechanism for the formation of ply wrinkles due to shear between plies. Compos. Part A Appl. Sci. Manuf. 2013, 49, 139–147. [Google Scholar] [CrossRef]
  12. Guzman-Maldonado, E.; Hamila, N.; Naouar, N.; Moulin, G.; Boisse, P. Simulation of thermoplastic prepreg thermoforming based on a visco-hyperelastic model and a thermal homogenization. Mater. Des. 2016, 93, 431–442. [Google Scholar] [CrossRef]
  13. Çinar, K.; Ersoy, N. Effect of fibre wrinkling to the spring-in behaviour of L-shaped composite materials. Compos. Part A Appl. Sci. Manuf. 2015, 69, 105–114. [Google Scholar] [CrossRef]
  14. Belnoue, J.P.; Nixon-Pearson, O.J.; Thompson, A.J.; Ivanov, D.S.; Potter, K.D.; Hallett, S.R. Consolidation-driven defect generation in thick composite parts. J. Manuf. Sci. Eng. Trans. ASME 2018, 140, 071006. [Google Scholar] [CrossRef]
  15. Rashidi, A.; Keegan, C.; Milani, A.S. Analysis of inter-ply friction in consolidation process of thermoset woven prepregs. AIP Conf. Proc. 2019, 2113, 1–7. [Google Scholar] [CrossRef]
  16. Sun, J.; Gu, Y.; Li, M.; Ma, X.; Zhang, Z. Effect of forming temperature on the quality of hot diaphragm formed C-shaped thermosetting composite laminates. J. Reinf. Plast. Compos. 2012, 31, 1074–1087. [Google Scholar] [CrossRef]
  17. Larberg, Y.; Åkermo, M. In-plane deformation of multi-layered unidirectional thermoset prepreg—Modelling and experimental verification. Compos. Part A Appl. Sci. Manuf. 2014, 56, 203–212. [Google Scholar] [CrossRef]
  18. Wang, L.; Xu, P.; Peng, X.; Zhao, K.; Wei, R. Characterization of inter-ply slipping behaviors in hot diaphragm preforming: Experiments and modelling. Compos. Part A Appl. Sci. Manuf. 2019, 121, 28–35. [Google Scholar] [CrossRef]
  19. Pasco, C.; Khan, M.; Gupta, J.; Kendall, K. Experimental investigation on interply friction properties of thermoset prepreg systems. J. Compos. Mater. 2019, 53, 227–243. [Google Scholar] [CrossRef]
  20. Sun, J.; Li, M.; Gu, Y.; Zhang, D.; Li, Y.; Zhang, Z. Interply friction of carbon fiber/epoxy prepreg stacks under different processing conditions. J. Compos. Mater. 2014, 48, 515–526. [Google Scholar] [CrossRef]
  21. Liang, B.; Hamila, N.; Peillon, M.; Boisse, P. Analysis of thermoplastic prepreg bending stiffness during manufacturing and of its influence on wrinkling simulations. Compos. Part A Appl. Sci. Manuf. 2014, 67, 111–122. [Google Scholar] [CrossRef]
  22. Larberg, Y.R.; Åkermo, M. On the interply friction of different generations of carbon/epoxy prepreg systems. Compos. Part A Appl. Sci. Manuf. 2011, 42, 1067–1074. [Google Scholar] [CrossRef]
  23. Ersoy, N.; Potter, K.; Wisnom, M.R.; Clegg, M.J. An experimental method to study the frictional processes during composites manufacturing. Compos. Part A Appl. Sci. Manuf. 2005, 36, 1536–1544. [Google Scholar] [CrossRef]
  24. Ten Thije, R.H.; Akkerman, R.; Ubbink, M.; Van Der Meer, L. A lubrication approach to friction in thermoplastic composites forming processes. Compos. Part A Appl. Sci. Manuf. 2011, 42, 950–960. [Google Scholar] [CrossRef]
  25. Murtagh, A.M.; Lennon, J.J.; Mallon, P.J. Surface friction effects related to pressforming of continuous fibre thermoplastic composites. Compos. Manuf. 1995, 6, 169–175. [Google Scholar] [CrossRef]
  26. Lee, J.M.; Kim, B.M.; Lee, C.J.; Ko, D.C. A characterisation of tool-ply friction behaviors in thermoplastic composite. Procedia Eng. 2017, 207, 90–94. [Google Scholar] [CrossRef]
  27. Sachs, U.U. Friction and Bending in Thermoplasctic Composites Forming Processes; University of Twente: Enschede, The Netherlands, 2014; p. 101. [Google Scholar]
  28. Fetfatsidis, K.A.; Gamache, L.M.; Gorczyca, J.L.; Sherwood, J.A.; Jauffrès, D.; Chen, J. Design of an apparatus for measuring tool/fabric and fabric/fabric friction of woven-fabric composites during the thermostamping process. Int. J. Mater. Form. 2013, 6, 1–11. [Google Scholar] [CrossRef]
  29. Alshahrani, H.; Hojjati, M. Bending behavior of multilayered textile composite prepregs: Experiment and finite element modeling. Mater. Des. 2017, 124, 211–224. [Google Scholar] [CrossRef]
  30. Sachs, U.; Akkerman, R.; Fetfatsidis, K.; Vidal-Sallé, E.; Schumacher, J.; Ziegmann, G.; Allaoui, S.; Hivet, G.; Maron, B.; Vanclooster, K.; et al. Characterization of the dynamic friction of woven fabrics: Experimental methods and benchmark results. Compos. Part A Appl. Sci. Manuf. 2014, 67, 289–298. [Google Scholar] [CrossRef]
  31. Cornelissen, B.; Sachs, U.; Rietman, B.; Akkerman, R. Dry friction characterisation of carbon fibre tow and satin weave fabric for composite applications. Compos. Part A Appl. Sci. Manuf. 2014, 56, 127–135. [Google Scholar] [CrossRef]
  32. Rashidi, A.; Montazerian, H.; Yesilcimen, K.; Milani, A. Experimental characterization of the inter-ply shear behavior of dry and prepreg woven fabrics: Significance of mixed lubrication mode during thermoset composites processing. Compos. Part A Appl. Sci. Manuf. 2020, 129, 105725. [Google Scholar] [CrossRef]
  33. ten Thije, R.H.; Akkerman, R.; van der Meer, L.; Ubbink, M.P. Tool-ply friction in thermoplastic composite forming. Int. J. Mater. Form. 2008, 1, 953–956. [Google Scholar] [CrossRef]
  34. Singh Grewal, H. Characterization of Interply Shear Behaviour of Out-of-Autoclave Thermosetting Prepreg Composites; Technical Report; Concordia University: Montreal, QC, Canada, 2015. [Google Scholar]
  35. Kappel, E.; Stefaniak, D.; Spröwitz, T.; Hühne, C. A semi-analytical simulation strategy and its application to warpage of autoclave-processed CFRP parts. Compos. Part A Appl. Sci. Manuf. 2011, 42, 1985–1994. [Google Scholar] [CrossRef]
  36. Joven, R.; Tavakol, B.; Rodriguez, A.; Guzman, M.; Minaie, B. Characterization of shear stress at the tool-part interface during autoclave processing of prepreg composites. J. Appl. Polym. Sci. 2013, 129, 2017–2028. [Google Scholar] [CrossRef]
  37. Groves, D.J. A characterization of shear flow in continuous fibre thermoplastic laminates. Composites 1989, 20, 28–32. [Google Scholar] [CrossRef]
  38. Scherer, R.; Friedrich, K. Inter- and intraply-slip flow processes during thermoforming of cf/pp-laminates. Compos. Manuf. 1991, 2, 92–96. [Google Scholar] [CrossRef]
  39. Morris, S.R.; Sun, C.T. An investigation of interply slip behaviour in AS4/PEEK at forming temperatures. Compos. Manuf. 1994, 5, 217–224. [Google Scholar] [CrossRef]
  40. Gorczyca-Cole, J.L.; Sherwood, J.A.; Chen, J. A friction model for thermostamping commingled glass-polypropylene woven fabrics. Compos. Part A Appl. Sci. Manuf. 2007, 38, 393–406. [Google Scholar] [CrossRef]
  41. Kim, J.Y.; Hwang, Y.T.; Baek, J.H.; Song, W.Y.; Kim, H.S. Study on inter-ply friction between woven and unidirectional prepregs and its effect on the composite forming process. Compos. Struct. 2021, 267, 113888. [Google Scholar] [CrossRef]
  42. Shoaib, T.; Espinosa-Marzal, R.M. Advances in Understanding Hydrogel Lubrication. Colloids Interfaces 2020, 4, 54. [Google Scholar] [CrossRef]
  43. Zhao, Y.; Zhang, T.; Li, H.; Zhang, B. Characterization of prepreg-prepreg and prepreg-tool friction for unidirectional carbon fiber/epoxy prepreg during hot diaphragm forming process. Polym. Test. 2020, 84, 106440. [Google Scholar] [CrossRef]
  44. Nikas, G.K. Recent Developements in Wear Prevention, Friction, and Lubrication; Research Signpost: Thiruvananthapuram, India, 2010; p. 314. [Google Scholar]
  45. Rueden, C.T.; Schindelin, J.; Hiner, M.C.; DeZonia, B.E.; Walter, A.E.; Arena, E.T.; Eliceiri, K.W. ImageJ2: ImageJ for the next generation of scientific image data. BMC Bioinform. 2017, 18, 529. [Google Scholar] [CrossRef] [PubMed]
  46. Rashidi, A.; Crawford, B.; Olfatbakhsh, T.; Milani, A.S. A mixed lubrication model for inter-ply friction behaviour of uncured fabric prepregs. Compos. Part A Appl. Sci. Manuf. 2021, 149, 106571. [Google Scholar] [CrossRef]
  47. Burstein, L. Effect of sinusoidal roughened surfaces on pressure in lubricating film. Int. J. Surf. Sci. Eng. 2008, 2, 52–70. [Google Scholar] [CrossRef]
  48. Heshmat, H.; Walton, J.F. Starved Hydrodynamic Gas Foil Bearings-Experiment, Micromechanical Phenomenon, and Hypotheses. J. Tribol. 2016, 138, 1–14. [Google Scholar] [CrossRef]
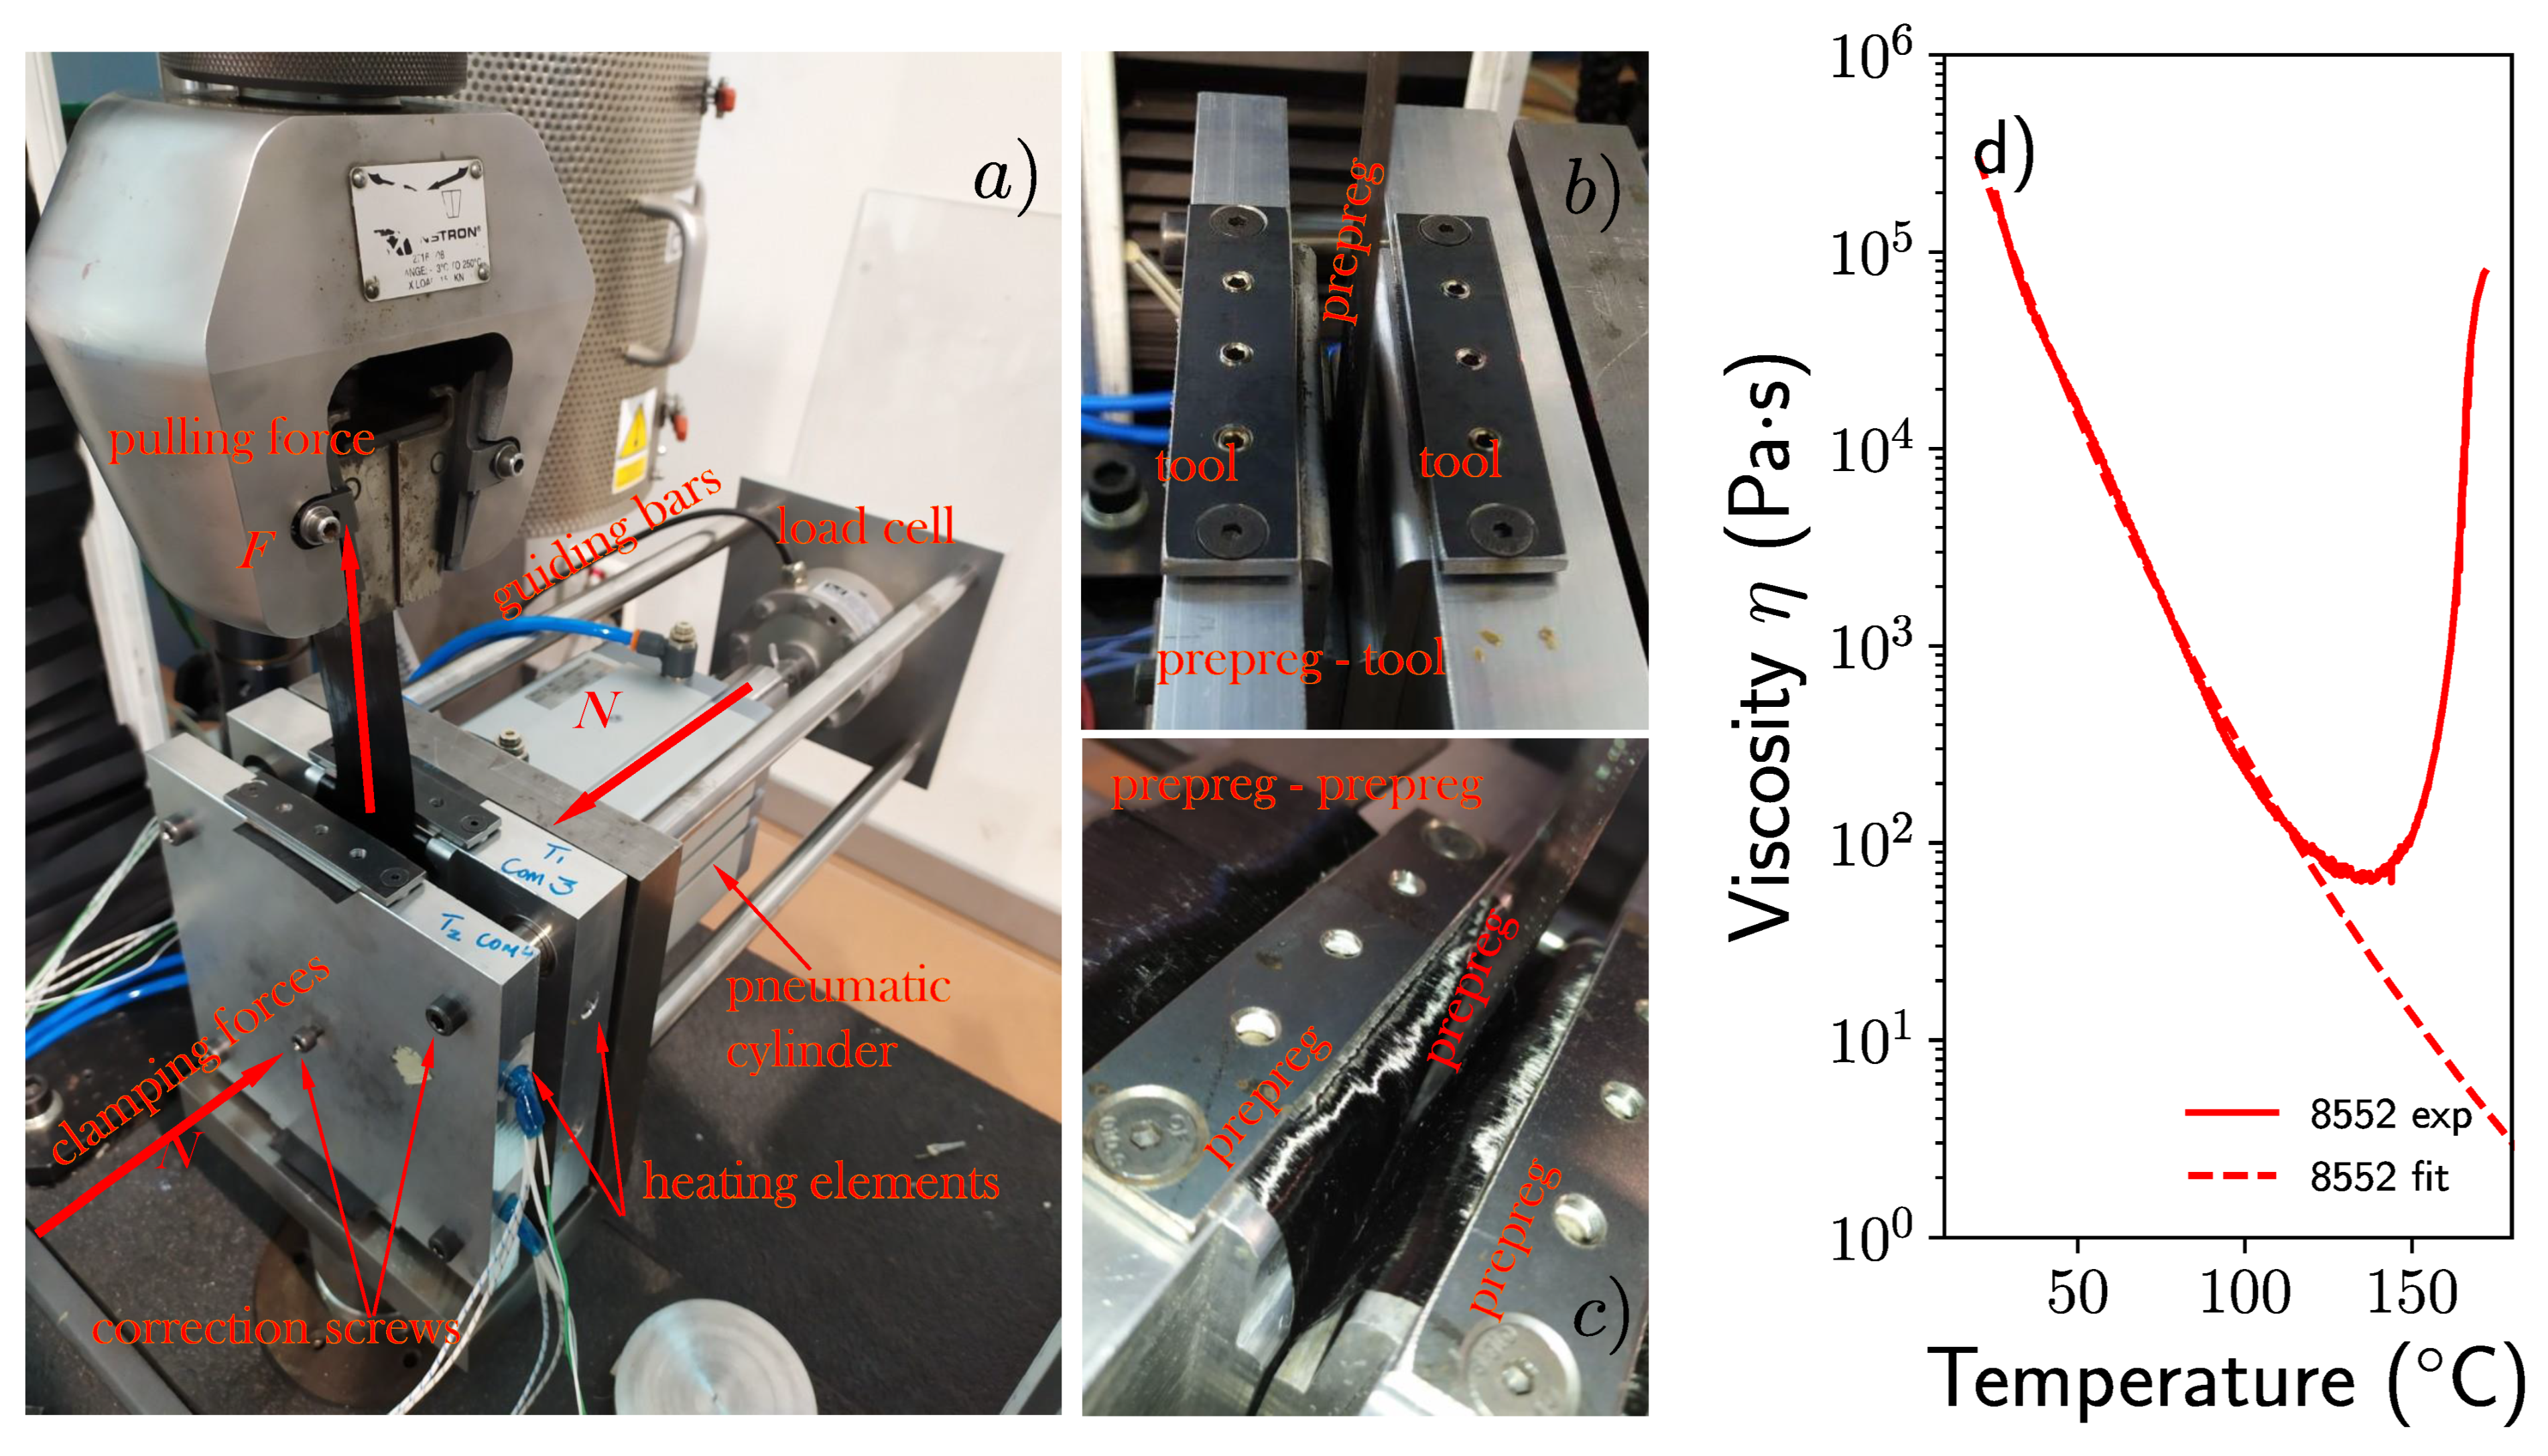
Figure 1. (a) Experimental set-up used for measuring friction coefficients, (b) Test for prepreg-tool friction measurement, (c) Test for prepreg-prepreg friction measurement, (d) Temperature dependence of the 8552 epoxy viscosity.
Jmmp 07 00014 g001
Figure 2. Pull-out load curves FU for prepreg-prepreg friction (af) and prepreg-tool friction (gi,ln) tests carried out at 40 °C and 60 °C with pressure and sliding velocities ranging between 0.5–2 bars and 1–10 mm/min.
Jmmp 07 00014 g002aJmmp 07 00014 g002b
Figure 3. Average friction coefficient and standard deviation at 40 °C and 60 °C for prepreg-prepreg contact in (a,b) and prepreg-tool contact in (c,d).
Jmmp 07 00014 g003
Figure 4. Stribeck curves for the friction coefficient: (a) Prepreg-prepreg contact, (b) Prepreg-tool contact.
Jmmp 07 00014 g004
Figure 5. Optical micrographs of the contact surfaces after testing. In (a,b) is presented prepreg-prepreg contact surfaces for 40 °C and 60 °C; in (c,d) prepreg-tool contact surfaces respectively for 40 °C and 60 °C. Coupons were tested at 1 mm/min sliding speed.
Jmmp 07 00014 g005
Figure 6. (a) XCT reconstruction of [ 0 ° ] 8 laminates for the interlayer thickness determination, (b) SEM image with a detailed view of the space between two adjacent prepreg plies, (c) Average resin interlayer thickness as a function of the temperature and applied pressure.
Jmmp 07 00014 g006
Figure 7. (a) Geometry of the two rubbing surfaces, (b) Sketch of the pressure distribution during sliding.
Jmmp 07 00014 g007
Figure 8. Comparisons between the analytical model and experimental results for the Stribeck curves for the friction coefficient: (a) Prepreg-prepreg contact, (b) Prepreg-tool contact.
Jmmp 07 00014 g008
Figure 9. Model sensitivity analysis: (a) Effect of wavelength L variation keeping a constant roughness A, (b) schematic illustration of the wavelength changing. In (c) is the effect of the roughness variation keeping constant wavelength L, in (d) is the schematic illustration of Amplitude changing.
Jmmp 07 00014 g009
Figure 10. Interlayer resin thickness, predicted with the developed model, as a function of the Hersey number.
Jmmp 07 00014 g010
Table 1. Average value and Standard deviation of friction coefficient for the ply-ply and ply-tool contact.
Clamping Pressure (bar)Pulling Velocity (mm/min)Friction Coefficients at 40 °C Ply-PlyFriction Coefficients at 40 °C Ply-ToolFriction Coefficients at 60 °C Ply-PlyFriction Coefficients at 60 °C Ply-Tool
0.510.59 ± 0.030.47 ± 0.020.1 ± 0.0040.17 ± 0.03
31.08 ± 0.030.68 ± 0.020.19 ± 0.010.23 ± 0.02
51.23 ± 0.030.78 ± 0.020.25 ± 0.0050.28 ± 0.008
101.31 ± 0.070.86 ± 0.040.3 ± 0.030.39 ± 0.01
110.33 ± 0.0070.30 ± 0.020.09 ± 0.0070.10 ± 0.008
30.67 ± 0.040.42 ± 0.040.15 ± 0.0010.13 ± 0.007
50.85 ± 0.040.44 ± 0.020.19 ± 0.0090.15 ± 0.008
101.27 ± 0.030.55 ± 0.060.26 ± 0.020.18 ± 0.005
210.23 ± 0.030.21 ± 0.0060.06 ± 0.0030.07 ± 0.007
30.41 ± 0.040.33 ± 0.010.09 ± 0.0080.09 ± 0.007
50.54 ± 0.010.35 ± 0.020.13 ± 0.010.19 ± 0.008
100.85 ± 0.020.47 ± 0.020.14 ± 0.010.14 ± 0.005
Table 2. AS4/8552 Roughness R a in μm for samples tested at 0.5 bar and pulled out at a displacement rate of 1 mm/min.
Contact Type40 °C60 °C
Prepreg-prepreg3.22 ± 0.233.17 ± 0.66
Prepreg-tool3.93 ± 0.463.10 ± 0.12
Disclaimer/Publisher’s Note: The statements, opinions and data contained in all publications are solely those of the individual author(s) and contributor(s) and not of MDPI and/or the editor(s). MDPI and/or the editor(s) disclaim responsibility for any injury to people or property resulting from any ideas, methods, instructions or products referred to in the content.