Article

Material Behavior around the FSW/FSP Tool Described by Molecular Dynamics

by
Bentejui Medina
1,† and
Ricardo Fernández
2,*
1
Electron-Microscopy Laboratory, CIC nanoGUNE BRTA, E-20018 Donostia, Spain
2
Centro Nacional de Investigaciones Metalúrgicas (CENIM), C.S.I.C., Avda. de Gregorio del Amo 8, E-28040 Madrid, Spain
*
Author to whom correspondence should be addressed.
Current address: European Organization for Nuclear Research, 1211 Geneva, Switzerland.
J. Manuf. Mater. Process. 2023, 7(1), 13; https://doi.org/10.3390/jmmp7010013
Submission received: 2 December 2022 / Revised: 23 December 2022 / Accepted: 25 December 2022 / Published: 30 December 2022

Abstract

:
Friction stir welding and processing (FSW/FSP) involves severe plastic deformation of metals or polymers at high temperature around a rotating tool. The material’s flow is usually modelled by FEM using a complex combination of thermomechanical and friction models. However, the description of the behavior of the first atomic layers in contact with the tool cannot be undertaken by continuum mechanics modelling such as FEM. Among the available simulation techniques, molecular dynamics (MD) where friction and heat are generated by material layers’ relative movement, allows the simulation of the behavior of the first atomic layers of the work piece in contact with the tool. In this work, in aluminum, the effect of temperature and advancing and rotating speeds on FSW/FSP material’s flow and crystallography in the vicinity of the tool are discussed. The data analyzed demonstrate that a normalization of the weld-pitch parameter by the pin radius allows obtaining reliable heat input, momentum, and temperatures typical of this critical region in the FSW/FSP processes by MD. The results show that MD provide reliable data as an input for the FEM in a multiscale FSW/FSP modelling.

1. Introduction

Friction stir welding (FSW) presents one of the fastest growing rates among the joining techniques in recent years. In 2026, the number of machines used for FSW welding is expected to double compared to 2020 [1]. This growth will result in a large number of combinations of materials, geometries, and thicknesses to be welded, which would require extensive experimental work for processes adjustment. A detailed description of the phenomena involved during welding would allow to select the optimal parameter window, with the consequent savings in cost and time. The material flow description during the FSW/FSP process in metals and polymers is carried out in most of the cases using finite element modeling (FEM) [2,3,4,5,6]. Although the description of the hot deformation of metallic materials has improved in the last years [7,8,9], the material is usually considered a viscous fluid (CFD simulations) in FEM-FSW modelling. The most advanced models are those that combine the rigid behavior of the tool on one hand and the high deformation capacity of the material on the other. An example is the apropos kinematic framework usually adopted by arbitrary Lagrangian–Eulerian (ALE) and Eulerian settings [10,11]. In recent works, the use of ALE + Eulerian settings has been combined with the concept of a tracer that discretizes the material and allows a very detailed spatial description of the material flow [12]. These models rely on the detailed description of the heat generated by both plastic deformation and friction between the tool and the work piece. In particular, the models using a modified Norton law describing the effect of the pressure around the tool in the friction phenomena must be calibrated to determine the heat transfer coefficients during the welding process [10,13]. An extra difficulty for material flow modeling is the inherent existence of high thermal and stress gradients around the tool during the friction/strain process. In particular, the contact condition between the tool and the workpiece needs to be defined accurately [14]. Experimentally, the use of tracers, i.e., particles of a harder dissimilar material located in specific areas of the starting material, has allowed to follow the material flow [15]. Once the weld is finished, the position of the tracers is determined by X-ray or tomography, allowing the calibration of predictive models. However, these experimental procedures cannot describe the material flow close to the tool where the stick–slip phenomena occurs. The severe plastic-deformation process around the welding tool and the phase reactions generated during FSW/FSP control the resulting microstructure. This scenario imposes the necessity of a multiscale approach for the microstructural design of the FSW/FSP process. Simulation tools as phase field (PM), Monte Carlo (MC), and cellular automaton (CA) have been used to investigate the variation of grain size produced by FSW [16]. However, one of the challenges in hierarchical multiscale modeling is passing information from one scale to another, especially from the molecular model to the continuum one [17]. Among the simulation techniques in the nanometric scale, molecular dynamics (MD) is a prominent one [18]. This simulation technique describes the dynamics of groups of atoms, usually in the order of tens of thousands to several millions, by considering their atomic potentials [19]. At this scale, the atoms may aggregate themselves in amorphous, quasi-crystalline, or crystalline form, which allows to properly simulate the stick–slip process that controls the FSW/FSP process. This simulation technique does not need to use equations describing the mechanical and thermal behavior of the set of atoms where friction and heat are generated by material layers’ relative movement. This is a very convenient way to model highly complex phenomena such as friction and deformation at high temperature in the FSW/FSP vicinity. The interaction between the tool and the material during the process is one of the most difficult aspects to describe due to the lack of tools to study this interaction. For this reason, simulation techniques, especially MD, are the only way to describe the interaction between the tool and material during FSW/FSP processes. In particular, friction is mainly a deformation phenomenon between the asperities of two surfaces at the atomic scale. In the case of MD, adhesion and friction are generated between the different layers of the material with the relative movement of atoms [20]. Despite these advantages, a much-reduced number of articles has been published to model the material flow in FSW [21,22]. The reason is that these works were devoted to describe the material flow during the FSW process for unrealistic nanometer0scale systems. Therefore, their output cannot be directly compared to experimental or simulated FEM data. In order to overcome these limitations, in the present work, MD is applied to simulate the material flow in the vicinity of the tool, providing new, useful information to be used as a starting dataset for multiscale modelling of the FSW process. This will open the door to a new, multiscale approach to optimize the FSW process.

2. Considerations about FSW/FSP Multiscale Modelling

The first step to perform a multiscale study of the FSW/FSP process is to provide an adequate description of the main characteristics of the material flow around the tool to be connected to the macroscopic description carried out by FEM modelling. The behavior of the firsts layers in contact with the tool can be described by MD. The problem with the connection between MD and FEM is that atomic motion in MD simulation contains a short wavelength that FE region cannot represent. This has forced the development of strategies that properly connect the total momentum transference from the MD domain into the FEM one in a concurrent multiscale analysis [23]. In the case of the FSW/FSP process, material deforms around the tool under such severe temperature and constriction conditions that it behaves like a viscous liquid, which minimizes scaling effects [24]. As it has been previously reported, tiny volumes of a few atoms along the edge obey the classical laws of continuum mechanics when the surface energy effects are adequately considered [24]. These surface effects, in the case of MD modeling of FSW/FSP, are associated with the combination of a reduced number of atoms and the use of the macroscopic diffusion coefficient, which produces an overrepresentation of the atomic diffusion. This fact is very relevant in the case of FSW/FSP because plastic deformation at high temperature is diffusion-controlled. Therefore, the management of temperature in the FSW/FSP modelling by MD is critical to provide valuable results.

2.1. Temperature

The heat generated in FSW/FSP can be associated in MD with the destruction of atomic bonds during the deformation of the material in an analogous manner to the prevailing theory used to model machining [25], where it is assumed that the highest temperature zone is slightly separated from the work piece–tool interface. MD simulation represents isolated systems, so it is necessary to use approximations that allow for adequate consideration of the large amount of energy generated by the deformation work. In MD modelling, it is common to consider a group of atoms with a fixed temperature, which act as heat sinks. The main disadvantage of this approach is that the results strongly depend on the thermal conductivity of the system. In MD, only the phonon thermal conductivity is considered, but in metals, the electronic thermal conductivity may represent an equal or greater contribution [26]. For that reason, in the present work, the heat sink approach has been ruled out in favor of the consideration of a constant average temperature in a system similar to that of the real process without producing an over-representation of the diffusion. However, modifying v and w affects the maximum temperature reached in the system [27]. This relationship between normalized weld pitch and temperature has been considered in MD simulations.

2.2. Advancing and Rotating Speeds—Weld Pitch

The advancing and rotating speeds (respectively, v and w) have a significant influence on the material flow around the tool. Usually, a parameter combining both speeds is used to describe the distance traveled per turn in FSW/FSP processes. This parameter is the weld pitch (v/w). In experimental studies, the weld pitch typically ranges between 1–0.01 mm/rev, while the rotating speed ranges between 50–3000 rpm, and the advancing speed ranges between 1–100 mm/s [27,28,29,30]. However, in previous FSW-MD simulations, very high advancing (5 × 10⁴–5 × 105 mm/s) speeds are used [21,22] to compensate for the small size of the system. One of the reasons for using very high advancing speeds is that they reduce simulation times to hours (or days in the case of large systems). Therefore, very high rotating speeds, typically in the range (0.1–1) ps−1, are used to compensate for the small size of the tool and provide weld-pitch values similar to the real ones. These parameters should be normalized by using the weld pitch to be compared to the real ones, as it will be shown in Section 3.1.

2.3. Tool Size and Geometry

The material flow around the FSW tool depends on the pin geometry as smooth, faceted, or threaded and size [28,29,30]. As MD simulations with periodic boundary conditions represent pseudo-2D systems, in the present work, a cylindrical pin is considered for the MD simulations of FSW/FSP processes. In this system, the pin radius has a significant influence on material flow. In general, a larger pin results in a more complex material flow for a given (v, w). The ideal normalized pin/system size to precisely describe the main characteristics of the material flow around the tool has been determined.
In real FSW/FSP processes, tool tilting with respect to the normal direction is applied in order to generate an adequate material flow [29]. Tool tilting allows forging the material to ensure an effective stir that avoids defects appearance. In the present MD simulations, the forging effect has been generated by a boundary condition that confines the material in the horizontal plane. This boundary condition disregards the shoulder friction contribution. Therefore, the zones far from the shoulder, as the material in contact with the pin surface, and the stationary shoulder procedures are well-represented by the present model. As it was said before, friction is described in the microscopic scale as plastic deformation. For this reason, the friction in MD simulations is controlled by deformation among the material layer’s controls, which minimizes the underestimation of shoulder friction. The contribution of the shoulder friction has been included in the average temperature considered in the simulations.

3. Molecular Dynamics Simulations

The molecular dynamics simulations presented in this study were carried out with the software package LAMMPS [31], while the illustration of the results were processed by the software Ovito [32]. The material considered in the present simulations is aluminum. A potential descriptor of aluminum [33] based on the embedded atom method EAM/FS [34] was selected for atom interaction. NVE integration was used to guarantee the integrity of quantity and energy of the atoms in the volume of work. The time step of the calculations was 0.001 ps and the number of atoms between 27 k to 1.27 million.
Crystallography and crystallographic defects are linked to the tendency of atoms to consolidate into compact groups. The kinematics in these groups must therefore consider the movement of discrete atoms, as this is one of the pillars of MD. In the MD simulations of FSW/FSP, crystals free of defects are normally considered as a starting point [21,22]. Since, experimentally, a rich defects interaction has been seen, in the present work, the work pieces are constituted by different grains, forcing the interaction dynamic defects and grain boundaries. These interactions will play a role in the plastic flow around the pin.
In this work, simulations were carried out considering different values of the main process parameters: number of atoms, advancing and rotating tool speeds, pin radius, and process average temperature (Table 1). The influence of these parameters on the final atoms configuration and the crystallography generated after welding was studied. Periodic boundary conditions were used to increase the simulated area up to 100 × 100 nm2. A two-pin radius was considered in the MD simulations (Table 1). The forging effect provided by the shoulder on the material is implicitly considered in the model since the material is confined in the out-of-plane direction. The contribution of the shoulder friction was included in the average temperature considered in the simulations. In the present case, the pin is made from (rigid) aluminum without any loss of generality. It is assumed that the greatest contribution to friction occurs between successive layers of the material that deforms plastically. The pin rotates clockwise at a speed w in all the simulations, while the material advances at a speed v. The advancing and rotating speeds have a great influence on the distribution of atoms in the weld, as will be seen in the simulations. The effect of (v, w) was normalized by the pin size in the MD simulations to provide a dimensionless weld pitch. In MD simulation of FSW/FSP, it is necessary to use a work piece 3–4 times larger than the pin radius to avoid excessive material confinement and to guarantee a coherent mechanical response in terms of plasticity in the surrounding material. This aspect was taken into account in the present work, together with the estimation of the total computation time of the simulation to select the two values of the pin radius. Therefore, 5 nm and 12 nm radii were used to study the influence of tool size on the material flow.
In the simulations developed in the present work, there are three types of atoms. The main one is that corresponding to aluminum free atoms. The second type corresponds to atoms at the external boundary of the system. They are used to generate a symmetric boundary to extend the system size. Finally, the atoms of the pin are aluminum atoms insensitive to the external force and are grouped having an invariant speed among them.

3.1. Material Flow

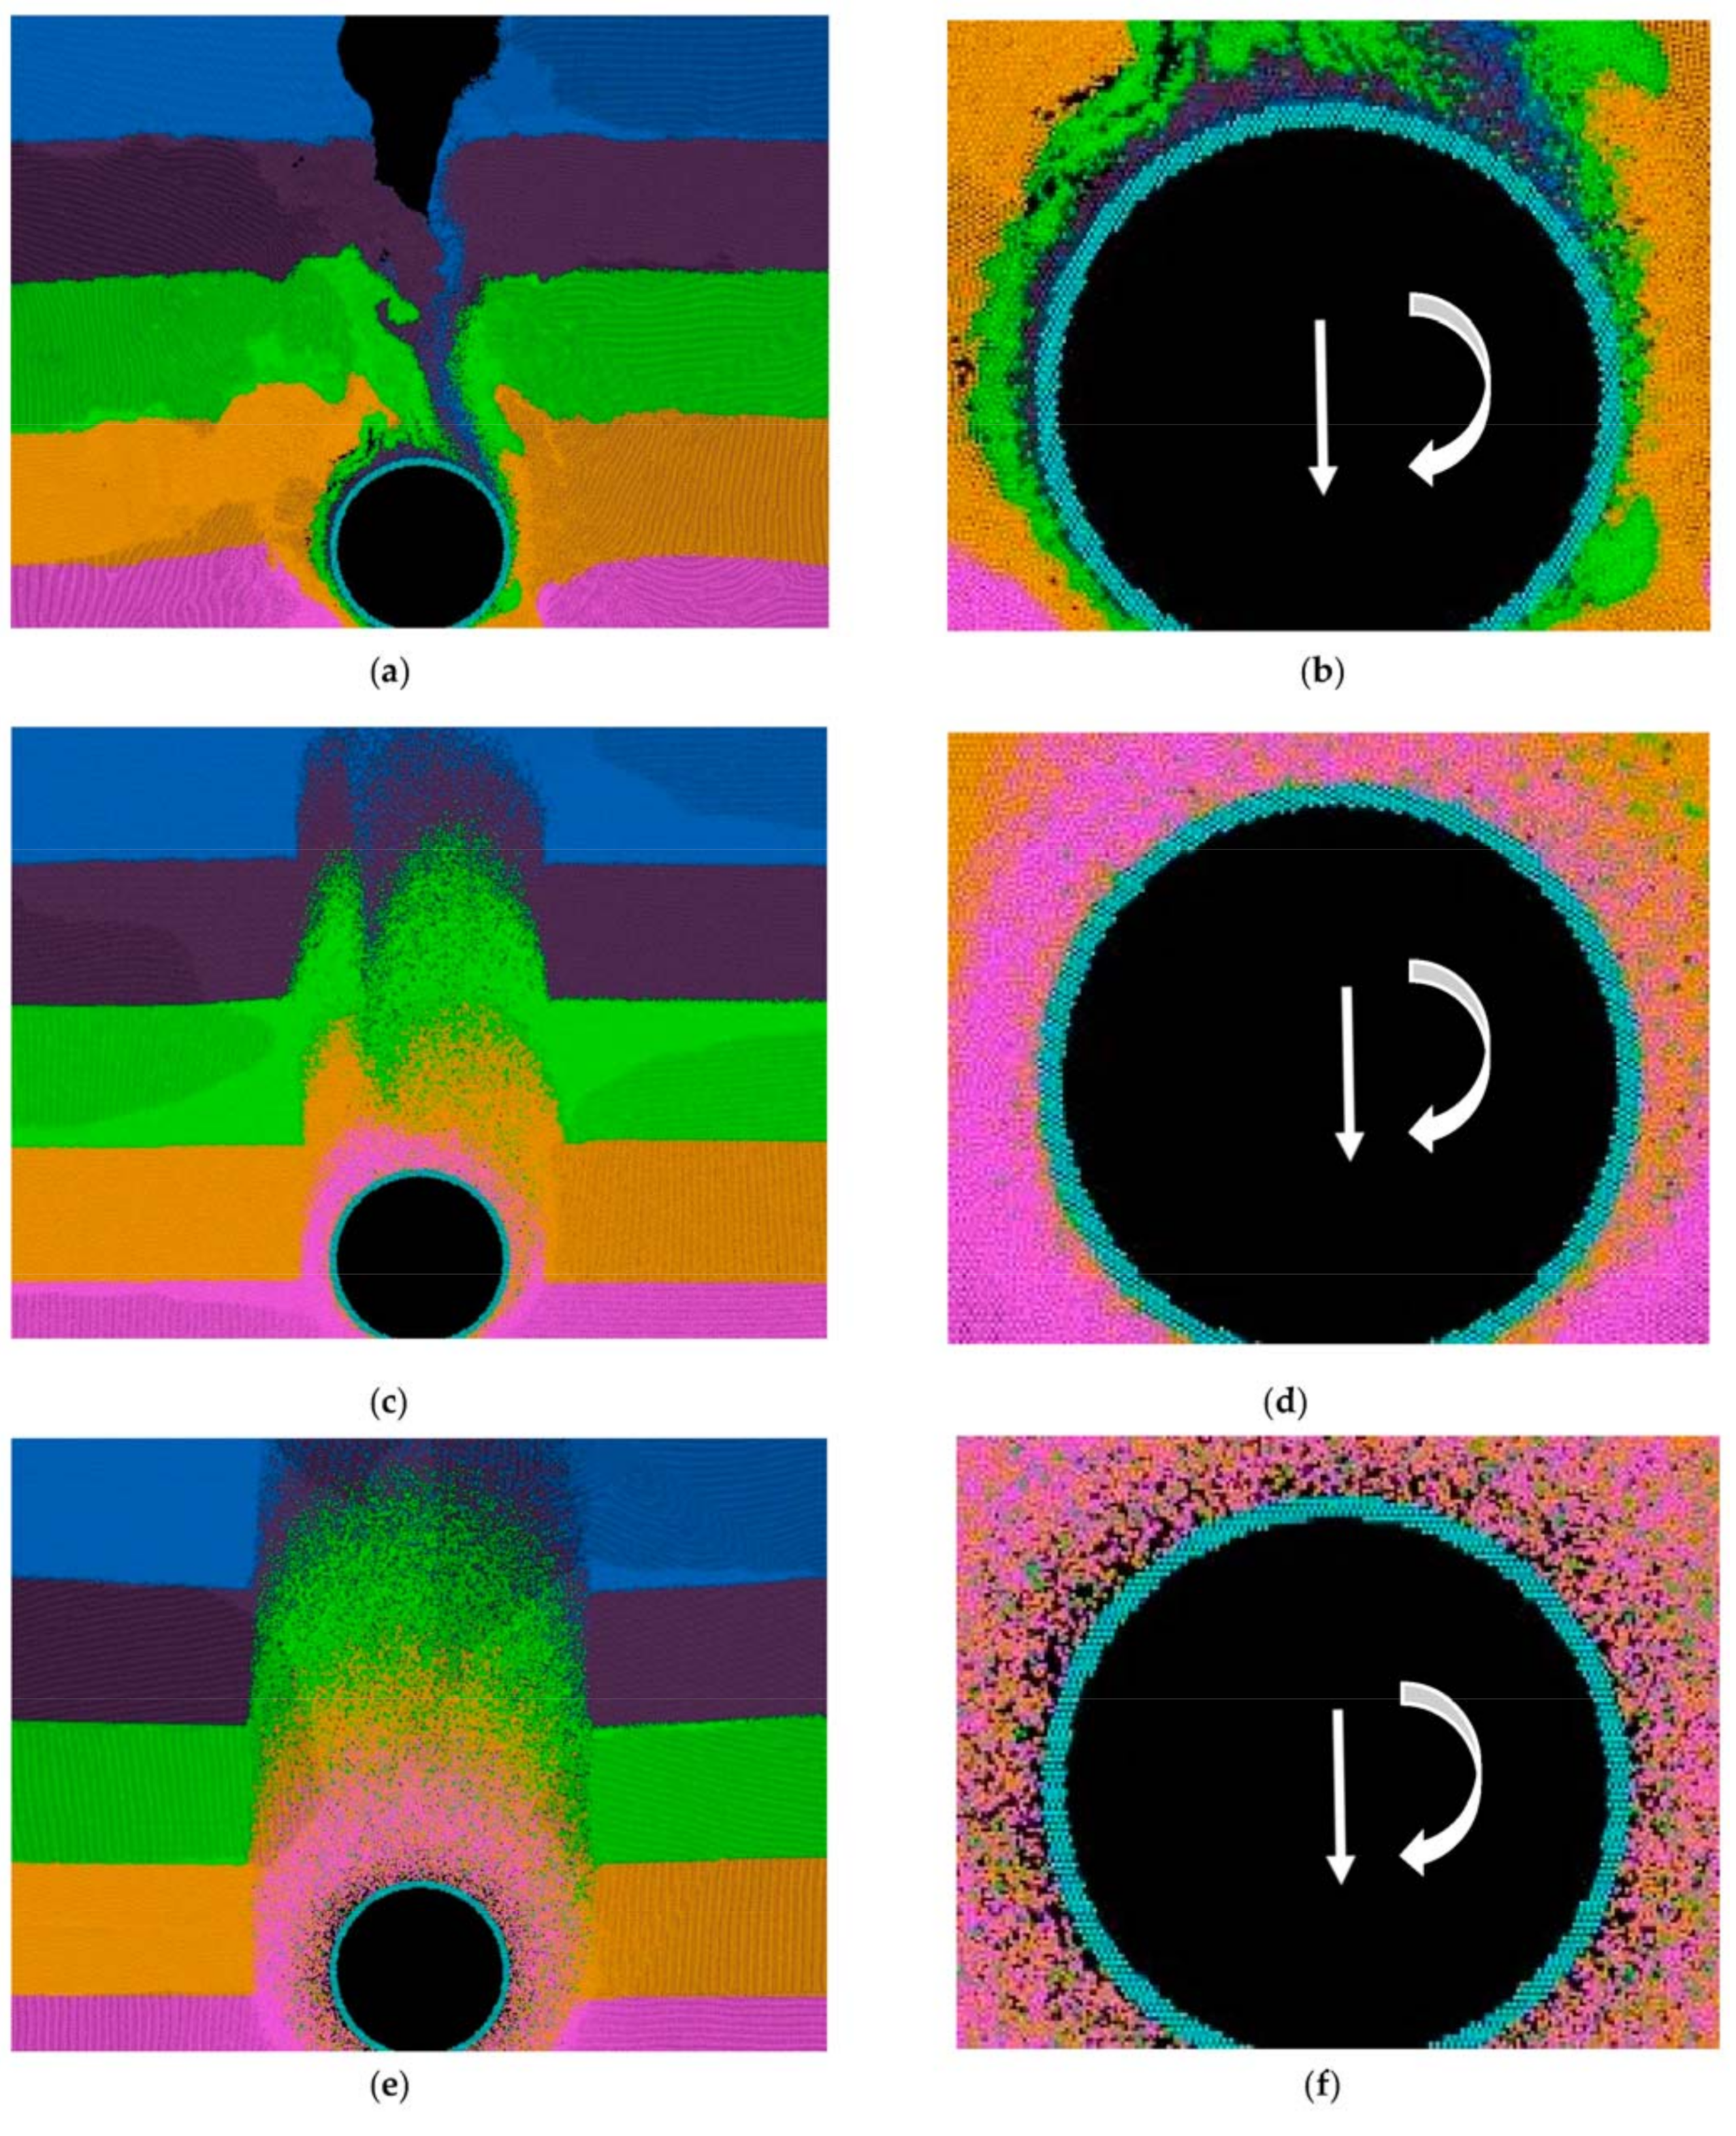
The effect of the pin radius in material flow around the pin is significant, showing higher turbulence in the case of the 12 nm radius pin. Figure 1 shows the influence of the pin radius, i.e., 5 nm in Figure 1a and 12 nm in Figure 1b, on the distribution of atoms after welding at 0.01 ps−1 and 100 m/s. The material flow is also highly dependent on the normalized weld pitch (v/wr). The advancing side is in the right part of the figures. The advancing and rotating directions are indicated by two white arrows in the figures. The simulations shown in Figure 2 were carried out with a pin radius of 12 nm.
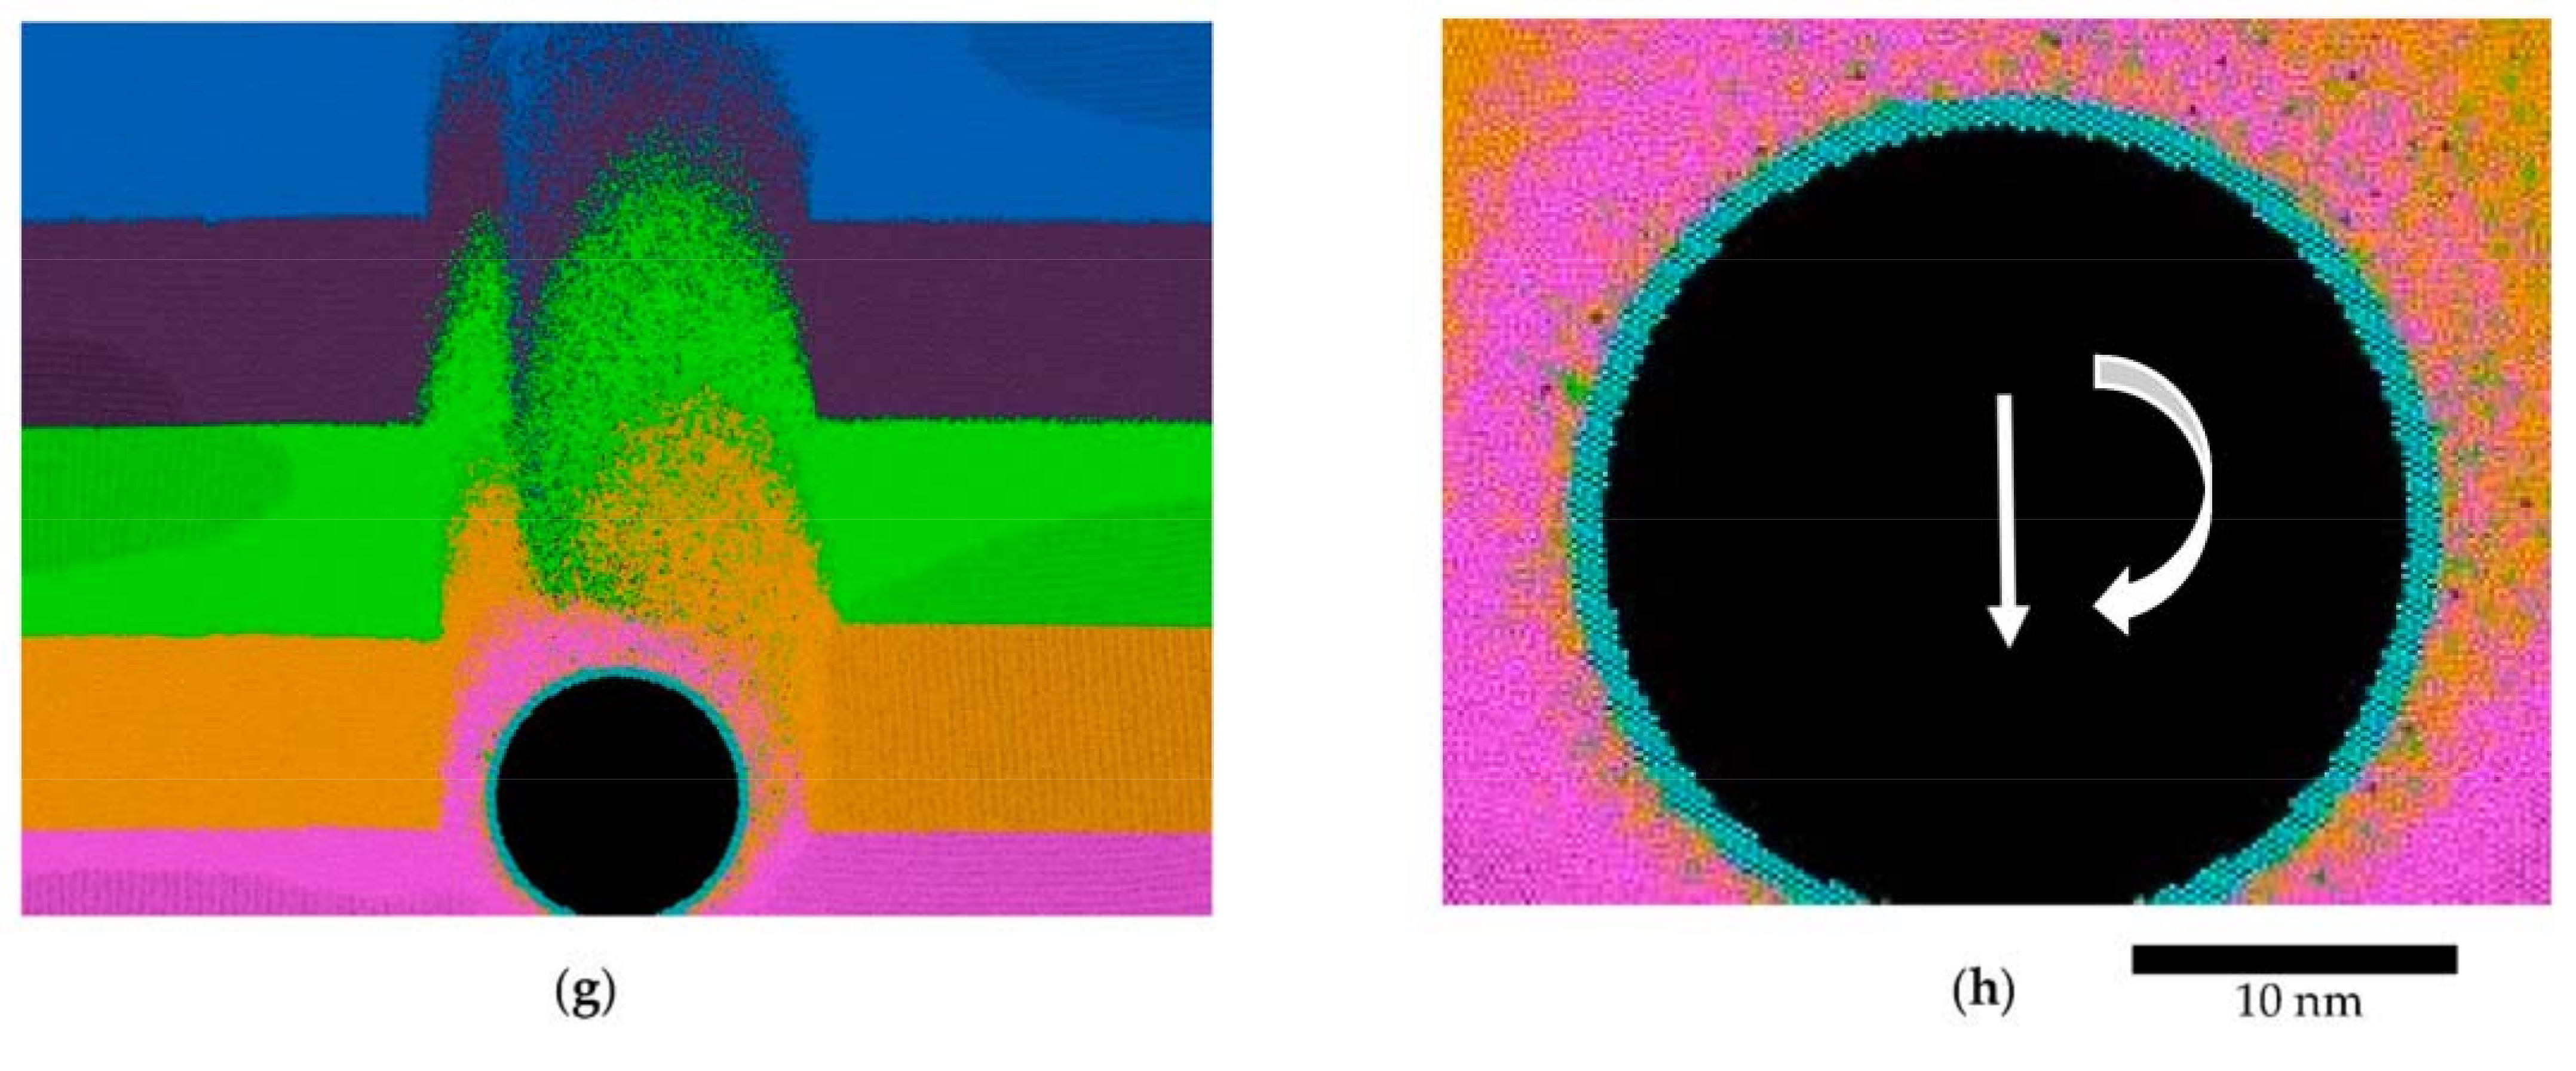
In the case of a very high advancing speed and a slow rotating speed, i.e., v/wr = 8.3 × 100 (Figure 2a,b) the flow of material around the tool cannot fill the gap generated by the pin, and cavities appear. If the rotating speed increases, and the advancing speed decreases v/wr = 8.3 × 10⁻¹, the flow around the tool increases considerably, and the defects disappear (Figure 2c,d). Under these conditions, it can be seen that the resulting flow of material is asymmetric. A higher flow is found on the advancing side (right part of the figures) (Figure 2e,f) so that the material almost completely surrounds the pin on the left. A laminar flow is found on the right (advancing side) and a more turbulent one in the retreating side (left part of the plots). Finally, for an even higher weld pitch, i.e., v/wr = 8.3 × 10⁻², such a severe stirring of the material is produced in such a way that the asymmetry typical of the process between advancing and retreating sides of the weld is not reproduced (Figure 2g,h).
This result is due to the high temperature reached in this high-weld pitch. In MD simulation, the temperature depends mainly on the heat generation produced by the deformation of the material. Therefore, in order to maintain a temperature in the stirring region consistent with the experimental values [35], an average value was established for all the atoms in the simulations. In the developed MD script, the temperature (kinetic energy) of all atoms is corrected every 100 steps, keeping its gradient between inner and outer regions constant. In the simulations performed, average temperatures of 400 K, 550 K, and 650 K were used. The average temperature has a small effect on the flow of atoms (Figure 2c,d,g,h) but influences the atom temperatures around the tool. The temperature of the material around the tool depends on the normalized weld pitch and the average temperature used in the simulations. As it was formerly explained, the size of the pin has a considerable effect on the plastic flow of the material through the v/wr ratio related to the process temperature as shown in Table 1.

3.2. Microstructure

The number of atoms in the simulation that is proportional to the pin size also has a major influence on the microstructural characteristics obtained by MD simulation of the FSW/FSP process. In particular, to obtain a certain atomic mobility that generates crystal defects, it is necessary to consider a high number of atoms. In the present case, systems with 27 k, 678 k, and 1.27 M atoms were considered. The system dimensions are four times bigger than the pin radius to avoid excessive constriction of the material. Depending on the size of the system, between 8 and 12 grains of different orientations were considered initially in the form of a plate. In all cases, the material close to the pin is in a semi-solid state, represented in Figure 3 by small, randomly oriented aggregates of atoms.
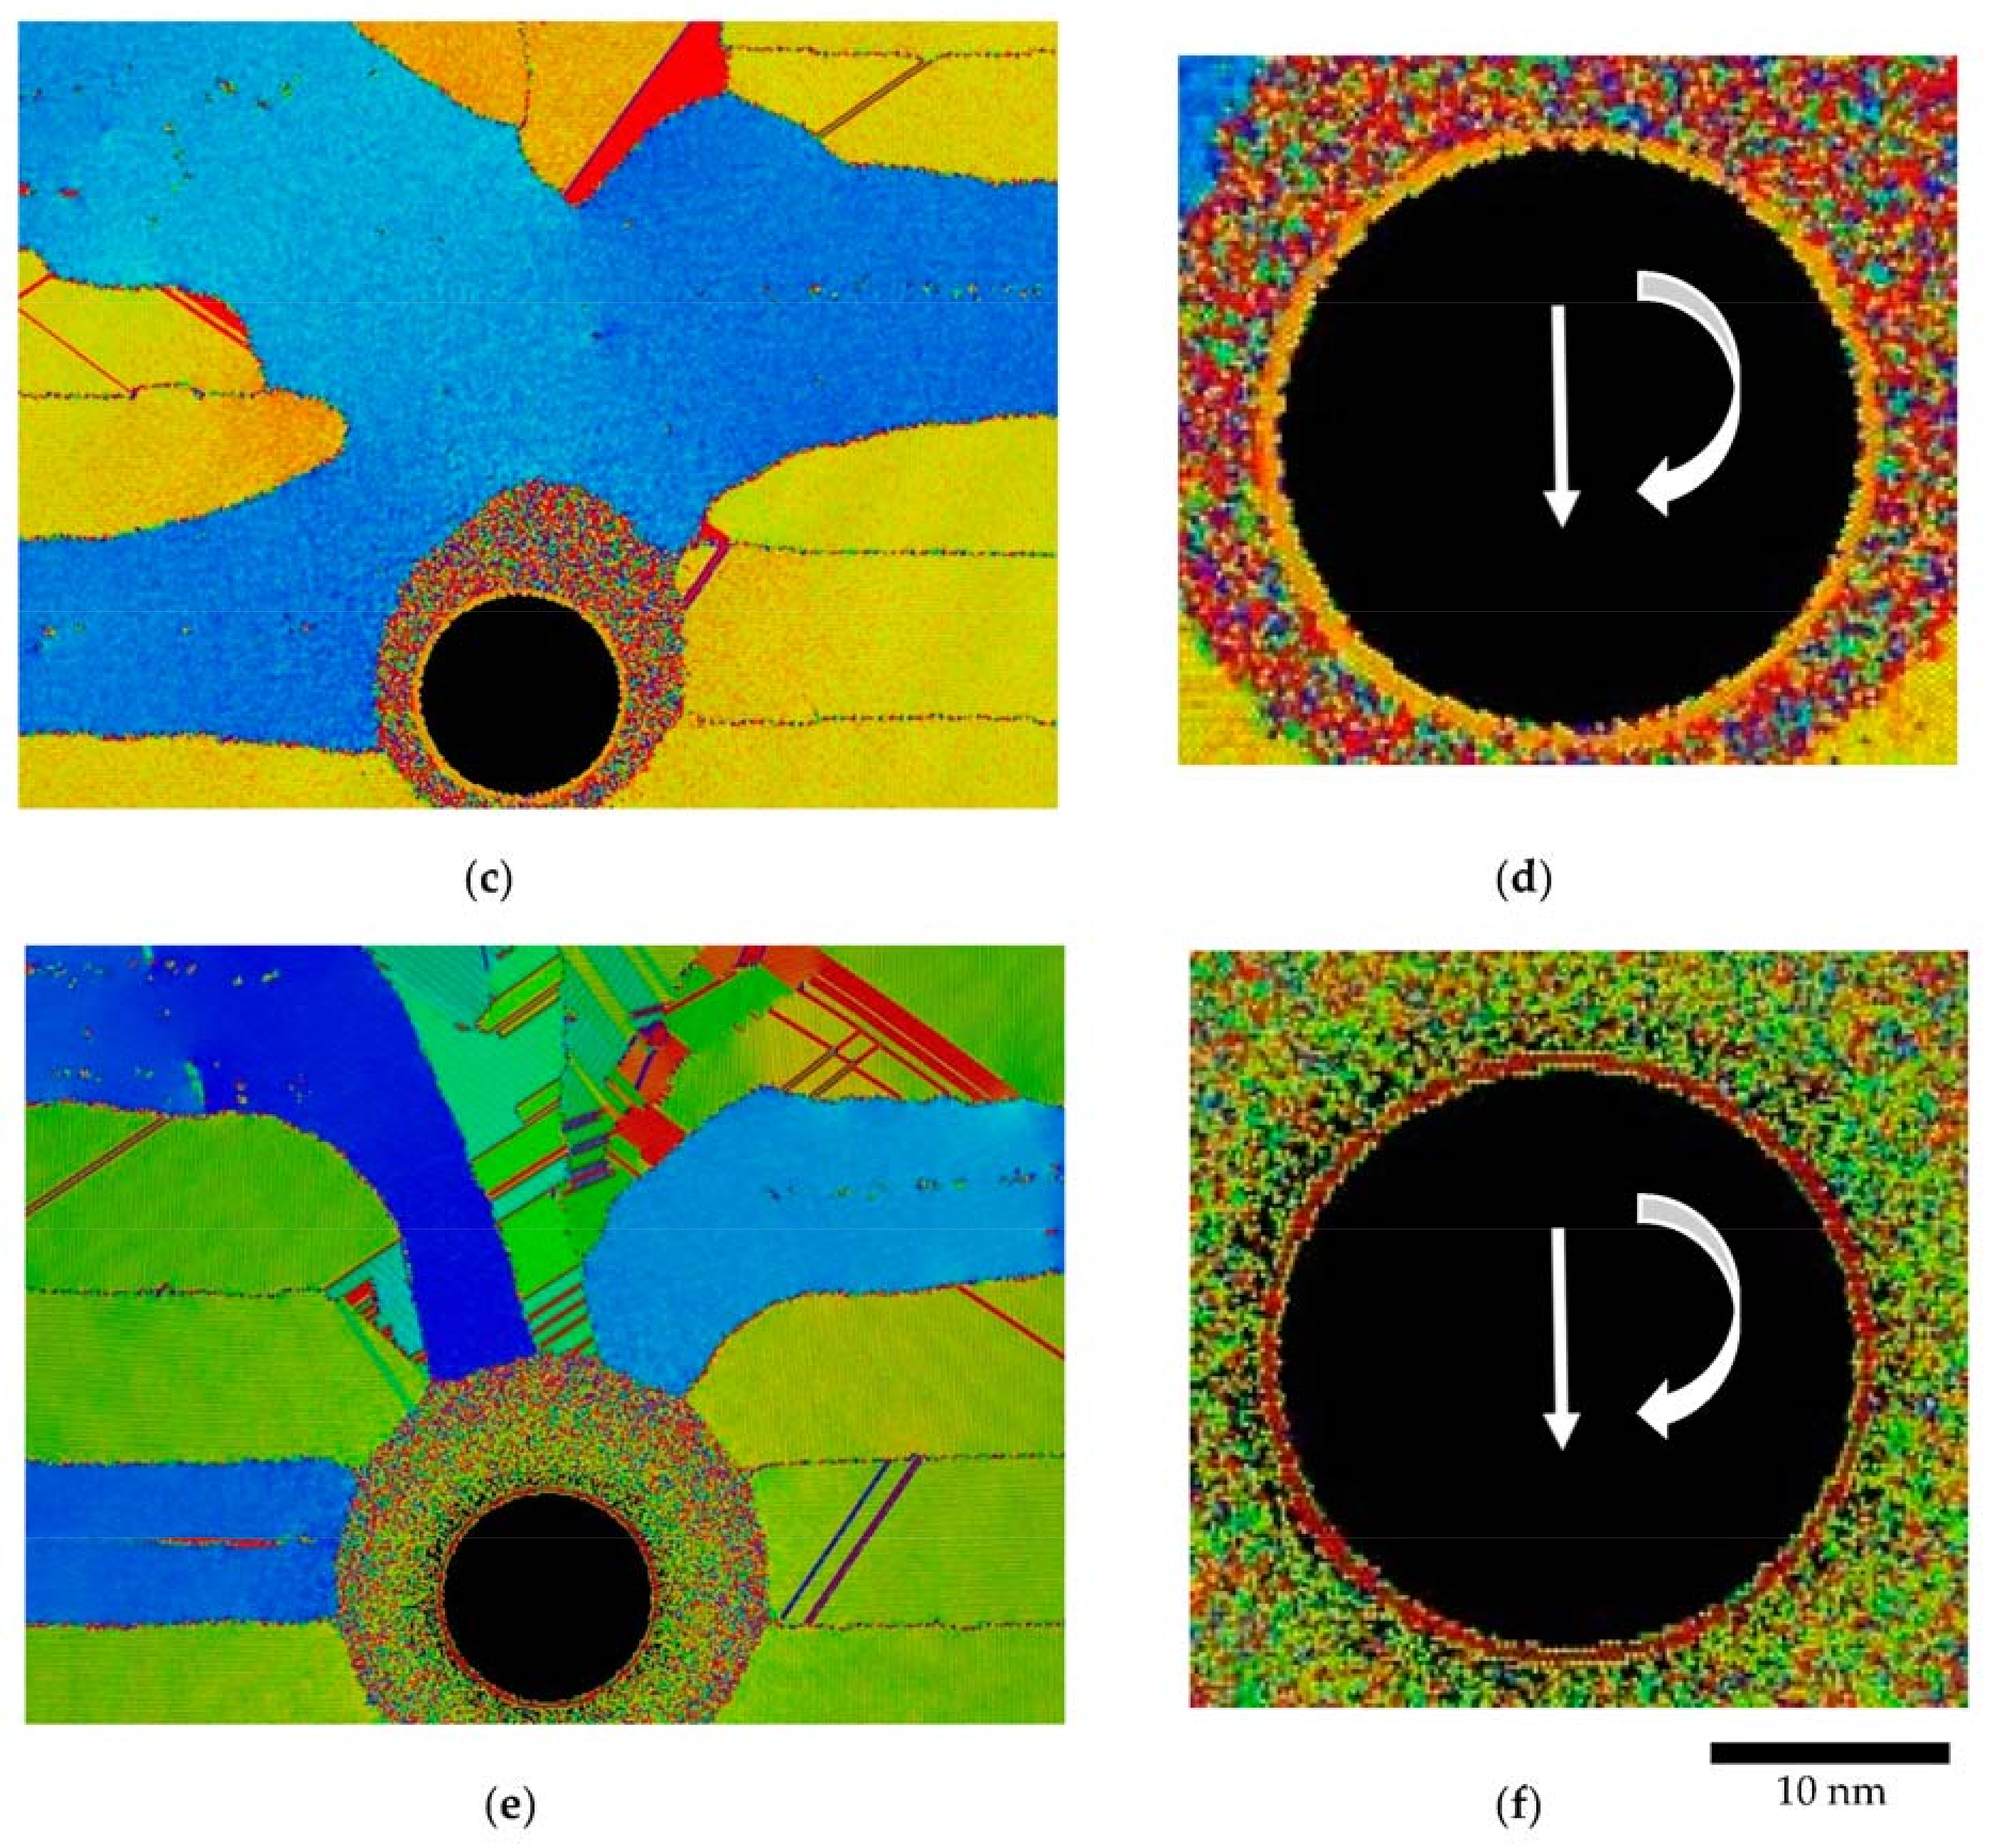
A remarkable crystallographic activity was only generated in large simulations of 678 k or 1.27 M atoms as seen in Figure 3c–f. In particular, the 1.27 M simulation (Figure 3e,f) is the best representation of reality, showing the typical asymmetry between the advancing and retreating sides. The typical crystallographic activity generated at low heat input conditions in FSW/FSP is shown in Figure 4a,b. Moreover, at these conditions, a nano-crystalline structure is generated, as it has been found experimentally in processes with a high deformation generated by friction [36]. However, in conditions where the heat input is higher, the generated crystallographic structure practically disappears (Figure 4c–f).
Table 1. Molecular dynamics, FEM and experimental FSW parameters, and Tmax calculated for aluminum and copper.
AuthorTechniquew (rpm)v (mm/s)Pin Radius (mm)v/wr (mm/rev)AtomsTmelt (K)Tmax (K)TmaxMD (K)
[12]FEM6.00 × 1023.30 × 1003.50 × 1009.4 × 10−2300 k660645
6.00 × 1026.60 × 1003.50 × 1001.9 × 10−1660609
1.20 × 1026.60 × 1003.50 × 1009.4 × 10−1660480
7.98 × 1019.90 × 1003.50 × 1002.1 × 100660445
1.20 × 1036.60 × 1003.50 × 1009.4 × 10−2660686
[21]MD6.00 × 10105.00 × 1041.80 × 10−62.8 × 10185 k1000721
6.00 × 10101.00 × 1051.80 × 10−65.6 × 1011000677
[22]6.00 × 10105.00 × 1042.45 × 10−62.0 × 10275 k660597
[37]Experimental2.00 × 1036.70 × 1002.00 × 1001.0 × 10−1---660679
[38]1.20 × 1033.00 × 1002.00 × 1007.5 × 10−2---660666
[39]4.50 × 1028.30 × 10−23.25 × 1003.4 × 10−3---660853
[40]6.00 × 1021.33 × 1012.00 × 1006.7 × 10−1---1000660
[41]1.20 × 1033.30 × 1012.50 × 1006.6 × 10−3--- 660687
This workMD6.00 × 10101.00 × 1051.20 × 10−58.3 × 100678 k660744
6.00 × 10111.00 × 1055.00 × 10−62.0 × 10127 k660996
6.00 × 10101.00 × 1041.20 × 10−58.3 × 10−1678 k/1.27 M660938
6.00 × 10111.00 × 1041.20 × 10−58.3 × 10−2678 k6601600
6.00 × 10101.00 × 1055.00 × 10−62.0 × 101“ (550 K)660935935
6.00 × 10101.00 × 1055.00 × 10−62.0 × 101“ (400 K)660807807
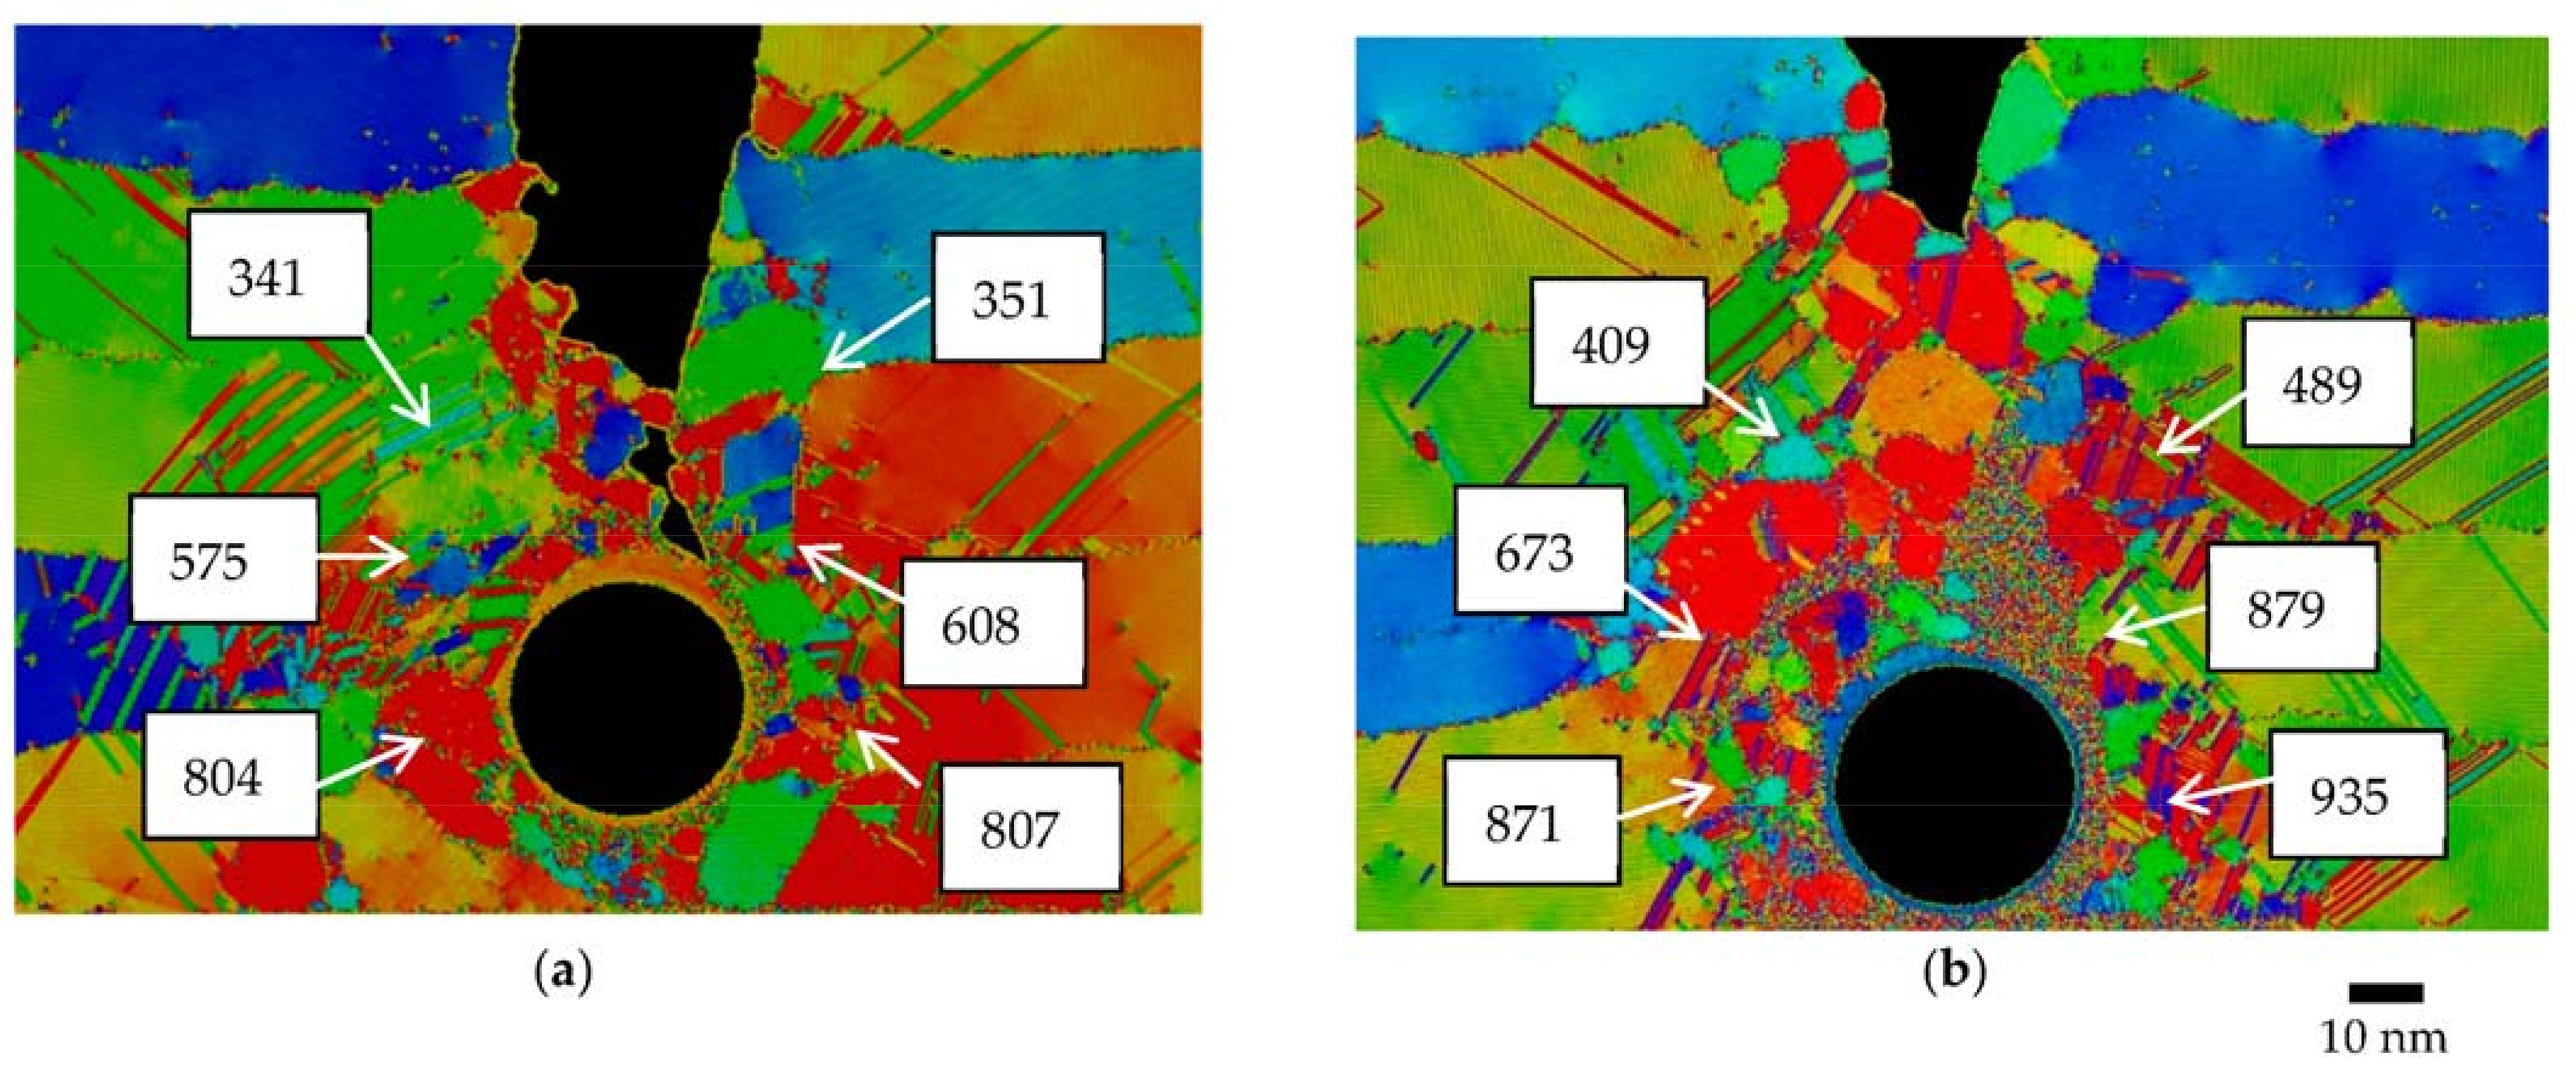
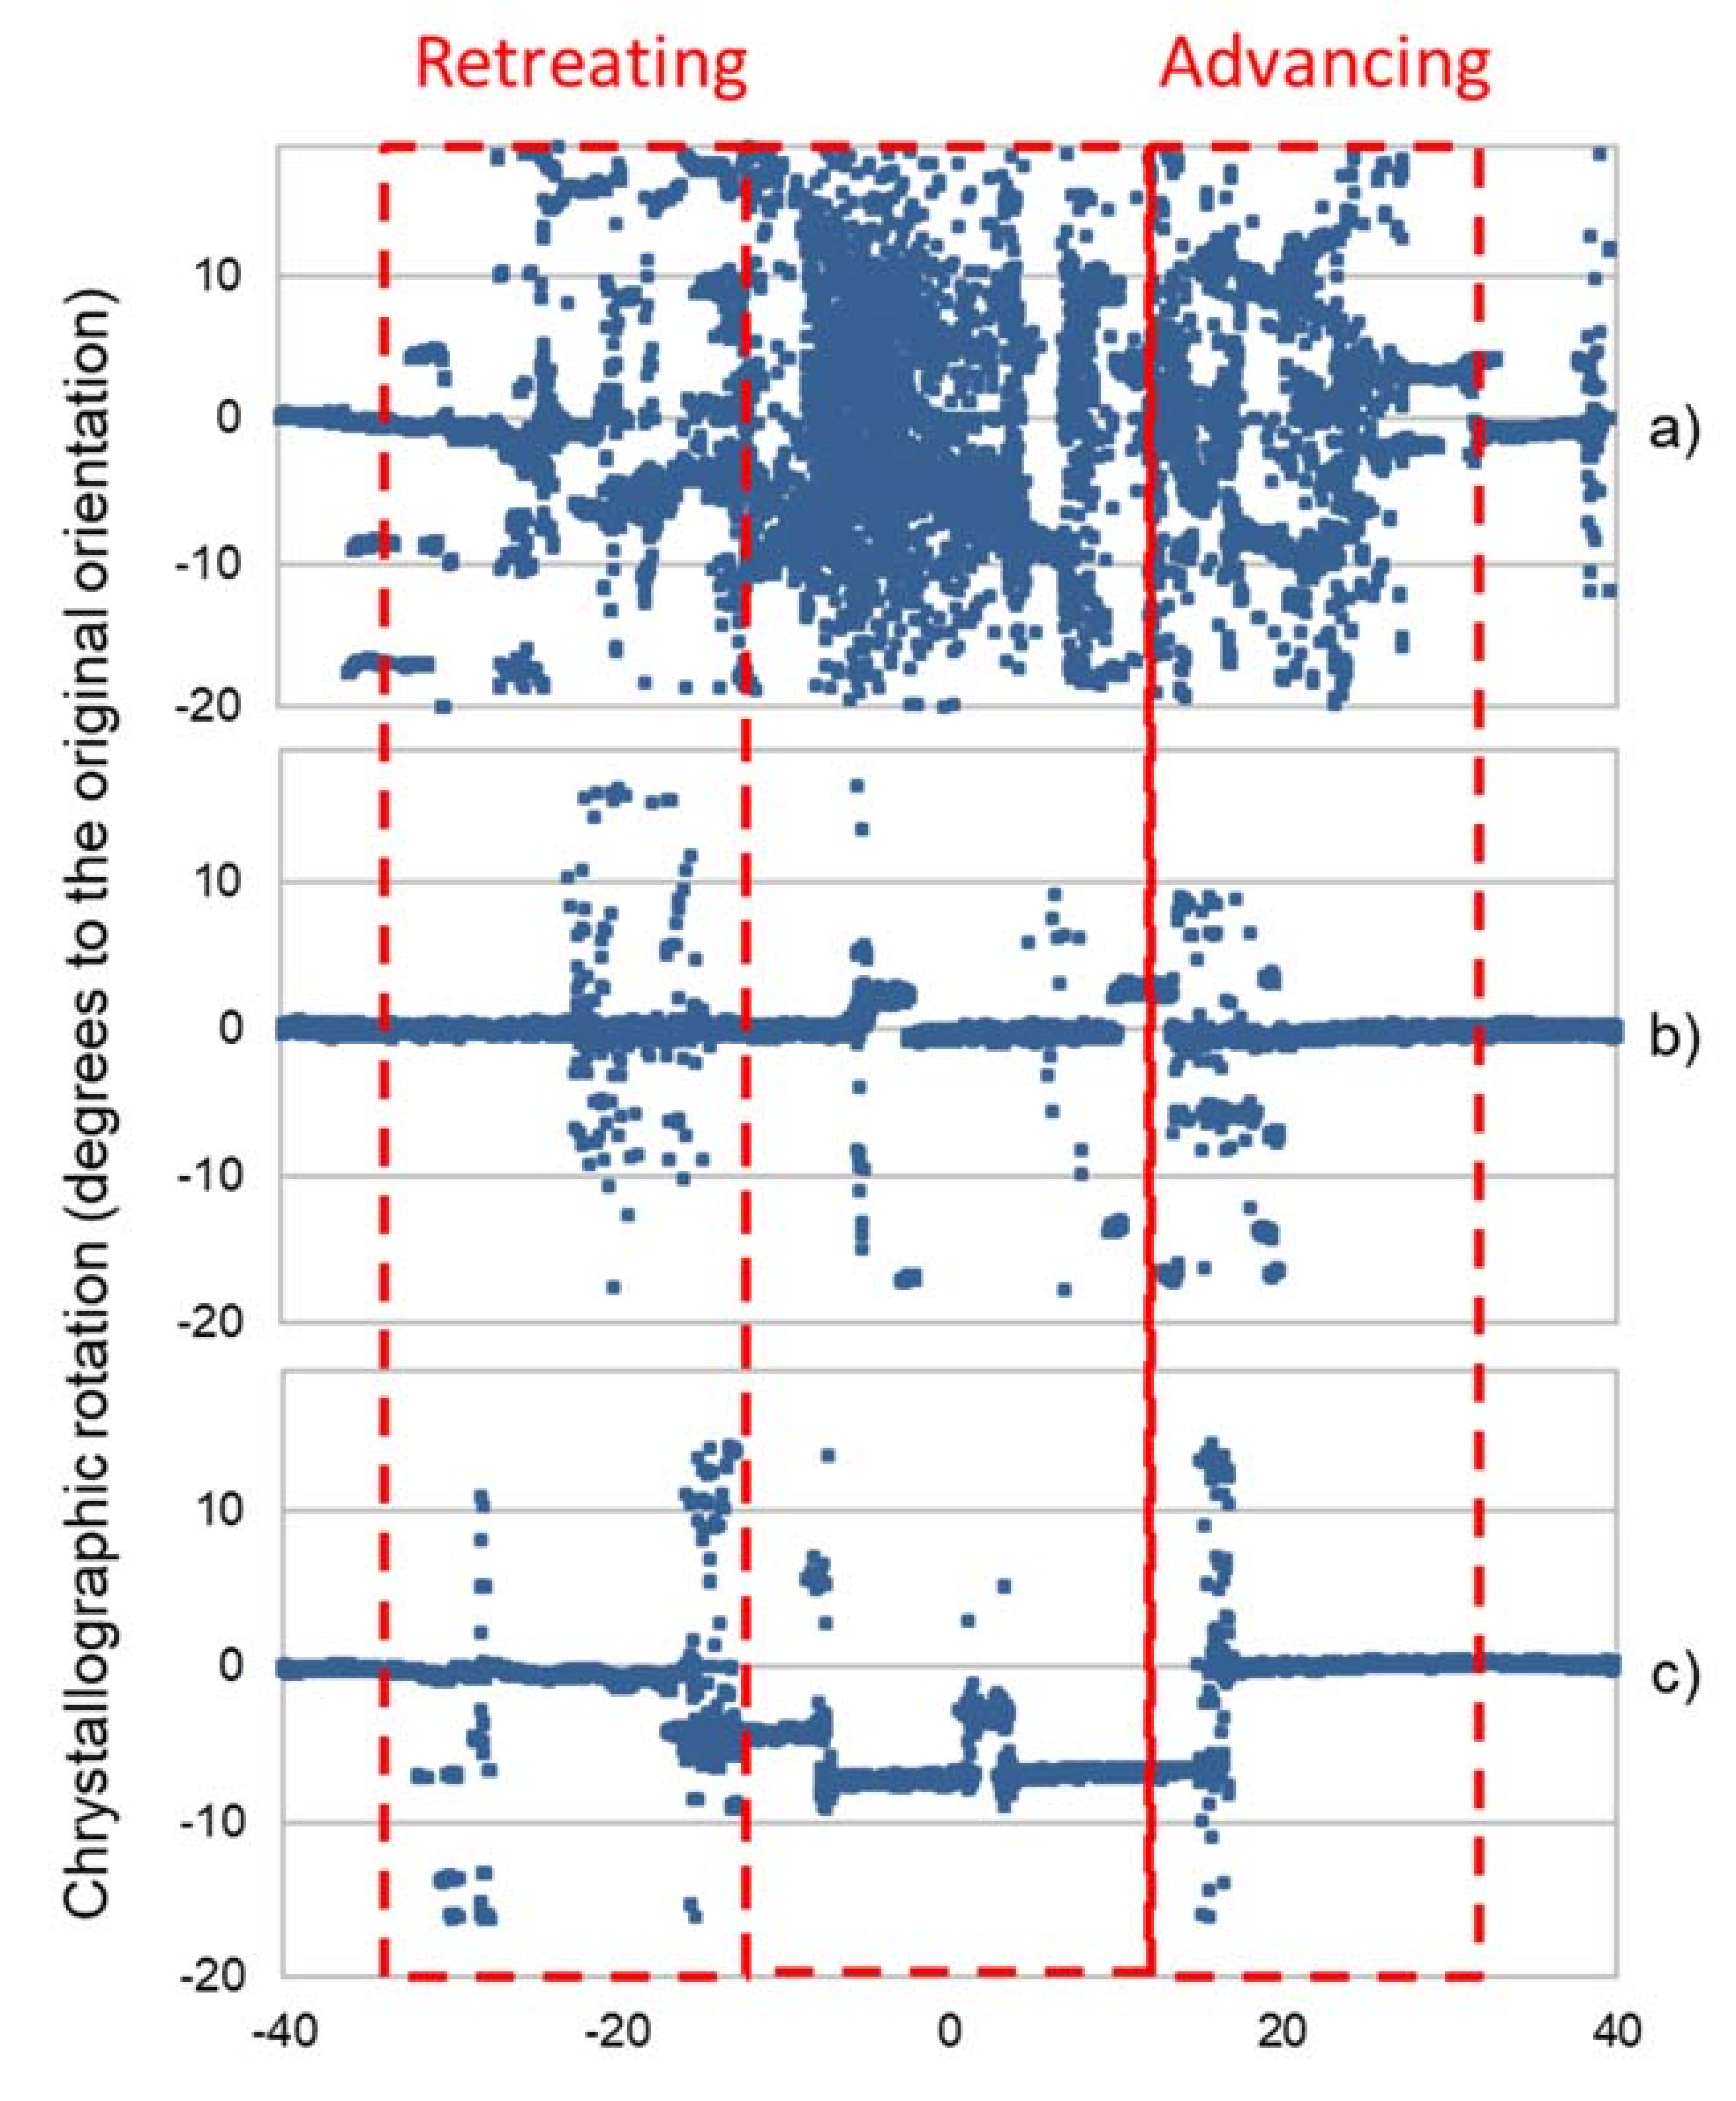
The average temperature used in the simulations also influences the microstructure around the pin as it is shown in Figure 5. At higher average temperature (Figure 5b), the disordered region spreads to longer distances from the pin. Figure 6 shows the misorientation, i.e., recrystallization degree, that the atoms from each initial grain have undergone after pin travel once the system is cool enough to represent the final microstructure.
The misorientation strongly depends on the normalized weld pitch (Figure 6).
In the process conditions providing the lowest temperature (Figure 6a), a very important increase of the misorientation is observed in the pin path during the process. In the adjacent zones, i.e., the retreating and advancing zones, considerable crystallographic activity is also observed. However, in the cases where the process temperature is high (Figure 6b,c), there is hardly any crystallographic activity. In the farthest areas on both sides of the pin, the orientation does not change under any of the conditions. In the FSW/FSP process, the lattice parameter of the material around the pin is also modified due to the defects introduced by the thermomechanical process that the material undergoes.

4. Discussion

It is well-known that thermal input is one of the aspects that most influences the behavior of the material during the FSW/FSP process [37]. The contribution of the thermal input is described by the weld pitch, i.e., the ratio of the rotational speed to the advancing speed. This parameter has been widely used to correlate process parameters with the characteristics of the resulting material or to calculate the maximum temperature generated in the process [35], among others. The usefulness of weld pitch to describe the FSW/FSP process is undeniable. However, it is necessary to consider the dimensions of the tool, mainly its radius, in order to compare the different processes properly. In the present work, the normalized weld pitch (v/wr) is defined in order to compare real and MD-simulated process conditions. In addition to its influence on the thermal input, the tool radius conditions the thickness of the material layer that remains adhered to the tool during the process. This layer of semi-solid material can be related to the presence of a layer of material that rotates in solidarity with the pin, as has been previously reported in the literature [38,39,40,41]. The thickness of this bonded layer is only a few atoms and is proportional to the tool radius regardless of the heat input (Figure 1). This layer of bonded material has a continuous nature as shown by its uniform color in Figure 1, and it does not correspond to any grain of the original material. Beyond the layer adhered to the pin, the material flows around the tool. In MD simulations of FSW processes, the material is represented by a quasi-2D system [21,22]. The shoulder is introduced into the simulation only to prevent movement of the atoms in the direction perpendicular to the plane of the material. In this sense, these simulations would adequately represent the stationary shoulder processes [42]. In the case of rotating shoulder welds, not considering the shoulder effect in the simulation is equivalent to modelling the flow of material at the bottom of the weld where there is little vertical flow [43]. Therefore, it is assumed that the 2D or quasi-2D description should describe reasonably well the flow of material during the FSW/FSP process in the region close to the pin and away from the shoulder. Defects associated with poor flow are most likely to occur in this region [44]. A key aspect in the MD simulations of the FSW/FSP process is that the dimensions of the simulated system are much smaller than those used in reality. For this reason, only the MD results in the vicinity of the pin are representative of the real process. In real systems, the normalized weld pitch, v/wr, is usually in the range 6.6 × 10⁻¹–6.6 × 10⁻³. [42,45,46]. The weld pitch used in the literature for MD simulations is in the range 2.8 × 101–2.0 × 10² [21,22], which corresponds to very low heat input conditions. In FEM simulations, the experimental plastic flow has been described by using v/wr in the range 1.0 × 10⁻¹–2.0 × 100 [12]. In this work, the flow generated in the MD simulation at v/wr = 8.3 × 10⁻¹ shows remarkable similarities (Figure 2c,d) with the results obtained by FEM at v/wr = 1.9 × 10⁻¹ in Figure 5 of [12]. The use of periodic boundary conditions of force along the pin axis permits the simulation of a thin plate considering planar flow and stresses. Hence, for the same number of atoms, the area of the work piece and pin increases by approximately one order of magnitude. In these conditions, it is possible to obtain a material flow similar to those obtained by N. Dialami et al. [11] with advanced FEM techniques. Under high heat input conditions (Figure 2e,f), the flow pattern is very similar to the one shown in Figure 1 of [22], which also corresponds to high heat input conditions. In relation to the effect of the smooth surface of the pin used here, previous experimental work has shown that the material flow with an unthreaded tool has the same features although not exactly the same pattern as the material flow using classical threaded tools [47]. This point is out of the scope of the present work, and it will be researched in a future study.
We have determined experimentally the relationship between the inverse of the weld pitch and the maximum temperature obtained in the FSW process [35]:
T m a x = 0.065 ( w 2 y ) 0.15 P 0.14 T m ,
where Tmax is the temperature at the pin surface and Tm the solidus temperature, both in °C, of the work piece material; ω is the rotating speed in rpm, v is the advancing speed in mm/s, and P is the normal pressure in MPa. A pressure of 10 MPa has been considered here, averaging the values used in [35] for real systems [12,42,43,44,45]. An average pressure of 50 MPa was calculated for the MD systems simulated in the present work. This value has been also used for MD works from the literature [21,22]. Tmax calculated for different welding conditions and materials is summarized in Table 1. The temperatures for the MD simulations [21,22], this work using normalized parameters and a high number of atoms are in good agreement to those calculated by Equation (1) in experimental and FEM works [12,42,43,44,45,46] despite the huge difference in system size (Table 1). These results provide a strong support for the use of normalized FSW/FSP parameters and the number of atoms around 1 M in their MD simulations. Moreover, the temperatures obtained in this work explain the presence of a semi-solid layer of material around the pin (Figure 3 and Figure 4) in the case of high heat input conditions.
The crystallography and the associated defects generated in the MD model, as shown in Figure 4, greatly depend on the heat input, i.e., the process temperature. This is an indication that a great variety of microstructures can be obtained depending on the FSW/FSP process parameters, as it has been shown in previous works [48]. Low heat input conditions form a rich microstructure (Figure 4a,b). This can be explained in the case of aluminum because of its preference for stacking-faulting, stabilization of partial dislocations, and crystal twinning in nano-grained structures [49]. Moreover, such structures as those shown in Figure 4a,b are also commonly observed experimentally at high-deformation-rate processes [50], leading to a very rich crystallography around the rotating layer. This zone is described in real FSW/FSP processes as the shear zone, also called the transition zone [45]. At an intermediate heat input (Figure 4c,d) most of the twinning disappears into regular grain boundaries. Moreover, the mean grain size increases and remains stable. The increase in grain size is due to the high mobility of grain boundaries in aluminum. A further increase in the heat input (Figure 4e,f) does not modify the mean grain size but increases twinning, which is uncommon in aluminum. This crystallographic effect is related to the confinement of the material in a thin plate (quasi 2D model) of very fine grains [48], leading to a grain subdivision phenomena based on dislocations and twins. The change in grain size is accompanied by an increase in misorientation, mainly due to the dynamic recrystallization process [51]. However, the aim of the present work is not to provide a specific size of the microstructure but to describe the main characteristics of the material around the tool during the FSW/FSP processes.
The pin travel produces a complete recrystallization of the material and a plastic deformation in the adjacent zones when the process temperature is well under the melting one, as seen in Figure 4a,b. Under these conditions, the advancing and retreating thermomechanical-affected zones are well-described in the MD simulations. The width of these zones obtained at low-temperature processes (Figure 4a,b) is similar to that of the pin diameter. These results are in line with those found experimentally [52]. If the temperature is close to the melting one, the new grains nucleate from the semi-solid phase so that the original seed grain orientation is maintained (Figure 4c–f). In addition, the region of semi-solid material around the pin is so large (Figure 4c–f) that it eliminates shear forces. This lack of shear forces minimizes the plastic flow around the pin and therefore prevents texture modification.
The system average temperature assumed in the present work influences the temperature in the material around the tool (Figure 5). Once an average temperature is imposed, the system balances the temperature generated in the tool with the temperature at the ends of the sample. This keeps the average temperature of the experiment constant. It is important to use an average temperature around 400 K for the FSW-MD simulations. Higher average temperatures generate temperatures around the tool that are close to the melting point. These temperatures have not been observed experimentally. In fact, maximum temperatures obtained by FSW are around 0.85 Tm in monolithic alloys [53,54,55].
In summary, the crystallographic analysis shows significant recrystallization and grain refinement depending on the heat input. This would indicate a mechanical origin of the material’s reordering, as indicated by the large number of nano-structures and twin boundaries in aluminum, which is a material prone to avoid them [45]. The generation of these crystallographic structures relay the existence of large strain-rate and temperature gradients, which promotes a refined structure (Figure 6).

5. Conclusions

The challenge of the microstructural design of the FSW/FSP process can be addressed by combining MD with other simulation techniques as atomistic ab initio calculations. The use of MD to simulate the FSW/FSP process must be based on the correlation microstructures obtained to process parameters. A proper microstructural description and its correlation with FSW/FSP process parameters by MD is only possible if a detailed plastic flow description of the material is obtained by MD. For a proper description of the material flow and microstructure by MD, some considerations have been established in the present work. We found that:
  • The molecular dynamics simulation technique adequately describes a material’s plastic flow during the FSW/FSP process if the pin size is large enough, i.e., >10 nm in aluminum;
  • The number of atoms in the system must be proportional to the pin diameter, as the system dimensions are around 4 times that of the pin diameter, to avoid edge effects and allow an adequate description of the material flow;
  • The advancing and rotating speeds must be normalized by the pin radius to obtain weld-pitch values equivalent to the heat input and temperatures typical of real processes;
  • The typical microstructural zones of the FSW/FSP materials and their crystallographic characteristics, namely grain size, texture, and lattice parameter (equivalent to residual stress), are well-correlated to the temperatures around the pin as calculated by MD simulations.
It is concluded that MD can be a relevant technique for future developments in FSW/FSP due to its significant advantages on microstructure analysis over other simulation techniques. Further studies are needed to establish a sound and proven methodology in different materials and experimental conditions.

Author Contributions

Conceptualization, R.F.; methodology, R.F. and B.M.; software, B.M.; validation, R.F. and B.M.; writing—original draft preparation, R.F.; writing—review and editing, R.F. and B.M.; funding acquisition, R.F. and B.M. All authors have read and agreed to the published version of the manuscript.

Funding

This research was funded by (R.F.) MINECO, Spain, and CAM, Madrid’s Community, for the financial support of Projects MAT2017-83825-C4-1-R and Y2018/NMT-4668 Micro-Stress-MAP-CM, respectively and (B.M.) the Basque government under the project Elkartek 2020 and from Spain (the project MDM-2016-0618 of the Marie de Maeztu Units of Excellence Program and the RETOS projects RTI2018-095463-B-C21 and RTI2018-095463-B-C22 Surfnanocut).

Data Availability Statement

Not applicable.

Acknowledgments

R.F. is grateful to MINECO, Spain, and CAM, Madrid’s Community, for the financial support of Projects MAT2017-83825-C4-1-R and Y2018/NMT-4668 Micro-Stress-MAP-CM, respectively. B.M-C. acknowledges financial support from the Basque government under the project Elkartek 2020 and from Spain (the project MDM-2016-0618 of the Marie de Maeztu Units of Excellence Program and the RETOS projects RTI2018-095463-B-C21 and RTI2018-095463-B-C22 Surfnanocut) for their funding of the research presented in this paper.

Conflicts of Interest

The authors declare no conflict of interest.

References

  1. Global Friction Stir Welding Machine Market, Forecast to 2026. Available online: www.fiormarkets.com (accessed on 1 September 2022).
  2. Xu, S.; Deng, X. Two-Dimensional Finite Element Simulation of Material Flow in the Friction Stir Welding Process. J. Manuf. Proc. 2004, 2, 125–133. [Google Scholar]
  3. Santiago, D.H.; Lombera, G.; Urquiza, S.; Cassanelli, A.; de Vedia, L.A. Influence of Welding Parameters and Post-weld Aging on Tensile Properties and Fracture Location of AA2139-T351 Friction-stir-welded Joints. Process. Mat. Res. 2004, 7, 569–574. [Google Scholar] [CrossRef] [Green Version]
  4. Colegrove, P.; Shercliff, H. CFD modelling of friction stir welding of thick plate 7449 aluminium alloy. Sci. Tech. Weld. Join 2006, 11, 429–441. [Google Scholar] [CrossRef]
  5. Derazkola, H.; Eyvazian, A.; Simchi, A. Modeling and experimental validation of material flow during FSW of polycarbonate. Mater. Today Commun. 2020, 22, 100796. [Google Scholar] [CrossRef]
  6. Mendes, N.; Loureiro, A.; Martins, C.; Neto, P.; Pires, J.N. Effect of friction stir welding parameters on morpholo-gy and strength of acrylonitrile butadiene styrene plate welds. Mater. Des. 2014, 58, 457–464. [Google Scholar] [CrossRef]
  7. Fernández, R.; González-Doncel, G.; Garcés, G.; Bruno, G. Fractional brownian motion of dislocations during creep deformation of metals. Mat. Sci. Eng. A 2020, 776, 139036. [Google Scholar] [CrossRef]
  8. Fernández, R.; Bokuchava, G.; Toda-Caraballo, I.; Bruno, G.; Turchenko, V.; Gorshkova, Y.; González-Doncel, G. Analysis of the Combined Strengthening Effect of Solute Atoms and Precipitates on Creep of Aluminum Alloys. Adv. Eng. Mater. 2020, 22, 1901355. [Google Scholar] [CrossRef]
  9. Kobelev, V. Some basic solutions for nonlinear creep. Int. J. Sol. Struct. 2014, 51, 3372–3381. [Google Scholar] [CrossRef] [Green Version]
  10. Dialami, N.; Chiumenti, M.; Cervera, M.; Segatori, A.; Osikowicz, W. Enhanced friction model for Friction Stir Welding (FSW) analysis: Simulation and experimental validation. Int. J. Mech. Sci. 2017, 133, 555–567. [Google Scholar] [CrossRef] [Green Version]
  11. Dialami, N.; Chiumenti, M.; Cervera, M.; de Saracibar, C.A. An apropos kinematic framework for the numerical modeling of friction stir welding. Comp. Struct 2013, 117, 48–57. [Google Scholar] [CrossRef]
  12. Dialami, N.; Cervera, M.; Chiumenti, M. A Solids Defect Formation and Material Flow in Friction Stir Welding. Eur. J. Mech. 2020, 80, 103912. [Google Scholar] [CrossRef]
  13. Dialami, N.; Cervera, M.; Chiumenti, M.; Segatori, A.; Osikowicz, W. Experimental validation of an FSW model with an enhanced friction law: Application to a threaded cylindrical pin tool. Metals 2017, 7, 1–14. [Google Scholar] [CrossRef] [Green Version]
  14. Meyghani, B.; Awang, M.; Wu, C.S. Finite element modeling of friction stir welding (FSW) on a complex curved plate. J. Adv. Join. Process. 2020, 1, 100007. [Google Scholar] [CrossRef]
  15. Reynolds, A.P. Join Visualization of Material Flow in Autogenous Friction Stir Welds. Sci. Tech. Weld. 2000, 5, 120–124. [Google Scholar] [CrossRef]
  16. Iqbal, M.P.; Tripathi, A.; Jain, R.; Mahto, R.P.; Pal, S.K.; Mandal, P. Numerical modelling of microstructure in friction stir welding of aluminium alloys. Int. J. Mech. Sci. 2020, 185, 105882. [Google Scholar] [CrossRef]
  17. Xiao, S.; Hu, R.; Li, Z.; Attarian, S.; Bjork, K.-M.; Lendasse, A. A machine-learning-enhanced hierarchical multiscale method for bridging from molecular dynamics to continua. Neural Comput. Appl. 2020, 32, 14359–14373. [Google Scholar] [CrossRef]
  18. Anand, P.P.G. Chattopadhyay, Computational Design of Microstructure. In Computational Approaches to Materials Design: Theoretical and Practical Aspects; Datta, S., Paulo Davim, J., Eds.; IGI Global: Hershey, PA, USA, 2016; pp. 61–100. [Google Scholar]
  19. Allen, M.P.; Tildesley, D.J. Computer Simulation of Liquids; Oxford University Press: Oxford, UK, 1989. [Google Scholar]
  20. Kwon, S.; Kim, H.; Pei, X.; Ko, H.; Park, H.; Bennewitz, R.; Caron, A. Effect of cooling rate on the structure and nanotribology of Ag–Cu nano-eutectic alloys. J Mater. Sci. 2019, 54, 9168–9184. [Google Scholar] [CrossRef]
  21. Dmitriev, A.I.; Kolubaev, E.A.; Nikonov, A.Y.; Rubstob, V.E.; Psakhie, S.G. Study patterns of microstructure formation during friction stir welding. In Proceedings of the Proc. XLII Int. Summer School–Conference APM (2014), St. Petersburg, Russia, 30 June–5 July 2014; pp. 10–16. [Google Scholar]
  22. Konovalenko, I.; Dmitriev, A.; Psakhie, S.; Kolubaev, E. Molecular dynamics simulation of welding and joining processes: An overview. Key Eng. Mat. 2016, 683, 626–631. [Google Scholar] [CrossRef]
  23. Yongchang, L.; Cemal, B. A multiscale modeling technique for bridging molecular dynamics with finite element method. J. Comp. Phys. 2013, 253, 64–85. [Google Scholar]
  24. Zhou, M. Series A: Mathematical, Physical and Engineering Sciences. Proc. Roy. Soc. Lon. 2003, 459, 2347–2392. [Google Scholar] [CrossRef]
  25. Goel, S.; Luo, X.; Agrawal, A.; Reuben, R. Diamond machining of silicon: A review of advances in molecular dynamics simulation. Int. J. Mach. Tools Manuf. 2015, 88, 131–164. [Google Scholar] [CrossRef] [Green Version]
  26. Jain, A.; McGaughey, A.J.H. Thermal transport by phonons and electrons in aluminum, silver, and gold from first principles. Phys. Rev. B 2016, 93, 081206. [Google Scholar] [CrossRef]
  27. Long, T.; Tang, W.; Reynolds, A.P. Join Process response parameter relationships in aluminium alloy friction stir welds. Sci. Tech. Weld. 2007, 12, 311–317. [Google Scholar] [CrossRef]
  28. Yan, J.; Sutton, M.A.; Reynolds, A.P. Process–structure–property relationships for nugget and heat affected zone regions of AA2524–T351 friction stir welds. Sci. Tech. Weld. Join. 2005, 10, 725–736. [Google Scholar] [CrossRef]
  29. Acharya, U.; Roy, B.S.; Saha, S.C. Torque and force perspectives on particle size and its effect on mechanical property of friction stir welded AA6092/17.5SiCp-T6 composite joints. J. Manuf. Proc. 2019, 38, 113–121. [Google Scholar] [CrossRef]
  30. Simar, A.; Lecomte-Beckers, J.; Pardoen, T.; Meester, B.D. Effect of boundary conditions and heat source distribution on temperature distribution in friction stir welding. Sci. Tech. Weld. Join. 2006, 11, 170–177. [Google Scholar] [CrossRef] [Green Version]
  31. Plimpton, S. Fast parallel algorithms for short-range molecular dynamics. J. Comp. Phys. 1995, 117, 1–19. [Google Scholar] [CrossRef] [Green Version]
  32. Stukowski, A. Visualization and analysis of atomistic simulation data with OVITO–the Open Visualization Tool. Model. Sim. Mater. Sci. Eng. 2010, 18, 015012. [Google Scholar] [CrossRef]
  33. Mendelev, M.; Kramer, M.; Becker, C.; Asta, M. Analysis of semi-empirical interatomic potentials appropriate for simulation of crystalline and liquid Al and Cu. Phil. Mag. 2008, 88, 1723–1750. [Google Scholar] [CrossRef]
  34. Finnis, M.W.; Sinclair, J.E. A simple empirical N-body potential for transition metals. Philos. Mag. A 1984, 50, 45–55. [Google Scholar] [CrossRef]
  35. Rasti, J. Study of the welding parameters effect on the tunnel void area during friction stir welding of 1060 aluminum alloy. Int. J. Adv. Manuf. Technol. 2018, 97, 2221–2230. [Google Scholar] [CrossRef]
  36. Ohsaki, S.; Hono, K.; Hidaka, H.; Takaki, S. Characterization of nanocrystalline ferrite produced by mechanical milling of pearlitic steel. Scr. Mater. 2005, 52, 271–276. [Google Scholar] [CrossRef]
  37. Laska, A.; Szkodo, M. Manufacturing Parameters, Materials, and Welds Properties of Butt Friction Stir Welded Joints–Overview. Materials 2020, 13, 4940. [Google Scholar] [CrossRef]
  38. Barbini, A.; Carstensen, J.; dos Santos, J.F. Influence of a non-rotating shoulder on heat generation, microstructure and mechanical properties of dissimilar AA2024/AA7050 FSW joints. J. Mater. Sci. Technol. 2018, 34, 119–127. [Google Scholar] [CrossRef]
  39. Colligan, K. Material Flow Behavior during Friction Stir Welding of Aluminum. Weld. J. 1999, 78, 229–237. [Google Scholar]
  40. Tamadon, A.; Pons, D.J.; Clucas, D. Structural Anatomy of Tunnel Void Defect in Bobbin Friction Stir Welding, Elucidated by the Analogue Modelling. Appl. Syst. Innov. 2020, 3, 2–15. [Google Scholar] [CrossRef] [Green Version]
  41. Ji, S.D.; Meng, X.C.; Liu, J.G.; Zhang, L.G.; Gao, S.S. Formation and mechanical properties of stationary shoulder friction stir welded 6005A-T6 aluminum alloy. Mater. Des. 2014, 62, 113–117. [Google Scholar] [CrossRef]
  42. Fernández, R.; Ibáñez, J.; Cioffi, F.; Verdera, D.; González-Doncel, G. Friction stir welding of 25%SiC/2124Al composite with optimal mechanical properties and minimal tool wear. Sci. Tech. Weld. Join. 2017, 22, 526–535. [Google Scholar] [CrossRef]
  43. Ouyang, J.; Kovacevic, R. Material Flow and Microstructure in the Friction Stir Butt Welds of the Same and Dissimilar Aluminum Alloys. J. Mat. Eng. Perf. 2002, 11, 51–63. [Google Scholar] [CrossRef]
  44. Guerra, M.; Schmidt, C.; McClure, J.; Murr, L.; Nunes, A. Flow patterns during friction stir welding. Mat. Char. 2003, 49, 95–101. [Google Scholar] [CrossRef] [Green Version]
  45. Schmidt, H.; Dickerson, T.; Hattel, J. Material flow in butt friction stir welds in AA2024-T3. Acta Mater. 2006, 54, 1199–1209. [Google Scholar] [CrossRef]
  46. Nandan, R.; Roy, G.; Lienert, T.; Debroy, T. Three-dimensional heat and material flow during friction stir welding of mild steel. Acta Mater. 2007, 55, 883–895. [Google Scholar] [CrossRef]
  47. Lorrain, O.; Favier, V.; Zahrouni, H.; Lawrjaniec, D. Understanding the material flow path of friction stir welding process using unthreaded tools. J. Mat. Proc. Tech. 2010, 210. [Google Scholar] [CrossRef]
  48. Mironov, S.; Sato, Y.; Kokawa, H. Applications of EBSD to Microstructural Control in Friction Stir Welding/Processing. In Electron Backscatter Diffraction in Materials Science; Schwartz, A., Kumar, M., Adams, B., Field, D., Eds.; Springer: Boston, MA, USA, 2009. [Google Scholar] [CrossRef]
  49. Chen, M.; Ma, E.; Hemker, K.; Sheng, H.; Wang, Y.; Cheng, X. Deformation Twinning in Nanocrystalline Aluminum. Science 2003, 300, 1275–1277. [Google Scholar] [CrossRef] [PubMed] [Green Version]
  50. Sun, R.; Li, L.; Zhu, Y.; Guo, W.; Peng, P.; Cong, B.; Sun, J.; Che, Z.; Li, B.; Guo, C.; et al. Microstructure, residual stress and tensile properties control of wire-arc additive manufactured 2319 aluminum alloy with laser shock peening. J. Alloys Comp. 2018, 747, 255–265. [Google Scholar] [CrossRef]
  51. Moradi, M.; Aval, H.; Jamaati, R.; Amirkhanlou, S.; Ji, S. Microstructure and texture evolution of friction stir welded dissimilar aluminum alloys: AA2024 and AA6061. J. Man. Proc. 2018, 32, 1–10. [Google Scholar] [CrossRef] [Green Version]
  52. Hoyos, E.; Montoya, Y.; Fernández, R.; González-Doncel, G. Approach to plastic deformation and strain rate in FSW process. Weld. World 2021, 65, 1519–1530. [Google Scholar] [CrossRef]
  53. Takayama, Y.; Akutsu, Y.; Choshiro, N.; Kato, H.; Watanabe, H. Temperature Measurement During Friction Stir Welding of Dissimilar Aluminum Alloys. The Japan Institute of Light Metals. In In Proceedings of the 12th International Conference on Aluminium Alloys, Yokohama, Japan, 5–9 September 2010; pp. 1829–1834. [Google Scholar]
  54. Mehta, M.; Arora, A.; DeTarasankar, A.; Debroy, T. Tool Geometry for Friction Stir Welding—Optimum Shoulder Diameter. Met. Mat. Trans. A 2011, 42, 2716–2722. [Google Scholar] [CrossRef]
  55. Siddiqui, M.A.; Jafri, S.; Alam, S. Validation of Maximum Temperature during Friction Stir Welding of Butt Joint of Aluminium Alloy by using HyperWorks. Mat. Sci. Int. J. Eng. Res. Technol. 2015, 4, 817–821. [Google Scholar]
Figure 1. Atomic configurations after welding at 0.01 (ps−1)/100 (m/s) for a pin radius of (a) 12 nm (normalized weld pitch of 8.3 × 100 and Tmax of 744 K) and (b) (normalized weld pitch of 2.0 × 101 and Tmax of 935 K) (b) 5 nm. The colors indicate the initial location of the atoms except black, which represents air. Red arrows indicate the location of defects (pores). White arrows indicate the advancing and rotating directions. The color of the atoms refers to their initial position prior to the weld except for the circle of material around the pin. The colors in their atoms’ initial positions are shown in Figure 2 with the following sequence: blue, violet, green, orange, and pink.
Jmmp 07 00013 g001
Figure 2. Atomic configurations after welding for (a,b) 0.01 (ps−1)/100 (m/s) (weld pitch of 8.3 × 100 and Tmax of 744 K) and (c,d) 0.01 (ps−1)/10 (m/s) (normalized weld pitch of 8.3 × 10⁻¹ and Tmax of 938 K) (e,f) 0.1 (ps−1)/10 (m/s) at a mean temperature of 550 K (normalized weld pitch of 8.3 × 10⁻² and Tmax of 1600 K) and (g,h) the same conditions (a) at a mean temperature of 650 K. White arrows indicate the advancing and rotating directions. The colors indicate the initial location of the atoms except black, which represents air/pin.
Jmmp 07 00013 g002aJmmp 07 00013 g002b
Figure 3. Atomic configurations after welding positions at 0.01 (ps−1)/100 (m/s): (a,b) 27 k atoms, (c,d) 678 k atoms, and (e,f) 1.27 M atoms. The colors indicate the crystallographic orientation of the atom clusters except for black, which represents air/pin. White arrows indicate the advancing and rotating directions.
Jmmp 07 00013 g003aJmmp 07 00013 g003b
Figure 4. Crystallography after welding for 1.27 M atoms at (a,b) 0.01 (ps−1)/100 (m/s), (c,d) 0.01 (ps−1)/10 (m/s), and (e,f) 0.1 (ps−1)/10 (m/s) at a mean temperature of 550 K. The colors indicate the orientation of the atoms except black, which represents air/pin. Picture (a) depicts remarkable nano-twinning attributed to nano-crystalline aluminum and extreme strain rates, with this plasticity mechanism being less relevant in (c,e). White arrows indicate the advancing and rotating directions.
Jmmp 07 00013 g004aJmmp 07 00013 g004b
Figure 5. Temperatures (in K) around the pin determined by MD (a) at an average temperature of 400 K and (b) at an average temperature of 550 K for 1.27 M atoms at 0.01 (ps−1)/100 (m/s). The advancing and rotating directions are the same as in Figure 1, Figure 2, Figure 3 and Figure 4.
Jmmp 07 00013 g005
Figure 6. Reassembly of the microstructure after welding as atoms rotate from the original orientation particles for v/wr = (a) 8.33 × 101, (b) 8.33 × 100, and (c) 8.33 × 10⁻¹. The rotation (degrees) is represented for a cross-section along the welded material after system cooling.
Jmmp 07 00013 g006
Disclaimer/Publisher’s Note: The statements, opinions and data contained in all publications are solely those of the individual author(s) and contributor(s) and not of MDPI and/or the editor(s). MDPI and/or the editor(s) disclaim responsibility for any injury to people or property resulting from any ideas, methods, instructions or products referred to in the content.