Highlights
- Enhanced lubricity of biobased Metal Working Fluids (MWF) over mineral oil emulsions to machine titanium at low speed
- Method of soft synchronous tapping to evaluate MWFs on machine tool
- Method to calculate GHG Greenhouse Gas emission of MWFs
- Significant reduction in Greenhouse Gas emission for fully synthetic MWFs for cleaner manufacturing
Abstract
The paper discusses an instrumented tapping test method using a CNC machine tool to compare the lubricity of MWFs by cutting threads in a Ti-6Al-4V alloy at low speed. The method uses a spiral flute tap size typical of industrial practice. A soft synchronous tap holder and spindle mounted dynamometer were incorporated on the machine to measure torque and thrust force. The tapping test method was demonstrated on three groups of MWFs that were commercially available and classified by ASTM E2523-13:2018. The method developed stable results free of chip clogging in tool flutes which could otherwise mask their comparative lubricity. The fully synthetic (FS) group displayed the best lubricity and within this group the FS from renewables (FS-bio) was the best overall. The method was shown to be effective in mitigating biasing effects on lubricity performance due to the generous tool chamfer angle tolerance and was practical and economical to implement. The significance of the results is discussed enabling an understanding of friction effects in tapping using a soft synchronous tap holder. A life cycle assessment of each MWF group found total Greenhouse Gas emitted from the FS group was 17% of the hydrocarbon group whilst FS-bio emitted just 7%.
1. Introduction
Consumption of Ti-6Al-4V alloy exceeds 50% of the total of all other titanium alloys [] finding use in transport, medical, petrochemical, and other sectors. Cutting fluids (CFs) are essential in machining; providing lubrication to reduce friction and cool the tool and workpiece to enhance productivity, product quality, tool life and extend the life of the CNC asset [,]. Approximately 16% of the total machining cost of a product is attributed to the CF life cycle [,,]. According to Debnath et al. [] the cost of disposal can be up to four times the purchase cost because CFs are not biodegradable and require expensive after use treatments. Worldwide consumption of MWFs is predicted to reach 3.66 Megatons (3.66 trillion litres) by 2025 [].
Thread tapping using a benchtop instrumented device [] adopting industry standards ASTM D5619-00:2017 and Nordtest NT MECH 039 continues to be a widely practiced method to establish the relative lubricity of CFs to reduce friction between tool and workpiece. Although these devices have been proven with conventional materials, e.g., steel and aluminium alloys, they lack the low speed and torque needed to cut threads with larger taps in hard alloys such as Ti-6Al-4V alloy. An alternative approach taken in this paper uses an instrumented CNC machine tool and set up that simulates field performance to cut threads using industrial tap sizes in hard Ti-6Al-4V at low speed. In a broader context according to Pawar and Joshi [] small threaded holes of high accuracy are required for assembling components and threading is done almost exclusively by tapping. Thread tapping is often a final machining stage and tool breakage on a high value product incurs significant cost [,]. Without effective lubrication high strength titanium alloys such as Ti-6Al-4V are more prone to tool breakage due to seizure of tool in the workpiece [,,,,].
According to Hong et al. [] the machinability of Ti-6Al-4V is more difficult than many steels and other alloys because it retains its high strength at elevated temperature to 427 °C which generates a high cutting force and wear rates on the tool. Its high chemical reactivity leads to chip welding on the cutting tool, which can quickly result in tool failure by chipping or tap breakage [,]. For machining Titanium alloys CFs containing phosphates have worked well due to their anti-welding and cooling properties according to Ezugwu [] whilst emulsion oils with extreme-pressure additives gave reasonable results. For machining at low cutting velocity (Vc) such as tapping, CFs with chlorine compounds and hydrocarbons or sulfurized oils were found effective in reducing friction and chip welding. A chlorine additive in the CF was found to develop a surface film with thickness up 150 μm. Under REACH [] many additives such as boric acid, amines, sulphur, and chlorine, are no longer permitted in modern CFs.
A comprehensive review by Grzesik and Rech [] on friction (μ) in machining many different materials, with different MWFs, and tool coatings, found μ increased rapidly at lower sliding speed in the range examined from 5 to 300 m/min. Therefore, for machining at low speed straight oils and heavy duty mineral oil emulsions were preferred [,,] where good lubricity is essential. Emulsion concentrates when diluted in water for use, can be tailored to an application, e.g., containing from 3 to 10% with balance water according to Brinksmeier et al. [].
Published works on the machinability of titanium alloys including Ti-6Al-4V is extensive [,,,,,,]. Despite this there are very few published works on machinability of Ti-6Al-4V at low cutting speed ~1 m/min and no published work on soft synchronous tapping in this alloy. Of the few published works Zhang and Chen [] found the cause of high tapping torque in rigid tapping of Ti-6Al-4V was work surface spring back and high relief face friction between tool and workpiece.
In published work on cutting threads with taps in other materials a tap holding device was studied by Doyle and Dean [] to reduce the thrust force to improve dimensional accuracy of the thread form. Wan et al. [] found synchronisation error between the machine spindle and feed motor had a significant effect on thrust force. In the work of Pereira et al. [] a floating tap holding device was used for tapping SAE 1045 steel, and forward cutting torque (Tf) reduced to just 25% of that obtained in rigid tapping. Cao and Sutherland [] determined the contact pressure between tool and workpiece in rigid thread tapping can exceed 800 MPa. According to Ridenour [] a high thrust force reduces thread quality leading to thread form error, accelerating tap wear, causing chipping of tap cutting edges and tap breakage, and increasing surface roughness. Lorenz [] used a straight flute bottoming tap to investigate tap geometry and found cutting speed (Vc) and tap chamfer angle (κ) were the main factors affecting the Tf.
Tapping holes that do not break through the workpiece so called blind holes require helical (spiral) flutes as displayed in Figure 1 to reverse the chip flow direction and evacuate the chips back up the flutes in the opposing direction to the tap feed motion. Spiral flute taps have a larger κ than straight flute taps which results in fewer cutting edges and a larger depth of cut (DOC) with each cutting edge; therefore, thicker chips are produced than with straight flute taps and each cutting edge is more highly loaded. Steininger et al. [] used a spiral flute tap and oil in water emulsion lubricant for rigid tapping blind hole in AlSi9Cu3 aluminium alloy. It was found the forward thrust force (Ff) increased 9-fold as the tap decelerated at the end of the forward stroke, whilst Tf displayed only a fractional increase (~30%). The aluminium alloy had a strong tendency to BUE with poor chip transport leading to chip clogging in the flutes.

Figure 1.
Spiral fluted tap with chamfer angle (κ), rake angle on cutting edge (γ) and helix angle of flute (θ).
In tapping harder alloys such as austenitic stainless steel with a spiral flute tap at low Vc (~3 m/min) Reiter et al. [] observed a strong tendency for work piece material to cold weld and BUE on the tool with difficult chip transport from the cutting zone. The latter feature leads to chip clogging in the flutes of the tool. In the same work it was estimated the tool temperature using an emulsion lubricant did not to exceed 100 °C after 56 threads were produced with a single tap. With a 7-fold increase in Vc Tanaka et al. [] found the tool edge temperature can reach 400 °C in tapping stainless steel. In conclusion the review findings suggest at low Vc < 3 m/min, lubricity is the main requirement of the CF. Moreover, many alloys suffer from difficult chip evacuation using spiral flute taps that leads to clogging of flutes, and results in a chip packing force that significantly increases torque and thrust force. Rigid tapping not only increases thrust force and torque but reduces thread quality and accelerates tap wear.
Classification of MWFs
Classification of MWFs in Europe and USA are covered, respectively, by DIN 51385:2013 and ASTM E2523-13:2018. The former defines their composition as either oil-based or water-based whilst the latter identifies three groups in Table 1 as HDE, SS and FS. Each group in the ASTM classification depends on the type of oil used and its content in the neat concentrate before dilution.

Table 1.
Classification of MWF groups.
Published works [,,,,,,,,,,,] covering technical, environment and H&S attributes of each CF group classified in accord with ASTM E2523-13:2018 were reviewed and some key performance measures identified in Table 2. FS-bio group is identified as a separate column. From the literature a relative ranking was assigned to identify the benefits of each CF group in the emulsified form on a scale 1 to 3 against each measure.
Table 2.
Relative ranking of each CF group with Excellent = 3, Good = 2 and Baseline = 1.
Emulsions perform well at higher cutting speed because water has twice the specific heat of oil. HDE and SS have been shown to display higher lubricity than FS []. Furthermore cooling effectiveness of FS displays improved performance at higher cutting speeds [] due to the higher water content in the neat concentrate. New FS-bio formulations were shown to display good lubricity in a range of materials [,,,,] but the evidence to date suggests mineral oil formulations are better suited to machine hard alloys at low Vc. Modern machine-tools are designed for flexible manufacturing and a CF in the sump must be capable of use over a wide range of cutting processes, tools and materials at both low and high speed and feed rates. It is however conceivable the neat concentration of emulsion CF when diluted in water for use could be adapted in real time to service specific duty cycles.
A second aim of the paper is to apply the tapping test method to determine the relative lubricity of the FS CF group and a bio-based emulsion to machine hard Ti-6Al-4V at low Vc and compare technical performance to SS and HDE groups using the same alloy. In the final section of the paper the environmental impacts of the three CF groups are discussed and the method of calculation described to compute their GHG emissions using a case study.
2. Experimental Methodology
The method uses a spiral fluted tap size typical of industrial practice and tool supplier recommended speeds and feeds. A soft synchronous tap holder and spindle mounted dynamometer were incorporated on the machine tool to measure torque and thrust force. The tapping test method was applied to three groups of CFs (HDE, SS, FS), according to ASTM E2523-13:2018, to compare their relative lubricity. Within each group 3 different supplier’s CFs were selected. Therefore, 9 different CFs were tested together with a reference CF (CFref) alongside each. All CFs were commercially available products with a safety data sheet. Within the FS group, one CF was formulated from renewables (FS-bio). Established performance measures [] such as Tapping Torque Test efficiency, in accordance with ASTM D5619-00:2017 and Nordtest NT MECH 039, were used initially to compare CF lubricity.
2.1. Materials and Workpiece
Seven Ti-6Al-4V wrought alloy workpieces were obtained, each measuring (mm) 168 × 72 × 20. Room temperature tensile testing was performed on 5 test pieces taken from one workpiece in accord with ASTM E8/E8m-13a, using a Shimadzu AG-X test machine with 100 kN loadcell and contact extensometer Epsilon 3542. The mechanical properties of the alloy, in Table 3, displayed high consistency.
Table 3.
Tensile properties of Ti-6Al-4V workpiece.
Brinell hardness testing was also performed on all seven workpieces in accord with BS EN ISO 6503:2014 Brinell (1 mm 30 kg). The hardness was consistent across all seven workpiece materials from 318 to 338 BHN with an average value 329 BHN.
2.2. Layout of Blind Holes in Each Workpiece Block
A 1/4″unf tap was selected for tapping blind holes in the workpiece. Each workpiece was precision drilled with 160 blind holes (5.5 mm dia. × 15.8 mm deep), in an array of 20 columns by 8 rows using a solid carbide twist drill (SD203A-5.5-21-6RI-M). Hole spacing between centres was 8.0 mm. In each workpiece the holes were drilled in the direction of rows as shown in Figure 2. The direction of thread tapping for each CF group was in the column direction. Recommended drilling parameters with through-spindle coolant were used with drill bit replacement after 112 holes.
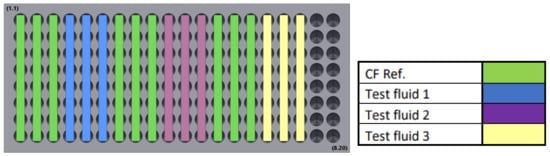
Figure 2.
Arrangement of blind holes in each workpiece and allocation of CF groups.
The ASME standard for the upper and lower limit of hole diameter for the tap class and size used in this study was, respectively (mm) 5.460 and 5.560, which is a range of 100 μm. A higher precision on hole diameter was chosen as a control measure, respectively 5.500- and 5.520-mm diameter. Drilled holes were measured using a DeMEET CMM at 4 points on the circumference and at two depths. All drilled holes were within 5.500- and 5.510-mm diameter.
2.3. Tap Tool and Process Parameters
The spiral flute tap tool for cutting a thread in Ti-6Al-4V was a UNF ¼-28 tap supplied by Walter to DIN 2184-1 with three flutes, each with 15° right hand helix. The tap tool is made from high-speed steel and uncoated. The tap dimensions are shown in Figure 3. The thread pitch was 0.907 mm with tolerance class 3B. The chamfer angle on the leading edge was a standard class C tolerance defined in DIN 2197 of 2 to 3 thread pitches.

Figure 3.
PARADUR TI-234164-UNF1/4″ tap tool.
Machine tapping was programmed to 9 mm thread depth in each hole using spindle speed (N) of 120 rpm. The tap chamfer angle κ was determined by the number of thread pitches to cut the full thread. The number of cutting edges for a tap with 2 and 3 thread pitches on the chamfer length and 3 flutes is, respectively, 6 and 9, and the corresponding nominal κ is 13.2° and 8.88°. The high precision feature of the tap is the thread form on the parallel guide length that does not cut the thread but stabilises the tap as it cuts the thread deeper into the hole. With N = 120 rpm, Vc = 2.39 m/min at the nominal tap outer diameter of 6.35 mm.
2.4. Machine and Instrumentation
The experiments were performed using a precision CNC machining centre (DMG Evo40) and set up shown in Figure 4. A Kistler 9170A rotating dynamometer (RCD) to enable direct measurement of torque and thrust was secured to the machine spindle by an HSK63A taper adaptor. The stator was fastened to the CNC machine and allowed for adjustment. A soft synchronous tap holder (Emuge Softsynchro-1) was secured to the RCD by a 20 mm diameter precision collect with an ER32 locking nut. The tap tool was secured to the soft synchronous holder using a 7 mm diameter collet with a (ER20) locking nut. The soft synchronous holder was set to minimum compensation and the unsupported stick out length of the tap tool was 50 mm. A load versus speed test was performed under representative tap loading with machine spindle speed set to N = 120 rpm and measured using a TKRT 10 Optical Tachometer and the spindle speed error was below 1%.
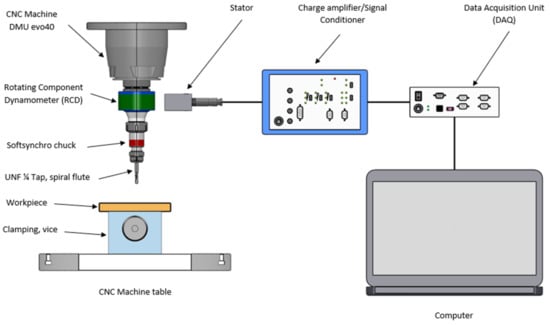
Figure 4.
Experimental set up with instrumentation on CNC machine tool.
The dynamometer stator (type 9170A) was connected to the charge amplifier and signal conditioning instrument (Kistler 5236B) with cable type 1500A95. The data acquisition unit (DAQ) was connected to the PC by a serial cable type 1700A111A2 D-Sub/RS-232C. The Input Mode selected in the DAQ software was Single Ended (64 ch). The range 2 setting was selected for the RCD (0 to 45 Nm) with low pass frequency (300 Hz). The calibration certificate provided by Kistler for the RCD confirms linearity of <=+/−0.04% (0.018 Nm for range 2 setting). Triggering was initiated using the PC with a 20 s recording time for each tapped hole.
2.5. Preparation of Cutting Fluids
Nine commercially available CFs from different suppliers were selected and divided into 3 groups according to the ASTM E2523-13:2018 as shown in Table 4. The neat concentrate of each CF was diluted in a ratio of 1 to 10 parts water. Demineralized water (EN ISO 3685:1995 Grade 3) supplied from a single source was used. A portable optical refractometer (RHB-32 range) was used to measure Brix.
Table 4.
Category and description of CFs.
2.6. Workpiece and Tool Preparation
The workpiece and the taps were cleaned in an ultrasonic bath for 10 min, then rinsed in demineralised water and thoroughly dried on the day of testing. The temperature and relative humidity, together with Brix%, were recorded on the day of testing each CF. The Brix is shown in Table 4. The temperature recorded for all tests was between 23.0 and 25.7 °C, and humidity between 39 and 62%.
2.7. Method of Tapping
Taps from the same batch were selected to perform a test on a CF alongside the CFref in the same workpiece. For each CF up to 4 holes were tapped using the same tool. This was repeated twice with each CF, but the tap was replaced with a new one in each repeat trial. The CFref was tapped alongside each of the nine CFs, and this required a total of 6 taps for each CF. On the day of testing, the neat CF was diluted, and a volume of 0.37 mL was introduced to each hole using a syringe, to prevent air bubbles from forming.
3. Results and Discussion
Figure 5a shows a typical torque and thrust force result obtained for tapping one hole. In the forward stroke the engagement of the tap chamfer in the hole displays a steady increase in torque until the chamfer length is fully engaged. Thereafter torque stabilises in the forward stroke as the tap parallel (guide) length fully engages which was typical of all results obtained. The spindle forward engagement decelerates to zero on completing the forward stroke, and the reverse stroke begins. At the start of the reverse stroke (point X) the chip is sheared causing a small peak in negative torque as the tap starts its disengagement. In the forward stroke, torque measured by the instrument was positive and in the reverse stroke, it was negative. Thrust force measured by the instrument however was positive in both forward and reverse stroke, which is compressive, suggesting push back in the reverse stroke on the thread flanks. The total cycle time for engagement and reversal of tap was near 7 s. Torque and thrust deceleration displayed in Figure 5b at the end of the forward stroke were, respectively 0.27 g and 0.02 g. Acceleration at start of the reverse phase increased slightly. Torque rise time in Figure 5a is approximately 1.5 s. The tap chamfer length which varies in accord with the class C manufacturing tolerance of between 2 and 3 thread pitches could influence the torque rise time and the stable torque attained. For example, with 2 full thread pitches on the tap chamfer length (2nthread) the predicted torque rise time is 2.60nthread/N = 1 s and for 3nthread the rise time = 1.5 s. The soft synchronous tap holder set with minimum compensation can allow up to +/−0.5 mm float in tension and compression.

Figure 5.
Typical test result filtered at 300 Hz with characterisation of performance measures Tf, Tr, Ff and Fr (a), and deceleration at the end of forward stroke (b).
Average plateau values in accord with ASTM D5619 were derived for torque in the tap forward stroke (Tf) with time window 1.6 s for averaging to the left of point X. Average values for reverse torque (Tr), forward (Ff) and reverse thrust force (Fr) were derived in the same way using time window 1.6 s either side of point X, shown in Figure 5a. For all results obtained Tf > abs (Tr) and similarly Ff > Fr.
A new tap was used at the start of tapping a sequence of 4 holes and a set of typical torque results using CFref is displayed in Figure 6. Tf stabilises quickly at hole 2 and Tr at hole 4. Hole 4 was selected to compare all Tf and Tr results. So that a sample size of 3 results were obtained for each CF, 9 results for each CF group, and 27 results for CFref. Chip clogging of flutes was not observed by inspection of the raw signal records of each tapped hole which in all cases presented stable results, and by visual inspection of each tap on completing a threading cycle.
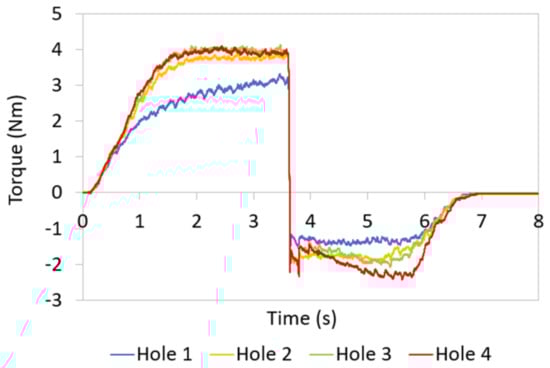
Figure 6.
Set of typical torque results obtained for tapping a sequence of 4 holes using CFref.
3.1. Relative Lubricity of CFs
The Tf and Ff results of each CF identified by product and group are displayed in Figure 7. The CFref tested alongside each product is also displayed. Despite the rigor over the preparations and procedures, variability is present, nevertheless there is clear differentiation in performance among the CF products and groups. The raw data record of each test result was examined for outliers, but the typical performance trends were in accord with Figure 7b, justifying the approach using a single result from each column of 4 tapped holes.
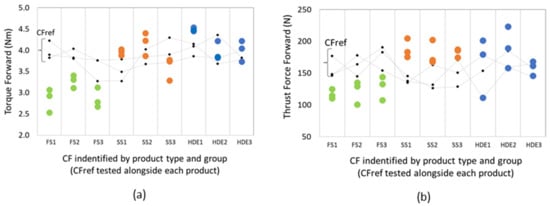
Figure 7.
Tf (a) and Ff (b) obtained for each CF product with group identified.
Each data point displayed in Figure 7 was obtained using a different tap. Taps were supplied with four different batch codes. Therefore, single factor one-way ANOVA was performed on Tf using the 27 CFref results with significance α = 0.05 to test the hypothesis using taps from the four different batches would not lead to biasing. The p-value > 0.05 confirmed biasing was unlikely so that all taps in this study were assumed to originate from the same population. With this, the distribution of Tf for CFref was found to be normal with a 95% confidence interval and the overall variability at one standard deviation (σ) was determined at 0.26 Nm. The variation in Tf for CFref displayed in Figure 7 could be attributed to the tool class C chamfer tolerance, resulting in the number of cutting edges varying between 6 and 9 which influences DOC. For higher accuracy, it is necessary to increase sample size for each CF, thereby increasing the number of columns and taps. For the current study accuracy was sufficient because differentiation was displayed for at least one of the 3 CF groups tested.
Relative lubricity [] of each CF (and CF group) was ranked using Tapping Torque Test efficiency (TTTeff) given in Equation (1).
Tf (CF) is the average for a product (or group) and Tf (CFref) is the average obtained for the reference CF tested alongside each product (or group). The higher the TTTeff, the better the relative lubricity of the tested CF.
In Figure 8a the FS group displays significantly enhanced lubricity with TTTeff = 128%. Within the FS group, FS1 which is the FS-bio displays the best overall lubricity with TTTeff = 140%. Replacing the denominator in Equation (1) with Ff (CF) and the numerator with Ff (CFref), Figure 8b displays the Tapping Thrust Force efficiency (TTFeff) and similarly the FS group displays enhanced lubricity with TTFeff = 135%. Thrust forces displayed in Figure 8b were in the range 100 to 220 N using a ¼” UNF tap. In stable rigid tapping [] using a smaller M3 straight flute tap in Ti-6Al-4V the measured torque was under half that recorded in this paper, however thrust force nearly doubled at 380 N. Consistent with the findings of Wan et al. [] the benefit of soft synchronous tapping of Ti-6Al-4V to reduce thrust force is confirmed, and TTFeff is also confirmed as a sensitive measure of CF lubricity.
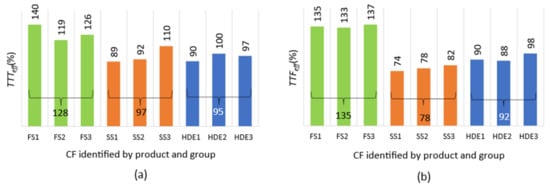
Figure 8.
TTTeff (a) and TTFeff (b) obtained for each CF product with each group identified.
3.2. New Performance Measure to Characterise CF Lubricity
Correlation between performance measures is displayed in Figure 9 by plotting the results of all tested CFs which were characterised in accord with Figure 5 and each CF group identified. A strong linear relationship exists between Tr and Tf with R2 = 0.82 and Tr/Tf = 0.5 as shown in Figure 9a. Similarly, between Fr and Ff with R2 = 0.87 and Fr/Ff = 0.45 at higher thrust force but decreasing to 0.2 at lower thrust force as shown in Figure 9b. A weaker linear relationship between Ff and Tf is displayed in Figure 9c, and there was no linear relationship between Fr and Tr.

Figure 9.
Relationship between performance measures in soft synchronous tapping (a–c), and friction between the tool cutting edge rake face and chip (d).
The significance of these experimental results enables an understanding of friction effects in the tapping process. Since there is no cutting on the tap reverse stroke with Tr/Tf = 0.5 and a strong linear correlation between Tr and Tf, flank friction (μfl) on the tap guide length exerts a significant influence on energy dissipation in the forward stoke. In rigid tapping the same alloy the cause of high tapping torque was found to be associated with work surface spring back resulting in high contact pressure on the relief edge and friction on the guide length [,]. With Tr/Tf = 0.5 the balance of energy dissipation must be associated with chip forming plastic deformation (ε) and friction at each cutting-edge rake face (μra) and relief edge (μre) on the chamfer of the tool. With improved lubricity of the CF due to the coupling between μra and ε as μra reduces the shear plane angle increases. This reduces cut chip thickness which decreases cutting force and cutting torque. Assuming μre is small compared to μra on the forward stroke μra in Equation (2).
D = outer tap diameter of tap guide length
Using Equation (2), Figure 9d displays a marginal reduction in μra for the FS group. Because of the variability any discernible trend across the different CFs and CF groups is masked by the scatter. Alternatively we can use the equation Ff = k.Tf shown in Figure 9c fitted to the results which assumes the origin is zero shown by hashed line to obtain k = 42.3, so that μra = D.k/2 = 0.127. This is the same as the average obtained across all the results in Figure 9d suggesting μra determined from Equation (2) is in fact constant because Ff and Tf are both changing in direct proportion to each other. The high variability in Figure 9d is due to small changes in Ff and Tf which serve to amplify error. With improved lubricity of a CF, it was expected that μra would reduce. One reason why μra is constant is due to the simple method of characterising each experimental torque and thrust force result. In this regard average plateau values of Tf, Tr, Ff and Fr are derived from the raw filtered data, and this simplifies the characteristics of each curve obtained; for example, the rate of increase of Tf and Ff before the tap chamfer has fully engaged the workpiece shown as the rise time in Figure 5a is ignored. It is also noted that both Tr and Fr do not display a plateau unlike Tf in Figure 5a. Moreover, on further examination of Figure 9c the relationship between Ff and Tf appears to display a slight positive curvature, suggesting Ff increases at a faster rate than Tf resulting in a higher μra with increasing Tf.
The work of Cao and Sutherland [] showed only fractional change in μ obtained from tribology tests of different CFs despite having a more significant effect on torque and thrust force for the same CFs under rigid tapping with good chip evacuation. However, chip clogging in the flutes was present in most results causing large jumps in torque and thrust force, which was identified as an additional chip packing load. On the other hand, the findings of Wan et al. [] in rigid tapping Ti-6Al-4V using a smaller tap size suggests Equation (2) with much smaller Tf and much higher Ff could develop a higher μra, even accounting for the smaller D value. With a higher feed force relative to cutting force thicker chips would be expected which could cause chip clogging in the flutes. Reducing μra in cutting threads would minimise the likelihood of chip clogging in the flutes that can impair thread quality and reduce tool life.
Reducing the feed force to near zero could extend tool life and maintain thread quality. Therefore, in repeated industrial processes that use thread tapping and a soft synchronous tap holder to cut threads there is scope to optimise the settings of the tap holder and calibrate the device to a specific set of process conditions using the method discussed in this paper. The results in Figure 9 suggest two measures are needed to characterise the relative lubricity of CFs in soft synchronous tapping, either Tf or Tr, and either Ff or Fr. If the aim is to determine the effectiveness of a CF on reducing flank friction, then Tr and Fr could be preferred performance measures. Therefore, in Equation (1) replacing Tf in TTTeff with Tr, and similarly Ff in TTFeff with Fr.
In outlook, there is further scope to reduce or eliminate friction energy in machining using a more effective CF. Recent developments with nano-engineered CFs for grinding [], drilling [], and broaching [] was found to display significant benefit. In broaching AISI 1045 steel which is a low-speed machining process Ni et al. [] found cutting force was reduced by up to 74% with pure sesame oil compared to conventional broaching oil. With the addition of CuO nanoparticles to the same sesame oil in the optimum concentration, cutting force was further reduced by up to 69% compared to pure sesame oil.
4. Impact of CF on GHG Emissions
The four stages of the CF life cycle are the raw material of concentrate, machining process, CF management during use and end of life disposal []. An HDE concentrate with mineral oil base stock carries high GHG emission associated with mining extraction, and production of the neat concentrate. A FS contains significantly higher water content in the neat concentrate. FS-Bio is extracted from renewables such as plant-based vegetable oil or ester feedstocks, which captures carbon from the environment through sequestration. Energy to produce a neat CF concentrate however emits GHG. Management of CF during use requires removal of tramp oil, sludge, and maintenance of the CF to within the specifications required of the machining process and the machine tool. When the CF has reached the end of its useful life the three most common methods of disposal are evaporation, membrane filtration and chemical treatment []. Initially the water is separated and conditioned by a water treatment process []. FS formulated with vegetable-based concentrate is biodegradable, however SS and HDE are not. The latter CF groups can be incinerated to recover energy for bio-mass fuel [].
A comparative life cycle assessment of the GHG emissions of each CF group was modelled for 3 stages of the CF life cycle; these are the mineral extraction and production of the neat concentrate (stage 1), machine tapping power (P) dissipated (stage 2) and end of life disposal (stage 4). The GHG emissions were calculated by multiplying the activity in the life cycle, e.g., machine tapping power, to the emissions factor per unit mass in Equation (3).
GHG (kg CO2eq) = activity × emissions factor
The GHG emission factor is weighted using the Global Warming Potential (GWP) index which incorporates CO2, CH4 and N2O so that GHG is quoted as kg CO2eq accounting for gases that contribute to global warming. Table 5 displays the water and oil content of each CF group [] used to determine GHG emissions factors for extraction and production of the neat concentrate and its disposal. The brackets identify the typical ranges of the mineral oil content.
Table 5.
Composition of neat concentrate of each CF group.
The neat CF concentrate is diluted for use at 1 in 10-part water content, although this can vary in industrial practice between 3 to 10% []. The emission factor for each CF group diluted for use and its disposal was determined using SimaPro, Ecoinvent3 [] and ELCD [] databases with results displayed in Table 6.
Table 6.
Emission factors determined for each CF group activity.
For this case study, it was assumed the machine tool is operational 24 h × 7 days × 1 year, which is 8760 h of machining time and serves to provide an upper bound of the GHG emissions arising from the machining power consumed. It was also assumed the 600 L coolant concentrate is replaced annually. The cutting tool and chip waste streams were not included in the calculation. Using the Tf and Tr results obtained for each CF group the GHG emission for tapping power (Tf + Tr) × ω was multiplied by the electricity emission factor 0.253 kg CO2eq/kWh [].
Using Equation (3) the calculated carbon equivalent emission per annum for machine power dissipated is displayed in Figure 10a. Due to the improved lubricity of the FS group, it displays appreciably lower GHG emission at (kg CO2eq per annum) 126 compared with 273 and 292, respectively, for the SS and HDE groups.
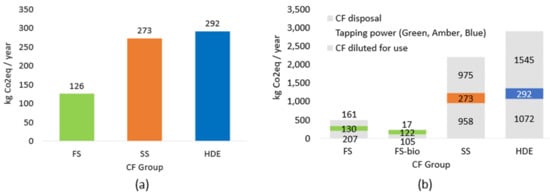
Figure 10.
Annual GHG emission from machine tapping power (a) and comparison of annual carbon equivalent emission for the CF diluted for use, machine tapping power and end of life disposal (b).
Figure 10b displays the GHG emitted from the CF groups over the three life cycle stages modelled. The FS group displays appreciably lower total GHG emission at (kg CO2eq per annum) 498 compared with 2208 and 2908, respectively, for the SS and HDE groups. The FS group displays significantly lower emission for the life cycle stages 1 and 4 than the SS and HDE groups. There is further environmental benefit in switching from FS to FS-Bio, with GHG emission reducing by half from 498 to 244 kg CO2eq per annum due to its biodegradability [].
5. Conclusions
The paper has demonstrated a method to appraise CFs in machining Ti-6Al-4V at low speed using thread tapping as a simple and economic way to compare their lubricity to reduce friction between tool and workpiece. A soft synchronous tap holder and a spiral flute tap size comparable to that used in industry was important because smaller taps are more prone to chip clogging in the flutes, which increases torque and thrust force and masks differences when comparing CF performance. Existing methods require tapping of many holes in softer alloys to test just one cutting fluid with a single tap. The method in this paper used 3 new taps and 4 holes per tap. Torque and thrust were obtained from the 4th hole, so the method attempted to average out any bias from a tap tool with a generous chamfer angle tolerance. With this approach the preparation of the workpieces may not require the high level of precision described in this paper.
In comparing the technical performance of the three CF groups the main findings are:
- Torque and thrust results confirm the FS group has significantly higher lubricity (TTTeff = 128%) over the SS and HDE groups (TTTeff, respectively, 97% and 95%). Within the FS group FS-bio displayed the highest overall lubricity (TTTeff = 140%).
- Soft synchronous machine tapping displayed significant benefit in reducing Tapping Thrust Force (TTF) compared to results obtained in the literature for rigid tapping the same alloy. Comparing the emulsion CFs tested in this paper the best result was the FS group with TTFeff = 135%, with TTFeff, respectively, for the SS and HDE groups 78% and 92%. The finding suggests TTFeff is a sensitive measure of CF lubricity.
- Flank friction on the tap guide length accounts for 50% of the total energy dissipated in cutting the thread.
Comparing the environmental impact of CFs:
- Life cycle assessment of the machining power consumed per annum established the GHG emitted from the FS group was less than half the SS and HDE groups.
- Aggregating mineral extraction and production with dilution of CF for use, end-of-life disposal and power dissipated annually in machining, GHG emission was significantly reduced for the FS group. Total GHG emitted annually from the FS group was just 17% of the HDE group whilst FS-bio displayed a significant reduction over the FS group as a whole emitting just 7% GHG relative to the HDE group.
- GHG emitted from power consumption in machining for the SS and HDE groups was only a tiny fraction of the total GHG emitted over the CF life cycle. Whilst FS group and FS-bio displayed the reverse effect and serves to emphasize the important role of CF lubricity in reducing GHG emissions.
Author Contributions
Conceptualization, P.W.; Data curation, F.B.; Formal analysis, P.W., F.B., H.V., A.M. and J.M.; Funding acquisition, P.W.; Investigation, P.W., W.C., M.P., S.H., A.S., A.M. and J.M.; Methodology, P.W., U.G., M.B., A.S., A.M. and J.M.; Project administration, P.W.; Supervision, P.W. and J.M.; Validation, A.S. and A.M.; Writing—original draft, P.W., F.B., W.C., H.V., U.G., Y.L. and M.R.; Writing—review and editing, P.W., W.C., H.V., U.G., M.P., J.C., Y.L., S.H., M.B., A.S., A.M. and J.M. All authors have read and agreed to the published version of the manuscript.
Funding
Rolls-Royce plc (UK) for funding this project [CFA 915591]. University of Derby College of Science and Engineering for funding the development of this paper.
Institutional Review Board Statement
Not Applicable.
Informed Consent Statement
Not Applicable.
Data Availability Statement
The authors confirm that the data and material supporting the findings of this work are available within the article.
Acknowledgments
The support of Senior Administrator, Lyn Rodney from the University of Derby is acknowledged.
Conflicts of Interest
The authors declare no conflict of interest.
References
- Rahman, M.F. Stress and Strain Distributions during Machining of Ti-6Al-4V at Ambient and Cryogenic Temperatures. Master’s Thesis, University of Windsor, Windsor, ON, Canada, 2014. [Google Scholar]
- Bierla, A.; Fromentin, G.; Martin, J.-M.; Le Mogne, T.; Genet, N. Tribological aspect of lubrication in form tapping of high-strength steel. Lubr. Sci. 2008, 20, 269–281. [Google Scholar] [CrossRef]
- Belluco, W.; De Chiffre, L. Surface integrity and part accuracy in reaming and tapping stainless steel with new vegetable based cutting oils. Tribol. Int. 2002, 35, 865–870. [Google Scholar] [CrossRef]
- Abdalla, H.S.; Baines, W.; McIntyre, G.; Slade, C. Development of novel sustainable neat-oil metal working fluids for stainless steel and titanium alloy machining. Part 1. Formulation development. Int. J. Adv. Manuf. Technol. 2006, 34, 21–33. [Google Scholar] [CrossRef]
- Lawal, S.A.; Choudhury, I.A.; Nukman, Y. Application of vegetable oil-based metalworking fluids in machining ferrous metals—A review. Int. J. Mach. Tools Manuf. 2012, 52, 1–12. [Google Scholar] [CrossRef]
- Debnath, S.; Reddy, M.M.; Yi, Q.S. Environmental friendly cutting fluids and cooling techniques in machining: A review. J. Clean. Prod. 2014, 83, 33–47. [Google Scholar] [CrossRef]
- GlobeNewswire. Metalworking Fluids–Worldwide Market Outlook to 2025. 2019. Available online: https://www.globenewswire.com/news-release/2019/04/25/1809472/0/en/Metalworking-Fluids-Worldwide-Market-Outlook-to-2025-Anticipated-to-Reach-3-655-Kilotons-in-Terms-of-Volume.html (accessed on 28 January 2022).
- Yang, Y.; Guo, S.; Si, L.; Liu, T.; Dai, Y.; Yan, C.; Zhang, C. Investigation of a new water-based cutting fluid for machining of titanium alloys. J. Manuf. Process. 2021, 71, 398–406. [Google Scholar] [CrossRef]
- Pawar, S.; Joshi, S.S. Experimental analysis of axial and torsional vibrations assisted tapping of titanium alloy. J. Manuf. Process. 2016, 22, 7–20. [Google Scholar] [CrossRef]
- Boyer, R.R. An overview on the use of titanium in the aerospace industry. Mater. Sci. Eng. A 1996, 213, 103–114. [Google Scholar] [CrossRef]
- Ezugwu, E.O.; Wang, Z.M. Titanium alloys and their machinability. J. Mater. Process. Technol. 1997, 68, 262–274. [Google Scholar] [CrossRef]
- Patel, H.J.; Patel, B.P.; Patel, S.M. A Review on Thread Tapping Operation and Parametric Study. Int. J. Eng. Res. Appl. 2012, 2, 109–113. [Google Scholar]
- Radovan, P.; Kokotović, B. Prediction of thrust force and torque in tapping operations using computer simulation. FME Trans. 2006, 34, 1–5. [Google Scholar]
- Hong, H.; Riga, A.T.; Gahoon, J.M.; Scott, C.G. Machinability of steels and titanium alloys under lubrication. Wear 1993, 162–164, 34–39. [Google Scholar] [CrossRef]
- Eylon, D.; Fujishiro, S.; Froes, F.H. Titanium Alloys for High Temperature Applications—A Review. High Temp. Mater. Process. 1984, 6, 81–92. [Google Scholar] [CrossRef]
- Machado, A.R.; Wallbank, J. Machining of Titanium and its Alloys—A Review. Proc. Inst. Mech. Eng. Part B J. Eng. Manuf. 1990, 204, 53–60. [Google Scholar] [CrossRef]
- Health and Safety Executive. UK Registration, Evaluation, Authorisation & Restriction of Chemicals (REACH). Health and Safety Executive Website. 2015. Available online: https://www.hse.gov.uk/reach/ (accessed on 30 November 2022).
- Grzesik, W.; Rech, J. Influence of machining conditions on friction in metal cutting process–A review. Mechanik 2019, 92, 242–248. [Google Scholar] [CrossRef]
- JTM Products. Straight Oils for Cutting & Grinding. 2018. Available online: https://www.koolrite.com/pdfs/White-Paper-Oil-Based-Metalworking-Fluids.pdf (accessed on 30 November 2022).
- Shaikh, M.B.N.; Ali, M. Turning of steels under various cooling and lubrication techniques: A review of literature, sustainability aspects, and future scope. Eng. Res. Express 2021, 3, 042001. [Google Scholar] [CrossRef]
- Brinksmeier, E.; Meyer, D.; Huesmann-Cordes, A.; Herrmann, C. Metalworking fluids—Mechanisms and performance. CIRP Ann. 2015, 64, 605–628. [Google Scholar] [CrossRef]
- Yang, X.; Liu, C.R. Machining Titanium and Its Alloys. Mach. Sci. Technol. 1999, 3, 107–139. [Google Scholar] [CrossRef]
- Zhang, D.-Y.; Chen, D.-C. Relief-face friction in vibration tapping. Int. J. Mech. Sci. 1998, 40, 1209–1222. [Google Scholar] [CrossRef]
- Doyle, E.D.; Dean, S.K. Effect of axial forces on dimensional accuracy during tapping. Int. J. Mach. Tool Des. Res. 1974, 14, 325–333. [Google Scholar] [CrossRef]
- Wan, M.; Ma, Y.-C.; Feng, J.; Zhang, W.-H. Mechanics of tapping process with emphasis on measurement of feed error and estimation of its induced indentation forces. Int. J. Mach. Tools Manuf. 2017, 114, 8–20. [Google Scholar] [CrossRef]
- Pereira, I.C.; Pinto Mapa, L.D.P.; de Barros, T.N.; Fortes, R.C.; da Silva, M.B.; Guimarães, G.P. Dynamic Behavior of Tapping Axial Force. J. Vib. Eng. Technol. 2021, 9, 1499–1509. [Google Scholar] [CrossRef]
- Cao, T.; Sutherland, J.W. Investigation of thread tapping load characteristics through mechanistics modeling and experimentation. Int. J. Mach. Tools Manuf. 2002, 42, 1527–1538. [Google Scholar] [CrossRef]
- Ridenour, D. Speed Tapping. Cutting Tool Engineering Website. 1998. Available online: https://www.ctemag.com/news/articles/speed-tapping (accessed on 5 July 2022).
- Lorenz, G. On Tapping Torque and Tap Geometry. CIRP Ann. 1980, 29, 1–4. [Google Scholar] [CrossRef]
- Steininger, A.; Siller, A.; Bleicher, F. Investigations Regarding Process Stability Aspects in Thread Tapping Al-Si Alloys. Procedia Eng. 2015, 100, 1124–1132. [Google Scholar] [CrossRef]
- Reiter, A.E.; Brunner, B.; Ante, M.; Rechberger, J. Investigation of several PVD coatings for blind hole tapping in austenitic stainless steel. Surf. Coat. Technol. 2006, 200, 5532–5541. [Google Scholar] [CrossRef]
- Tanaka, R.; Yamazaki, S.; Hosokawa, A.; Furumoto, T.; Ueda, T.; Okada, M. Analysis of Cutting Behavior during Tapping and Measurement of Tool Edge Temperature Measured by a Two-Color Pyrometer. J. Adv. Mech. Des. Syst. Manuf. 2013, 7, 115–124. [Google Scholar] [CrossRef][Green Version]
- Benedicto, E.; Carou, D.; Rubio, E.M. Technical, Economic and Environmental Review of the Lubrication/Cooling Systems Used in Machining Processes. Procedia Eng. 2017, 184, 99–116. [Google Scholar] [CrossRef]
- Shashidhara, Y.M.; Jayaram, S.R. Vegetable oils as a potential cutting fluid—An evolution. Tribol. Int. 2010, 43, 1073–1081. [Google Scholar] [CrossRef]
- García-Martínez, E.; Miguel, V.; Martínez-Martínez, A.; Manjabacas, M.C.; Coello, J. Sustainable Lubrication Methods for the Machining of Titanium Alloys: An Overview. Materials 2019, 12, 3852. [Google Scholar] [CrossRef]
- Meier, L. Developing Metalworking Fluids for Titanium Cutting. Ph.D. Thesis, Swiss Federal Institute of Technology in Zurich, Zurich, Switzerland, 2020. [Google Scholar]
- Mangiaterra, M. Lubricants Impact on Cutting Forces Lubricants Impact on Cutting Forces. Master’s Thesis, KTH Royal Institute of Technology, Stockholm, Sweden, 2018. [Google Scholar]
- Sen, B.; Mia, M.; Krolczyk, G.M.; Mandal, U.K.; Mondal, S.P. Eco-Friendly Cutting Fluids in Minimum Quantity Lubrication Assisted Machining: A Review on the Perception of Sustainable Manufacturing. Int. J. Precis. Eng. Manuf. Green Technol. 2021, 8, 249–280. [Google Scholar] [CrossRef]
- Revuru, R.S.; Posinasetti, N.R.; Ramana, V.; Vsn, V.R. Application of cutting fluids in machining of titanium alloys—A review. Int. J. Adv. Manuf. Technol. 2017, 91, 2477–2498. [Google Scholar] [CrossRef]
- Wickramasinghe, K.C.; Sasahara, H.; Rahim, E.A.; Perera, G.I.P. Green Metalworking Fluids for sustainable machining applications: A review. J. Clean. Prod. 2020, 257, 120552. [Google Scholar] [CrossRef]
- Somashekaraiah, R.; Gnanadhas, D.P.; Kailas, S.V.; Chakravortty, D. Eco-Friendly, Non-Toxic Cutting Fluid for Sustainable Manufacturing and Machining Processes. Tribol. Online 2016, 11, 556–567. [Google Scholar] [CrossRef]
- Lee, C.-M.; Choi, Y.-H.; Ha, J.-H.; Woo, W.-S. Eco-friendly technology for recycling of cutting fluids and metal chips: A review. Int. J. Precis. Eng. Manuf. Green Technol. 2017, 4, 457–468. [Google Scholar] [CrossRef]
- Pereira, I.C.; Vianello, P.I.; Boing, D.; Guimarães, G.; da Silva, M.B. An approach to torque and temperature thread by thread on tapping. Int. J. Adv. Manuf. Technol. 2020, 106, 4891–4901. [Google Scholar] [CrossRef]
- CRP MECCANICA. Titanium Ti-6Al-4V (Grade 5), Annealed AMS 4928 AMS 4911. 2021. Available online: https://www.crpmeccanica.com/PDF/machining-titanium-ti-6al-4v-annealed-ams-4928-sheet.pdf (accessed on 30 November 2022).
- Demmerling, A.L.; Söffker, D. Improved examination and test procedure of tapping torque tests according to ASTM D5619 using coated forming taps and water-mixed metalworking fluids. Tribol. Int. 2019, 145, 106151. [Google Scholar] [CrossRef]
- Zhang, J.; Li, C.; Zhang, Y.; Yang, M.; Jia, D.; Liu, G.; Hou, Y.; Li, R.; Zhang, N.; Wu, Q.; et al. Experimental assessment of an environmentally friendly grinding process using nanofluid minimum quantity lubrication with cryogenic air. J. Clean. Prod. 2018, 193, 236–248. [Google Scholar] [CrossRef]
- Yi, S.; Li, G.; Ding, S.; Mo, J. Performance and mechanisms of graphene oxide suspended cutting fluid in the drilling of titanium alloy Ti-6Al-4V. J. Manuf. Process. 2017, 29, 182–193. [Google Scholar] [CrossRef]
- Ni, J.; Cui, Z.; He, L.; Yang, Y.; Sang, Z.; Rahman, M.M. Reinforced lubrication of vegetable oils with nano-particle additives in broaching. J. Manuf. Process. 2021, 70, 518–528. [Google Scholar] [CrossRef]
- Sheng, P.S.; Oberwalleney, S. Life-Cycle Planning of Cutting Fluids—A Review. J. Manuf. Sci. Eng. 1997, 119, 791–800. [Google Scholar] [CrossRef]
- Busca, G.T.M. Treatment of Semi-synthetic Metalworking Fluids: Membrane Filtration and Bioremediation. Ph.D. Thesis, University of Nottingham, Nottingham, UK, 2004. [Google Scholar]
- Chipasa, K. Best Practice Guide for the Disposal of Water-Mix Metalworking Fluids; United Kingdom Lubricants Association: Buckinghamshire, UK, 2015. [Google Scholar]
- Byers, J.P. Metalworking Fluids, 3rd ed.; Byers, J.P., Ed.; CRC Press: Boca Raton, FL, USA, 2018. [Google Scholar]
- Wernet, G.; Bauer, C.; Steubing, B.; Reinhard, J.; Moreno-Ruiz, E.; Weidema, B. The ecoinvent database version 3 (part I): Overview and methodology. Int. J. Life Cycle Assess. 2016, 21, 1218–1230. [Google Scholar] [CrossRef]
- European Commission. European Platform on Life Cycle Assessment. European Commission Website. Available online: https://eplca.jrc.ec.europa.eu/ (accessed on 30 November 2022).
- Department for Business, Energy & Industrial Strategy, UK Government. Greenhouse Gas Reporting: Conversion Factors 2020. UK Government Website. Available online: https://www.gov.uk/government/publications/greenhouse-gas-reporting-conversion-factors-2020 (accessed on 30 November 2022).
- William-Olsson, P. Comparative LCA between Bio-Based and Petroleum-Based Lubricants. Master’s Thesis, KTH Royal Institute of Technology, Stockholm, Sweden, 2020. [Google Scholar]
Publisher’s Note: MDPI stays neutral with regard to jurisdictional claims in published maps and institutional affiliations. |
© 2022 by the authors. Licensee MDPI, Basel, Switzerland. This article is an open access article distributed under the terms and conditions of the Creative Commons Attribution (CC BY) license (https://creativecommons.org/licenses/by/4.0/).