Article

Tool Condition Monitoring Using Machine Tool Spindle Electric Current and Multiscale Analysis while Milling Steel Alloy

by
Maryam Jamshidi
1,*,
Jean-François Chatelain
1,
Xavier Rimpault
1 and
Marek Balazinski
2
1
Department of Mechanical Engineering, École de Technologie Supérieure, Montréal, QC H3C 1K3, Canada
2
Department of Mechanical Engineering, Polytechnique Montréal, Montréal, QC H3T 1J4, Canada
*
Author to whom correspondence should be addressed.
J. Manuf. Mater. Process. 2022, 6(5), 115; https://doi.org/10.3390/jmmp6050115
Submission received: 16 September 2022 / Revised: 27 September 2022 / Accepted: 28 September 2022 / Published: 1 October 2022

Abstract

:
In the metal cutting process, the tool condition directly affects the quality of the machined component. To control the quality of the cutting tool and avoid equipment downtime, it is essential to monitor its condition during the machining process. The primary purpose is to send a warning before tool wear reaches a certain level, which could influence product quality. In this paper, tool condition is monitored using fractal analysis of the spindle electric current signal. The current study analyzes the monitoring of the cutting tool when milling AISI 5140 steel with a four-flute solid carbide end mill cutter to develop monitoring techniques for wear classification of metal cutting processes. The spindle electric current signal is acquired using the machine tool internal sensor, which meets industrial constraints in their operating conditions. As a new approach, the fractal theory is referred to analyze the spindle electric current signal and then assess the tool wear condition during the metal cutting process. Fractal parameters were defined to extract significant characteristic features of the signal. This research provides a proof of concept for the use of fractal analysis as a decision-making strategy in monitoring tool condition.

1. Introduction

The cutting tool is vital in the metal cutting process, and the tool condition directly influences the quality of the machined component. When tool wear is severe enough to influence product quality, the cutting tool needs to be replaced. In real time, successful determination of wear can avoid insufficient product quality, unplanned downtime, and economic losses associated with tool failure. The average machine tool downtime due to the tool wear was estimated to be 7 to 20 percent, resulting in significant productivity loss [1]. Abrasion, fracture, plastic flow, and built-up edge were reported as the main wear mechanisms during the machining of the AISI 5140 steel [2].
Real time tool condition monitoring is a pillar of intelligent manufacturing, especially in the highly automated production lines [3]. Tool condition monitoring has been classified into two categories: direct and indirect methods. In the direct method, the geometric parameters of the cutting tool are evaluated with a high degree of accuracy using an optical microscope [4]. This method has real-time limitations since it requires interrupting the cutting process to estimate tool wear. Furthermore, the direct method requires specific laboratory equipment, which is a constraint in the harsh industrial machining environment [5]. However, the indirect method contains a simpler setup, and it is performed by correlating relevant sensor signals to the tool wear states. Different signals can be employed to monitor the tool condition. The cutting force signal is the most reliable monitoring signal, and it is very sensitive to the tool condition changes [3,6]. Li et al. [3] introduced a force-based tool condition monitoring system based on ν-Support Vector Regression (ν-SVR) and correlation analysis. Experimental results proved the prediction accuracy to be up to 96.76 percent during the turning of steel alloy. Recently, Liao et al. [7] developed an automated tool condition monitoring scheme using a cutting force sensor to guide decision-making in milling steel alloy effectively. The proposed monitoring system correctly indicated the degree of tool wear using Support Vector Machine (SVM) and Genetic Algorithm (GA). The SVM approach, however, has some drawbacks. The performance of this method is greatly influenced by the choice of the kernel function and its parameters. They can only be chosen through a method of trial and error which greatly complicates their selection.
Despite the cutting force signal’s capacity to assess tool condition during machining, obtaining cutting forces requires specialized sensors such as dynamometers. Using those sensors in the production line is not practical or cost-effective. Low-cost sensors that do not interfere with the cutting process are preferred in industrial environments [8]. Rmili et al. [9] developed an automatic system for monitoring tool wear based on the vibratory signatures produced during the turning operation using the mean power analysis. The proposed automatic detector introduced as a useful method for improving a wear monitoring system in an industrial environment. However, the accuracy of Tool Condition Monitoring (TCM) using vibration signal is limited by the characteristics of machining processes and the vibration signal is extremely sensitive to the environment. Moreover, the vibration signal can be impacted by the location of the sensor and the type of cutting fluid as well.
For industrial applications, it is more practical to use the machine tool’s internal data, such as power and electric current, because data acquisition is extremely fast and no external sensors are involved [10]. Drouillet et al. [1] used the spindle power sensor data to predict Remaining Useful tool Life (RUL). A curve fitting method of Artificial Neural Network (ANN) was used to anticipate the RUL. The predicted and actual RUL of the cutting tool were found to be in good agreement. However, to achieve great performance, ANN need a lot of training data, which is time-consuming and expensive. Choi et al. [11] developed a method based on the Root Mean Square (RMS) of the feed and spindle motor currents to predict drill foreboding failure during steel alloy drilling. Regardless of the cutting tool type and cutting conditions, the proposed algorithm identified impending failure before breakage of the drill using the feed motor current signal. Moreover, Jamshidi et al. [6] showed that the electric current signal from the spindle was extremely responsive to the cutting conditions and could precisely depict tool condition changes during milling. Implementing a monitoring system based on the spindle electric current signal is accessible, and no modification is required to the workpiece fixture or machine tool.
Data mining is commonly defined as the process of obtaining valid, understandable data from massive data sets in order to improve the decision-making process. For data mining and extracting information from a specific signal, a variety of techniques are available [12]. As previously indicated, conventional statistical methods [13], the combination of time and frequency domain analysis [11], genetic algorithms [7], fast Fourier transform [14], artificial neural networks analysis [1] and other methods have been used to analyze the acquired signals in the tool condition monitoring while machining steel alloys. However, a method with shorter training duration and quicker processing time is required for TCM. Recently, fractal analysis was introduced as a new approach in tool condition monitoring while machining composite parts. Fractal analysis was introduced to reveal inherent patterns hidden in the acquired signals such as cutting force signal [6,15] and electric current signal [6]. According to the literature review, fractal parameters depend on cutting parameters less than statistical parameters. Recently, Jamshidi et al. [6] referred to fractal analysis to monitor the tool condition using cutting forces and electric current signal while machining composite parts. During machining of Carbon Fiber Reinforced Plastic (CFRP), fractal characteristics were evaluated to determine discrete wear stages of the cutting tool.
In this study, it is proposed to use the built-in machine tool spindle electric current signal to anticipate the tool condition in an integrated system without any use of an external device which meets industrial constraints. This research provides a proof of concept for the use of fractal analysis as a decision-making strategy in monitoring tool condition. This approach is an important innovation, allowing one to assess the tool condition in real time as shown in Figure 1. This study intends to demonstrate the possible outcome of the fractal analysis of the built-in machine tool spindle electric signal in the online tool condition monitoring during the metal cutting process as the effectiveness of this method was proved during composite machining [6].

2. Methodology

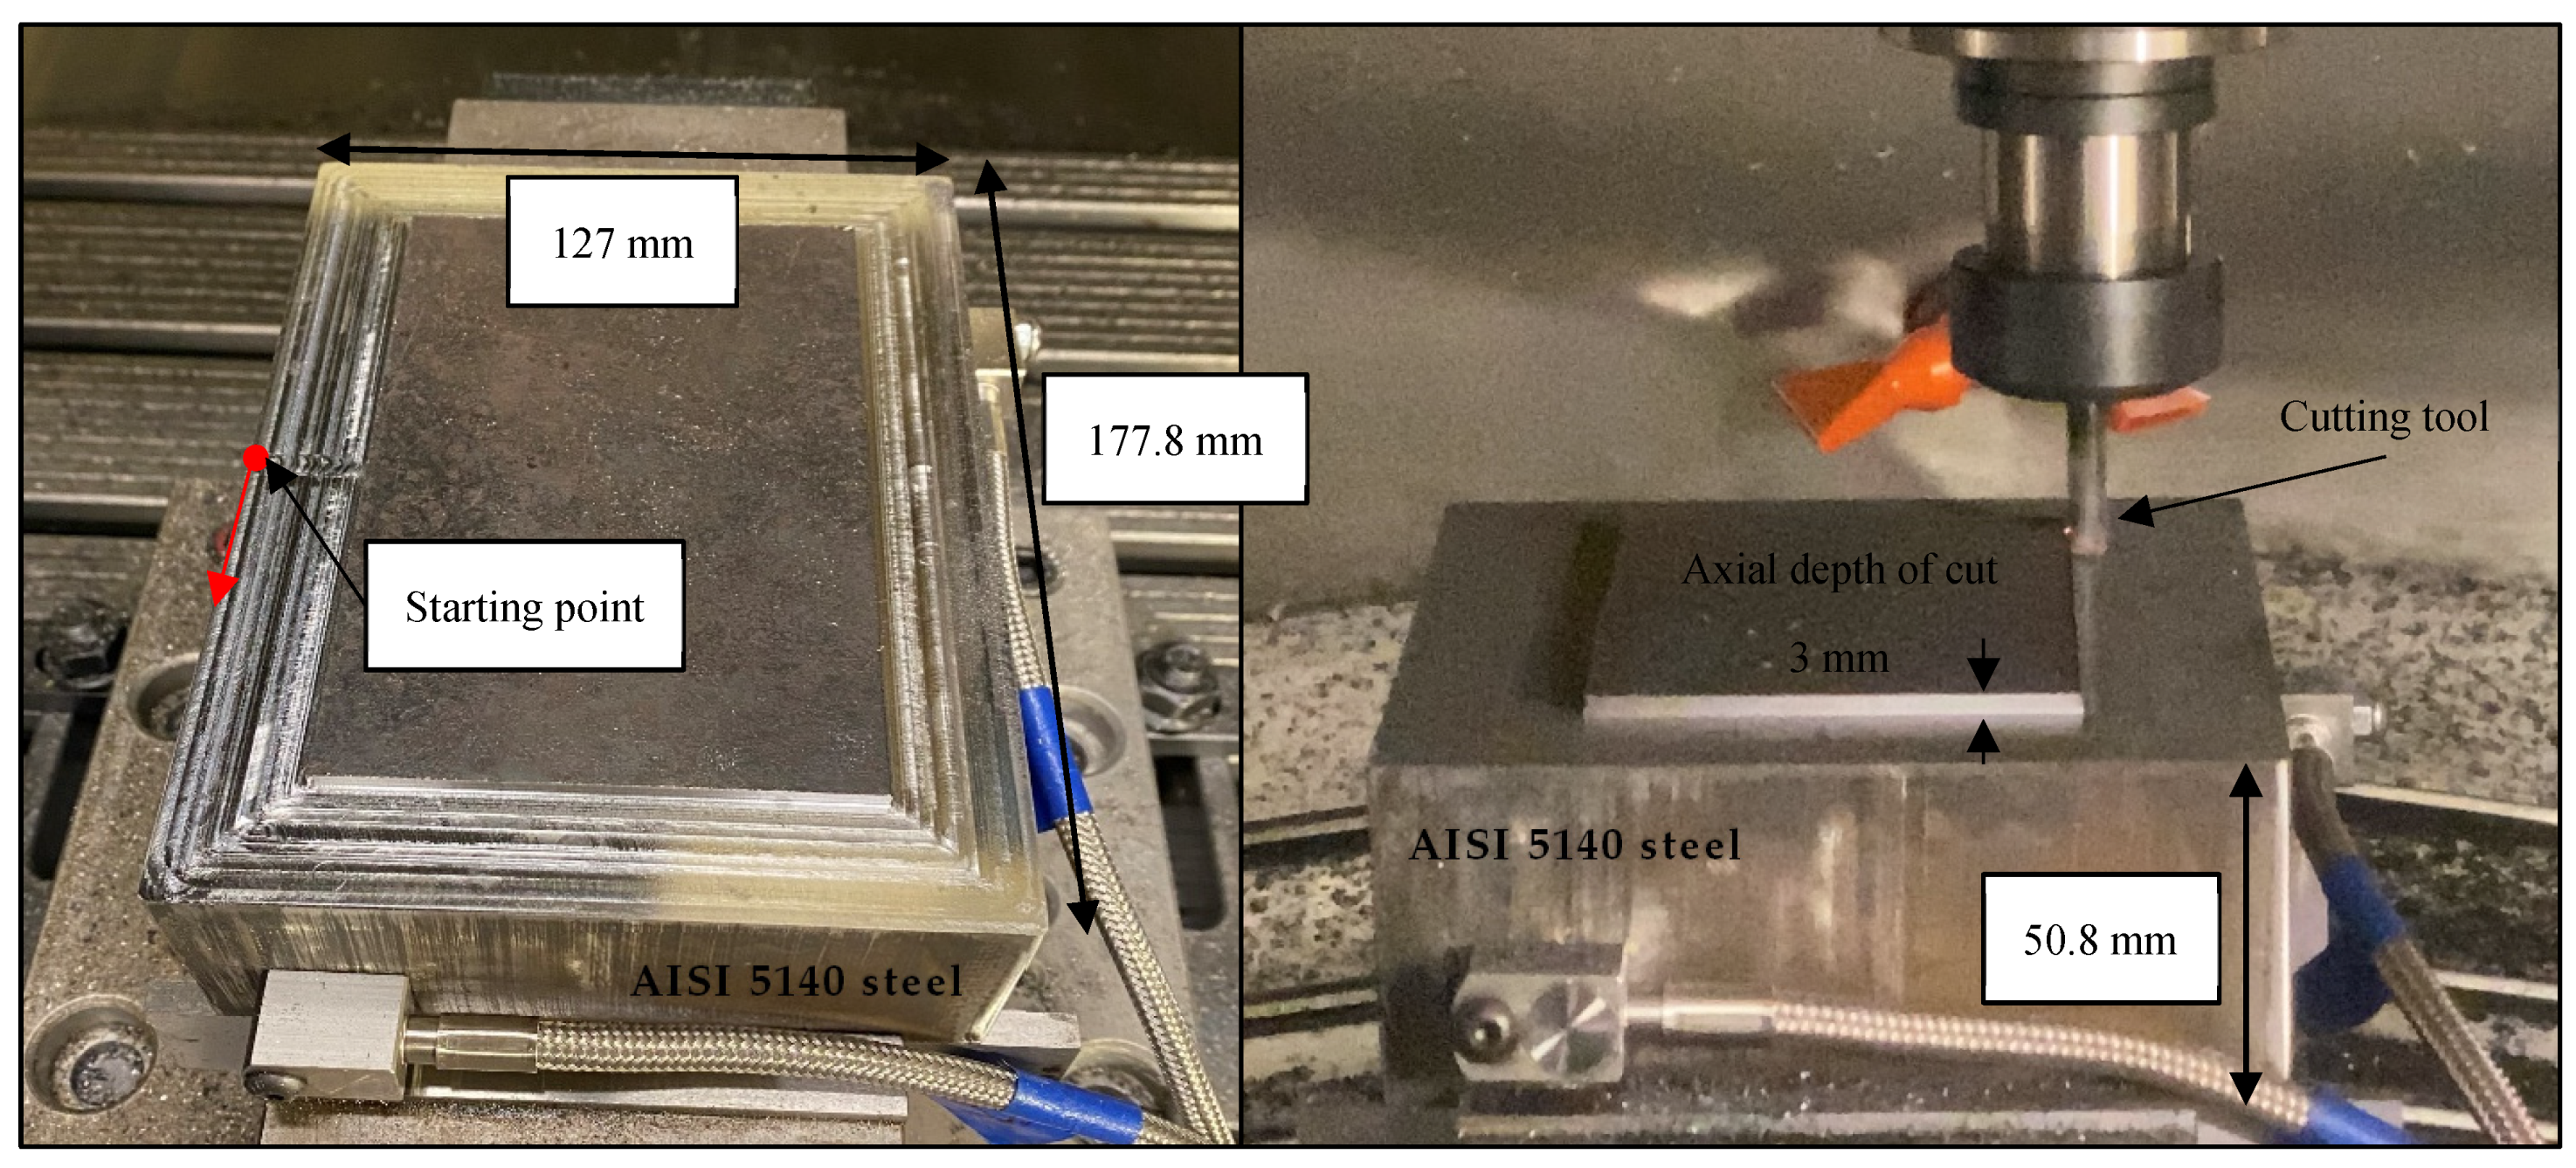
In this study, the spindle electric current signal was acquired during shoulder milling of an AISI 5140 steel block using a four-flute solid carbide end mill cutter. The experiments lasted 50 min and the overall cutting length was 23.3 m. As shown in Figure 2, the cutting toolpath consisted in a contour-parallel. The machining was paused every three contours for tool wear measurement. Following the contouring operations, the areal roughness parameter was estimated on each contour resulting surface.

2.1. Materials and Experimental Setup

A four-flute solid carbide AlTiN coated end mill cutter having a 6.35 mm (1/4”) diameter was used to machine a block of AISI 5140 steel with dimensions of 177.8 mm × 127 mm × 50.8 mm as displayed in Figure 2. Table 1 and Table 2 demonstrate the chemical composition and mechanical properties of AISI 5140 steel, respectively. The cutting conditions recommended by the cutting tool manufacturer were selected to conduct this experiment, as specified in Table 3. Tool wear was estimated by averaging the flank wear on each of the four cutting tool edges. The photographs of the tool were taken using a Keyence VHX-500 F digital microscope. A reading of the flank wear was taken after every three-contour machining until the tool met the ISO 8688-1 wear criterion of 0.3 mm [16]. A K2X10 Huron® high-speed machining center equipped with a dust extraction system was used for the dry milling contouring process.
The spindle electric current signal is very responsive to cutting conditions and can accurately describe tool condition changes. The data acquisition of this signal was done through an internal sensor of the machine tool and a static synchronized action, programmed using the Application Programming Interface (API) of the SIEMENS SINUMERIK 840D controller. The signal data were recorded at a frequency of 333 Hz. The electric current signal requires a lower frequency than the cutting force signal because the electric current variation is a portion of the requested power and its variation is less reliant on the cutting parameters. In this study, the NCU of K2X10 Huron® high-speed machining center has an interpolator cycle time of 3 ms and the acquisition rate through synchronous actions was considered as 333 Hz. The machined surface quality was evaluated using the areal surface roughness parameter. The Keyence VR-5000 optical profiler was used to record the 3D images of the machined surface as well as the areal surface roughness parameter.

2.2. Fractal Analysis for Feature Extraction

The concept of fractals was initially introduced by B.B. Mandelbrot [17]. Using fractal analysis, he calculated the length of the British coastline. Fractal objects have irregular shapes and an affine structure, and they are self-similar. They have fractal dimension which is greater than the topological dimension [17]. Fractal theory can be a valuable tool for forecasting and analyzing the behavior of complex dynamic systems and explaining and extracting properties from signals. This theory can be applied to chemistry, physics, and geology [18]. Fractal analysis was widely used in the advanced surface roughness evaluation [19,20]. The fractal theory has recently been introduced as a novel method in tool condition monitoring because of the quick processing time [15].
Fractal dimension can be calculated using a variety of techniques, including correlation analysis, information analysis, regularization analysis, and the box-counting method. Regularization analysis was chosen in this study because it has a significant degree of repeatability, as evidenced by recent studies [6,21,22]. In the regularization analysis, a signal (s) can be regularized by convolution with different kernels, such as the Gaussian kernel ( g a ). Convolution product is defined as:
s a = s g a
The smoothed signal ( s a ) is theorized to have a finite length ( l a ) and the Gaussian kernel ( g a ) has the width (a). The regularization dimension can be estimated using the following equation:
D = 1 lim a 0 l o g   l a l o g a
The slope in the area where the Gaussian kernel’s width goes to 0 and the R 2 of the linear regression is close to 1 is determined as the limit in this equation [23].
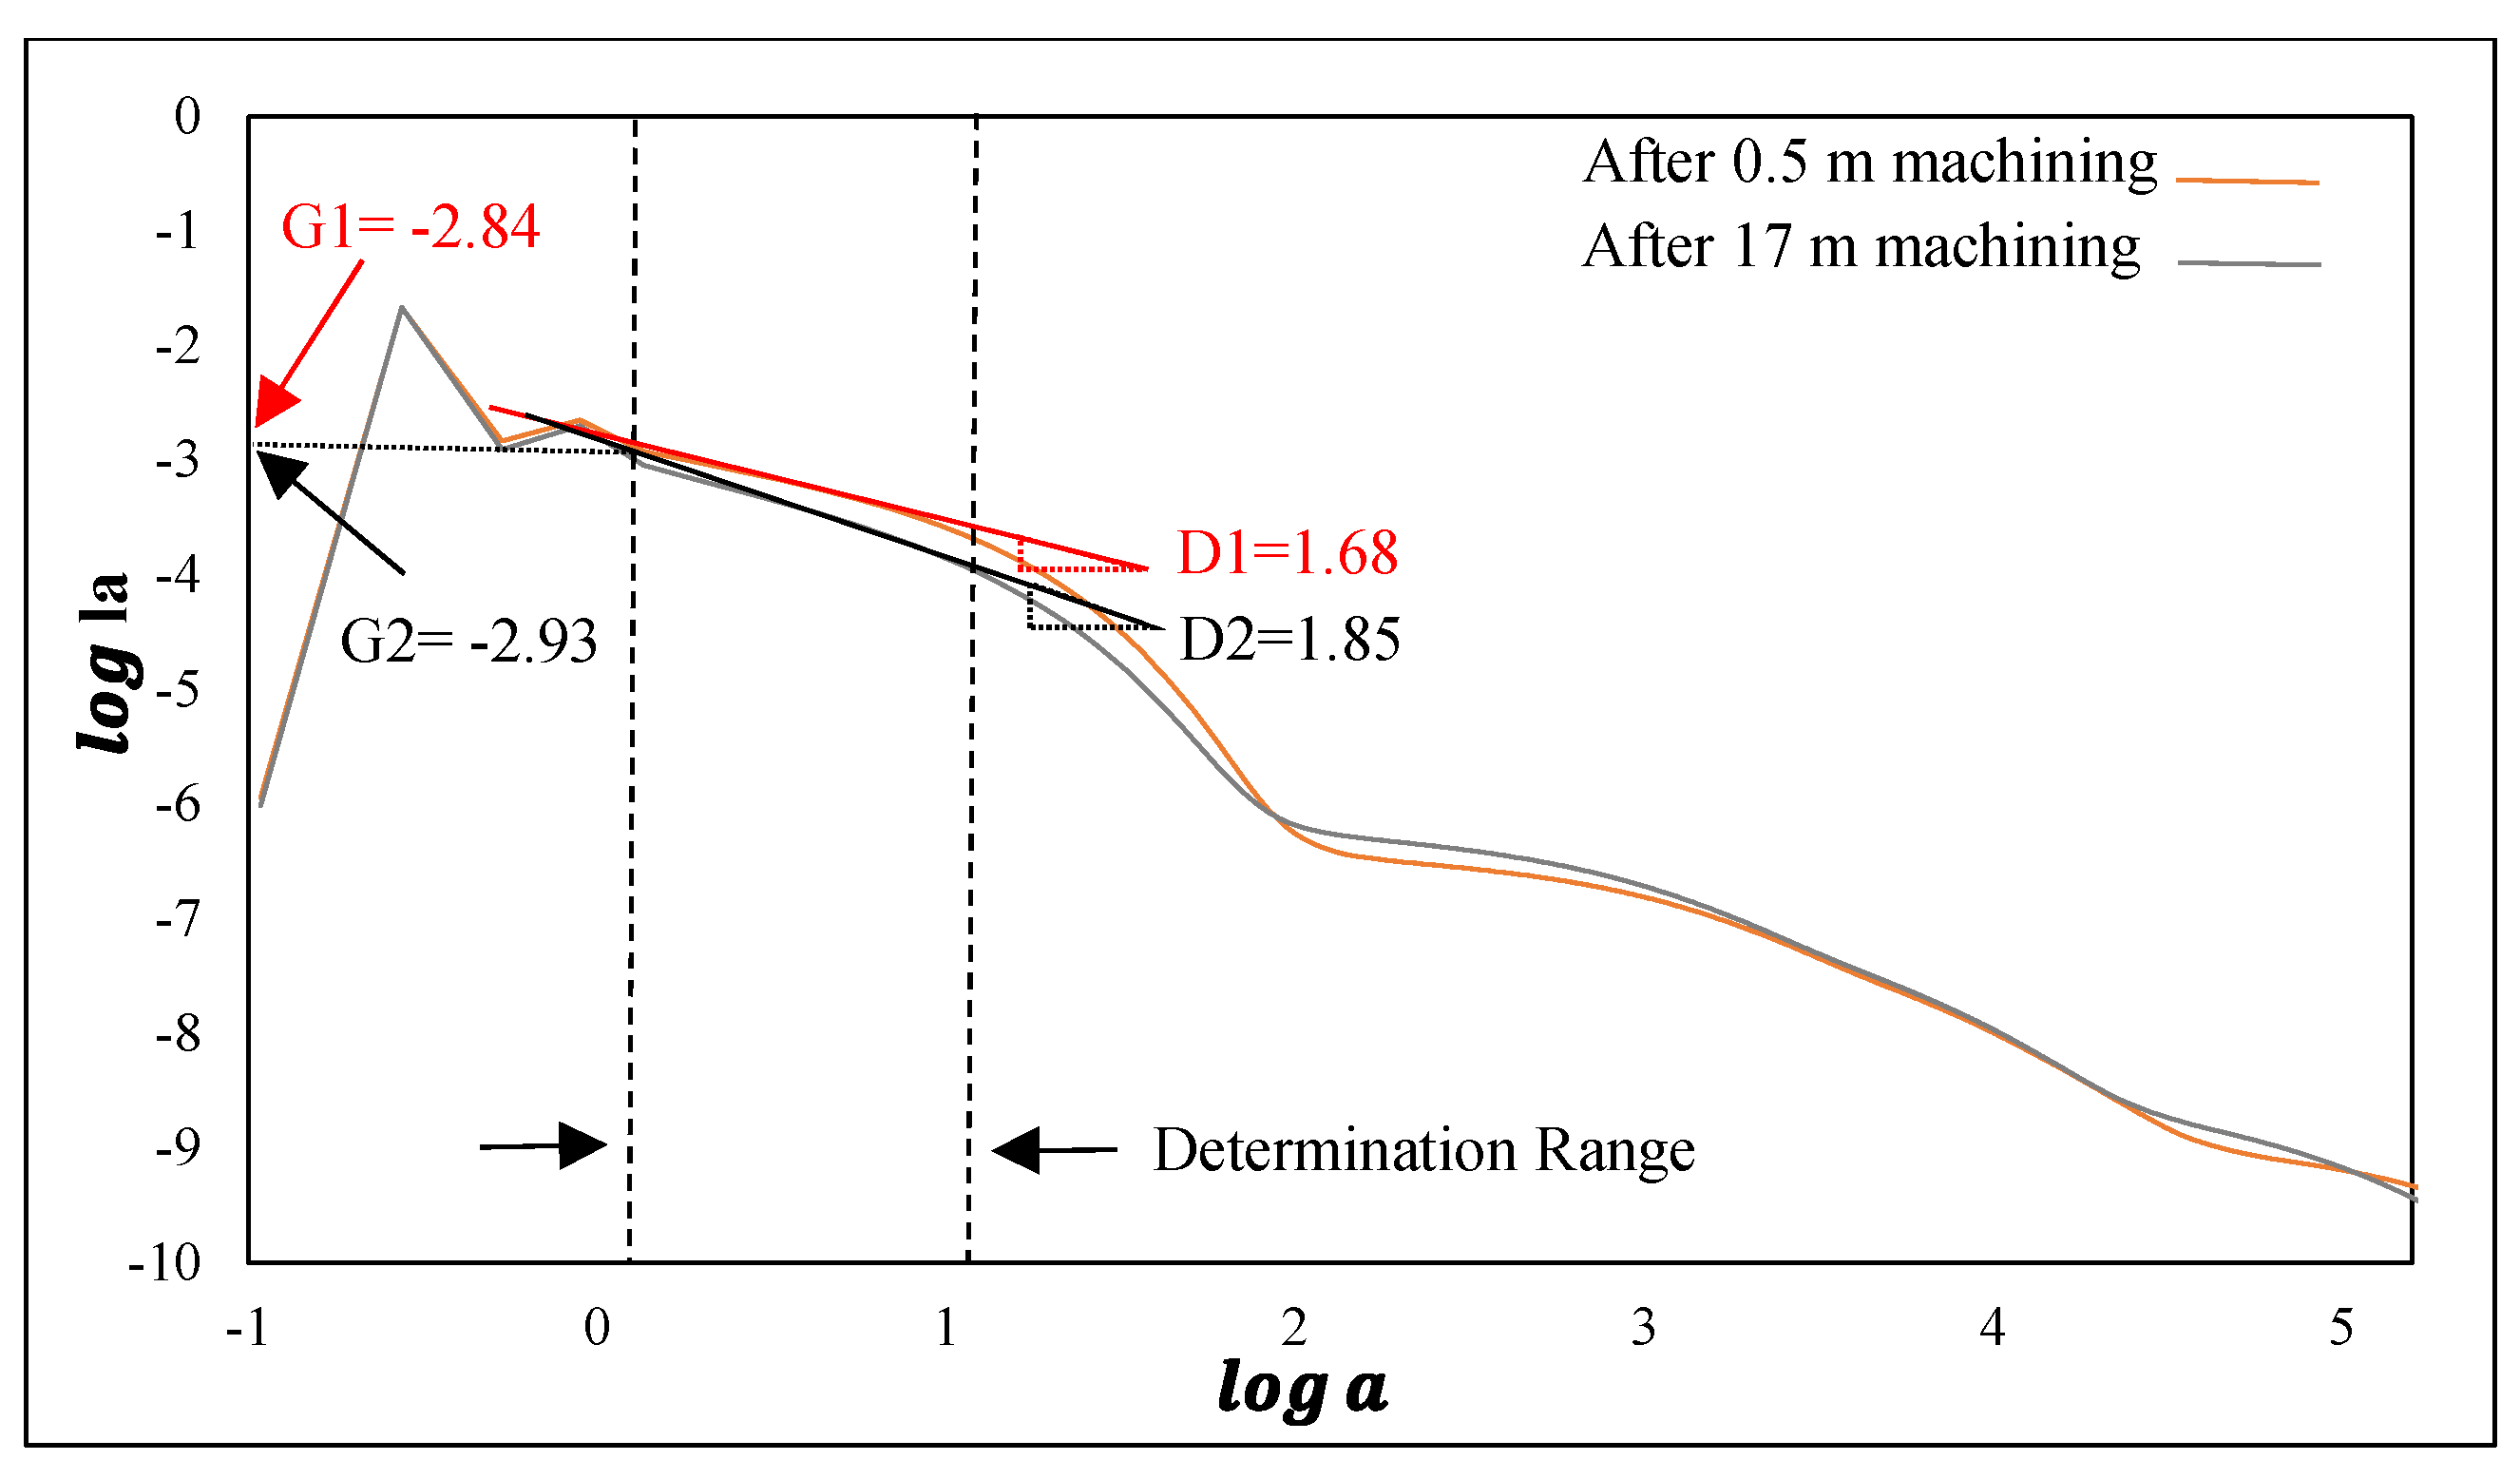
A typical region in the l o g l a vs. l o g a graph with greater linearity and sufficient points for linear regression must be selected to ensure the results accuracy. Herein, a determination range was chosen based on preliminary computations for the spindle electric current signal, identified in Figure 3 by dash lines. The fractal parameters were calculated in the 5 to 15 points range. In Figure 3, two graphs were illustrated as an example. The linear regression slope (D) and y intercept slope offset (G) were calculated for each curve in this range. The slope in these regions where the (a) value is close to 0 and the R 2 of the linear regression is close to 1 is used to compute fractal dimension which indicates the signal’s roughness as well as the irregularity and complexity of a system. Additional fractal parameters were established to obtain complementary signal characteristics; topothesy (G) and the coefficient of determination of the linear regression ( R 2 ). The signal’s ruggedness was represented by topothesy and the auto-scale regularity of the signal was defined as the coefficient of determination of the linear ( R 2 ).

3. Results and Discussion

3.1. Conventional Analysis

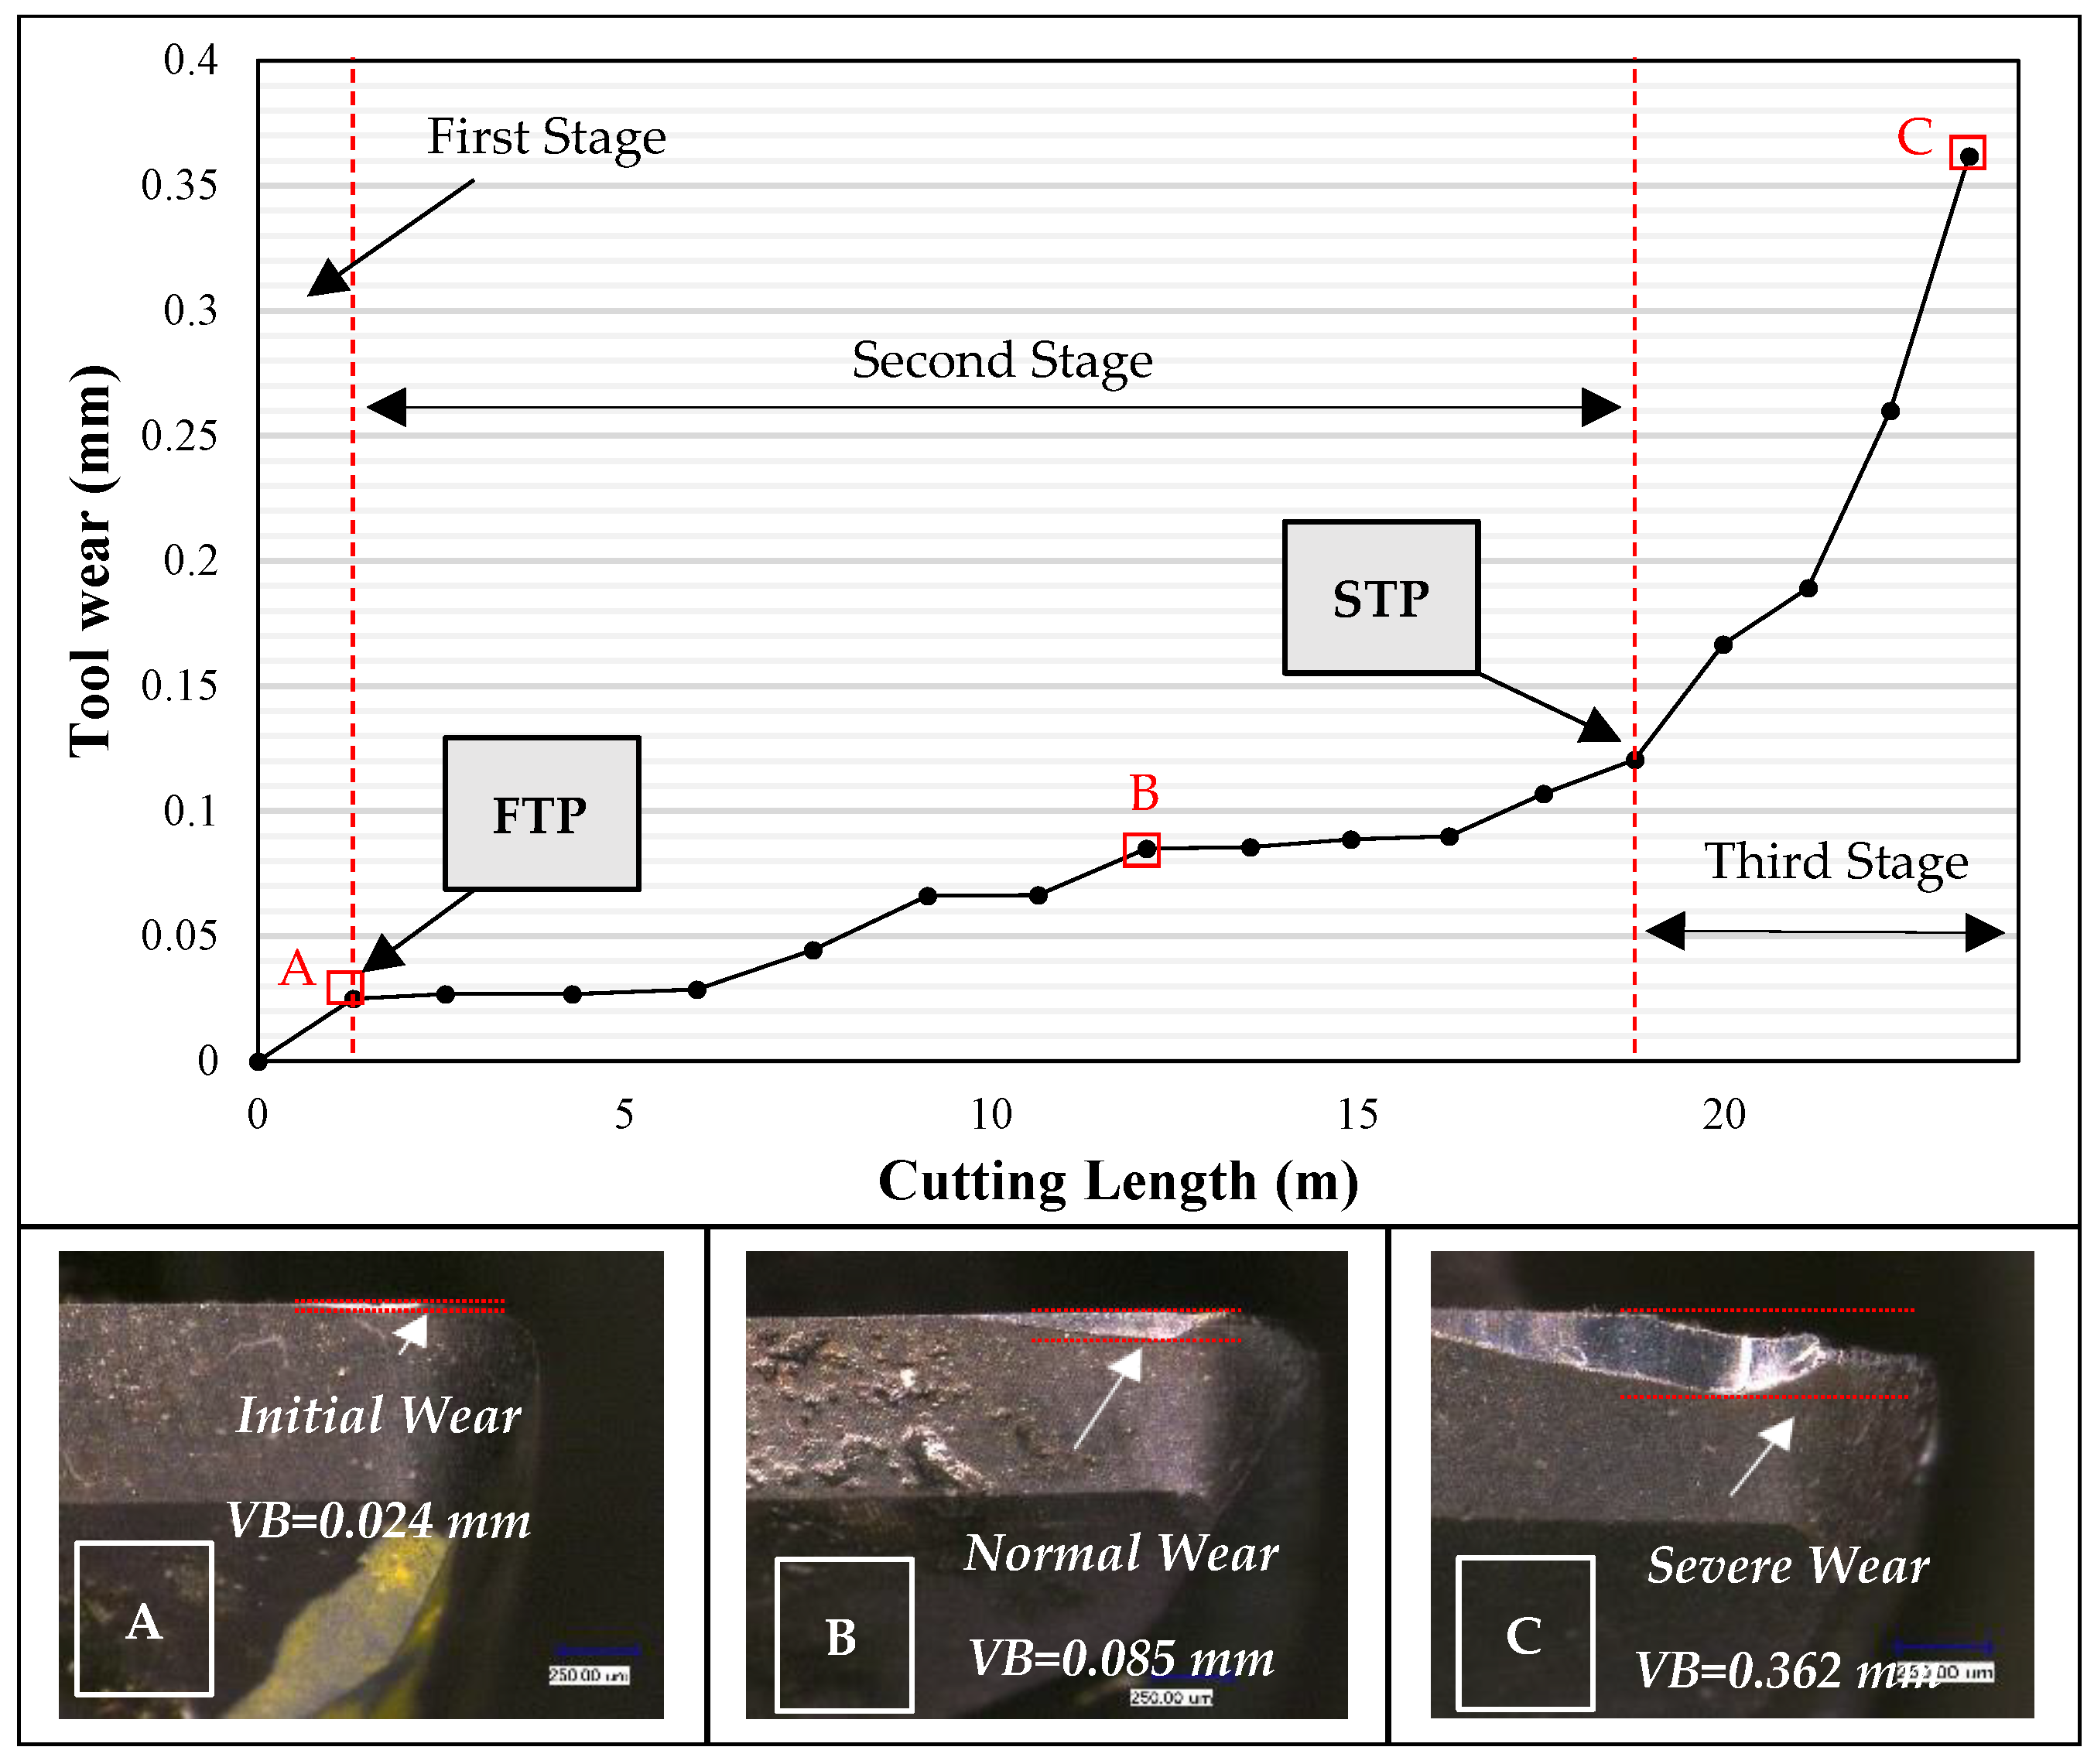
The experimental results of shoulder milling of AISI 5140 steel block using the solid carbide end mill tool are discussed in this section. During machining, the tool performance degrades and directly impacts the machined surface. The tool wear evolution curve of the solid carbide end mill for 23.3 m of contour milling is depicted in Figure 4. This curve has three separate stages. At the initial stage, the wear increased more quickly due to the high pressure in the small contact area. Up to the third stage, the wear rose at a slower, more consistent rate. In this area, tool wear was considered normal. The wear increased faster at the final stage until the tool achieved its wear criteria of 0.3 mm according to ISO 8688 1 [16]. The First Transition Point (FTP) was defined as the transition point between the first and second wear stages after 1.3 m of machining. The Second Transition Point (STP) was defined as the transition point between the second and third wear stages after 18.8 m of machining (Figure 4). To avoid any change in the workpiece surface quality, the cutting tool must be replaced before the second transition point. In the present study, the procedure generated sparks after 14 m of cutting in the second stage of tool wear because of the elevated temperature at the tool workpiece interface. The quantity of sparks increased considerably in the third stage, when the cutting tool lost its initial cutting geometry and generated a new contact surface.
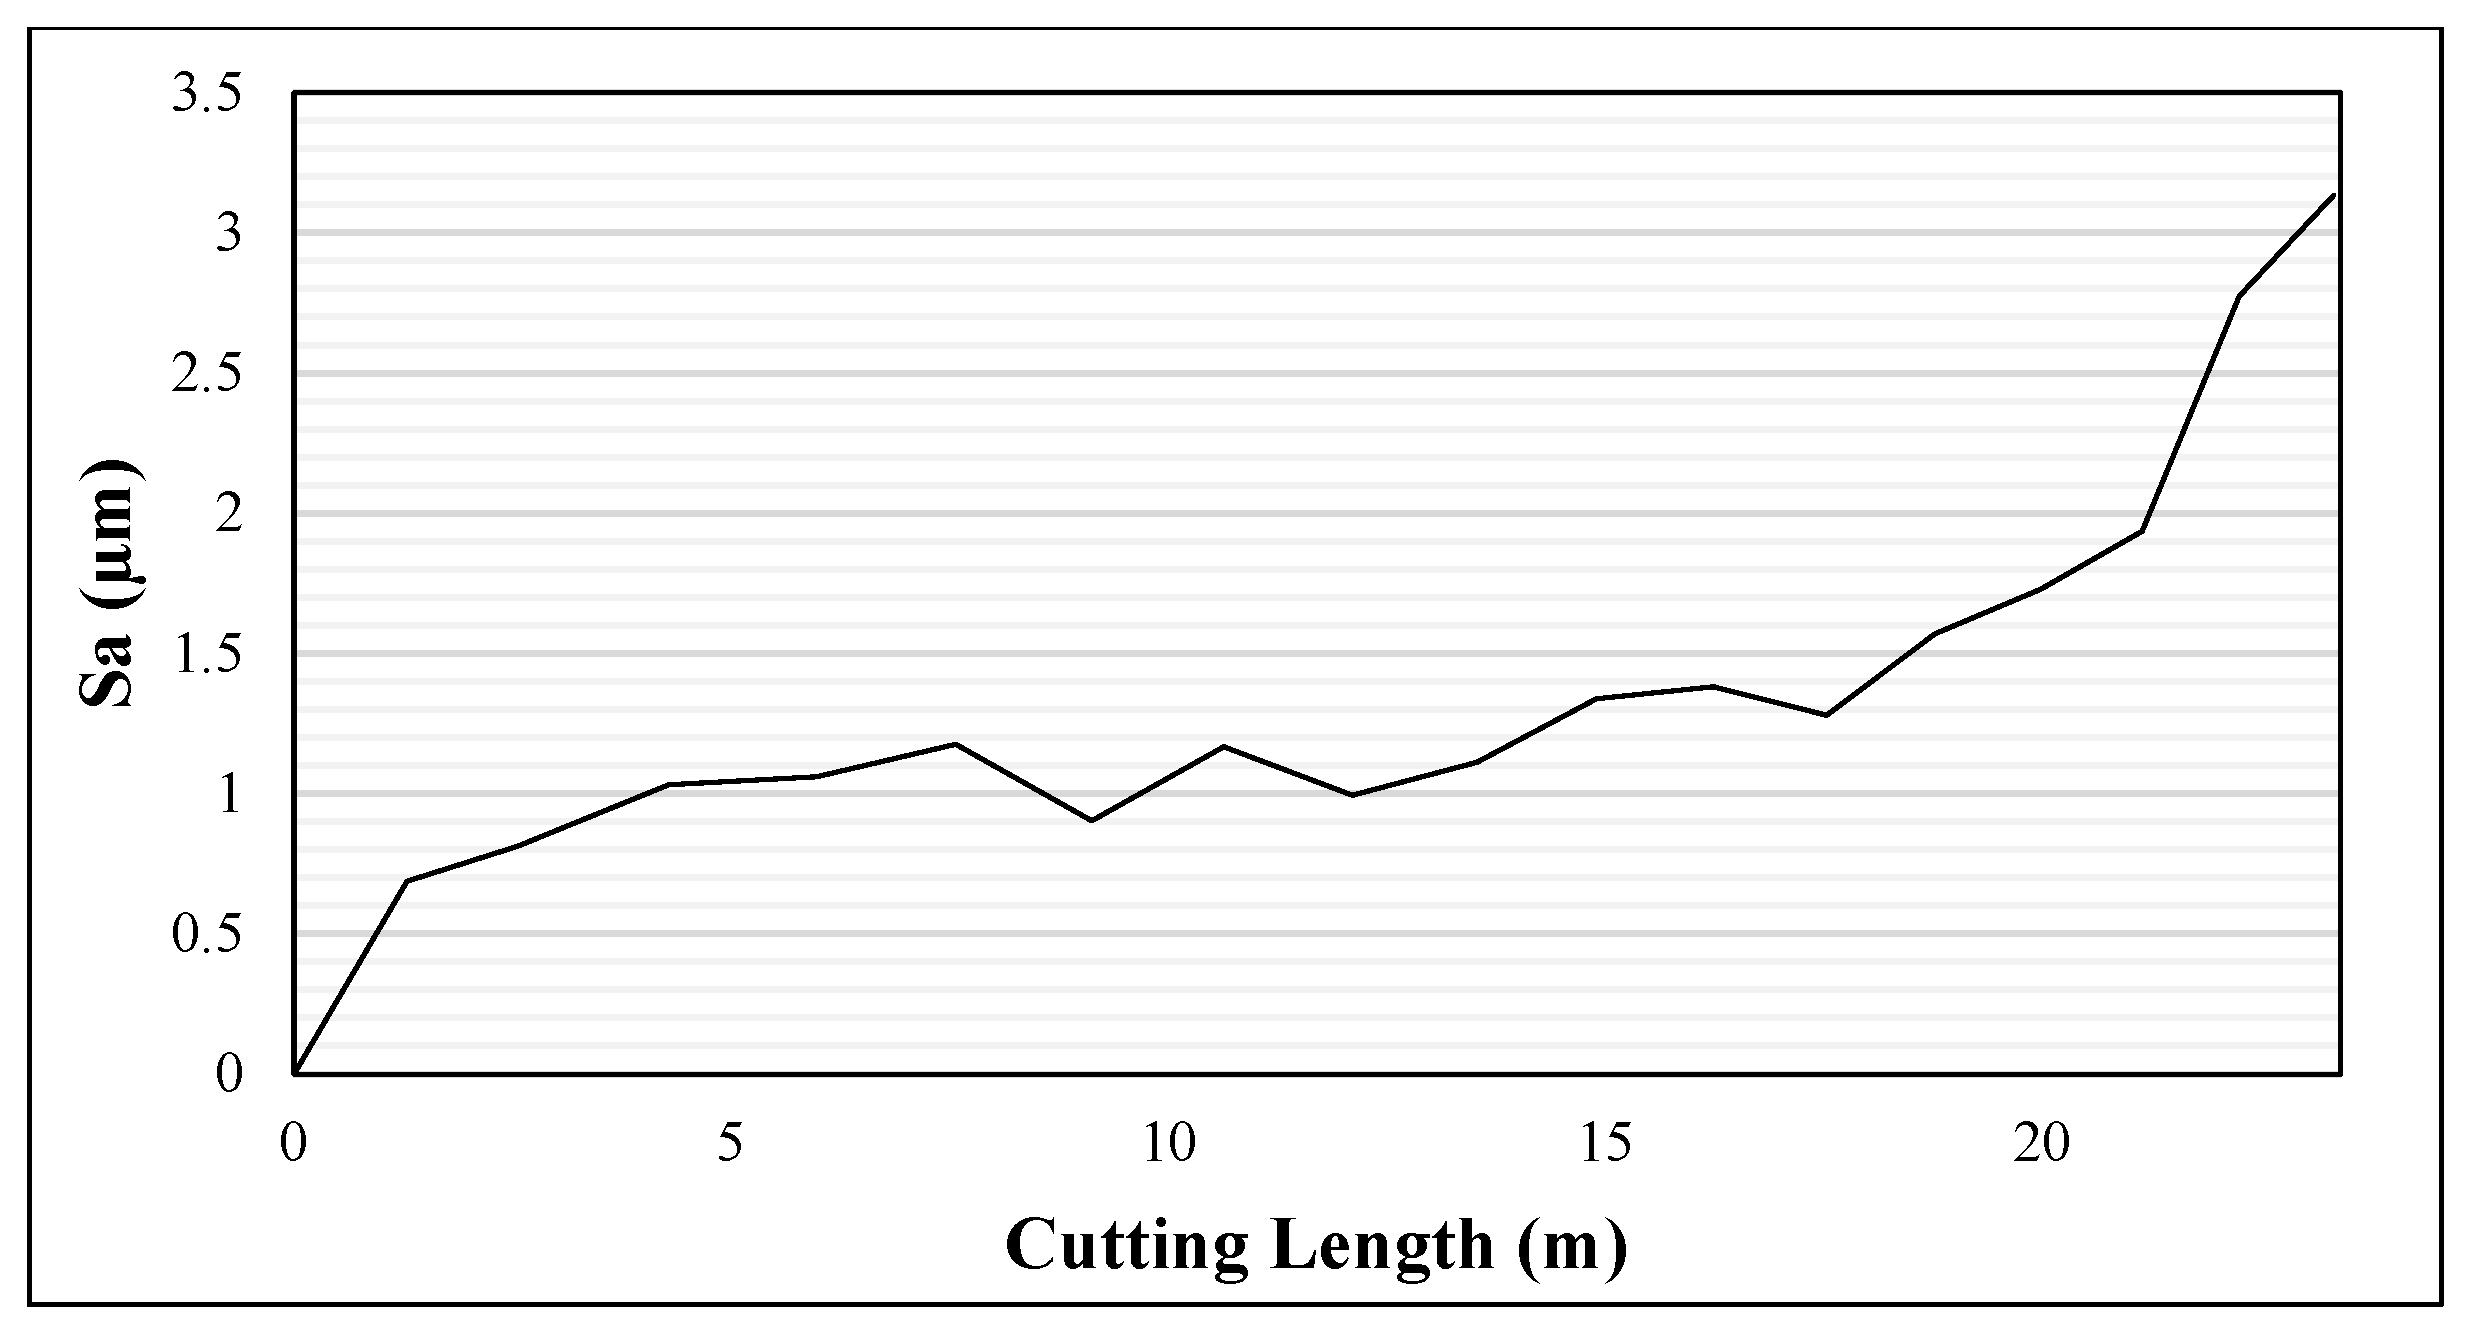
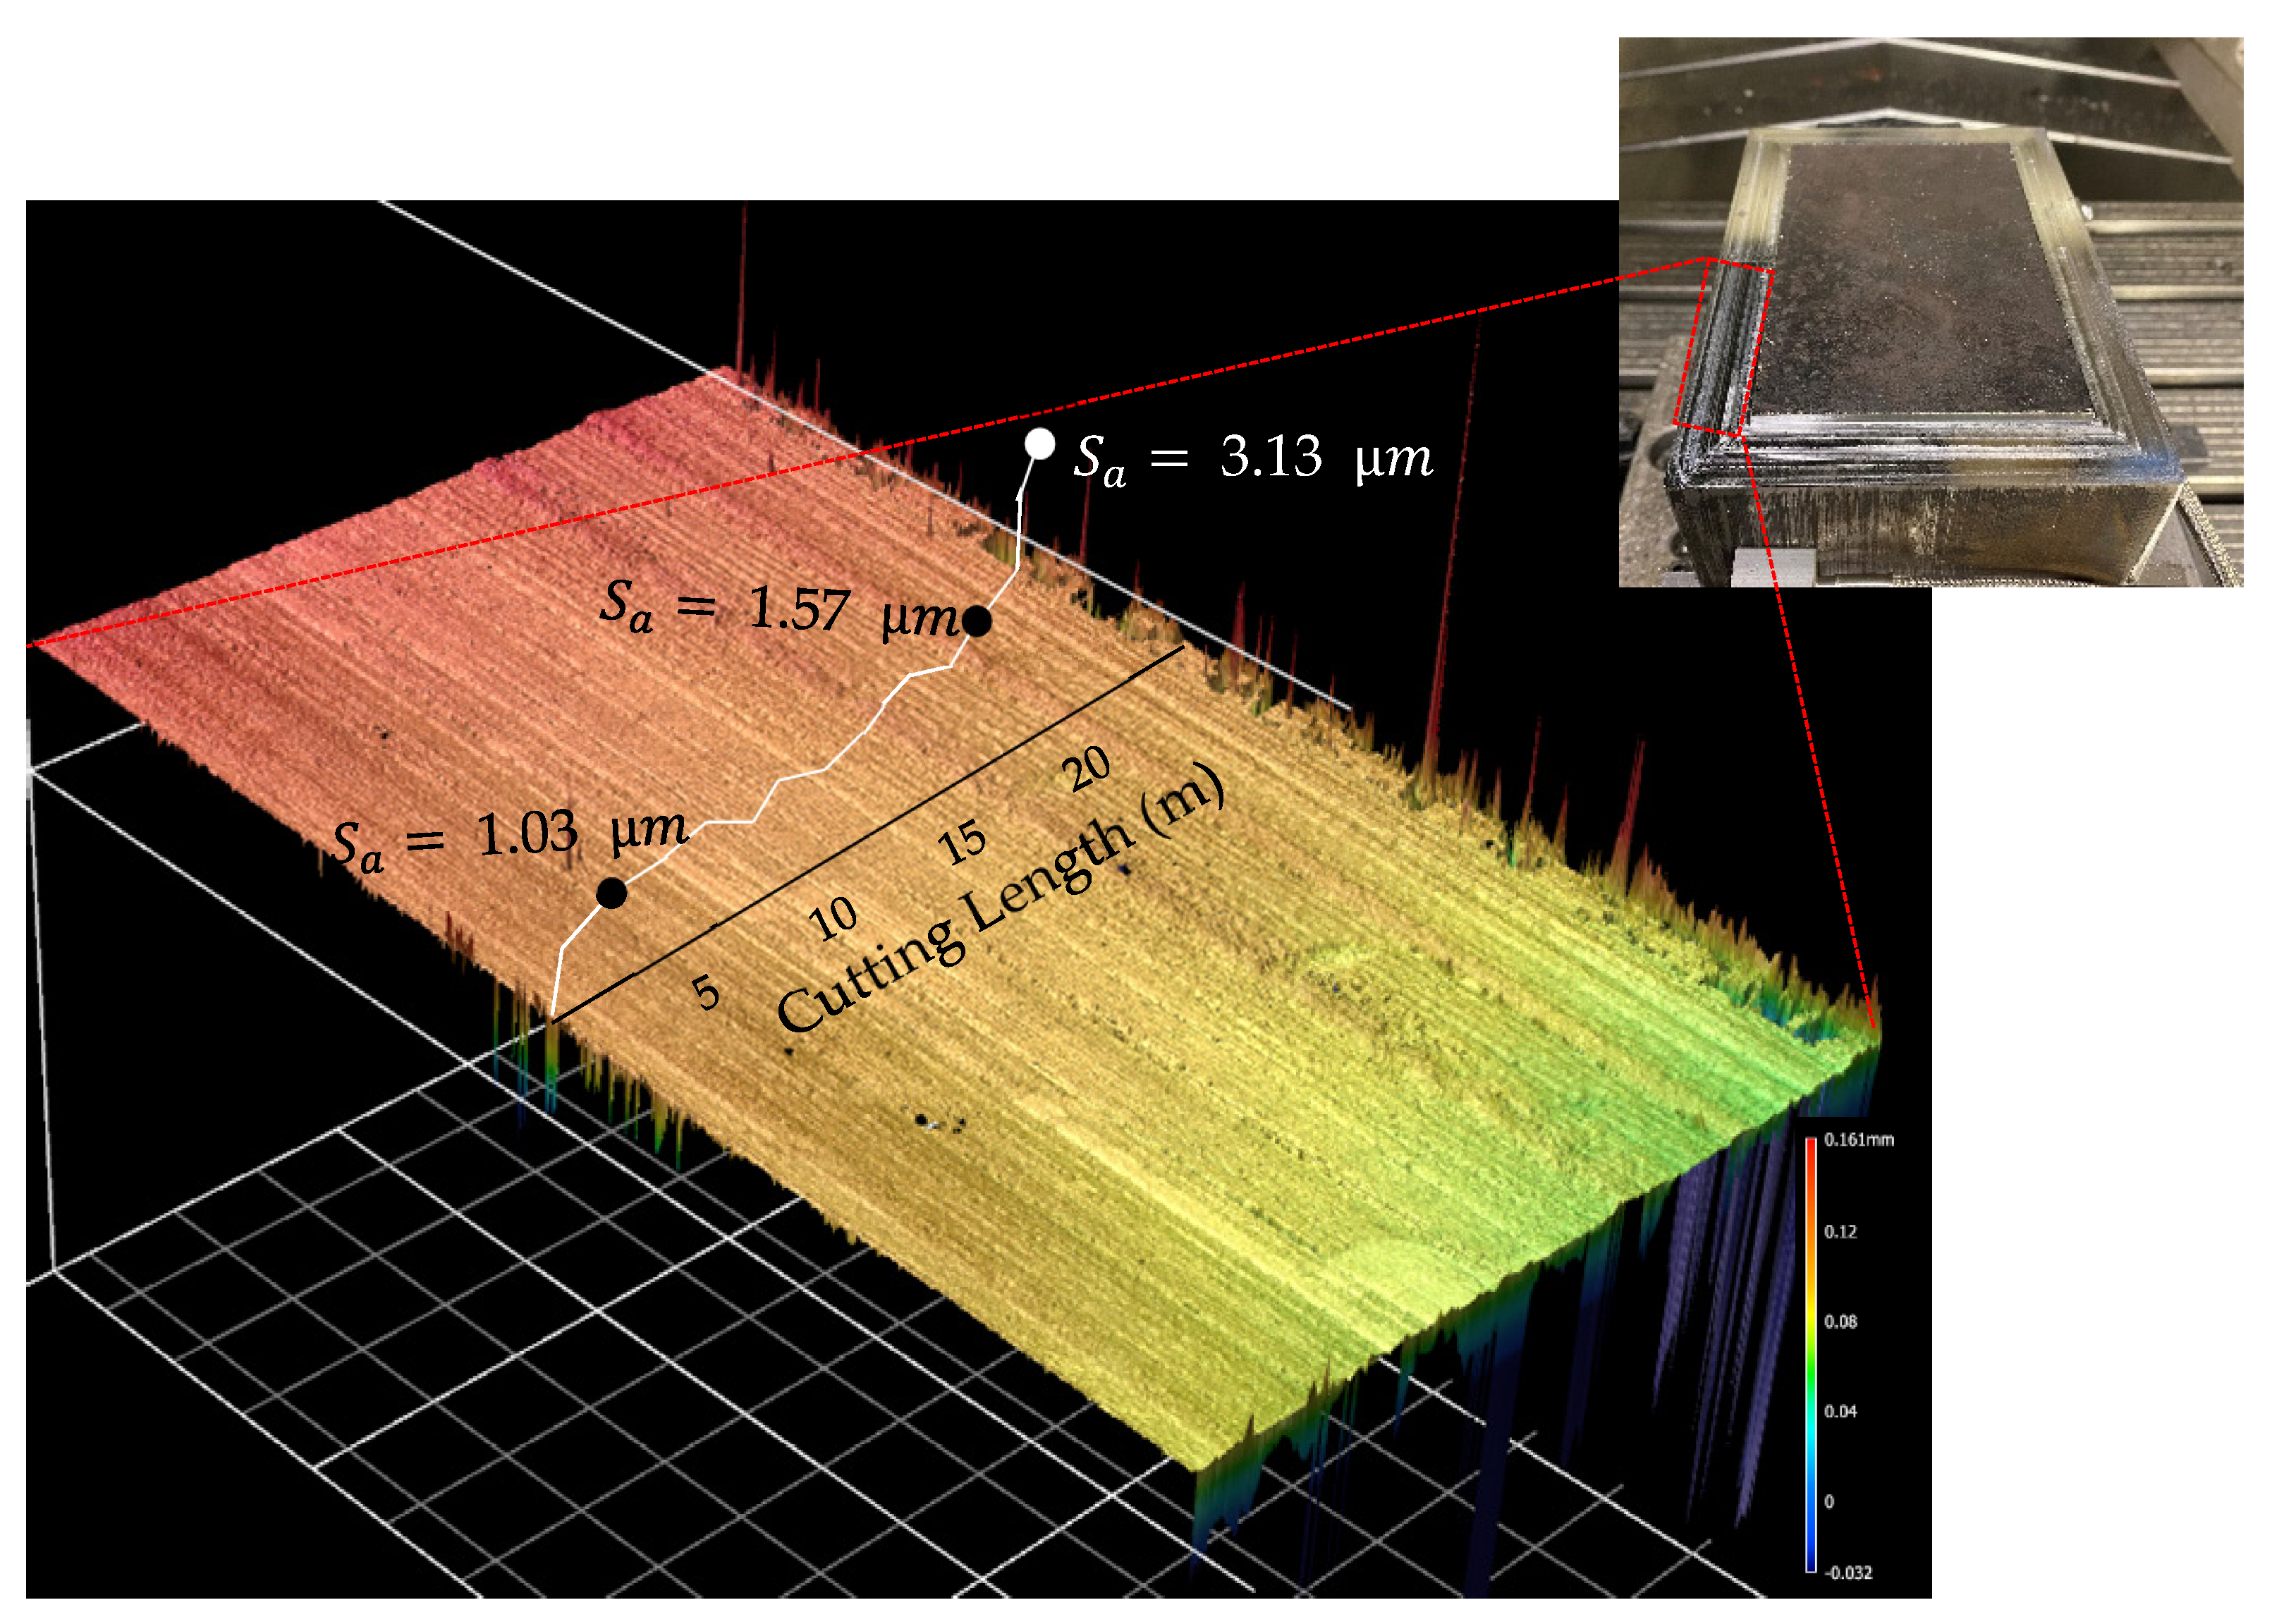
The areal roughness parameter was obtained in this study to evaluate the surface quality of the steel block. Surface roughness is influenced by a variety of elements throughout the milling process, including the cutting tool condition, machining process parameters, relative vibration between the tool and the workpiece, and machining dynamics [24]. R a is a roughness parameter based on the arithmetical mean height of a line. S a is the extension of R a to a surface. The average absolute value of the height for each point in the area is determined by S a [25]. The result of S a (arithmetical mean height) is displayed in Figure 5. With S a less than 1.5 µm in the first 18 m of cutting, the surface is acceptable; however, after 18 m of machining, S a increased, and surface quality dropped. Figure 6 illustrates the 3D image of a section of a steel block to demonstrate how the surface deteriorates as the tool wear increases. When tool wear became severe, and sparks rose, the arithmetical mean height ( S a ) of the surface reached 3.13 µm at the end of the machining.
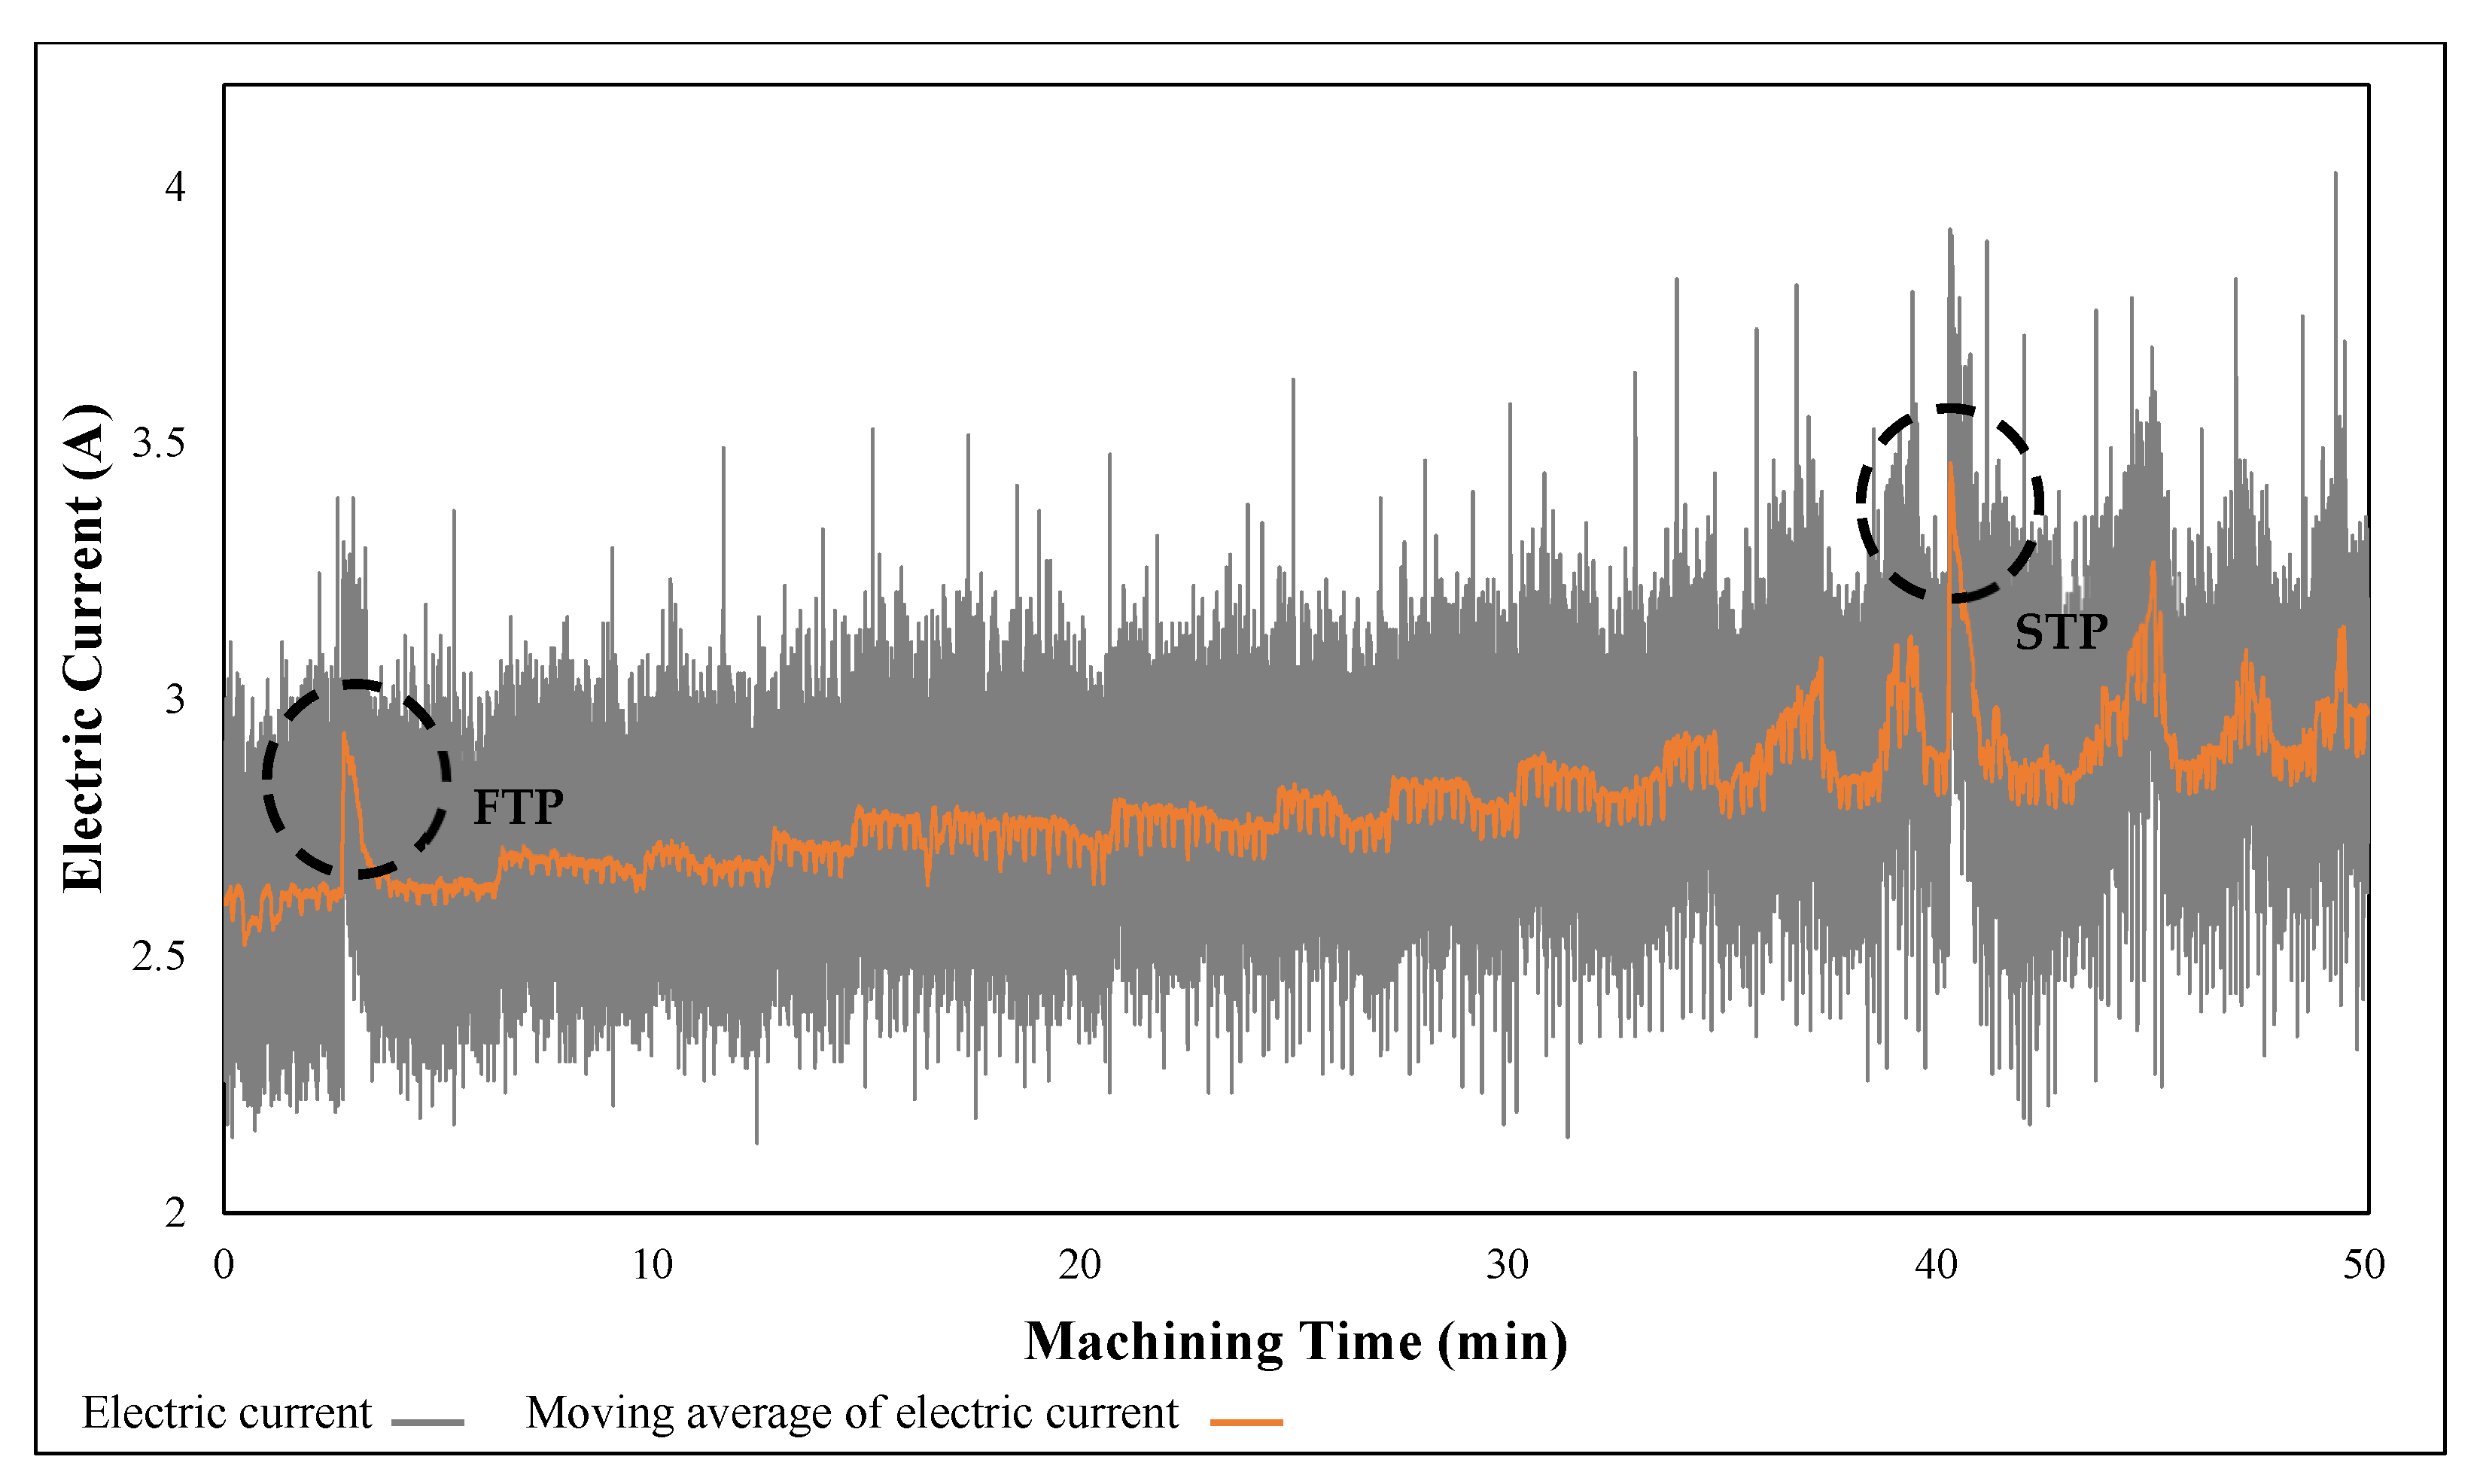
Figure 7 shows the electric current signal related to the spindle sampled utilizing the machine tool internal sensor with the least noise level. To emphasize the electric current changes over time, this figure also contains a moving average of the spindle electric current signal. After 2.8 and 40.3 min of machining, the moving average of the electric current signal displays two notable rises. Since the cutting condition remained constant over time, these two peaks respectively can represent the FTP and STP points in the tool wear evolution curve, as previously showed in Figure 4.
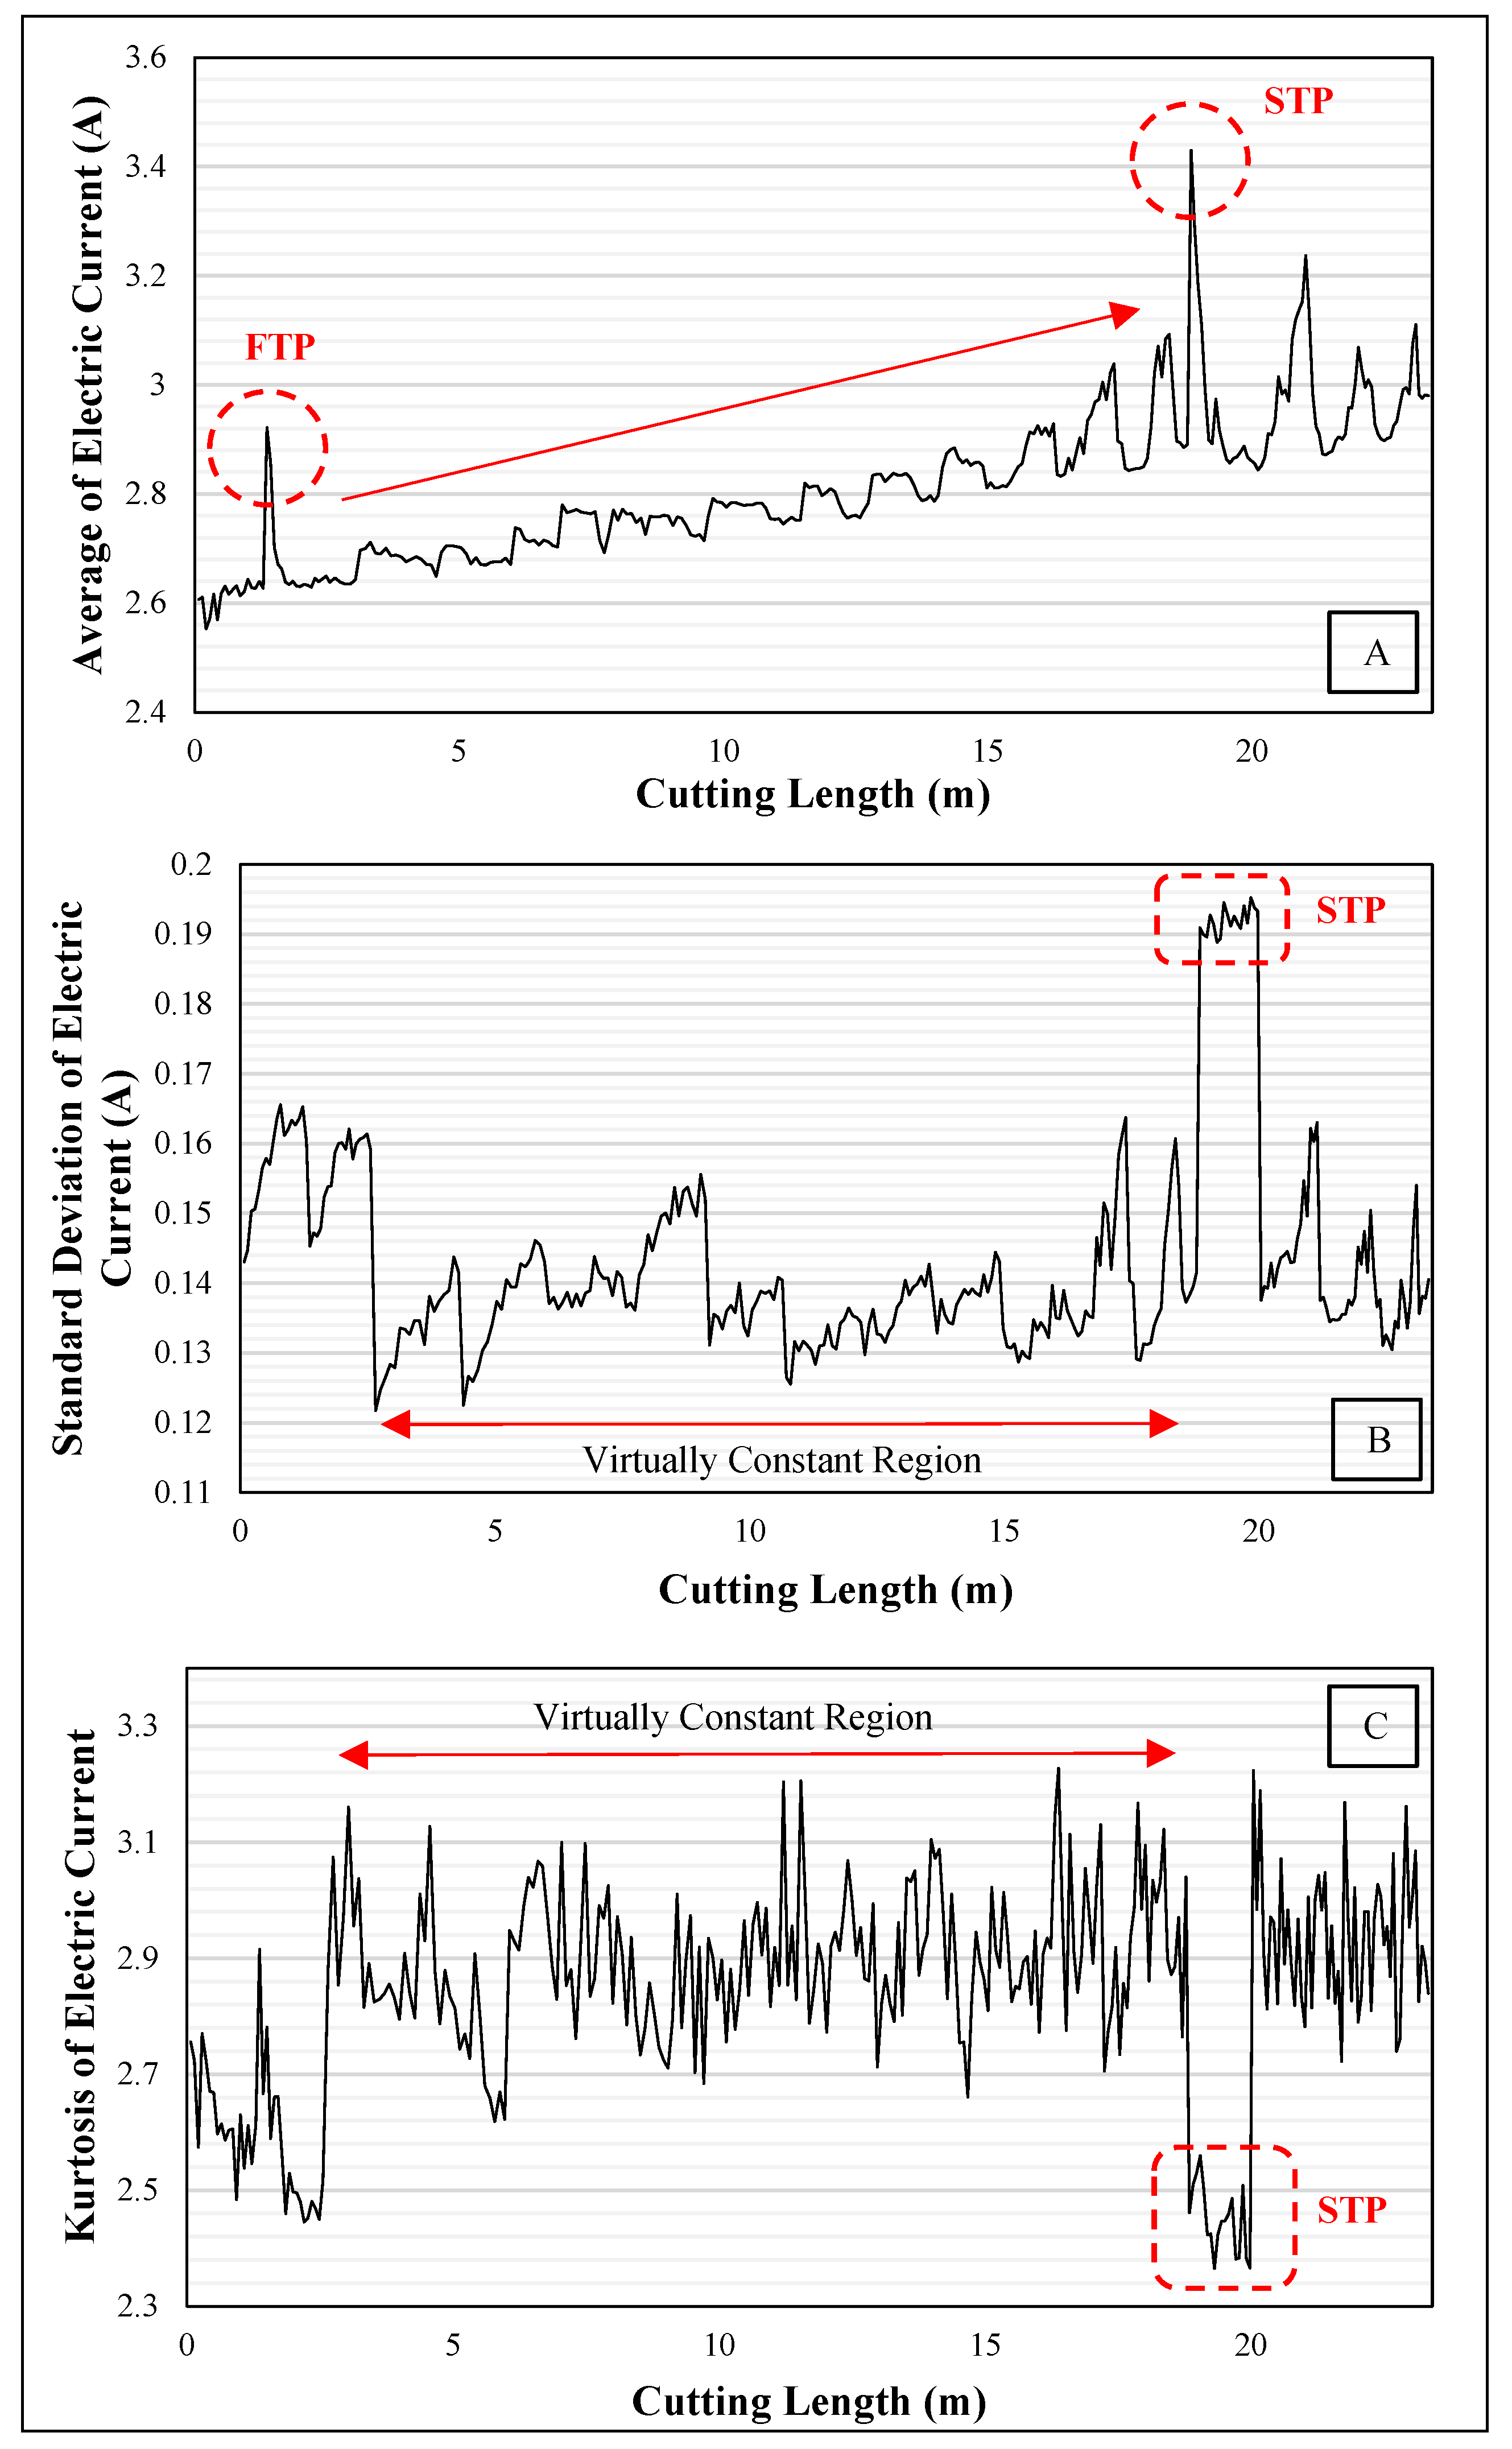
The conventional statistical analysis (average, standard deviation, and kurtosis) was considered in this study to extract more information from the spindle electric current signal, as shown in Figure 8. Generally, the mechanical force required to remove material from the workpiece is provided by electric drives and spindles. The cutting forces are directly related to the spindle electric current. As the cutting tool wears out, the cutting force increases, requiring more power to machine the workpiece, which result in the electric current increase. The average of the spindle electric current signal as a function of the cutting length is illustrated in Figure 8A. The first and second transition points of tool wear clearly appear in the electric current signal average, where the current rose suddenly after 1.3 and 18.8 m of cutting. Tool wear causes a slight increase in the electric current in the second wear stage between FTP and STP. When tool wear becomes severe (third stage of tool wear), the spindle electric current fluctuates, and several peaks appear. The standard deviation of the electric current signal is also shown in Figure 8B. A merely constant region can be seen in this graph, where the current readings are close to the mean with minor variation. Tool wear was expected in this area, and the machined surface quality was acceptable. However, after 18.8 m of cutting, a disruption in the signal appears, where the electric current values spread out over a broader range of mean. Herein, instead of a transition point, a transition area that comprises STP is visible, where the standard deviation increases significantly. This area can also be seen in the kurtosis of the electric current signal, where the kurtosis drops significantly after a merely constant area. Generally, kurtosis describes how a distribution peak and tails depart from the normal distribution. As shown in Figure 8C, there is a disturbance in the electric current signal between 18.8 m to 19.9 m of cutting. The cutting condition remained constant throughout the experiment; the only variation in this experiment was the wear on the cutting tool. This disturbance could therefore be linked to the status of the cutting tool, where the cutting tool wear had become severe enough to modify cutting forces and, as a result, to cause a significant alteration in the electric current signal. This unpredictable behavior in a system is the subject of chaos theory, where the fractal parameters are utilized to predict any change in the signal shape. The next section discusses the fractal analysis of the electric current signal to set a single value as a warning in the machine tool before tool wear reaches a specific level.

3.2. Fractal Analysis

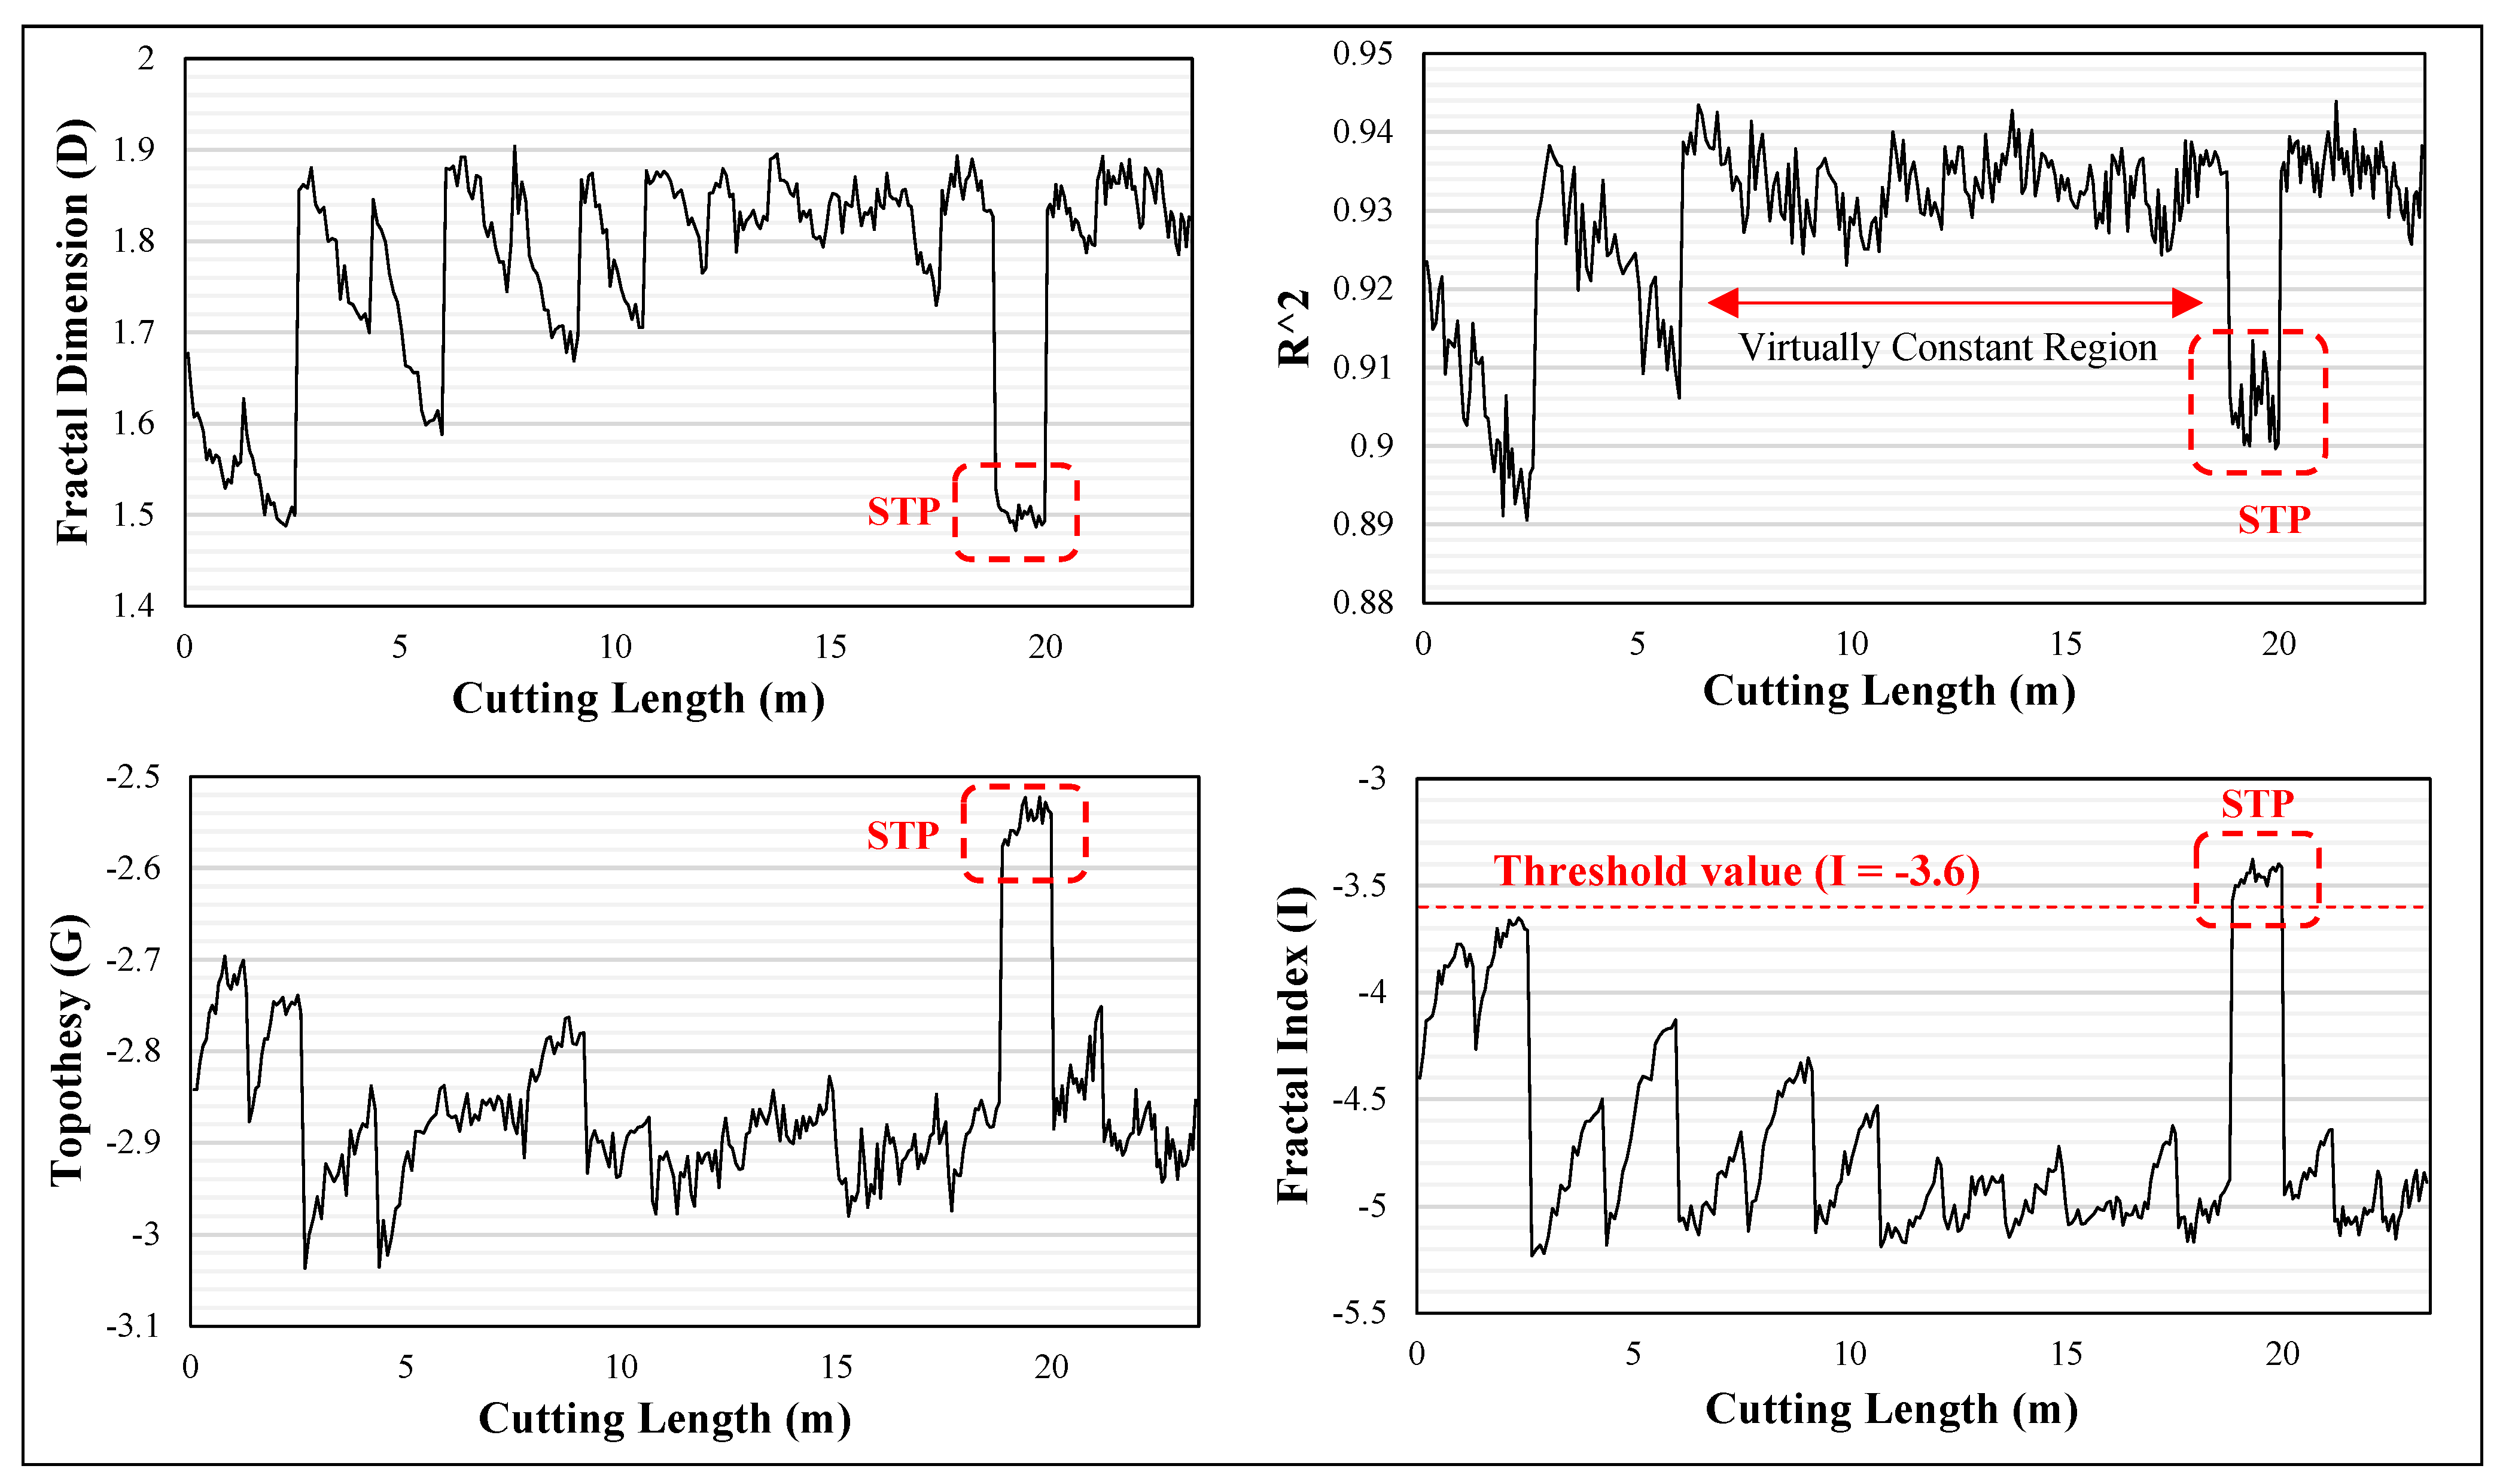
Figure 9 represents the fractal analysis results of the spindle electric current signal during milling of the AISI 5140 steel block. As stated in the previous section, the current signal represents any change in the cutting tool condition. This is of major importance since it may lead to the implementation of an online tool condition monitoring system. Fractal theory attempts to explain and extract properties from the signal so that any change in it may be predicted. Fractal dimension is an indication of the signal “roughness”. As previously indicated, the First Transition Point (FTP) and Second Transition Point (STP) were defined as the points between the first and second wear stages, as well as the second and third wear stages. As seen in Figure 9, fractal dimension (D) exhibited a periodic behavior at the beginning of the machining process and attempted to maintain a consistent behavior at the end. However, due to signal turbulence in the cutting window of 18.8 to 19.9 m, the fractal dimension dropped to an approximate value of 1.5, where the Second Transition Point (STP) of tool wear happens. The result of topothesy also follows the same pattern as fractal dimension; a cyclical behavior at the beginning and a consistent trend at the end. The signal turbulence in the transition area of tool wear causes a sudden increase in the topothesy result. Topothesy represents ruggedness of the signal. The auto-scale regularity of the signal was measured by the coefficient of determination of the linear regression ( R 2 ), which is also shown in Figure 9. A merely constant region could be seen during the cutting process, where the tool wear was normal. R 2 drops within the cutting window of 18.8 to 19.9 m and then tends to resume its stable behavior for the remaining cutting length.
A fractal index is also evaluated to assist the online tool condition monitoring and establish a decision-making system based on all fractal parameters. Using fractal parameters in a combination can express more information about the spindle electric current signal and increase the decision-making system accuracy. The empirical fractal index (I) is defined as follows:
I = D × G × R 2
Figure 9 illustrates the empirical index of the current signal as a function of the cutting length. The magnitude of the fractal index gradually decreases with the cutting length and exhibits a damping behavior until the cutting window of 18.8 to 19.9 m. This turbulence in the signal is identified with a single value. This value is used in online tool condition monitoring as a threshold value to prevent workpiece surface damage due to severe tool wear. The threshold value for the present study was set at −3.6 or lower based on turbulence prediction in the spindle electric current signal to guarantee the cutting tool still is in a perfect operating condition.

4. Conclusions

In smart manufacturing, real-time tool condition monitoring is crucial. The purpose of real time monitoring is to issue an alert before tool wear reaches a critical value. For industrial applications, motor-related parameters for detecting this value are preferred because the machining does not need to be disrupted. In this study, the spindle electric current signal was used for online tool condition monitoring during shoulder milling of an AISI 5140 steel block using a solid carbide end mill. The spindle electric current signal was sampled using the machine tool internal sensor, which meets industrial requirements. Two transition points in the tool wear evolution curve were introduced; First Transition Point (FTP) and Second Transition Point (STP). These transition points were easily recognized on the average of the spindle electric current signal graph. Turbulence was discovered in the spindle electric current signal when standard deviation increased, and kurtosis decreased unexpectedly between 18.8 and 19.9 m of cutting. Fractal analysis was applied to the spindle electric current signal to predict any unexpected turbulence in the signal and to establish a single value in the machine tool as a warning before tool wear became severe. The empirical fractal index (I) was defined based on a combination of the fractal parameters to express more information about the spindle electric current signal and improve the accuracy of the decision-making system. This research provides a proof of concept for the use of fractal analysis as a decision-making strategy in monitoring tool condition. The effectiveness of fractal analysis of the built-in machine tool spindle electric current signal as a decision-making method in tool condition monitoring was demonstrated in this study. However, to evaluate the repeatability of the method, further additional investigation is required.

Author Contributions

Conceptualization, M.J.; methodology, M.J.; software, M.J. and X.R.; validation, M.J.; formal analysis, M.J.; writing—original draft preparation, M.J.; writing—review and editing M.J., X.R., J.-F.C., M.B.; supervision, J.-F.C.; funding acquisition, J.-F.C., M.B. All authors have read and agreed to the published version of the manuscript.

Funding

This research received no external funding.

Data Availability Statement

Not applicable.

Conflicts of Interest

The authors declare no conflict of interest.

References

  1. Drouillet, C.; Karandikar, J.; Nath, C.; Journeaux, A.-C.; El Mansori, M.; Kurfess, T. Tool life predictions in milling using spindle power with the neural network technique. J. Manuf. Process. 2016, 22, 161–168. [Google Scholar] [CrossRef]
  2. Grzesik, W. Wear development on wiper Al2O3–TiC mixed ceramic tools in hard machining of high strength steel. Wear 2009, 266, 1021–1028. [Google Scholar] [CrossRef]
  3. Li, N.; Chen, Y.; Kong, D.; Tan, S. Force-based tool condition monitoring for turning process using v-support vector regression. Int. J. Adv. Manuf. Technol. 2016, 91, 351–361. [Google Scholar] [CrossRef]
  4. Nouri, M.; Fussell, B.K.; Ziniti, B.L.; Linder, E. Real-time tool wear monitoring in milling using a cutting condition independent method. Int. J. Mach. Tools Manuf. 2015, 89, 1–13. [Google Scholar] [CrossRef]
  5. Guo, J.; Wang, X.-Y.; Zhao, Y.; Hou, C.-Y.; Zhu, X.; Cai, Y.-D.; Jin, Z.-J.; Kang, R.-K. On-machine measurement of tool nose radius and wear during precision/ultra-precision machining. Adv. Manuf. 2022, 10, 368–381. [Google Scholar] [CrossRef]
  6. Jamshidi, M.; Chatelain, J.-F.; Rimpault, X.; Balazinski, M. Tool condition monitoring based on the fractal analysis of current and cutting force signals during CFRP trimming. Int. J. Adv. Manuf. Technol. 2022, 1–16. [Google Scholar] [CrossRef]
  7. Liao, X.; Zhou, G.; Zhang, Z.; Lu, J.; Ma, J. Tool wear state recognition based on GWO–SVM with feature selection of genetic algorithm. Int. J. Adv. Manuf. Technol. 2019, 104, 1051–1063. [Google Scholar] [CrossRef]
  8. Li, X.; Liu, X.; Yue, C.; Liang, S.Y.; Wang, L. Systematic review on tool breakage monitoring techniques in machining operations. Int. J. Mach. Tools Manuf. 2022, 176, 103882. [Google Scholar] [CrossRef]
  9. Rmili, W.; Ouahabi, A.; Serra, R.; Leroy, R. An automatic system based on vibratory analysis for cutting tool wear monitoring. Measurement 2016, 77, 117–123. [Google Scholar] [CrossRef]
  10. Li, D.-D.; Zhang, W.-M.; Li, Y.-S.; Xue, F.; Fleischer, J. Chatter identification of thin-walled parts for intelligent manufacturing based on multi-signal processing. Adv. Manuf. 2020, 9, 22–33. [Google Scholar] [CrossRef]
  11. Choi, Y.J.; Park, M.S.; Chu, C.N. Prediction of drill failure using features extraction in time and frequency domains of feed motor current. Int. J. Mach. Tools Manuf. 2008, 48, 29–39. [Google Scholar] [CrossRef]
  12. Wang, K.-S. Towards zero-defect manufacturing (ZDM)—A data mining approach. Adv. Manuf. 2013, 1, 62–74. [Google Scholar] [CrossRef]
  13. Arslan, H.; Er, A.O.; Orhan, S.; Aslan, E. Tool Condition Monitoring in Turning Using Statistical Parameters of Vibration Signal. Int. J. Acoust. Vib. 2016, 21, 371–378. [Google Scholar] [CrossRef]
  14. Pyatykh, A.S.; Savilov, A.V.; Timofeev, S.A. Method of Tool Wear Control during Stainless Steel End Milling. J. Frict. Wear 2021, 42, 263–267. [Google Scholar] [CrossRef]
  15. Jamshidi, M.; Rimpault, X.; Balazinski, M.; Chatelain, J.-F. Fractal analysis implementation for tool wear monitoring based on cutting force signals during CFRP/titanium stack machining. Int. J. Adv. Manuf. Technol. 2020, 106, 3859–3868. [Google Scholar] [CrossRef]
  16. ISO 8688-2:1989; Tool Life Testing in Milling—Part 2: End Milling. American National Standards Institute (ANSI): Co-lumbia, WA, USA, 1989.
  17. Mandelbrot, B.B. The Fractal Geometry of Nature; W.H. Freeman: New York, NY, USA, 1982. [Google Scholar]
  18. Chuangwen, X.; Hualing, C. Fractal analysis of vibration signals for monitoring the condition of milling tool wear. Proc. Inst. Mech. Eng. Part J: J. Eng. Tribol. 2009, 223, 909–918. [Google Scholar] [CrossRef]
  19. Zuo, X.; Zhu, H.; Zhou, Y.; Yang, J. Estimation of fractal dimension and surface roughness based on material characteristics and cutting conditions in the end milling of carbon steels. Proc. Inst. Mech. Eng. Part B J. Eng. Manuf. 2015, 231, 1423–1437. [Google Scholar] [CrossRef]
  20. Sahoo, P.; Barman, T.; Davim, J.P. Fractal Analysis in Machining; Springer Science & Business Media: Berlin/Heidelberg, Germany, 2011. [Google Scholar]
  21. Feng, Z.; Zuo, M.J.; Chu, F. Application of regularization dimension to gear damage assessment. Mech. Syst. Signal Process. 2010, 24, 1081–1098. [Google Scholar] [CrossRef]
  22. Rimpault, X.; Chatelain, J.-F.; Klemberg-Sapieha, J.; Balazinski, M. Tool wear and surface quality assessment of CFRP trimming using fractal analyses of the cutting force signals. CIRP J. Manuf. Sci. Technol. 2017, 16, 72–80. [Google Scholar] [CrossRef]
  23. Rimpault, X.; Bitar-Nehme, E.; Balazinski, M.; Mayer, J. Online monitoring and failure detection of capacitive displacement sensor in a Capball device using fractal analysis. Measurement 2018, 118, 23–28. [Google Scholar] [CrossRef]
  24. Guo, M.-X.; Liu, J.; Pan, L.-M.; Wu, C.-J.; Jiang, X.-H.; Guo, W.-C. An integrated machine-process-controller model to predict milling surface topography considering vibration suppression. Adv. Manuf. 2022, 10, 443–458. [Google Scholar] [CrossRef]
  25. ISO 25178-2; Geometrical Product Specifications (GPS)—Surface Texture: Areal—Part 2: Terms, Definitions and Surface Texture Parameters. ISO: Geneva, Switzerland, 2012; p. 47.
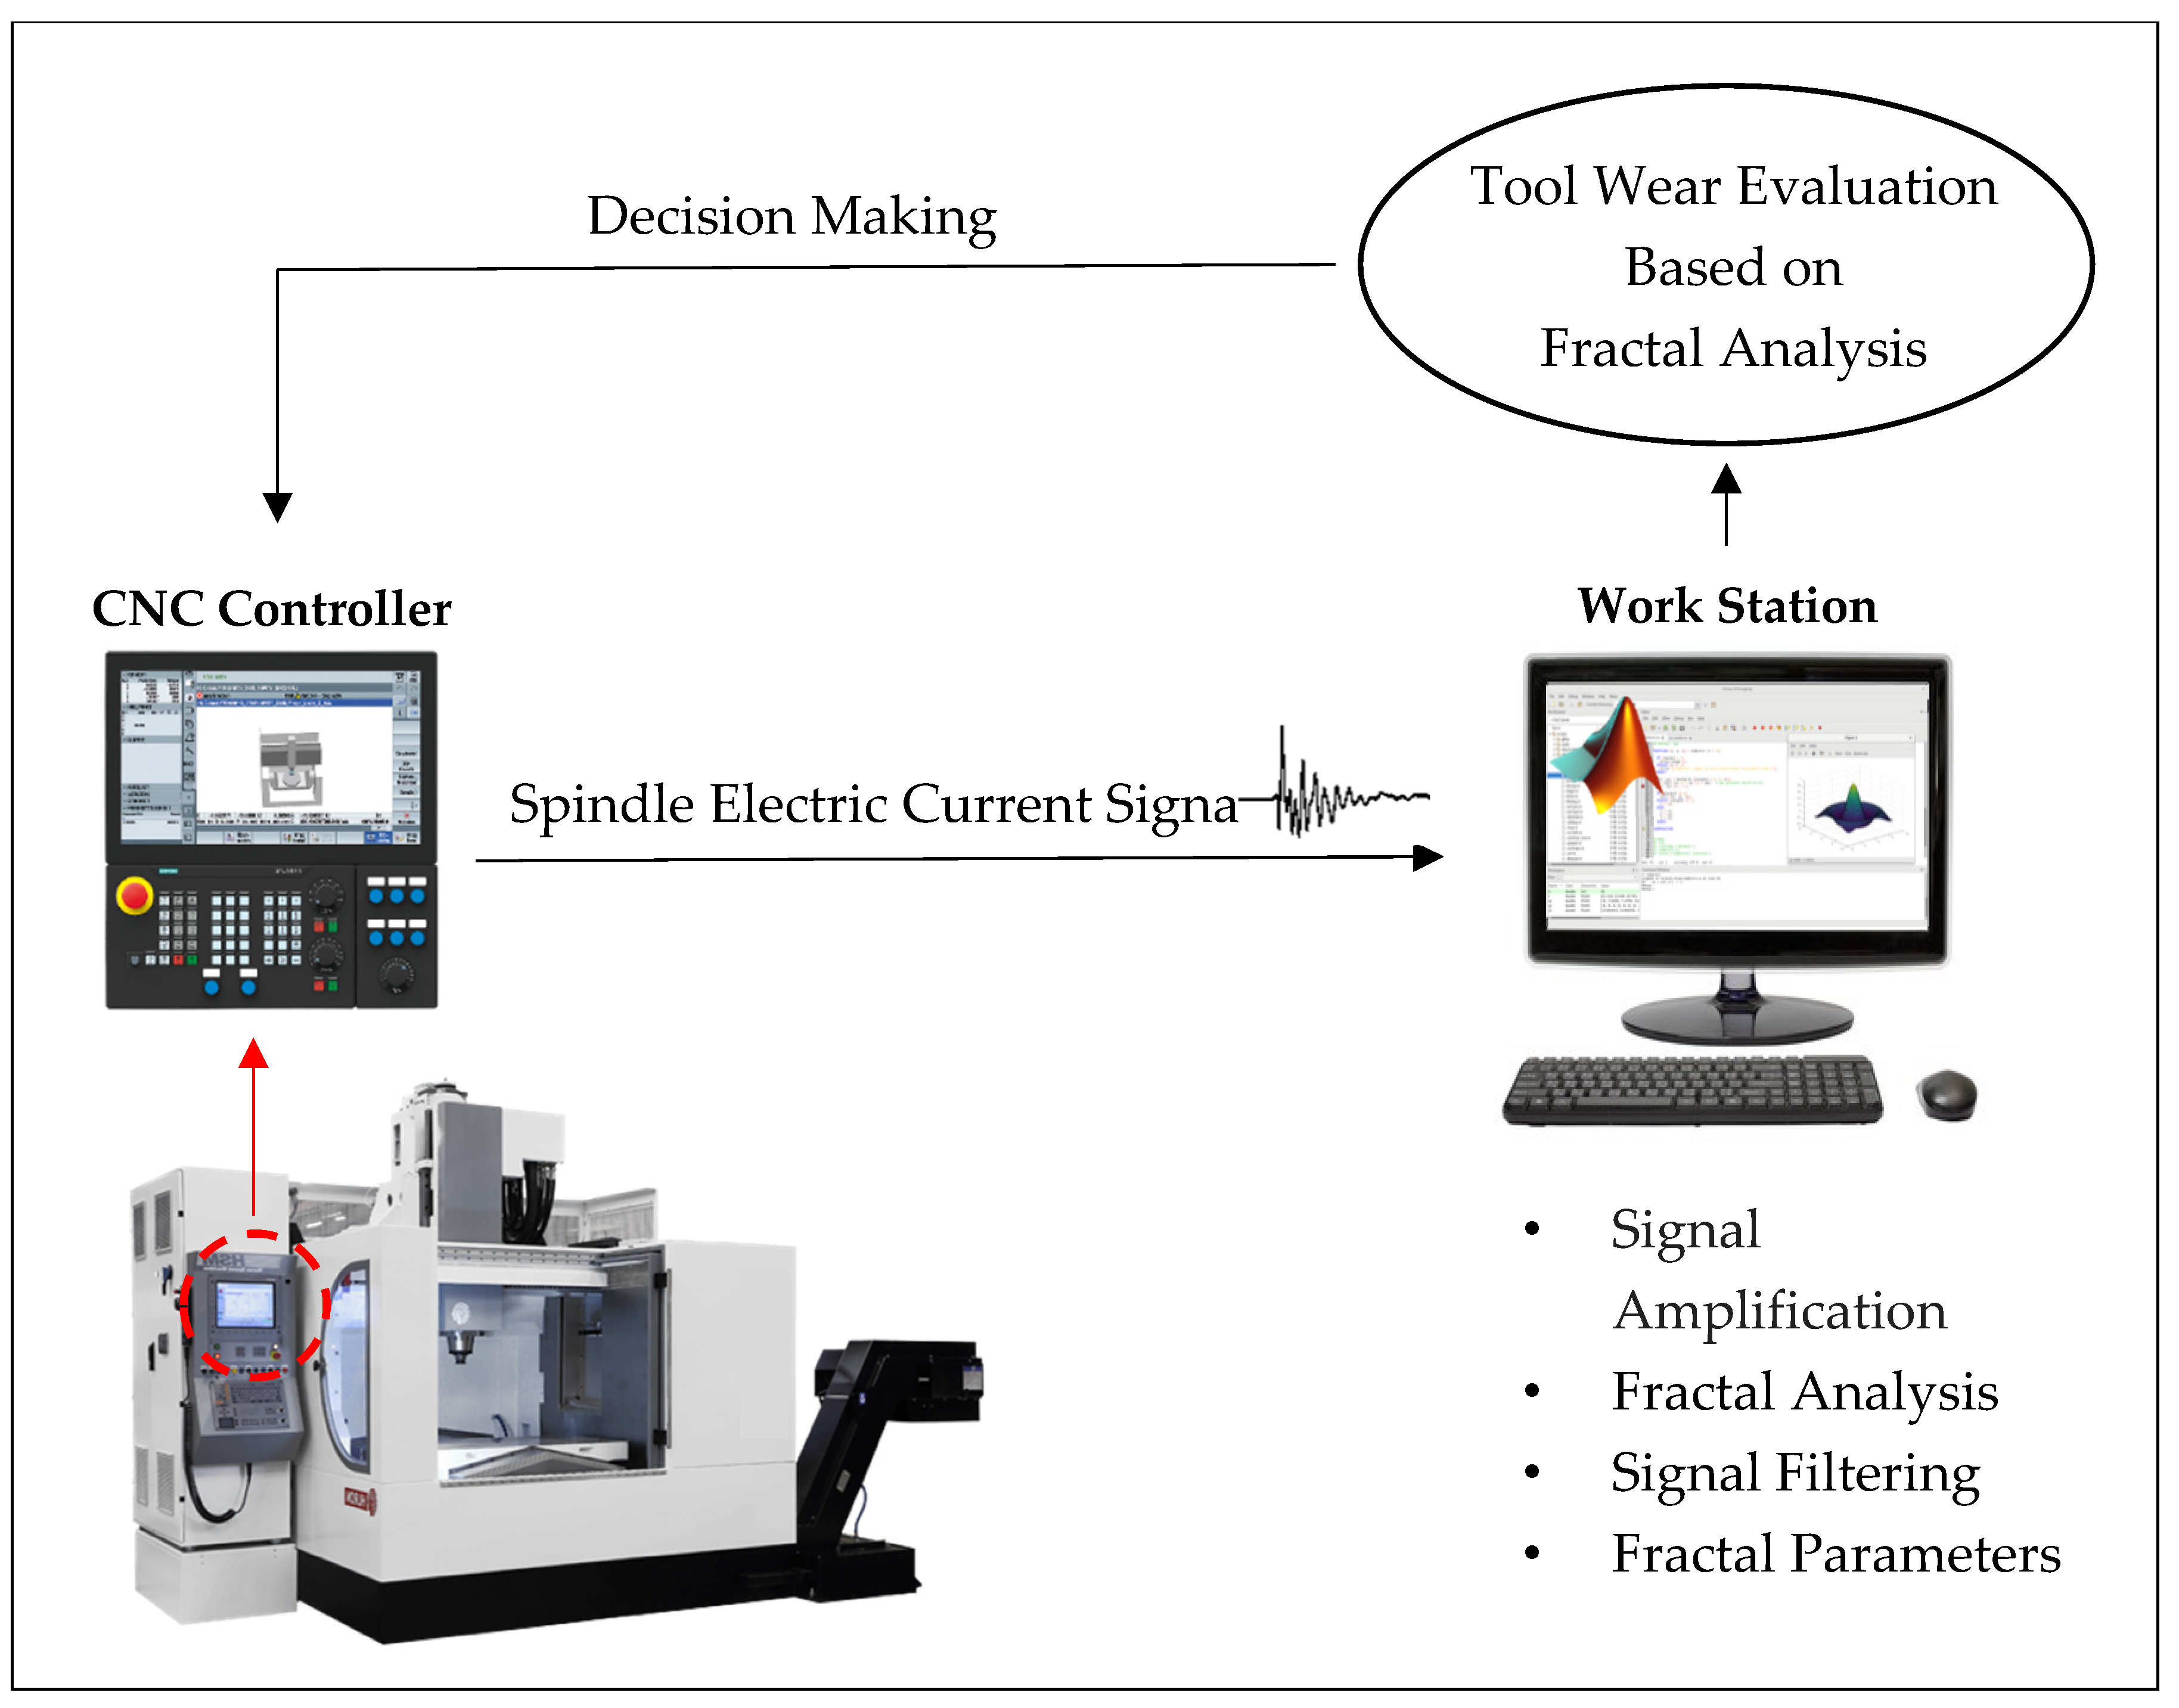
Figure 1. Indirect method of tool condition monitoring using spindle electric current signal.
Jmmp 06 00115 g001
Figure 2. The experimental setup.
Jmmp 06 00115 g002
Figure 3. Regularization analysis of the spindle electric current signal. The plot expresses two graphs as an example in log format.
Jmmp 06 00115 g003
Figure 4. Tool wear evolution curve of the solid carbide end mill for 23.33 m of shoulder milling of AISI 5140 steel block.
Jmmp 06 00115 g004
Figure 5. Areal surface roughness parameter ( S a ) as a function of cutting length.
Jmmp 06 00115 g005
Figure 6. Image and surface map of a steel block; areal surface roughness parameter ( S a ) as a function of cutting length.
Jmmp 06 00115 g006
Figure 7. Electric current signal related to the spindle as a function of machining time.
Jmmp 06 00115 g007
Figure 8. The conventional statistical analysis of the spindle electric current signal. (A) The average of the spindle electric current signal as a function of the cutting length (B) The standard deviation of the electric current signal as a function of the cutting length (C) The kurtosis of the electric current signal as a function of the cutting length.
Jmmp 06 00115 g008
Figure 9. The fractal parameters of the spindle electric current signal during shoulder milling of the AISI 5140 steel block.
Jmmp 06 00115 g009
Table 1. General chemical properties of AISI 5140 steel.
ElementFeMnCrCSiSP
Content (%)97.395–98.070.7–0.90.7–0.90.38–0.430.15–0.3≤0.04≤0.035
Table 2. Mechanical properties of AISI 5140 steel.
PropertiesTensile StrengthYield StrengthElastic ModulusPoisson’s RatioHardness
570 MPa295 MPa189,998–210,000 MPa0.27–0.30167 (Brinell)
Table 3. Cutting conditions.
Cutting SpeedFeed RateRadial Depth of Cut (RDOC)Axial Depth of Cut (ADOC)
18336 RPM465.73 mm/min0.64 mm3 mm
Publisher’s Note: MDPI stays neutral with regard to jurisdictional claims in published maps and institutional affiliations.