Article

Influences of Surface, Heat Treatment, and Print Orientation on the Anisotropy of the Mechanical Properties and the Impact Strength of Ti 6Al 4V Processed by Laser Powder Bed Fusion

1
Joanneum Research—Materials, Leobnerstraße 94, 8712 Niklasdorf, Austria
2
IMAT Institute of Material Science, Joining and Forming, Graz University of Technology, Kopernikusgasse 24/1, 8010 Graz, Austria
3
CEST Kompetenzzentrum für Elektrochemische Oberflächentechnologie, 2700 Wiener Neustadt, Austria
*
Author to whom correspondence should be addressed.
J. Manuf. Mater. Process. 2022, 6(4), 87; https://doi.org/10.3390/jmmp6040087
Submission received: 28 June 2022 / Revised: 6 August 2022 / Accepted: 9 August 2022 / Published: 14 August 2022
(This article belongs to the Special Issue Metal Additive Manufacturing and Its Post Processing Techniques)

Abstract

:
The scope of this work is to provide an overview of the influences of process parameters, print orientation, and post-process treatments of Ti6AlV4 processed by laser powder bed fusion on its microstructure and physical and mechanical properties and their anisotropic behavior. To avoid the influence of changes in powder quality and ensure comparability, experiments were carried out using a single batch of virgin powder. First, characterization of the density and surface roughness was performed to optimize the process parameters utilizing design of experiment. Tensile, notched bar impact and compression test specimens were built in three different orientations: vertically, horizontally, and inclined at 45° to the build plate. Later, the influence of the staircase effect and the possible course of anisotropy from vertical to horizontal were investigated. Subsequently, heat treatments for stress relief, furnace annealing, and hot isostatic pressing were performed. In addition to as-built samples, mechanical machining and a two-step electrochemical polishing surface treatment were applied to investigate the influence of the surface roughness. With parameter optimization, a relative density of 99.8% was achieved, and surface roughness was improved over default parameters, reducing Ra by up to 7 µm. Electrochemical polishing is a viable way to decrease the surface roughness. An Ra value of 1 µm and an Rz value of 4 µm can be achieved for 45° downskin surfaces with as-built surface roughness values of Ra 24 µm and Rz 117 µm. As-built and stress-relieved conditions show little anisotropy in their yield and tensile strength (max 2.7%), but there is a strong influence of the build orientation on necking, and brittle fracture behavior is shown due to the martensitic microstructure (up to 70%). Heat treatment can increase the ductility and further decrease the strength anisotropy with both furnace annealing and hot isostatic pressing delivering similar results for tensile properties, while angled samples exhibit behavior that is closer to vertical than horizontal, indicating a non-linear change in break behavior. Electrochemical polishing increases fracture necking, and its isotropy drastically increases from 4% to over 30% compared with as-built parts, which is close to the level of the machined specimen.

1. Introduction

Although titanium and its alloys are expensive materials, their strength, corrosion resistance, and lightweight properties have made them indispensable for many technical applications, especially in the aircraft industry. The most commonly used and best studied alloy is Ti6Al4V (Ti64), which has a two-phase α + β structure [1]. In order to save costs from high material losses in mechanical processing (e.g., up to 95% in machining processes) and to enable complex geometries of components that are not feasible with subtractive processes, additive manufacturing (AM) processes, such as laser powder bed fusion (L-PBF), are of increasing interest [2,3,4,5].
However, to apply L-PBF to structural (aerospace) components, exact knowledge of the mechanical strength and possible anisotropy under consideration of all influencing factors is required, and optimization of the process parameters is advisable.
Previous work indicates some major drawbacks of L-PBF considering the technical requirements of Ti64, which are as follows: (i) the rapid cooling rates and high temperature gradients lead to distortion and a non-equilibrium microstructure; (ii) the unidirectional build direction leads to anisotropic grain growth [2,6,7,8,9,10], which may result in anisotropic and differing material behavior compared with classic production processes; (iii) the surface roughness of L-PBF parts is higher due to various effects. First, the layer-wise build process leads to a staircase effect, especially for downskin surfaces [5]. Secondly, the particle and laser spot size combined with the welding process limit the possible minimal roughness; (iv) the powder properties, such as its chemical composition, morphology, and number of reuse cycles, have major impacts on the density as well as the mechanical properties [11,12].
Within this work, these issues are addressed by process parameter optimization and by applying different post-process heat and surface treatments, including stress relief to reduce the residual stresses, furnace annealing to achieve a stable α + β microstructure, and hot isostatic pressing of the microstructure to increase the density [13,14,15,16]. Concerning the influences of the surface roughness and the possible sub-surface pores on the static mechanical properties, mechanical machining and electrochemical polishing are applied. The latter is of special interest for AM designs, because it is a feasible way to treat complex structures, such as lattices, undercuts, and surfaces of higher order.
Until now, the effects of anisotropy have only been investigated in vertical and horizontal specimens. In order to fully understand the effects and influencing factors and to aid in the future design of structural components, an additional specimen type at a 45° angle to the build plate was tested. This orientation maximizes the staircase effect without the need for support structures. For tensile tests, cylindrical specimens were used instead of flat bones to minimize (i) the support structures and (ii) the influence of orientation around the longitudinal axis [2]. Tensile tests were then supplemented with compression tests to investigate the elastic regime and rounded off by the notched bar impact test to assess dynamic break behavior.
Finally, all tests were performed using only virgin powder from a single production batch to rule out any influence of changing powder properties [11,12,17], as such effects can be greater than the effects of parameters, orientation, and post-process treatments. This enabled the comparability of post-process treatments and orientation, which is not the case for previous studies.

2. Materials and Methods

To ensure perfect comparability of the results, the morphology and chemical composition of the powder were investigated. The latter was determined using various analytical methods. The oxygen and nitrogen contents were determined by hot extraction in helium using a LECO TCH 600 (LECO, Saint Joseph, MO, USA) (ASTM E 1409-13). The hydrogen concentration was measured using the inert gas fusion thermal conductivity method (JUWE H-Mat 2500 analyzer (JUWE, Viersen, Germany), ASTM E 1447-09) and argon was measured using mass spectrometry (IPI ESD 100, (InProcess Instruments, Bremen, Germany)). The aluminum content was investigated by inductively coupled plasma optical emission spectrometry.
The particle size distribution (PSD) as well as the sphericity of the powder were measured in accordance with ISO 13322-2 through a dynamic image analysis using a CAMSIZER XT (Retsch, Haan, Germany). The flow properties were determined with a 2.5 mm Hall flow meter (ASTM B 213-17) and a Carney flow meter (ASTM B924). The bulk density was measured in accordance with the ASTM B212 standard.
In order to optimize the process parameters for the density, distortion, and the powder used, a 2-step DoE model was created using the open-source software StudioR. The optimization was based on correlations between the process parameters and density found in the work of Thijs et al. [10], Dilip et al. [18], and Kasparovich et al. [19]. The DoE experiment table was established using the Fedorov operator, while for the evaluation, different statistical models were applied and tested. The DoE Model was set to 20 experiments with an energy density limit of between 40 and 70 J/mm3, including the default parameter set from the EOS.
The density was measured using Archimedes tests on a Radwag PS 210 X2 digital scale (Radwag, Radom, Poland) in accordance with the ISO 3369:2006 standard, and all measurements were repeated 5 times. Different cube sizes (10, 15, and 20 mm) were used to determine the influence of the sub-surface porosity. The evaluation of the sub-surface porosity density of the infill sections was investigated using two different microscopes (Keyence VHX500 digital microscope (Keyence, Osaka, Japan) and Leica Aristomet (Leica, Wetzlar, Germany)) and corresponding picture analyzing software (Keyence/LAS). With the digital microscope, the whole cross-section of a vertical cut cube was scanned, while 3 sectional pictures of vertical and horizontal cross-sections were measured when using a Leica microscope. Distortion was measured using horizontal cantilever beams by cutting massive support structures to print and measure translation in the z-axis (Figure 1).
Contour parameters were optimized to improve the surface roughness. After selecting the possible parameters via the optical evaluation (Olympus SZX10 stereomicroscope (Olympus, Tokyo, Japan)) of single line tests, the roughness values of the vertical and 45° angled samples were measured using a mechanical Mitutoyo SJ-210 portable roughness measurement device (Mitutoyo, Kawasaki, Japan) for optimization. Table 1 shows the parameters used for the line tests. Three layers of cubes using only contour parameters were printed. All samples were produced on an EOS EOSINT M280 machine (EOS, Munich, Germany) equipped with a 400 W Nd:YAG Laser in an Argon 5.0 protective atmosphere.
After L-PBF, all samples underwent stress relief (SR) heat treatment (2 h at 650 °C, heating rate of 30 K/min, cooling rate of 5 K/min) using a Linn High Therm VMK-135 furnace (Linn High Therm, Hirschbach, Germany) flooded with Ar 5.0. Some of the samples were furnace annealed (FA) (2 h at 800 °C, heating rate of 30 K/min, cooling rate of 5 K/min) in a vacuum furnace, while others underwent hot isostatic pressing in a QUINTUS QIH213 HIP furnace (Quintus, Västerås, Sweden).
As-built samples were removed from the build plate using a band saw (Jaespa Concept 265 GTH (Jaespa, Spangenberg, Germany) and cleaned in an ultrasonic bath for 15 min. Machined specimens were mechanically treated to the final specimen size according to the ASTM standard using various CNC turning machines.
For electrochemical polishing, specimens were first prepared by chemical pickling in acid according to the AIRBUS specifications 80-T-35-0106 to limit the increase in the oxide layer after SR heat treatment. Polishing took place in a temperature- and flow-controlled organic AlCl3/ZnCl2 electrolyte. In order to optimize the process parameters, as-built samples were used without heat treatment in the first step. The surface roughness was measured using a Keyence VHX digital optical microscope (able to measure the area surface roughness (Sq, Sa, Sz)) and a mechanical Mitutoyo SJ-210 portable roughness measurement device, where the middle value of the 3-line roughness (Rq, Ra, Rz) measurements was used.
For the characterization of mechanical properties, tensile, compression, and notched bar impact tests were performed at different orientations (vertical, 45°, and horizontal) and under different heat treatments (stress relief, furnace annealed, and HIP). The 45° specimen was introduced to give a more application-orientated view of the mechanical properties, since load cases of components rarely have just vertical or horizontal orientations, and a linear transition of properties cannot be expected. Tensile tests were performed on a Zwick Roell universal test rig (Zwick Roell, Ulm, Germany) at a rate of 1 mm/min using cylindrical samples in accordance with the ASTM 8 standards. For the notched bar impact test (Charpy), a 300 J W Testor Type PW30/15 Hammer (Buehler, Uzwil, Switzerland) and a 10 × 10 × 55 mm³ specimen with printed notches, in accordance with ASTM E23, were used, since the related body of literature [20,21,22,23] shows a negligible difference between printed and EDM-cut notches. Compression tests took place at Material Center Leoben MCL in accordance with ASTM E9 using an Instron 8802/8802K9832 (Instron, Norwood, MA, USA) and machined, cylindrical samples, which were 12 mm in diameter and 30 mm in length. The abbreviations for the specimens’ conditions are summarized in Table 2. and may be used in a combined form (e.g., VSRAB for vertical stress relieved as-built specimen).
Material anisotropy for tensile, compression, and Charpy samples was evaluated using the difference in the middle value of a property for one orientation compared with the middle value of all orientations for a singular heat and surface treatment. As an example, Equations (1)–(3) show the formulas for the percentile anisotropy for the UTS of the VFA AB samples:
Middle value UTS (VFAAB) − Middle value UTS (VFAAB; FFAAB; HFAAB) = ∆UTS
% Anistropy UTS (VFAAB) = 100/(Middle value UTS (VFAAB; FFAAB; HFA B)) ∗ ∆UTS
Middle value UTS (VFAAB) = (UTS(VFAAB) + UTS(FFAAB) + UTS(HFAAB))/3

3. Results and Discussion

3.1. Powder Characterization

The commercially available gas-atomized Grade 5 powder used for this process showed a PDS suitable for L-PBF with a sufficient sphericity. The chemical composition can be found within the ASTM B265 standard values for Grade 5 Ti64. The bulk density was 52% of the full density with no flowability measurable by the Hall flow meter due to blockage. Instead, a wider Carney flow meter with a flow rate of 8.4 s/50 g had to be used (Table 3). This did not affect the recoating in the machine type used but could be noticed when handling the powder.

3.2. Parameter Optimization and Density

Table 4 shows the sets of parameters for the selected variables and limits created using the Fedorov operator. The energy density was confined to between 40 and 70 J/mm3 with set 11 being the default set recommended by the machine manufacturer for their own powder. The relative density was above 99.5% for most parameters; only those set with energy densities below 43 J/mm3 showed more porosity. This made it challenging to achieve a statistically relevant DoE model. However, visible cracks were observed for sets with high scan speeds and/or high laser power levels; hence, crack formation was included in DoE models 6 and 7.
In Table 5, the suggested parameter sets for the seven statistical models and the resulting densities are shown. For every model, parameters at the default laser power of 280 W and the suggested set for the highest density were measured using cubes with side lengths of 10, 15, and 20 mm. A trend toward a higher density for larger cubes was evident. Furthermore, the distortion of the cantilevers for the sets with the highest overall density was measured, with the default set performing best with a 2.96 mm vertical displacement.
Figure 2 shows that the main area of porosity was the sub-surface area. With an increase in volume compared with the surface, the density increased linearly for the measured cube sizes. To prove these results, the infill density was investigated with a light microscope using image-processing software. As shown in Table 6, for the same set of process parameters, the infill porosity was below 0.03%, confirming the uneven porosity distribution.
However, porosity results found in the literature depend highly on the measurement method used. While Leuders et al. [13] found a similar porosity of 0.23% by using X-ray tomography, others [10,14] stated lower values down to 0.01%, because the 2D measurement method does not take sub-surface pores into account. Although Kasparovich et al. [19] used 3D tomography to investigate the porosity, they did not show the effect of sub-surface pores, because the specimen cubes were cut out of the infill material, hence supporting the theory of an increased sub-surface porosity. Kasparovich et al. [14] showed a positive effect of HP on the overall porosity. Furthermore, the assumed nominal density can influence the results of the Archimedes method. Gong et al. [24] used 4.41 g/cm3, whereas in this work, a value of 4.43 g/cm3 was assumed, considering the powder composition. The increased accumulation of pores beneath the surface also explains the fatigue results found in previous work [25], where machined specimens outperformed electrochemically polished ones. Hence, the zone of increased porosity must be between 0.1 and 0.9 mm of the surface. For the final test specimen parameter, set 11 was used for the infill parameters due to its high density, lowest distortion, and enhanced comparability with results from other work.
Considering the optical evaluation, parameters with a line energy of 0.25 J/mm2 were used for further tests. Nearly all tested parameter sets were superior to the default set of parameters for the vertical (standard) and upskin walls. In the case of downskin walls, the default parameters showed the best results, since their energy density is reduced compared to the standard and upskin walls. For the final surface parameters, set 5 was chosen for the standard, set 6 was chosen for the upskin, and the default parameters were used for the downskin walls. Contour parameters (final roughness values for the sets used are indicated in bold) and the relevant surface roughness are shown in Table 7.

3.3. Heat Treatment and Microstructure

After L-PBF, the material showed a martensitic microstructure due to the fast cooling rates used in the process [26]. Figure 3 compares the different microstructures after heat treatments (SR and FA) and HIP. After SR (Figure 3a), the microstructure was finer with a partially decomposed martensitic phase and a small β phase due to the low temperature of the treatment, which is way below the β transus temperature. Similar findings were discovered by Baitimerov et al. [17] using conditions of 3 h and 650 °C. When the material was heat-treated at 800 °C and cooled in the furnace, stabilized and coarser α laths were observed in the β phase (Figure 3b).
The microstructure after HP (Figure 3c) showed a similar morphology and phase content to the furnace-annealed sample. The results for FA are in accordance with those of Kasparovich et al. [14] and Leuders et al. [13], who investigated furnace annealing at 700 °C and 900 °C and 800 °C, respectively. However, both produced a coarser microstructure for HP. Facchini et al. [16] showed similar microstructures but gave no specific information about the heat treatments performed.

3.4. Surface Treatment

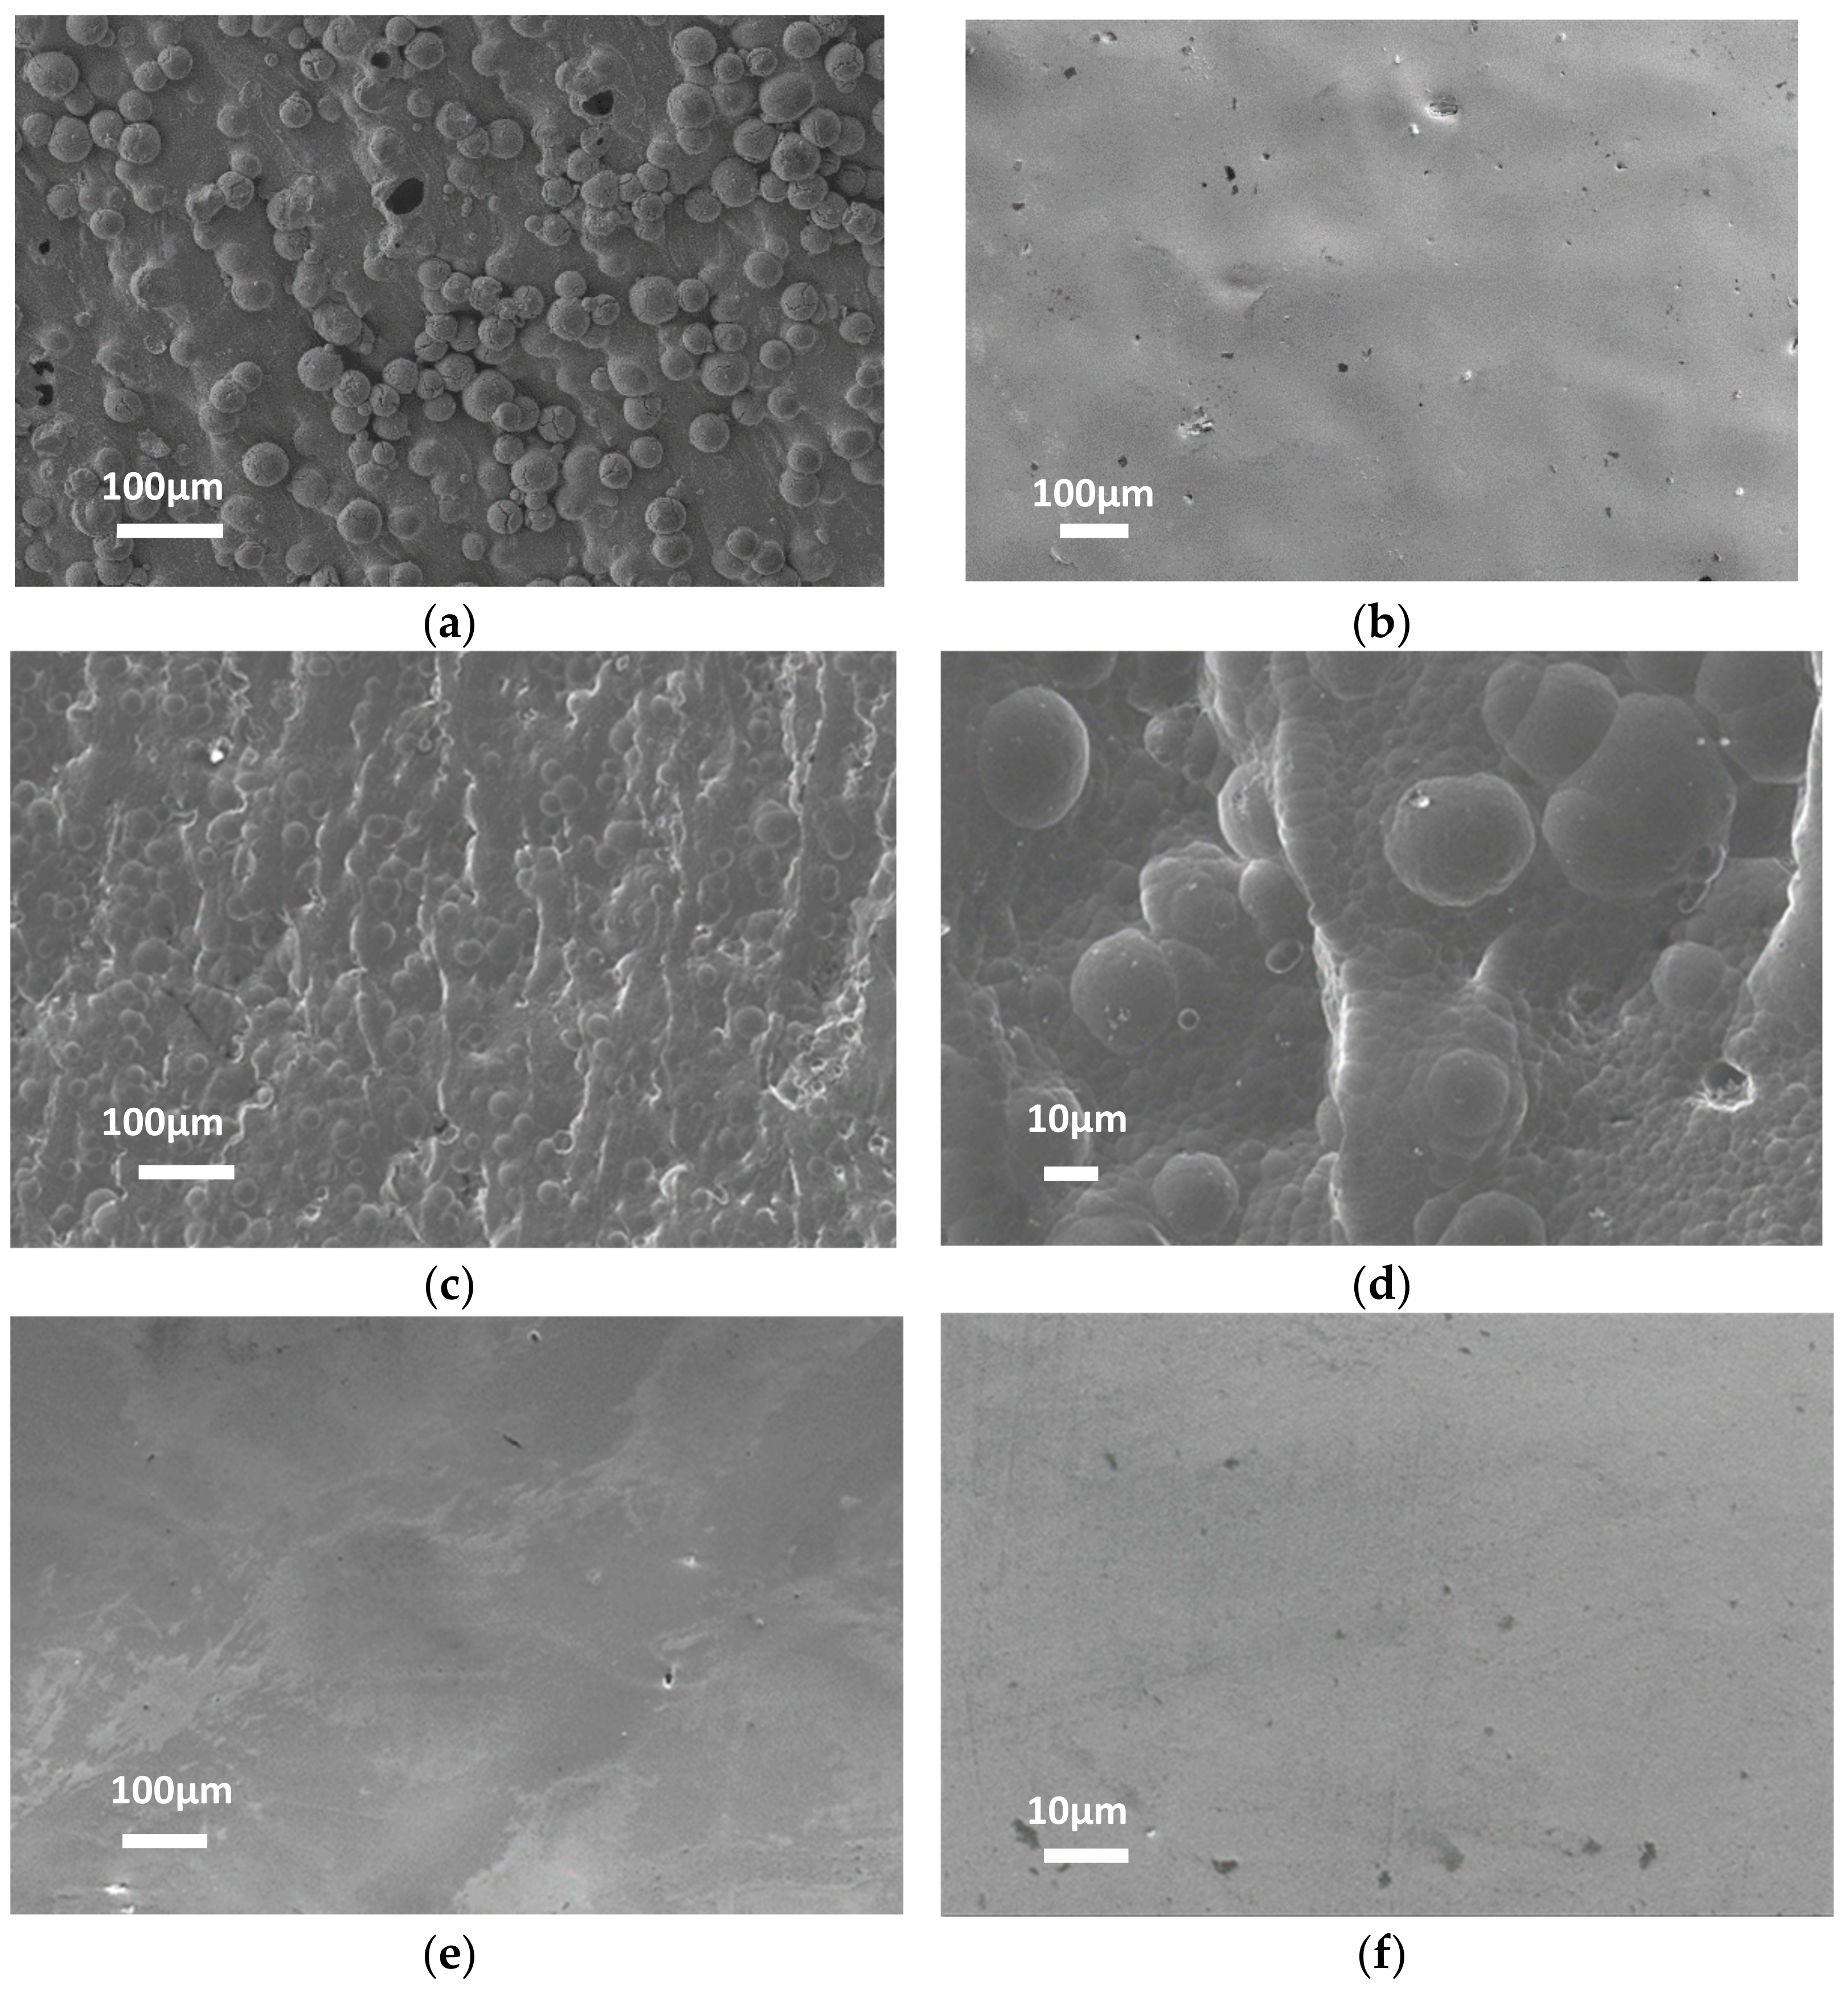
In a first step, EP surface treatment was used under non-heat-treated conditions for as-built specimens with a vertical orientation. Figure 4 shows the relevant surfaces. The as-built surface has a rather chopped surface topology with numerous partly melted particles attached (Figure 4a), while after EP, a slightly wavy surface without any particles but a silver mirroring appearance was achieved (Figure 4b). The visible black dots indicate the sub-surface porosity exposed by the material removed in the EP process.
For heat-treated (SR, FA, and HP) specimens, a pickling step was added to remove the increased oxide layer (Figure 4c,d). While the surface produced after EP showed a similar mirroring appearance as that produced for non-heat-treated samples (Figure 4e,f), pickling seemed to remove some of the unmelted particles together with the oxide layer (Figure 4d). An average ablation rate of 575 g/m2 or 114 µm for the process was measured and must be considered for technical applications.
For AB specimens, optical and mechanical measurements were in line with these results, validating the use of the optical method for rough surfaces. The difference when comparing Sz with Rz is expected. For smoother Ma and EP surfaces, optical measurement seems to be an inadequate method, since the results were in the same range as those for the AB specimen, despite microscopy as well as the optical and haptic appearances indicating otherwise (Table 8).
MA resulted in the expected homogenization and surface improvement for all orientations with Ra values of 0.4 µm for V, 0.7 µm for H, and 0.9 µm for F; and Rz values of 2.6, 4.5, and 6.2 µm, respectively. F orientated samples still showed a rougher surface, indicating that the microstructure orientation has an effect on machining.
EP improves the surface roughness, but it is not independent of the original surface properties. For upskin surfaces, Ra improvements were closer to those of MA with 0.8 µm for H, 1.4 µm for V, and 1.9 µm for F, while for downskin surfaces, they were relatively rougher: 3.8 µm for F and 4.4 µm for H. The same effect was observed for Rq and Rz. This indicates that the impact of EP differs depending on the reasons for surface roughness (e.g., staircase effect, balling, residuals of support structures, etc.). The roughness achieved for vertical samples was similar to that shown in the work of Yang et al. [27] for EBM samples using the same electrolyte, while the surface roughness was superior with lower ablation rates compared with the L-PBF samples produced by Yang et al. [28]. Mower et al. [29] could not achieve any reduction in the surface roughness using MA or EP, having an Sa of 10–13 µm for all conditions.
EP can reduce the rather rough surfaces achieved for L-PBF of around Ra 6 to 20 µm to a level closer to that of the MA specimen: 1–4.5 µm for EP and around 1 µm for MA. However, the final roughness achieved by EP strongly depends on the AB roughness of the area, which must be considered for technical applications.

3.5. Mechanical Properties

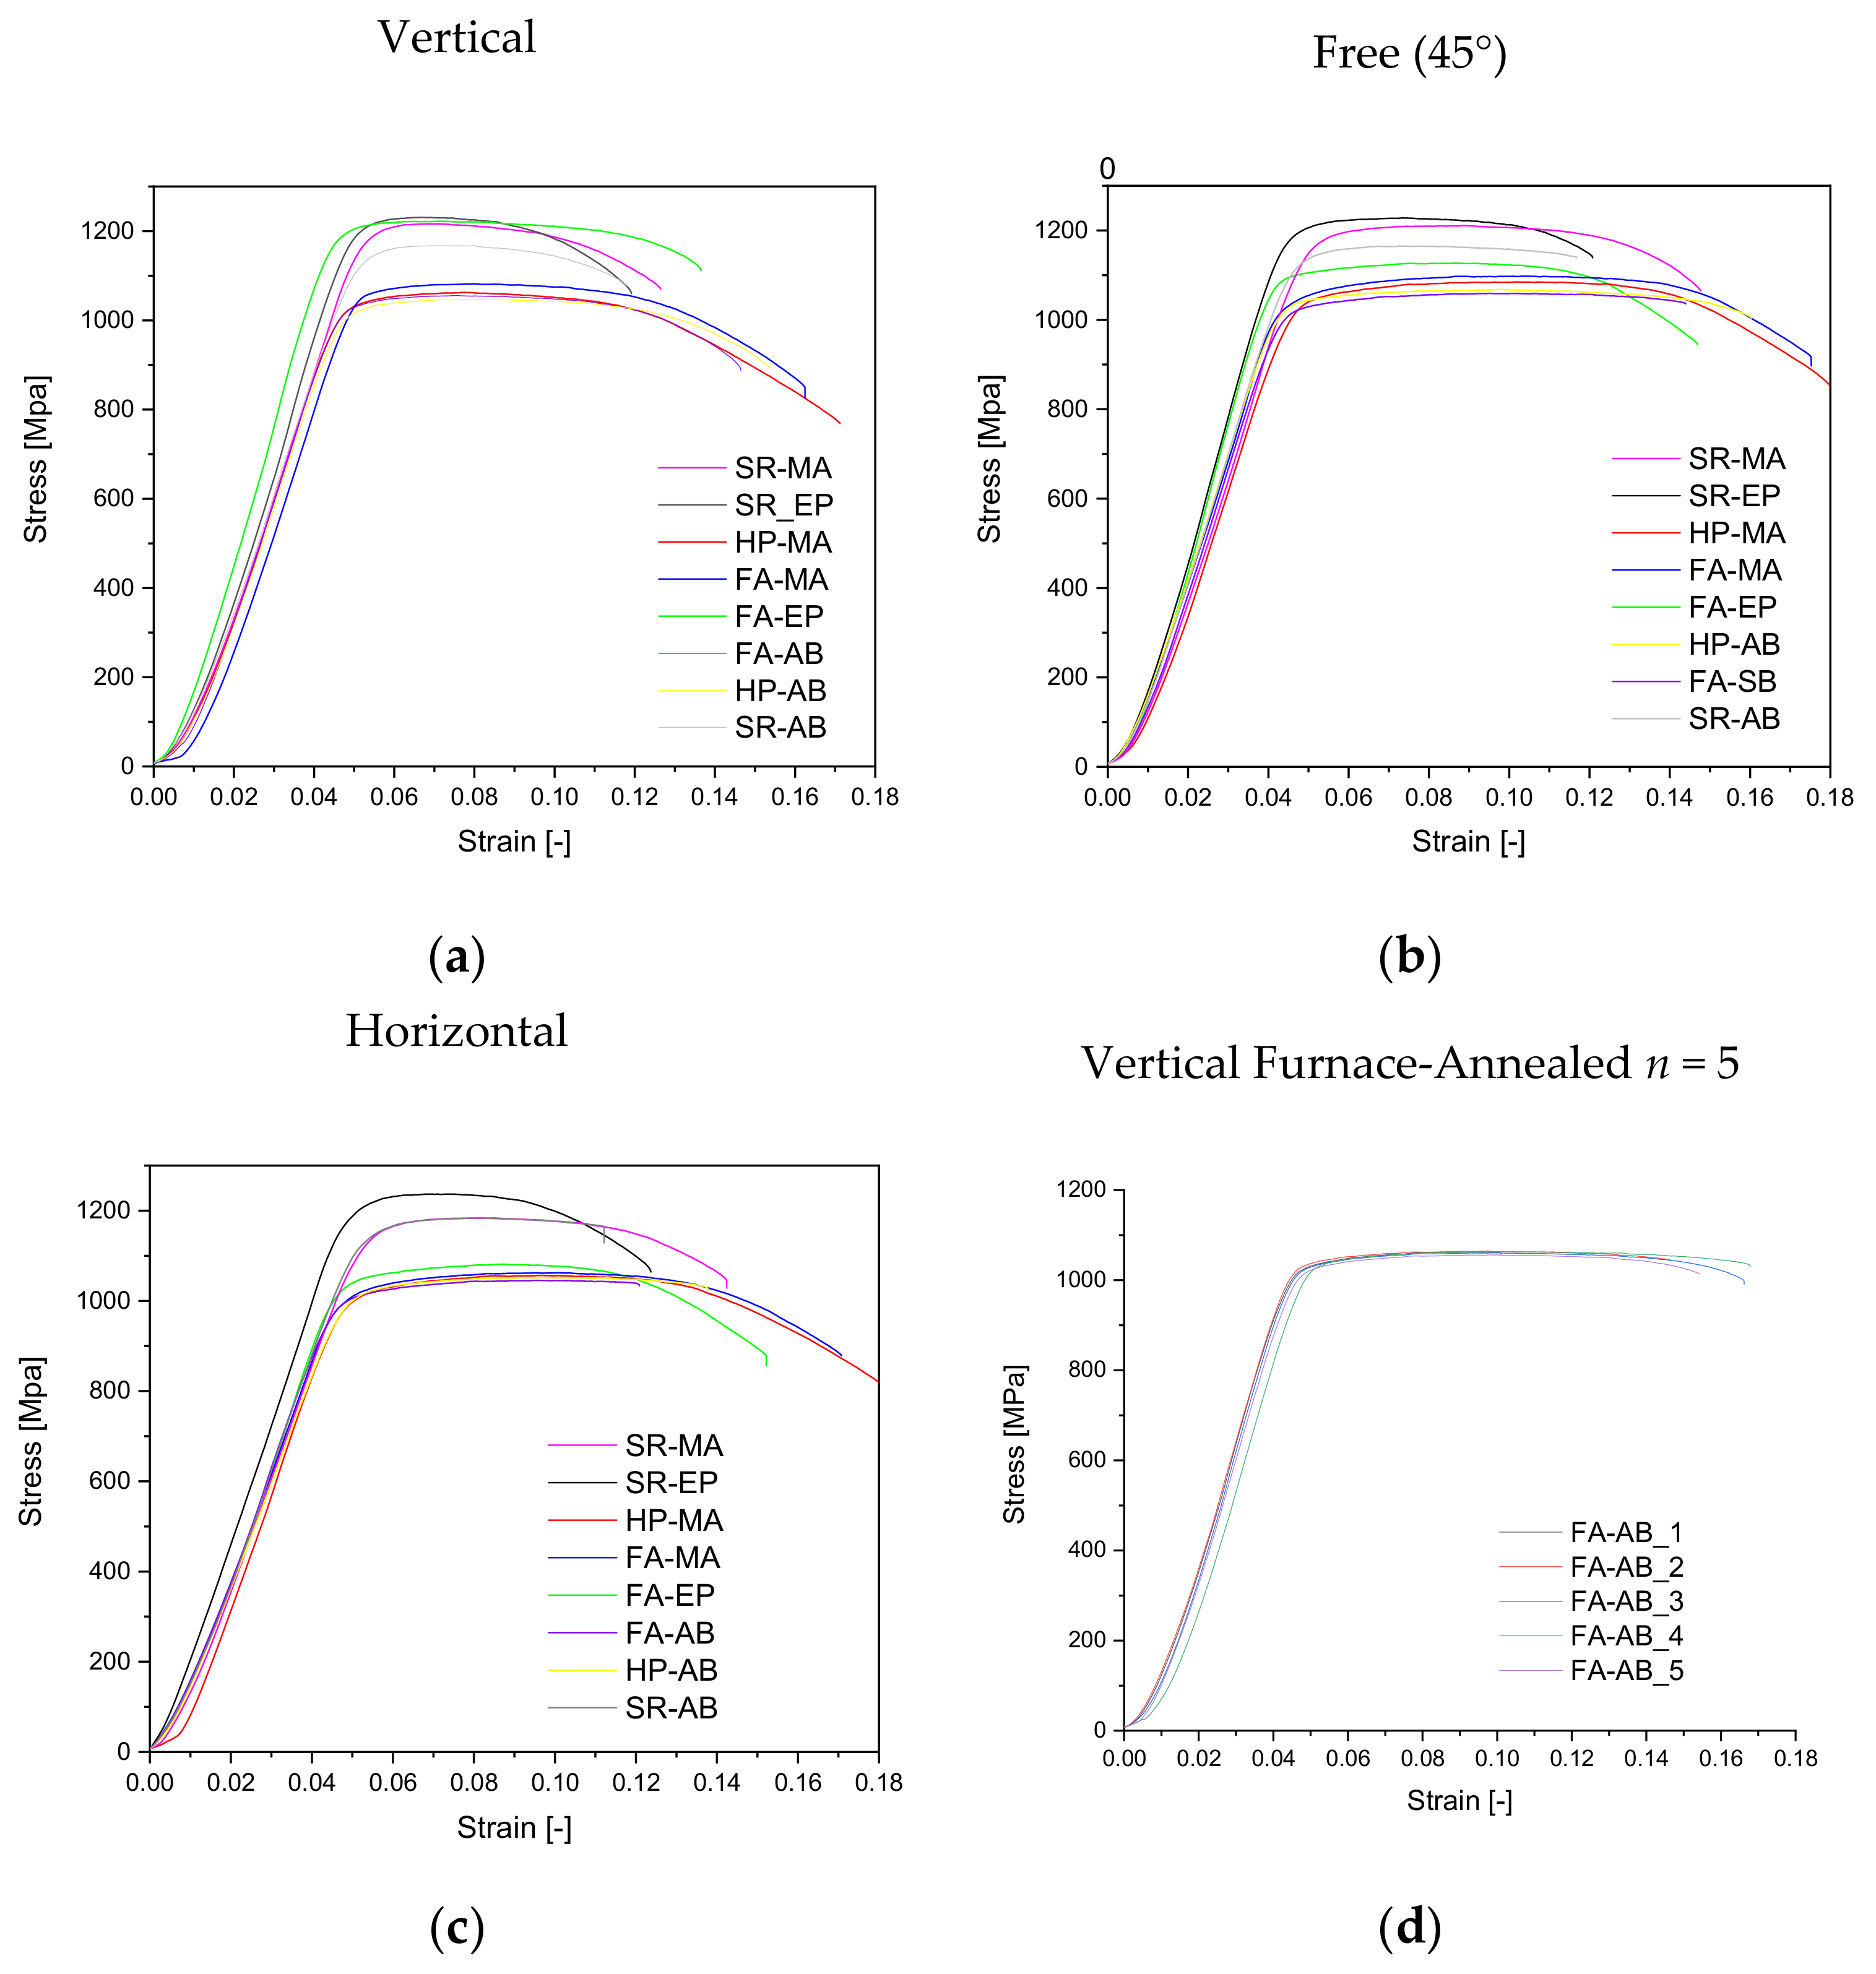
Figure 5a–c shows the strain–stress diagrams for all orientations and all surface and heat treatments. For each condition, a representative curve was selected to depict the results since every single condition that was highly reproducible (Figure 5d). The overall deviation was from 2.3 (for FFAAB) to 22 MPa (for HSRAB) for yield strength (YS), while a lower value was found for the ultimate tensile strength (UTS; 0.7 for VSRMA to 18.3 MPa for VFAEP). A tendency toward higher deviations was found for the EP surface and SR heat treatment.
An effect of heat treatment was seen for all orientations and surface treatments, as described in [12,13,19,20,21]. The SR samples showed YS and UTS values well above 1100 and 1200 MPa, respectively, with an elongation at break of 4–5%. Both FA and HP led to an increase in ductility with the elongation at break reaching more than 8%, but a minor reduction in tensile strength occurred, with the YS being around 1000 MPa and a UTS of 1100 MPa. Kasperovich et al. [14] and Leuders et al. [13] also recorded a higher ductility for the hipped specimen. The type of α + β microstructure obtained by FA and HP explains the reduction in the anisotropy of ductility. However, the costly HP process does not bring any substantial advantage over FA treatment, since both treatments have similar morphologies for the α and β phases (Figure 3).
Surface treatment has a negligible impact on UTS and YS, especially for V and F, but it has an impact on ductility, especially on the constriction of H samples with an increase of nearly 100%: from 4.5% with SRAB to 38% with the SRMA specimen (Appendix A). The results for F reflect those of the V rather than the H orientation. The results for UTS and YS contradict those of Kasparovic et al. [13], who saw differences of 100 and 200 MPa, respectively, for as-built and machined specimens.
When comparing our results with other work, attention has to be paid to the alloy grade used and, therefore, the chemical composition. Ti6Al4V Grade 23 extra-low interstitial (ELI), which has lower oxygen levels, shows higher ductility, as oxygen is an α stabilizer. Even the range of oxygen found in Grade 5 powder is quite large, and therefore, results may vary [17].
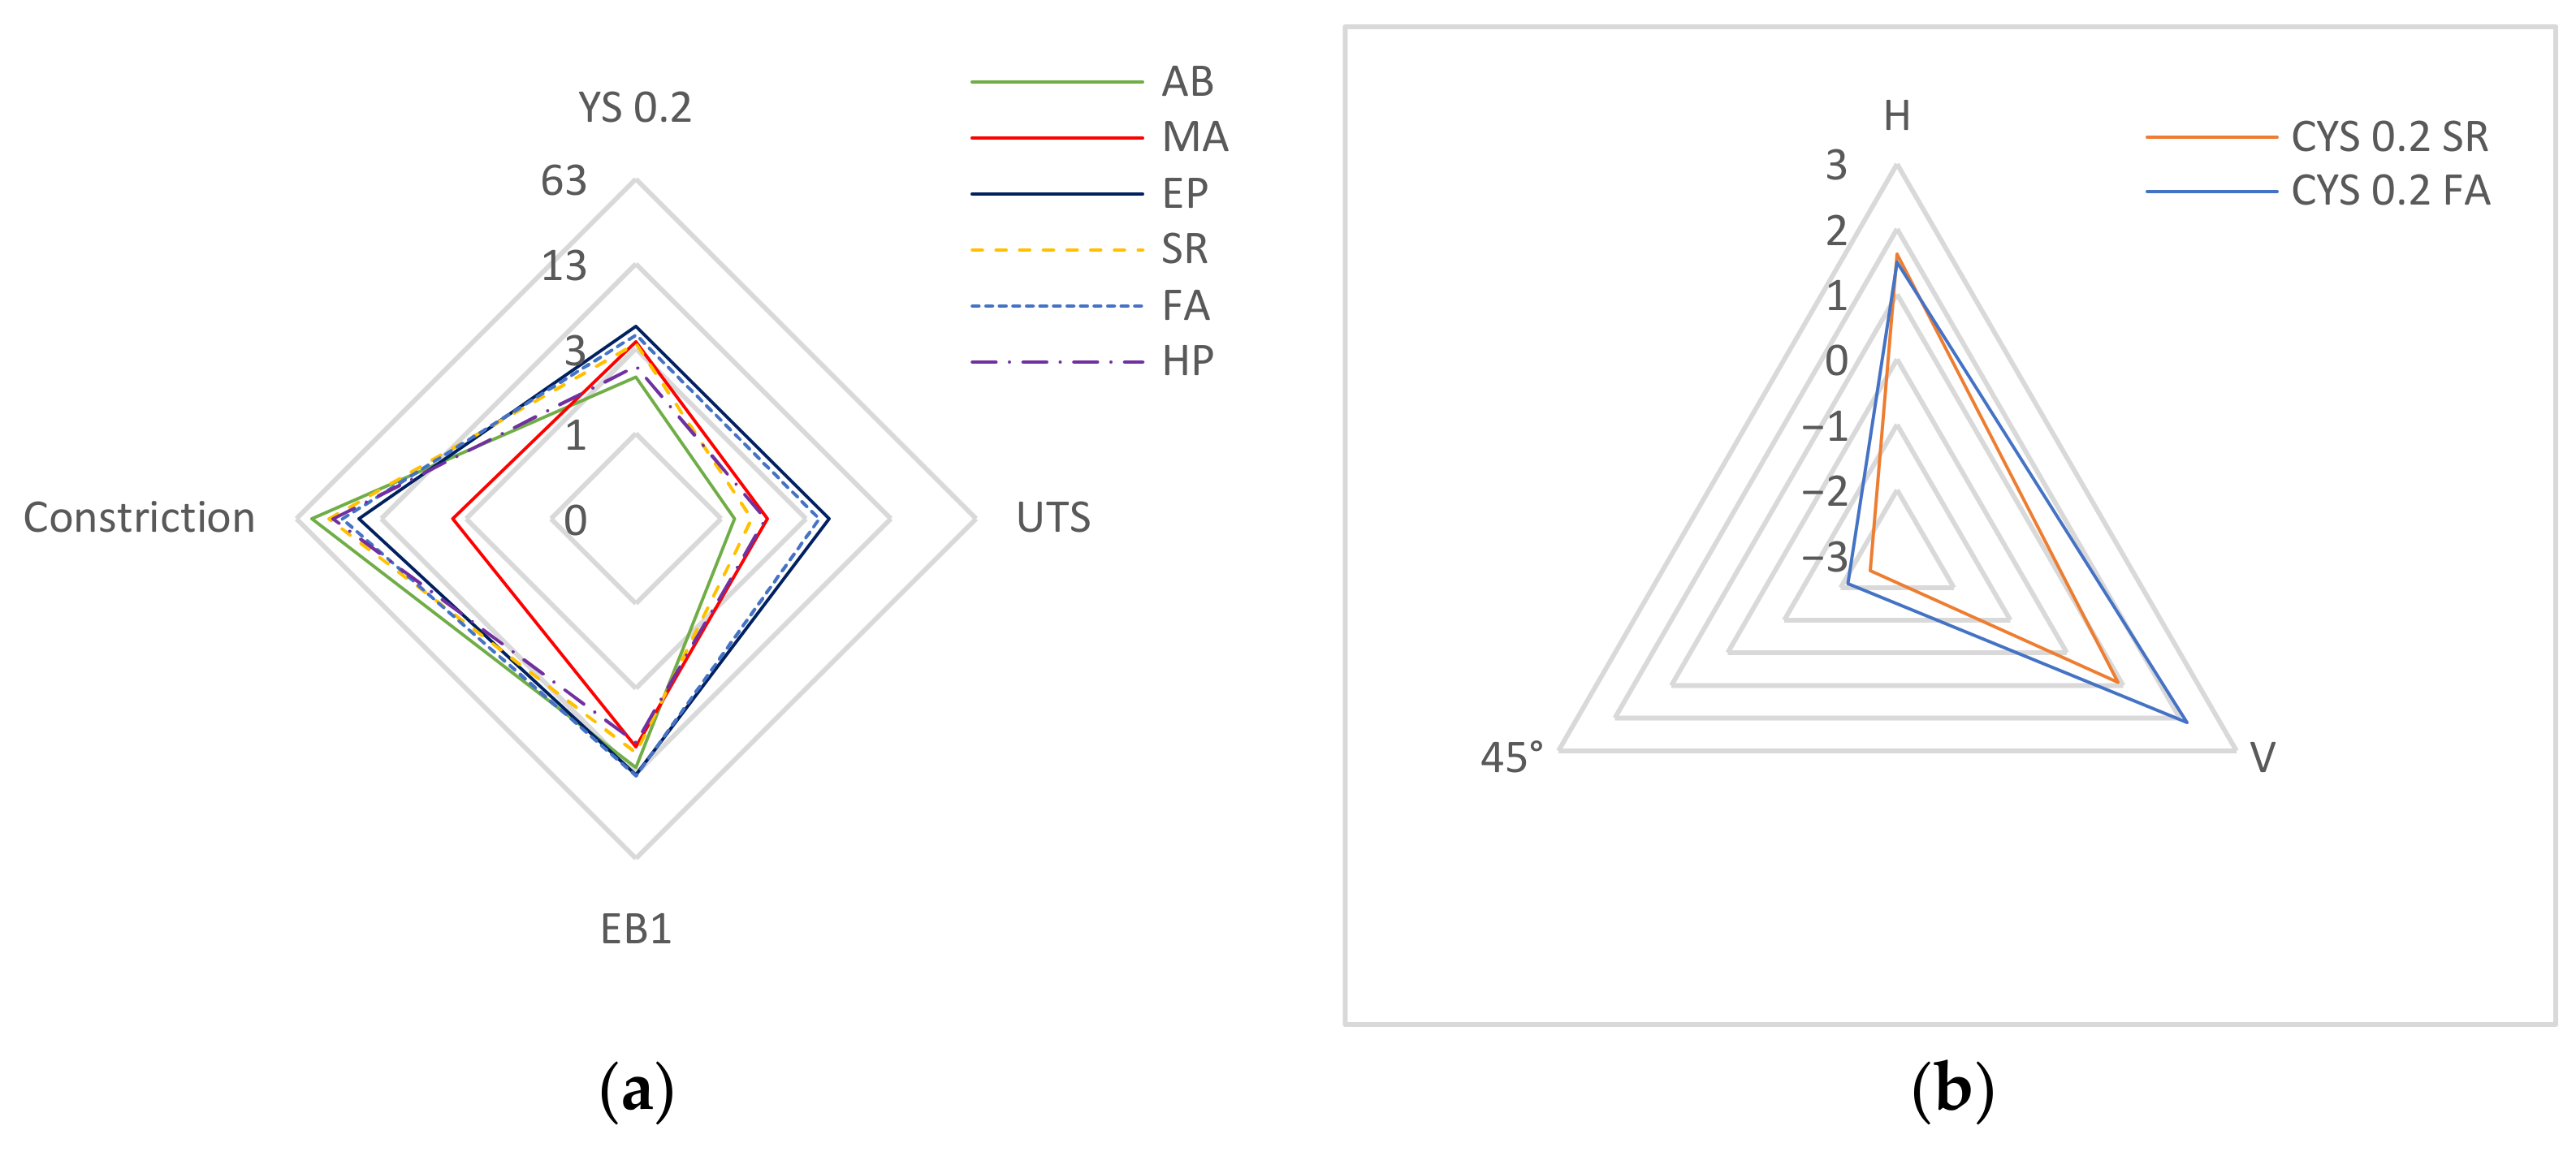
The compression YS was 1–5% above the tensile YS, where the SR and MA specimens showed higher strength values by about 50 MPa compared with the more ductile FA and HP specimens (about 10 MPa), with no advantage of HP over FA (Figure 6). All values were well above the standard limits.
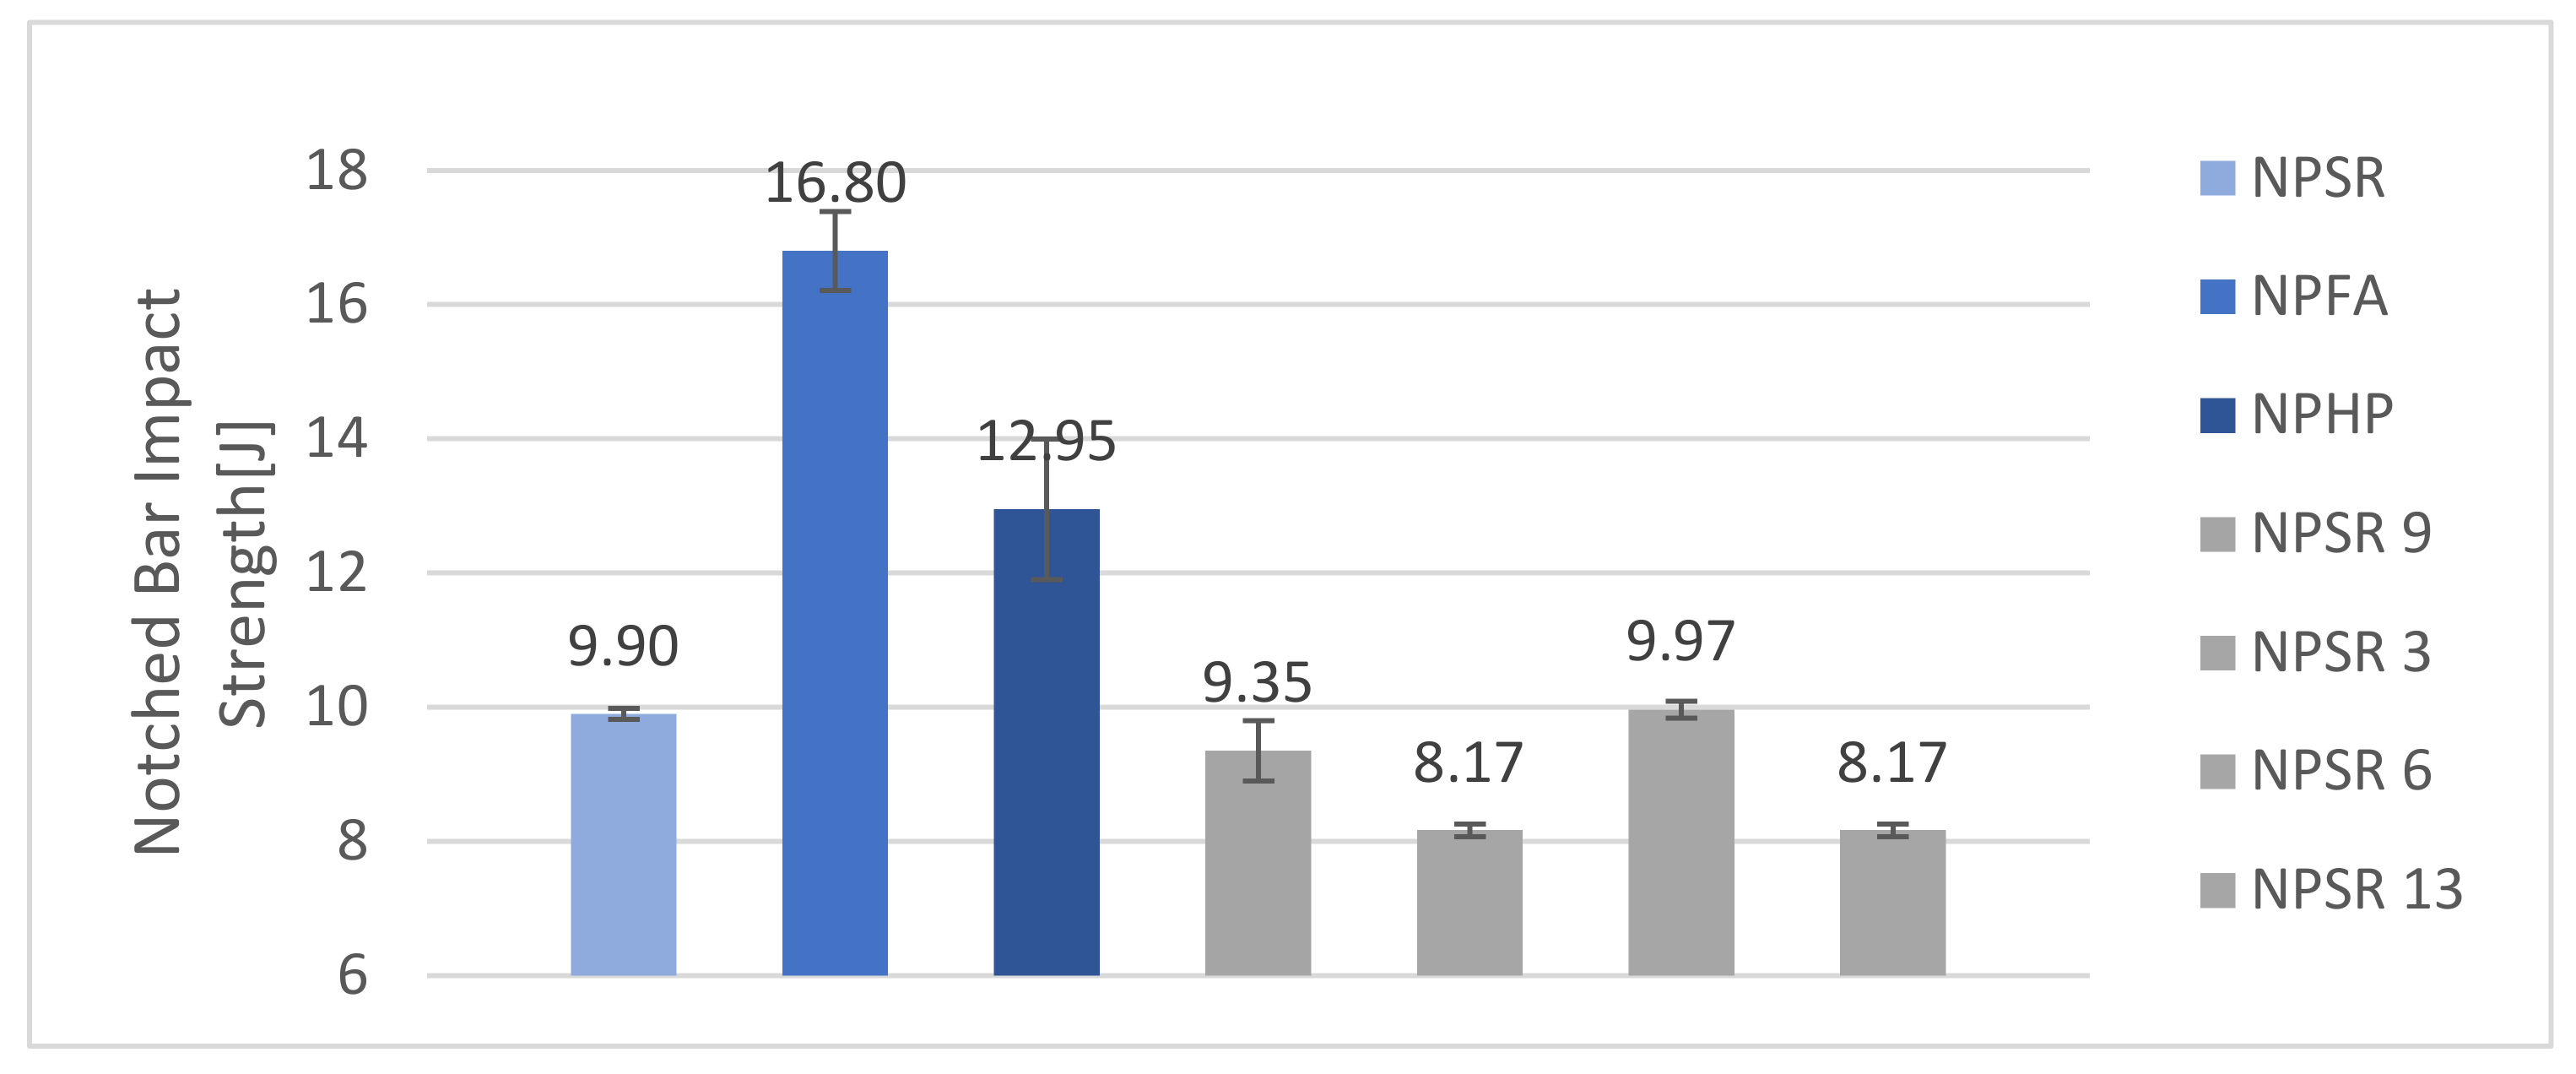
The dynamic break behavior was investigated using Charpy tests, and the results are shown in Figure 7. The results show the effect of the microstructure on the impact strength. FA led to the best results with an impact strength of 16.8 J, while SR samples were found to be more brittle with an impact strength of just 9.9 J for the standard set of process parameters. The HP samples showed an impact strength of 12.95 J with a similar microstructure to the FA condition (Figure 7).
Looking at the results from Yasa at al. [20], there was an improvement between HT for 3 h at 595 °C and that for 3 h at 735 °C (which is similar to SR and FA used in this work) from 7 to 10.1 J; however, both values are below those found here. Since the AB samples without heat treatment performed better (11.5 J), the results may have been affected by oxygen pickup in the heat treatment process. Lee et al. [21] had similar results with 7.3 J for the SR specimen but just 6 J for the AB specimen. Muiruri et al. [22] achieved a higher strength value for the non-heat-treated specimen of about 14.4 ± 0.3 J, but this was produced with Ti64 Grade 23 with an oxygen level of just 0.082 wt%. For the same alloy grade, Monaheng et al. [23] achieved values of around 35 J for the FA condition but with different temperatures and holding times (650 °C for 3 h and 950 °C for 3 h).
The parameters also influence the break behavior. Impact strengths of 8.17, 9.97, 9.35, and 8.17 J were observed in SR samples for DoE sets 3, 6, 9, and 13 (Table 4). Using specimens of half the size, Lucon et al. [30] showed the same strong influences of the process and post-process parameters on the impact strength of electron-beam-melted AM samples. This indicates that Charpy testing is a highly suited tool for the characterization of the quality of the L-PBF process and should be further investigated.
Materials processed by L-PBF have always been considered anisotropic due to the uniaxial build direction and, therefore, the aligned grain growth [2,7,8,9,10]. However, for YS and UTS, as well as compression YS, the material behaved isotropically with overall deviations of just 4 and 2% for YS and UTS, respectively, for the AB surface condition. Figure 8 and Figure 9 show the precentral anisotropy for tensile strength and plastic deformation. The highest anisotropy for tensile strength was found for the FA EP specimen, for which YS and UTS showed increases of about 7% in the V orientation, while for H, the values were 5% below the middle value. For most other conditions, anisotropy was in the range of ±2% for YS and even lower for UTS at ranges of 0.2 to 1.8%. Compared with previous work [2,29], the results are superior considering anisotropy, and to the best of the authors’ knowledge, no results for free orientation can be found in the literature.
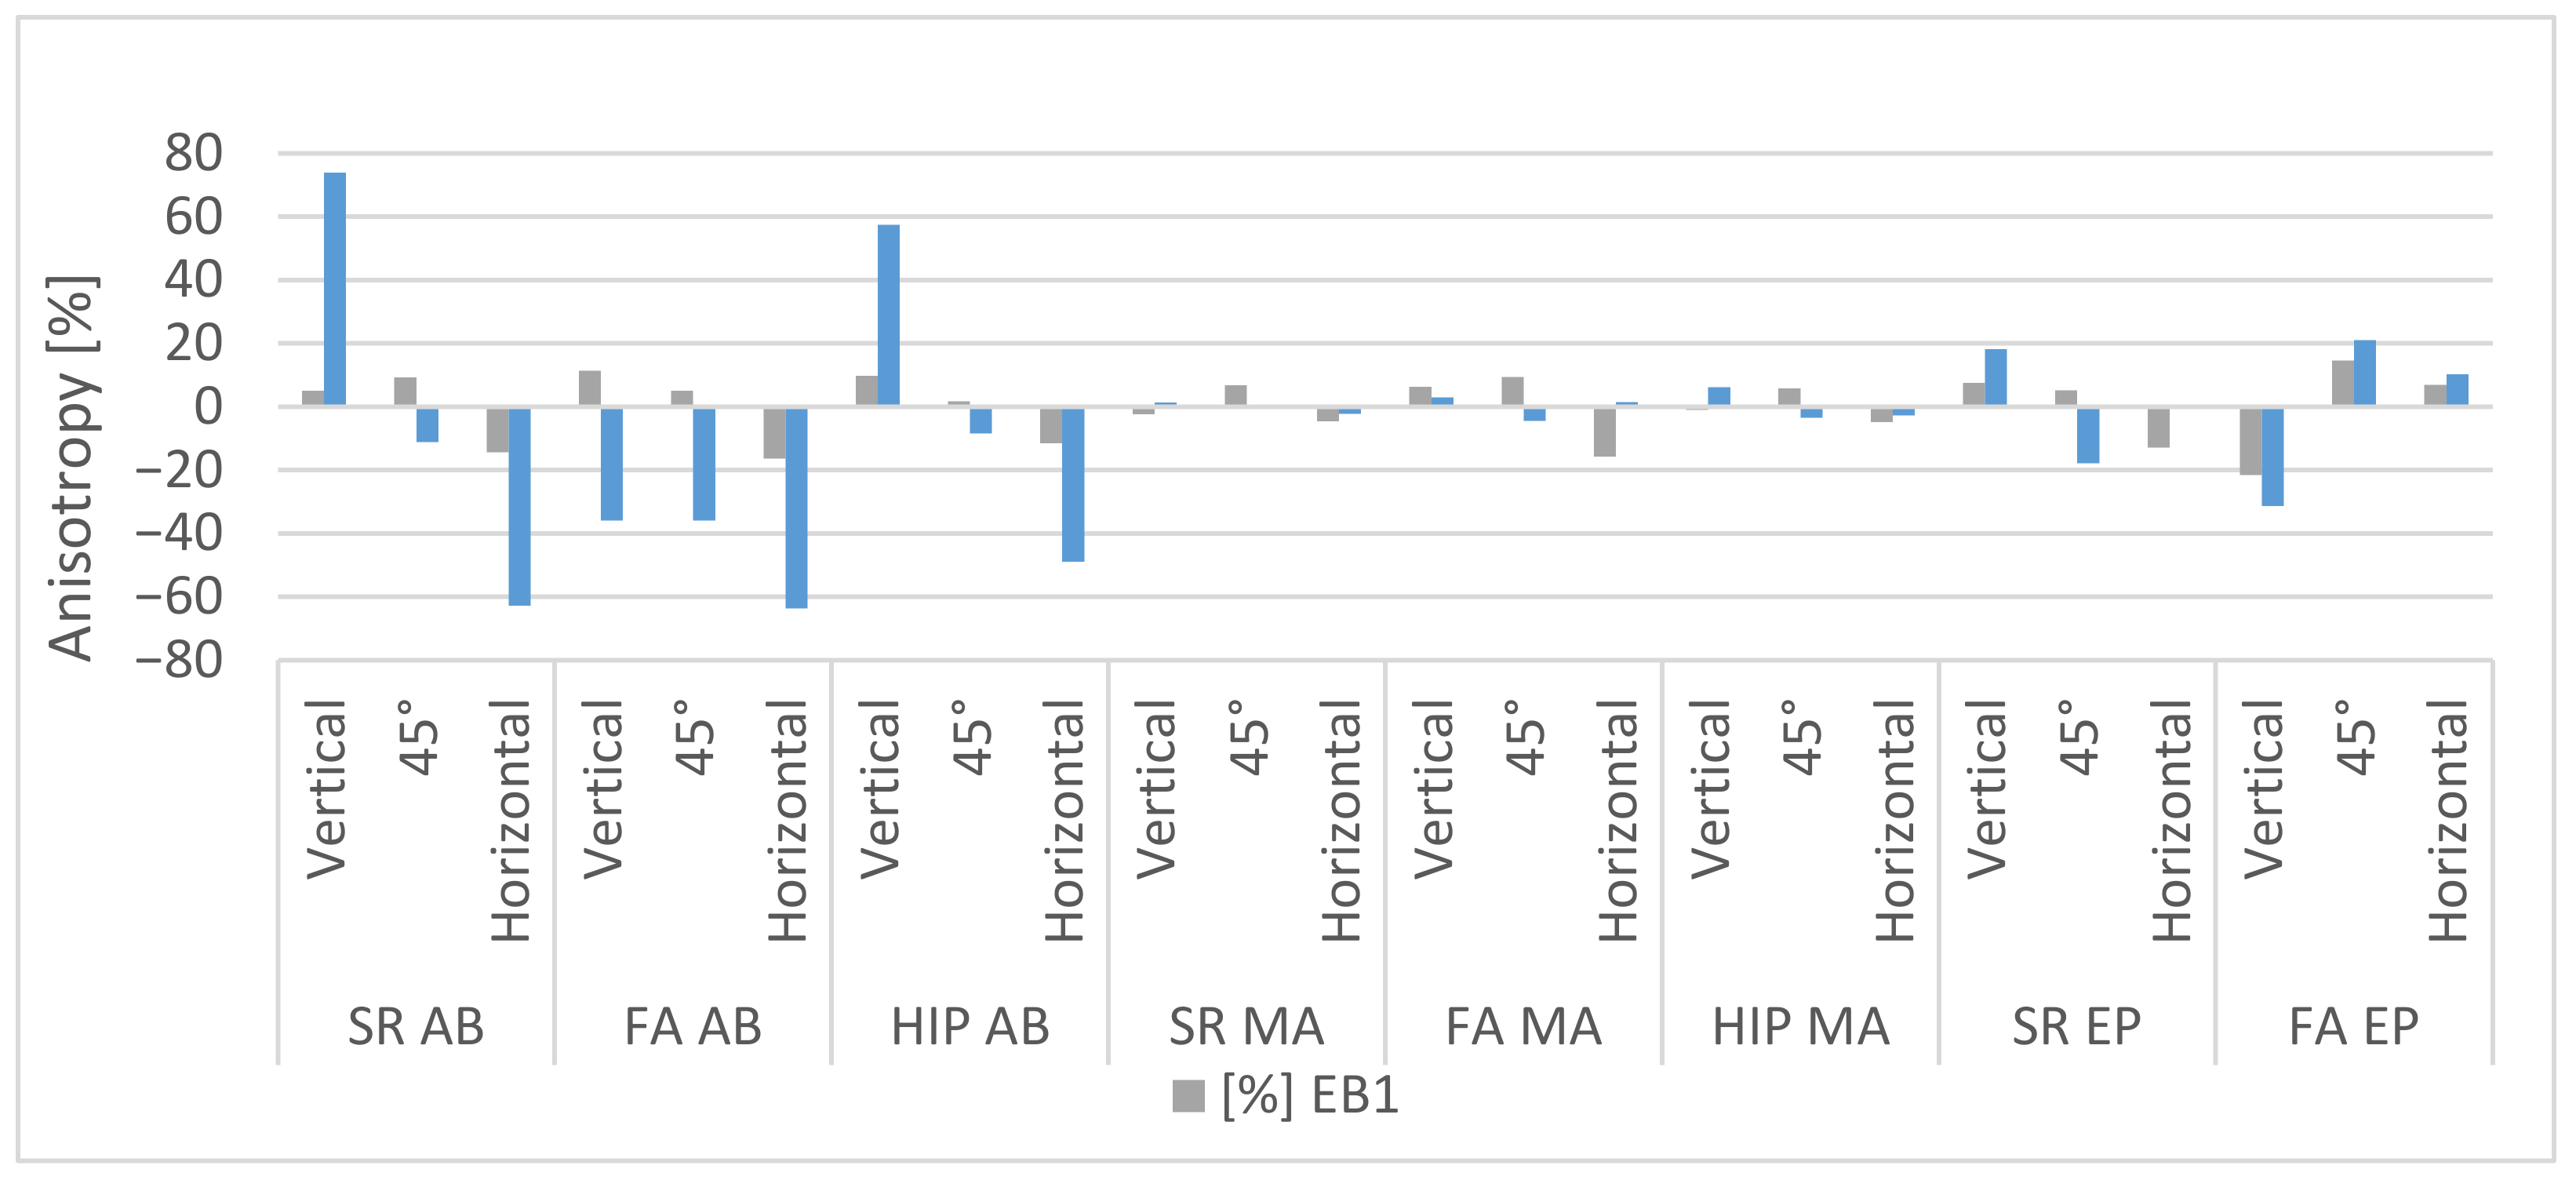
Greater anisotropy was seen for the ductility and break behavior (Figure 9 and Figure 10). Constriction highly depends on the orientation, especially for the AB surface, with the H specimen showing just 4% total constriction, while V showed up to 30% necking. A similar but less pronounced trend was seen for elongation at break. Liu et al. [2] claimed that the reason for this is the elongated grain structure in the build direction. Though being a reasonable argument, heat treatment and, therefore, a more globular microstructure showed little effect, while surface treatment, EP, and even more so, MA, reduced the anisotropy in the break behavior (Figure 10).
Mower et al. [19] observed a worse performance for V samples than for H samples, but there was total isotropic behavior for the HP specimen. This indicates that the microstructure is the reason for the anisotropy found in YS and UTS, while for break behavior, influencing factors reduced by surface treatment, such as the surface roughness, porosity distribution, geometric accuracy, and residual stresses [31], are crucial. A similar effect for anisotropic behavior was found for fatigue strength, which was highly influenced by the sub-surface porosity [25,32].
For the yield and tensile strengths in particular, the values of specimen F were more in the range of those of specimen V than those of specimen H, showing that the detectable change in properties is not linear between V and H but rather is a phenomenon of specimen H. This is beneficial from a technical point of view, considering that load cases will rarely be unidirectional (Figure 8 and Figure 10).
Figure 10a shows the deviation of the anisotropies concerning singular surfaces and heat treatments. Surprisingly, the deviation of YS and UTS increased marginally for surface-treated specimens (MA and EP) and FA heat treatment, but it can still be considered low. The reason for this trend is the higher anisotropy for the FAEP specimen. All surface and heat treatments showed positive impacts on constriction, with machining having the highest effect. The anisotropy of the compression YS (Figure 10b) was even smaller than that of tensile anisotropy with only around 0.2% for both the SR and FA samples. While not that critical for component design, which is normally limited by the YS, the anisotropy of the break behavior can have a strong influence on postprocessing, especially machining, as shown by Perez-Ruiz et al. [33] for Inconel 718.
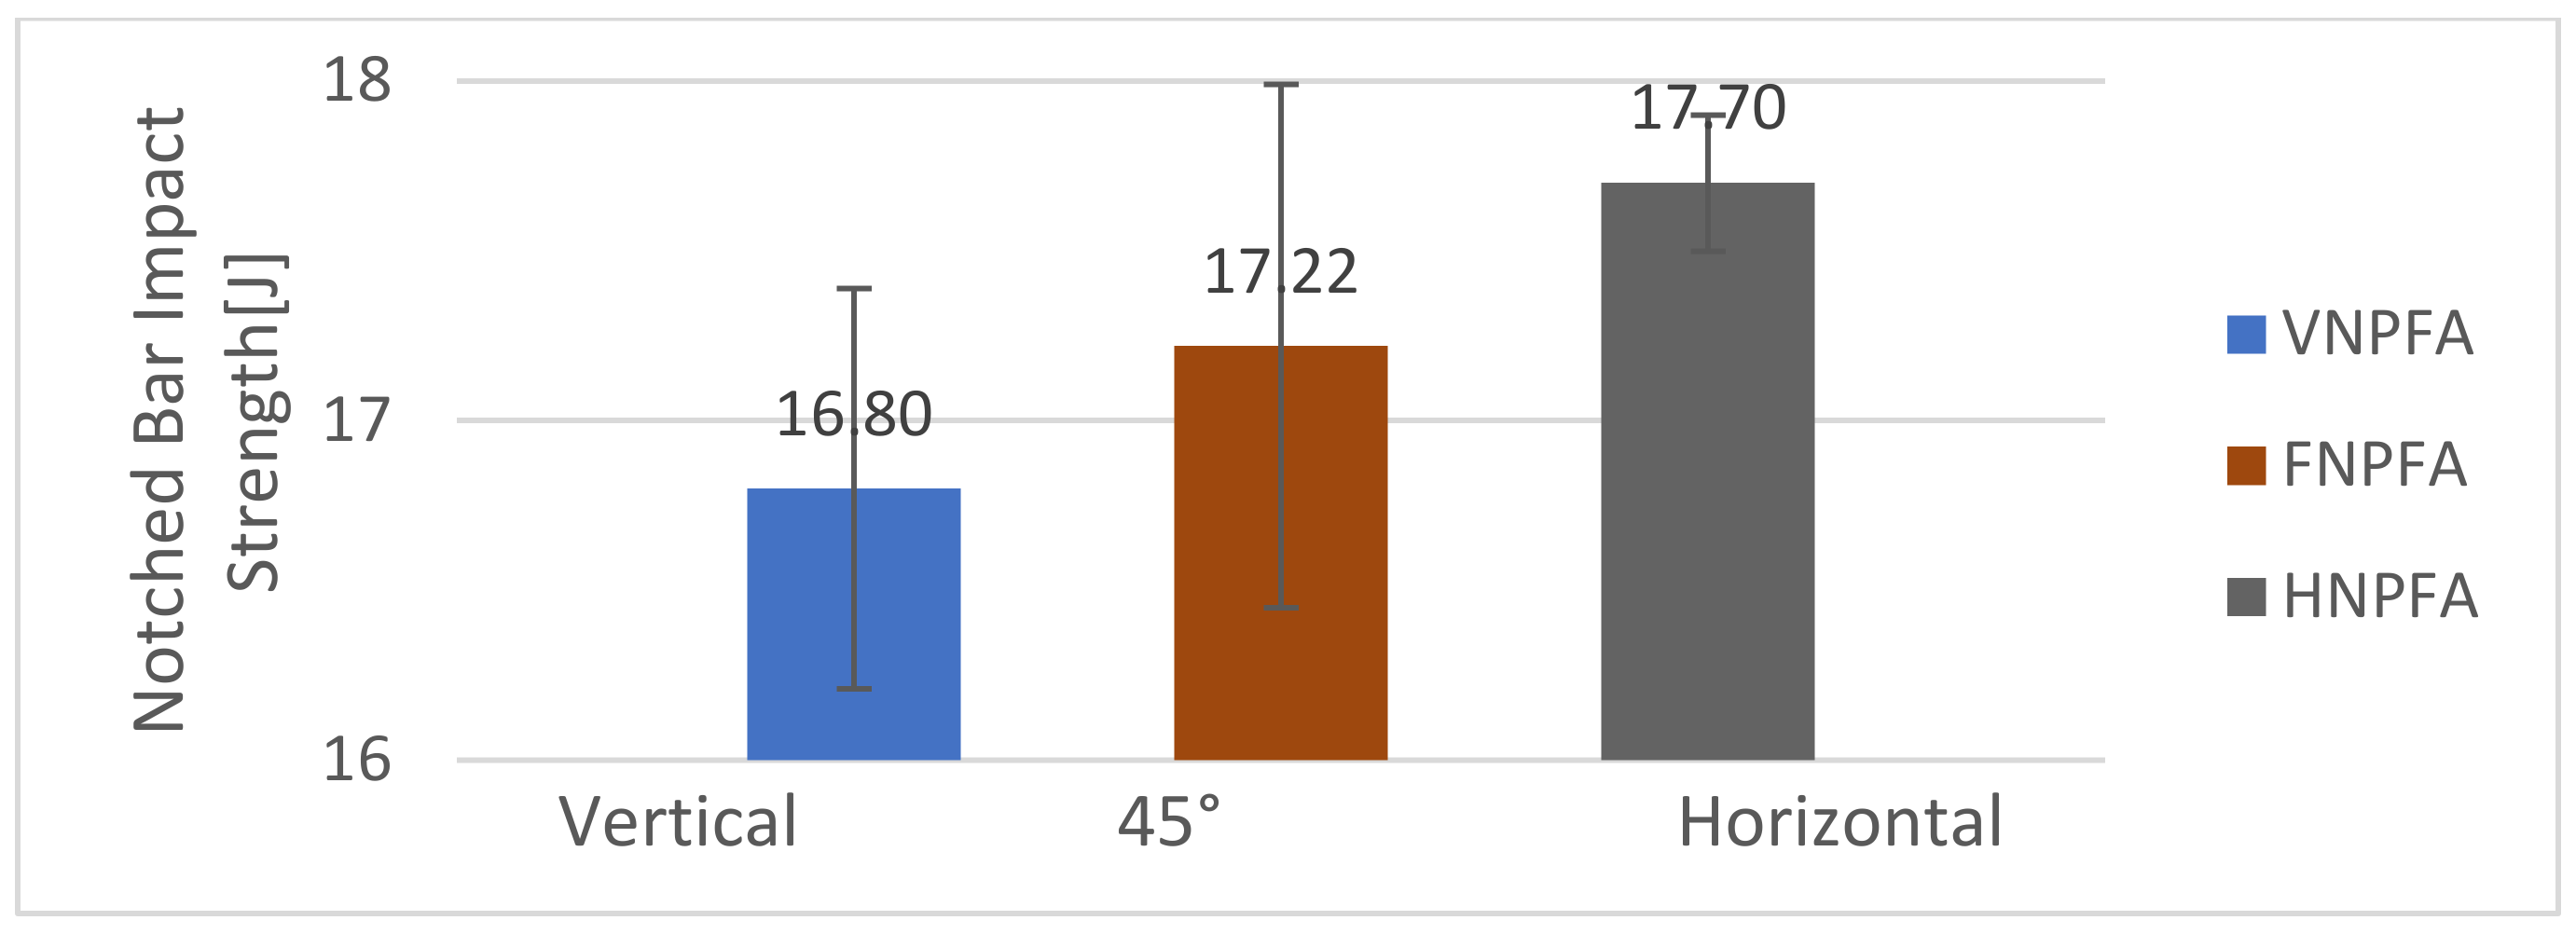
The dynamic anisotropy for the notched bar impact strength (Figure 11) was a little higher, from 16.8 J for vertical to 17.7 J for horizontal samples, which showed the highest impact strength, but all the results showed deviations. Yasa et al. [20] also showed inferior behavior for vertical samples, but the error margin was bigger, and the overall strength was inferior. However, they used just a single, non-heat-treated sample for each orientation and mentioned problems in the build process. Monaheng et al. [23] recorded a deviation of a similar size but found that vertical samples showed the best results.

4. Conclusions

Working in an inert gas atmosphere and with very local heat input, L-PBF is suitable for the processing of Ti64, as it reduces the risk of hydrogen and oxygen pickup creating near-net-shape structures without tool wear. Compared with other materials, Ti64 is relatively insensitive to L-PBF process parameters, achieving relative densities of over 99.5% as long as the energy input is kept within the right limits (e.g., 55 to 67 J/mm3 for the given set up). This makes it complicated to establish a significant DoE model just based on density, but secondary parameters, such as the reduction in cracks or distortions, can serve as additional optimization goals. Contour parameters can be easily optimized for the powder used to reduce the surface roughness. Sub-surface pores represent the main portion of the overall porosity, as infill sections show densities of over 99.9%. Considering this, porosity values found in the literature and material sheets are highly dependent on the measurement method used and are, therefore, hard to compare. Hence, an in-depth investigation of this basic topic using computer tomography would be of interest.
Electrochemical polishing is a promising process for the reduction in the surface roughness of L-PBF components, especially for surfaces with complex shapes and those that are hard to reach by mechanical methods. In this study, electrochemical polishing was associated with a greater variation in roughness compared with machining, and the achievable smoothening was dependent on the original surface roughness after the build. The microstructure for stress-relieved samples was a mixture of a martensitic section and the first transformation to the α + β structure, which was not expected after 2 h at just 650 °C. Furnace annealing at 800 °C and HIP treatment produced almost identical α + β microstructures.
All static properties showed higher strengths than those found in standards for classic production processes in terms of the cost of ductility. Contrary to other studies, hot isostatic pressing showed no improvement over furnace annealing but achieved a similar microstructure and properties.
Anisotropy was limited to plastic deformation and break behavior. YS, UTS, and compression YS could be considered isotropic at only ±2% for most investigated conditions, while plastic deformation showed anisotropy, especially constriction at break with a directional difference of up to 70%. This might have been due to the microstructure, residual stresses, and variation in the up- and downskin surface roughness. However, this was partially reduced by heat and mechanical surface treatments. Electrochemical polishing increased isotropy in the plastic regime but actually decreased it for YS and UTS.
Compression behavior showed even lower anisotropy with a maximum value of 2.66% with the same increase in ductility for furnace annealing over stress relieving found for tensile strength. The value was only marginally higher than that of tensile strength.
The Charpy test showed minimal anisotropy. The break behavior was rather brittle with a maximal impact strength of 17.7 J, and strong influences of heat treatment and even process parameters were shown. Furnace annealing achieved distinctly better results than hot isostatic pressing, while the effects of stress relief were considerably lower. Process parameters further influenced the Charpy performance, making them highly suited to the investigation of the L-PBF quality. An in-depth investigation into this topic with high specimen numbers and statistic evaluation could be a topic for further research.
The processing of Ti64 by L PBF permits a wide window of stable parameters to be used with properties being reproducible for a controlled powder batch. The study further shows that static anisotropy is negligible in the plastic regime and is concentrated on the horizontal orientation, while specimens in the vertical orientation and at 45° act in nearly identical ways.

Author Contributions

Conceptualization, B.M. and N.G.; methodology, B.M., N.G., F.W., S.S. and C.B.; software, B.M.; validation, F.W., R.K. and W.W.; formal analysis, B.M., F.W., C.B., A.S. and G.P.; investigation, B.M., F.W., S.S. and C.B.; resources, W.W. and C.S.; data curation, B.M.; writing—original draft preparation, B.M., N.G. and F.W.; writing—review and editing, B.M., F.W., R.K. and W.W.; visualization, B.M. and F.W.; supervision, R.K., F.W. and C.S.; project administration, R.K.; funding acquisition, R.K., W.W. and C.S. All authors have read and agreed to the published version of the manuscript.

Funding

The Federal Ministry for Climate Action, Environment, Energy, Mobility, Innovation and Technology and the FFG funded parts of the work described in this article within Austrian Take-Off call 2016, project no. 861050. Supported by TU Graz Open Access Publishing Fund.

Data Availability Statement

Data is contained within the article. The data presented in this study are available in [Table 1, Table 4, Table 5 and Table 7 and Annex 1 and 2]. If questions arises, additional information concerning data used in this study are available on request from the corresponding author.

Conflicts of Interest

The authors declare no conflict of interest. The funders had no role in the design of the study; in the collection, analyses, or interpretation of data; in the writing of the manuscript, or in the decision to publish the results.

Appendix A

Table A1. Results of the Tensile Tests—Middle Values of 3 or 5 Specimens.
Sample SetYS 0.2DeviationUTSDeviationElongation at Break—ExtensometerElongation at Break—by Hand after BreakConstriction
(MPa)±(MPa)±%%%
VSRAB113215.811661.95.08.520.8
VFA2AB10185.310613.27.811.914.1
VFA1AB10162.610494.67.712.128.6
VHPAB101010.410453.18.012.632.8
FSRAB11295.111682.55.26.810.6
FFAAB10102.310591.97.310.511.9
FHPAB10153.010690.77.414.119.1
HSRAB108522.011842.84.14.04.5
HFAAB99815.510441.35.88.46.7
HHPAB9792.710510.86.49.810.6
VSRMA119716.412160.74.48.525.6
VFAMA10554.810783.48.212.938.3
VHPMA
FSRMA116917.512055.14.810.125.4
FFAMA10222.910961.68.412.135.6
FHPMA
HSRMA108410.211852.84.39.224.9
HFAMA101011.310663.16.513.037.8
HHPMA
VSREP11766.612149.04.86.726.5
VFAEP11738.4123118.35.69.619.6
FSREP11855.012307.84.67.118.5
FFAEP108214.911216.38.211.934.6
HSREP121212.012393.63.87.722.4
HFAEP10338.810874.57.610.931.5

Appendix B

Table A2. Anisotropy.
Post ProcessingOrientationAnisotropy Tensile Properties (%)
YS 0.2UTSEB1EB2 Constriction
SR ABVertical1.5−0.65.032.374.0
45°1.2−0.49.35.5−11.2
Horizontal−2.71.0−14.3−37.8−62.8
FA ABVertical0.8−0.111.429.8−35.9
45°0.20.85.012.3−35.9
Horizontal−1.0−0.6−16.4−10.3−63.7
HIP ABVertical0.9−0.99.86.357.5
45°1.41.31.730.5−8.5
Horizontal−2.3−0.4−11.5−36.8−49.0
SR MAVertical4.11.2−2.3−8.01.4
45°1.70.26.98.80.3
Horizontal−5.7−1.4−4.5−0.8−2.2
FA MAVertical2.5−0.26.41.62.9
45°−0.71.59.4−4.5−4.4
Horizontal−1.8−1.3−15.82.91.5
HIP MAVertical2.6−0.2−1.19.36.1
45°−0.41.75.81.2−3.5
Horizontal−2.2−1.5−4.8−10.5−2.7
SR EPVertical−1.3−1.17.6−6.418.2
45°−0.50.25.2−0.7−17.8
Horizontal1.80.9−12.87.1−0.4
FA EPVertical7.07.4−21.6−11.3−31.3
45°−1.3−2.214.610.321.0
Horizontal−5.7−5.27.01.010.3
ABDeviation1.50.611.124.146.7
MA2.91.27.56.43.2
EP3.83.912.87.419.0
SR2.80.98.417.433.6
FA3.33.213.012.026.1
HP1.81.26.920.531.2

References

  1. Leyens, C.; Peters, M. Titanium and Titanium Alloys; Wiley-VCH Verlag: Hoboken, NJ, USA, 2003; ISBN 3-527-30534-3. [Google Scholar]
  2. Liu, S.; Shin, Y.C. Additive manufacturing of Ti6Al4V alloy: A review. Mater. Des. 2018, 164, 107552. [Google Scholar] [CrossRef]
  3. Huang, R.; Riddle, M.; Graziano, D.; Warren, J.; Das, S.; Nimbalkar, S.; Cresko, J.; Masanet, E. Energy and emissions saving potential of additive manufacturing: The case of lightweight aircraft components. J. Clean. Prod. 2016, 135, 1559–1570. [Google Scholar] [CrossRef]
  4. Lütjering, G.; Williams, J.C. Titanium, 2nd ed.; Springer: New York, NY, USA, 2007. [Google Scholar]
  5. DebRoy, T.; Wei, H.L.; Zuback, J.S.; Mukherjee, T.; Elmer, J.W.; Milewski, J.O.; Beese, A.M.; Wilson-Heid, A.; De, A.; Zhang, W. Additive manufacturing of metallic components—Process, structure and properties. Prog. Mater. Sci. 2018, 92, 112–224. [Google Scholar] [CrossRef]
  6. Royer, F.; Bienvenu, Y.; Gaslain, F. EBSD Observation of Grains Microstructures Produced by Selective Laser Melting. In Proceedings of the Conference Proccedings Euro PM2015, Reims, France, 4–7 September 2015. [Google Scholar]
  7. Kunze, K.; Etter, T.; Grässlin, J.; Shklover, V. Texture, anisotropy in microstructure and mechanical properties of IN738LC alloy processed by selective laser melting (SLM). Mater. Sci. Eng. A 2015, 620, 213–222. [Google Scholar] [CrossRef]
  8. Thijs, L.; Sistiaga, M.L.M.; Wauthle, R.; Xie, Q.; Kruth, J.-P.; Van Humbeeck, J. Strong morphological and crystallographic texture and resulting yield strength anisotropy in selective laser melted tantalum. Acta Mater. 2013, 61, 4657–4668. [Google Scholar] [CrossRef]
  9. Song, B.; Dong, S.; Coddet, P.; Liao, H.; Coddet, C. Fabrication of NiCr alloy parts by selective laser melting: Columnar microstructure and anisotropic mechanical behavior. Mater. Des. 2014, 53, 1–7. [Google Scholar] [CrossRef]
  10. Thijs, L.; Verhaeghe, F.; Craeghs, T.; Van Humbeeck, J.; Kruth, J.-P. A study of the microstructural evolution during selective laser melting of Ti–6Al–4V. Acta Mater. 2010, 58, 3303–3312. [Google Scholar] [CrossRef]
  11. Meier, B.; Skalon, M.; Warchomicka, F.; Belei, C.; Görtler, M.; Kaindl, R.; Sommitsch, C. Effect of the Reuse of Powder on Material Properties of Ti6Al4V processed by SLM. In Proceedings of the AIP Conference Proceedings, Vitoria-Gasteiz, Spain, 8–10 May 2019; Volume 2113, p. 150006. [Google Scholar] [CrossRef]
  12. Skalon, M.; Meier, B.; Leitner, T.; Arneitz, S.; Amancio-Filho, S.; Sommitsch, C. Reuse of Ti6Al4V Powder and Its Impact on Surface Tension, Melt Pool Behavior and Mechanical Properties of Additively Manufactured Components. Materials 2021, 14, 1251. [Google Scholar] [CrossRef]
  13. Leuders, S.; Thöne, M.; Riemer, A.; Niendorf, T.; Tröster, T.; Richard, H.; Maier, H. On the mechanical behaviour of titanium alloy TiAl6V4 manufactured by selective laser melting: Fatigue resistance and crack growth performance. Int. J. Fatigue 2013, 48, 300–307. [Google Scholar] [CrossRef]
  14. Kasperovich, G.; Haubrich, J.; Gussone, J.; Requena, G. Correlation between porosity and process parameters in Ti6Al4V processed by selective laser melting. Mater. Des. 2016, 105, 160–170. [Google Scholar] [CrossRef]
  15. Baitimerov, R.M.; Lykov, P.A.; Radionova, L.V. Influence of Heat Treatment on Microstructure and Mechanical Properties of Selective Laser Melted TiAl6V4 Alloy. Solid State Phenom. 2018, 284, 615–620. [Google Scholar] [CrossRef]
  16. Facchini, L.; Magalini, E.; Robotti, P.; Molinari, A.; Höges, S.; Wissenbach, K. Ductility of a Ti-6Al-4V alloy produced by selective laser melting of prealloyed powders. Rapid Prototyp. J. 2010, 16, 450–459. [Google Scholar] [CrossRef]
  17. Meier, B.; Belei, C.; Petrusa, J.; Angerer, P.; Warchomicka, F.; Sartory, B.; Kaindl, R.; Sommitsch, C. Influence of Powder Production Process on Material Properties of additive manufactured Ti 6Al 4V by L-PBF. IJAMT, 2022; submitted. [Google Scholar]
  18. Dilip, J.J.S.; Zhang, S.; Teng, C.; Zeng, K.; Robinson, C.; Pal, D.; Stucker, B. Influence of processing parameters on the evolution of melt pool, porosity, and microstructures in Ti-6Al-4V alloy parts fabricated by selective laser melting. Prog. Addit. Manuf. 2017, 2, 157–167. [Google Scholar] [CrossRef]
  19. Kasperovich, G.; Hausmann, J. Improvement of fatigue resistance and ductility of TiAl6V4 processed by selective laser melting. J. Mater. Process. Technol. 2015, 220, 202–214. [Google Scholar] [CrossRef]
  20. Yasa, E.; Deckers, J.; Kruth, J.-P.; Rombouts, M.; Luyten, J. Experimental Investigation of Charpy Impact Tests on Metallic SLM parts. In Innovative Developments in Design and Manufacturing, 1st ed.; Taylor & Francis Group: Abingdon-on-Thames, UK, 2009; ISBN 9780429206498. [Google Scholar]
  21. Lee, K.-A.; Kim, Y.-K.; Yu, J.-H.; Park, S.-H.; Kim, M.-C. Effect of Heat Treatment on Microstructure and Impact Toughness of Ti-6Al-4V Manufactured by Selective Laser Melting Process. Arch. Met. Mater. 2017, 62, 1341–1346. [Google Scholar] [CrossRef]
  22. Muiruri, A.M.; Maringa, M.; Du Preez, W.; Masu, L. Variation of Impact Toughness of As-Built Dmls TI6AL4V (ELI) Specimens with Temperature. S. Afr. J. Ind. Eng. 2018, 29, 284–298. [Google Scholar] [CrossRef]
  23. Monaheng, L.F.; du Preez, W.B.; Polese, C. Towards Qualification in the Aviation Industry: Impact Toughness of Ti6Al4V(ELI) Specimens Produced through Laser Powder Bed Fusion Followed by Two-Stage Heat Treatment. Metals 2021, 11, 1736. [Google Scholar] [CrossRef]
  24. Gong, H.; Rafi, K.; Gu, H.; Ram, G.D.J.; Starr, T.; Stucker, B. Influence of defects on mechanical properties of Ti–6Al–4V components produced by selective laser melting and electron beam melting. Mater. Des. 2015, 86, 545–554. [Google Scholar] [CrossRef]
  25. Meier, B.; Warchomicka, F.; Kaindl, R.; Sommitsch, C.; Waldhauser, W. Influence of Different Surface- and Heat Treatments; Elevated Temperature, Orientation on the Fatigue Properties of Ti6Al4V Processed by L-PBF for Controlled Powder; STIN. Fatigue Fract. Mater. Struct. 2022, 24, 235–243. [Google Scholar] [CrossRef]
  26. Vrancken, B.; Thijs, L.; Kruth, J.-P.; Van Humbeeck, J. Heat treatment of Ti6Al4V produced by Selective Laser Melting: Microstructure and mechanical properties. J. Alloy. Compd. 2012, 541, 177–185. [Google Scholar] [CrossRef]
  27. Yang, L.; Wu, Y.; Lassell, A.; Zhou, B. Electropolishing of Ti6Al4V Parts Fabricated by Electron Beam Melting; Solid Freeform Fabrication 2016. In Proceedings of the 26th Annual International Solid Freeform Fabrication Symposium, Austin, TX, USA, 10–12 August 2015. [Google Scholar]
  28. Yang, L.; Gu, H.; Lassell, A. Surface treatment of Ti6Al4V parts made by powder bed fusion additive manufacturing processes using electropolishing; 2014; Solid Freeform Fabrication 2014. In Proceedings of the 24th Annual International Solid Freeform Fabrication Symposium, Austin, TX, USA, 12–14 August 2013. [Google Scholar]
  29. Mower, T.M.; Long, M.J. Mechanical behavior of additive manufactured, powder-bed laser-fused materials. Mater. Sci. Eng. A 2016, 651, 198–213. [Google Scholar] [CrossRef]
  30. Lucon, E.; Hrabe, N. Instrumented Impact Testing of Miniaturized Charpy Specimens of AM Ti-6Al-4V. Mater. Perform. Charact. 2018, 7, 126–138. [Google Scholar] [CrossRef] [PubMed]
  31. Malý, M.; Höller, C.; Skalon, M.; Meier, B.; Koutný, D.; Pichler, R.; Sommitsch, C.; Paloušek, D. Effect of Process Parameters and High-Temperature Preheating on Residual Stress and Relative Density of Ti6Al4V Processed by Selective Laser Melting. Materials 2019, 12, 930. [Google Scholar] [CrossRef]
  32. Nicoletto, G. Anisotropic HCF behavior of Ti6Al4V optained by powder bed laser fusion. Int. J. Fatigue 2016, 94, 255–262. [Google Scholar] [CrossRef]
  33. Pérez-Ruiz, J.D.; de Lacalle, L.N.L.; Urbikain, G.; Pereira, O.; Martínez, S.; Bris, J. On the relationship between cutting forces and anisotropy features in the milling of LPBF Inconel 718 for near net shape parts. Int. J. Mach. Tools Manuf. 2021, 170, 103801. [Google Scholar] [CrossRef]
Figure 1. Design of cantilever beams for distortion measurement (a) and after cutting (b).
Jmmp 06 00087 g001
Figure 2. Relative density over the surface-to-volume ratio.
Jmmp 06 00087 g002
Figure 3. SEM images of the microstructure after heat treatment: (a) SR and (b) FA, and (c) after HP.
Jmmp 06 00087 g003
Figure 4. Surface morphology before (a) and after (b) EP of vertical samples without heat treatment; after pickling for SR, V samples at (c) 100× and (d) 500× magnification; after EP for SR samples at (e) 100× and (f) 1000× magnification.
Jmmp 06 00087 g004
Figure 5. Stress–strain curves for (a) vertical, (b) free, and (c) horizontal orientations and (d) 5 tests of vertical, furnace-annealed, and as-built samples.
Jmmp 06 00087 g005
Figure 6. Compression yield strengths for 0.1% and 0.2% plastic deformation for different heat treatments and orientations.
Jmmp 06 00087 g006
Figure 7. Notched bar impact strength for different heat treatments and DoE set parameters (Table 4) in the vertical orientation.
Jmmp 06 00087 g007
Figure 8. Directional anisotropy—tensile strength.
Jmmp 06 00087 g008
Figure 9. Directional anisotropy—elongation at break and constriction.
Jmmp 06 00087 g009
Figure 10. Influences of heat and surface treatments on the anisotropy (a) and the direction of anisotropy of the compression yield strength as a percentage (b). All values can be found in Appendix B.
Jmmp 06 00087 g010
Figure 11. Notched bar impact strength for vertical, 45°, and horizontal furnace-annealed specimens.
Jmmp 06 00087 g011
Table 1. Parameter sets used for the line tests.
Line Energy (J/mm2)0.250.200.150.120.10
Laser Power (W)Scan Speed (mm/s)
1004005006678331000
12048060080010001200
14056070093311671400
150600750100012501500
160640800106713331600
180720900120015001800
Table 2. Specimen abbreviations.
OrientationHeat TreatmentSurface Treatment
VVertical: in the Build DirectionSRStress ReliefABAs-Built
F“Free”: 45° to XZ-axisFAFurnace annealingMAMachined
HHorizontal: perpendicular to the build directionHPHot isostatic pressingEPElectrochemically polished
Table 3. Chemical composition, PSD, and morphology of the powder.
Chemical CompositionAl (wt%)V (wt%)O (wt%)N (wt%)C (wt%)FE (wt%)Ar (ppm)H (ppm)
Virgin Powder6.133.90.160.030.010.071.121
Limit Grade 5 (ASTM B265)5.5–6.53.5–4.50.200.050.080.4Residuals (1000)150
Error±0.332±0.25±0.006±0.00444±0.0011±0.007-±70
PSDSphericityFlowability (s/50 g)Bulk Density (g/cm3)
D10 (µm)D50 (µm)D90 (µm)W/Hbh13HallCarney
18.833.648.70.890.94-8.42.34
Table 4. The DoE parameter sets used and their achieved densities and visible crack formation.
Parameter SetProcess ParametersRelative Density (%)Cracks
Laser Power (W)Scan Speed (mm/s)Hatching (µm)Energy Density (J/mm3)
122013508067.999.73-
222016508055.699.75-
324016508060.699.77-
4220105010069.899.85-
5320165010064.699.65-
6340165010068.799.58yes
722090012067.999.68-
8340135012070.099.61-
9240165012040.499.08yes
1022075014069.899.51-
11 1280120014055.699.66-
12260135016040.199.47-
13340165016042.999.30-
1434090018070.099.54yes
15340150018042.099.24-
1622075020048.999.62-
1730075020066.799.63-
1730075020066.799.63-
1 Default set.
Table 5. Density results for the optimized parameters and different cube sizes plus distortion.
Statistical Model and Suggested ParametersProcess ParametersRelative Density (%)Distortion Cantilever (mm)
Laser Power (W)Scan Speed (mm/s)Hatching (mm)Energy Density (J/mm³)Cubes 10 mmCubes 15 mmCubes 20 mmAverage
First Run *Default280120014055.699.5699.8399.8599.752.96
Best of220105010069.899.3999.7699.8899.68
Model 1280 W28015009069.199.5599.7899.8599.73
Best of23014008068.599.7399.7699.9299.803.00
Model 2280 W280135010069.199.4799.7999.8799.71
Best of2401450806999.7499.8599.8099.803.01
Model 3280 W280130012059.899.7499.6799.8299.74
Best of220105012058.299.6899.7599.7399.72
Model 4280 W28095017057.899.5199.8099.8399.71
Best of26095016057.099.6699.7399.8299.74
Model 5280 W28095017057.899.5199.8099.8399.71
Best of26090017056.699.7299.7099.8099.74
Model 6—Crack 1280 W28095017057.899.5199.8099.8399.71
Best of26095016057.099.6699.7399.8299.74
Model 7—Crack 2280 W280125011067.999.6999.7399.8299.75
Best of270120011068.299.7099.6899.8299.73
Average cube relative density (%)99.6199.7699.8399.74
* DoE model parameters.
Table 6. Infill porosity for vertical and horizontal cuts measured by optical microscope.
Microscope Type and Cut DirectionPorosity Infill (%)DeviationRelative Density (%)
Optical, vertical0.0170.00599.98
Optical, horizontal0.030.00899.97
Table 7. Surface roughness for different contour parameters; final parameters are presented in bold.
Parameter Set90°45° Upskin45° Downskin
Ra (µm)Rz (µm)Ra (µm)Rz (µm)Ra (µm)Rz (µm)
1Default *13.790.917.9110.218.9124.6
2E0.25 100 W11.673.616.298.526.0158.9
3E0.25 120 W14.587.914.582.931.6161.9
4E0.25 140 W13.485.212.887.023.4132.2
5E0.25 150 W10.464.613.179.628.3156.0
6E0.25 160 W12.675.511.166.323.6133.9
7E0.25 180 W12.074.010.871.321.7128.7
* Machine parameters.
Table 8. Surface roughness for as-built, machined, and electrochemically polished samples in vertical, 45°, and horizontal orientations. For F and H samples, up- and downskin surfaces were measured separately.
Surface TreatmentOrientationSurface Roughness
BuildSurfaceSa (µm)Sq (µm)Sz (µm)Ra (µm)Rq (µm)Rz (µm)
As-builtV-6.48.157.17.89.643.3
Fupskin8.811.278.76.27.736.8
downskin20.626.3182.424.626.5117.4
Hupskin8.810.670.76.27.934.6
downskin20.826.8200.020.725.1104.4
MachinedV-4.35.331.80.40.52.6
Fupskin4.55.633.60.91.15.3
downskin4.96.348.01.01.36.2
Hupskin4.75.938.30.70.94.5
downskin5.26.441.50.70.94.7
Electrochemically polishedV-6.58.2142.61.41.98.4
Fupskin3.13.823.61.92.27.7
downskin6.37.744.93.84.717.2
Hupskin5.16.436.40,81.03.7
downskin0.00.00.04.45.520.6
Publisher’s Note: MDPI stays neutral with regard to jurisdictional claims in published maps and institutional affiliations.

