Article

Binder Jetting 3D Printing of Magnesium Oxychloride Cement-Based Materials: Parametric Analysis of Manufacturing Factors

1
Department of Industrial Engineering, University of Trento, Via Sommarive 9, 38123 Trento, Italy
2
National Interuniversity Consortium of Materials Science and Technology (INSTM), Trento Research Unit, Via G. Giusti 9, 50121 Firenze, Italy
*
Author to whom correspondence should be addressed.
J. Manuf. Mater. Process. 2022, 6(4), 86; https://doi.org/10.3390/jmmp6040086
Submission received: 22 June 2022 / Revised: 29 July 2022 / Accepted: 3 August 2022 / Published: 9 August 2022

Abstract

:

Highlight

  • Controllable parameters in the binder jetting printing process were determined, and experiments were designed and performed to investigate their effect on the mechanical properties of the final products.
  • The modulus of rupture (MOR) was modeled as a function of its process parameters, including particle size, amount of binder, and layer thickness.
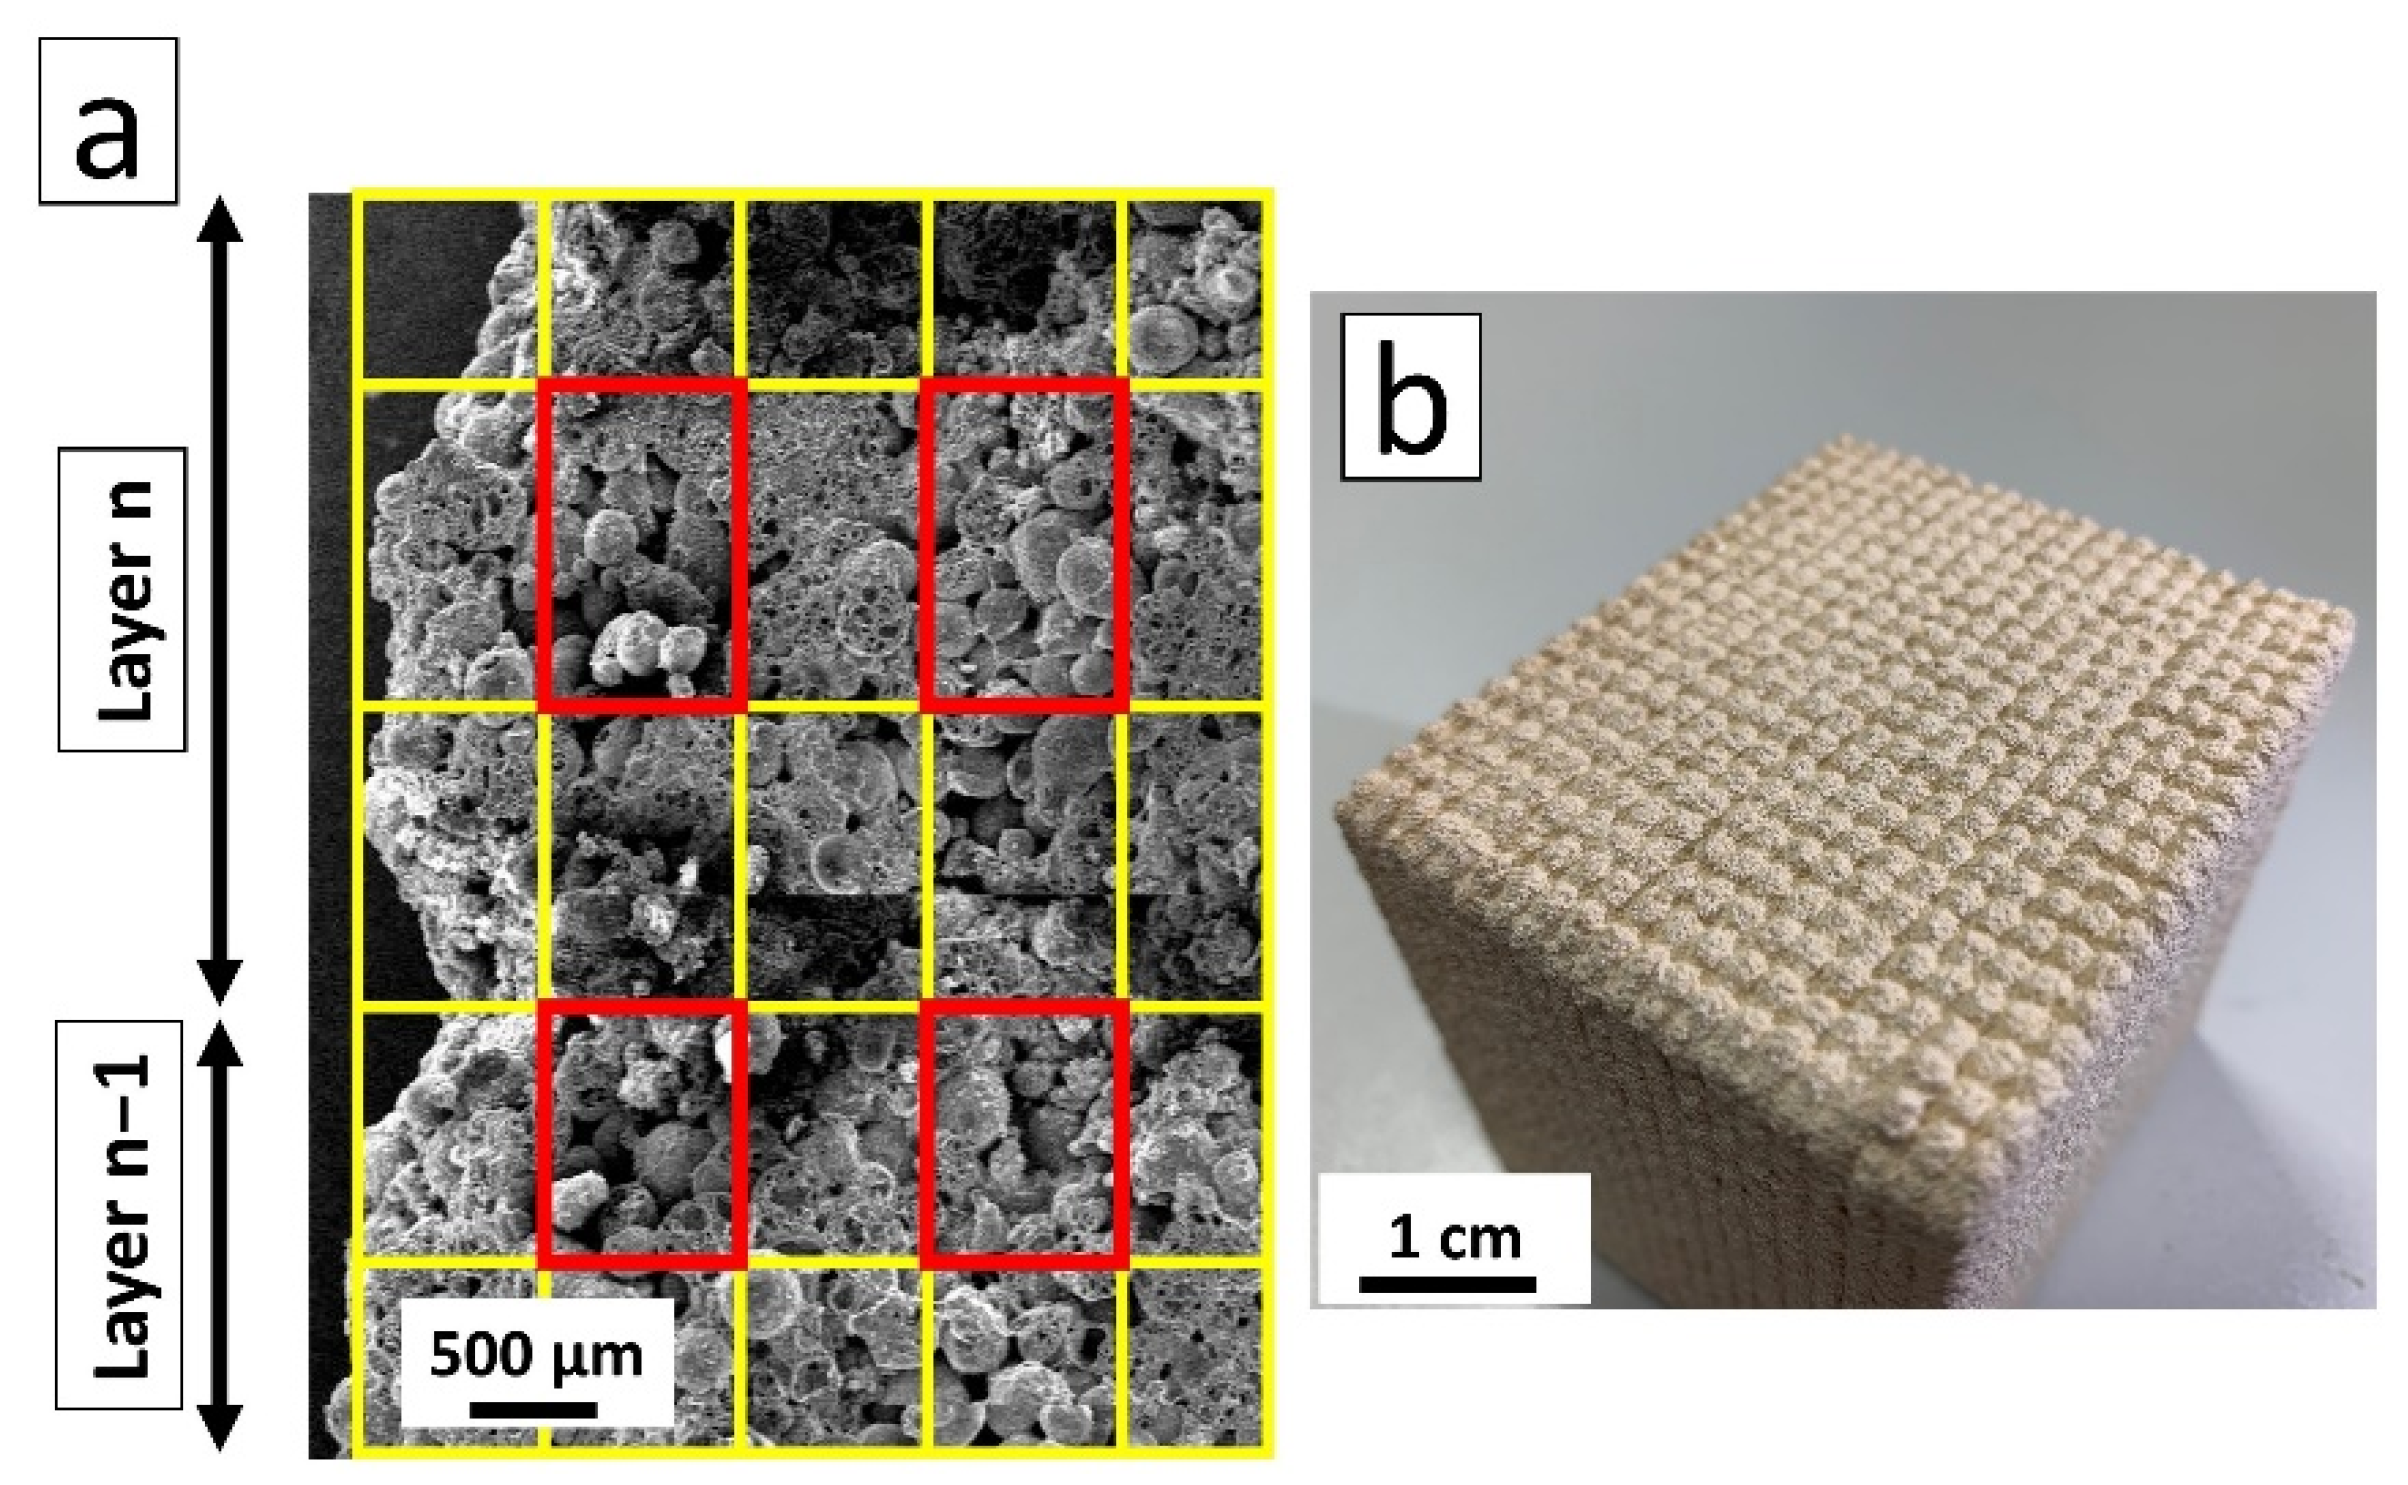
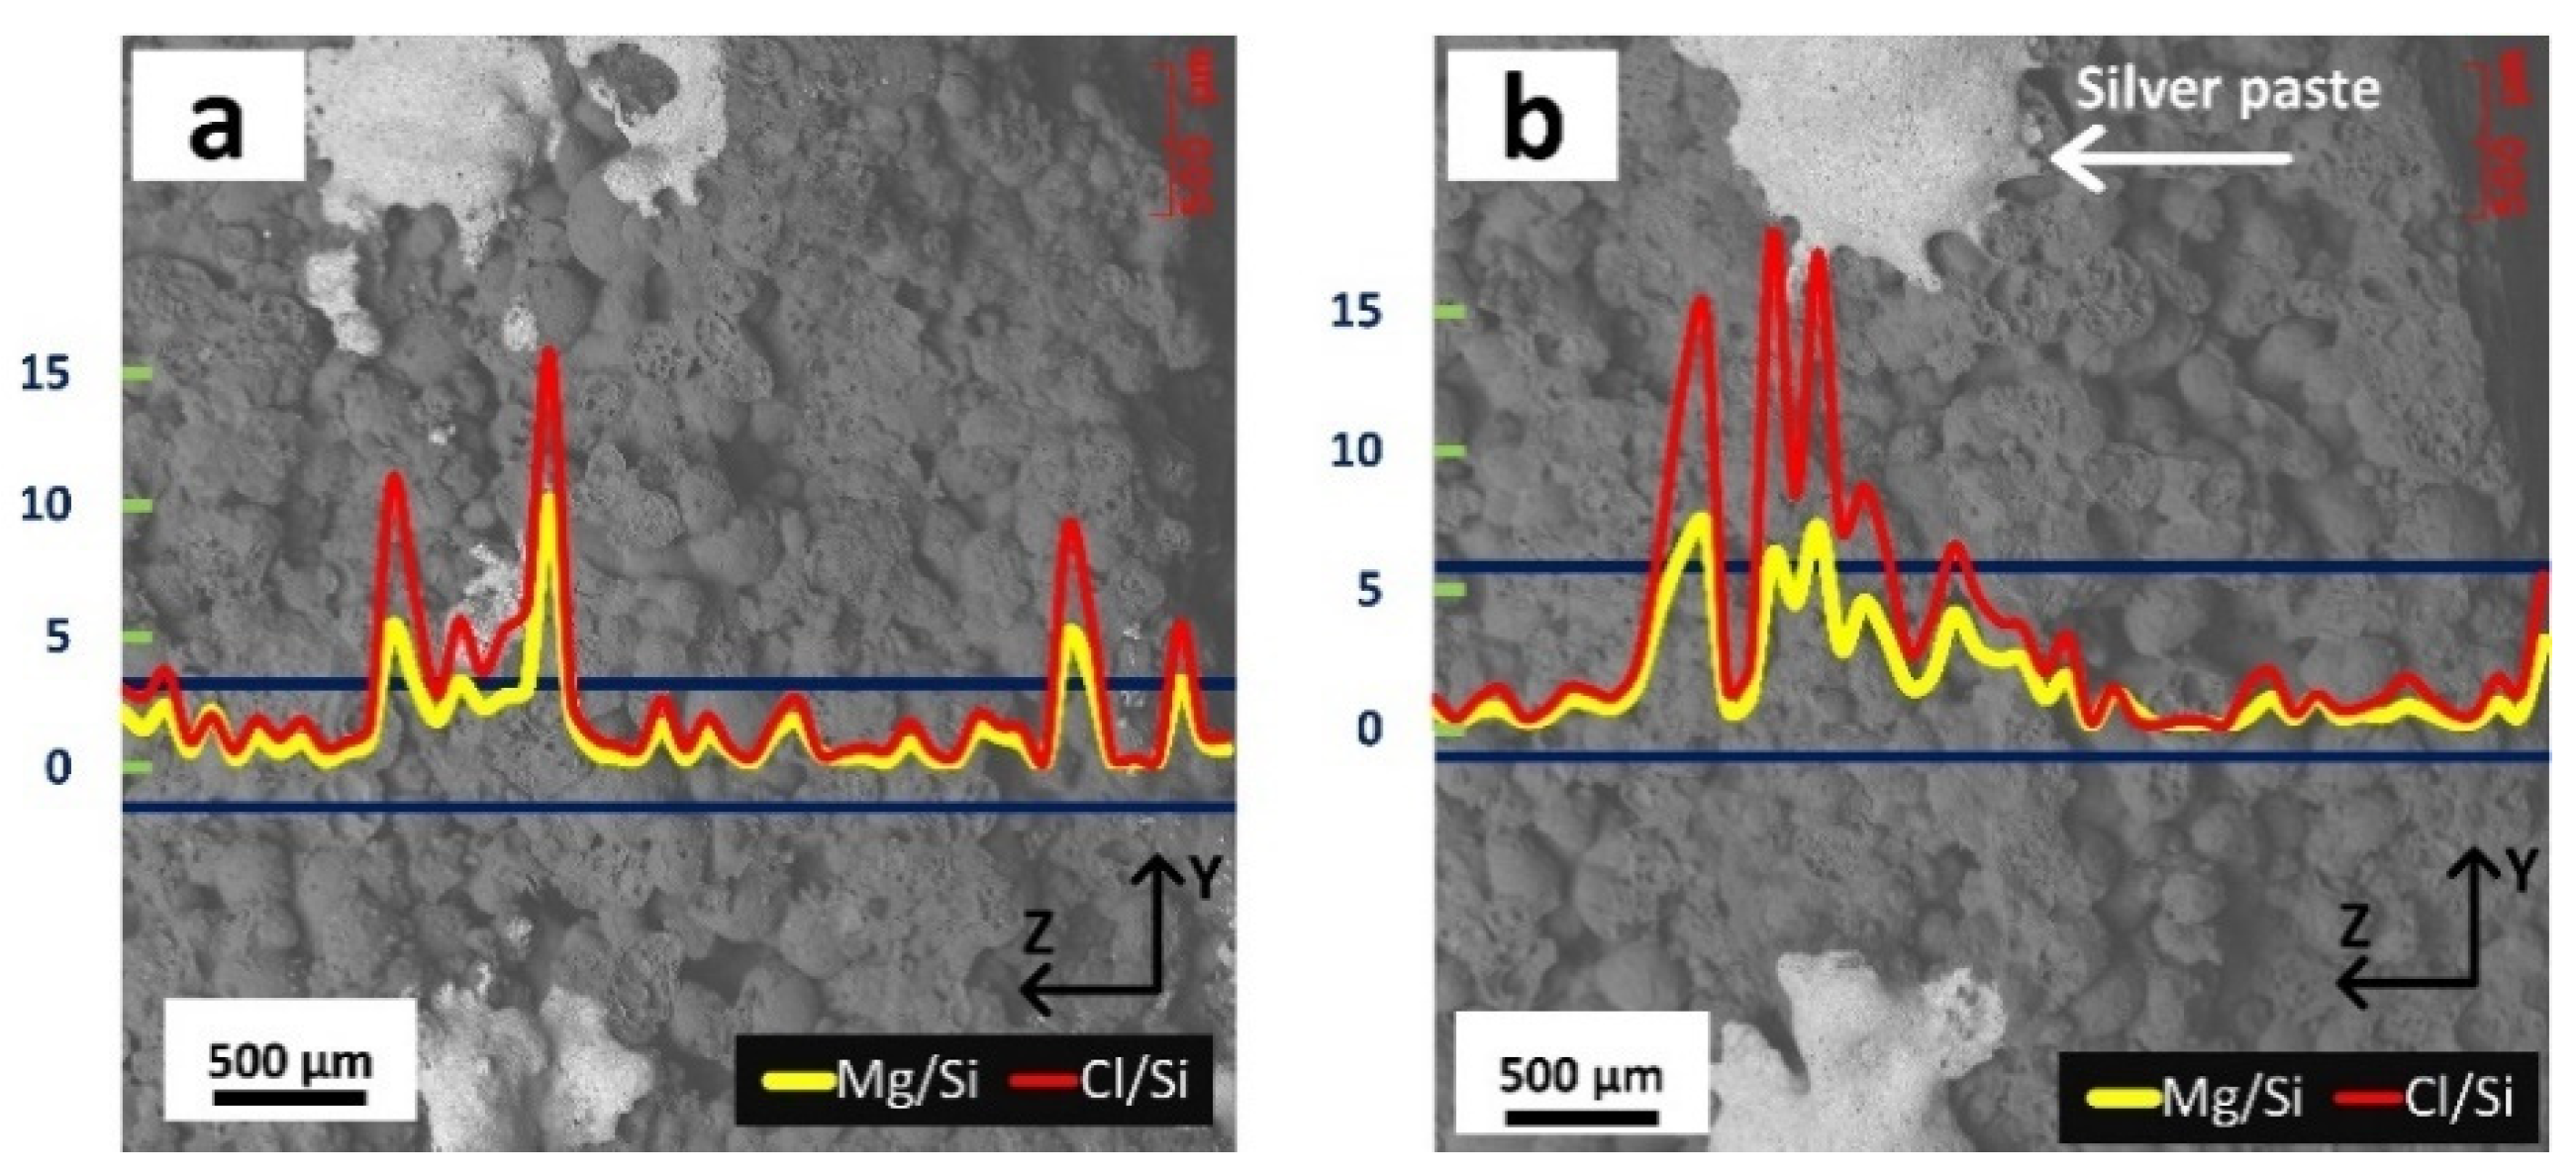
  • In an SCA-product, there are two types of interfaces: interlayer and intervoxel; blocks printed with high fluid pressure have stronger interlayer connections than those printed with low pressure, resulting in higher MOR.

Abstract

Powder-bed binder jet 3D printing is a flexible method for producing magnesium oxychloride (MOC)-based articles. Despite the great potential of this additive manufacturing technology for producing free-form MOC cement-based components, the influence of processing factors on final material performance has not yet been investigated and no general models exist for the selection of proper parameters with the desired quality. In the present work, the effect of six key manufacturing factors on the modulus of rupture of MOC cement-based components was studied, using an analysis of variance. The parametric analysis revealed that the material’s strength was strongly influenced by three process inputs: particle size, the amount of binder, and layer thickness. The amount of binder was determined by the “rate of voxel” and the “powder-bed density” and required precise control during the printing process. The introduced quadratic regression model can assist operators in selecting a combination of binder jet process inputs to achieve predetermined final material performance.

Graphical Abstract

1. Introduction

Additive manufacturing (AM), commonly known as 3D printing, is changing the way products are designed and fabricated [1]. Aerospace, automotive, and biomedical companies are pioneer industries that have adapted their production line to benefit from the numerous advantages of this technology [2,3,4,5,6,7]. Recently, AM has gained popularity in other fields, such as the construction industry [8]. While extrusion-based 3D printing technologies are essential for on-site building applications, powder-based 3D printing processes allow for a much greater degree of precision and enable complex geometries to be produced off-site [9,10,11,12].
Binder jetting is one of the most flexible powder-based 3D printing technologies, because a wide variety of materials can be processed, including ceramics, polymers, metals, and composites, without the need to design support structures required in other AM technologies [8,13]. Binder jetting reduces material input by means of structural optimization and the integration of functional details in the designed concrete elements [9]. Two different particle-bed 3D printing techniques can be used in building applications: selective cement activation, and cement paste intrusion [9,14]. The binder jetting printing process consists of three iterative steps: (1) spreading powder over a platform; (2) the selective deposition of a liquid bonding agent onto the powder, utilizing a printer head; and (3) lowering the platform or raising the printer head by the layer thickness of the model. In the end, the non-solidified powders are removed [1,15]. Powder-bed 3D printing enables the production of concrete elements with a free-form design, without the requirement of designing supporting structures or tools [9].
In recent decades, MgO-based cements have been considered potential eco-friendly materials for construction applications [16,17,18]. Magnesium oxychloride cement (MOC) is a non-hydraulic cement that possesses certain advantages over Portland cement [17,18]. It has high compressive and flexural strength that is achieved in a relatively short time [17,18], good fire resistance [17,18], low thermal conductivity [18], and low specific density [18]. It is obtained by mixing magnesium oxide (MgO) powder with a concentrated solution of magnesium chloride (MgCl2) [17]. An exothermic reaction generates magnesium oxychloride phases, called “5-phase” (5Mg(OH)2.MgCl2.8H2O) and “3-phase” (3Mg(OH)2.MgCl2.8H2O), which impart important mechanical properties [16,17]. During their room temperature curing regime, these cements reach their final strength in less than a couple of days [19].
Binder jetting appears to be a suitable method for 3D printing MOC-based material structures. The aggregate (inert) is mixed with pulverized magnesium oxide (MgO) before use as the powder bed. The cement is achieved when the oxide reacts with the MgCl2 that is contained in the water–salt binder that is dispensed from the printer head nozzle [9]. It is to be noted that MOC is suitable for different aggregates [18].
The parameters in the binder jetting process that influence the properties of the final product can be classified into five categories: (1) feature design (including CAD parts and designed optimizations); (2) the formulation of the powder (the selection of the aggregate and activator, as well as additives for the powder properties, e.g., flowability); (3) the formulation of the binder (the selection of the binding agent and additives for the solution rheology); (4) the printing process variables (e.g., the layer thickness and the printing orientation); and (5) the post-processing procedures (e.g., curing time) [20,21,22].
The aim of the present article was to study the effect of the process factors on the modulus of rupture of (MOC)-based 3D printed components. To make our approach clearer, we considered the fundamental factors that control the binder jetting process and classified them into three subsets: powder deposition, layer thickness, and binder jetting.

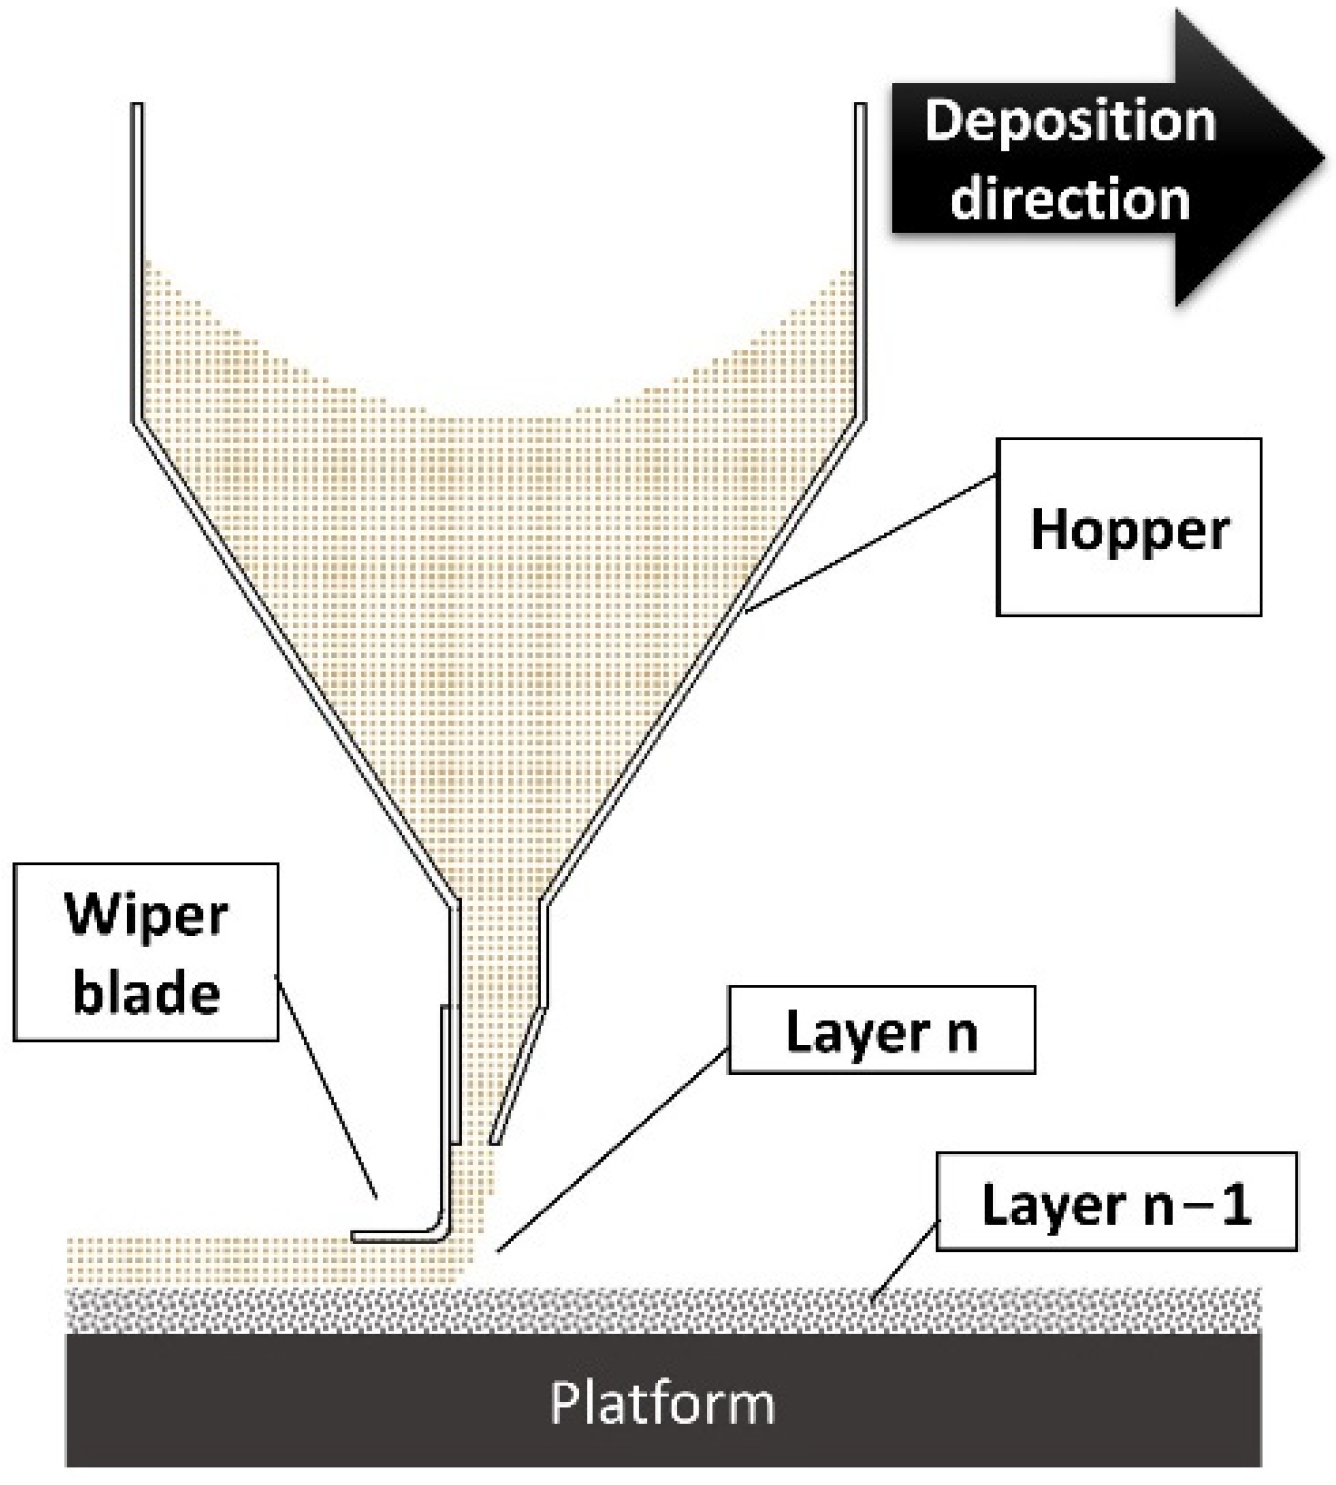
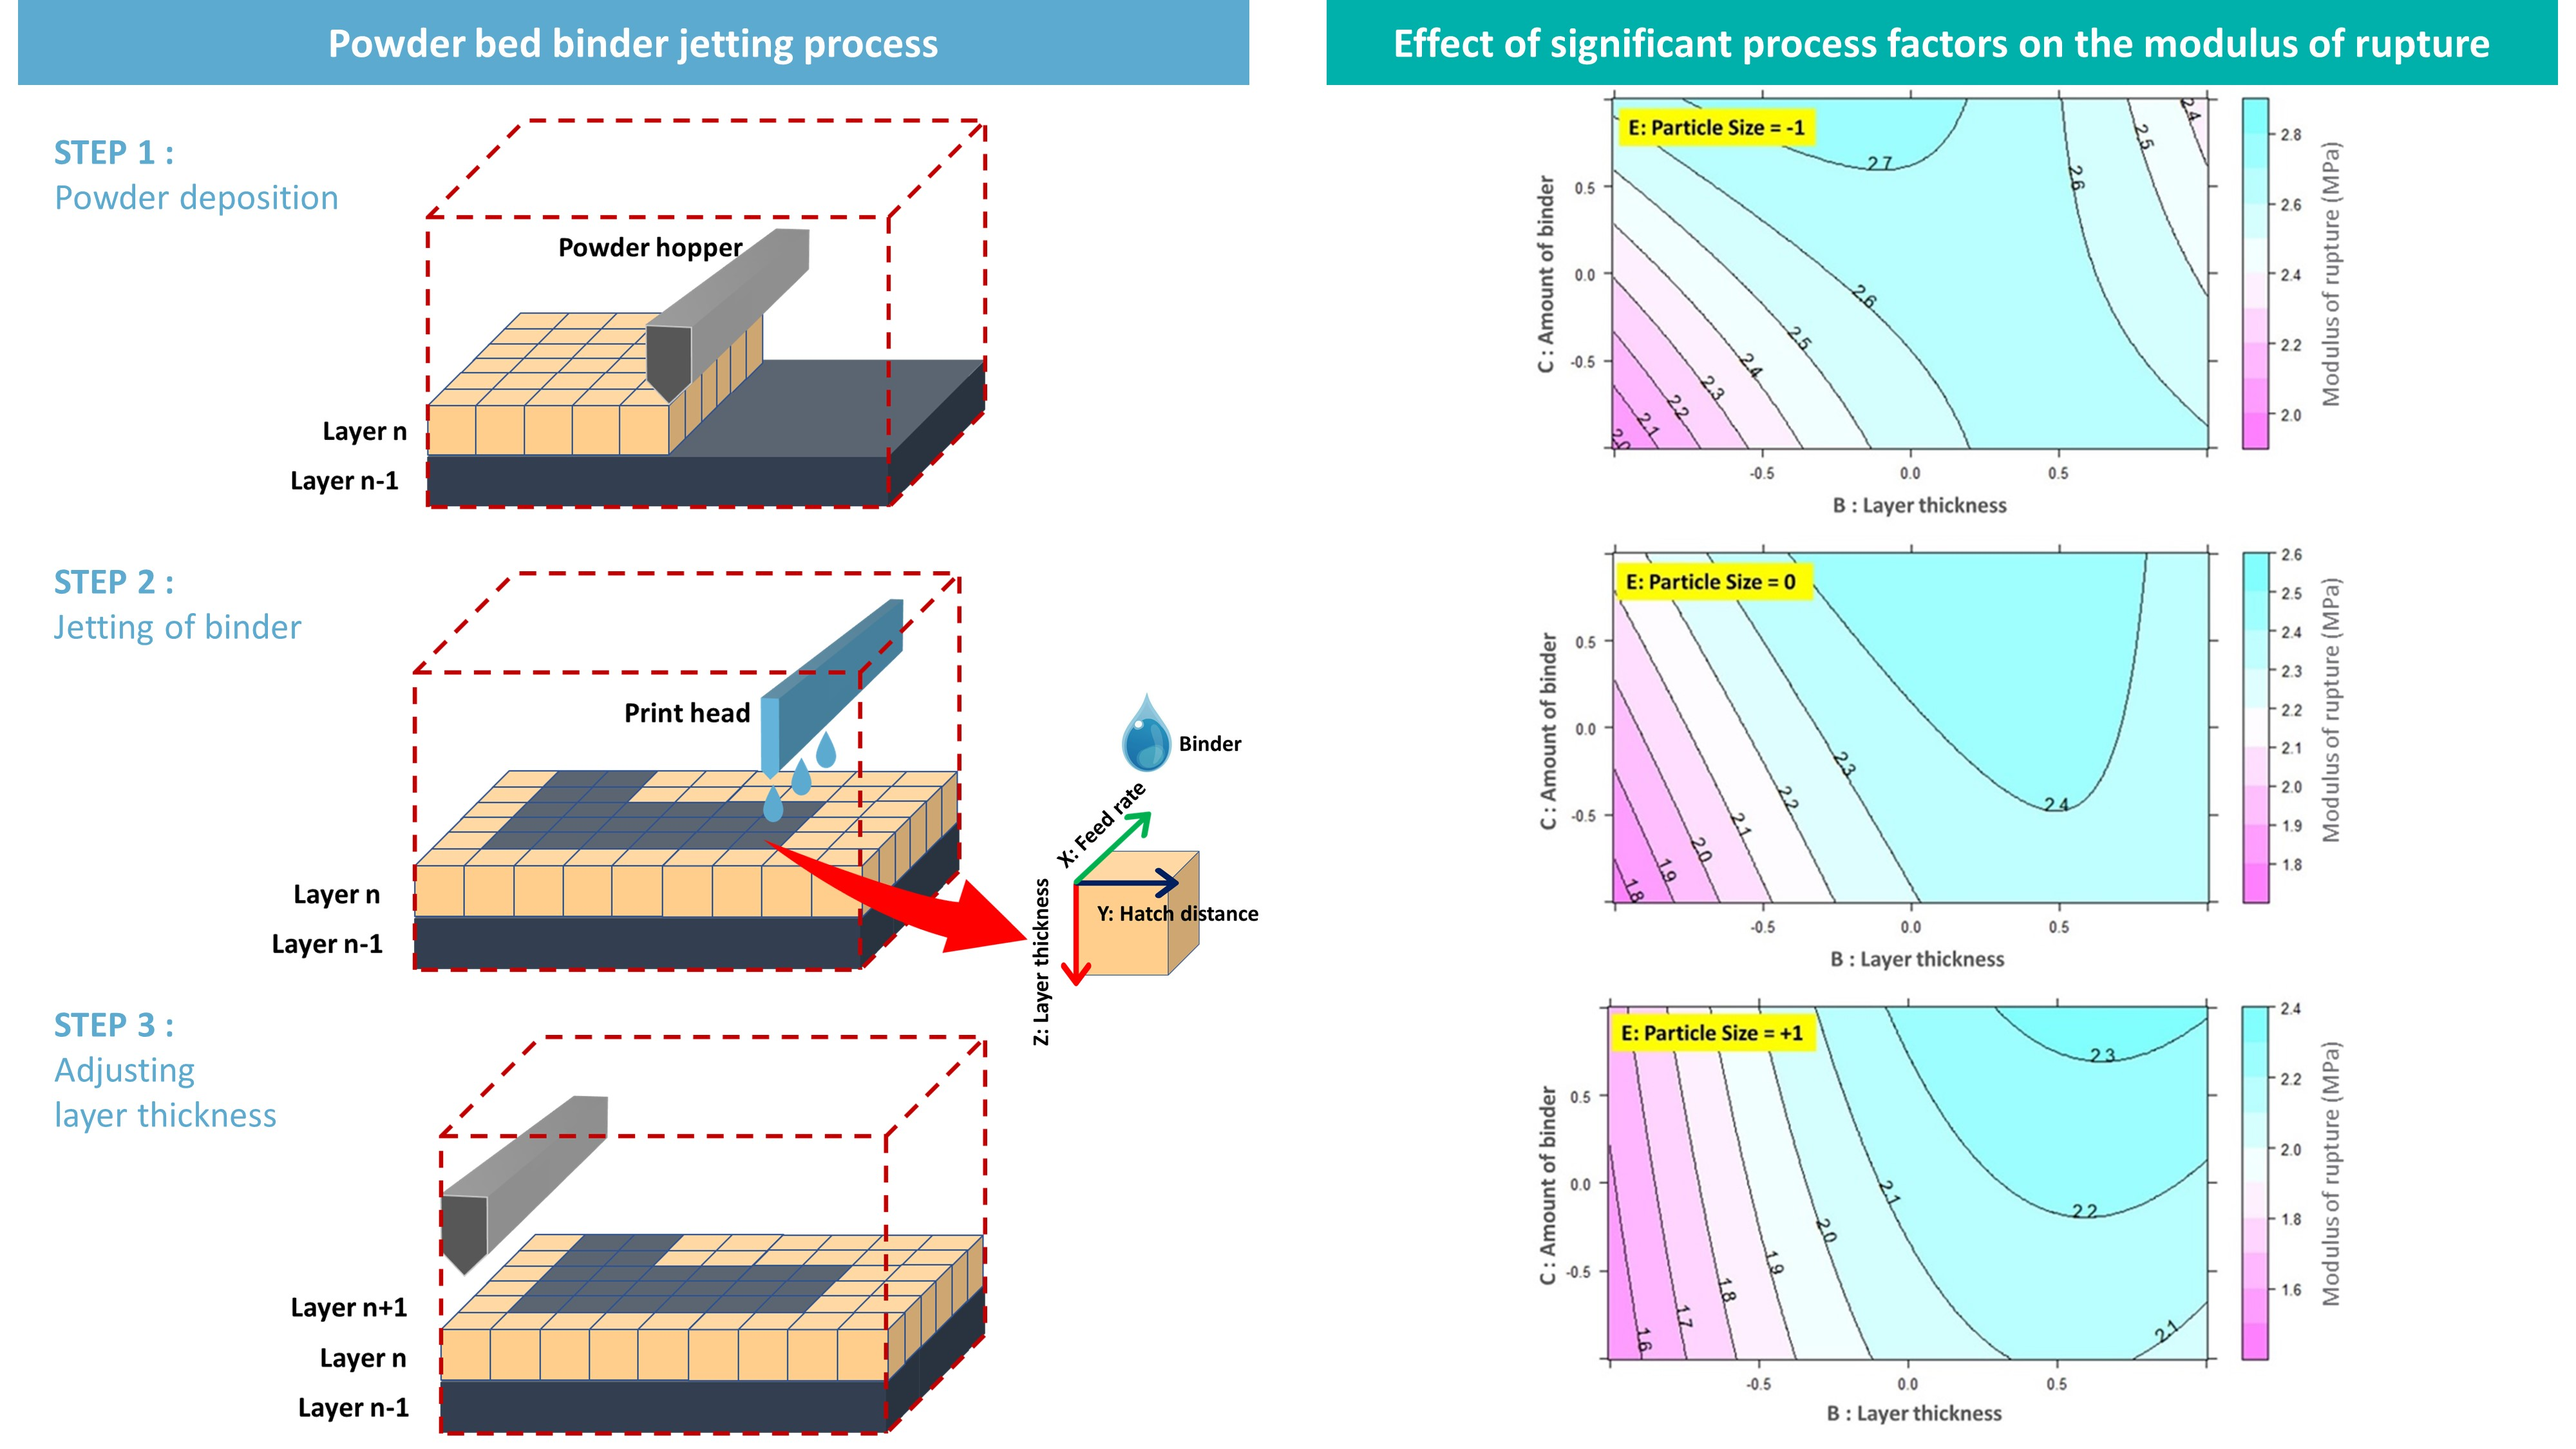
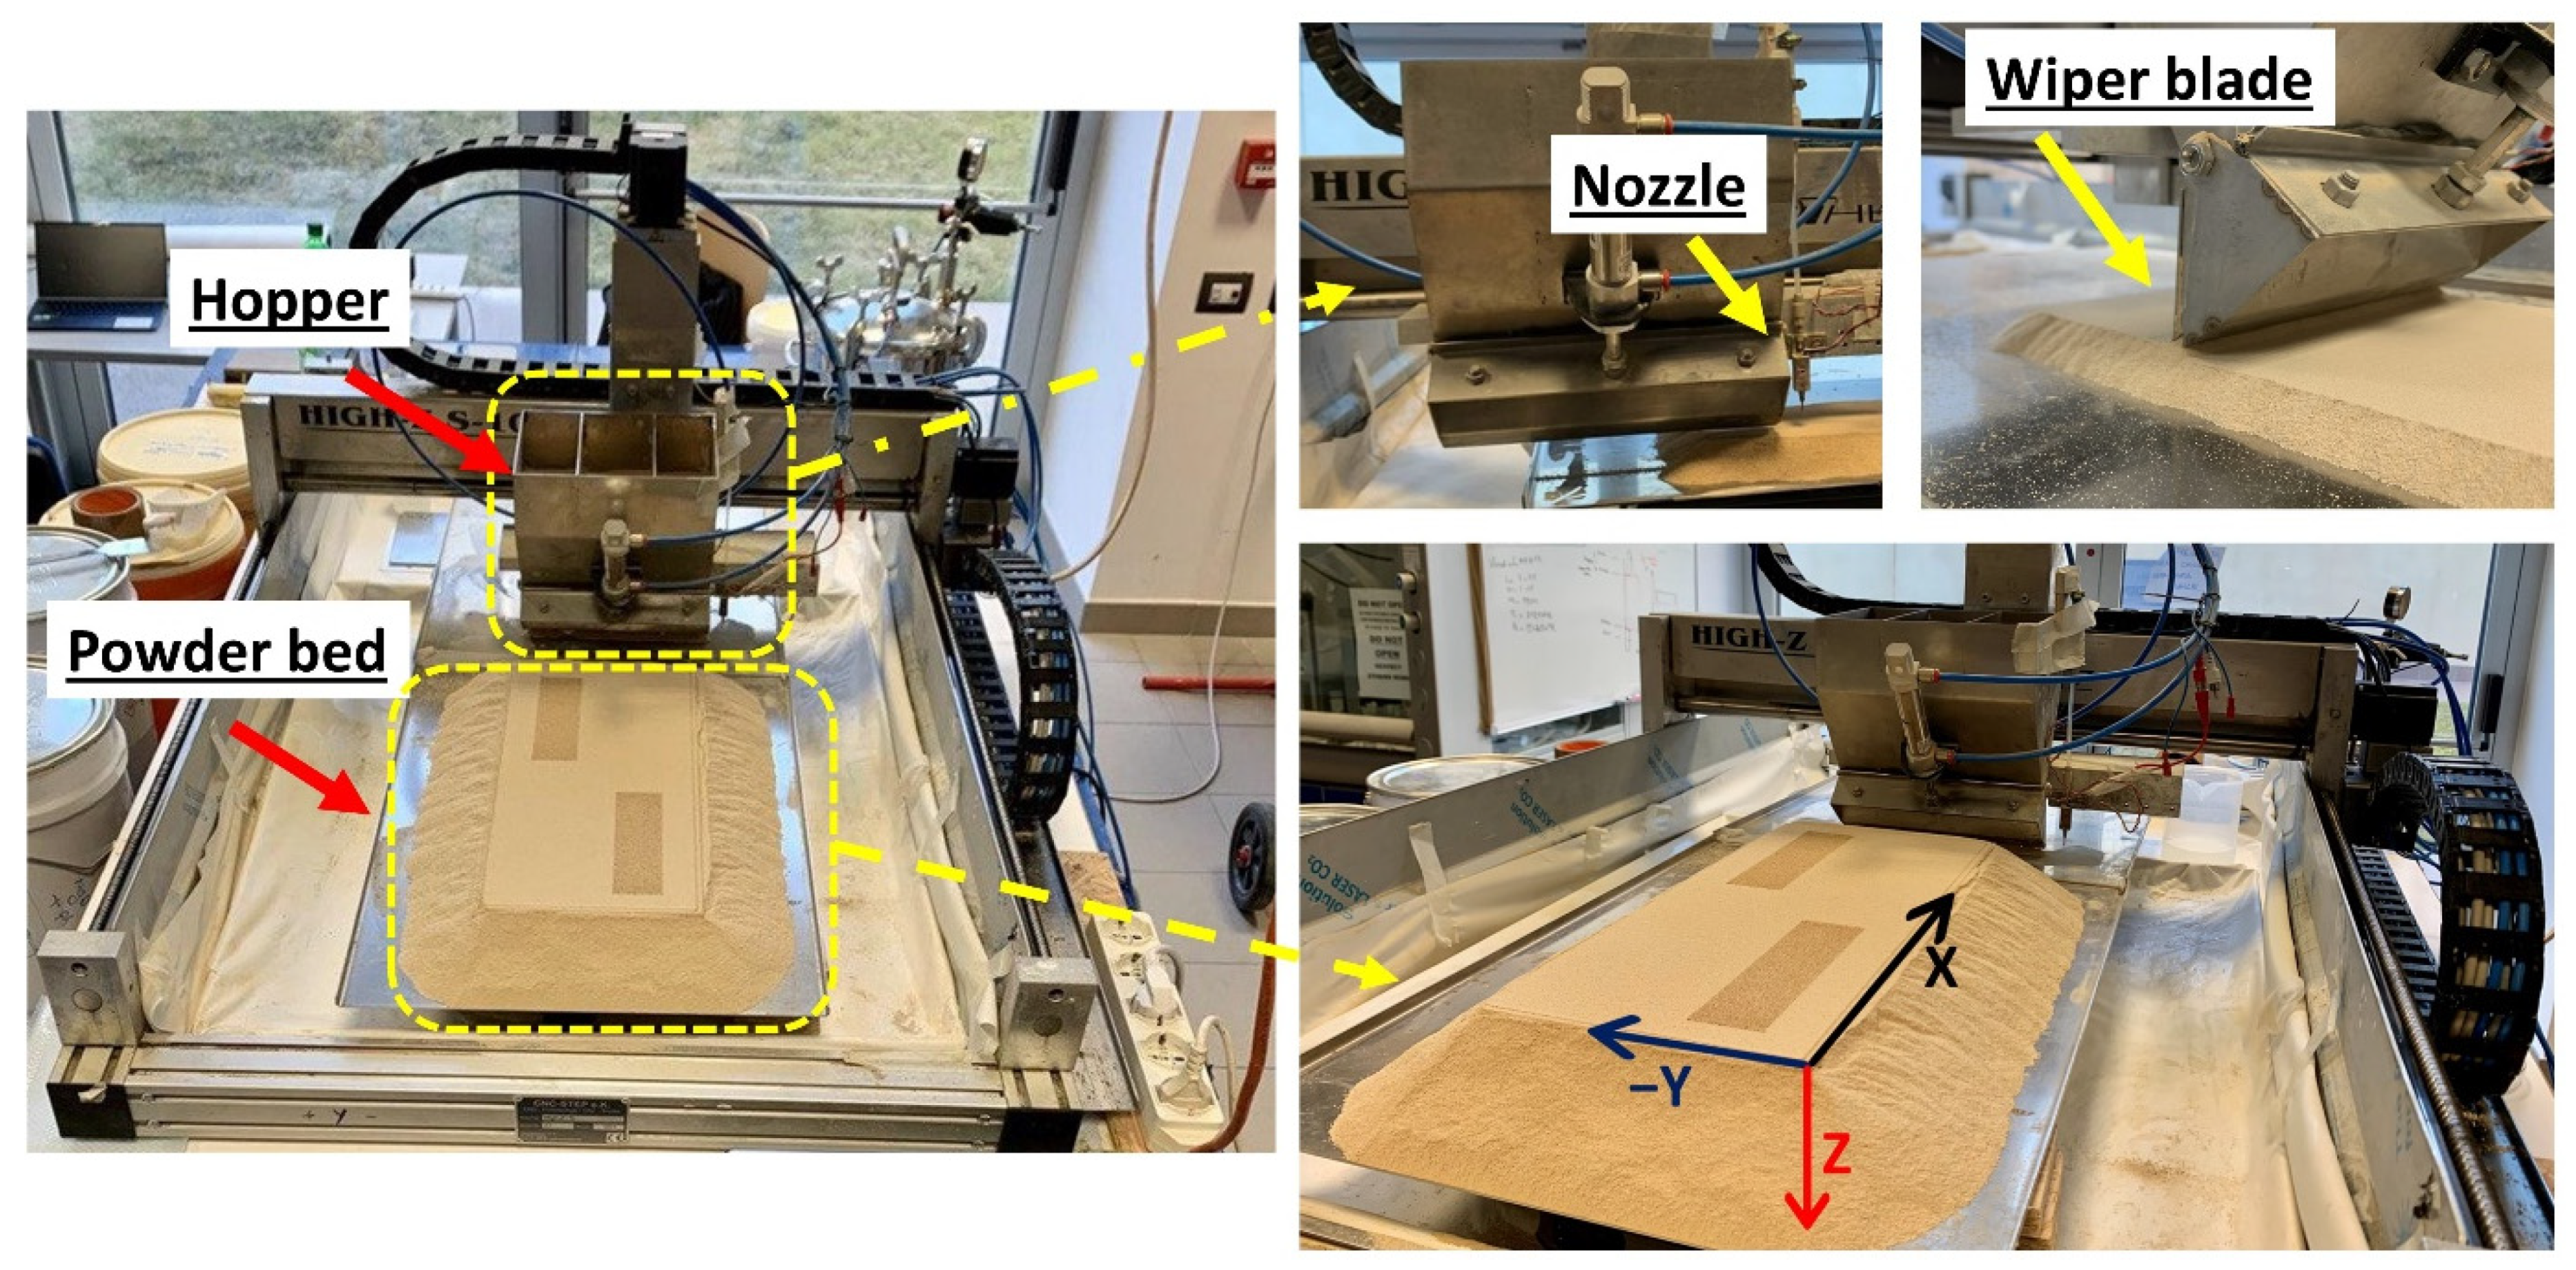
1.1. Deposition of the Powder Bed

The first step in the printing process is the deposition of a thin layer of powder bed on the build box. There are parameters in this step that affect the final properties of the product. The dimension, shape, and size distribution are the main characteristics of the powder particles that influence powder flowability when a homogeneous and sufficiently dense powder bed needs to be realized [11,22,23]. Spherical and coarse powders have better relative movement among the neighboring particles or in the container, which is described as better flowability [23]. In powder-bed AM techniques, the deposited layer has a packing density that is between the values of loose density and tapped density [24]. Although bigger particle sizes have better flowability, voids remain, and the powder-bed density is decreased; hence, a multimodal distribution is recommended, where fine particles can fill voids between large particles [25]. Powder packing significantly affects binder spreading and, consequently, the strength of the printed body [20]. The powder spreading speed, which determines how fast each layer is deposited, affects the powder-bed density [20].

1.2. Adjusting Layer Thickness

Layer thickness is one of the most important printing parameters in various AM techniques, as it strongly affects the properties of the printed products. It is defined as the thickness of a single deposited layer and it is governed by the resolution of the printing part and particle size [24]. A smaller thickness provides better resolution, surface quality, and strength; however, it increases the processing and printing times [20,25,26,27,28]. The chosen amount of binder must allow sufficient penetration between layers, but avoid seepage into other regions of the powder bed [29].

1.3. Jetting of the Liquid Binder

Commercial binder jetting printers use drop-on-demand (DOD) printing mechanisms with piezo elements to dispense drops of binder, after mechanical positioning on the powder bed [9,30]. The printhead traverses over the powder bed at a given feed rate, while dispensing droplets of binders form a single line [31]. Spreading, bouncing, or splashing are possible impacts of a droplet on a porous surface. The interaction between a jetted droplet and a porous surface depends on printhead velocity and the spacing between successive printed tracks (lines) [23]. Miyanaji et al. [23] showed that a larger printing speed reduces the accuracy of the fabricated part. The build orientation has a significant effect on the modulus of rupture of the printed materials [2,22,31].
In the production of concrete or cement components by powder-bed 3D printing, the interaction between the deposited powder and the dispensed binder initiates the hardening chemical reactions. The mechanical properties of the printed material are determined by the aggregate grain size and the relative amount of binder. It is clear that particle size and the binder saturation level (i.e., the relative amount of the fluid) have a significant impact on the mechanical properties of the printed parts [22,25,32,33,34]. Typically, a reduction in particle size results in higher mechanical strength because of the larger relative amount of cement in the body, which is substantially proportional to the specific surface area of the aggregate [25,35,36,37].
Although selective binding in a particle bed is a viable method for digitizing construction components, no methodical approaches are available to correlate the process inputs and the modulus of rupture of the printed parts. Most of the previous research into binder jetting investigated the optimization of processes in which metal powders were used. For the “selective binding” of aggregates method that is of interest in this article, two different techniques are proposed: “cement paste intrusion,” where a cement suspension is deposited on the powder bed for hardening, and “selective cement activation,” where an activator binder is dispensed on a cement–aggregate mixture layer [9,15,38]. Unfortunately, no results are available in the literature about optimizing the properties of binder jet 3D printing cement-based materials or the modulus of rupture, which could assist engineers in designing material performance [39]. In the present work, a multi-variable regression model is established to predict the modulus of rupture as a function of process inputs for binder jetting 3D printed MOC-porous glass aggregate.

2. Experimental Designs and Methods
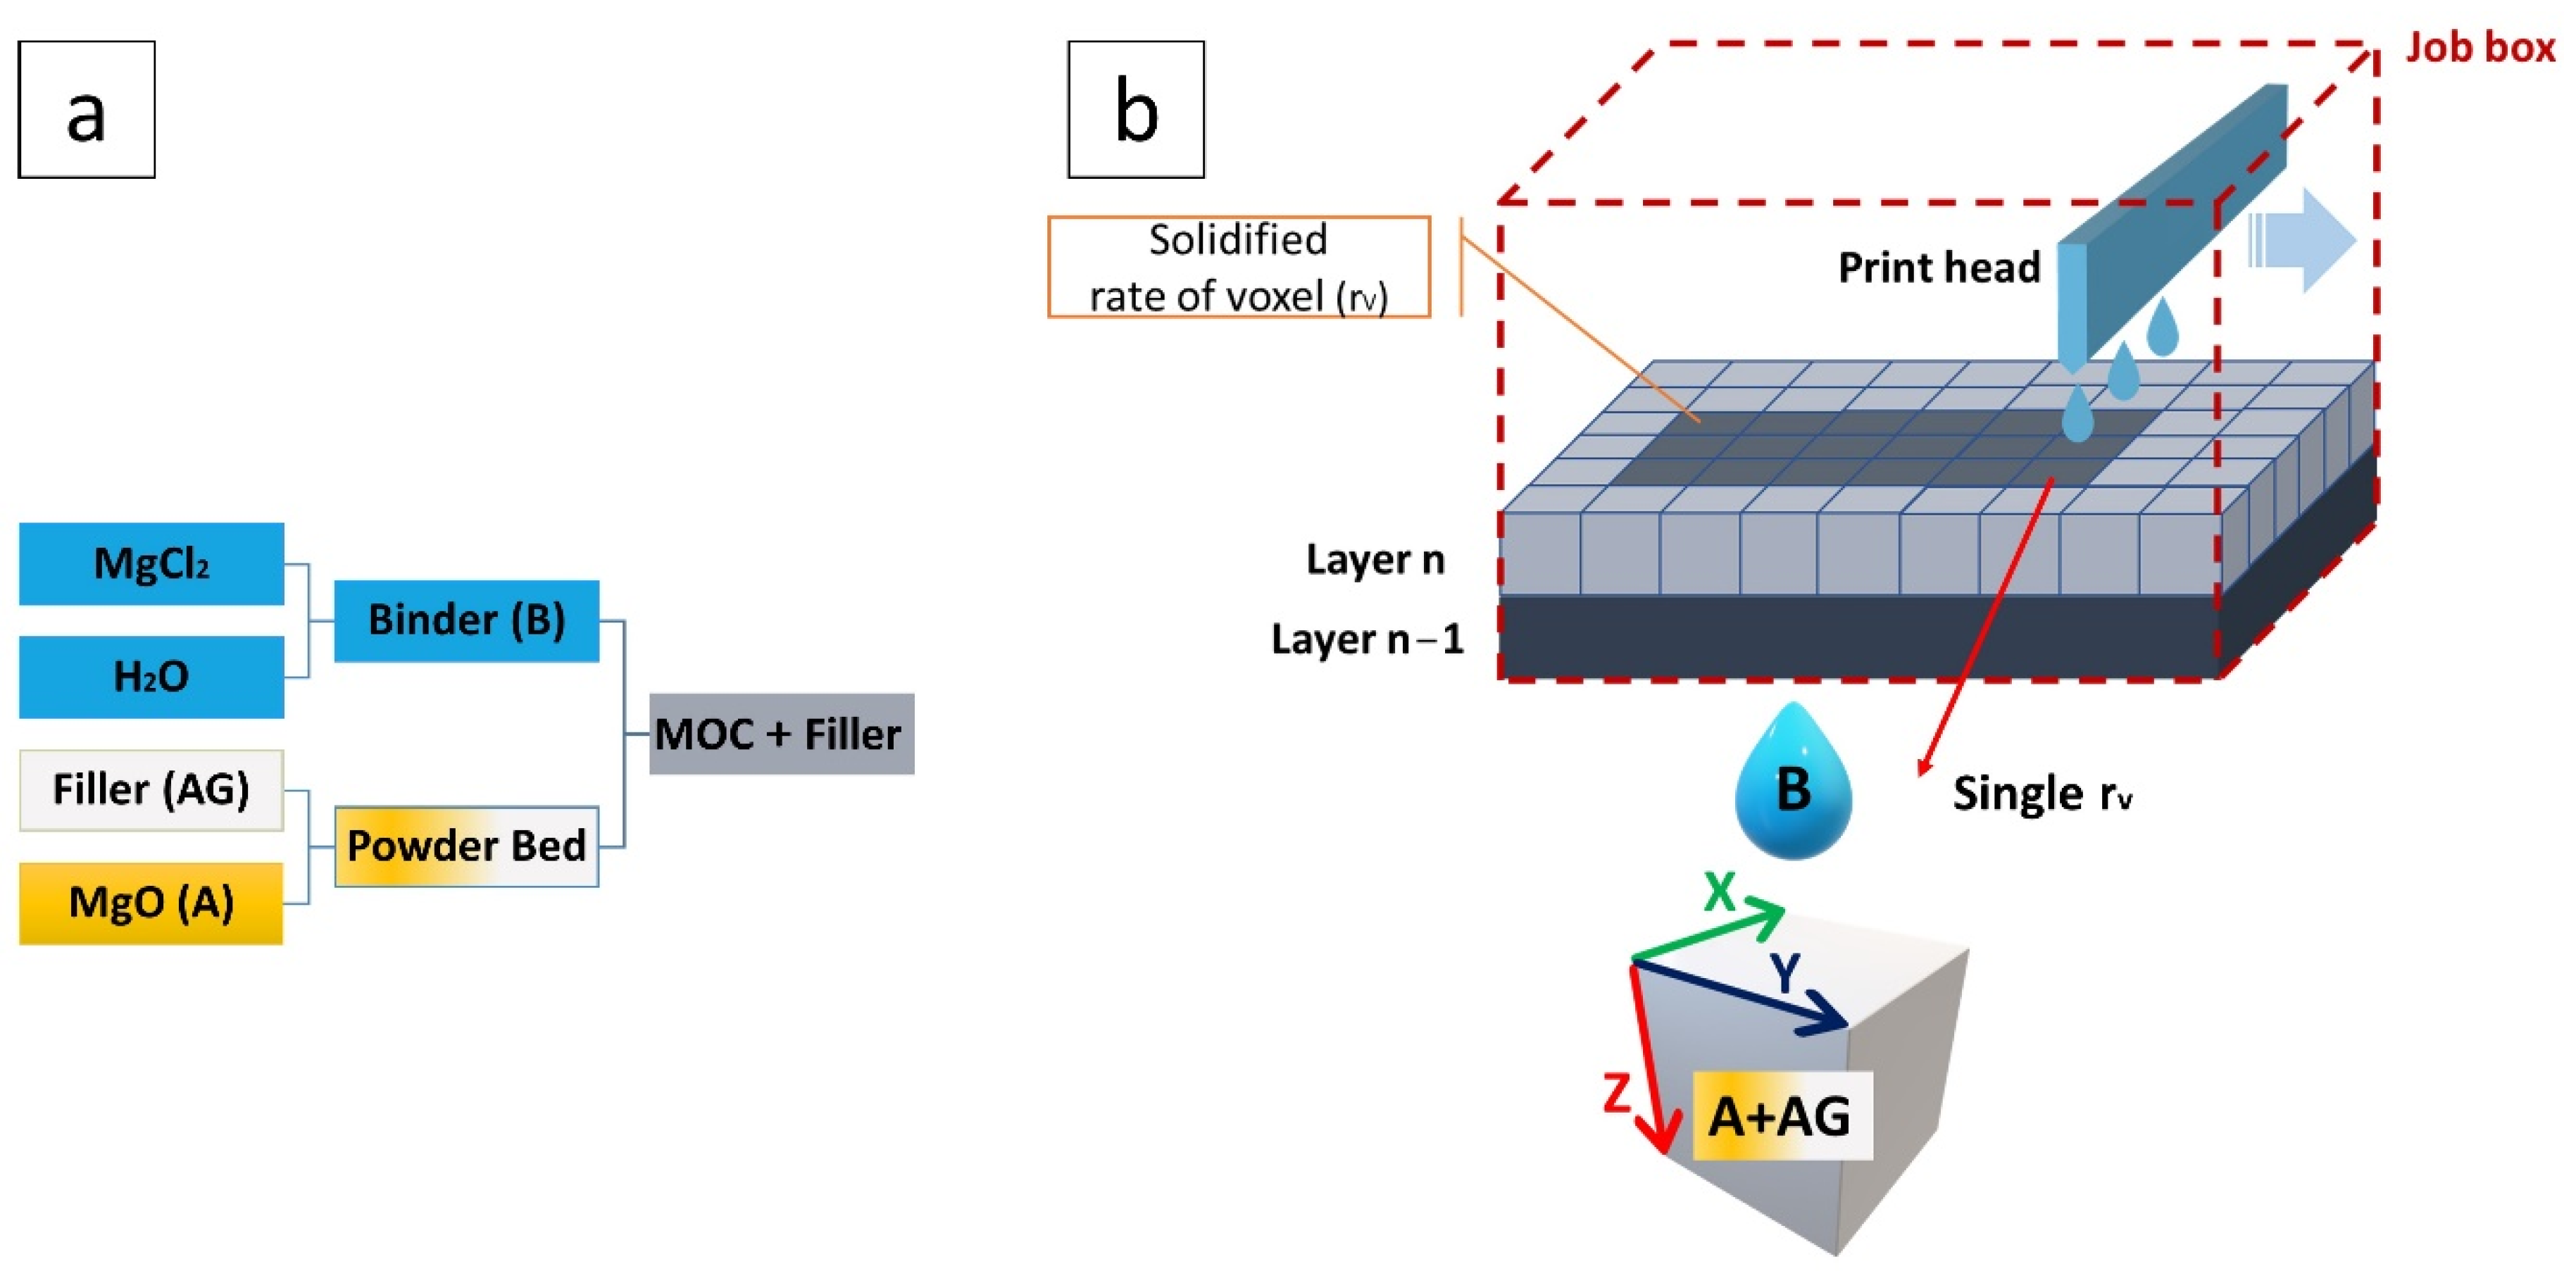
2.1. Material

The binder jetting process we used was intended to produce a lightweight concrete material, made by porous glass aggregate and magnesium oxychloride cement. The compositions were chosen according to a preliminary activity that aimed to obtain 3D printed materials with reasonable strength. The liquid binder used in the experiments, as reported in Table 1, was a deionized water solution of magnesium chloride hexahydrate (MgCl2.6H2O) (flakes, including 47.2% MgCl2, DEUSA International GmbH, Bleicherode, Germany) and rice starch (Z.E.U.S. GmbH, Bolzano, Italy) to control the viscosity. The binder was obtained by mixing the components in a glass container; first stirring the magnesium chloride hexahydrate in water for 15 min at ambient temperature. The solution was heated to 60 °C followed by adding rice starch and stirring with a magnetic stirrer for 5 h to obtain a suspension.
A blend of commercially available magnesium oxide (MgO) (81% MgO, particle size < 90 μm, Styromag GmbH, tragöß—St. Katharein, Austria), porous glass (Poraver®, Dennert Poraver GmbH, Schlüsselfeld, Germany), orthophosphoric acid (H3PO4) (85 wt% in water, Carlo Erba Reagents, Val-de-Reuil, France), and methylcellulose (Decotric GmbH, Hann. Münden, Germany) was used for the preparation of the powder bed, as summarized in Table 2. The porous glass was selected in two ranges of grain size, 0.1 mm to 0.3 mm and 0.25 mm to 0.5 mm. Powder-bed mixtures were prepared by mixing all the components in a concrete mixer for 3 h.

2.2. 3D-Printing

The binder jetting process was carried out using the materials described above on a semi-automatic 3D printing laboratory set-up, which included a motorized XYZ platform equipped with a hopper and a micro dispensing system (Figure 1). The powder blend stored in the hopper bin was deposited on the X direction platform and immediately flattened by a wiper blade. The aqueous binder, stored in a pressurized vessel, was sprayed by a single nozzle (with a 0.19 mm internal diameter) onto the powder bed, while moving in the X–Y plane according to the predefined CAD model. In the parts where the binder was applied, the powder material solidified, while the remaining powder material remained as a support for the other parts. The printhead was adjusted in the Z direction to generate a predetermined layer thickness for printing the successive section. The pressure regulated the binder flow rate, while the signal frequency for the solenoid valve in the nozzle was kept constant during all experiments. Deposited powders in a layer were confined by printing a contour in the margin of the related cross-section. The minimum feature size in the X–Y plane was ~12 mm.
Specimens with nominal dimensions of 150 mm × 40 mm × 40 mm were printed and tested for flexural strength using the ASTM C293 standard [40]. The printed components were sufficiently hardened after 24 h to be extracted from the powder bed. Then, they were subjected to curing in lab air at room temperature for 5 to 7 days to allow the MOC chemical reactions to finish.
The mechanical strength of binder jetting printed parts can be significantly affected by the printing parameters. Based on design of experiments (DOE) principles, the experimental procedure was designed to identify the effect of the inputs [41]. We investigated the effects of six fundamental process parameters on the modulus of rupture were investigated. Among all of the variables, the printing process factors that operators can control were selected, as summarized in Table 3. The designed CAD file of the specimens was sliced to generate the G-code program for every printing session. The nominal “feed rate”, “velocity of powder spread”, “layer thickness”, and “hatch distance” were assigned to the G-code that was sent to the 3D printer controller. The pressure to provide the required amount of binder was adjusted by a precise regulator in the system, and a pressure sensor read the values.
Factorial designs are the most efficient method used in experiments where the study of the interaction effect of several factors on a response is required [41,42]. The industrial factorial analysis relies on two levels of factorial designs to realize the process, including identifying the factors that cause a difference in the final properties of the product and the interaction between the factors [41]. Adding center point runs provides enough information if the obtained regression model is linear or includes quadratic terms. In the manner of non-linearity for the model, a higher level of factorial design (e.g., three levels of factorial design), central composite design (CCD), or Box-Behnken design must be conducted for a quadratic model regression [41].
Screening of the process was applied by a two-level fractional factorial plane (FFP) in three treatments, using the generators I = ABCDEF ( 2 V I 6 1 ). To measure the stability of the process and to test the curvature of the regression model, six center point runs were conducted at the end of the experiments. The low and high values of each level were determined experimentally by observing dimensionally acceptable samples (Table 3). The whole design and analysis process was performed by RStudio software [43]. The top rows of the designed plan are shown in Table 4.
The effect of the selected factors and their interactions on the modulus of rupture was examined by analysis of variance (ANOVA). The confidence level was considered to be 95% for p-values.
A multivariable regression model can predict the modulus of rupture as a function of the printing significant inputs. The initial terms of this model can be written as follows:
Y = φ 0 +   φ a A +   φ b B +   φ ab AB + φ a 2 A 2 + φ b 2 B 2 + ϵ
where Y is the predicted modulus of rupture, ϕ0 is the y-intercept, and ϕi indicates the coefficients values. The letters, e.g., A and B, represent factors as inputs for the model [38].
The printing factors are provided in coded units, defined as follows:
z = 2 R x x min 1
where z represents the coded level value for each factor x, R is the range of values for factor x, and xmin is the minimum value for factor x. By substituting factor levels (x) that were orthogonally coded, the maximum value is coded as 1, the midpoint as 0, and the minimum as −1 [44].

2.3. Binder Liquid Flow Rate
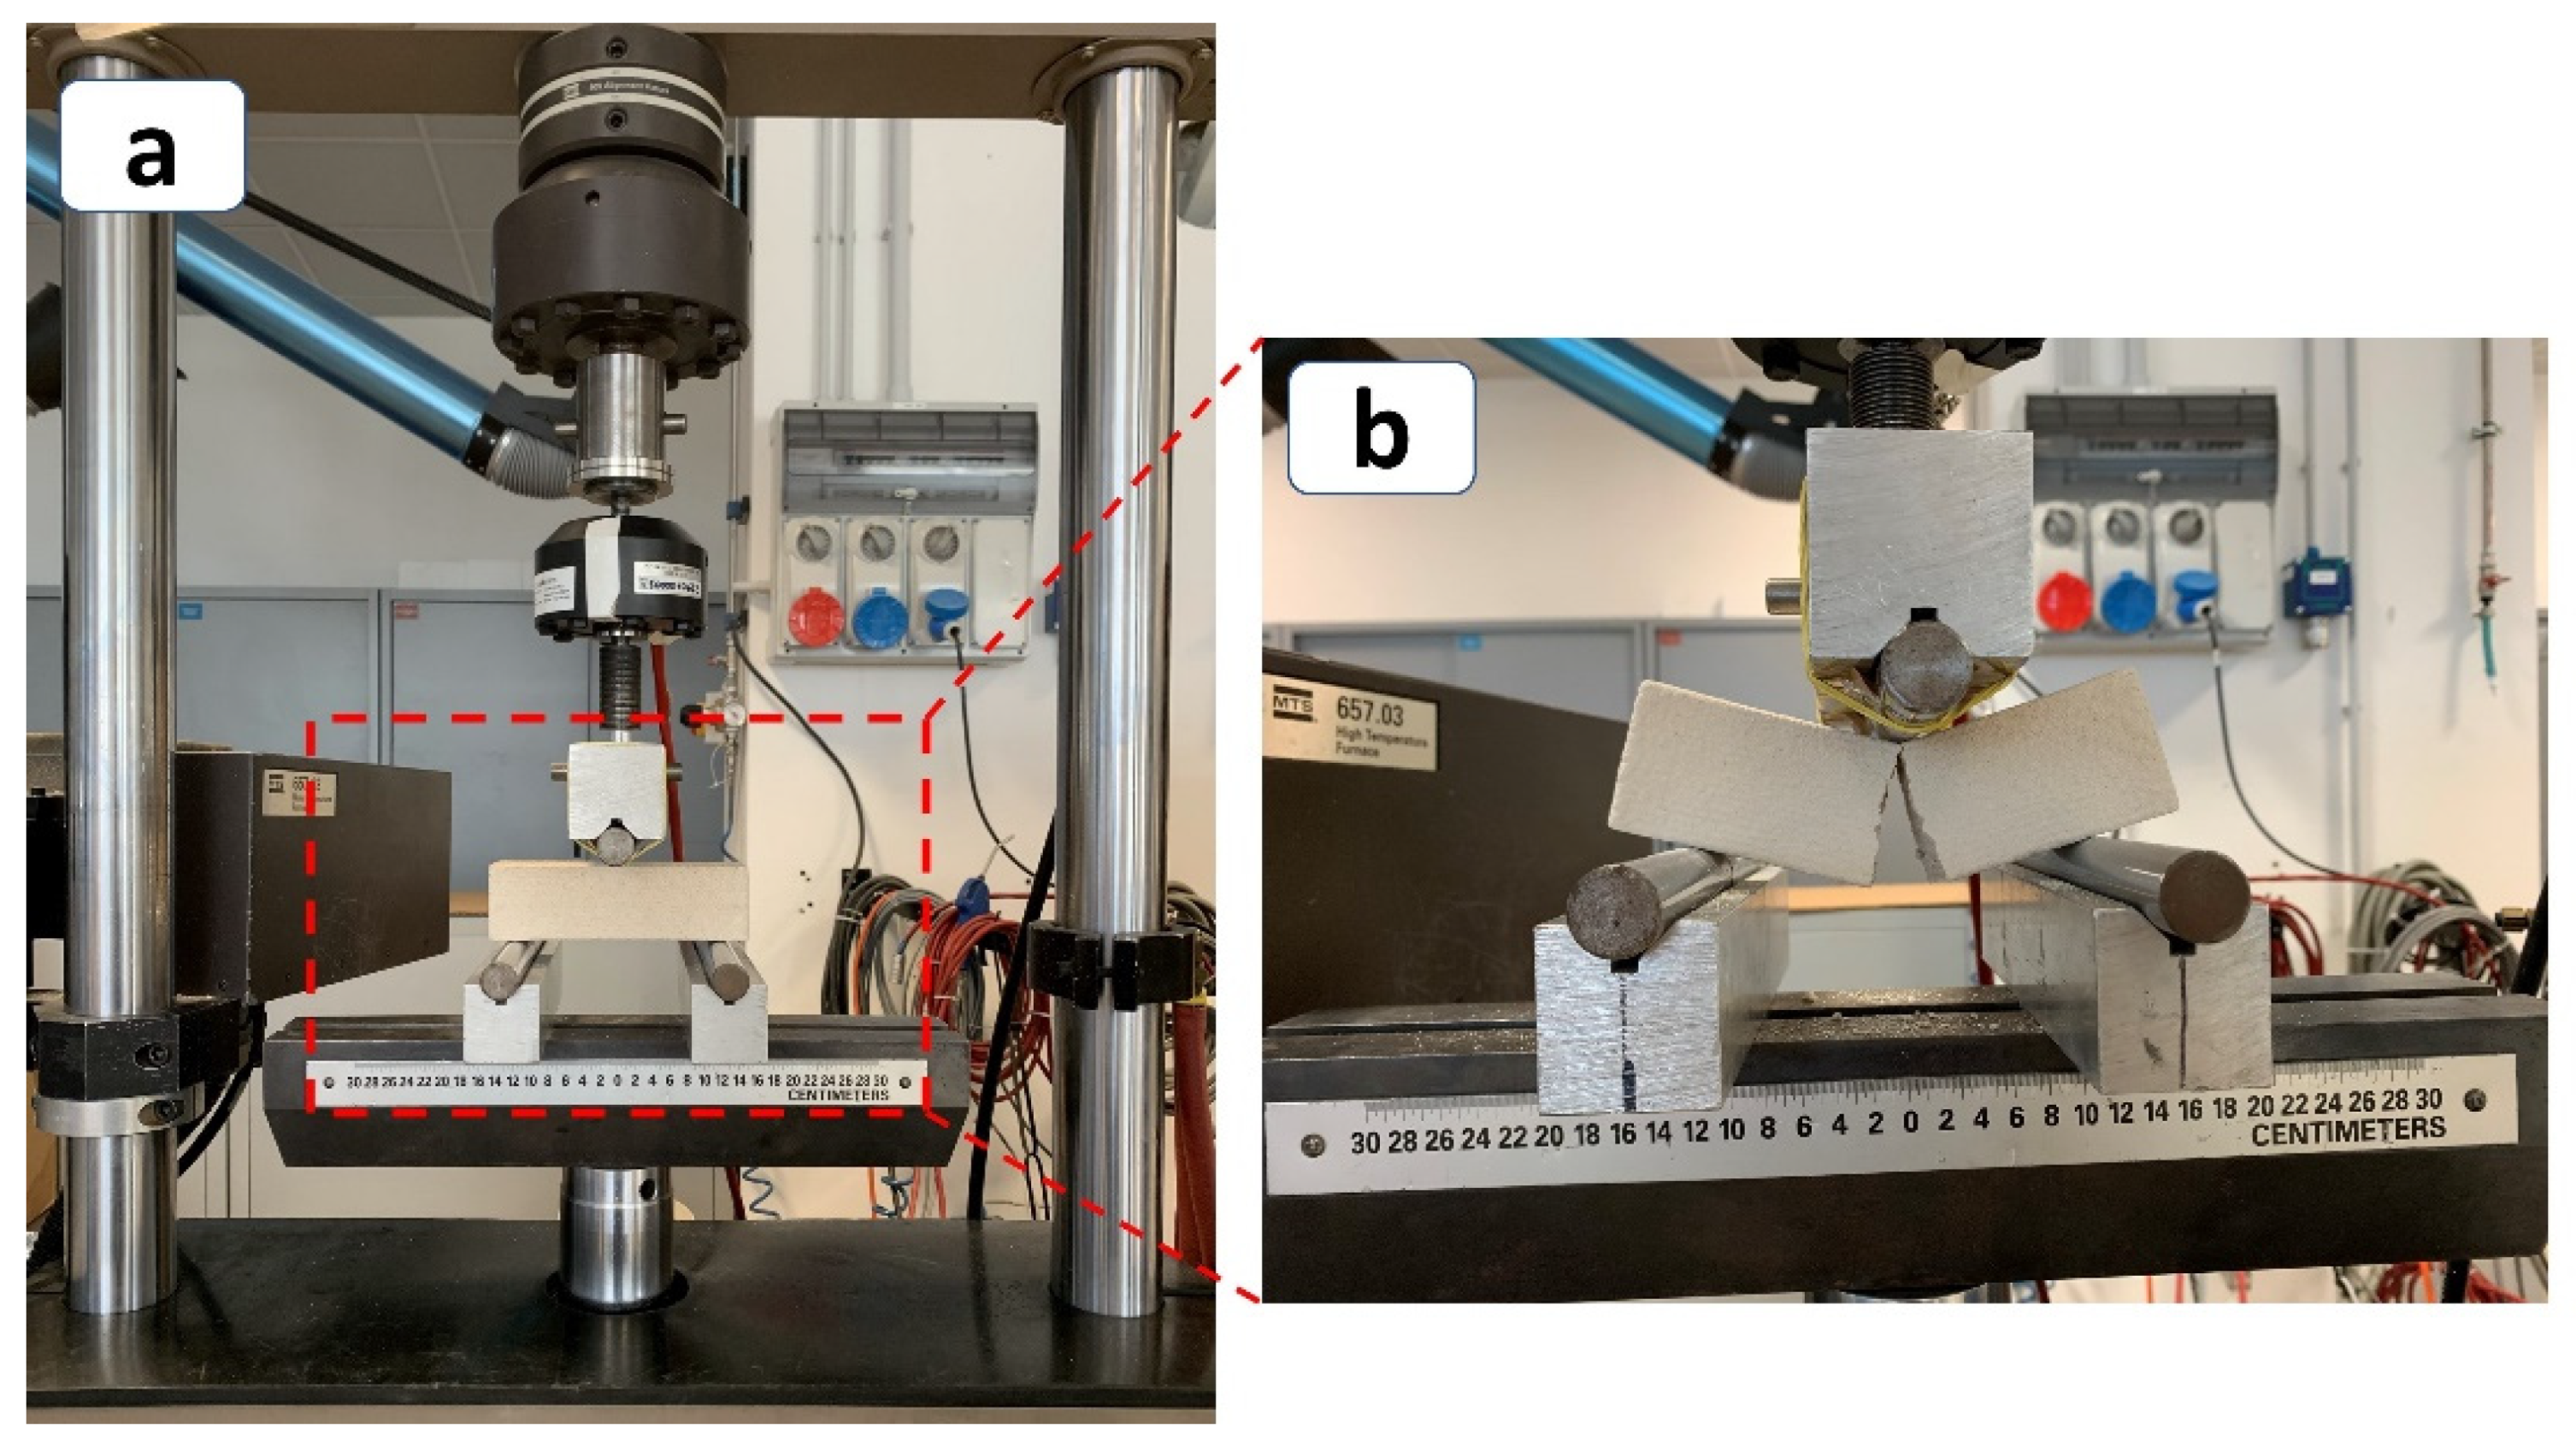
Primitive units in the powder-bed binder jetting process can be determined by multiplying layer thickness (L), hatch distance (H), and feed rate (FR). The “rate of voxel” (rV) is a practical definition for expressing the minimum printable features, instead of the voxel. A meshed powder bed with rV elements is shown schematically in Figure 2. The binder solidifies the desired rVs based on the CAD file, leaving the rest free. The cement reaction stoichiometry, the aggregate to cement ratio, and the powder-bed density are used to quantify the required binder for each rV. The binder mass flow rate is calculated as follows:
β   = r V   ρ p b   α   s
where rV is the rate of voxel and is the volume of the powder per unit time (a combination of layer thickness (Z), feed rate (X), and hatch distance (Y) in the Cartesian coordinate system).
ρ p b is the powder density (a variable of the aggregate size),
α is the weight ratio of MgO to the powder blend (equal to 0.32 as experimentally determined and a reference number for MOC cements), and
s (0.60) is the stoichiometric ratio of MgCl2 and water to MgO ( B i n d e r M g O ) in the following 5MOC chemical reaction:
5 MgO   +   MgCl 2 + 13 H 2 O   5   Mg OH 2 · MgCl 2 · 8 H 2 O
In the DOE table, each set of “feed rate”, “layer thickness”, and “hatch distance” formed a rate of voxel; then, a corresponding binder mass flow rate according to the equation was calculated. Densities of 0.65 and 0.58 kg.m−3 were measured experimentally as the densities for the powder bed formed with fine and semi-fine aggregates, respectively. Low and high levels of 10% less and 1% more than the calculated β were selected to study the effects of the “amount of binder”.

2.4. Tests

Rectangular beam specimens were printed and tested in three-point bending to determine the modulus of rupture 5 to 7 days after printing (Figure 3) [40]. For the anisotropic properties of the printed material, flexural tests were carried out in normal (Z axis) and parallel (Y axis) directions with respect to the top surface of specimens, and the corresponding strengths were labeled as Y0 and Y90, respectively. Mechanical tests were carried out using a universal mechanical testing machine (model 810, MTS Systems, Minneapolis, MN, USA) and the modulus of rupture was calculated as follow:
R = 3   P   L 2 b d 2
where P is the maximum applied load, L is the span, and b and d are the specimen width and thickness, respectively.
Portions of the sample were collected and prepared in the form of powder for X-ray diffraction (XRD) analysis, using CuKa radiation at 40 kV and 30 mA (Geiger Flex Dmax III, Rigaku Inc., Tokyo, Japan). The samples were scanned in the interval of 10° to 100° (2theta) with a 0.05° sampling interval and a 5 s counting time. A qualitative analysis of the phases detected in the samples as a function of curing time was carried out using MAUD software [45], a modified Rietveld method for the evaluation of the content of amorphous and crystalline phases in ceramic samples [46]. The broken samples were used for microstructural analysis by scanning electron microscopy (SEM), and EDS analyses were carried out using a JEOL IXRF SYSTEMS 500 with Iridium Ultra software (JSM-5500, Jeol Inc., Tokyo, Japan).

3. Results and Discussions

All samples were successfully printed and tested (as an example, Figure 4 shows sample # 11 from screening experiments). The manufacturing process followed a layer-by-layer deposition of material with jetting of the binder onto the spread powder. Compared to the traditional cast-in-place concrete technique, a hardened 3D printed part had two types of interfaces [47]. The first type of interface was related to the joint between single line primitives or inter-rV (intervoxel) connections, and the second type of interface was between successive printed layers (Figure 4e). Due to the manufacturing parameters and the variation in bond strength between the two types of interfaces, an anisotropic behavior in the mechanical properties of printed parts was observed.
Figure 5 depicts the mean values of the modulus of rupture (MOR) for the Y0 and Y90 directions; the mechanical behavior differs with respect to the three orthogonal axes, as defined by the direction of the jetting of the binder. It is possible to conclude that printed materials have orthotropic behavior. Apart from the samples with run numbers of 11 and 26, the MOR in the Z direction was always higher. The average values of all treatments for each set of parameters are shown in Table 5.

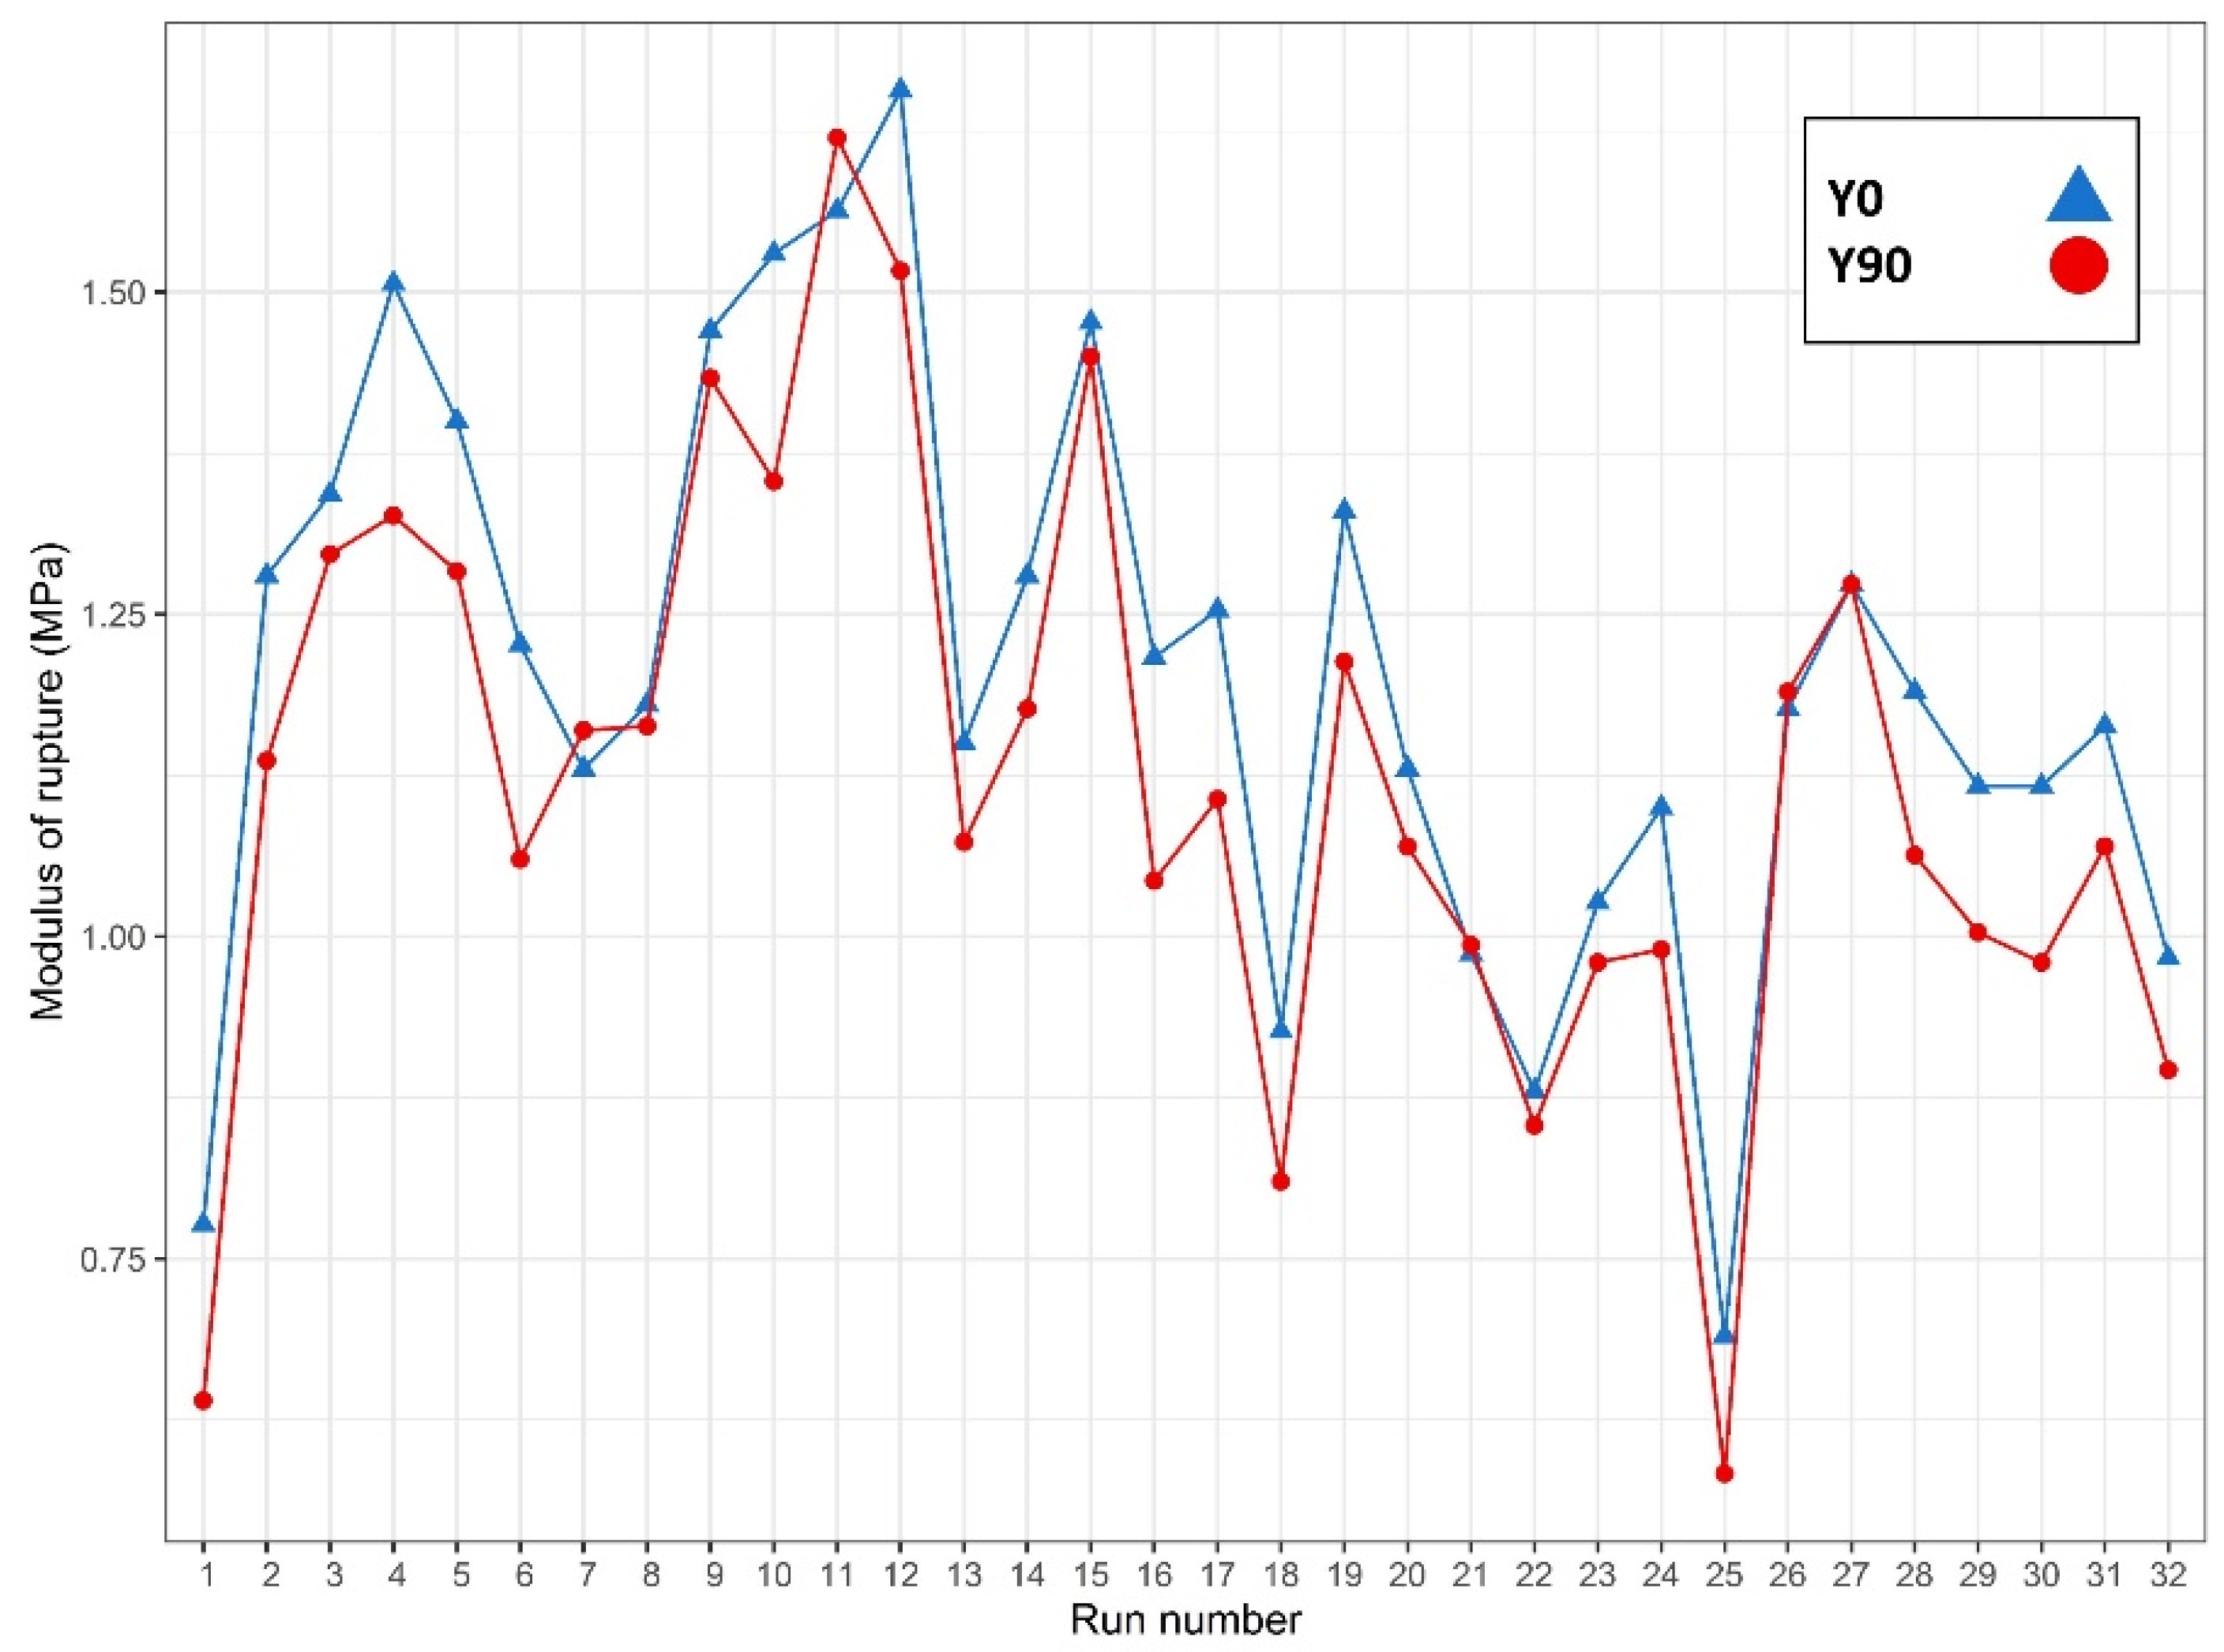
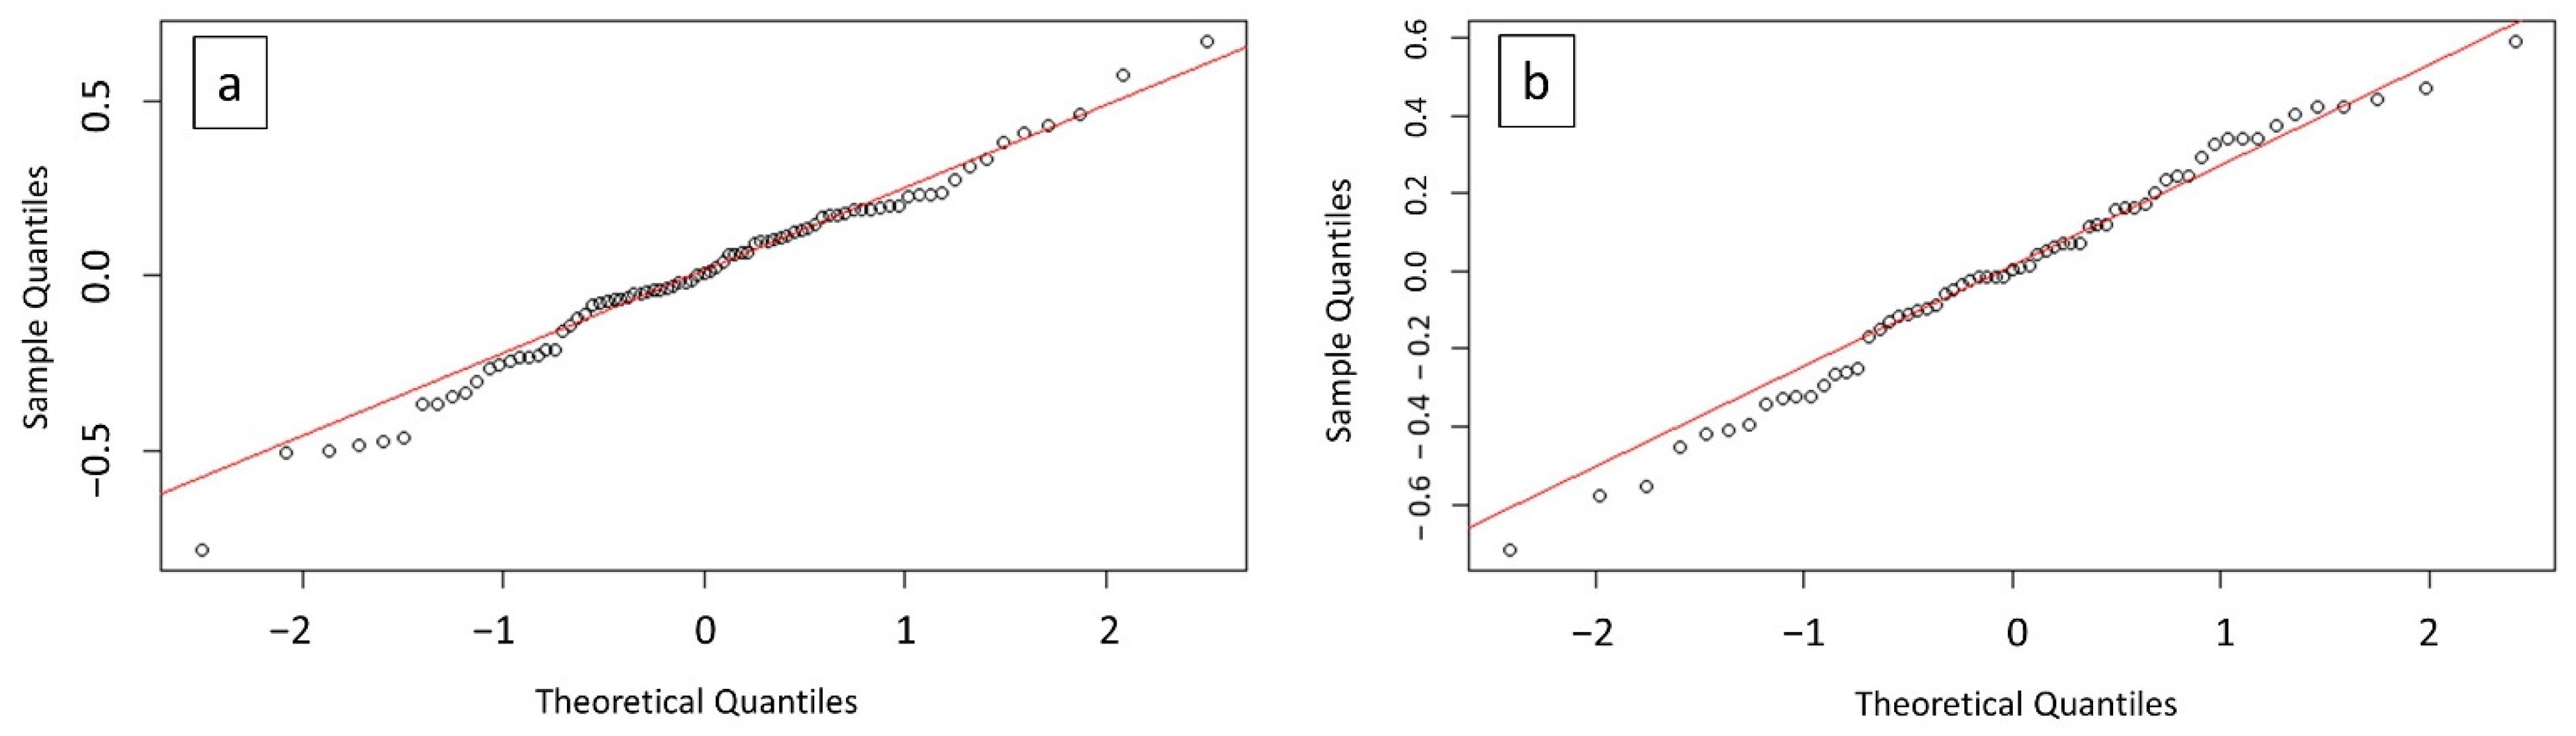
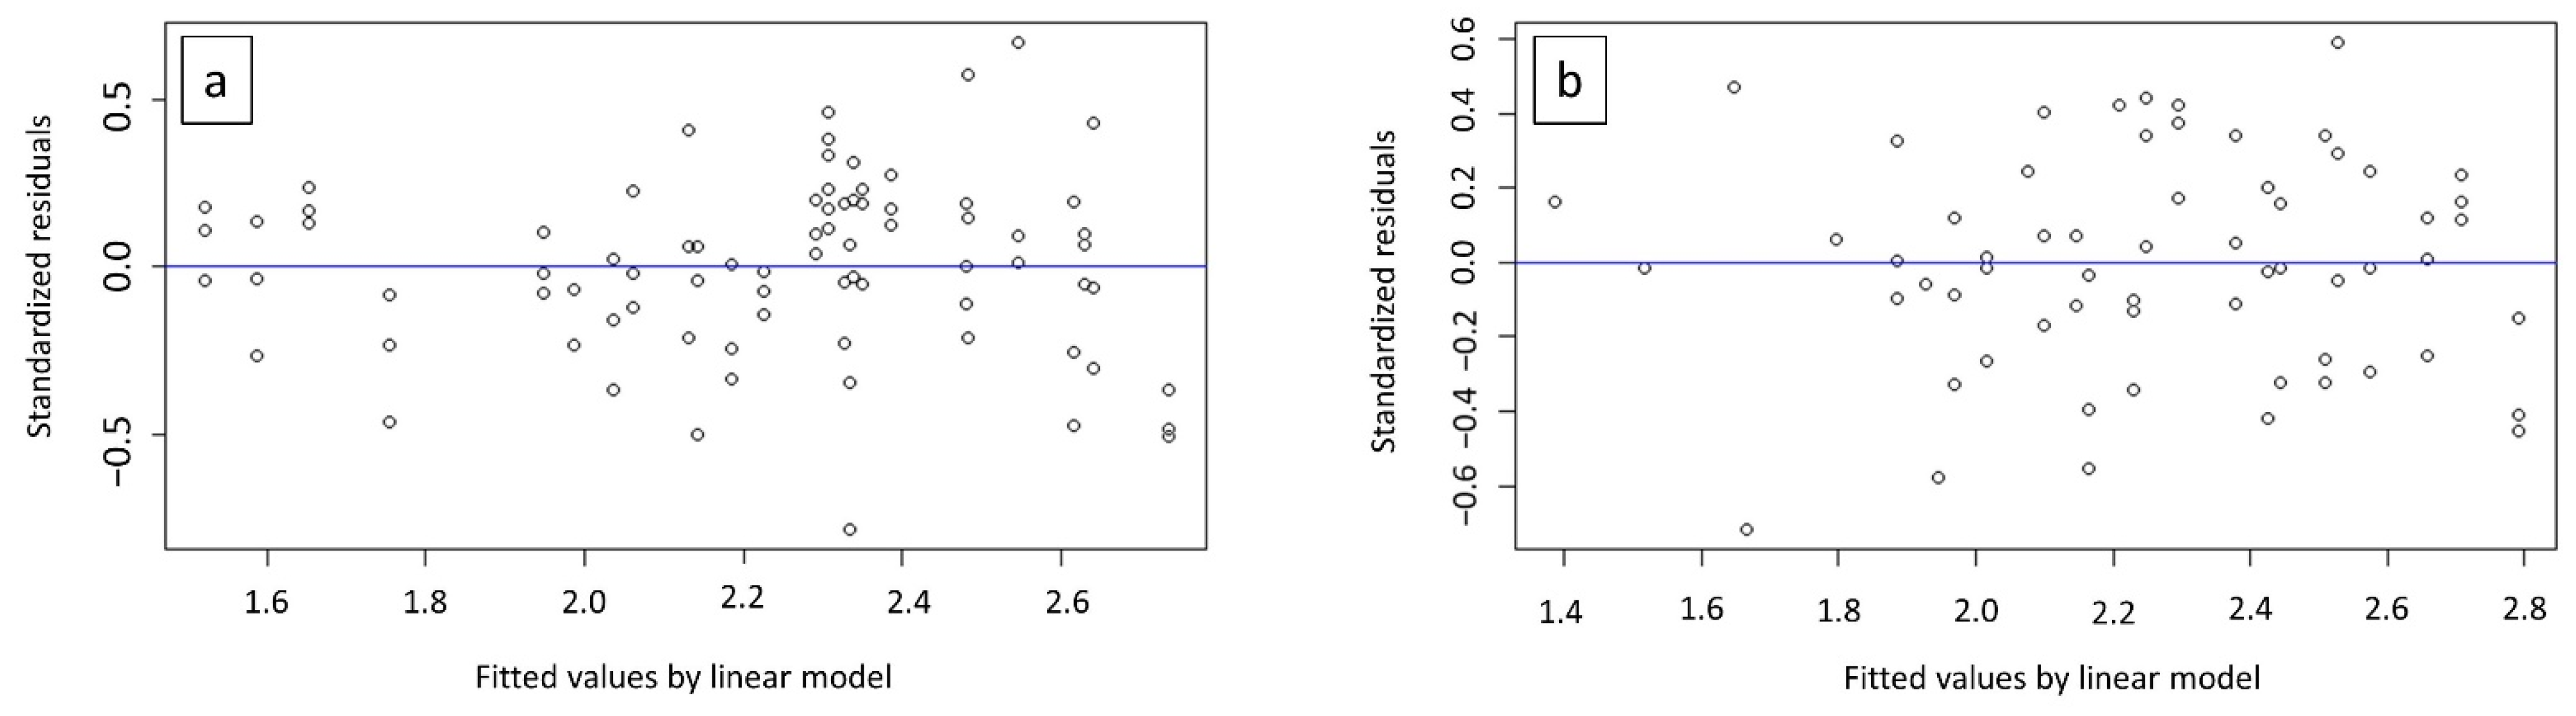
3.1. Statistical Analysis
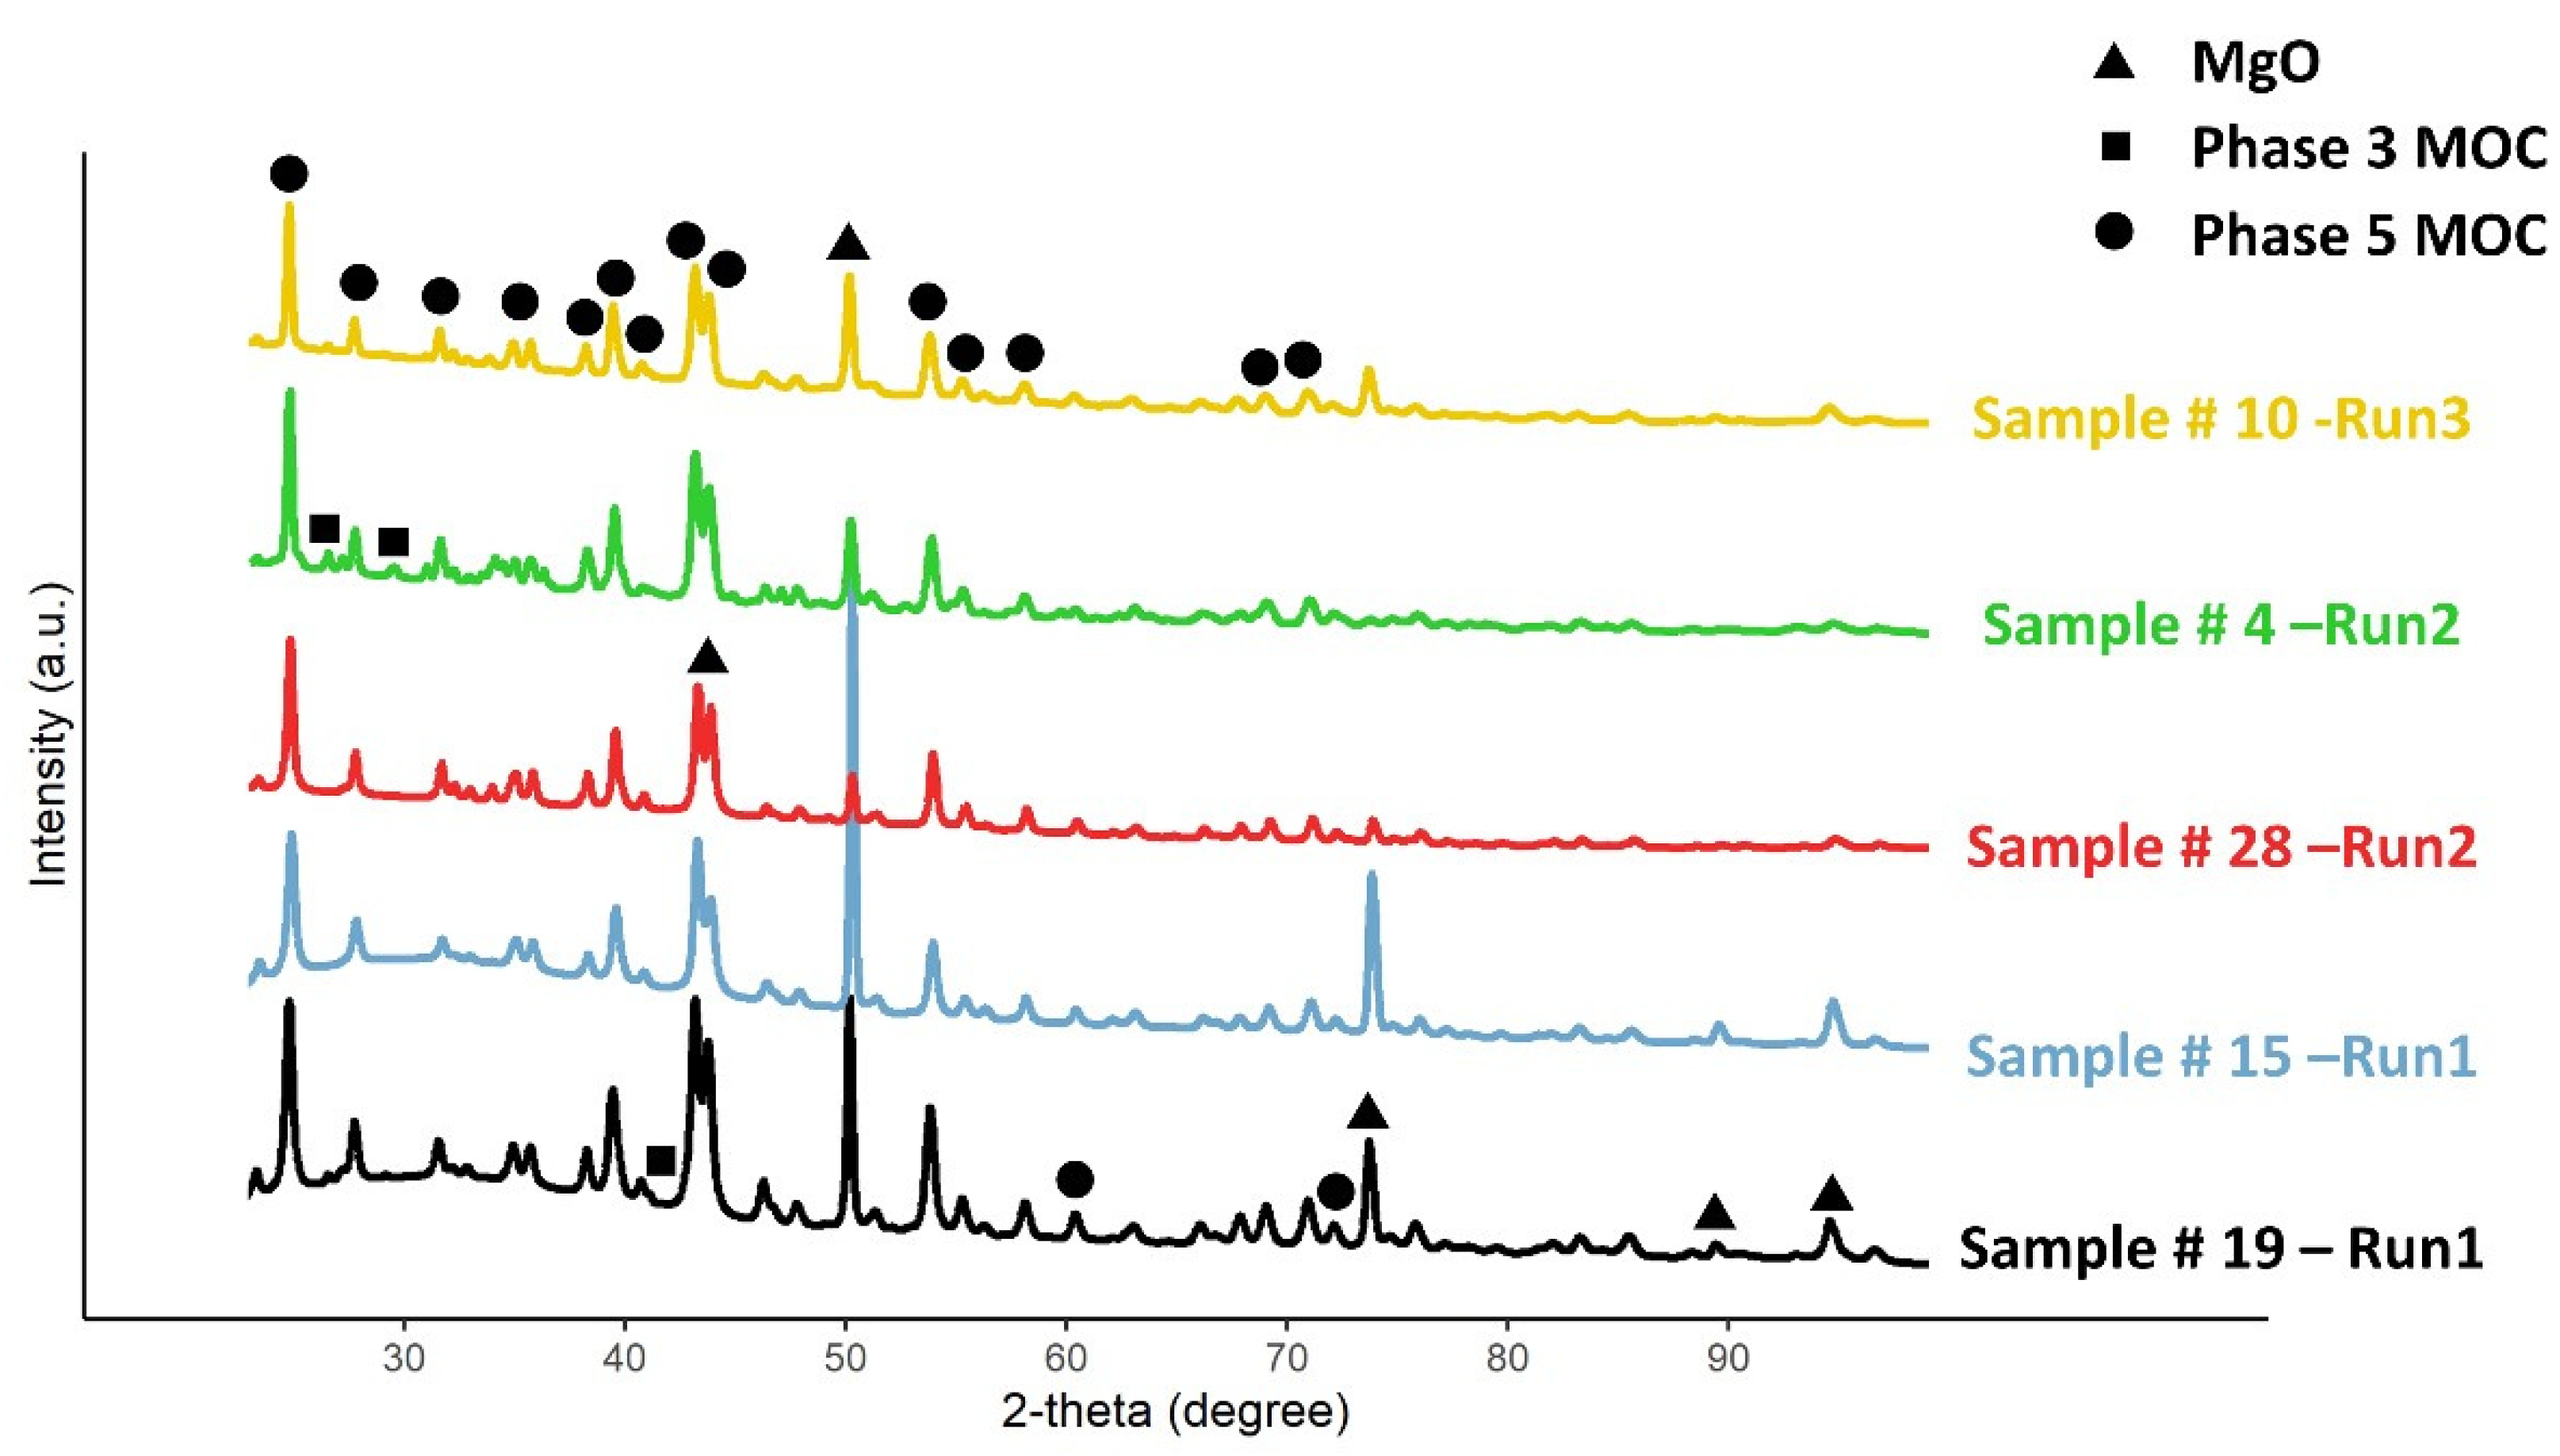
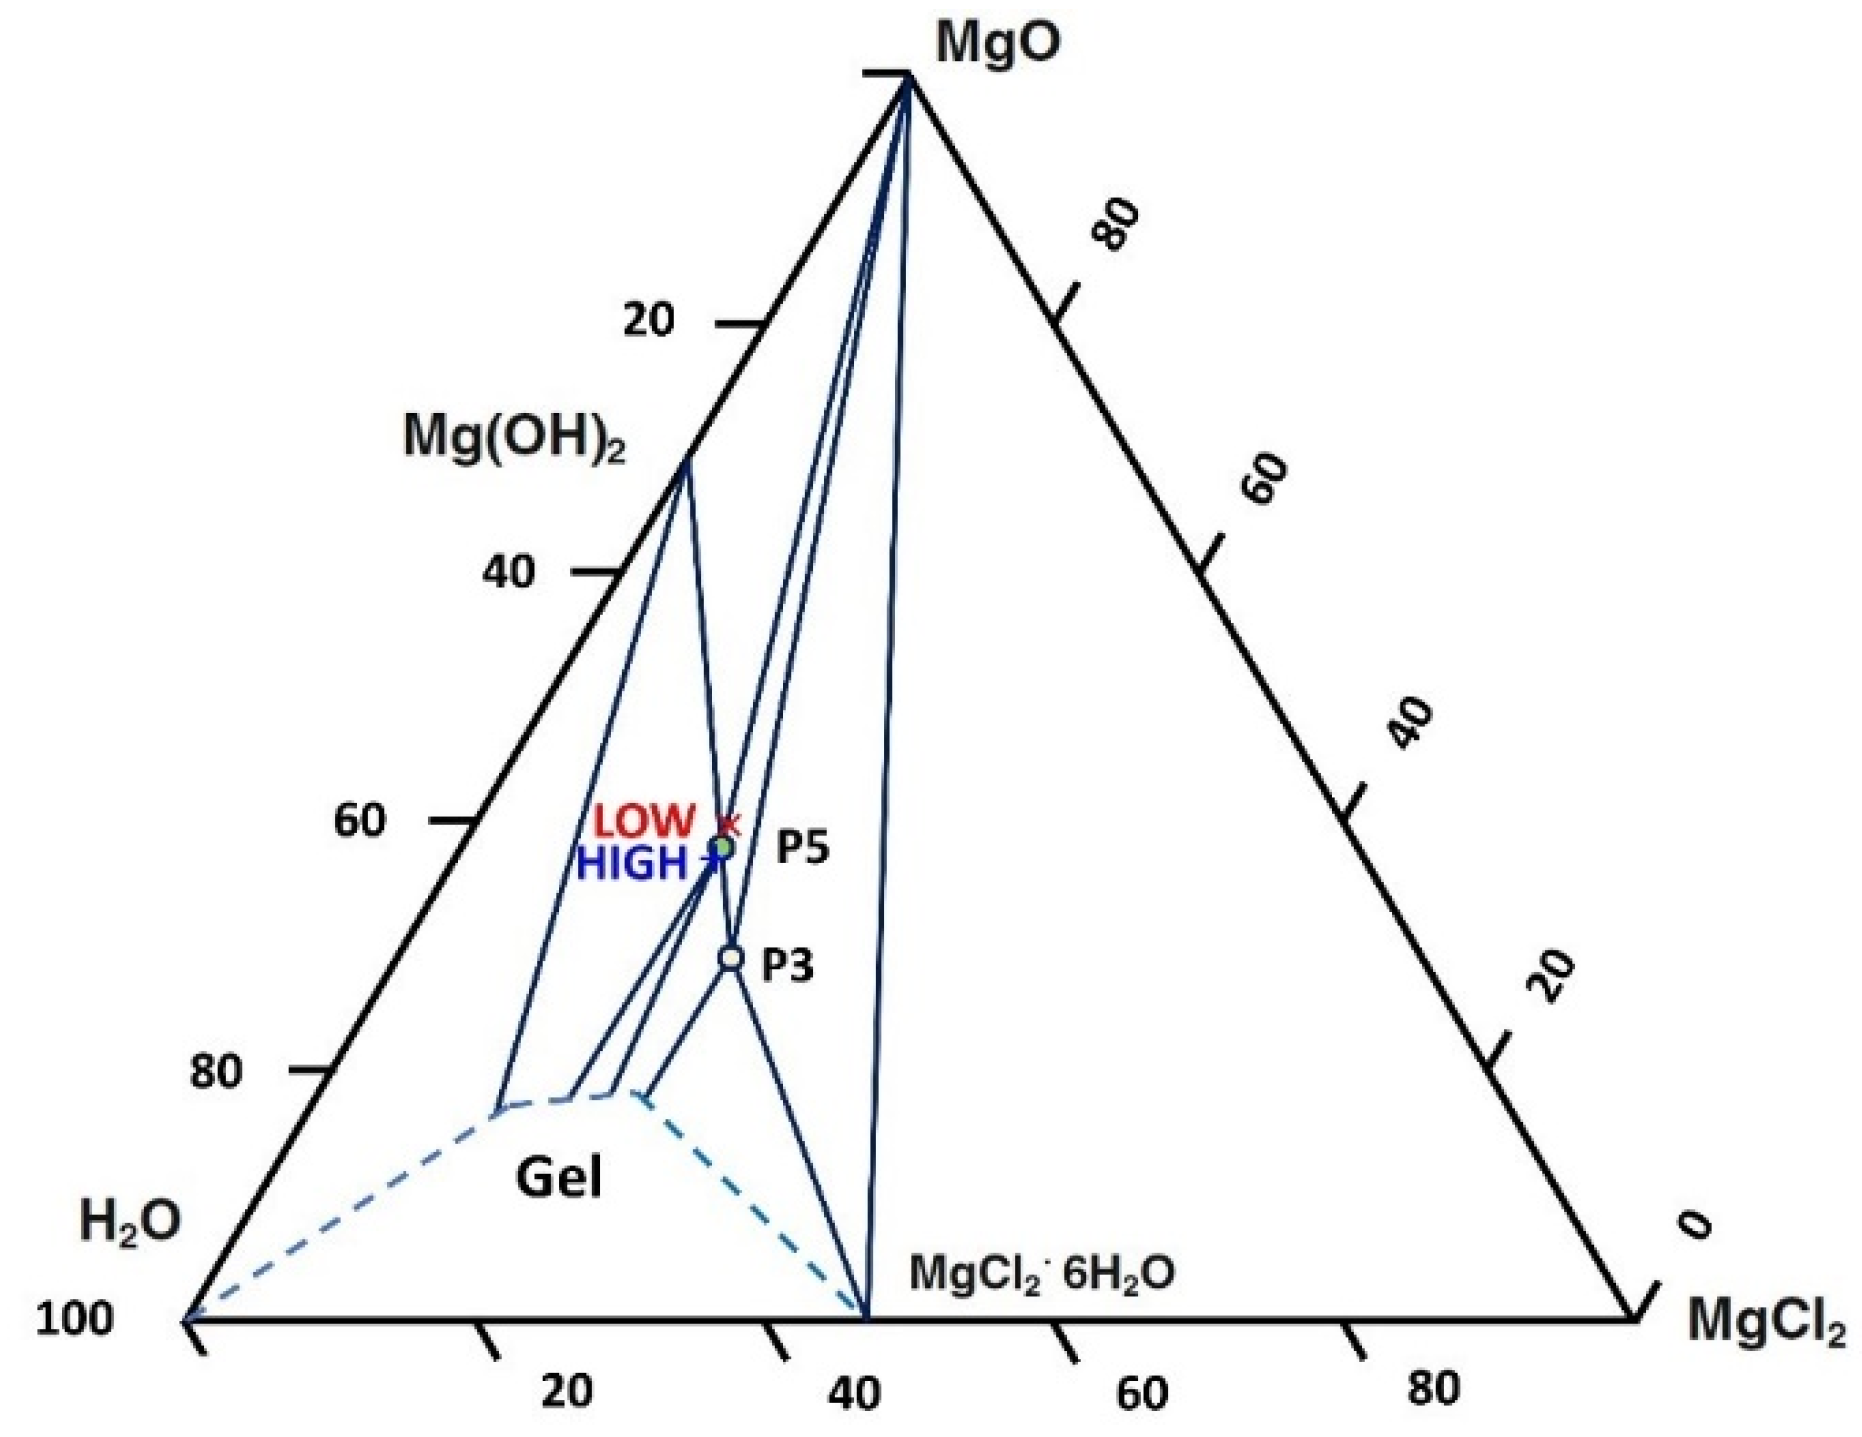
Using analysis of variance (ANOVA), the screening design revealed the effect of each factor on the final modulus of rupture. Among all input factors, layer thickness (p-value = 0.014), the amount of binder (p-value = 0.041), and particle size (p-value = 6.2 × 10⁻⁶) were significant. The augmented factorial plan with central point runs (p-value = 4 × 10⁻¹³) suggested quadratic effects for regression models; hence, a three-level full factorial design in three treatments was adopted to model product behavior (Table 6). For the new experiments, all samples were printed with a velocity of spread equal to 7500 mm/min, a hatch distance of 1.5 mm, and a feed rate of 7200 mm/min. The powder-bed density for samples with particle sizes in the midpoint level was determined to be 0.59 kg.m−3.
For each response, separate models are provided, as follows:
Y 0 = φ i 0 + φ b B + φ c C + φ e E + φ bc BC + φ be BE + φ bce BCE + φ b 2 B 2
Y 90 = φ i 0 + φ b B + φ c C + φ e E + φ b 2 B 2
These models were obtained from their full model by excluding non-significant factors from the ANOVA. The corresponding ANOVA results are reported in Table 7 and Table 8. The Box-Cox range for Y0 and Y90 showed that there was no need for transformation and, therefore, only significant factors and interactions were considered for the regression model. The coefficients for each model are presented in the ANOVA, Table 9 and Table 10.
The substitution of the level of factors (−1, 0, 1) into the regression models provided a prediction value for the modulus of rupture for any set of printing parameters. To assess the accuracy of these models, quantile–quantile plots (QQ-plots) were considered (Figure 6). Because both sets of theoretical and sample quantiles came from the same distribution for Y0 and Y90 models, a scatter plot of points for each model formed a line that was roughly straight [48].
The differences between the predicted and measured values for an input set of printing parameters were defined as the model residuals; a standard method to evaluate model adequacy is the analysis of the model residuals [44]. Each model’s standardized residuals were plotted against the fitted values by the linear model (Figure 7). There was no pattern in the residuals for both models, and the distributed residuals were about zero.

3.2. XRD Results

XRD analysis was carried out on five random samples during the experimental procedure to evaluate the effect of ambient conditions (temperature and humidity) on the chemical reaction product. As expected, XRD analysis (Figure 8) pointed out the presence of only three phases: MgO-Periclase (COD ID: 1000053); MOC-Phase 3, corresponding to the mineral phase Mg2(OH)3Cl.4H2O (COD ID: 9010975); and MOC-Phase 5, corresponding to the mineral phase Mg3(OH)5Cl.4H2O (COD ID: 2103035 [18]. Poraver is made of glass and therefore no clear peaks could be identified, apart from a wide band centered at about 30°.

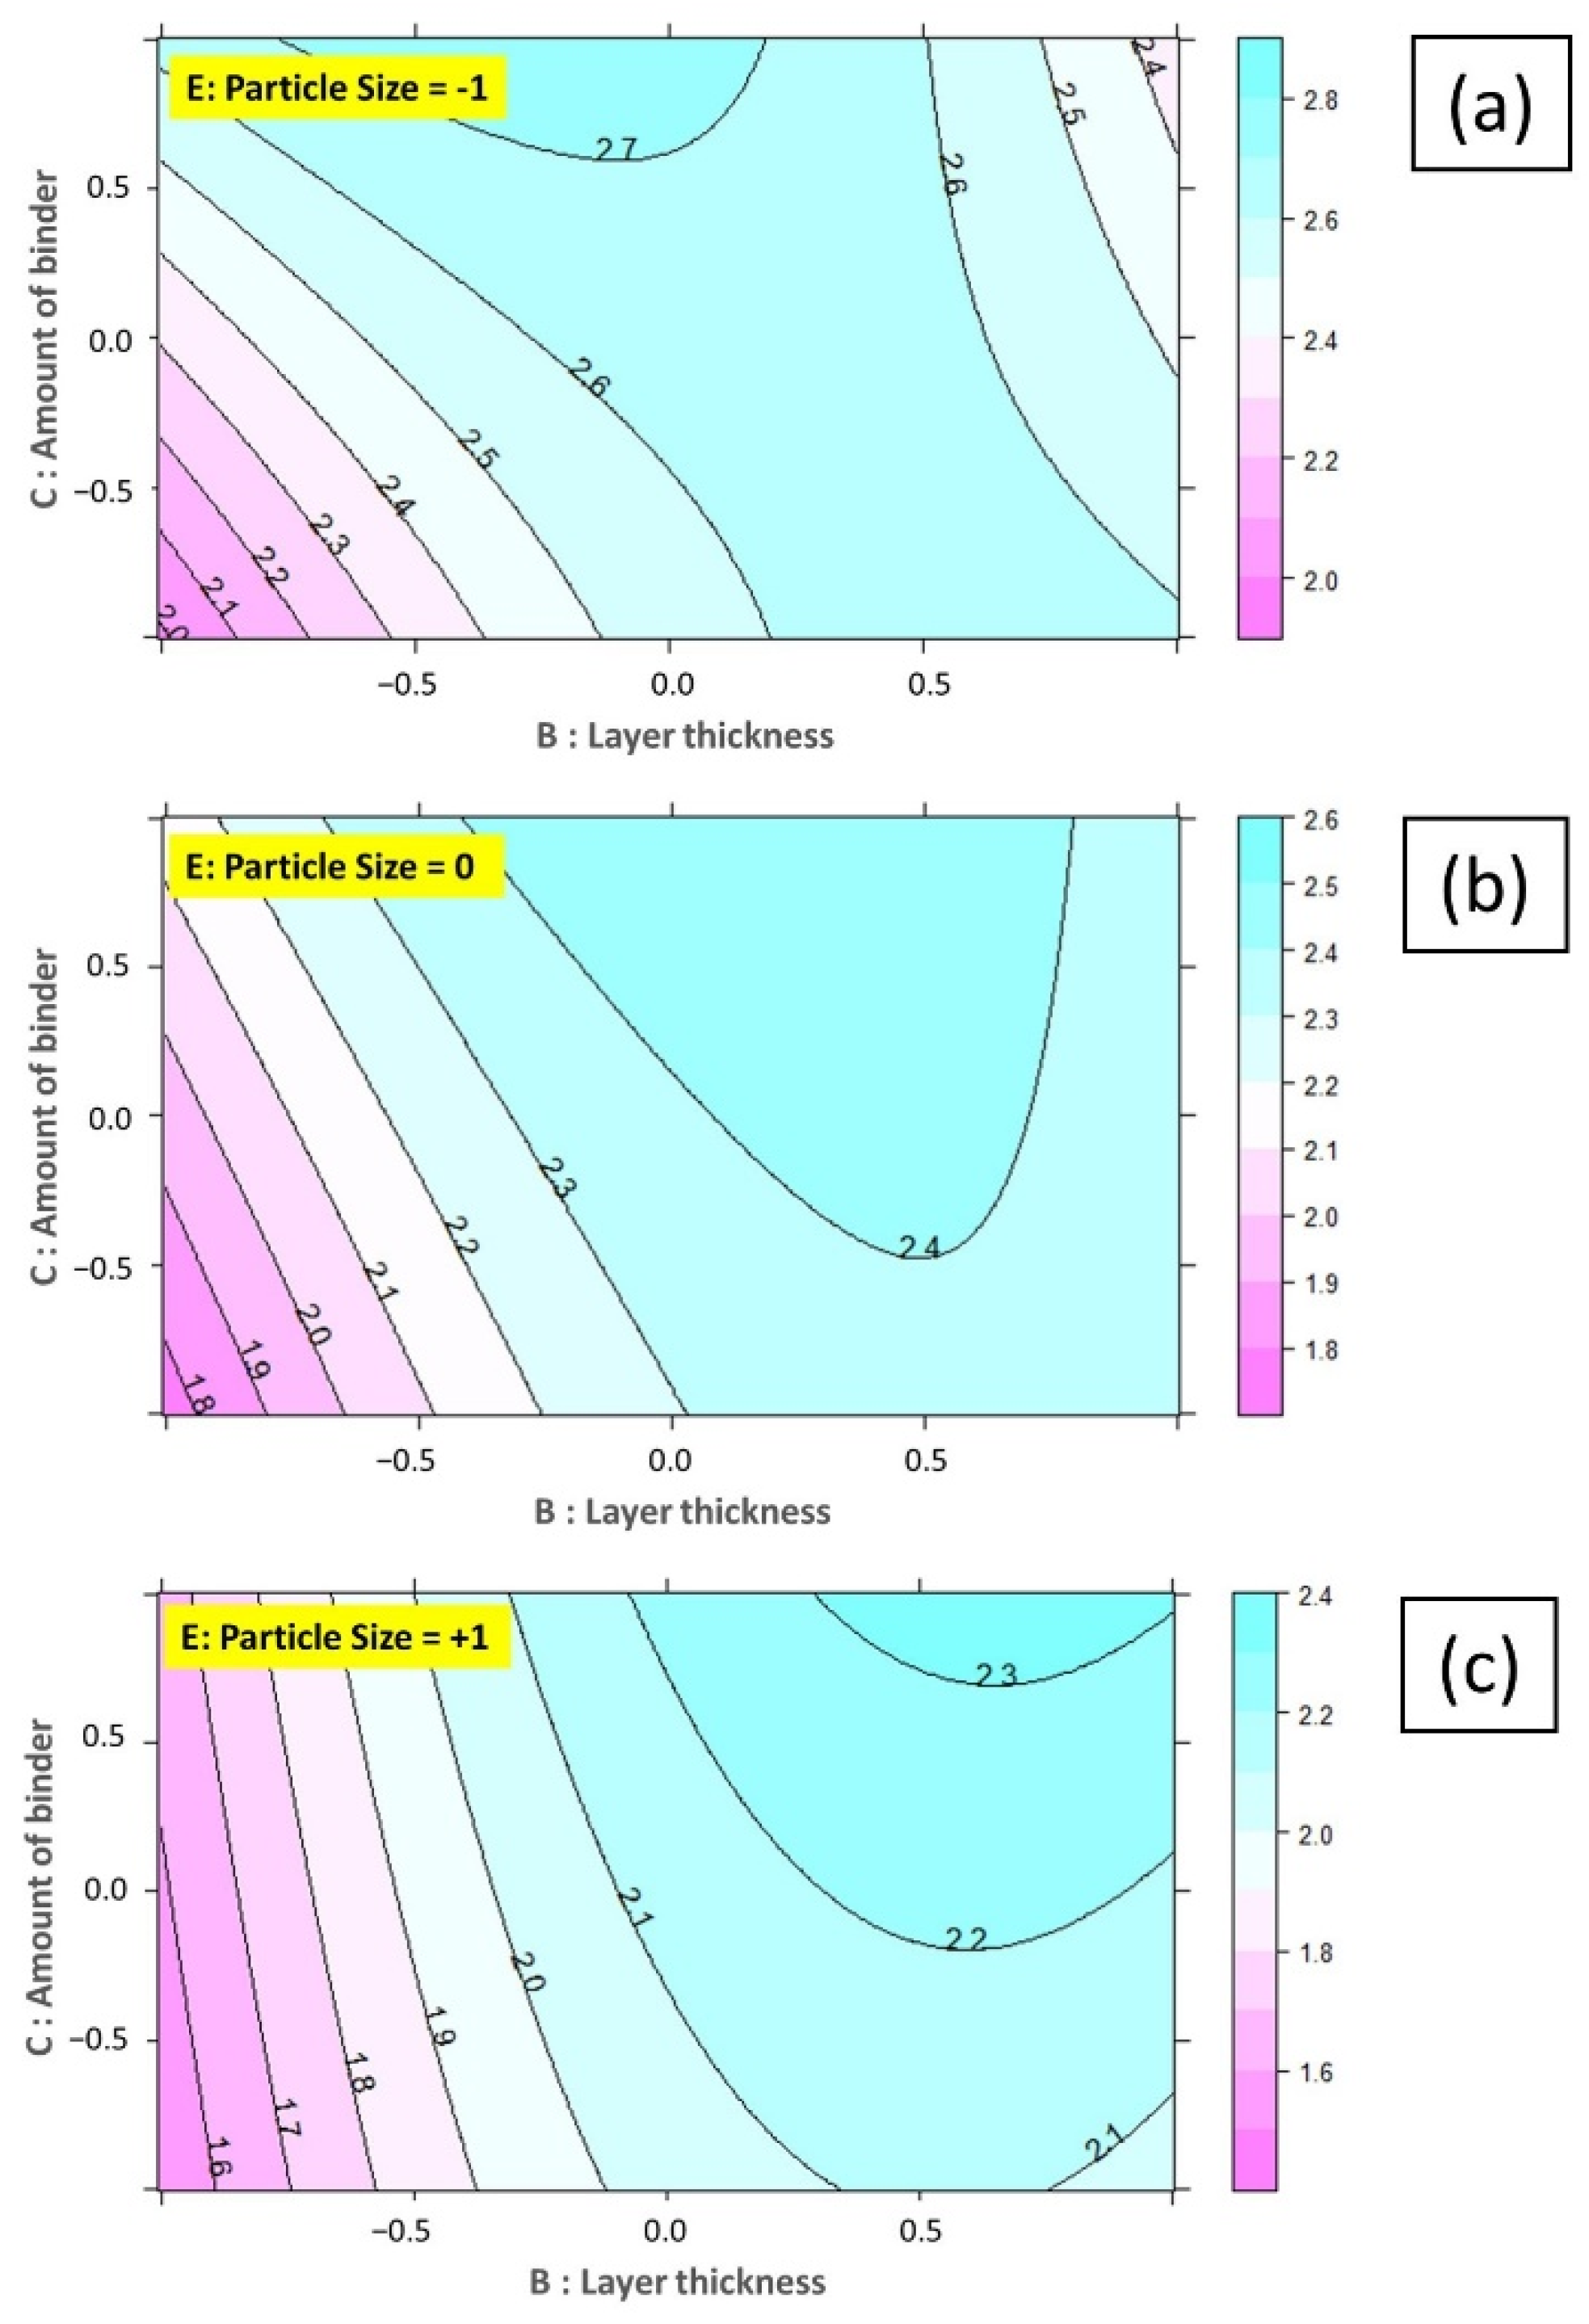
3.3. Main Effect and ANOVA for Printing Inputs

3.3.1. Powder-Binder Interaction (PBI)
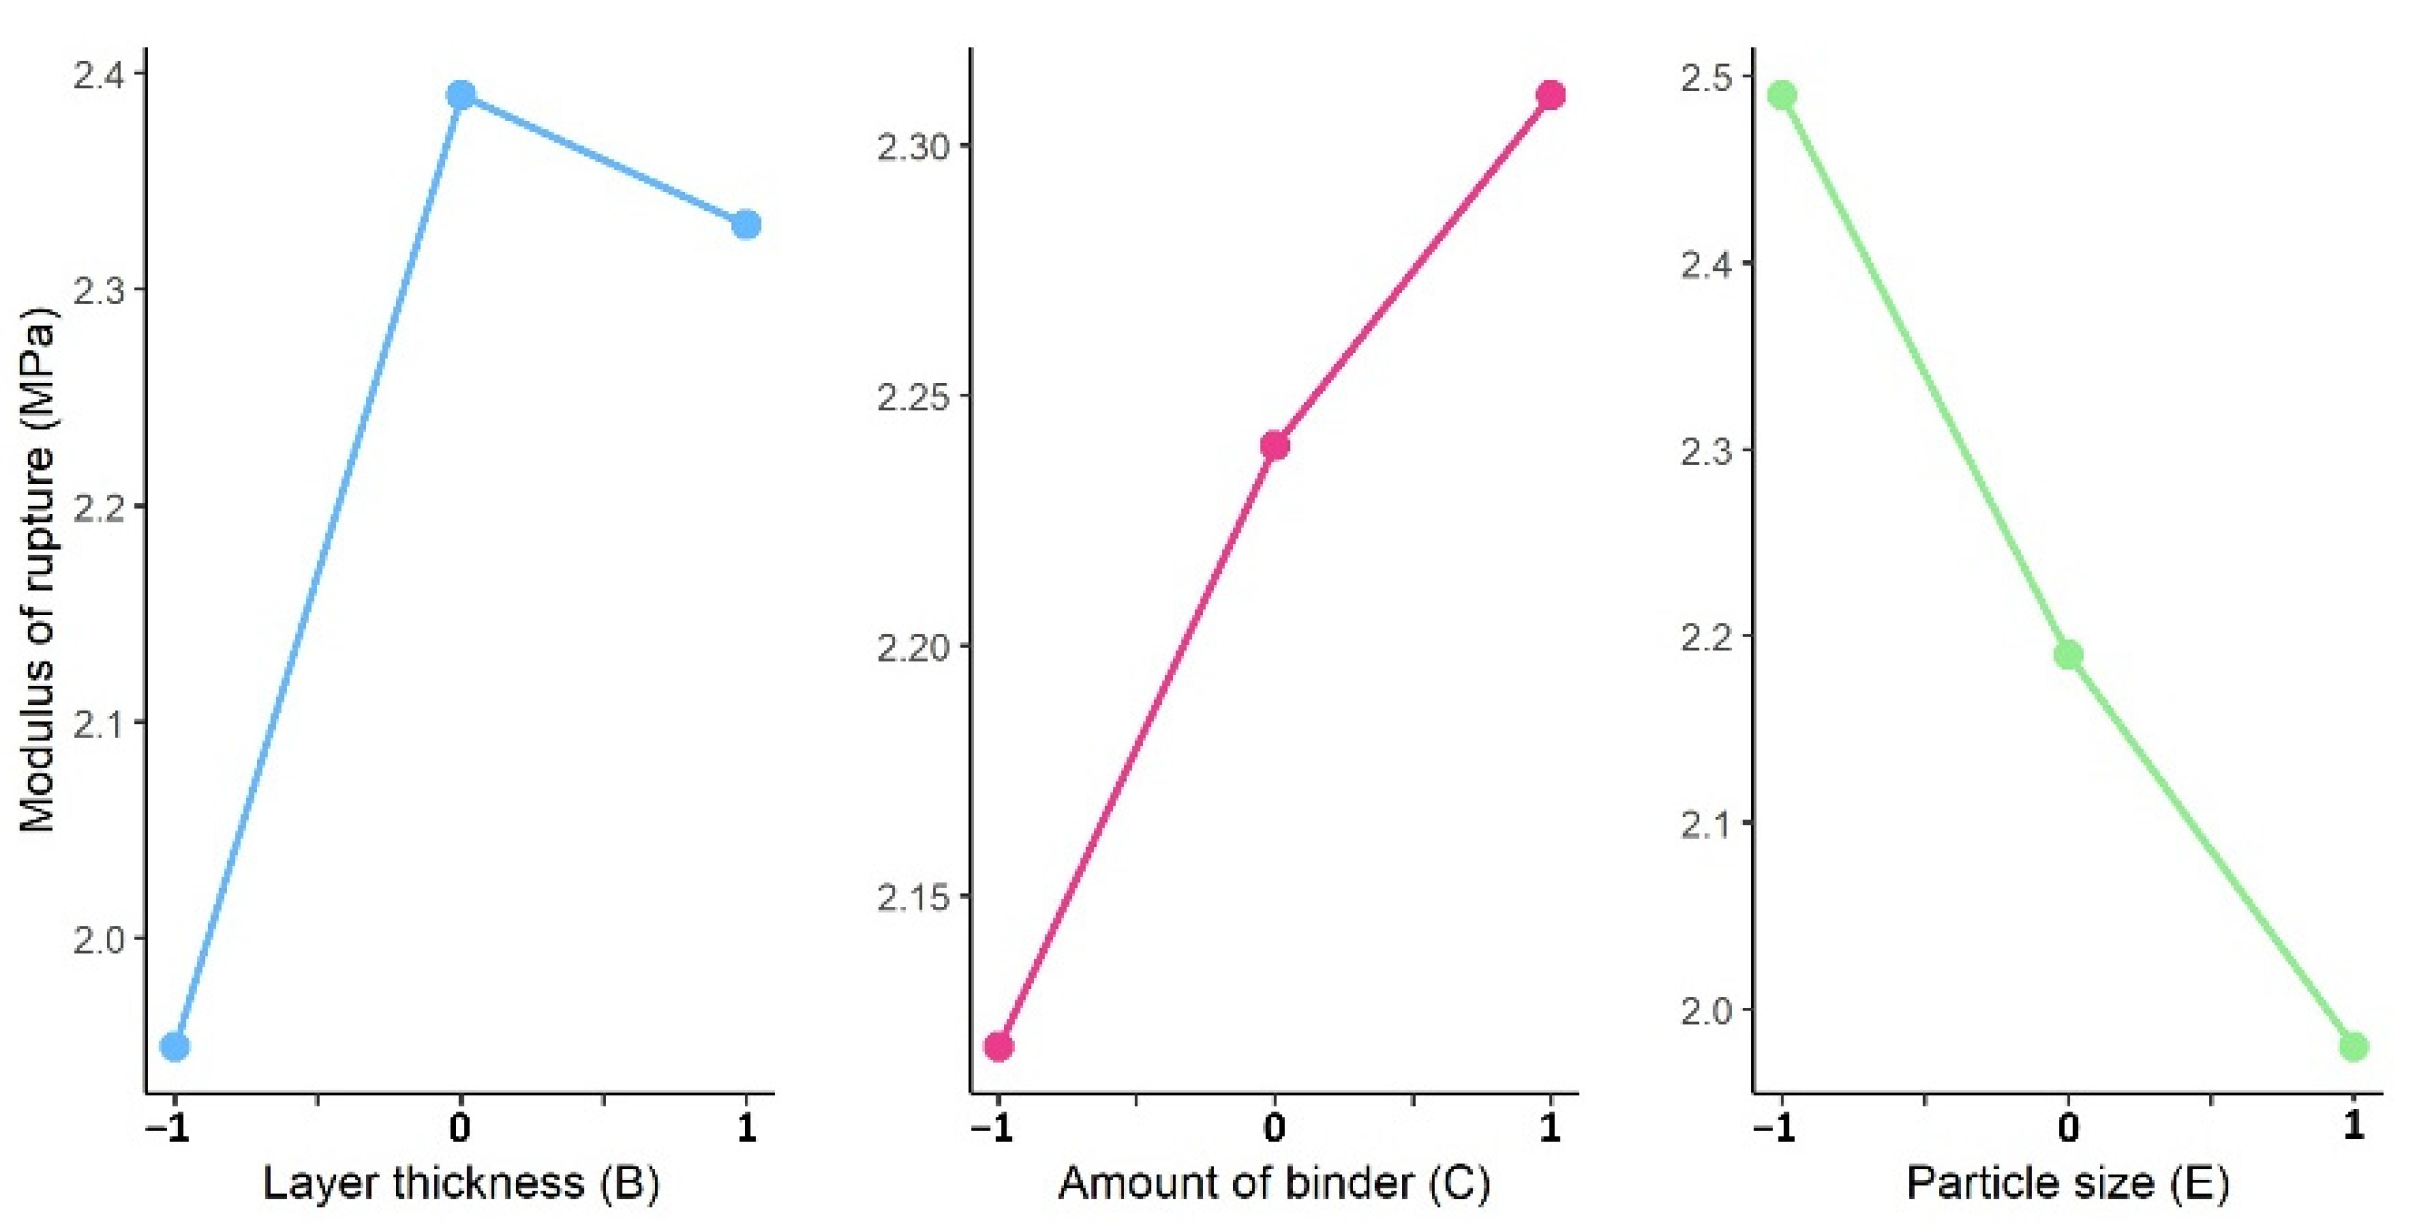
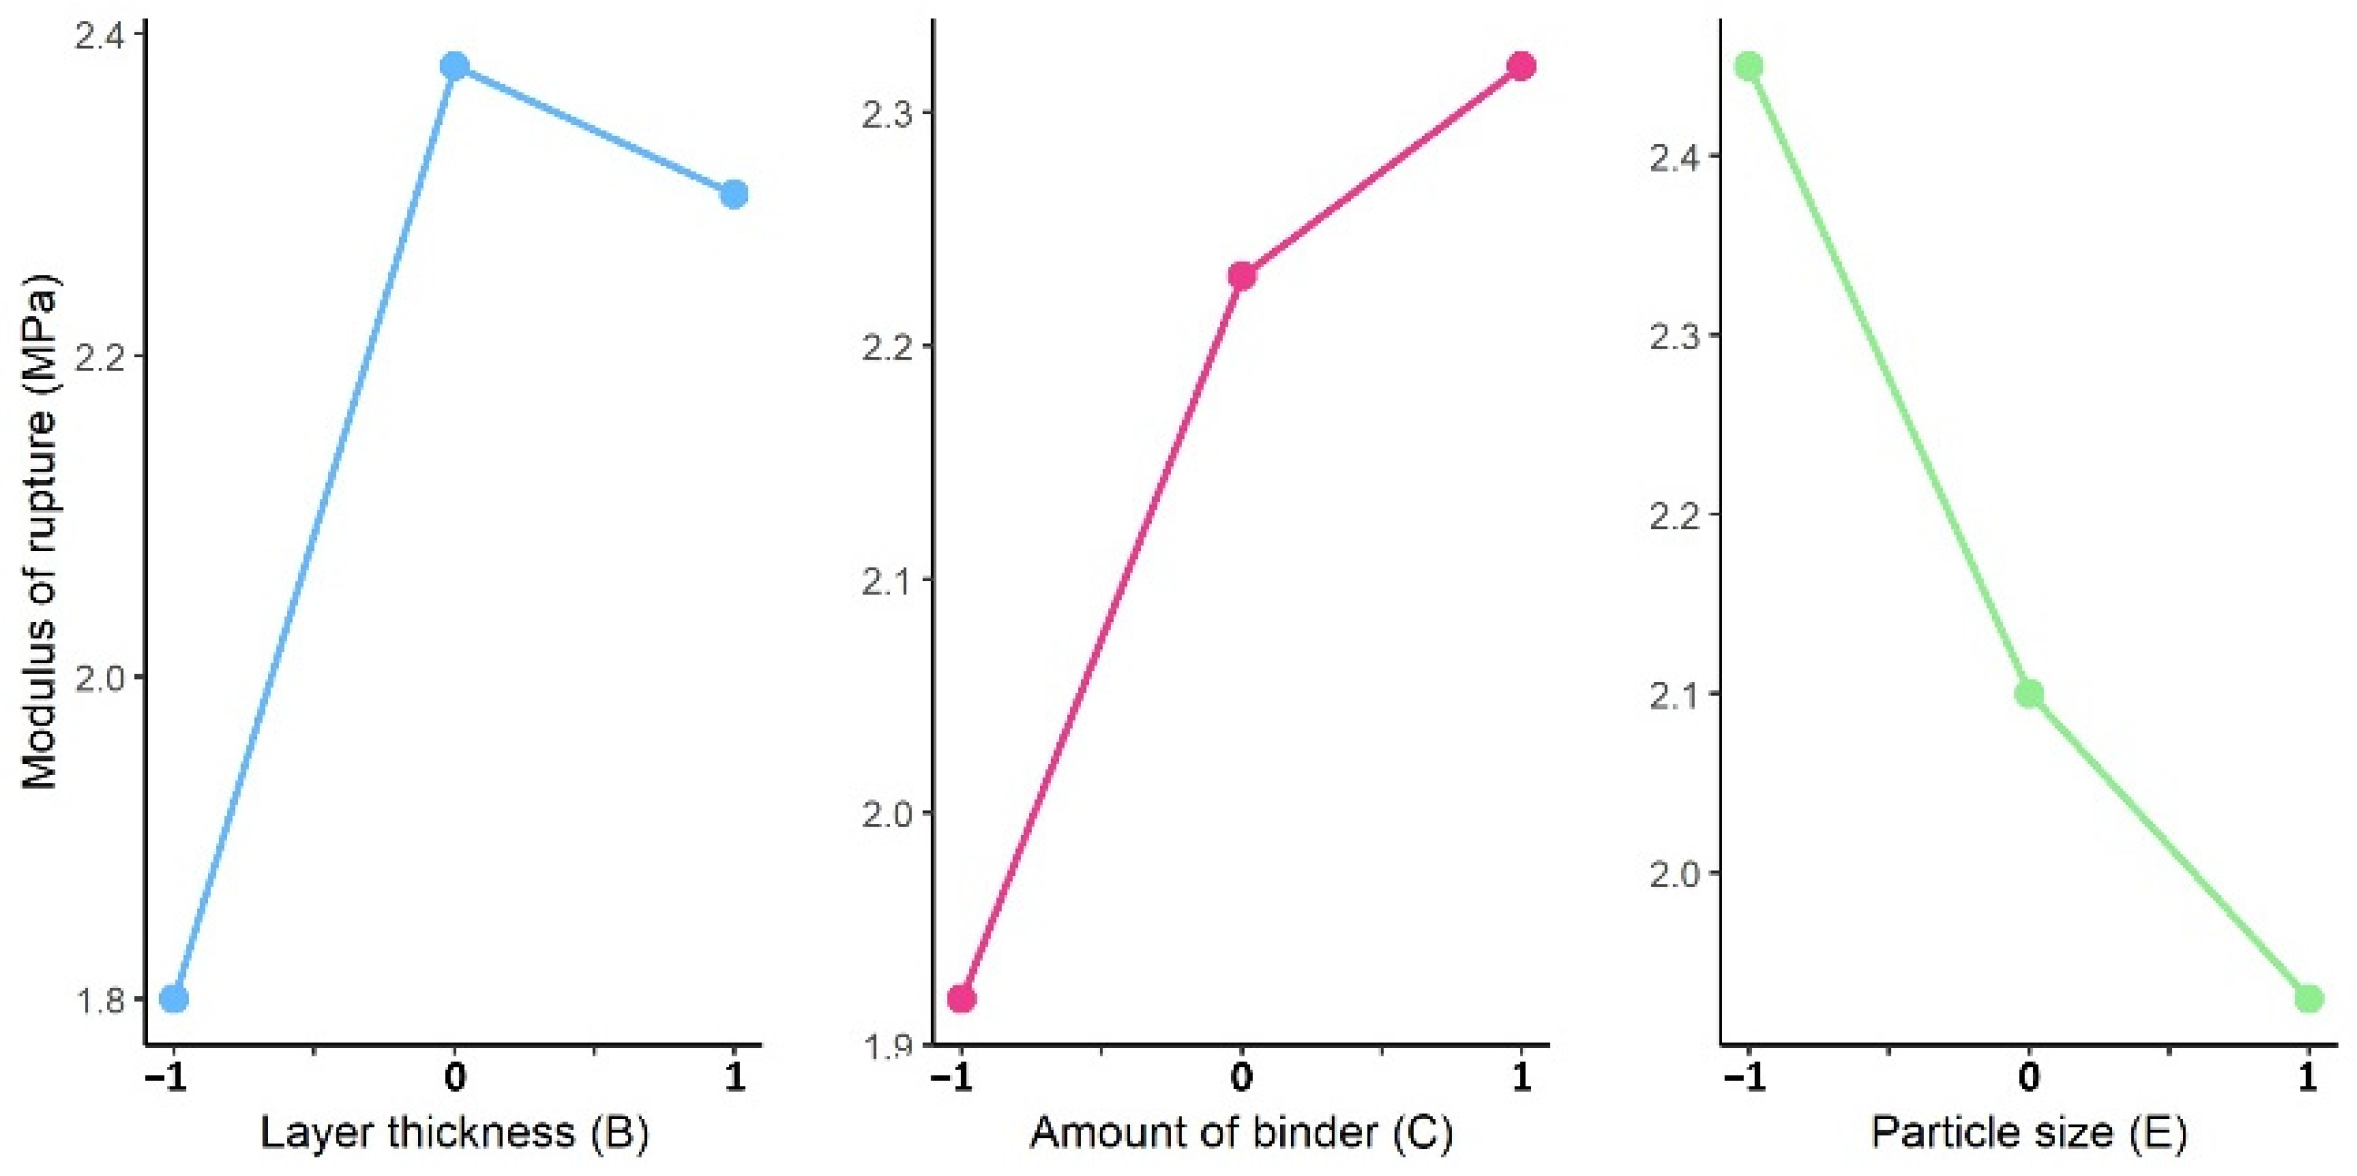
There was a physical interpretation for each printing parameter in the regression model. The effects of the significant factors and their interactions are discussed in this section. Understanding the distribution of binder inside the powder bed is beneficial, because it is a fundamental aspect of forming homogenous and monolithic rVs [15,49,50].
The nozzle movement over the powder-bed jets multiple droplets; the instant binder droplets impact the powder and the cement reaction initiates to bond aggregates. Three recognized granule formation mechanisms are tunneling, spreading, and crater formation, which are determined by droplet kinetic energy, aggregate particle sizes, and powder-bed density [51,52]. For substrates with a similar powder-bed density, a spreading mechanism (Figure 9a) is dominant for low-pressure fluids, and the crater formation (Figure 9b) is activated if the printing parameter requires a high-pressure jet stream to solidify target rVs [53].
Following the initial impact, the fluid penetrates and spreads in all three directions, known as the imbibition phase, due to capillary forces associated with fluid migration in the space between the aggregates and the gravity forces of the droplet [24,34,51,55]. Fluid flow in the deposited powder bed, including macro-voids, differs from a well-packed substrate [56]. As the liquid penetrates into powders containing large macro-voids, the liquid front tends to halt when the pore radius suddenly increases [56]. Depending on pore size and surface chemistry of the particles, four possible paths for the binder fluid penetration can be identified: (1) no liquid absorption by the powder bed, (2) trapping of liquid on the top of the deposited layer, (3) liquid descending to the bottom of each layer, and (4) liquid spreading through the powder bed (Figure 9c) [15,54,56].
The migration of drops into the powder bed continues until there is no binder on the deposited layer surface [50]; the fluid migration continues throughout the drainage phase. In drainage, liquid migrates from the saturated region (the initial region penetrated by the droplet) to the surrounding dry aggregates, and this process continues until the driving forces in both regions are equal [24,34,51,55].
Merging solidified rVs provides the single-line primitives [53,57]. The cross-section of the part is formed by single-line coalescence; the hardened object is produced by interlayer bonding between consecutive layers [53,57]. The final mechanical strength of the printed blocks depends on the bonding between single-line primitives (inter-rV connection) and layers (interlayer connection).
The flow rate could be adjusted as a function of the control signal duration for the solenoid valve or the fluid pressure. The signal frequency was kept constant at 110 Hz in this study, and the flow rate was a function of the set pressure. The specific kinetic energy of the jetted droplets depended on the drop size/speed and drop spacing/frequency [49]. Higher pressure increased the droplet speed, droplets with larger kinetic energy had higher penetration depth inside the powder bed, and their impact rearranged particles of the top surface.

3.3.2. Main Effects

The main effects plots for the process inputs are plotted in Figure 10 and Figure 11. A larger difference between average values indicated a stronger influence by the specific input. A similar effect was observed for the Y0 and Y90 outcomes when the factor level was changed. Increased AoB and PS levels resulted in enhanced mechanical characteristics. The best results were seen in the mid-level of layer thickness changes. Below is a detailed explanation of the rationale behind these changes.

Effect of Particle Size and Velocity of Powder Spread

The effect of “particle size” and “velocity of powder spread” on the mechanical properties of the printed parts are primarily attributed to their direct effect on the powder-bed density ( ρ p b ), which is defined as the in situ ratio of the mass of the powder to its occupied volume [20,24,58]. Furthermore, “aggregate size” determines the volume of cementitious bonding to improve mechanical strength, as explained below.
Figure 12 shows a SEM image of bonded particles and a schematic of particle–bond interaction. Based on this observation, an annular binder bridge (yellow meshed parts in Figure 12a) connects two particles. This kind of connection resembles the sintering process [32]. If the binder bridge is small with respect to the particle radius (h = constant), the volume of the bond or the liquid quantity is determined as follows:
V b = 4 3 π   a 2   h
where a and h are the radius and height of the cylinder, respectively. The mechanical strength can be considered to be proportional to the printed volume of the bond [32]:
σ m a x ~ V b
An increase in spread layer density increases the mechanical strength of the products; therefore, if the printing parameters are adjusted so that the powder-bed density improves, more cementitious bonds are formed, leading to better mechanical properties.
A wiper blade with a super-elliptic edge profile was mounted to the machine’s hopper to compress and level the dispersed powders in each layer (Figure 13). Since there was no other compaction mechanism in the system, such as a roller or a vibrator, the two discussed factors were the sole variables that affected the powder-bed density.
Two stepper motors connected by trapezoidal screws provided the necessary speed for powder deposition. Faster powder deposition rates amplified system vibrations, which rattled the hopper’s bin and enhanced powder flowability, leading to slightly improved powder-bed density. The ANOVA outcomes from the screening experiment revealed a p-value equal to 0.0522 for the “velocity of powder spread” factor, which indicated the non-significance of V on the modulus of rupture yields.
The powder-bed density ( ρ p b ) was affected by aggregate particle size. Finer particles had a higher compaction ratio than semi-fine particles in each deposited layer, due to the fewer spaces between them; as a result, the volume of cementitious bonds that could form was increased to support beams with flexural strength.
Aside from the influence of the P.S. factor on the powder-bed density, the powder beds with P013 finer aggregates had a higher surface area per unit volume [59] and created a greater volume of bonds. Considering the effects of P.S. on the volume of formable cement for both Y0 and Y90 outcomes, a smaller particle size led to a greater modulus of rupture.

Effect of Layer Thickness and Hatch Distance

The layer thickness, as determined by the product’s resolution and the size of available aggregates, is a significant parameter in all AM techniques [24]. The effect of layer thickness on the mechanical properties should be evaluated in the context of how it alters powder–binder interaction to form interlayer and inter-rV (intervoxel) connections.
The binder flow rate varied with the “rate of voxel”, and the fluid pressure was adjusted accordingly. Each constitutive element for the rate of voxel was considered an independent parameter in the current investigation. One component of the rV was L; as a more thickness of the layer was designed, a higher fluid pressure was applied.
In accordance with SEM images and EDS analysis, printed samples with a low layer thickness demonstrated a homogeneous distribution of cementitious bonds among the aggregates, but the printed blocks with larger layer thickness revealed inhomogeneity within the layers. In addition, the inhomogeneity was visible with the layered region phenomena. As an example, in sample #11 (Figure 4c), visible layers on the Y–Z plane were highlighted and characterized by a height equal to the layer thickness (L). The information from micrographic observations was in accordance with the PBI mechanisms.
Higher fluid pressure had a double effect on the powder-binder interaction. On the one hand, a higher pressure increased the kinetic energy of droplets, and binder fluid penetrated deeper inside the powder bed down to the bottom of the deposited layer. On the other hand, higher pressure rearranged the aggregates on the surface of each deposited layer, created a net shape channel, and increased the total porosity within a block.
Figure 14a shows the macro-voids and binder migration channels for sample #12. Two sides of the distinct bright color (dense material) were marked with silver paste to be detected by SEM observations, to analyze the microstructure between the layered regions.
In micrographs of the successive printed layers labeled as n and n−1, the visible layered region (layer n) could be distinguished by two white lines (Figure 15). The following findings were obtained from the SEM micrographs. First, longer lengths of MOC crystals were formed within the highlighted band (Figure 15c), while cementitious bonds between particles in other regions were limited (Figure 15b). Moreover, macro-porosities were at the top of each layer’s highlighted band (Figure 15a); for samples with L = 2 mm, the macro-voids were not observed in SEM images.
The pronounced inhomogeneity in samples with larger layer thickness was illustrated by composition variation through EDS line scan fluctuations (Figure 16). The main chemical element in the printed sample was the Si (related to the aggregate from Poraver glass). Hence, the Mg/Si and Cl/Si ratios were plotted along the z direction (between two determined blue lines) to investigate the amount of cement material over thickness. Obviously, composition variation can be pointed out in a visible layered region that was marked with silver paste. For samples #15 and #11 (from the screening step) with the layer thickness of 2.5 mm (Figure 16), it was understood that a larger amount of cement was formed in the visible layered region. Therefore, with reference to Figure 4c and the visible layered phenomena, dark and bright bands depict dense and loose materials with voids.
A low level of L led to more homogenous distribution of bonds and stronger inter-rV connections. However, a high level of this parameter provided a stronger interlayer connection with porosities inside a printed layer. According to the obtained results, the positive effect of a higher level of L overcame the negative effect of macro-voids in the mid-level of the DOE studies. For a high level of L, macro-voids were dominant, rather than midpoints, but adjusting higher pressure, correlated to the L values, led to better mechanical properties due to the stronger interlayer joints. Nevertheless, samples with larger thicknesses were mechanically stronger than samples with lower thicknesses, indicating that interlayer bonds were more critical in determining flexural strength.
In addition to the layer thickness, the hatch distance was a constitutive element of the rV, in which fluid pressure was increased with larger hatch sizes. Following ANOVA from the screening experiments, this factor did not show a significant effect (p-value = 0.1018) on the MOR in Y0, but for Y90 it was effective (p-value = 0.0155). When the force was normal to the x-z plane (Y90), the “hatch distance” acted as “layer thickness” in the Y0 state, increasing H reinforced interlayer connections to tolerate higher flexural tensions.

Effect of Amount of Binder

The amount of binder can be identified as the water-to-cement ratio in the conventional concrete production process [11]. In order to produce high mechanical resistance samples, the optimal composition for MOC cement should fall approximately in the middle of the compatibility triangle, MgO–P3–P5 (Figure 17) [18].
As illustrated in Figure 17, in order to maintain the initial stoichiometric condition of printing within the demanded zone, the interval of the AoB factor was kept limited. The recorded p-values for Y0 and Y90 were 0.01 and 0.005, respectively, indicating that the variations of this factor on the modulus of rupture were significant. A higher level of this factor contributed to a larger modulus of rupture. The impact of AoB on MOR may be assessed from two perspectives. First, a high AoB level increased the required fluid pressure to adjust the flow rate, resulting in improved interlayer interactions. Second, the quantity of binder added to the powder bed was increased, which aided fluid migration in the imbibition and drainage phases to form more cementitious bonds for inter-rV interfaces.

Feed Rate

The feed rate of droplets in the horizontal direction, or the travel speed of the printhead, was the printing speed. In this study, the feed rate did not significantly affect the final yields (p-value = 0.774 from screening runs). The velocity of droplets had two horizontal and vertical components that were related to the printing speed and the jetting of binder liquid, respectively.
To study the behavior of a jetted binder on the powder bed, the dimensionless Weber number can be used to characterize fluid interaction with a porous media [23]:
W e = ρ r v 2 / γ
where ρ is the density of the binder material, r and v are the radius and velocity of the droplet, respectively, and γ is the surface tension of the liquid binder. The Weber number describes the droplet-powder interaction that result in higher values of We in a larger wetted area.
Although the experimental results showed that the horizontal component of droplet velocity was not a significant printing factor on the MOR in the x and y directions, the feed rate at high printing speeds could not be ignored.
Increasing the printing speed increased the inertial forces and facilitated the spread of droplets in the printing direction [23]. The horizontal component of droplet velocity had a less noticeable effect than the vertical component (the vertical component of velocity as a function of fluid pressure) on the final strength of the printed blocks. The quality of the blocks was unaffected by the FR, which could be selected freely.

3.4. Interactions

The printing procedure in the selective cement activation binder jetting method began with the designing of a rate of voxel (FR × L × H) and the calculation of the corresponding quantity of binder (β). The manufacturing process was started by spreading a layer of the powder bed (L) with specified particle sizes (PS) and deposition rates (V), followed by jetting droplets in designed tracks (H) for various printing speeds. A correlation between the significant factors was generated to understand the optimized process parameters, as discussed below.
Based on the statistical analysis, contour plots are reported in Figure 18 and Figure 19. The diagrams can be used as a reference for selecting printing parameters. Considering the plotted contours for both Y0 and Y90 outcomes, the maximum modulus of rupture values were obtained by the finer aggregate particles (E = −1). Greater powder-bed densities achieved by using smaller aggregate sizes could contribute to better mechanical properties.
In the binder jetting process, the feed rate, the layer thickness, and the hatch distance comprised a componential element known as rV. Designing an rV with various rates alters the volume of cementitious bonds in inter-rV and interlayer interfaces; larger layer thickness values were preferred for acceptable mechanical qualities and a reduction in printing time, as long as the porosities did not become prominent.
A remarkable interaction was the one between layer thickness and the amount of binder, which was related to the binder flow rate calculation. Considering the contour plots, we concluded that samples with a higher layer thickness and a higher level of AoB with finer particle size resulted in better mechanical properties.

4. Conclusions

In this paper, we addressed binder jetting 3D printing by selective cement activation, a powder-bed method of producing precast concrete elements for the construction industry. Our focus was on identifying the significant printing parameters. A design of experiments approach was used to study the effect of six key printing factors on the modulus of rupture of MOC cement-based components. Prior to the manufacturing process, and based on the printing parameters, the binder flow rate (β) should be determined, formulated as: “β = rV  ρ p b α s”. A 2 V I 5 DOE with center point runs was performed to screen the process parameters on the MOR, and according to the ANOVA of screening results, a three-level full factorial design in three treatments was adopted to model the MOR’s printing parameters. Based on the statistical analysis carried out in the experimental work, the following conclusions were drawn.
  • The modulus of rupture (MOR) was determined by the layer thickness, the amount of binder, the particle size, and the interaction between these factors. When the aim was to print better mechanical strength blocks, the feed rate and the velocity of powder spread were not significant factors. These parameters were selected freely, on the basis that the binder amount and the rate of voxel (rV) were kept constant.
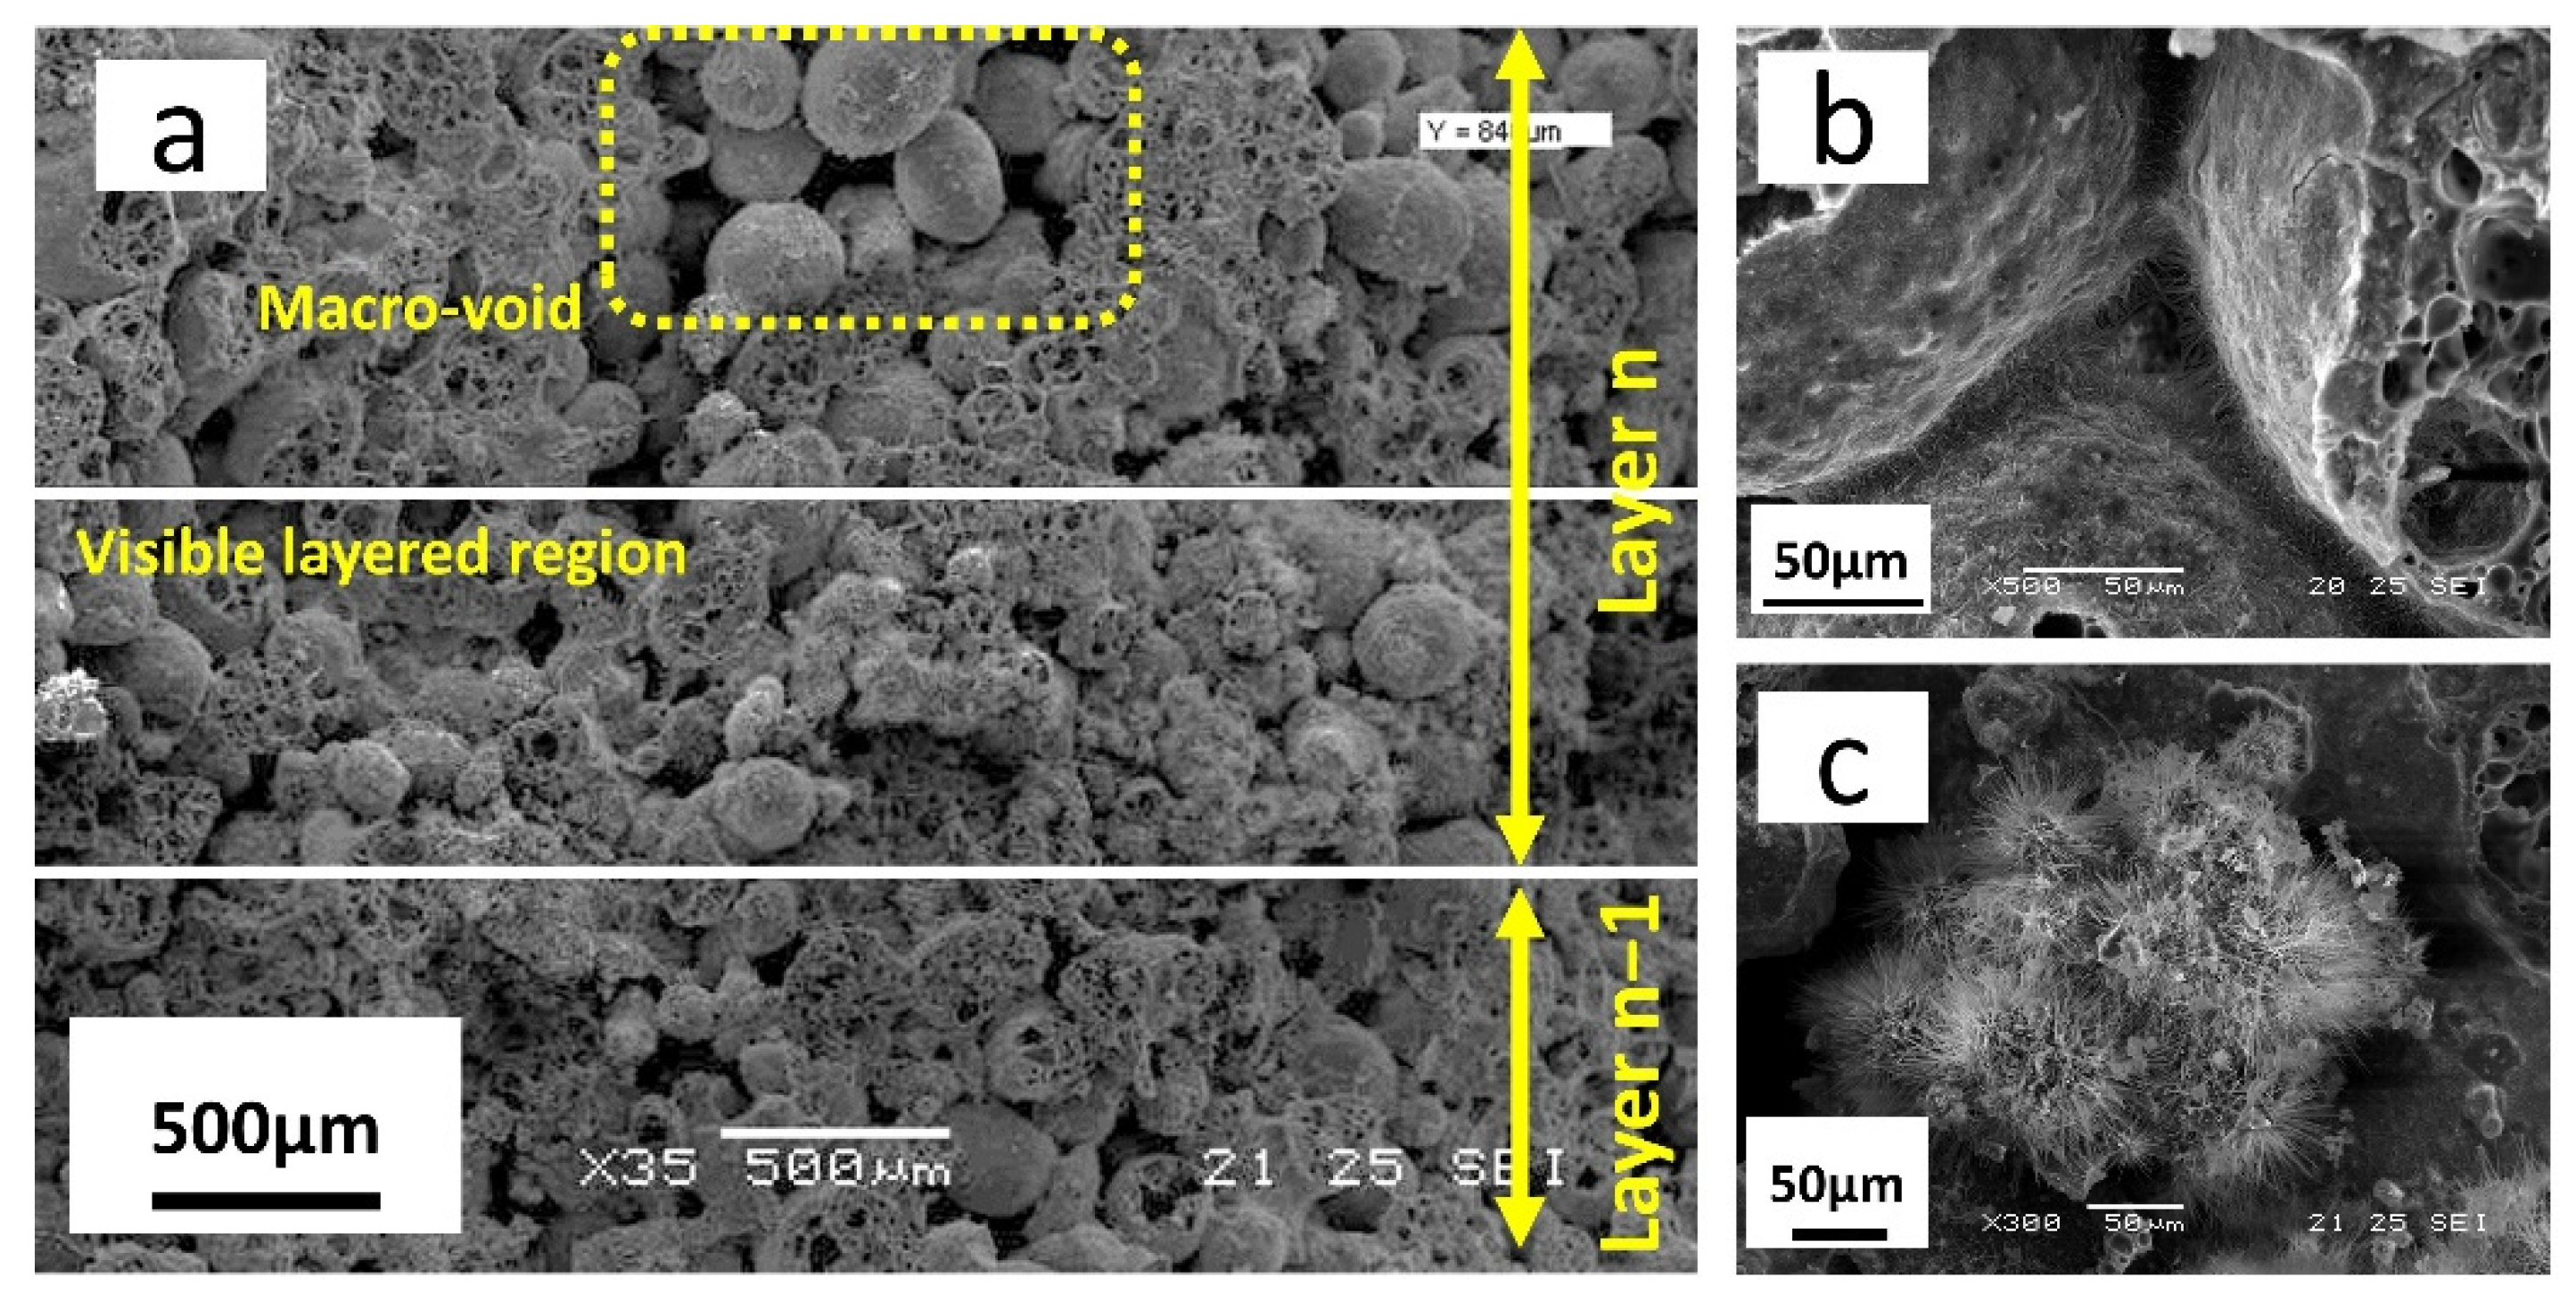
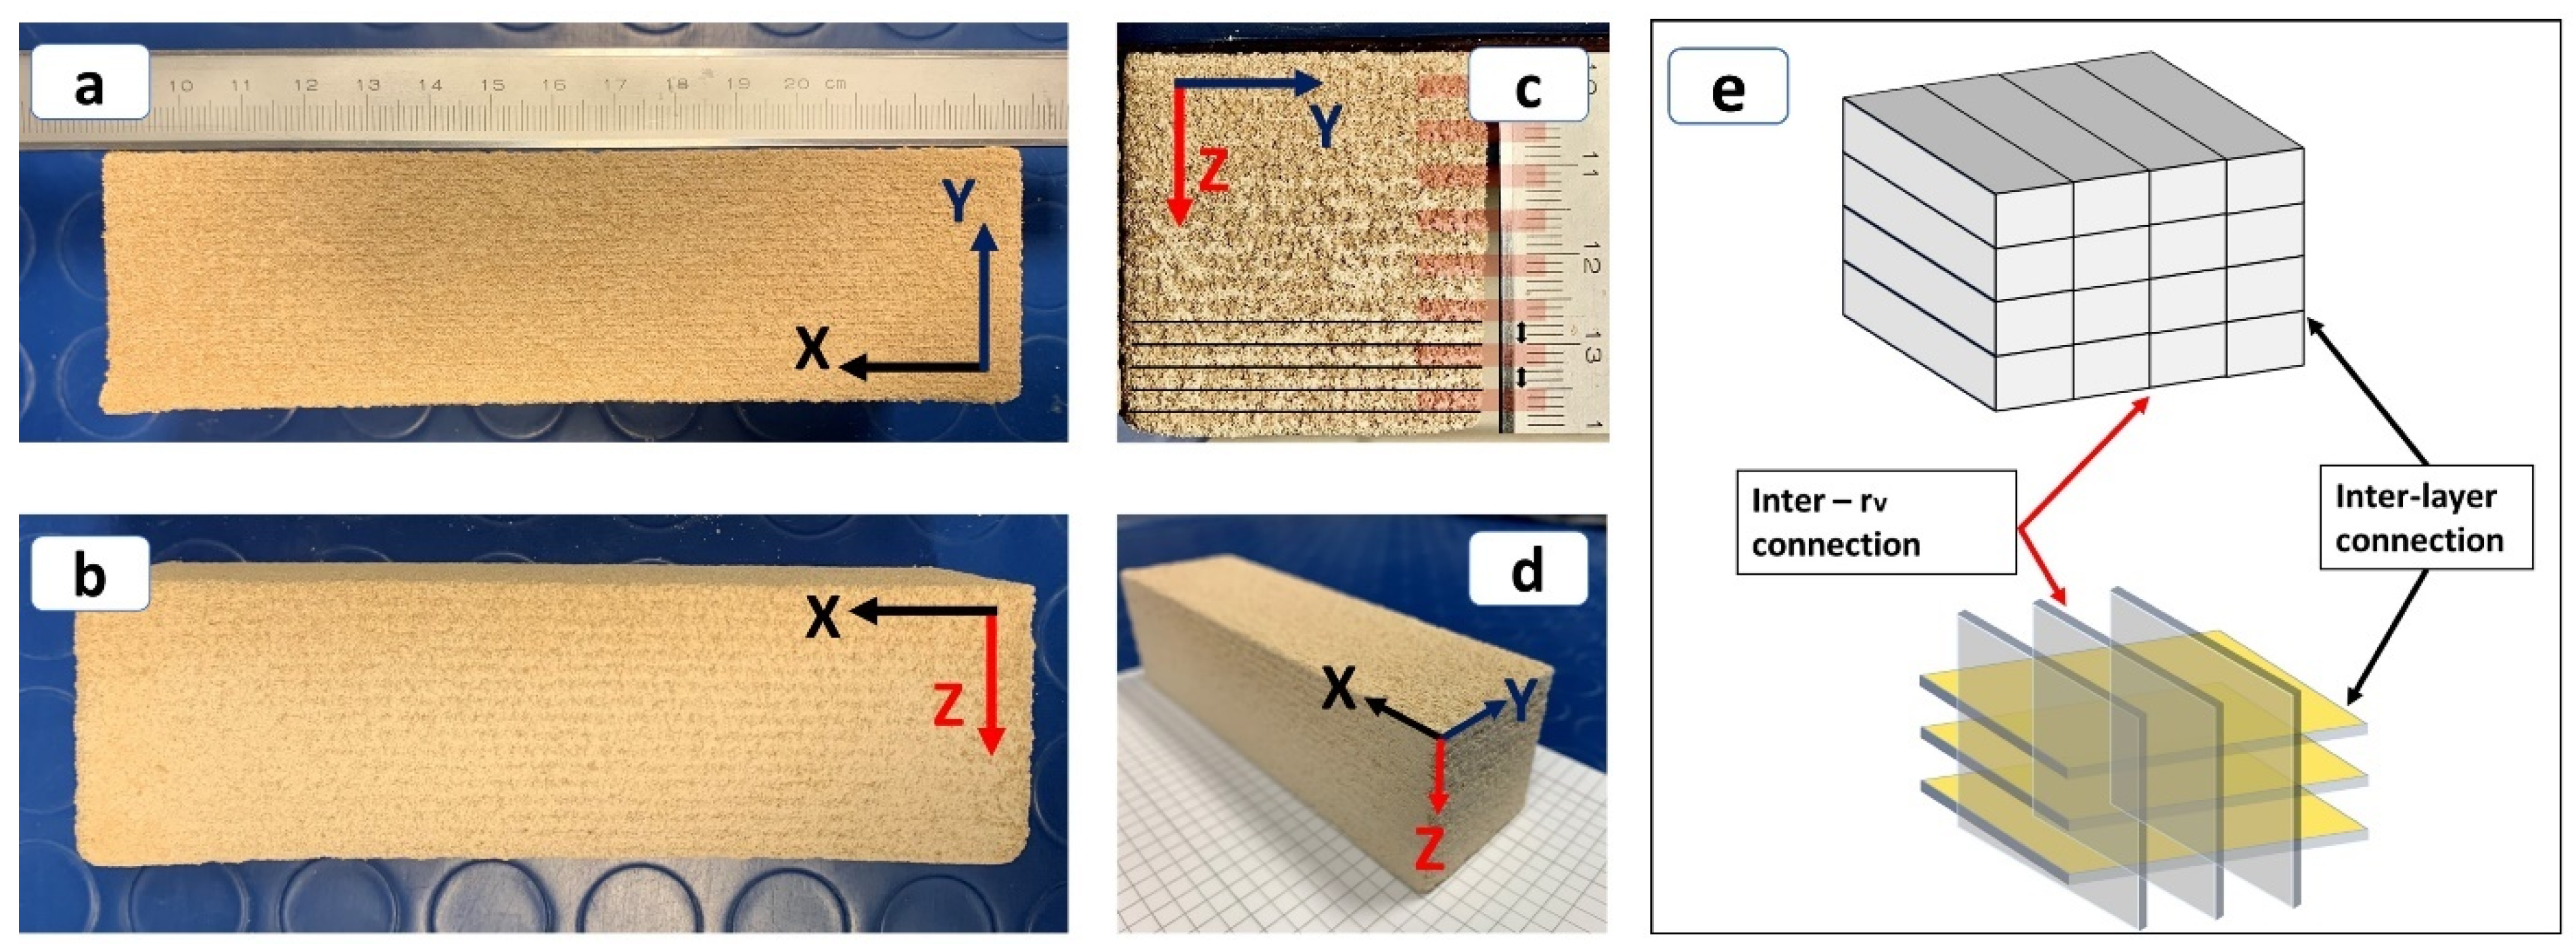
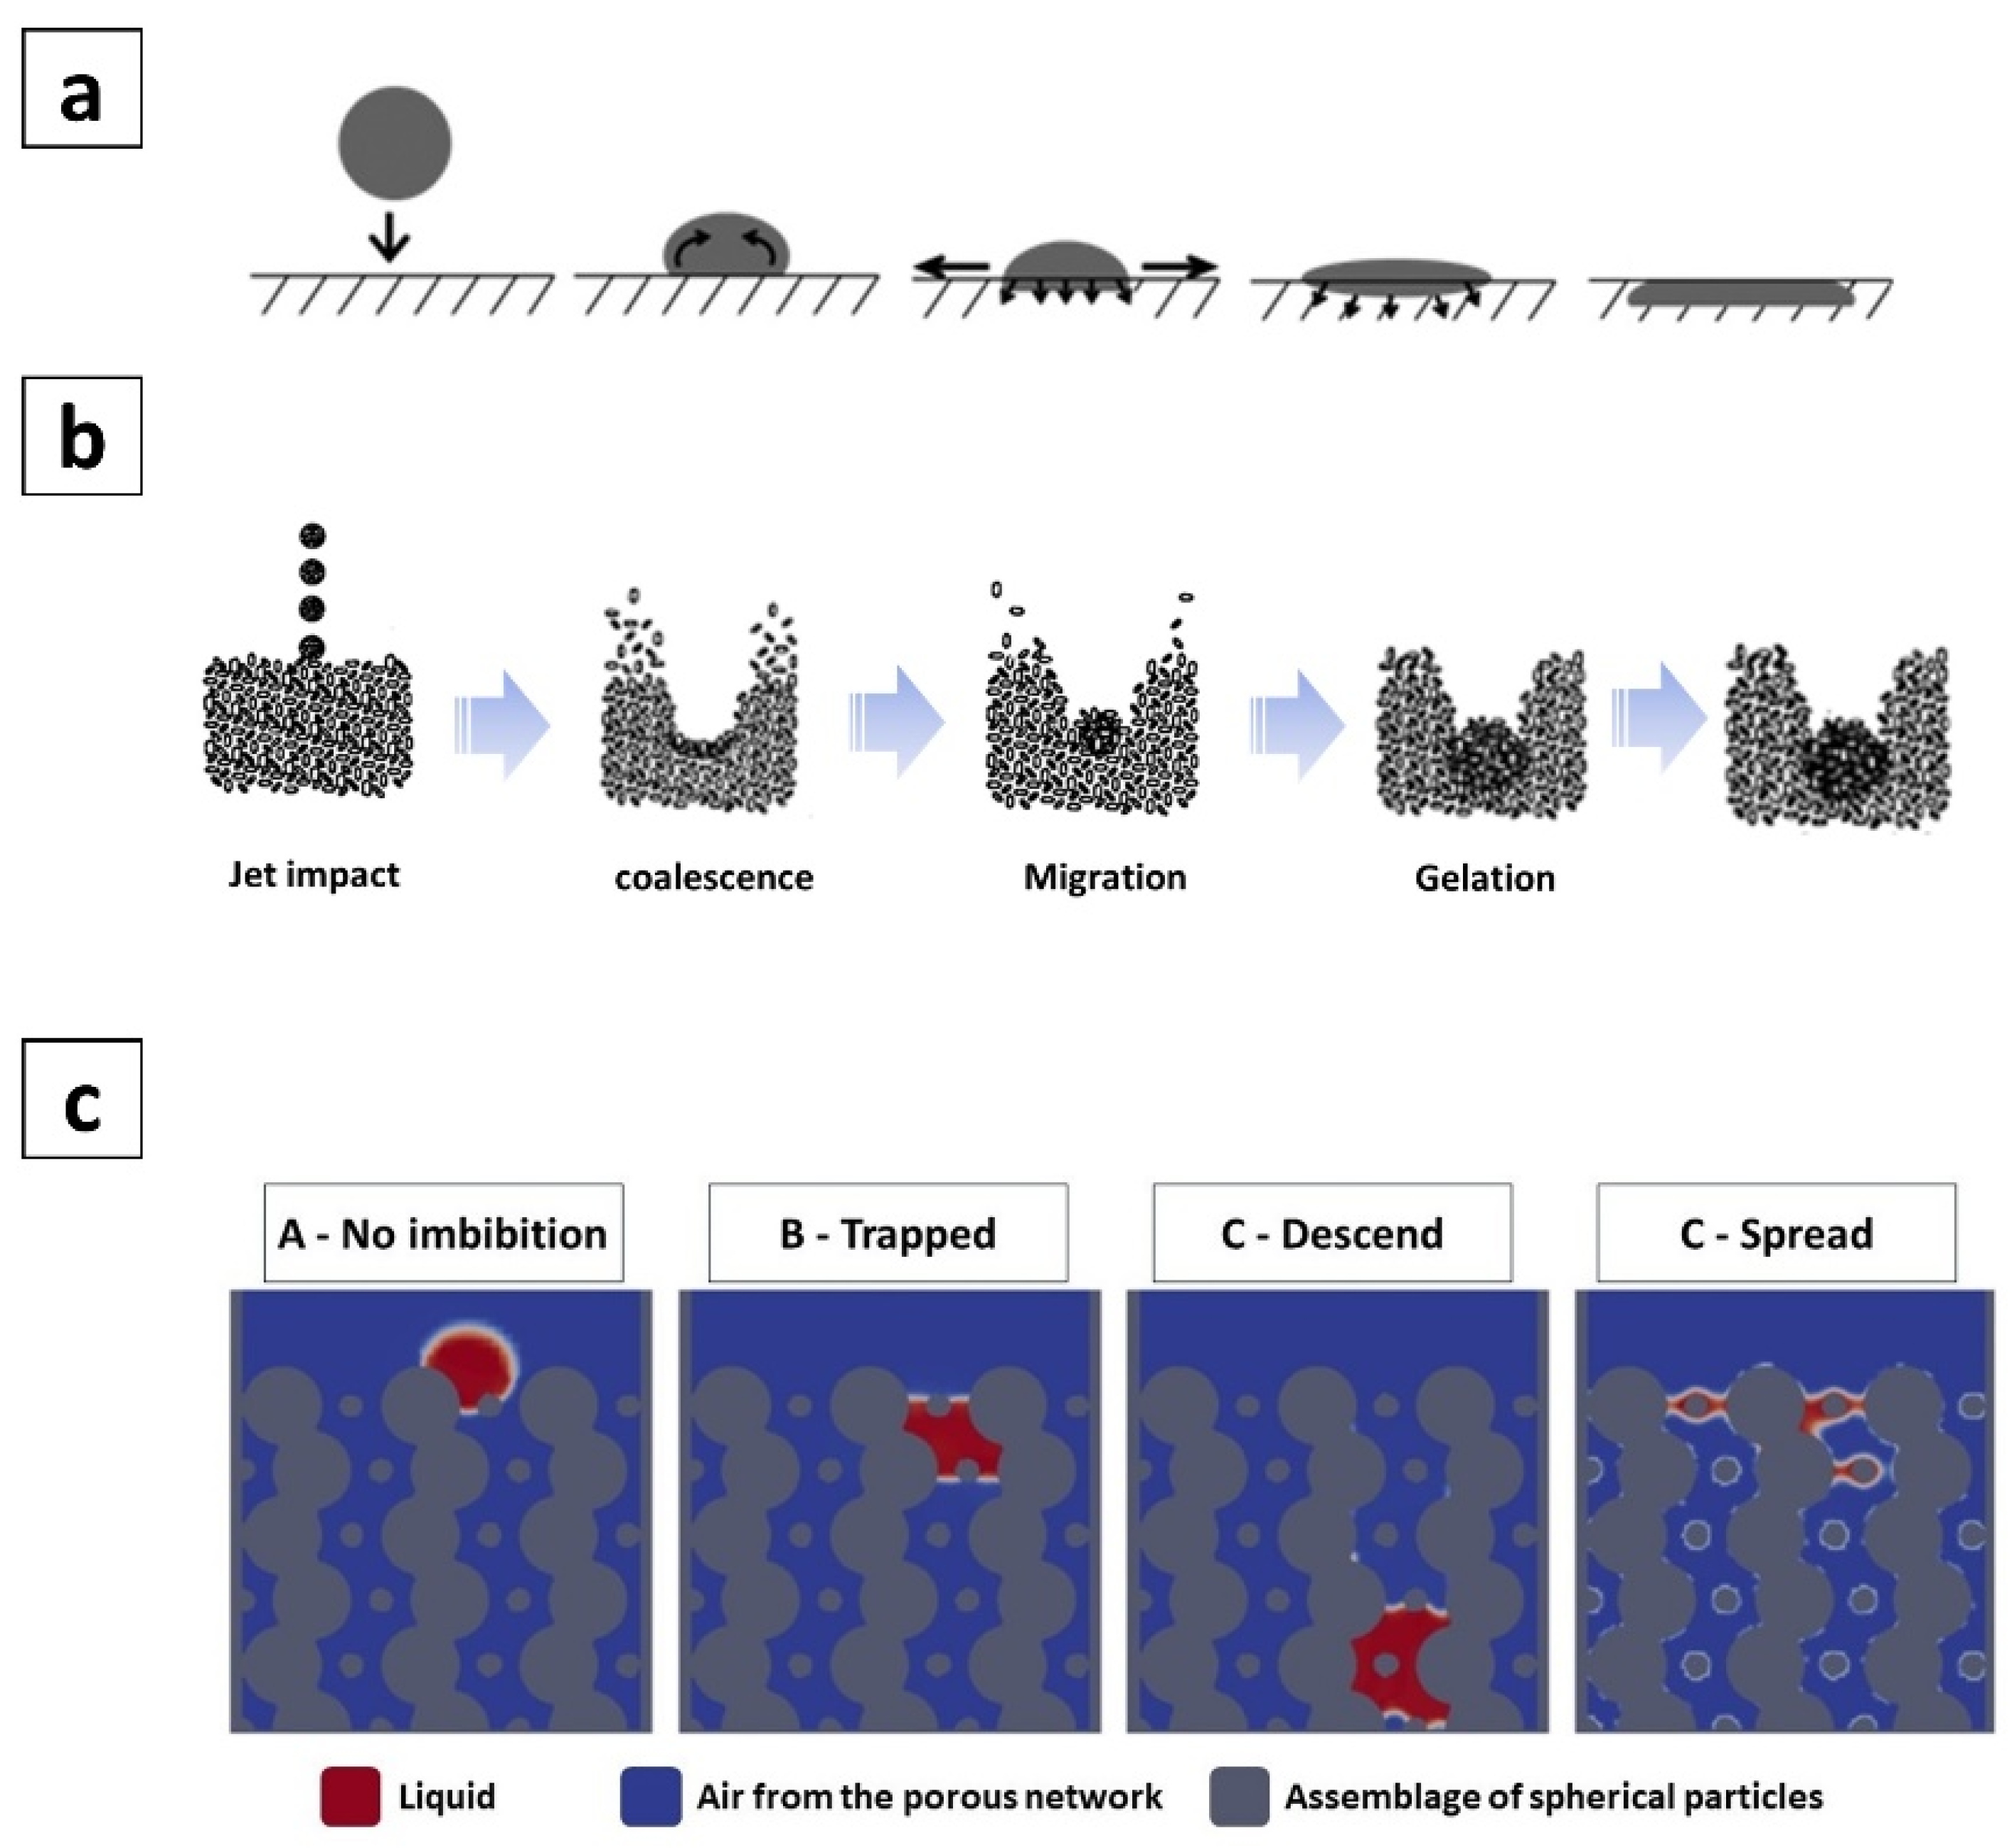
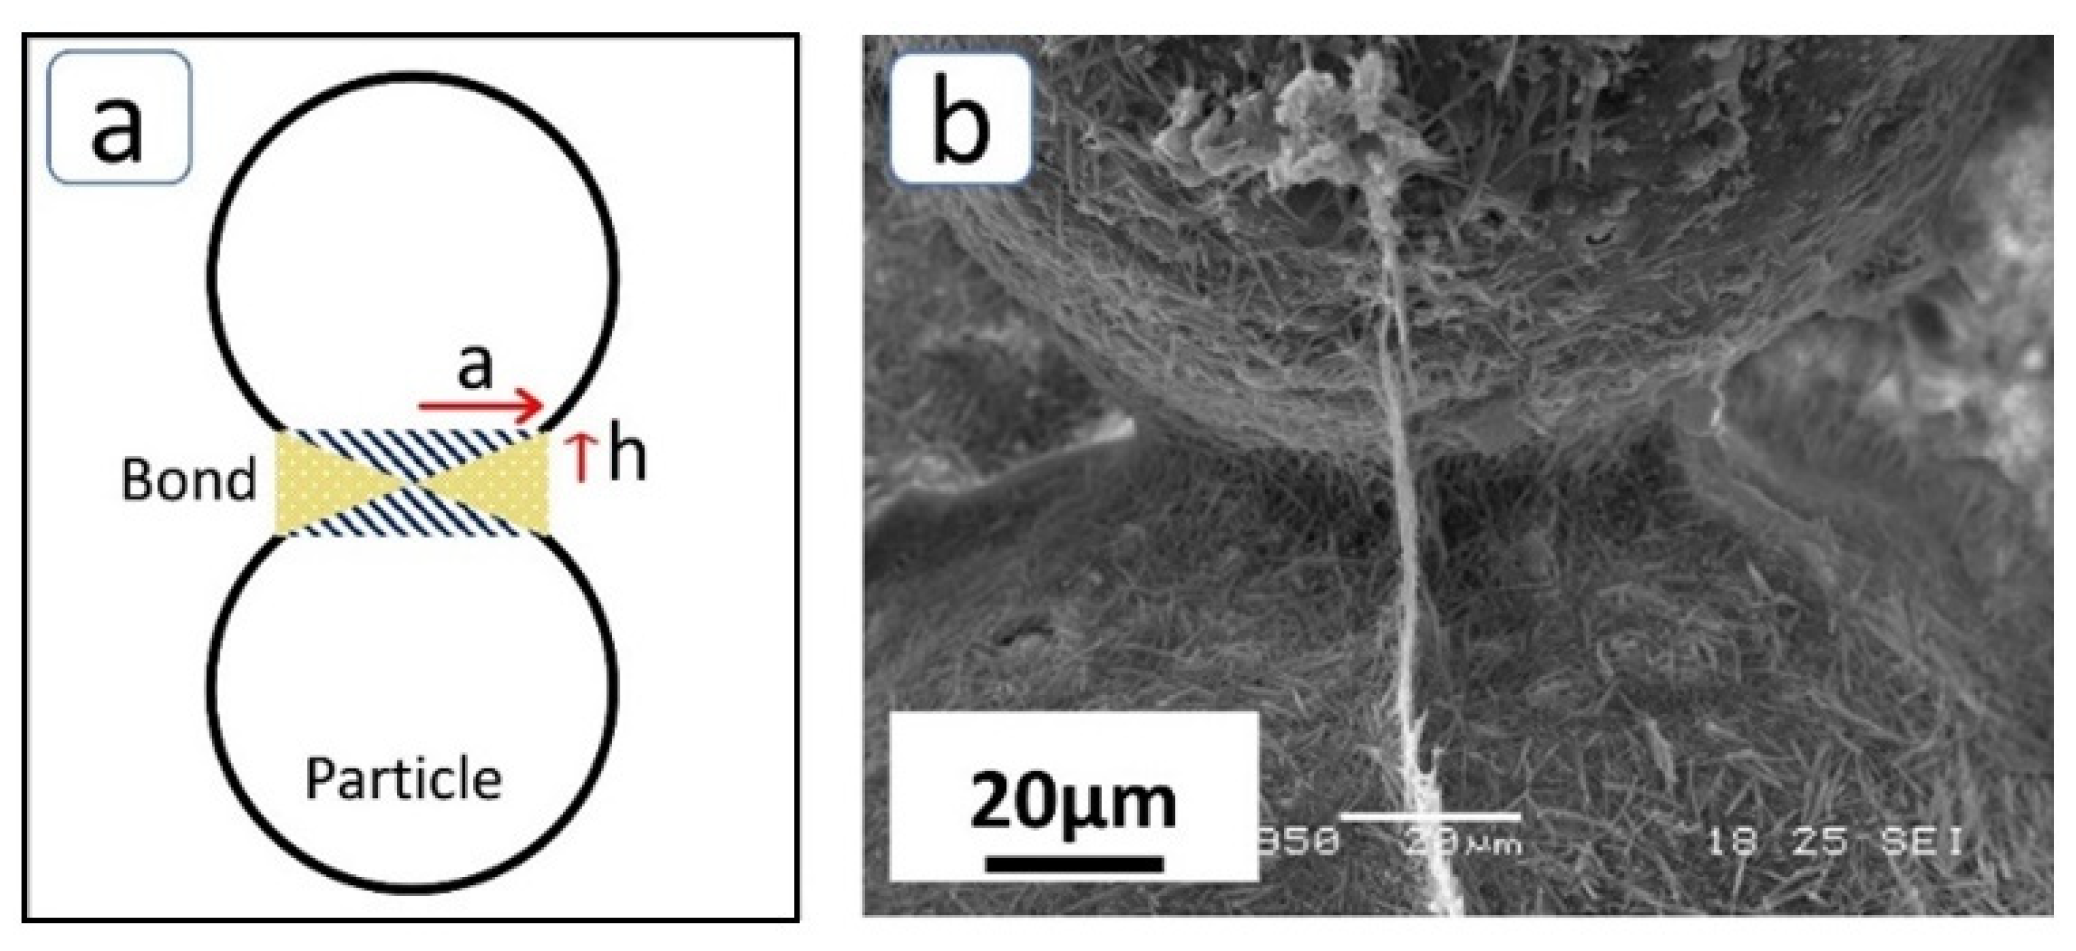
  • The powder binder interaction (PBI), i.e., the interaction between jetted binder droplets and the deposited powder bed, determined the quality of the printed blocks. A sample was formed by merging rVs as single-line primitives, followed by connecting successive cross-sections; hence, inter-rV and interlayer connections were two types of interfaces in each printed component. The final products were orthotropic materials whose properties depended on the binder’s deposition direction.
  • Under high fluid pressure, single-line primitives were created through a crater formation mechanism, where the binder went deeper into the powder bed, but each layer was formed with macro porosities. At low fluid pressures, on the other hand, the spreading mechanism was dominant and the cement was distributed homogeneously throughout the printed part.
  • The mechanical strength of SCA-produced products with an inorganic binder was proportional to the volume of the cementitious bonds ( σ m a x   ~ V b among the aggregates. Finer particles generated a more compacted layer with more active surface area to form cementitious bonds. As a result, they ended up with a higher MOR. Furthermore, increasing the density of the powder bed with finer aggregates demanded higher flow rates, activating the crater mechanism and reinforcing the interlayer connections.
  • In the SCA process, the AoB operated in a manner similar to that of the water-to-cement ratio in traditional concrete manufacturing. When this factor increased, the flow rate increased and, as a result, the fluid pressure rose, resulting in the formation of stronger interlayer connections.
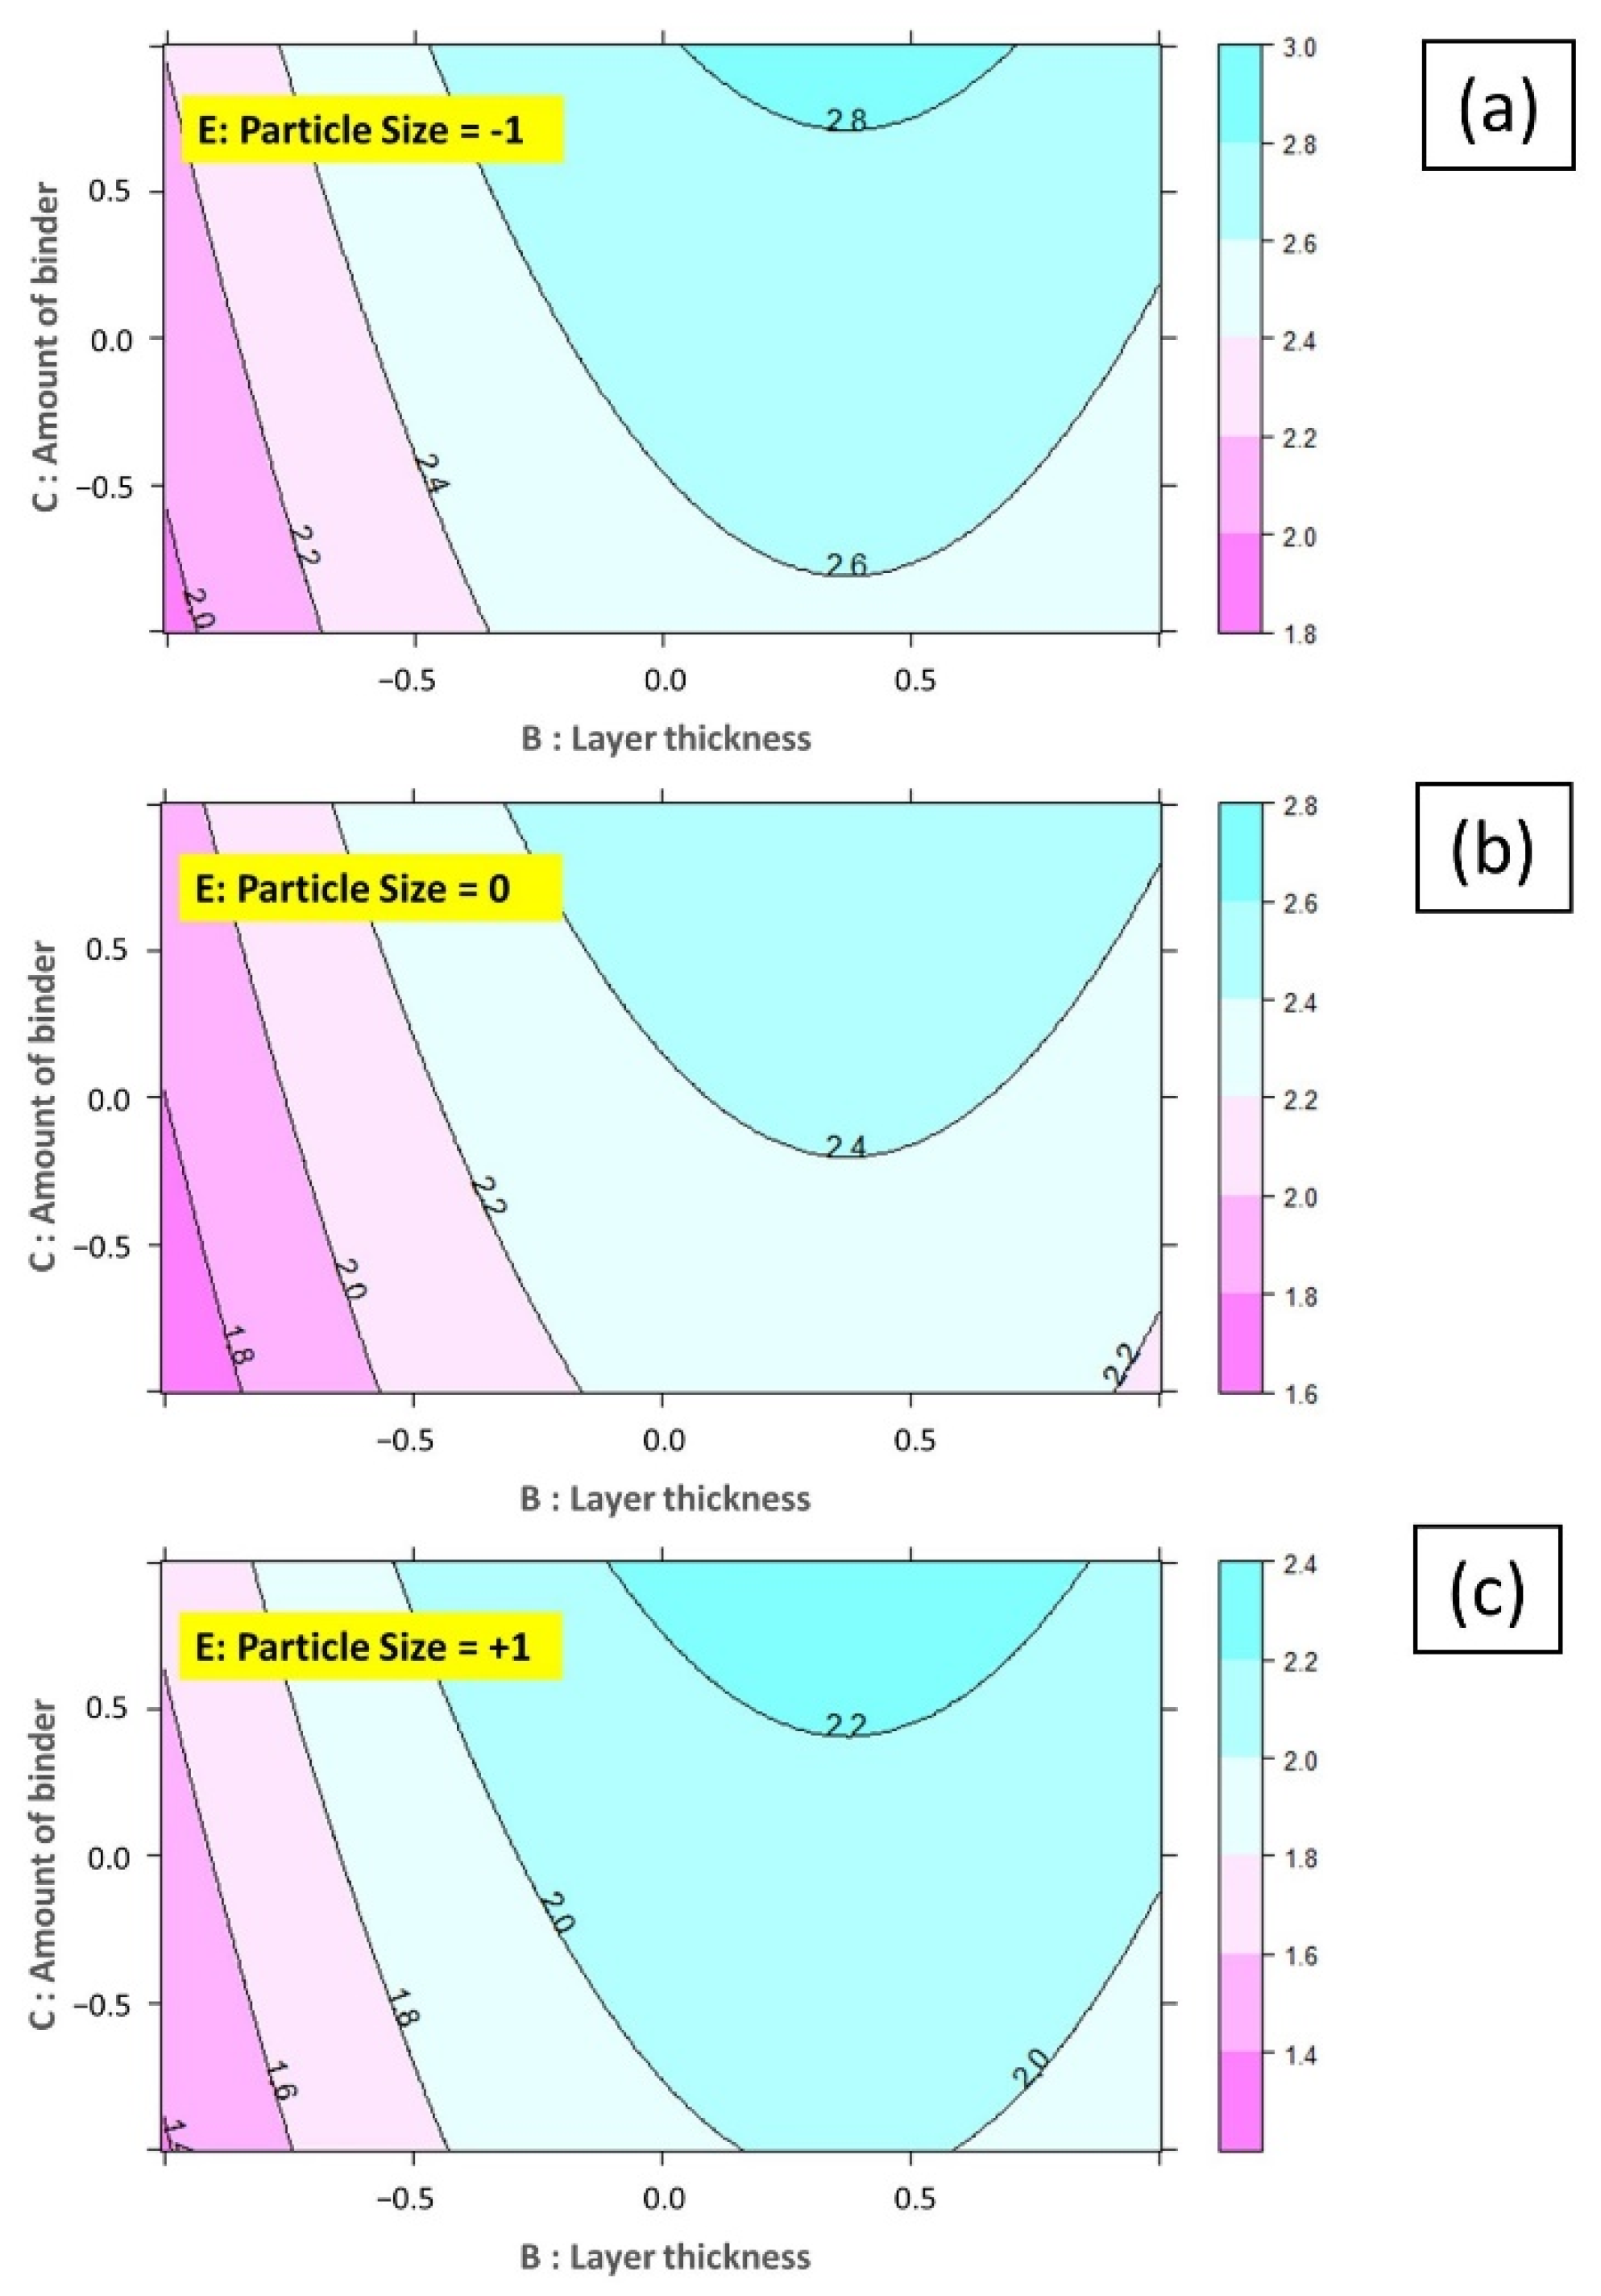
  • Statistical models were developed to predict MOR in three levels: as a function of layer thickness, the amount of binder, and particle size. The aim was to print the most robust products; hence, fine particle size combined with a high level of AoB factor, with the layer thickness maintained in mid-level, provided the best results for both Y0 and Y90 outcomes.

Author Contributions

F.S.: Conceptualization; data curation; formal analysis; investigation; methodology; resources; software; validation; visualization; writing—original draft; writing—review & editing. P.B.: Conceptualization; formal analysis; data curation; methodology; project administration; software; supervision; validation; writing—review & editing. V.M.S.: Conceptualization; funding acquisition; project administration; supervision; validation; writing—review & editing. All authors have read and agreed to the published version of the manuscript.

Funding

This research received no external funding.

Institutional Review Board Statement

Not applicable.

Informed Consent Statement

Not applicable.

Data Availability Statement

Not applicable.

Acknowledgments

The authors acknowledge the support from the Italian Ministry of University and Research (MIUR) within the project Dipartimenti di eccellenza 2018–2022 (Department of Industrial Engineering, University of Trento; project “3D PRINTING”).

Conflicts of Interest

The authors declare no conflict of interest.

References

  1. Gibson, I.; Rosen, D.W.; Stucker, B.; Khorasani, M.; Rosen, D.; Stucker, B.; Khorasani, M. Additive Manufacturing Technologies; Springer: Cham, Switzerland, 2021; Volume 17. [Google Scholar]
  2. Xia, M.; Nematollahi, B.; Sanjayan, J. Printability, accuracy and strength of geopolymer made using powder-based 3D printing for construction applications. Autom. Constr. 2019, 101, 179–189. [Google Scholar] [CrossRef]
  3. Goh, G.L.; Dikshit, V.; Koneru, R.; Peh, Z.K.; Lu, W.; Goh, G.D.; Yeong, W.Y. Fabrication of design-optimized multifunctional safety cage with conformal circuits for drone using hybrid 3D printing technology. Int. J. Adv. Manuf. Technol. 2022, 120, 2573–2586. [Google Scholar] [CrossRef]
  4. Collins, M.N.; Ren, G.; Young, K.; Pina, S.; Reis, R.L.; Oliveira, J.M. Scaffold Fabrication Technologies and Structure/Function Properties in Bone Tissue Engineering. Adv. Funct. Mater. 2021, 31, 2010609. [Google Scholar] [CrossRef]
  5. Zheng, Y.; Hong, X.; Wang, J.; Feng, L.; Fan, T.; Guo, R.; Zhang, H. 2D Nanomaterials for Tissue Engineering and Regenerative Nanomedicines: Recent Advances and Future Challenges. Adv. Health Mater. 2021, 10, 2001743. [Google Scholar] [CrossRef]
  6. Keneth, E.S.; Kamyshny, A.; Totaro, M.; Beccai, L.; Magdassi, S. 3D Printing Materials for Soft Robotics. Adv. Mater. 2020, 33, e2003387. [Google Scholar] [CrossRef] [PubMed]
  7. Sinha, A.K.; Goh, G.L.; Yeong, W.Y.; Cai, Y. Ultra-Low-Cost, Crosstalk-Free, Fast-Responding, Wide-Sensing-Range Tactile Fingertip Sensor for Smart Gloves. Adv. Mater. Interfaces 2022, 9, 2200621. [Google Scholar] [CrossRef]
  8. Xia, M.; Sanjayan, J. Method of formulating geopolymer for 3D printing for construction applications. Mater. Des. 2016, 110, 382–390. [Google Scholar] [CrossRef]
  9. Lowke, D.; Dini, E.; Perrot, A.; Weger, D.; Gehlen, C.; Dillenburger, B. Particle-bed 3D printing in concrete construction—Possibilities and challenges. Cem. Concr. Res. 2018, 112, 50–65. [Google Scholar] [CrossRef]
  10. Nematollahi, B.; Xia, M.; Sanjayan, J. Current Progress of 3D Concrete Printing Technologies. In ISARC. Proceedings of the International Symposium on Automation and Robotics in Construction; IAARC Publications: Taipei, Taiwan, 2017; Volume 34. [Google Scholar]
  11. Xia, M.; Nematollahi, B.; Sanjayan, J. Influence of Binder Saturation Level on Compressive Strength and Dimensional Accuracy of Powder-Based 3D Printed Geopolymer. In Materials Science Forum; Trans Tech Publications: Zurich, Switzerland, 2018; Volume 939, pp. 177–183. [Google Scholar]
  12. Shakor, P.; Chu, S.H.; Puzatova, A.; Dini, E. Review of binder jetting 3D printing in the construction industry. Prog. Addit. Manuf. 2022, 1–27. [Google Scholar] [CrossRef]
  13. Shrestha, S.; Manogharan, G. Optimization of Binder Jetting Using Taguchi Method. JOM 2017, 69, 491–497. [Google Scholar] [CrossRef]
  14. Lowke, D.; Talke, D.; Dressler, I.; Weger, D.; Gehlen, C.; Ostertag, C.; Rael, R. Particle Bed 3D Printing by Selective Cement Activation–Applications, Material and Process Technology. Cem. Concr. Res. 2020, 134, 106077. [Google Scholar] [CrossRef]
  15. Pierre, A.; Perrot, A. 3D Printing by Selective Binding in a Particle Bed: Principles and Challenges. In 3D Printing of Concrete: State of the Art and Challenges of the Digital Construction Revolution; John Wiley & Sons: Hoboken, NJ, USA, 2019; pp. 73–99. [Google Scholar]
  16. Walling, S.A.; Provis, J.L. Magnesia-Based Cements: A Journey of 150 Years, and Cements for the Future? Chem. Rev. 2016, 116, 4170–4204. [Google Scholar] [CrossRef] [PubMed]
  17. Góchez, R.; Wambaugh, J.; Rochner, B.; Kitchens, C.L. Kinetic Study of the Magnesium Oxychloride Cement Cure Reaction. J. Mater. Sci. 2017, 52, 7637–7646. [Google Scholar] [CrossRef]
  18. Sglavo, V.M.; De Genua, F.; Conci, A.; Ceccato, R.; Cavallini, R. Influence of Curing Temperature on the Evolution of Magnesium Oxychloride Cement. J. Mater. Sci. 2011, 46, 6726–6733. [Google Scholar] [CrossRef]
  19. Xu, B.; Ma, H.; Hu, C.; Yang, S.; Li, Z. Influence of Curing Regimes on Mechanical Properties of Magnesium Oxychloride Cement-Based Composites. Constr. Build. Mater. 2016, 102, 613–619. [Google Scholar] [CrossRef]
  20. Dini, F.; Ghaffari, S.A.; Jafar, J.; Hamidreza, R.; Marjan, S. A Review of Binder Jet Process Parameters; Powder, Binder, Printing and Sintering Condition. Met. Powder Rep. 2020, 75, 95–100. [Google Scholar] [CrossRef]
  21. Utela, B.; Storti, D.; Anderson, R.; Ganter, M. A Review of Process Development Steps for New Material Systems in Three Dimensional Printing (3DP). J. Manuf. Processes 2008, 10, 96–104. [Google Scholar] [CrossRef]
  22. Lv, X.; Ye, F.; Cheng, L.; Fan, S.; Liu, Y. Binder Jetting of Ceramics: Powders, Binders, Printing Parameters, Equipment, and Post-Treatment. Ceram. Int. 2019, 45, 12609–12624. [Google Scholar] [CrossRef]
  23. Miyanaji, H.; Momenzadeh, N.; Yang, L. Effect of Printing Speed on Quality of Printed Parts in Binder Jetting Process. Addit. Manuf. 2018, 20, 1–10. [Google Scholar] [CrossRef]
  24. Mostafaei, A.; Elliott, A.M.; Barnes, J.E.; Li, F.; Tan, W.; Cramer, C.L.; Nandwana, P.; Chmielus, M. Binder Jet 3D Printing—Process Parameters, Materials, Properties, Modeling, and Challenges. Prog. Mater. Sci. 2021, 119, 100707. [Google Scholar] [CrossRef]
  25. Vaezi, M.; Chua, C.K. Effects of Layer Thickness and Binder Saturation Level Parameters on 3D Printing Process. Int. J. Adv. Manuf. Technol. 2011, 53, 275–284. [Google Scholar] [CrossRef]
  26. Farzadi, A.; Solati-Hashjin, M.; Asadi-Eydivand, M.; Abu Osman, N.A. Effect of Layer Thickness and Printing Orientation on Mechanical Properties and Dimensional Accuracy of 3D Printed Porous Samples for Bone Tissue Engineering. PLoS ONE 2014, 9, e108252. [Google Scholar] [CrossRef] [PubMed]
  27. Gonzalez, J.; Mireles, J.; Lin, Y.; Wicker, R. Characterization of ceramic components fabricated using binder jetting additive manufacturing technology. Ceram. Int. 2016, 42, 10559–10564. [Google Scholar] [CrossRef] [Green Version]
  28. Yao, A.W.; Tseng, Y. A robust process optimization for a powder type rapid prototyper. Rapid Prototyp. J. 2002, 8, 180–189. [Google Scholar] [CrossRef]
  29. Kumar, A.; Bai, Y.; Eklund, A.; Williams, C.B. Effects of Hot Isostatic Pressing on Copper Parts Fabricated via Binder Jet-ting. Procedia Manuf. 2017, 10, 935–944. [Google Scholar] [CrossRef]
  30. Derby, B. Additive Manufacture of Ceramics Components by Inkjet Printing. Engineering 2015, 1, 113–123. [Google Scholar] [CrossRef] [Green Version]
  31. Ingaglio, J.; Fox, J.; Naito, C.J.; Bocchini, P. Material characteristics of binder jet 3D printed hydrated CSA cement with the addition of fine aggregates. Constr. Build. Mater. 2019, 206, 494–503. [Google Scholar] [CrossRef]
  32. Günther, D.; Mögele, F. Additive Manufacturing of Casting Tools Using Powder-Binder- Jetting Technology. New Trends 3D Print. 2016, 53–86. [Google Scholar] [CrossRef] [Green Version]
  33. Ramakrishnan, R.; Griebel, B.; Volk, W.; Günther, D.; Günther, J. 3D Printing of Inorganic Sand Moulds for Casting Applica-tions. In Advanced Materials Research; Trans Tech Publications: Zurich, Switzerland, 2014; Volume 1018, pp. 441–449. [Google Scholar]
  34. Miyanaji, H. Binder Jetting Additive Manufacturing Process Fundamentals and the Resultant Influences on Part Quality. Ph.D. Dissertation, University of Louisville, Louisville, KY, USA, 2019. [Google Scholar] [CrossRef]
  35. Zhao, H.; Ye, C.; Fan, Z.; Wang, C. 3D Printing of Cao-Based Ceramic Core Using Nanozirconia Suspension as a Binder. J. Eur. Ceram. Soc. 2017, 37, 5119–5125. [Google Scholar] [CrossRef]
  36. Huang, S.-J.; Ye, C.-S.; Zhao, H.-P.; Fan, Z.-T. Parameters optimization of binder jetting process using modified silicate as a binder. Mater. Manuf. Process. 2019, 35, 214–220. [Google Scholar] [CrossRef]
  37. Lu, K.; Hiser, M.; Wu, W. Effect of particle size on three dimensional printed mesh structures. Powder Technol. 2009, 192, 178–183. [Google Scholar] [CrossRef]
  38. Weger, D.; Lowke, D.; Gehlen, C. 3D Printing of Concrete Structures Using the Selective Binding Method–Effect of Concrete Technology on Contour Precision and Compressive Strength. In Proceedings of the 11th fib International PhD Symposium in Civil Engineering, Tokyo, Japan, 29–31 August 2016; pp. 1–8. [Google Scholar]
  39. Craveiroa, F.; Duartec, J.P.; Bartoloa, H.; Bartolod, P.J. Additive Manufacturing as an Enabling Technology for Digital Construction: A Perspective on Construction 4.0. Sustain. Dev. 2019, 4, 6. [Google Scholar] [CrossRef]
  40. American Society for Testing and Materials. ASTM C293, Standard Test Method for Flexural Strength of Concrete Using Simple Beam with Center Point Loading; ASTM: West Conshohocken, PA, USA, 2002. [Google Scholar]
  41. Montgomery, D.C. Design and Analysis of Experiments; John Wiley & Sons: Hoboken, NJ, USA, 2017. [Google Scholar]
  42. Gunst, R.F.; Mason, R.L. Fractional Factorial Design. Wiley Interdiscip. Rev. Comput. Stat. 2009, 1, 234–244. [Google Scholar] [CrossRef]
  43. Team RStudio. RStudio: Integrated Development Environment for R; PBC: Boston, MA, USA, 2020. [Google Scholar]
  44. Chandrasekaran, R.R.; Benoit, M.J.; Barrett, J.M.; Gerlich, A.P. Multi-Variable Statistical Models for Predicting Bead Geometry in Gas Metal Arc Welding. Int. J. Adv. Manuf. Technol. 2019, 105, 1573–1584. [Google Scholar] [CrossRef]
  45. Lutterotti, L.; Ceccato, R.; Dal Maschio, R.; Pagani, E. Quantitative Analysis of Silicate Glass in Ceramic Materials by the Rietveld Method. In Materials Science Forum; Trans Tech Publications: Aedermannsdorf, Switzerland, 1998; Volume 278, pp. 87–92. [Google Scholar]
  46. Lutterotti, L.; Bortolotti, M.; Ischia, G.; Lonardelli, I.; Wenk, H. Rietveld Texture Analysis from Diffraction Images. Z. Kristallogr. 2007, 26, 125–130. [Google Scholar] [CrossRef]
  47. Xiao, J.; Liu, H.; Ding, T. Finite Element Analysis on the Anisotropic Behavior of 3D Printed Concrete under Compression and Flexure. Addit. Manuf. 2020, 39, 101712. [Google Scholar] [CrossRef]
  48. Ford, C. Understanding Qq Plots. Access Date 2015, 4, 18. [Google Scholar]
  49. Lanzetta, M.; Sachs, E. The Line Formation with Alumina Powders in Drop on Demand Three Dimensional Printing. In PRIME 2001, 1st Int. CIRP Seminar on: PRogress in Innovative Manufacturing Engineering; Dipartimento di Ingegneria della Produzione, Università di Genova: Genoa, Italy, 2001; pp. 189–196. [Google Scholar]
  50. Miyanaji, H.; Zhang, S.; Yang, L. A New Physics-Based Model for Equilibrium Saturation Determination in Binder Jetting Additive Manufacturing Process. Int. J. Mach. Tools Manuf. 2018, 124, 1–11. [Google Scholar] [CrossRef]
  51. Emady, H.N.; Kayrak-Talay, D.; Litster, J.D. A Regime Map for Granule Formation by Drop Impact on Powder Beds. AIChE J. 2013, 59, 96–107. [Google Scholar] [CrossRef]
  52. Emady, H.N.; Kayrak-Talay, D.; Litster, J.D. Modeling the Granule Formation Mechanism from Single Drop Impact on a Powder Bed. J. Colloid Interface Sci. 2013, 393, 369–376. [Google Scholar] [CrossRef] [Green Version]
  53. Salari, F.; Bosetti, P.; Sglavo, V.M. Binder Jet 3D Printing of Magnesium Oxychloride Cement-Based Concrete: A Framework to Design the Rate of Voxel. In Key Engineering Materials; Trans Tech Publications: Zurich, Switzerland, 2022; Volume 919, pp. 3–14. [Google Scholar]
  54. Boyce, C.M.; Ozel, A.; Sundaresan, S. Intrusion of a Liquid Droplet into a Powder Under Gravity. Langmuir 2016, 32, 8631–8640. [Google Scholar] [CrossRef] [PubMed]
  55. Bai, Y.; Wall, C.; Pham, H.; Esker, A.; Williams, C.B. Characterizing Binder–Powder Interaction in Binder Jetting Additive Manufacturing via Sessile Drop Goniometry. J. Manuf. Sci. Eng. 2019, 141. [Google Scholar] [CrossRef]
  56. Hapgood, K.P.; Litster, J.D.; Biggs, S.R.; Howes, T. Drop Penetration into Porous Powder Beds. J. Colloid Interface Sci. 2002, 253, 353–366. [Google Scholar] [CrossRef] [PubMed]
  57. Wagner, J.J.; Shu, H.; Kilambi, R. Experimental Investigation of Fluid-Particle Interaction in Binder Jet 3D Printing. Preprints 2021, 2021010546. [Google Scholar]
  58. Mangulkar, M.; Jamkar, S. Review of Particle Packing Theories Used for Concrete Mix Proportioning. Contrib. Pap. 2013, 141. [Google Scholar]
  59. Mirzababaei, S.; Pasebani, S. A Review on Binder Jet Additive Manufacturing of 316L Stainless Steel. J. Manuf. Mater. Processing 2019, 3, 82. [Google Scholar] [CrossRef] [Green Version]
Figure 1. 3D printer set-up.
Jmmp 06 00086 g001
Figure 2. (a) Material composition for a “rate of voxel” (labeled as A + AG) and binder liquid for the BJ process of MOC; (b) the powder bed has meshed with rV elements and the coordinate systems on an rV.
Jmmp 06 00086 g002
Figure 3. (a) Three-point bending test setup to measure modulus of rupture; (b) fractured specimen after testing.
Jmmp 06 00086 g003
Figure 4. Sample #11 after extrusion from the powder bed: (a) top view; (b) X–Z plane side view; (c) Z–Y planeside view (the visible layered effect is highlighted with a red band mark and black line for five bottom layers); (d) isometric view; and (e) schematic of interfaces in a printed part.
Jmmp 06 00086 g004
Figure 5. Average modulus of rupture for each run number (as in Table 5).
Jmmp 06 00086 g005
Figure 6. Quantile-quantile (q-q) plot for (a) Y0 and (b) Y90 model.
Jmmp 06 00086 g006
Figure 7. Model standardized residuals, plotted as a function of fitted values for (a) Y0, and (b) Y90 models.
Jmmp 06 00086 g007
Figure 8. Plots for the qualitative XRD analysis.
Jmmp 06 00086 g008
Figure 9. Schematics of the granule formation mechanisms: (a) spreading; (b) crater formation [51]; (c) binder liquid distribution in the powder bed [54].
Jmmp 06 00086 g009
Figure 10. Main effect plot of printing inputs for Y0.
Jmmp 06 00086 g010
Figure 11. Main effect plot of printing inputs for Y90.
Jmmp 06 00086 g011
Figure 12. (a) Particle–bond model; (b) SEM image of MOC bond between two particles.
Jmmp 06 00086 g012
Figure 13. Schematic of powder deposition mechanism, hopper and wiper blade attached to the hopper.
Jmmp 06 00086 g013
Figure 14. (a) Red boxes inside yellow frame mesh illustrate the locations of macro voids; (b) pattern of fabricated channels.
Jmmp 06 00086 g014
Figure 15. Sample #15, L = 2.5: (a) visible layering effect band is specified from surrounding, and bonded aggregates; (b) outside the light band; (c) inside the light band.
Jmmp 06 00086 g015
Figure 16. EDS line scan analysis of Mg/Si and Cl/Si ratios in the determined blue region. The horizontal scale on the right hand of each plot shows the different intensity. Results are depicted for (a) sample #15, and (b) sample #11 (as in Table 5).
Jmmp 06 00086 g016
Figure 17. Ternary phase diagram for the MOC system and the position of starting materials for two levels of amount of binder.
Jmmp 06 00086 g017
Figure 18. Interaction between AoB and L for Y0 at (a) PS = −1, (b) PS = 0, and (c) PS = +1.
Jmmp 06 00086 g018
Figure 19. Interaction between AoB and L for Y90 at (a) PS = −1, (b) PS = 0, and (c) PS = +1.
Jmmp 06 00086 g019
Table 1. Chemical composition of the liquid binder.
CompositionContent (wt%)
MgCl2.6H2O49.5
H2O49.5
Rice starch1
Table 2. Chemical composition (in weight%) of the powder bed.
CompositionContent (wt%)
Porous glass60.8
MgO36.5
Methylcellulose1.5
H3PO41.2
Table 3. Description of the binder jetting process parameters.
LabelFactorAbbreviationUnitLevelDescription
Low (−1)Center Point (0)High (+1)
AFeed RateFRmm/min720076008000velocity of the nozzle, installed on printer head, as it dispenses binder agent
BLayer Thickness Lmm22.252.5distance the printer head is raised at the start of a new layer
CAmount of Binder LiquidAoBwt%9095101relative amount of binder
DVelocity of Powder Spread Vmm/min150017502000velocity of the hopper when spreading a layer powder bed
EParticle SizePSmm(0.1–0.3)Mix *(0.25–0.5)grain sizes of porous glass aggregates
FHatch DistanceHmm11.251.5distance between successive tracks
* Mixed powder was composed of 50% fine and 50% semi-fine aggregates.
Table 4. Top rows of FFP.
RunTreatmentFactor
ABCDEF
11−1−1−1−1−1−1
22−1−1−1−1−1−1
33−1−1−1−1−1−1
411−1−1−1−11
521−1−1−1−11
631−1−1−1−11
71−11−1−1−11
82−11−1−1−11
93−11−1−1−11
10111−1−1−1−1
Table 5. Modulus of rupture for all printed samples in both loading directions.
Run NumberPrinting Input Parameters *Modulus of Rupture (MPa)
FRLAoBVPSHY0Y90
1720020.91500P01310.780.64
2800020.91500P0131.51.281.14
372002.50.91500P0131.51.341.30
480002.50.91500P01311.511.33
5720021.011500P0131.51.401.28
6800021.011500P01311.231.06
772002.51.011500P01311.131.16
880002.51.011500P0131.51.181.16
9720020.92000P0131.51.471.43
10800020.92000P01311.531.35
1172002.50.92000P01311.561.62
1280002.50.92000P0131.51.661.52
13720021.012000P01311.151.07
14800021.012000P0131.51.281.18
1572002.51.012000P0131.51.481.45
1680002.51.012000P01311.221.04
17720020.91500P2551.51.251.11
18800020.91500P25510.930.81
1972002.50.91500P25511.331.21
2080002.50.91500P2551.51.131.07
21720021.011500P25510.990.99
22800021.011500P2551.50.880.85
2372002.51.011500P2551.51.030.98
2480002.51.011500P25511.100.99
25720020.92000P25510.690.58
26800020.92000P2551.51.181.19
2772002.50.92000P2551.51.271.27
2880002.50.92000P25511.191.06
29720021.012000P2551.51.121.00
30800021.012000P25511.120.98
3172002.51.012000P25511.161.07
3280002.51.012000P2551.50.980.90
Center point76002.2511750Mix1.251.561.74
Center point76002.2511750Mix1.251.741.88
Center point76002.2511750Mix1.251.671.70
Center point76002.2511750Mix1.251.711.84
Center point76002.2511750Mix1.251.581.85
Center point76002.2511750Mix1.251.681.75
* abbreviation of printing input parameter are described.
Table 6. Three-levels DOE table for significant factors.
LabelFactorAbbreviationUnitLevel
Low (−1)Midpoint (0)High (+1)
BLayer Thickness Lmm1.522.5
CAmount of Binder LiquidAoBwt%9095101
EParticle SizePSmm(0.1–0.3)Mix(0.25–0.5)
Table 7. ANOVA table for Y0 model.
FactorDegree of FreedomSum of SquareF-ValuePr (>F)
B211.0814.54430.0003
B12.0227.04761.7 × 10−6
C10.486.45460.0131
E13.5247.19071.8 × 10−9
B:C10.364.79740.0317
B:E10.405.40340.0229
B:C:E10.405.33120.0238
Residuals735.45
Table 8. ANOVA table for Y90 model.
FactorDegree of FreedomSum of SquareF-ValuePr (>F)
B211.517.20560.0001
B10.859.78817.8 × 10−8
C10.728.29150.0056
E13.2937.76980.0027
Residuals58
Table 9. Coefficients of Y0 model.
CoefficientsEstimate
φ i 0 2.38593
φ b 0.19333
φ c 0.09444
φ e −0.25537
φ b c −0.09972
φ b e 0.10583
φ b c e 0.12875
φ b 2 −0.24556
Table 10. Coefficients of Y90 model.
CoefficientsEstimate
φ i 0 2.3796
φ b 0.2496
φ c 0.1312
φ e −0.2800
φ b 2 −0.3333
Publisher’s Note: MDPI stays neutral with regard to jurisdictional claims in published maps and institutional affiliations.

