Article

Characterization of the Interaction of Metalworking Fluids with Grinding Wheels

1
Division Manufacturing Technologies, Leibniz Institute for Materials Engineering, Badgasteiner Str. 3, 28359 Bremen, Germany
2
MAPEX Center for Materials and Processes, University of Bremen, Bibliothekstr. 1, 28359 Bremen, Germany
3
Bremen Institute for Metrology, Automation and Quality Science (BIMAQ), University of Bremen, Linzer Straße 13, 28359 Bremen, Germany
*
Author to whom correspondence should be addressed.
J. Manuf. Mater. Process. 2022, 6(3), 51; https://doi.org/10.3390/jmmp6030051
Submission received: 7 March 2022 / Revised: 4 April 2022 / Accepted: 12 April 2022 / Published: 21 April 2022
(This article belongs to the Topic Modern Technologies and Manufacturing Systems)

Abstract

:
The thermal load that occurs during grinding can be reduced with the aid of an optimized metalworking fluid (MWF) supply. In previous work, mainly the free jet was considered for the determination of the conditions required for an optimized MWF supply. An investigation of the interaction area between the MWF and the grinding wheel has not yet been carried out due to the lack of suitable measurement techniques. In the presented work, both the free jet and the interaction area are analyzed with the aid of new metrological analysis and evaluation methods based on high-speed records (shadowgraphy and shadogram imaging velocimetry) in order to assess the free jet geometry and velocities, as well as the velocity distribution and the MWF amount in the interaction area. Using this approach, the following main results were derived: (1) The free jet velocity remains approximately constant in a defined free jet cross-section even at high distances from the nozzle outlet. (2) The velocity distribution in the interaction area is mainly influenced by the flow rate. (3) A new image parameter (black pixel fraction) was derived for the evaluation of the MWF supply to the contact zone.

1. Introduction

Grinding processes are characterized by a thermomechanical load, whereby the thermal load is generally more dominant [1,2]. Thus, grinding involves an increased risk of thermal damage to the machined workpieces due to high temperatures and larger contact zones compared to other manufacturing processes. The thermal damage, commonly referred to as grinding burn, leads to the formation of tensile residual stresses or a drop in hardness in the surface layer of the ground workpieces [3,4,5,6]. Numerous approaches at minimizing the thermal effects during the grinding process can be found in the literature. Metalworking fluids (MWF) reduce the thermal load by (i) lubricating the contact zone between the grinding wheel and workpiece, thus reducing the amount of generated heat as well as (ii) cooling the tool and the workpiece by dissipating generated heat. In addition to the selection of a suitable metalworking fluid, an approach that is easy to implement even in an industrial environment and yet very effective is the optimization of the MWF supply [7,8,9,10,11]. With the help of an optimized MWF supply, a sufficient MWF supply in the contact zone should be ensured. As shown in Figure 1, a number of influencing parameters, such as the nozzle geometry, e.g., [12,13,14], the nozzle position, e.g., [15,16,17], the selected flow rate QMWF, e.g., [18,19,20], and the velocity ratio between the MWF free jet vjet and the grinding wheel velocity vs, e.g., [21,22,23], have to be taken into account in order to realize an optimized MWF supply.
The nozzle geometry determines the shape and coherence of the free jet. The free jet shape in conjunction with the free jet velocity vjet has a considerable influence on the fluid’s interaction with the grinding wheel and thus on the amount of MWF delivered to the contact zone [8]. It was shown that laminar, or at least coherent free jets, are particularly advantageous for the supply of MWF during grinding [24,25]. In order to generate such free jets, the nozzle design should avoid abrupt cross-sectional changes within the nozzle or sharp edges at the nozzle outlet [13,14]. A nozzle geometry that meets such requirements and can be used as a basis for the nozzle design was introduced by Rouse [14]. With the so-called Rouse nozzles, laminar and coherent free jets are ensured over a large distance from the nozzle outlet. The velocity of the free jet vjet depends on the nozzle geometry (outlet cross-section A), but also on the selected flow rate QMWF:
v jet = Q MWF A
In industrial practice, high flow rates are predominantly used [20,22]. However, as shown in [26,27], an increase in the flow rate at a constant jet velocity has no significant influence on the grinding process. According to [20], the highest possible minimization of the contact zone temperature is partly achieved independently of the flow rate, but above all by the correct selection of the free jet velocity. Thus, in view of increasingly strict ecological and economic requirements, significantly lower flow rates can be selected without endangering process reliability and a possible loss of workpiece quality. In general, the free jet velocity should be selected in such a way that the free jet can break through the air barrier caused by the rotation of the grinding wheel [27,28,29,30,31]. The literature does not provide a clear indication of the optimal free jet velocity or the velocity ratio between the free jet and the grinding wheel velocity, which shows that a large number of influencing parameters does not allow for any respective general statement. The differences in the velocity ratios determined in the work of [19,21,22,32], at which breakthrough of the air barrier can be ensured, are based on the specific approaches to determine the free jet velocities.
Due to the lack of suitable measuring techniques for quantifying the MWF supply, the free jet velocity was estimated according to Equation (1) directly at the nozzle outlet in the past. The velocity differences within the free jet or a drop in velocity from a certain distance from the nozzle outlet could not be determined up to now but is essential for understanding the interaction with the grinding wheel and the amount of MWF delivered into the contact zone. In the recent past, first measurement attempts for observing and quantifying the MWF supply were reported. Geilert et al. used the shadowgraphy method to visualize and compare the free jet shape during grinding. With this approach, the influence of the nozzle geometry on the flow in the free jet was investigated and it was found that a nozzle with the most coherent jet leads to better grinding results with regard to the occurrence of grinding burn [24]. Nevertheless, there is still a great need for research regarding the aim of velocity field measurement in the MWF supply. In order to obtain the first quantitative statements, the existing knowledge from flow metrology should be used to measure the velocity within flows. One established method for the quantitative measurement of flow velocity fields is particle image velocimetry (PIV). It was shown that this technique can be used to measure the velocity field in a single-phase free jet, which has many parallels to the MWF supply [33]. The first investigations of velocity field measurements during MWF supply in a grinding machine were carried out by Espenhahn et al. with particle image velocimetry (PIV) and the shadowgraph imaging velocimetry (SIV) [34].
Although there are numerous investigations on the MWF supply, these are mainly focused on the free jet. Up to now, the consideration of the interaction of the free jet with the grinding wheel and the resulting MWF supply to the contact zone is limited. In particular, the influence of parameters relevant to the MWF supply, such as flow rate, free jet velocity, and grinding wheel velocity, has not been clearly validated. Therefore, the whole path of the MWF starting from the nozzle to the contact zone is considered here. The aim is to use new metrological analysis methods to yield a better understanding of the interaction of the free jet with the grinding wheel and thus derive conclusions with regard to the most decisive factors in MWF supply.

2. Approach and Procedure

A highly systematic approach considering the path of the MWF from the nozzle outlet to the contact zone of the grinding wheel and the workpiece with the aid of new metrological analysis methods was chosen. The aim of this approach is to confirm already established knowledge regarding the MWF supply during grinding, extend it where necessary on the basis of valid data, and interpret new observations scientifically. For this purpose, not only the free jet but also the interaction area is to be examined more closely, as shown in Figure 2.
High-speed images of the free jet and the interaction area are taken under varying conditions regarding the nozzle geometry, the flow rate QMWF, and the grinding wheel velocity vs, while the distance and the orientation of the nozzle to the grinding wheel are kept constant. In a first step, the high-speed images are used to characterize the shape of the free jet and thus verify the desired coherence of the free jet. In the interaction area, possible statements on the MWF supply and distribution are derived. Based on the high-speed images, the next step is an in-depth analysis of the free jet and the interaction area using shadowgram imaging velocimetry (SIV) and shadowgraphy. In particular, the SIV measurement method has already been sufficiently investigated by Espenhahn et al. for the observation of the MWF flow during grinding and has shown the reliability with regard to the determination of the velocity field in the free jet and in the interaction area by comparison with PIV measurements [34]. By using SIV, the velocity distribution in the free jet and in the interaction area are evaluated in this paper depending on the varied parameters. Based on the shadowgraphy, the free jet geometry in the top and side view is determined. Furthermore, a suitable parameter for the evaluation of the MWF supply in the interaction area is derived by also using shadowgraphy. In order to assess the informative value of the derived parameter with regard to the MWF supply in a real grinding process, a test rig is used with which the efficiency of the MWF supply is evaluated on the basis of the temperature in the contact zone between the grinding wheel and the workpiece.

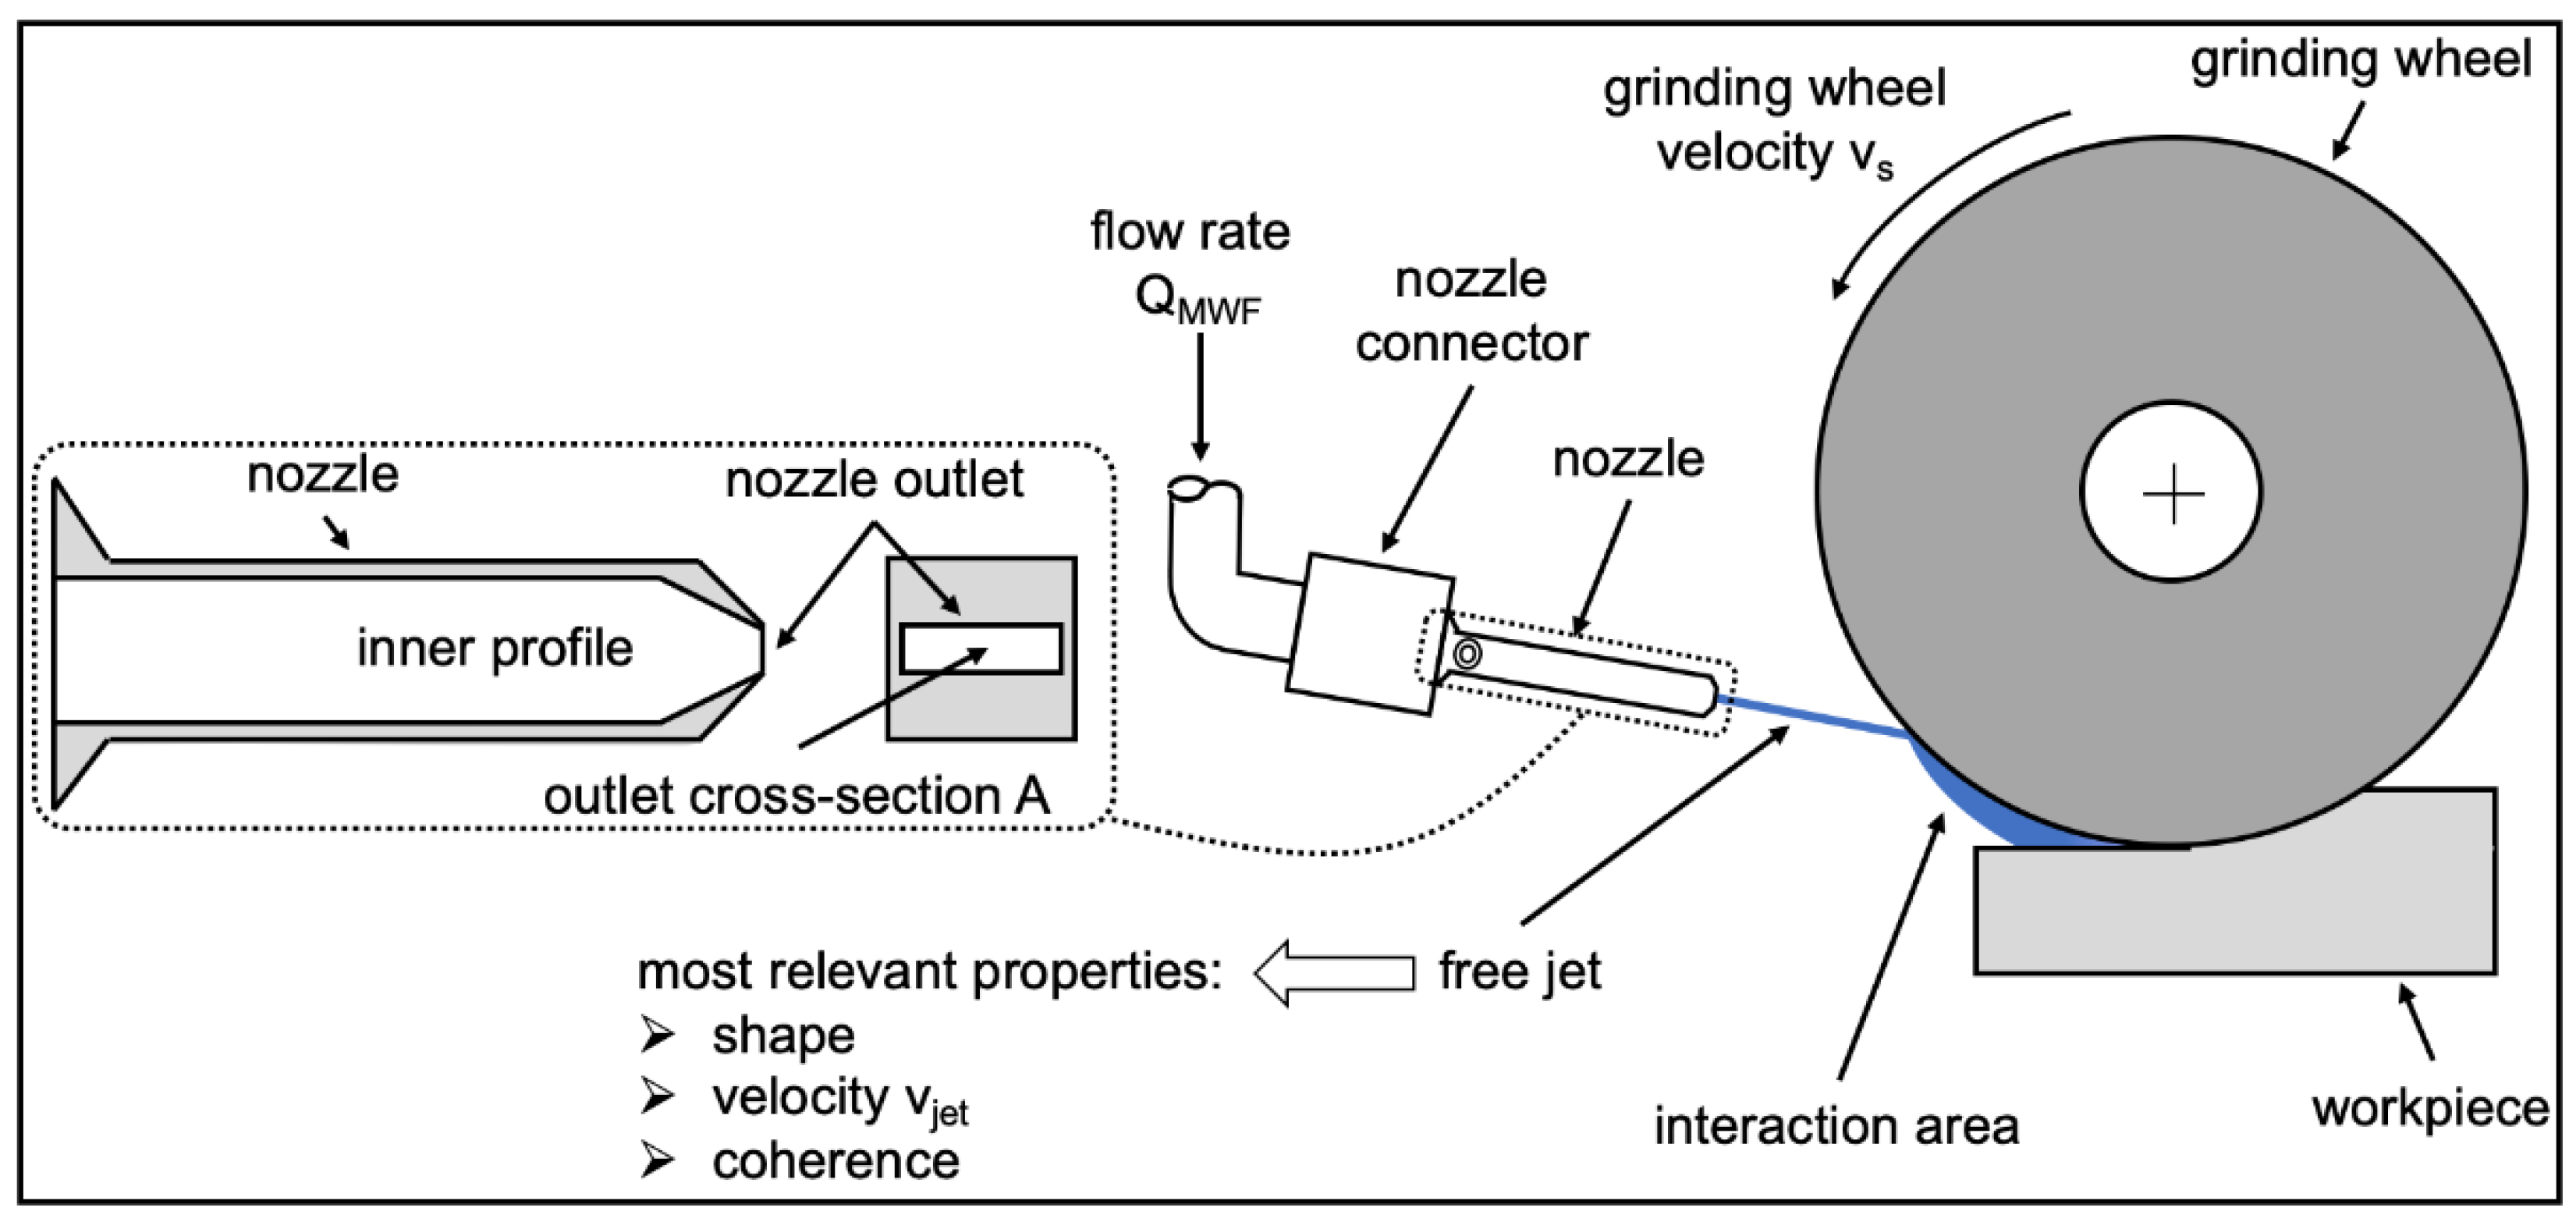
2.1. Experimental Setup

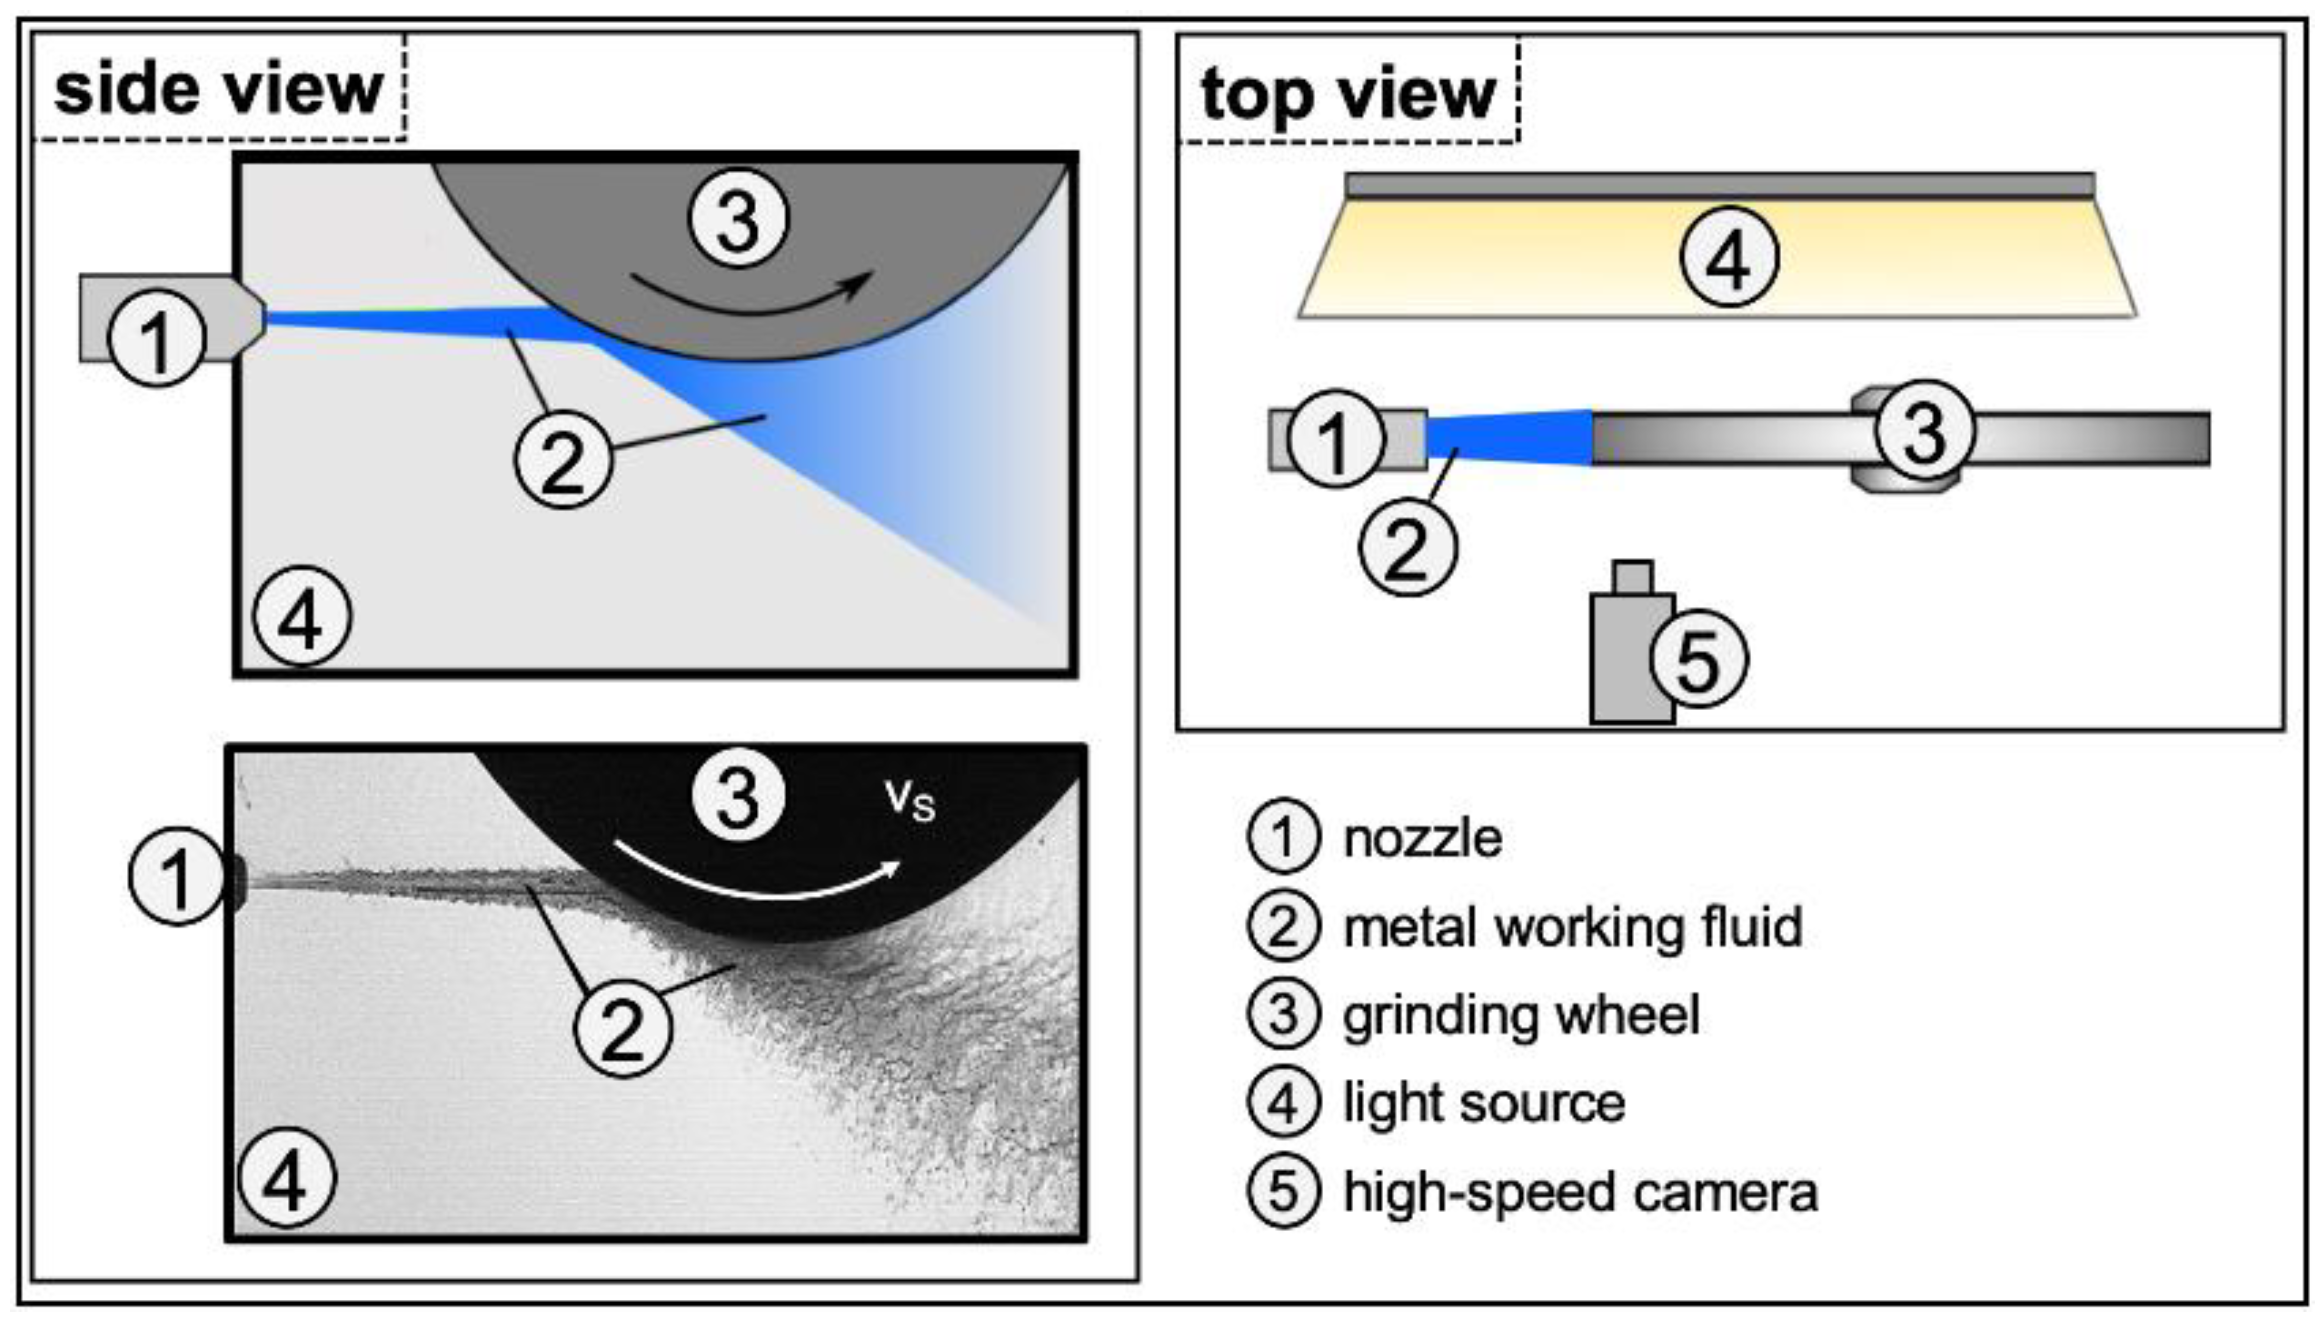
2.1.1. Setup for the High-Speed Recordings

The experimental investigations are carried out on the grinding machine type Micro-Cut A8 Unicon (Elb-Schliff Werkzeugmaschinen GmbH, Aschaffenburg, Germany). The oil-based MWF is a type PAO 2 cST (Synfluid) with a flash point of 256 °C, so that boiling of the MWF can be excluded for common grinding operations. The experimental setup is shown schematically in Figure 3. It should be noted that no workpiece is used here. The visualization of the MWF is realized by the effect of light refraction or reflection. The MWF is illuminated by the diffuse light source (LED panel in the background) and a camera on the opposite side records the resulting shadow.
The additively manufactured nozzles are aligned horizontally in the direction of the grinding wheel. A distance of 100 mm is selected between the nozzle outlet and the impact point at the grinding wheel. The grinding wheel used is a ceramic-bonded corundum grinding wheel with the specifications 9A60H16VCF2 and the dimensions of 20 × 125 × 400 mm. Images are taken with the high-speed camera Motion Pro (Imaging Solutions GmbH, Eningen, Germany), which is positioned in front of the grinding machine. In addition to the camera, a 105 mm F2.8 Ex macro lens (Sigma GmbH, Rödermark, Germany) is used.

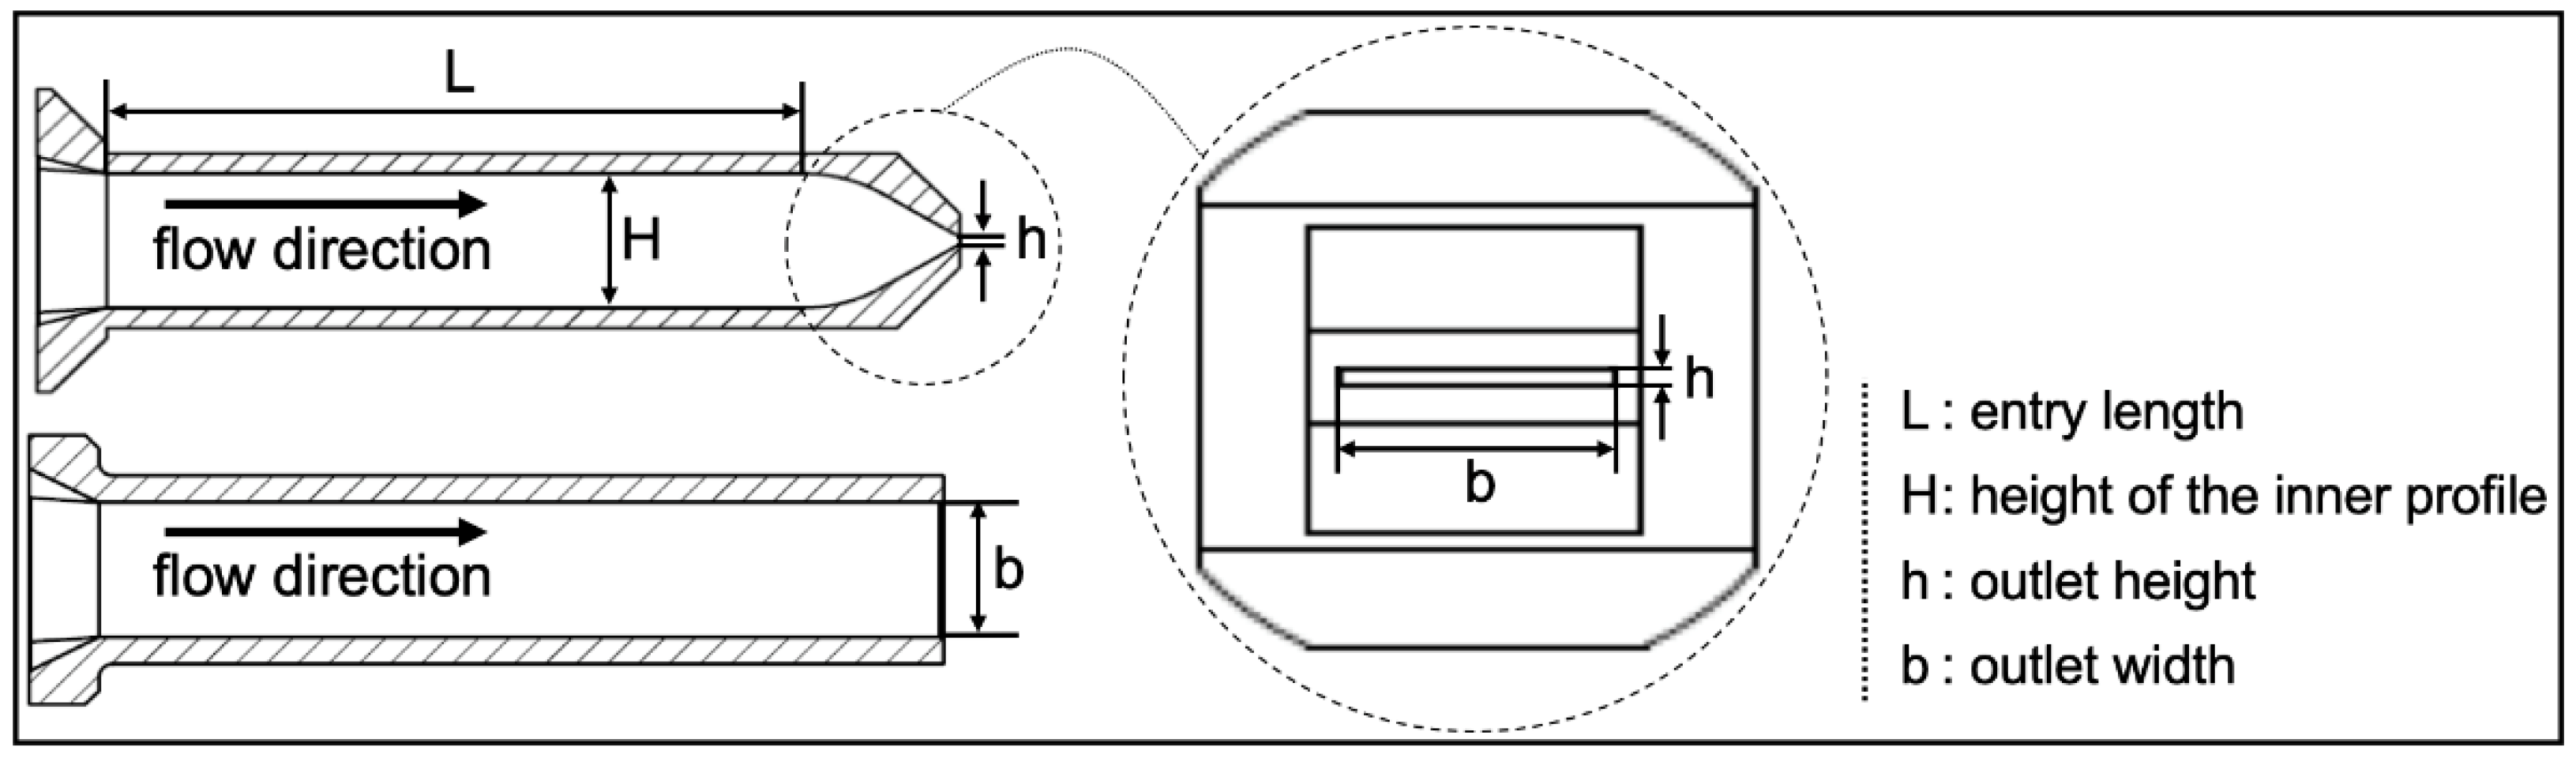
2.1.2. Nozzle Design

To generate laminar and coherent free jets, the Rouse profile is used for the nozzle design [14]. An example of a nozzle with a Rouse profile and the essential geometric parameters is shown in Figure 4. L represents the entry length, H the height of the inner profile, h the height, and b the width of the nozzle outlet.
The nozzle geometry is determined by systematically varying the entry length L, the contraction ratio CR (Equation (2)), and the aspect ratio AR (Equation (3)) while maintaining the Rouse profile.
CR = H h
AR = b h
When designing the nozzles, a value of 20 mm is chosen for the width b of the nozzle outlet, as this corresponds to the width of the used grinding wheel. The selection of the parameters AR, CR, and L is motivated by the limiting boundary conditions of the grinding machine.
A velocity ratio of 1.0 between the free jet velocity at the nozzle outlet and grinding wheel velocity is aimed for, with a maximum grinding wheel velocity of 35 m/s. Using Equation (3), an aspect ratio is calculated. Subsequently, a suitable outlet area is determined using Equation (1). With the constant width b, an aspect ratio of AR = 16 results. In order to estimate the influence of this parameter, higher and lower values are also chosen.
In the case of the contraction ratio, the interface used for the nozzle integration to the MWF supply system is the limitation. In this case, the maximum contraction ratio is CR = 16. Smaller values are selected to achieve two other values for CR.
Finally, the entry length L and thus the nozzle length is examined. Additionally, three different values are used here. A length of 100 mm is selected as the standard size.
Table 1 gives an overview of the values calculated with Equations (2) and (3) for AR and CR as well as the values chosen for L. Note that when varying the value of one parameter, the other parameters are kept constant.

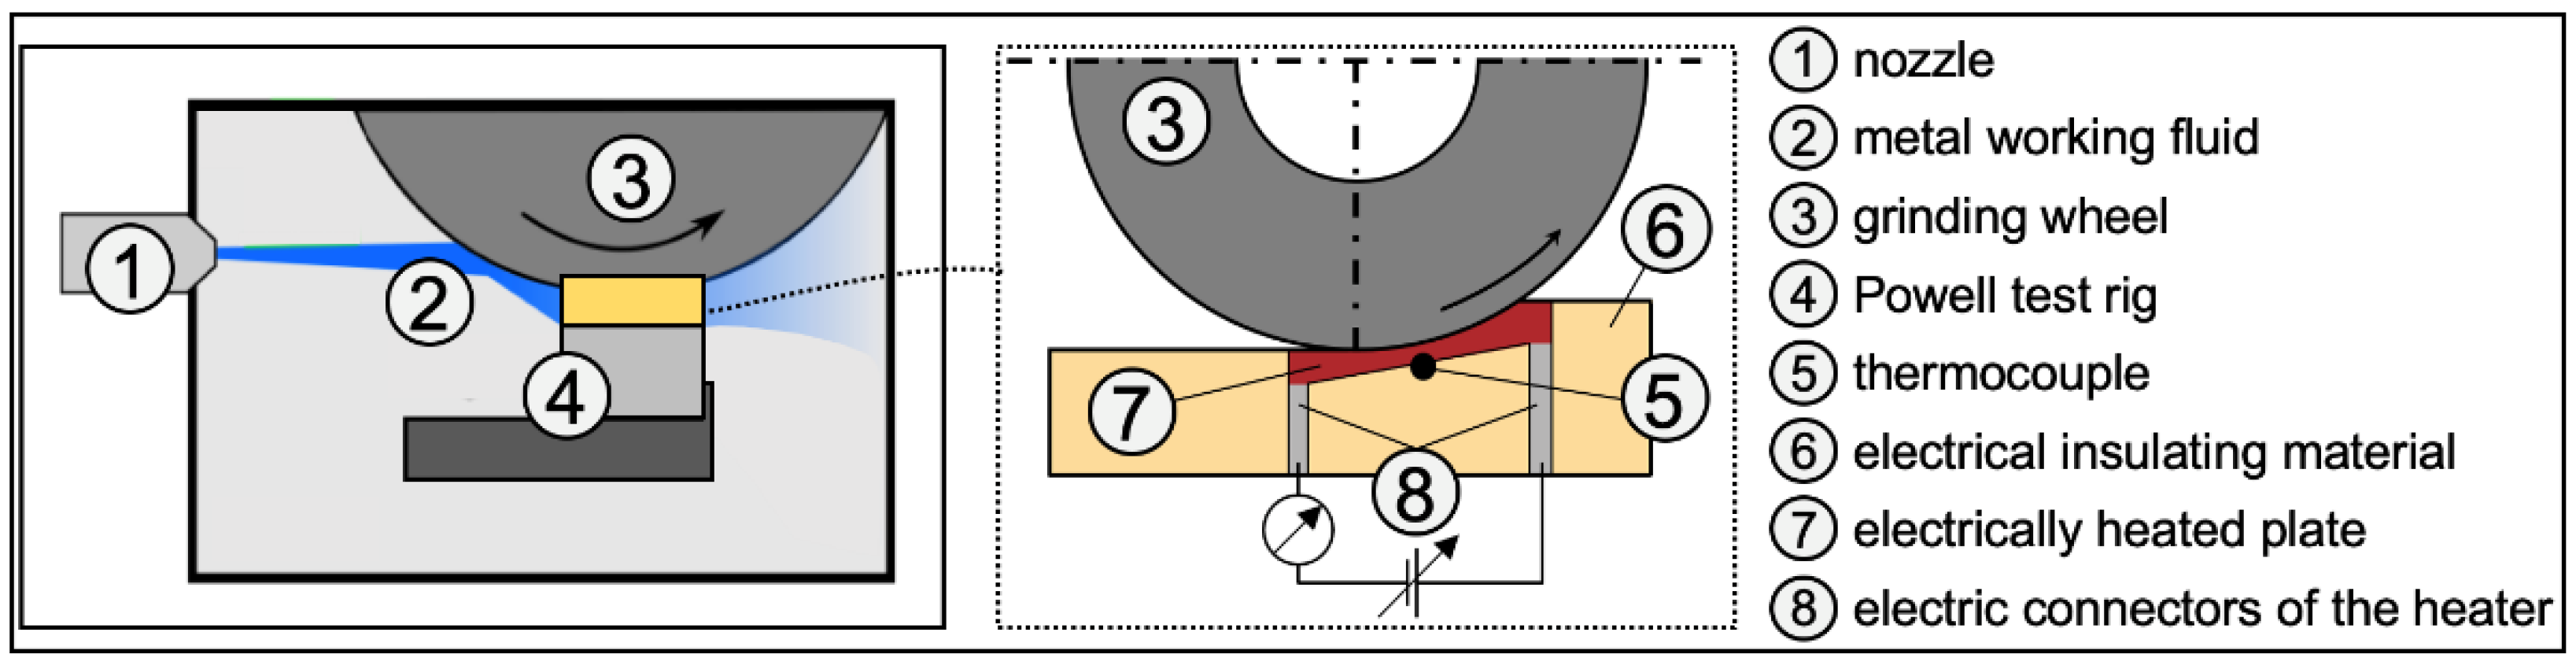
2.1.3. Setup for the Evaluation of the Cooling Capacity of the MWF Supply

The evaluation of the cooling capacity of the MWF supply is carried out by measuring the temperature in the contact zone between the grinding wheel and the workpiece in a special test rig. The test rig is shown schematically in Figure 5.
The grinding wheel is fed into an electrically heated plate. As soon as the contact zone is generated, the tangential feed speed is stopped while the grinding wheel continues to rotate at a constant velocity vs of 35 m/s. A thermocouple is located in the area of the contact zone of the heated plate to detect temperature changes. With a constant heating power, the thermocouple is able to record the temperatures resulting from varying MWF supply conditions. Note that the temperatures in the test rig are not the same as those in the real grinding process. Nevertheless, various previous studies have shown that the test rig is suitable for assessing the cooling performance under varying MWF supply [33,35,36,37,38].

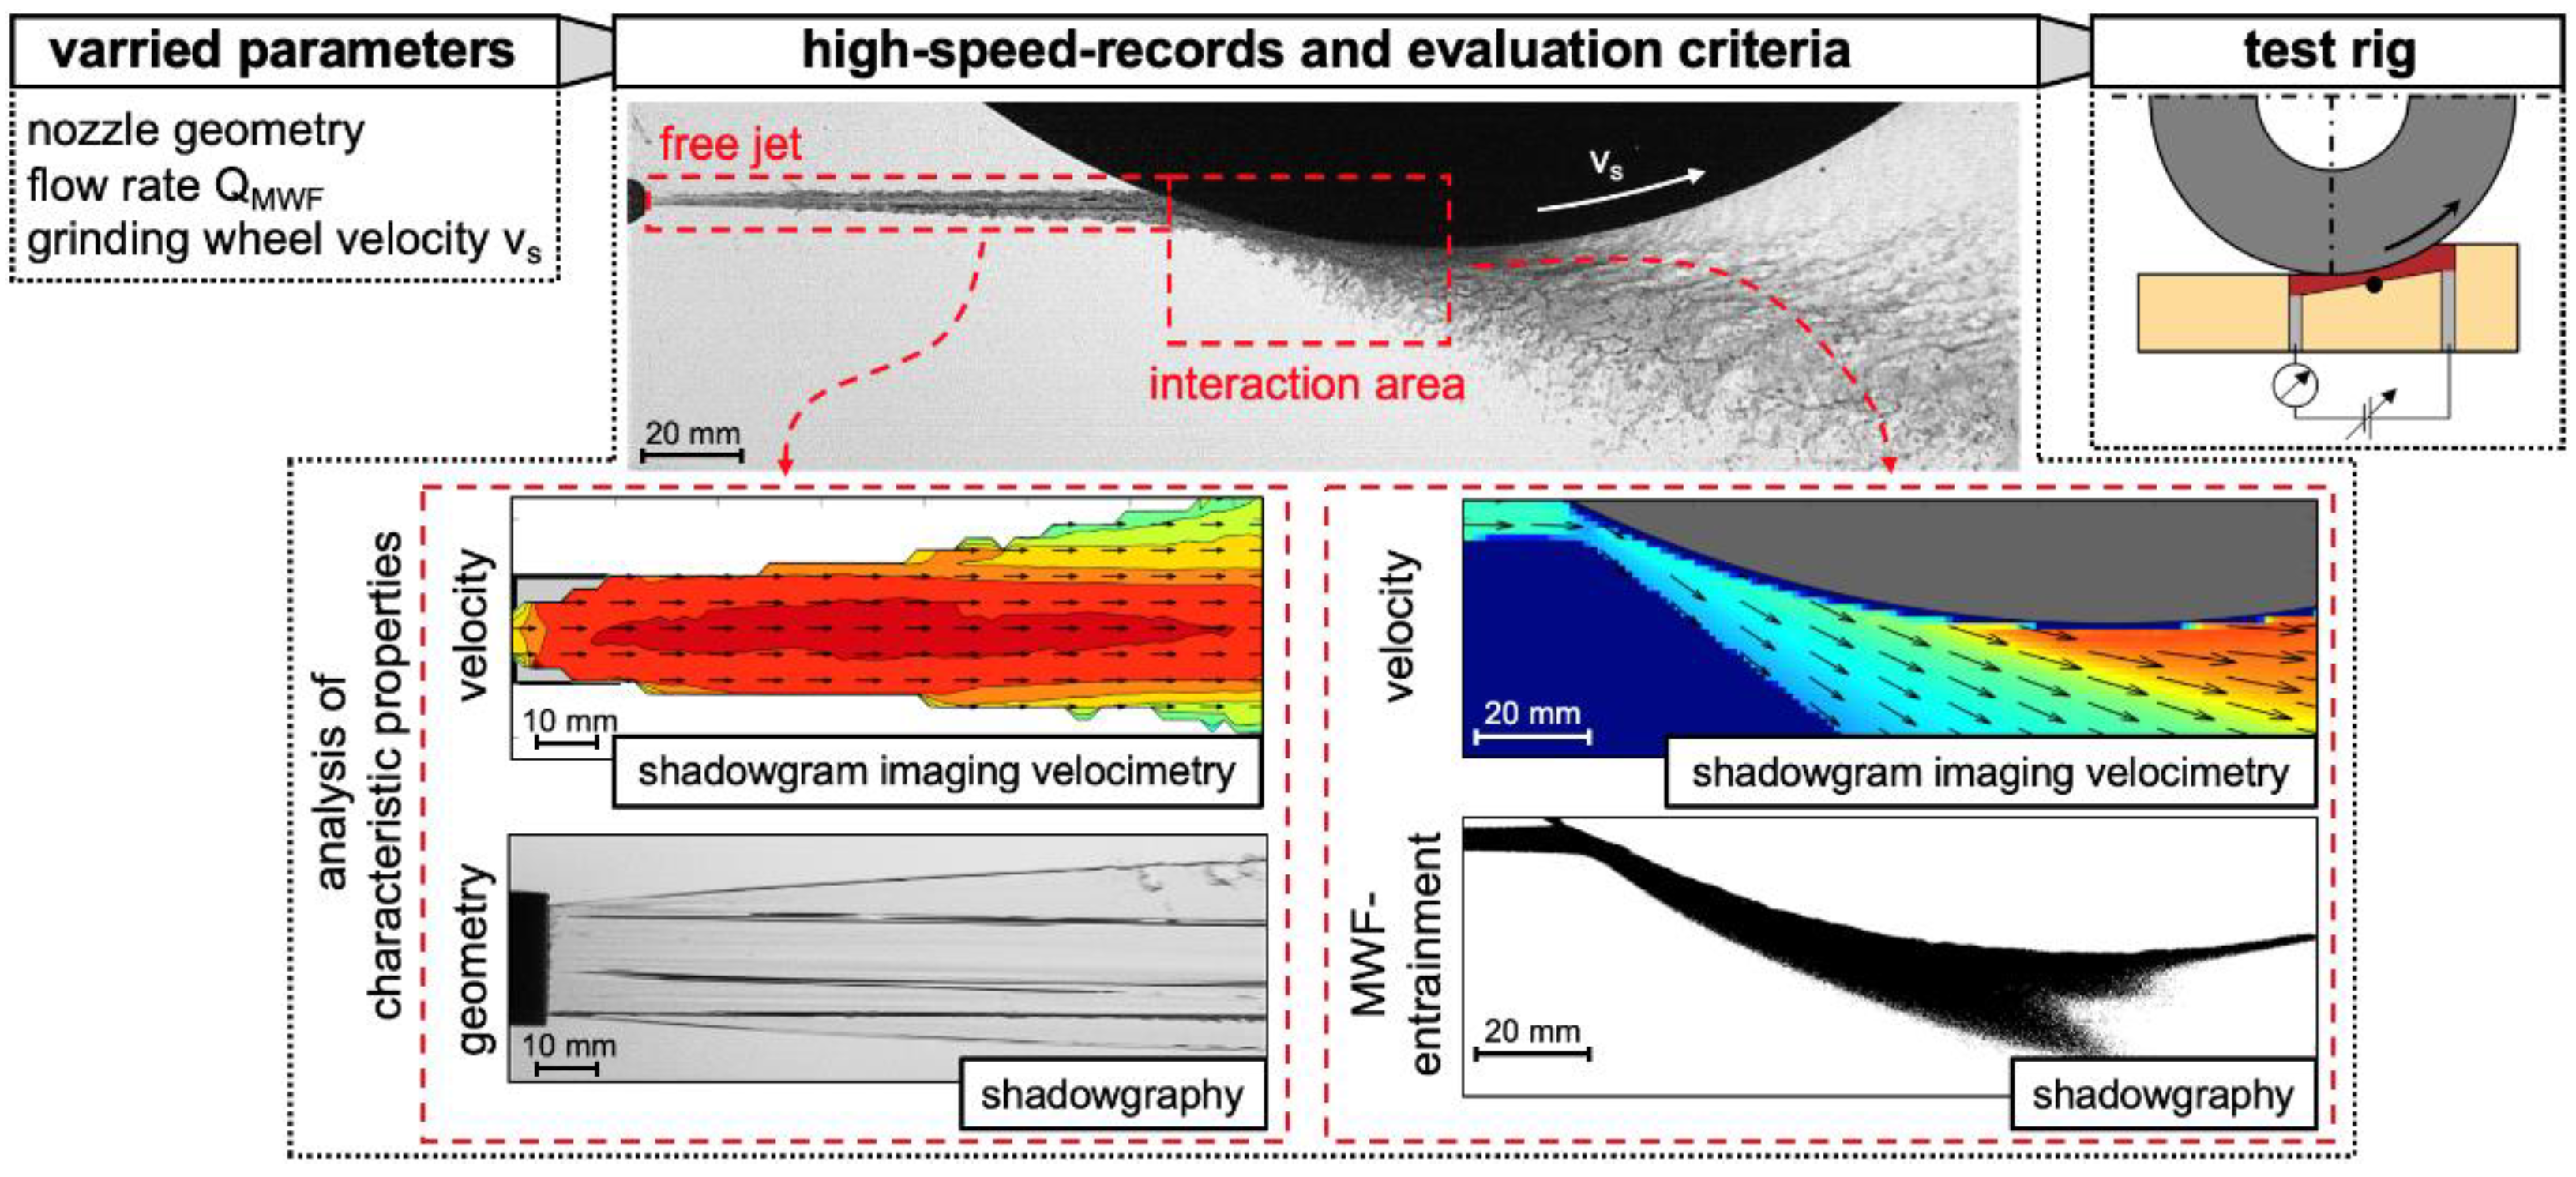
2.2. Methods of Analysis

2.2.1. Shadow Image Velocimetry

The high-speed records are used to evaluate the flow characteristics of the MWF supply. Part of the analysis is to determine the velocity distribution in the free jet and in the interaction area by correlating interrogation windows from two successive images, i.e., shadowgraph imaging velocimetry (SIV) is used here. A detailed description of SIV can be taken from [39].
SIV is an optical measurement method in which the motion of image patterns is visualized and tracked over several images to derive the velocities in the free jet. By using a cross-correlation for the interrogation windows across the different images, the distances traveled by the image patterns in each interrogation window are determined. The resulting distances are then divided by the time difference between the images to obtain the MWF velocity distribution. The cross-correlations are performed for interrogation windows with an overlap of 75% for a query area of 32 pixels × 32 pixels. Indeed, the basic idea of the SIV method is very similar to that of PIV. The differences are to be found especially in the fact that with SIV no depth information is recorded and a superposition of inhomogeneous structures in the flow from different depths can not be separated. This is not a problem in the present work since no significant depth information is required. Furthermore, Espenhahn et al. have shown that the results from the SIV have a good agreement with those from the PIV [39], which holds for both the free jet and the interaction area.

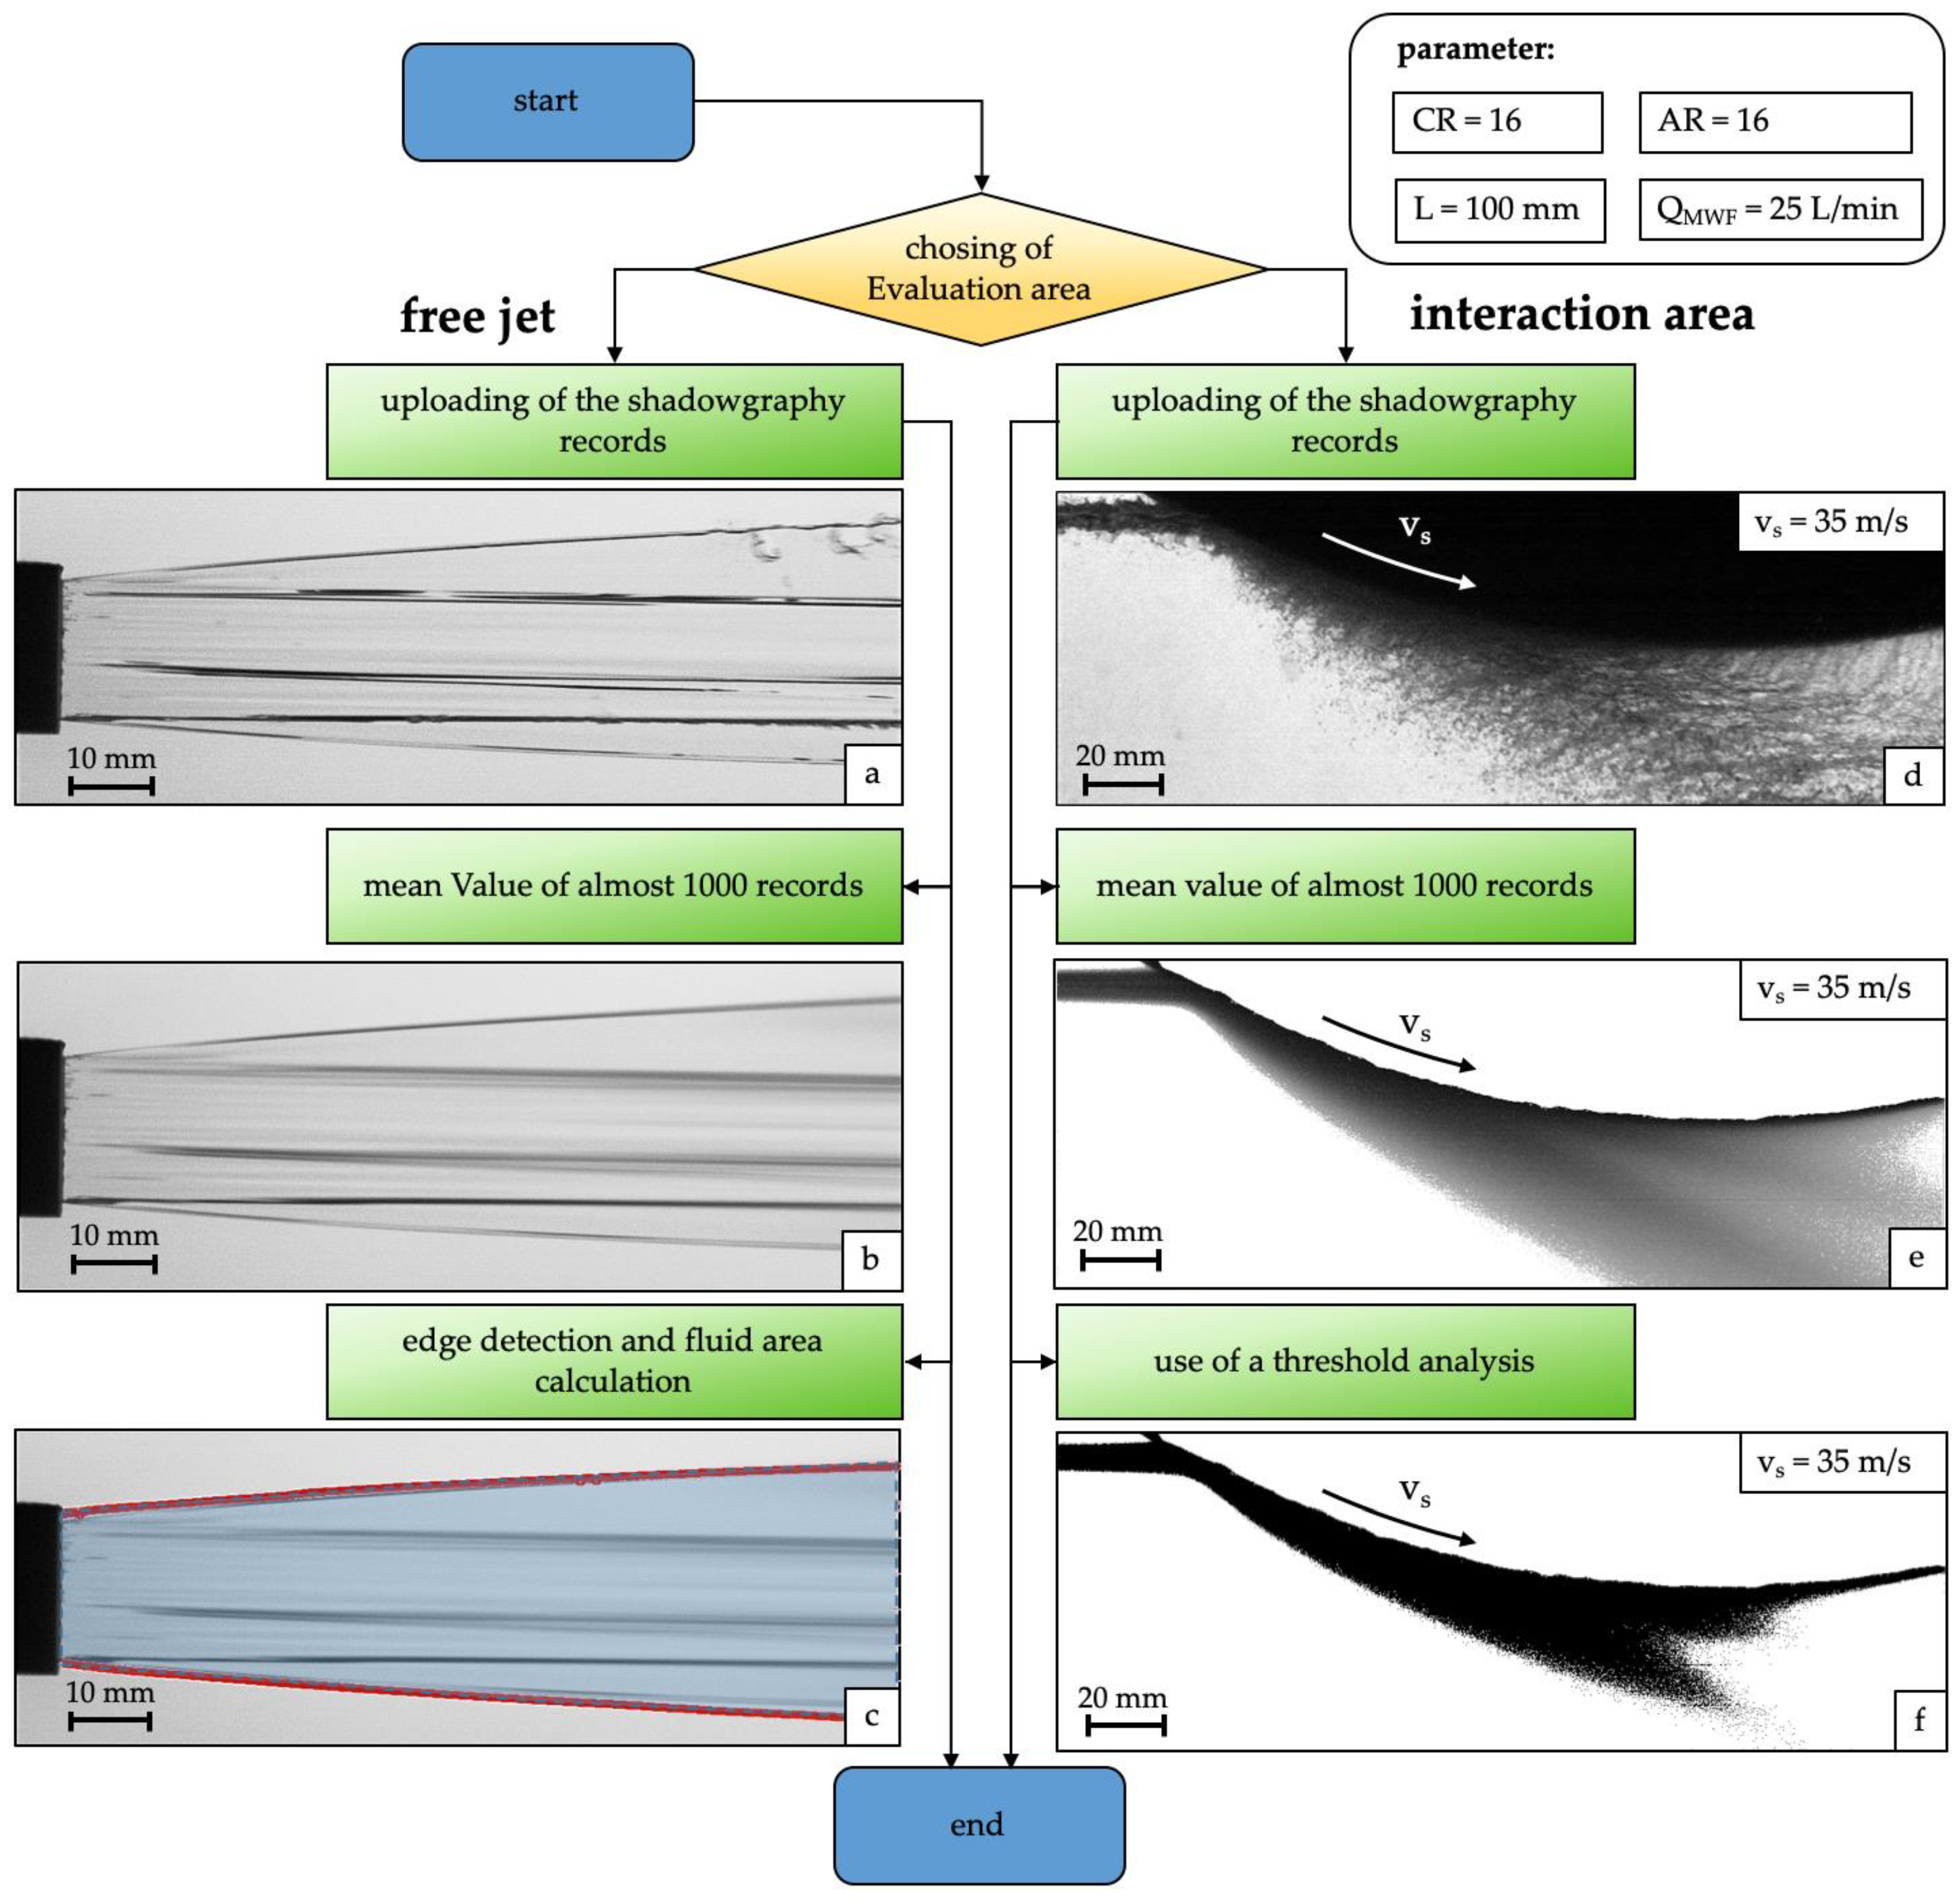
2.2.2. Processing of the Shadowgraphy Recordings

Figure 6 shows the example images of the free jet and the interaction area as well as the individual steps for the evaluation of the images. The left side of Figure 6 shows the evaluation of the free jet (Figure 6a–c) and the right side the evaluation of the interaction area (Figure 6d–f). For both the free jet and the interaction area, about 1000 images are taken with the high-speed camera at the beginning of a process. Then, these images are averaged over their greyscale value to remove random events (Figure 6b,e). In the interaction area, an image without liquid is additionally subtracted from the averaged image with MWF to eliminate the influence of the background and especially the grinding wheel (Figure 6e). Depending on the evaluation object, different strategies are followed after averaging. In the further evaluation of the free jet, the area enclosed by the edges of the free jet is determined. For this purpose, edge detection based on the Canny algorithm is applied to the averaged image of the MWF [40]. The detected edges of the free jet are used to calculate the area covered by the MWF. Here, an integral approach is used in which the areas below the edges are determined. The calculation uses a fixed distance from the nozzle outlet to 100 mm of the free jet. This constant distance ensures the comparability of the varied parameters. The calculated areas below the edges are then subtracted from each other, resulting in the area covered by the MWF (Figure 6c). This evaluation procedure is used to determine the area for the top view Atop as well as for the side view Aside (Figure 7). Finally, an evaluation range is defined for the interaction area, which allows a threshold analysis to be carried out. Here, only certain grey values in the selected interval are mapped (Figure 6f).

3. Results

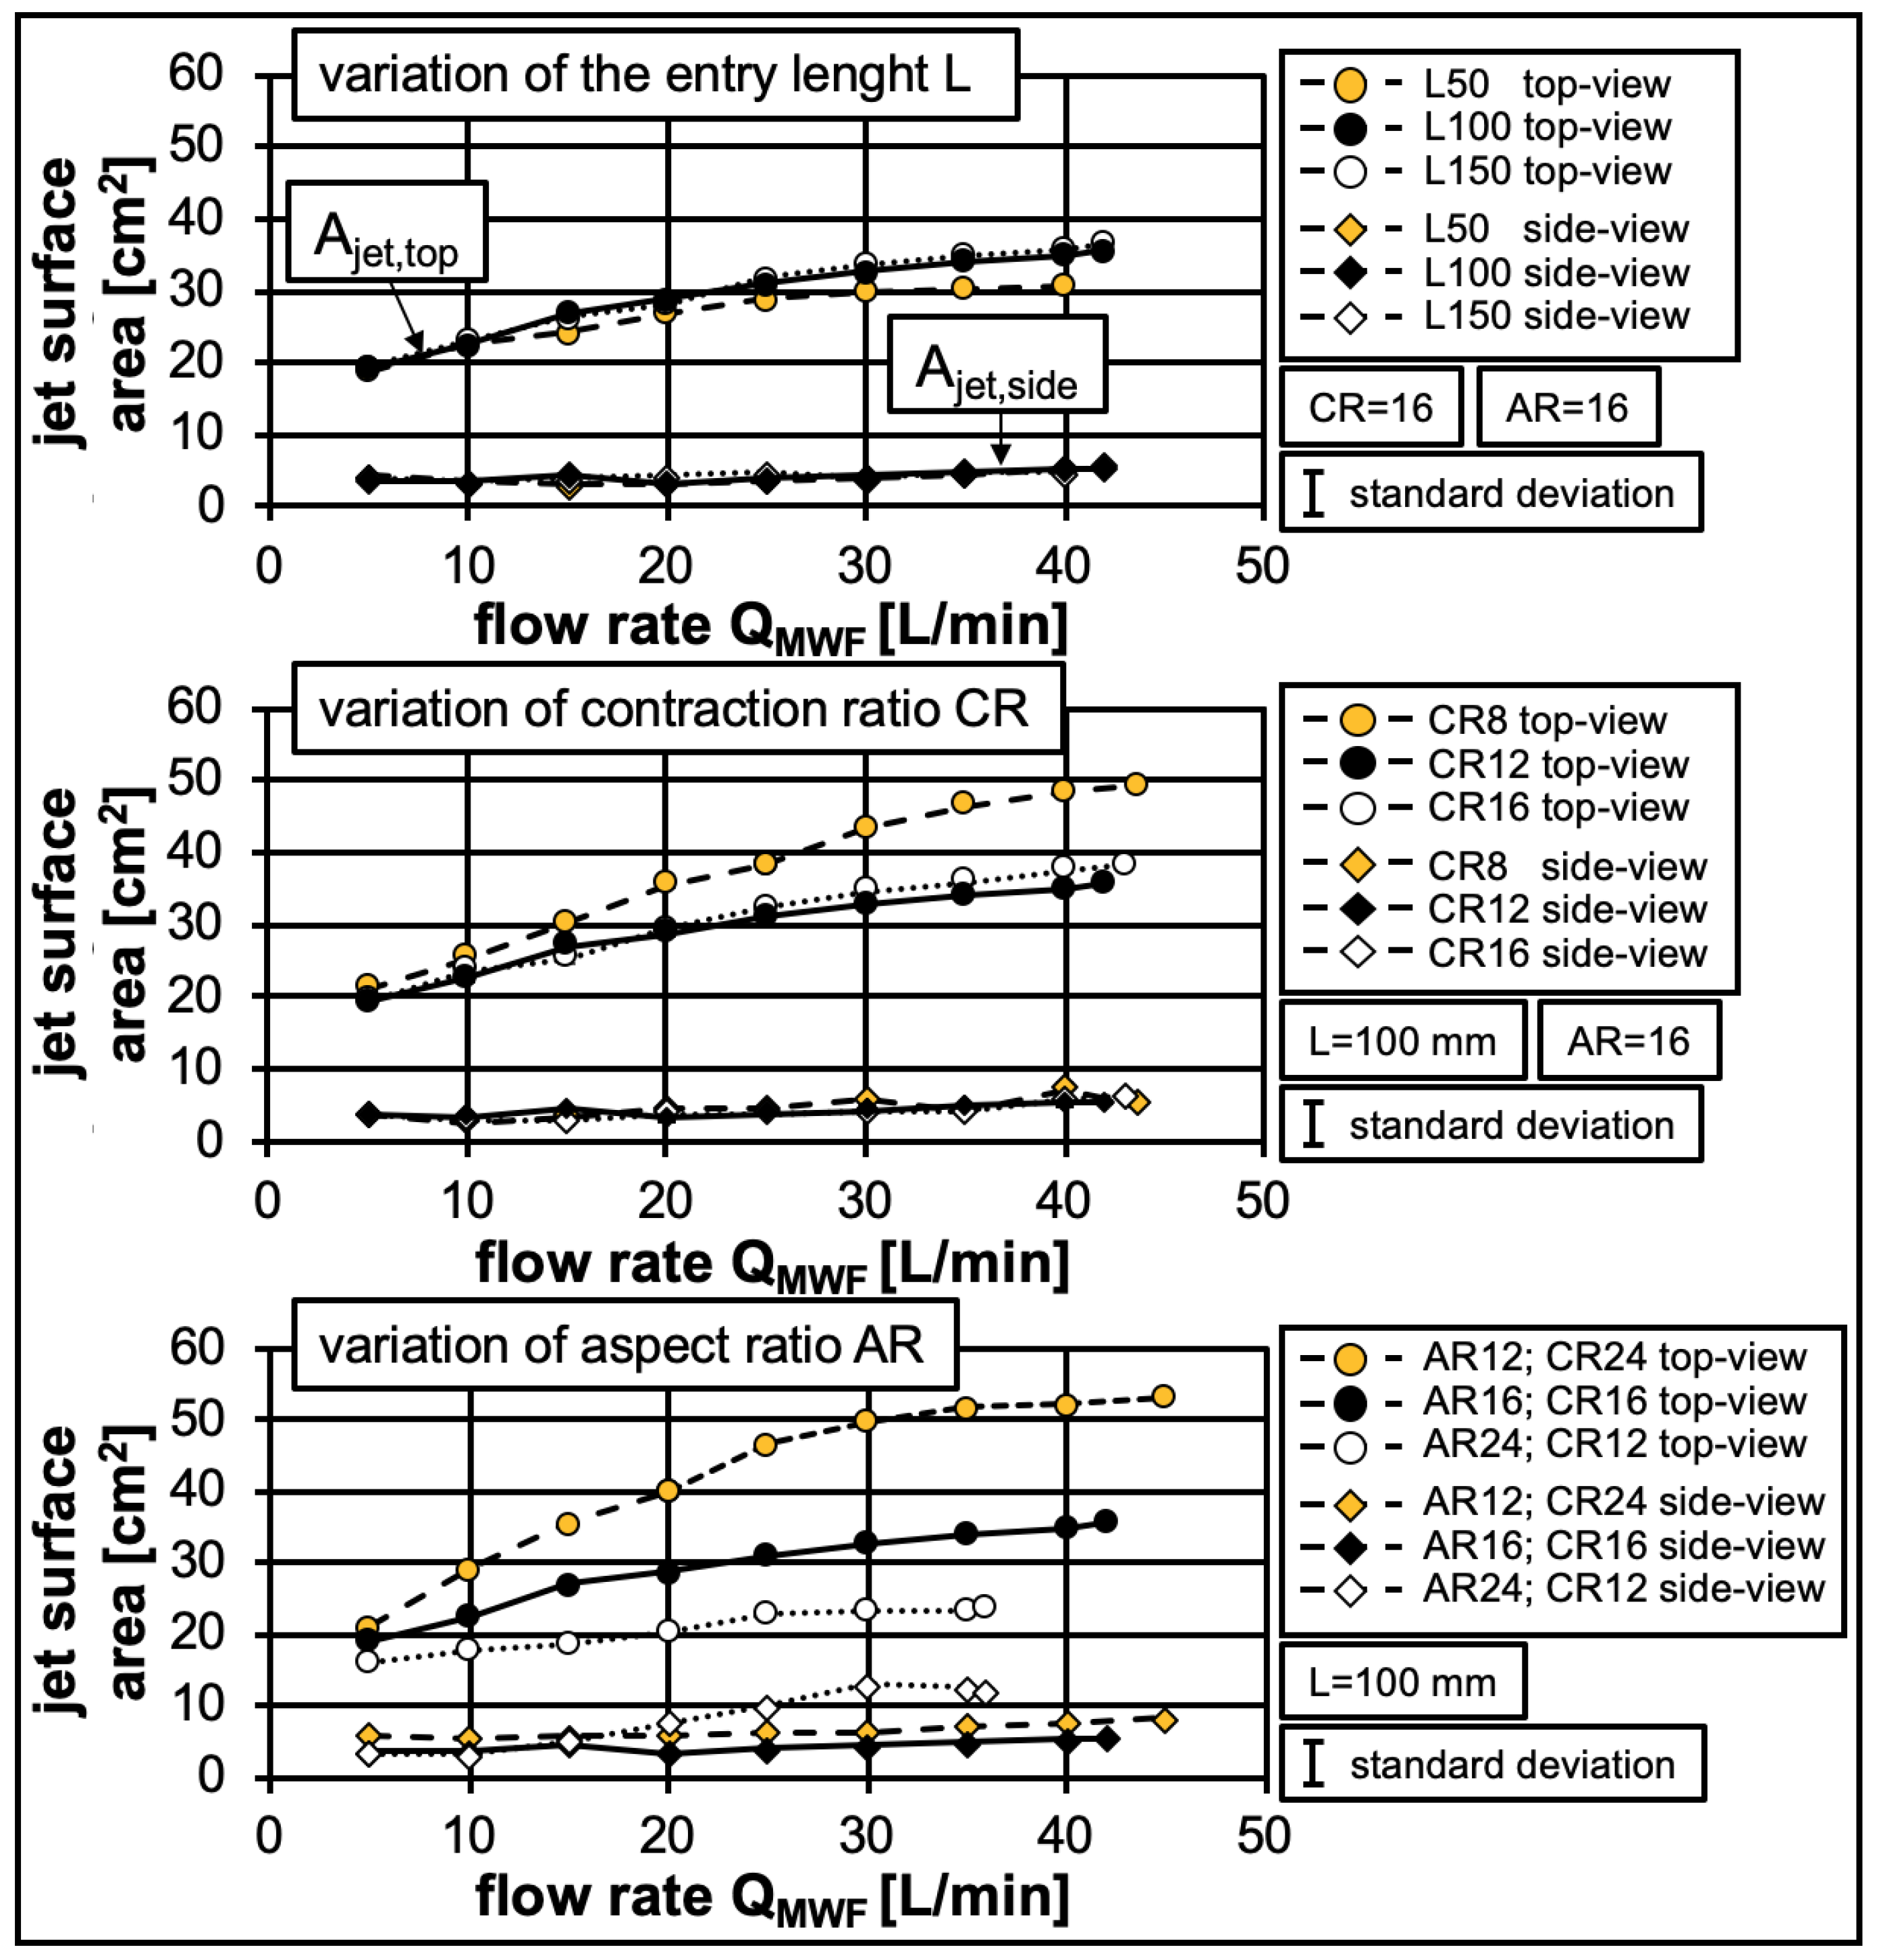
3.1. Free Jet—Geometry

As already described in the literature, the free jet widens with increasing distance from the nozzle outlet (Figure 7). In addition to the widening of the free jet, Figure 7 shows the images taken using shadowgraphy in the area of the free jet in the top view Atop and in the side view Aside. The evaluation of the jet geometry from the shadowgraphy is carried out as described in Section 2.2. The influences of the entry length L, the contraction ratio CR, and the aspect ratio AR on the free jet surface area are shown in Figure 8 over the flow rate QMWF.
A noticeable influence on the area from the side view Aside can not be detected even with increasing flow rates. This means that the free jet fans out laterally and not vertically. A slight influence can only be observed with a variation of the aspect ratio. The almost constant area from the side view confirms that, as intended, a laminar and coherent free jet has formed due to the Rouse profile used. With regard to the area from the top view Atop, an influence of the aspect ratio can be determined. This is due to the fact that a change in the aspect ratio means a change in the nozzle outlet geometry (see Equation (3)) and thus, according to Equation (1), a change in the free jet velocity, which has a direct influence on the jet expansion. However, an influence of the entry length and the contraction ratio can also be determined, although both parameters should have no significant influence on the free jet velocity due to a constant nozzle outlet geometry. In the case of the contraction ratio (see Equation (2)), this can be explained by the varying inner channel height H compared to a constant outlet height h. This results in different Reynolds values inside the nozzle. As a result, varying Reynolds values are present at different places in the nozzle, which in turn represent a measure of the turbulence. Thus, the Reynolds values decrease with increasing inner channel height, which in turn leads to lower turbulence inside the nozzle and to lower free jet expansion. In addition, the results allow the assumption that a larger contraction leads to a better laminarization of the free jet [25]. The influence of the entry length can be explained by the friction loss. Due to the longer nozzle entry, energy is lost due to friction at the wall [25]. This energy loss causes the jet to break up earlier, since less energy is available for the cohesion of the jet, which results in a noticeable jet expansion.

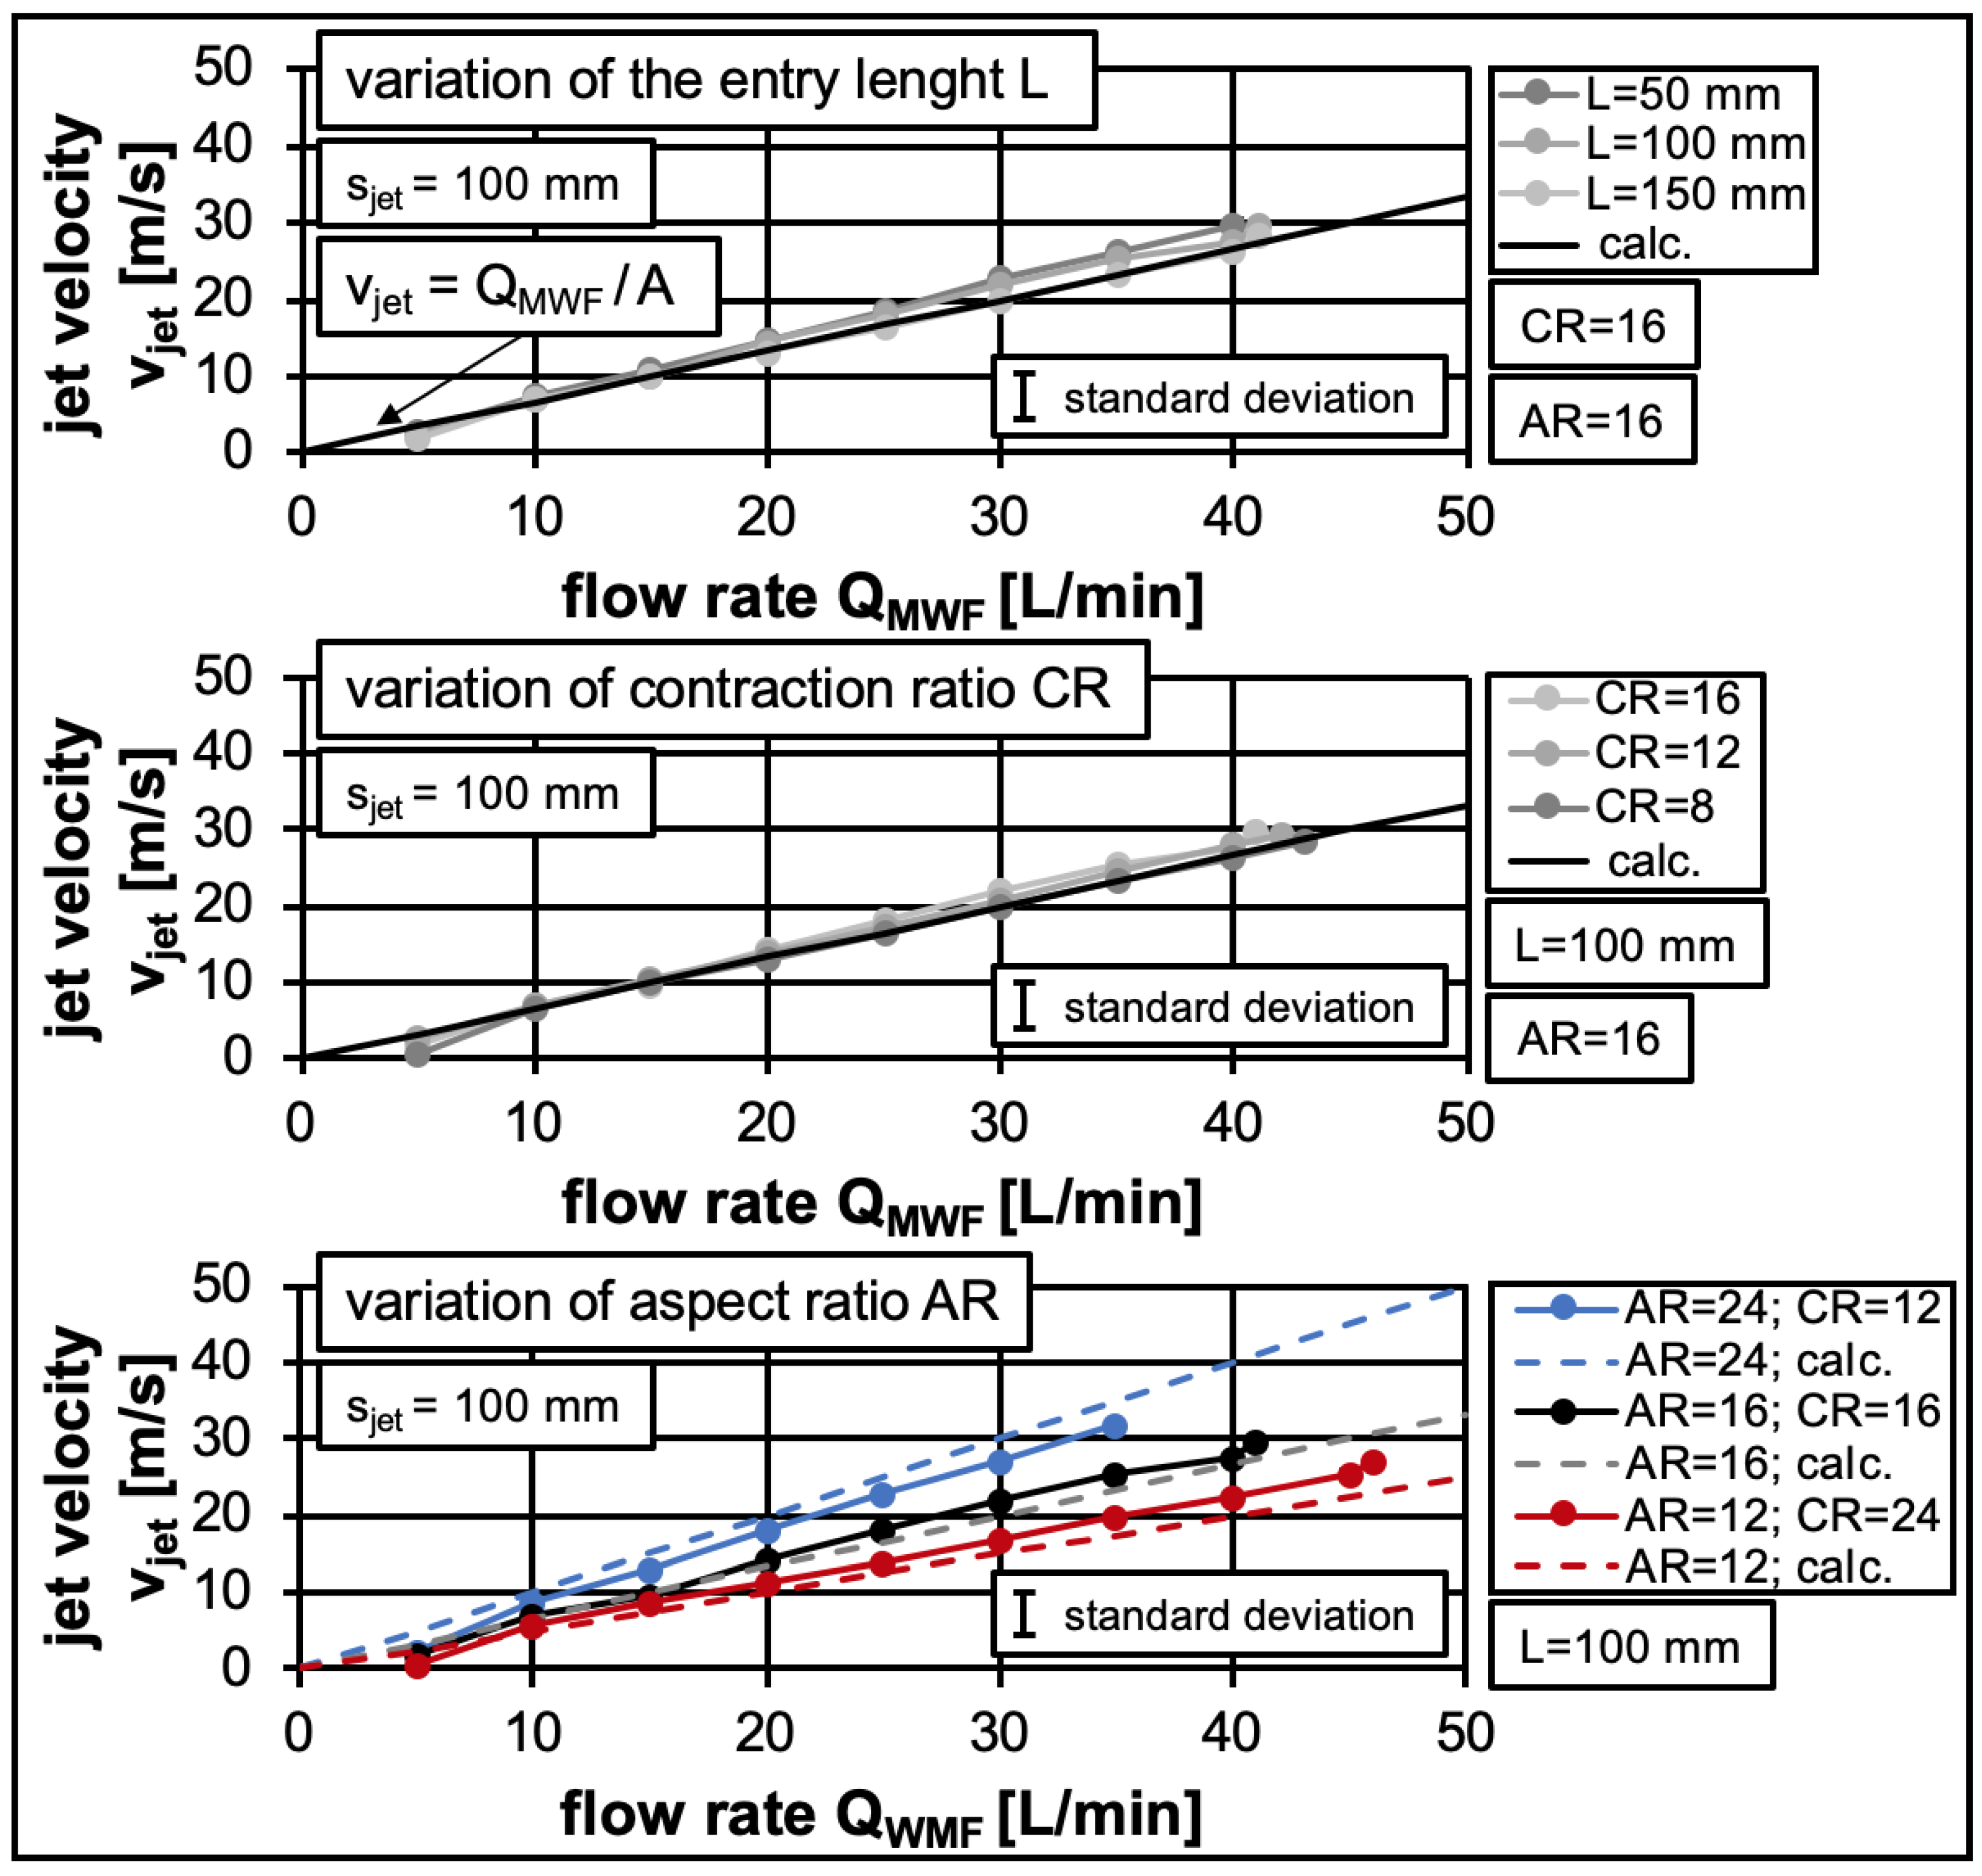
3.2. Free Jet—Velocity Distribution

With the help of the high-speed recordings, not only the free jet geometry but also the velocity distribution within the free jet was determined by means of SIV. An example of a high-speed image, and the velocity distribution calculated from it for a flow rate QMWF of 35 L/min, are shown in Figure 9. The velocities within the free jet are indicated by the different colors and the flow direction by the arrows. Up to a distance sjet of 20 mm from the nozzle outlet, the velocity distribution could not be fully evaluated for the entire free jet width due to the lack of traceable image patterns in the free jet, which are essential for the SIV principle (see Section 2.2).
Free jet expansion occurs with increasing distance sjet. Due to the free jet expansion and the interaction of the free jet with the ambient air, the velocities at the free jet edge are lower than in the free jet’s core. For the following evaluation of the mean velocity in the free jet, a free jet width of 20 mm is referred to, since a grinding wheel with a width of 20 mm was also used for the investigations and therefore the velocity of the free jet in this area is of particular interest (see Figure 9). Especially after a distance of 100 mm, the increase in the free jet width and the lower velocities at the free jet edge are clearly visible. Nevertheless, it appears that at distances lower than 100 mm, there is an approximately constant jet velocity in the relevant free jet area. To verify this, the jet velocity in the relevant free jet area and over the entire free jet width is determined at different distances. The obtained results for a flow rate of 35 L/min are shown in Figure 10. In addition, the jet velocity calculated according to Equation (1) is plotted.
Despite the expansion of the free jet visible in Figure 9, the jet velocity in the relevant free jet area remains approximately constant with increasing distance from the nozzle outlet. Likewise, no significant deviation between the measured and the calculated free jet velocity is detected. Based on these results, it is concluded that the free jet velocity at the point of impact of the grinding wheel corresponds approximately to the free jet velocity at the nozzle outlet. In comparison, the velocities determined over the entire free jet width are lower, beginning from a distance of 60 mm. This is due to the decreasing jet velocity in the edge area of the free jet (see Figure 9). Here, the influence of the approach on the determination of the free jet velocity becomes clear. It is therefore not surprising that different values can be found in the literature [19,21,22,39] for the velocity ratio between the grinding wheel and the free jet velocity, at which an optimized MWF supply into the contact zone is present, since different free jet velocities were determined according to the selected approach.
As a result of Figure 10, a sufficient estimation of the free jet velocity can be made with the aid of Equation (1) for the present conditions. In order to verify this for different nozzle geometries and supply conditions, the influences of the entry length L, the contraction ratio CR, and the aspect ratio AR, as well as a varying flow rate QMWF on the free jet velocity at a distance sjet of 100 mm from the nozzle outlet, are shown in Figure 11. In addition, the jet velocity calculated with Equation (1) is plotted.
Both the entry length and the contraction ratio have no discernible influence on the free jet velocity. This confirms the assumption that the influence of these parameters on the free jet expansion found in Figure 8 is due to the occurrence of turbulence and friction within the nozzle. The velocity determined with the help of the SIV corresponds approximately to the calculated free jet velocity. In contrast, a noticeable and expected influence is observed when varying the aspect ratio. As already described, this is due to the change in the nozzle outlet geometry (see Equation (3)), which influences the free jet velocity according to Equation (1). However, even here there are only minor differences between the measured and calculated velocities, with the biggest deviation at an aspect ratio of 24. This could indicate that if the outlets are too thin, other effects such as an increasing influence of friction affects the exit velocity. The good agreement between the calculated and measured values proves that the applied measuring method and the evaluation can accurately represent the conditions in the free jet, although the observed effects such as the free jet expansion are not taken into account in Equation (1). Hence, the calculated free jet velocity corresponds to the actual free jet velocity in the relevant free jet area, while the overall mean velocity across the jet width deviates, see Figure 10. This important finding follows from the free jet shape shown in Figure 9. There are no significant velocity changes in the relevant free jet area since deviations from a coherent jet occur at a distance of 120 mm from the nozzle outlet. Note, however, that the observations made here can not be applied without restrictions to other nozzle geometries or free jet shapes.

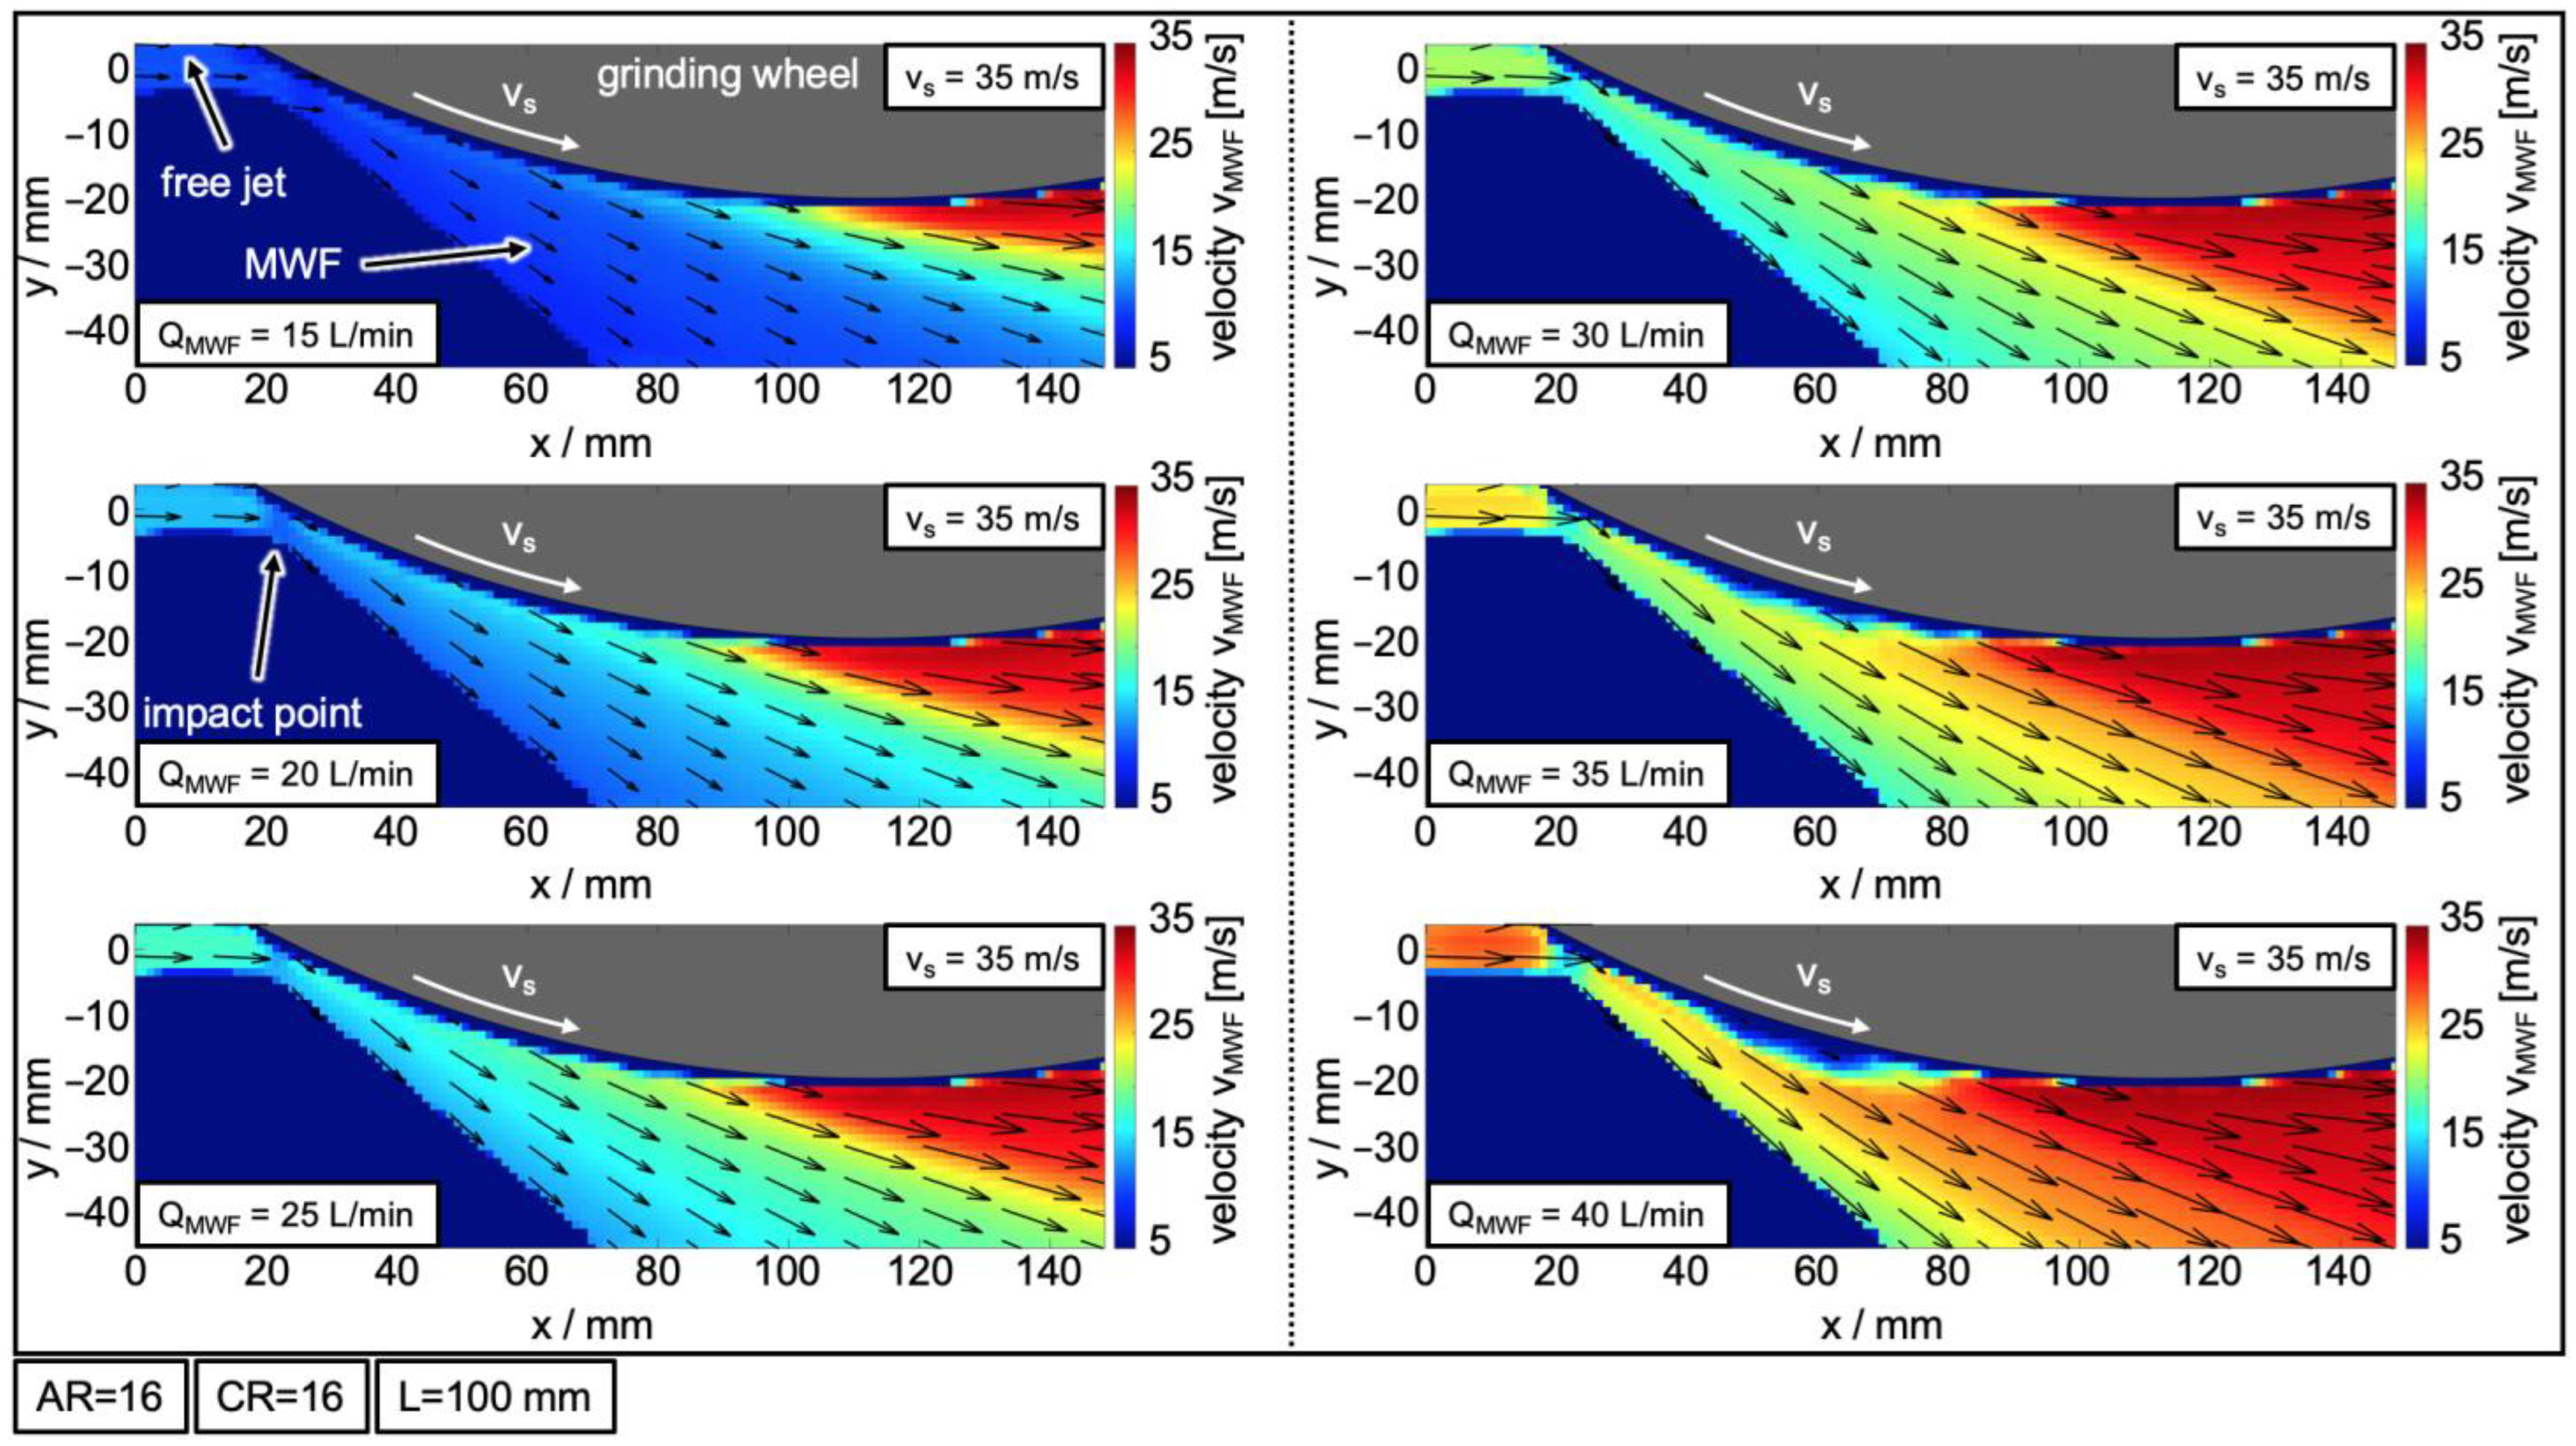
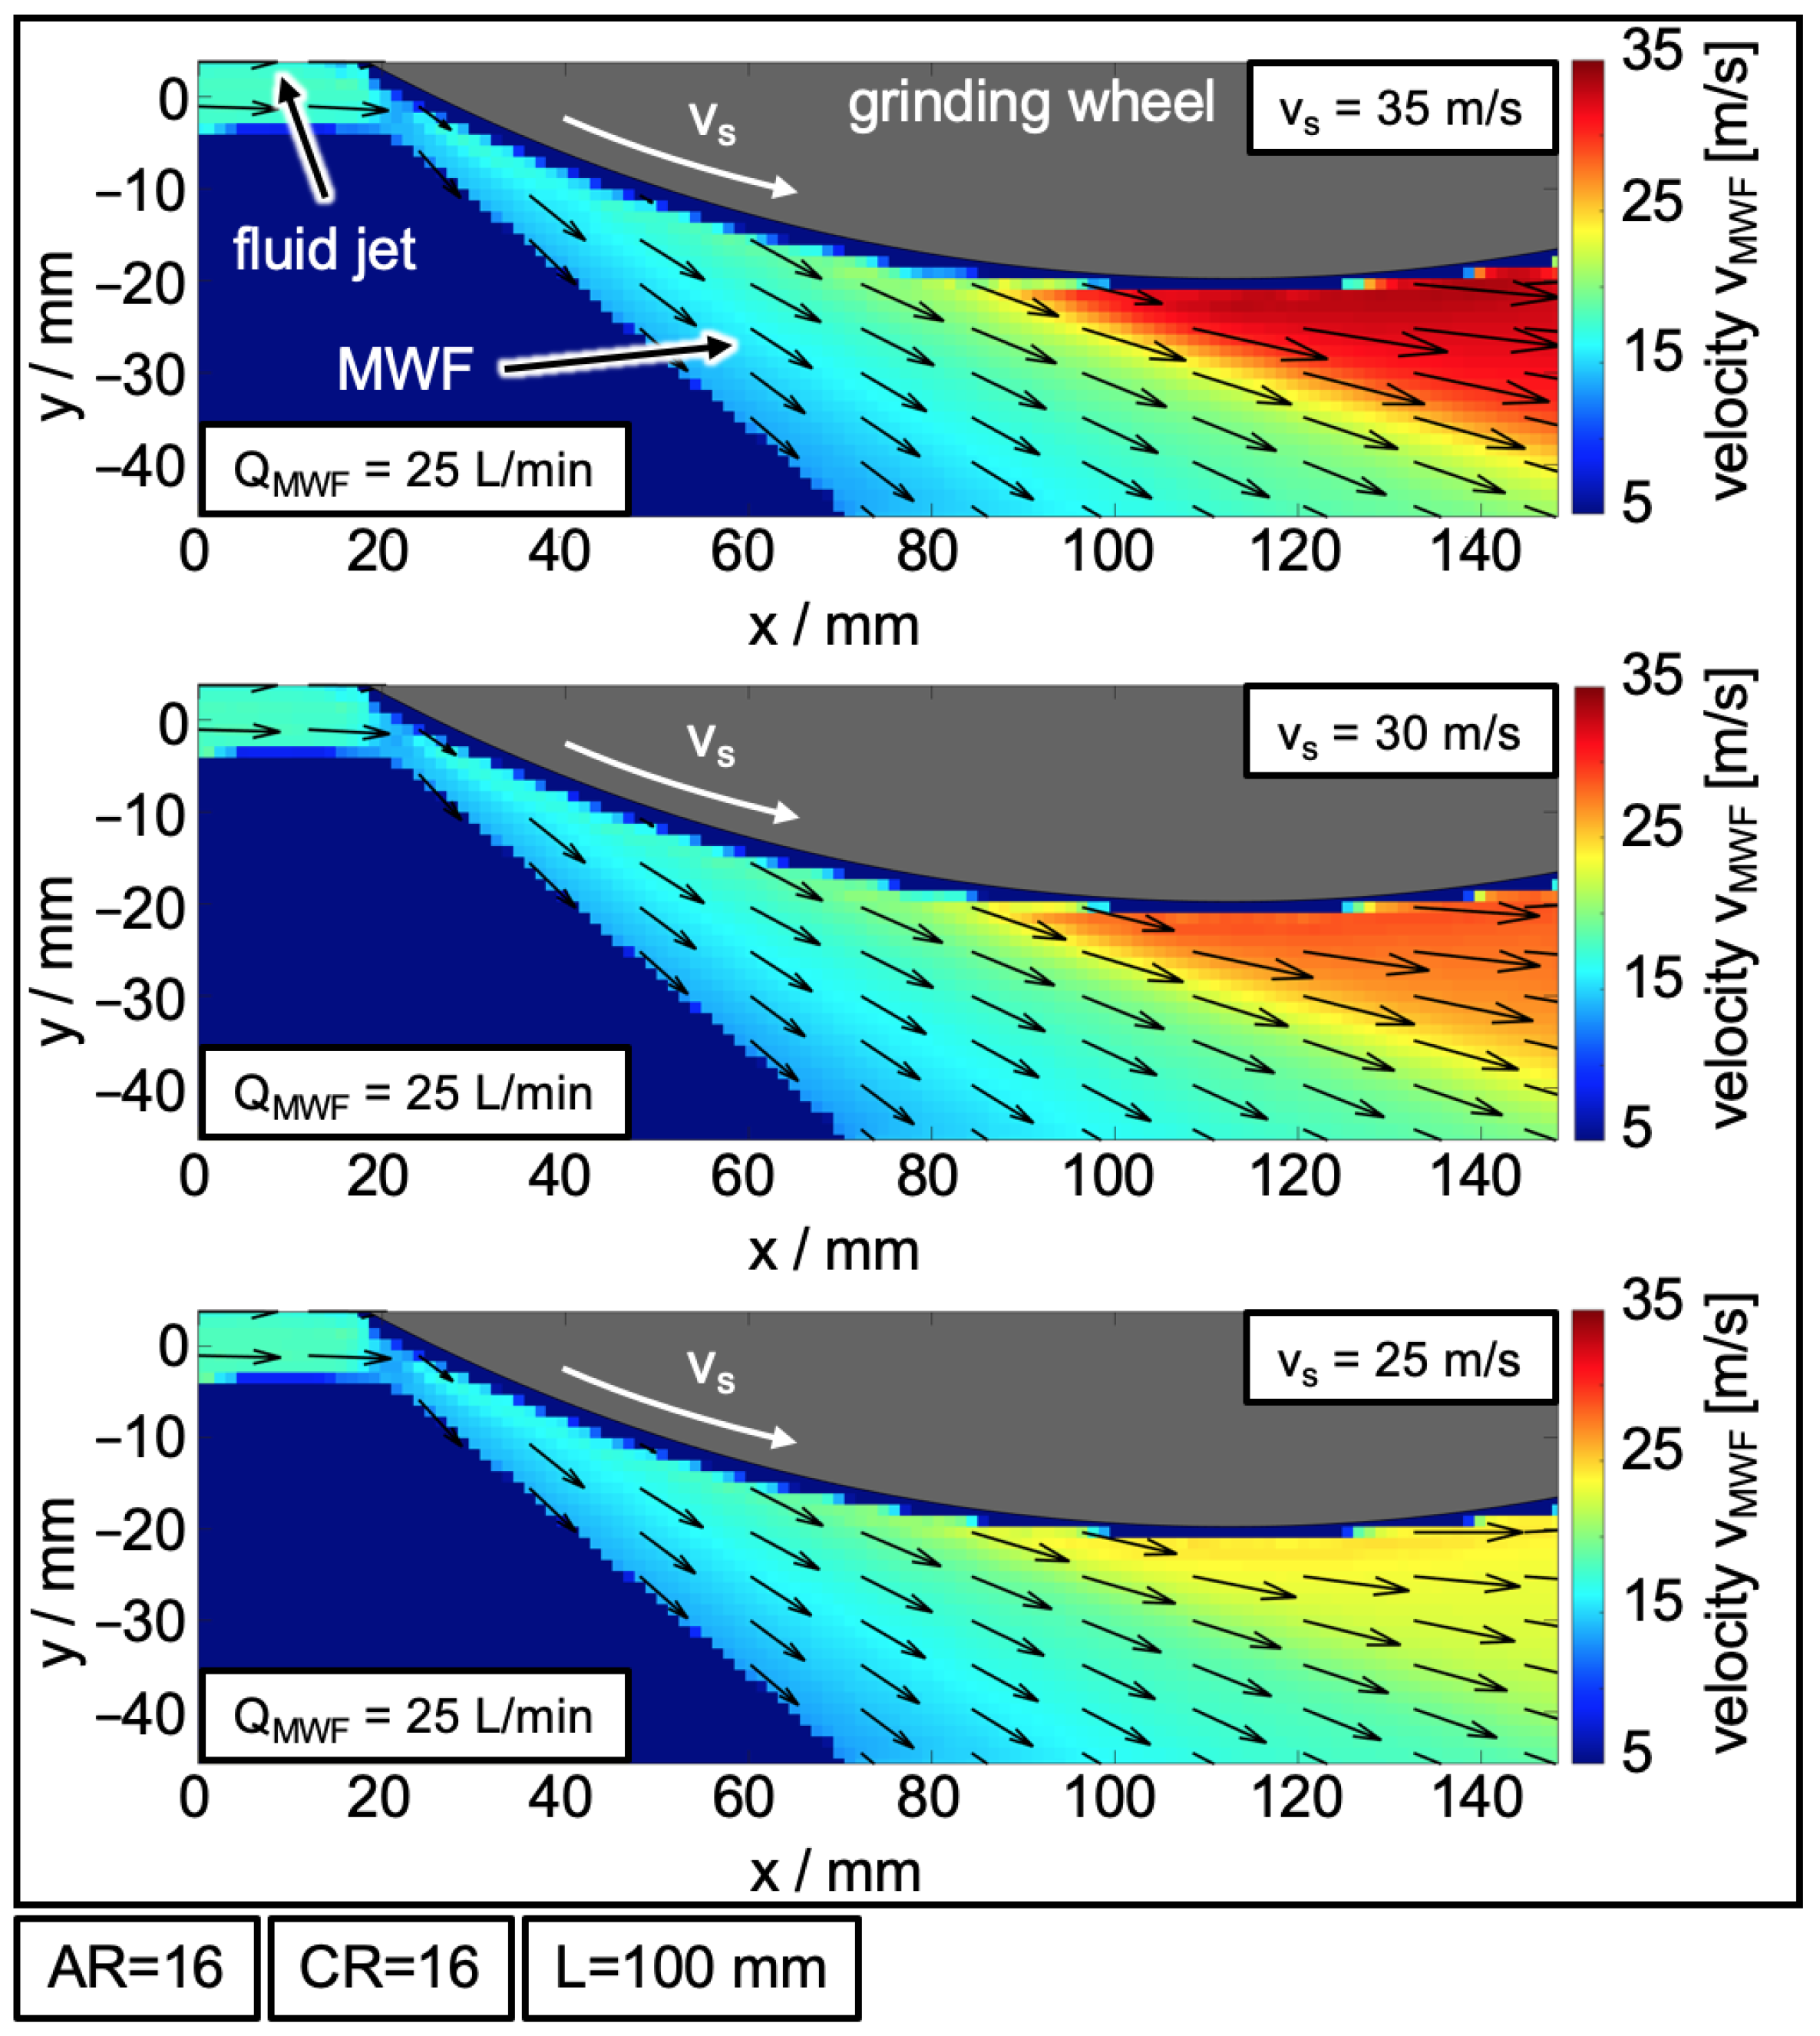
3.3. Interaction Area—Velocity Distribution

As with the free jets, the high-speed recordings from the interaction area serve as the basis for further analyses. An example of a high-speed recording is shown in Figure 12. According to the high-speed recordings, a variation in the flow rate QMWF has a significant influence on the shape of the fluid’s distribution within the interaction area. An increase in the flow rate seems to lead to an increased amount of MWF in the interaction area. Furthermore, the impression is that an increasing flow rate leads to a displacement of the MWF.
In order to derive more than just qualitative conclusions about the interaction area, an analysis of the velocity distribution in the interaction area is carried out using SIV. The results for a varying flow rate QMWF and a constant grinding wheel velocity vs of 35 m/s are shown in Figure 13. The velocities within the interaction area are again indicated by the different colors and the flow direction by the arrows. Regardless of the selected flow rate or free jet velocity, dark blue areas or very low MWF velocities are observed near the grinding wheel surface. This does not mean that MWF accumulates in this area at very low velocities but rather that, in this area, determination of the velocities is challenging with the selected measurement technique. At the impact point of the free jet, a brief decrease in the MWF velocity is observed. After this point, the MWF is entrained by the grinding wheel rotation and is accelerated independent of the initial flow rate or free jet velocity. At very low free jet velocities, only a limited part of the MWF at the lowest point of the grinding wheel is accelerated to velocities higher than the initial vjet. With increasing free jet velocities, the amount of accelerated MWF becomes larger. There are areas where the MWF velocity is higher than the free jet velocity.
In addition to the flow rate, the influence of the grinding wheel velocity on the velocity distribution in the interaction area is studied in Figure 14 for a constant flow rate of 25 L/min. An increase in the grinding wheel velocity leads to higher MWF velocities. However, compared to the increase in flow rate, the velocity increase only occurs in a limited area near the grinding wheel. Outside this range, the MWF velocity remains constant and corresponds approximately to the free jet velocity. It is thus concluded that the velocity distribution within the interaction area is mainly influenced by the flow rate and the free jet velocity.
The measured velocity fields also enable initial explanatory approaches to describe the influence of the velocity ratio between grinding wheel velocity and MWF velocity on the MWF supply. For this purpose, the grinding wheel velocity vs = 25 m/s is selected in such a way that, according to Heinzel et al. [19], there is an almost “optimal” velocity ratio of approximately 0.8 during grinding. Furthermore, the other grinding wheel velocities were chosen in such a way that additional deviations from the “optimal” velocity ratio could be realized for a first comparison. The investigations showed that at the most promising velocity ratio, the maximum velocity of the MWF already occurs before the lowest point of the grinding wheel and then remains constant. With the other velocity ratios, a more or less large velocity gradient appears at the lowest point of the grinding wheel, which then only reached its maximum velocity after the lowest point of the grinding wheel.

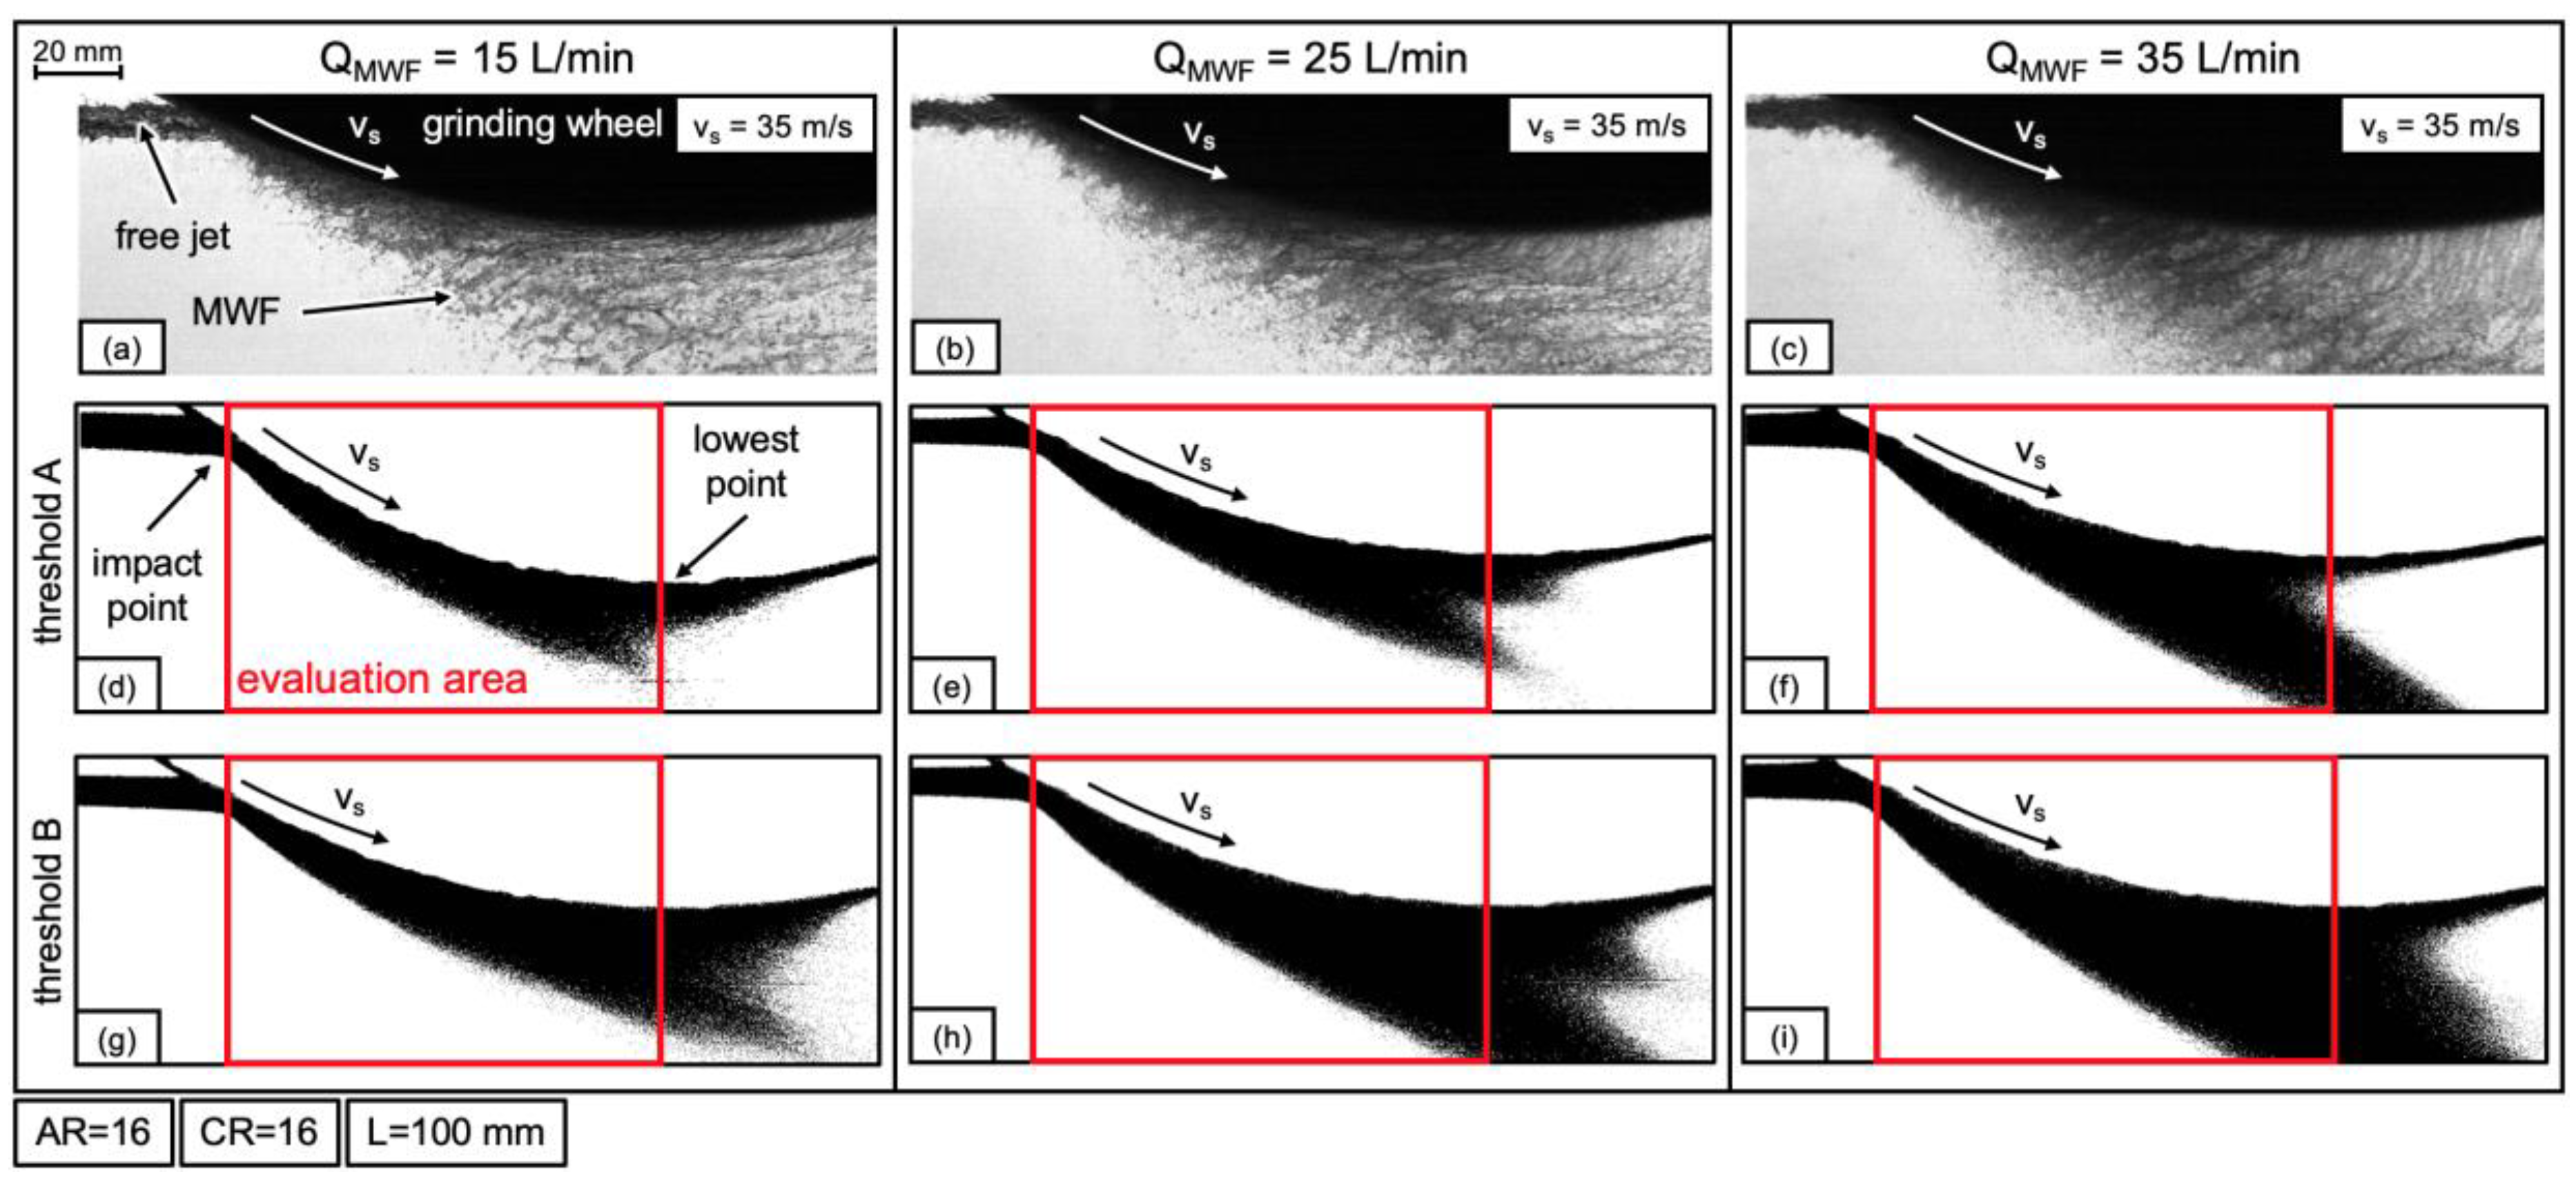
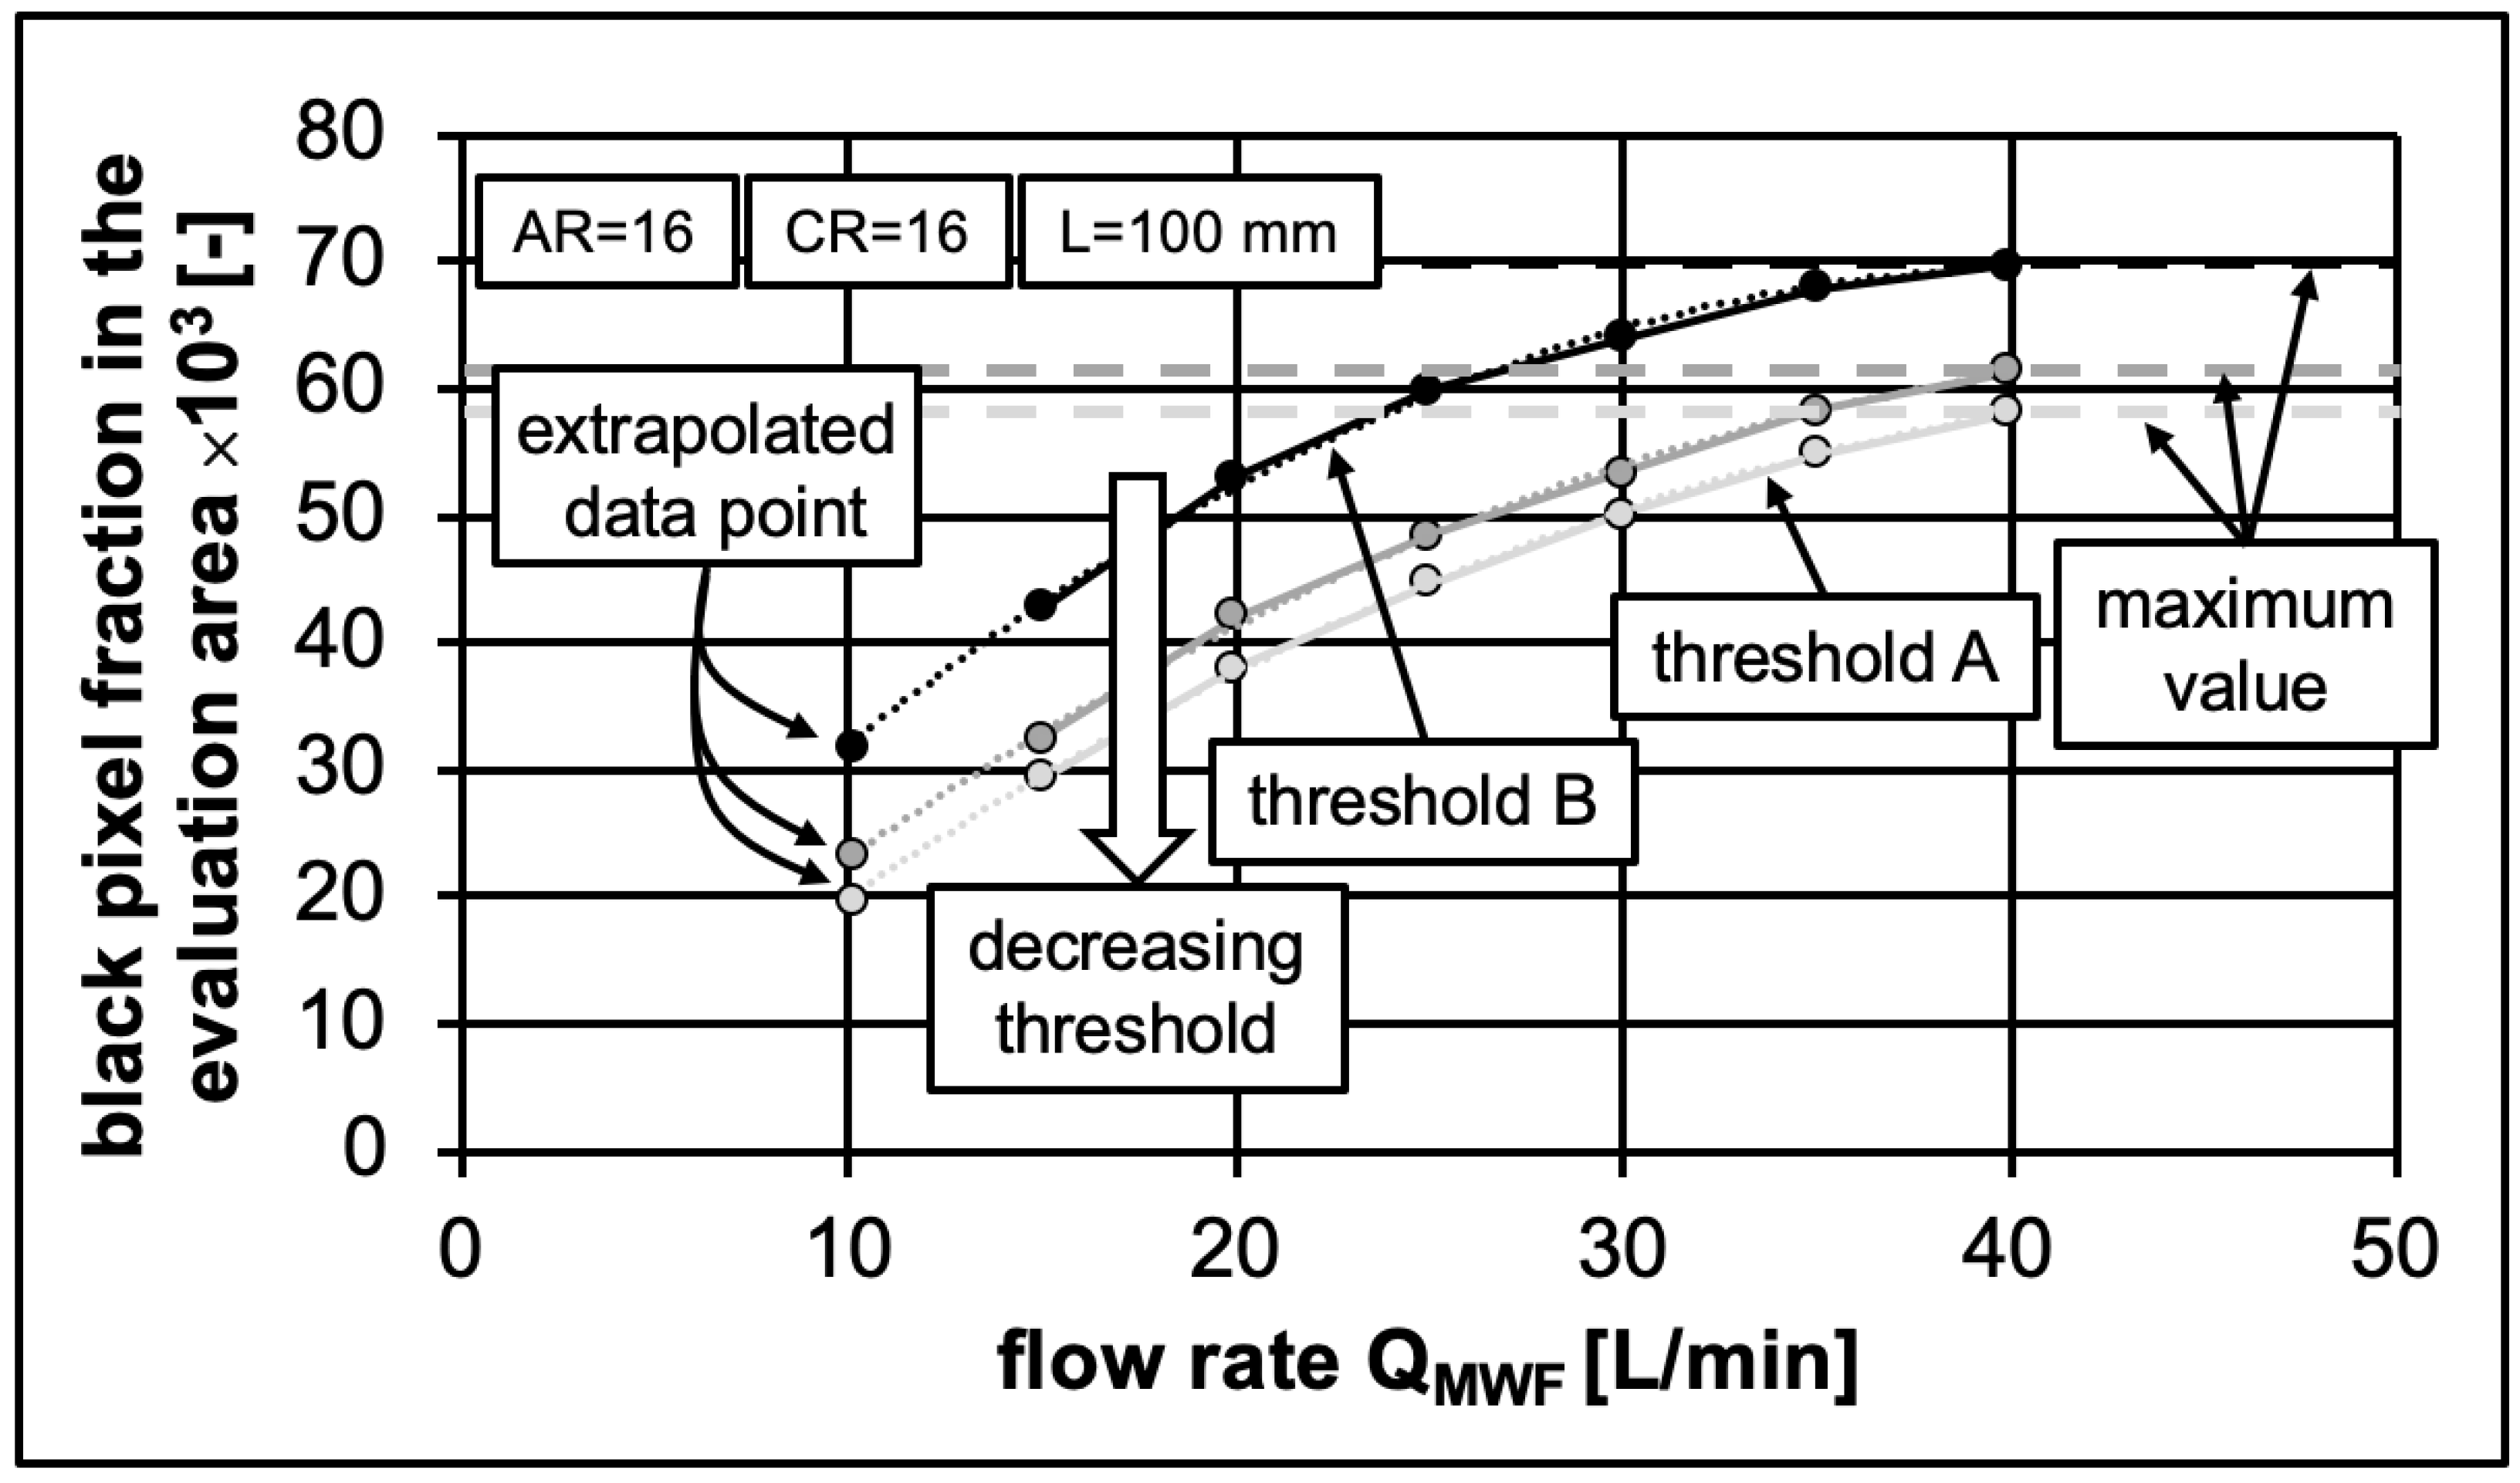
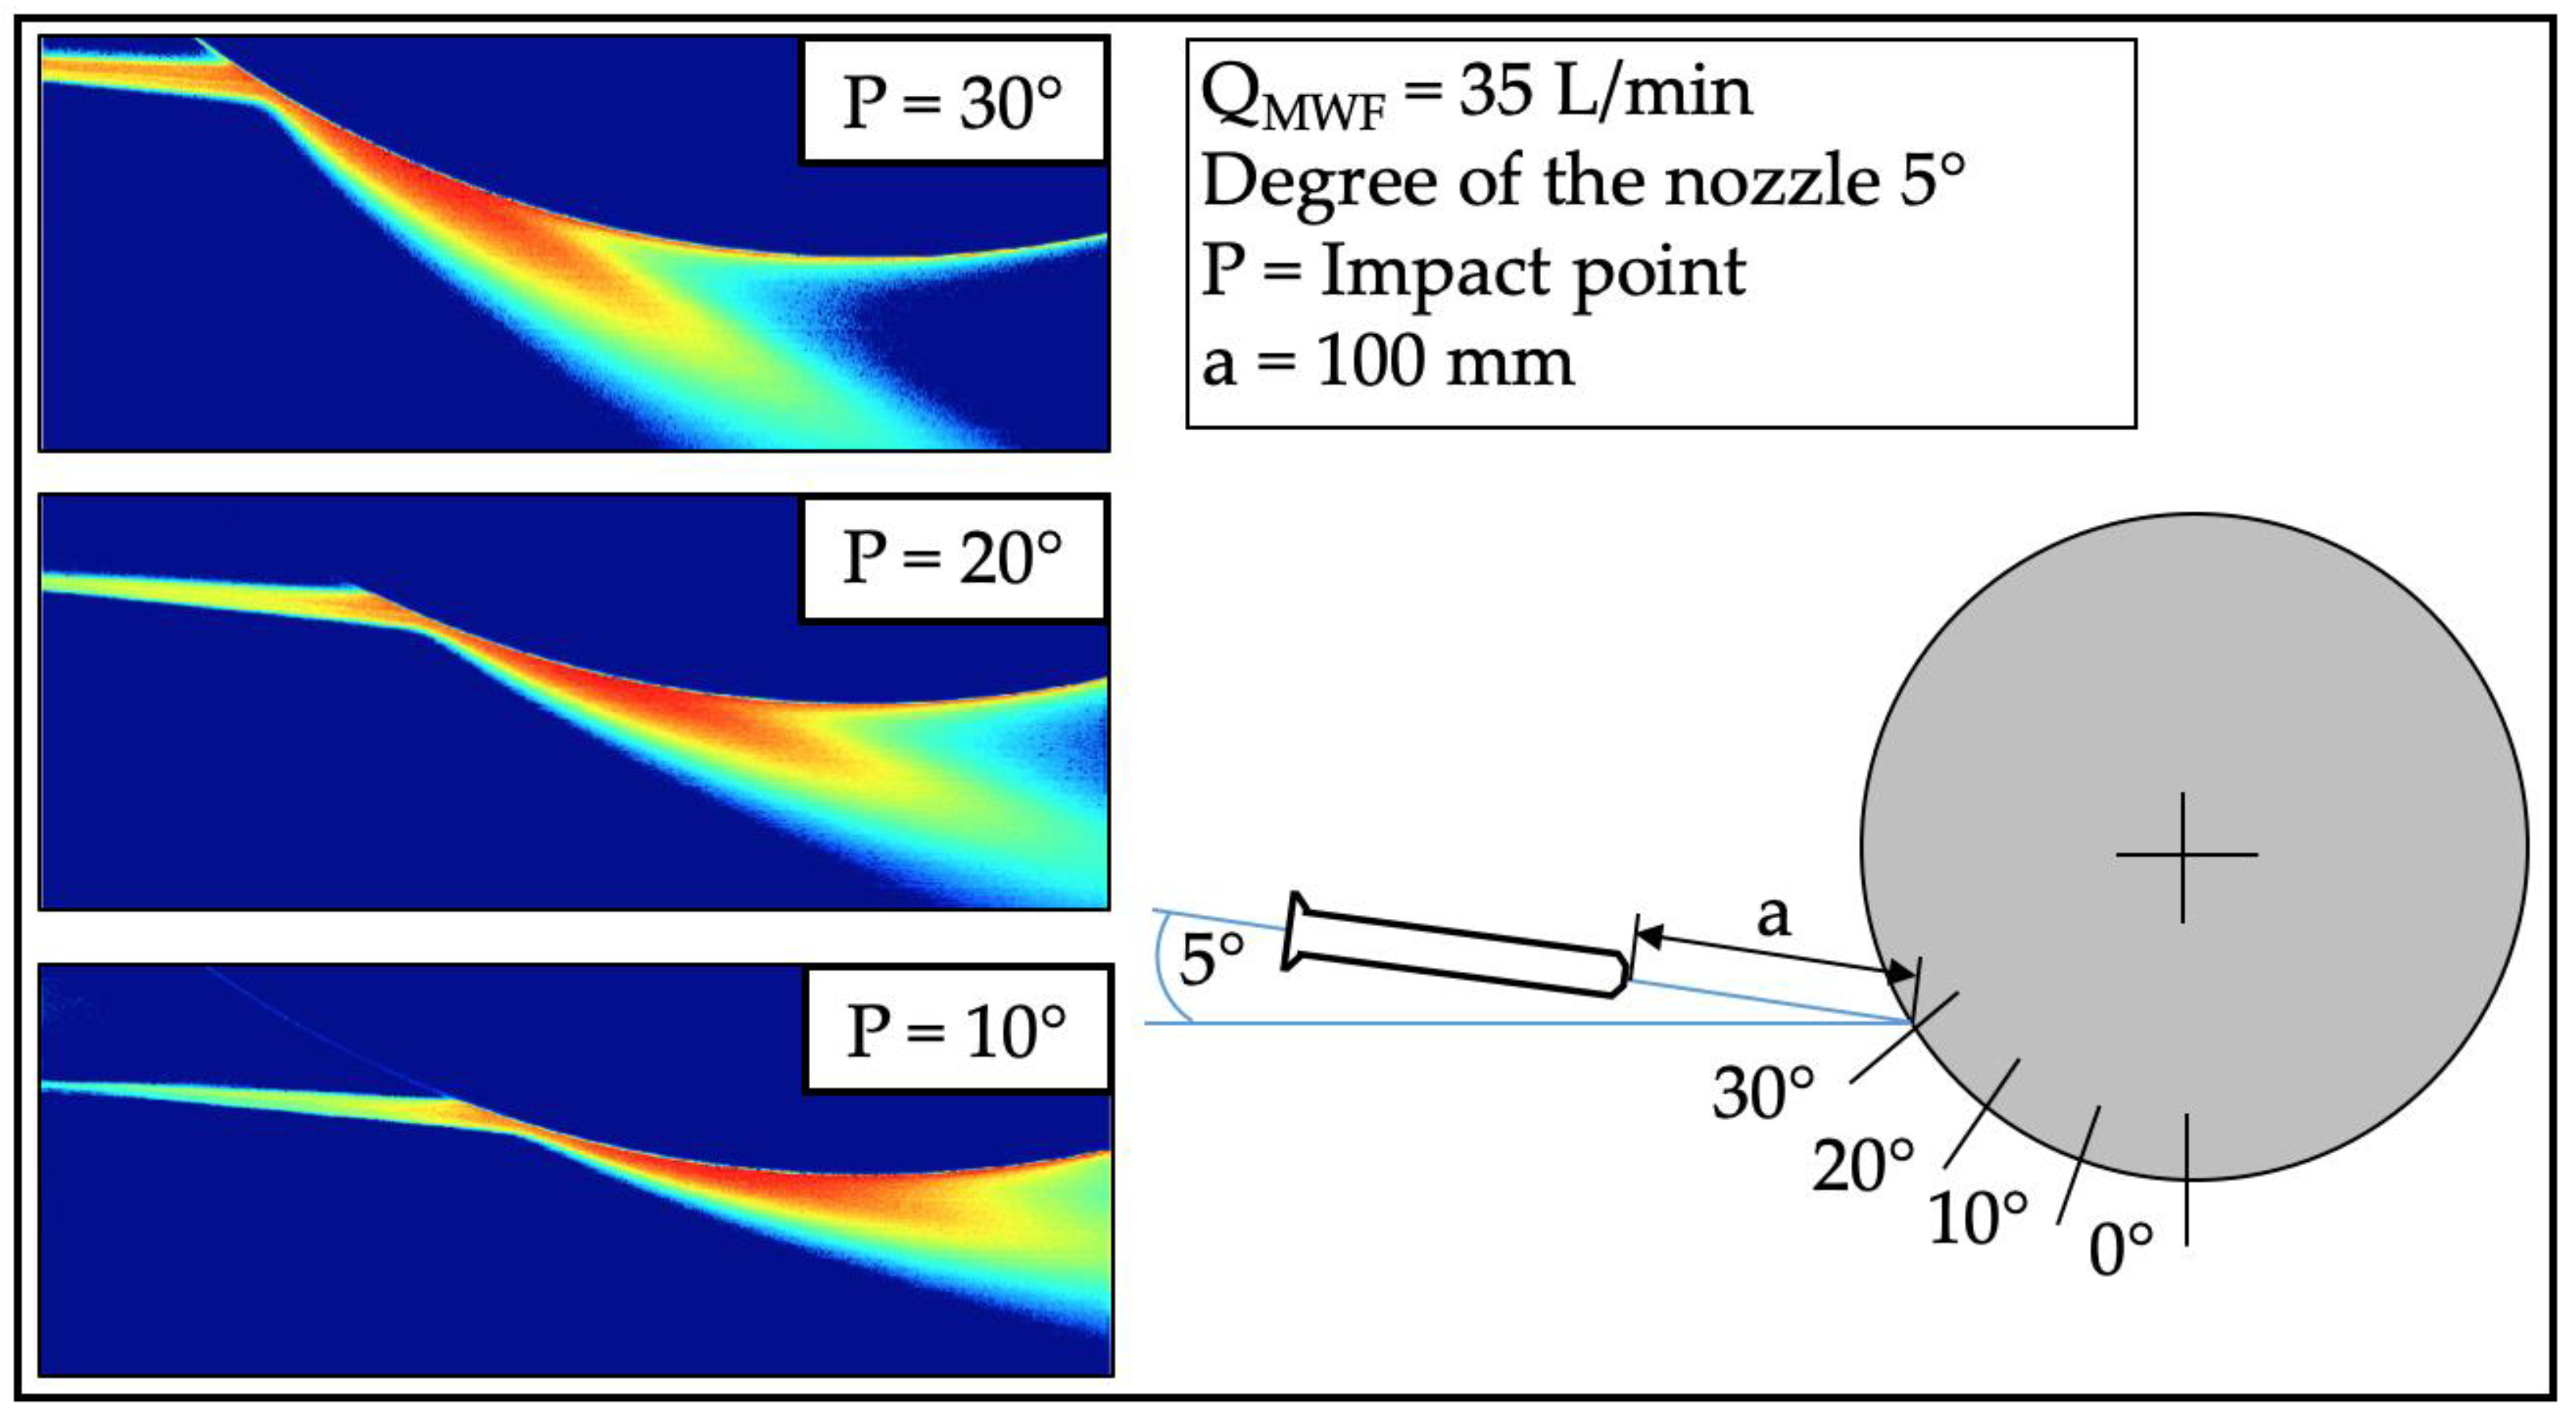
3.4. Analysis of the MWF Supply with Shadowgraphy

On the basis of the velocity distribution within the interaction area, no conclusions can be derived about the MWF supply in the interaction area. Remember that a sufficient MWF supply must be ensured, as this reduces the temperatures during the grinding process and thus keeps the risk of thermal damage to the workpiece to a minimum. Therefore, the evaluation of the MWF distribution and the MWF supply is carried out with the aid of shadowgraphy (see Section 2.2). Figure 15 shows exemplary results for three different flow rates and two different thresholds.
As expected, an increase in flow rate leads to an increase in the amount of MWF in the interaction area (Figure 15d–i). Therefore, there is a proportional relationship between the flow rate and the MWF amount in the interaction area. Further, it can be seen that more MWF is pushed away from the grinding wheel by higher flow rates. Especially, this is observable when comparing a flow rate of 25 L/min and 35 L/min (Figure 15e,f,h,i). This effect is explained by the increasing velocities within the interaction area when increasing the flow rate (see Figure 13). Due to the high velocities, a part of the MWF does not adhere to the grinding wheel and is pushed away. Furthermore, it seems that there is no MWF in the area shortly after the lowest point of the grinding wheel. This effect is particularly noticeable at a flow rate of 35 L/min (Figure 15f,i). This is also due to the high velocities in this part of the interaction area, see Figure 13. Due to the acceleration caused by the grinding wheel rotation, the velocities in this area are partly above the free jet velocity, which leads to the MWF being pushed away. Because of the lower amount of MWF in this area in conjunction with the threshold value selected for the image analysis of the shadowgraphs, a visualization of the MWF in this area is not possible, although MWF can be seen there in the high-speed records. An appropriate adjustment of the threshold would enable the visualization of the MWF in this area.
To demonstrate the effects of adjusting the imaging threshold, the imaging results of two different threshold values A and B are shown in Figure 15. Note that B is a higher threshold than A. As expected, more MWF is taken into account with the higher threshold value B. Especially with higher flow rates from 25 L/min, however, the disadvantages of a threshold value that is too high become apparent. Because of the increased amount of MWF and the too high threshold value, isolated flow phenomena are superimposed, which leads to a loss of information. Nevertheless, a threshold value that is too low can also contribute to a loss of information, as it does not take sufficient MWF into account.
In order to derive more than just qualitative conclusions about the amount of MWF within the interaction area, the fraction of black pixels within the evaluation area is determined. The evaluation area used for this purpose is shown in Figure 15 as a red box. The left border is defined by the point of impact of the free jet with the grinding wheel. The right border is at the lowest point of the grinding wheel. The results of the black pixel fraction analysis for different thresholds are shown in Figure 16. With increasing flow rates the amount of MWF and also the black pixel fraction increase. There is a proportional relationship between the MWF amount in the interaction area and the black pixel fraction. Furthermore, the figure shows that the black pixel fraction always converges towards a maximum value independent of the chosen threshold. This supports the thesis that there is a limit on MWF supply. Thus, the black pixel fraction is a suitable parameter for evaluating the MWF supply and offers the possibility of determining the required flow rate. However, it must first be defined at which black pixel fraction a sufficient amount of MWF is conveyed into the contact zone in order to keep the temperature and the risk of thermal workpiece damage as low as possible.

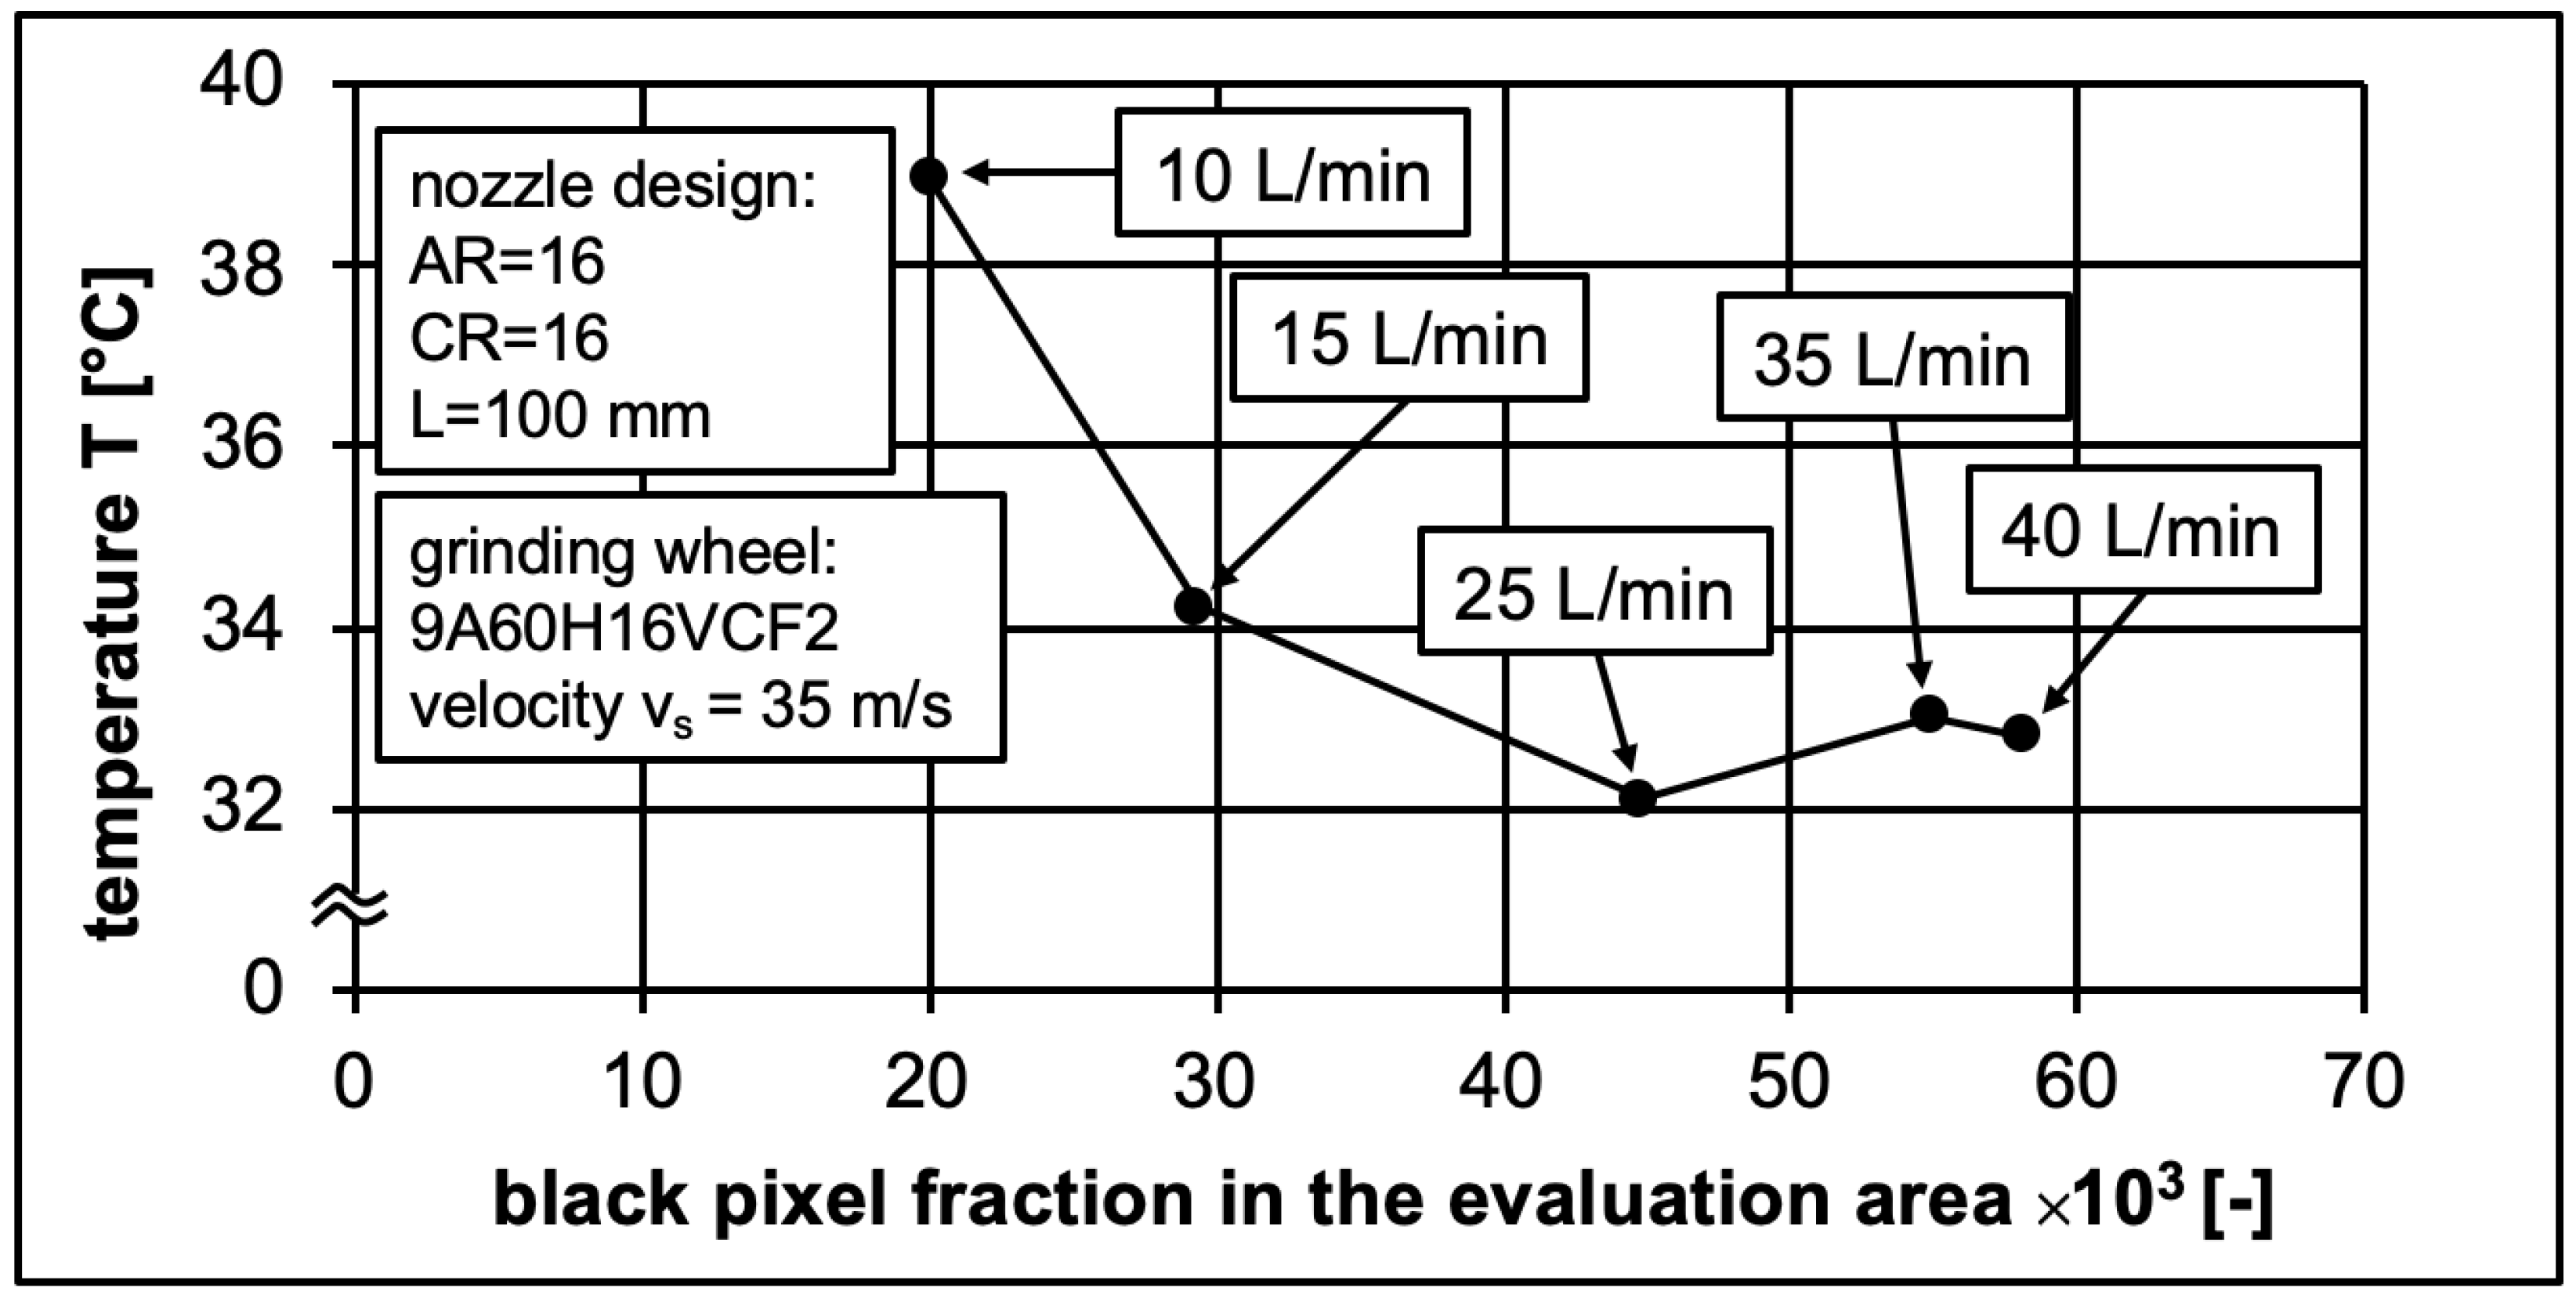
3.5. Evaluation of the Cooling Capacity Depending on MWF Supply Conditions

In order to assess the informative value of the black pixel fraction with regard to a sufficient MWF supply to the contact zone, the test rig described in Section 2.1 is finally used. With this experimental setup, the temperature in the contact zone can be measured for different MWF supply conditions, while lower temperatures correspond to an improved and favorable MWF supply.
The results obtained with the aid of the test rig are shown in Figure 17. The black pixel fractions determined in advance at the different flow rates are taken from Figure 16 (light grey line). As expected, the temperature decreases with increasing black pixel fraction or flow rate. A minimum occurs at a black pixel fraction of 45,000 or at a flow rate of 25 L/min. This is due to the geometric limitation of the contact zone between the grinding wheel and the workpiece. Furthermore, the amount of MWF supplied to the contact zone is limited by the available space within the pores of the grinding wheel. Thus, only a pre-determined amount of MWF is conducted to the contact zone and consequently, the temperature can not be further reduced [35,41,42]. These findings demonstrate that the black pixel fraction is a suitable parameter for evaluating the MWF supply and can be used to avoid excessive flow rates. In the future, such black pixel fraction graphs (black pixel fraction against flow rate) could be determined once for an existing MWF supply system with little metrological effort. With graphs of this kind, it is possible to choose a suitable flow rate even before grinding and to avoid over-supply of the contact zone with MWF. This not only reduces the risk of thermal damage but also saves operating costs for the MWF supply system.

4. Conclusions and Outlook

In this work, the entire path of the MWF, starting from the nozzle outlet to the contact zone between the grinding wheel and the workpiece, was studied using the analysis methods shadowgram imaging velocimetry (SIV) and the shadowgraph technique (shadowgraphy). With the aid of both methods, not only the free jet but also the interaction area was analyzed in more detail. In the following, the main conclusions are presented:
(1)
For the applied MWF nozzle, the jet velocity remains approximately constant in a defined free jet cross-section, even at high distances from the nozzle outlet. This confirmed that a valid estimate of the jet velocity in the relevant free jet area is obtained with the aid of Equation (1).
(2)
Despite constant velocities, the free jet geometry can differ significantly when the entrance length L and contraction ratio CR are varied.
(3)
The velocity distribution in the interaction area is mainly influenced by the flow rate. The grinding wheel velocity has an influence limited to an area below the grinding wheel.
(4)
The new parameter black pixel fraction was derived for the evaluation of the MWF supply to the contact zone.
(5)
The informative value of this new image parameter was verified with the aid of a suitable test rig.
In future investigations, it should be clarified how the black pixel fraction, at which sufficient MWF supply to the contact zone is given, can be determined. In this context, the definition and influence of the evaluation area should also be investigated more closely and adapted if necessary. For example, a radial section parallel to the circumference of the grinding wheel can also be used as the evaluation surface. At the same time, further evaluation approaches are to be pursued in the future in order to generate a higher gain in knowledge. As an example, Figure 18 shows the first investigations of the influence of the nozzle position on the MWF supply with an alternative evaluation approach. Here, a so-called false-color image is generated on the basis of the grey values by shadowgraphy. The further subdivision into different areas should provide more information and contribute to a better understanding of the MWF flow in the interaction area. In addition to the evaluation approaches, other parameters and their influence on the MWF supply are to be investigated. In the tests carried out, the grinding wheel topography was kept constant. By varying the dressing condition and the porosity (amount of pores) of the grinding wheel, the influence of these parameters on the MWF supply in the interaction area is to be investigated in the future. The knowledge gained will be used to predict the supply to the contact zone under different boundary conditions in order to ensure an optimum supply of MWF.

Author Contributions

Conceptualization, L.S. and N.G.; methodology, L.S, B.E. and D.S.; investigation, L.S. and B.E.; resources, A.F. and D.M.; data curation, L.S., B.E. and N.G..; writing—original draft preparation, L.S., N.G. and D.M.; writing—review and editing, D.S., A.F. and D.M.; visualization, L.S., B.E. and N.G.; supervision, D.S., A.F. and D.M.; funding acquisition, A.F. and D.M. All authors have read and agreed to the published version of the manuscript.

Funding

The authors thank the German Research Foundation (DFG—Project number 415003387).

Data Availability Statement

The data presented in this study are available on request from the corresponding author.

Conflicts of Interest

The authors declare no conflict of interest.

References

  1. Kohl, E.; Heinzel, C.; Eich, M. Evaluation of Hardness and Resiual Stress Changes of AISI 4140 Steel Due to Thermal Load during Surface Grinding. J. Manuf. Mater. Process. 2021, 5, 73. [Google Scholar]
  2. Srivastava, A.; Awale, A.; Vashista, M.; Yusufzai, M.Z.K. Monitoring of thermal damages upon grinding of hardened steel using Barkhausen noise analysis. J. Mech. Sci. Technol. 2020, 34, 2145–2151. [Google Scholar] [CrossRef]
  3. Neslusan, M.; Cizek, J.; Kolarik, K.; Minarik, P.; Cillikova, M.; Melokhova, O. Monitoring of grinding burn via Barkhausen noise emission in case-hardened steel in large-bearing production. J. Mater. Process. Technol. 2017, 240, 104–117. [Google Scholar] [CrossRef]
  4. Meyer, D.; Wagner, A. Influence of metalworking fluid additives on the thermal conditions in grinding. CIRP Ann. Manuf. Technol. 2016, 65, 313–316. [Google Scholar] [CrossRef] [Green Version]
  5. Rowe, W.B.; Black, S.C.E.; Mills, B.; Qi, H.S.; Morgan, M.N. Experimental Investigation of Heat Transfer in Grinding. Ann. CIRP 2018, 44, 329–332. [Google Scholar] [CrossRef]
  6. Schwienbacher, S. Einfluss von Schleifbrand auf die Flankentragfähigkeit einsatzgehärteter Zahnräder. Ph.D. Thesis, Technische Universität München, Munich, Germany, 2008. [Google Scholar]
  7. Aurich, J.C.; Kirsch, B. Improved coolant supply through slotted grinding wheel. CIRP Ann. Manuf. Technol. 2013, 62, 363–366. [Google Scholar] [CrossRef]
  8. Heinzel, C.; Kirsch, B.; Meyer, D.; Webster, J. Interactions of grinding tool and supplied fluid. CIRP Ann. Manuf. Technol. 2020, 69, 624–645. [Google Scholar] [CrossRef]
  9. Kirsch, B. The impact of contact zone flow rate and bulk cooling on the cooling efficiency in grinding applying different nozzle designs and grinding wheel textures. CIRP-JMST 2017, 18, 179–187. [Google Scholar] [CrossRef]
  10. Sieniawski, J.; Nadolny, K. Experimental study into the grinding force in surface grinding of steel CrV12 utilizing a zonal centrifugal coolant provision system. Proc. Inst. Mech. Eng. Part. B J. Eng. Manuf. 2018, 232, 394–403. [Google Scholar] [CrossRef]
  11. Baumgart, C.; Radziwill, J.J.; Kuster, F.; Weger, K. A Study of the interaction between coolant jet nozzle flow and the airflow around a grinding wheel in cylindrical grinding. Procedia CIRP 2017, 58, 517–522. [Google Scholar] [CrossRef]
  12. Zhao, Z.; Qian, N.; Fu, Y. Coolant condition and spindle power high-efficiency-deep-grinding of nickel-based superalloy profile part. Mater. Manuf. Process. 2021, 36, 1–13. [Google Scholar] [CrossRef]
  13. Smith, E.D.; Curtis, D. An investigation of additively manufactures coolant nozzles for cylindrical grinding applications and progression to high stock removal. Procedia CIRP 2021, 101, 162–165. [Google Scholar] [CrossRef]
  14. Rouse, H. Experimental investigation of fire monitors and nozzles. Trans. Am. Soc. Civil Eng. 1952, 117, 1147. [Google Scholar] [CrossRef]
  15. Stachurski, W.; Sawicki, J.; Krupanek, K.; Nadolny, K. Numerical analysis of coolant flow in the grinding zine. Int. J. Adv. Manuf. Technol. 2019, 104, 1999–2012. [Google Scholar] [CrossRef] [Green Version]
  16. Hosokawa, A.; Shimizu, R.; Kiwata, T.; Koyano, T.; Furumoto, T.; Hashimoto, Y. Studies on Eco-Friendly Grinding with an Extremely Small Amount of Coolant–Applicability of Contact-Type Flexible Brush-Nozzle. Int. J. Autom. Technol. 2019, 13, 648–656. [Google Scholar] [CrossRef]
  17. Parthasarathy, A.; Malkin, S. Effect of fluid application conditions on grinding behaviour. Mech. Eng. B J. Eng. 2010, 24, 225–235. [Google Scholar] [CrossRef]
  18. Brevern, P. Untersuchungen zur Kühlschmierstoffversorgung beim Tiefschleifen von Hartmetall. Ind. Diam. Rundsch. 2008, 42, 34–38. [Google Scholar]
  19. Heinzel, C.; Meyer, D.; Kolkwitz, B.; Eckebrecht, J. Advanced approach for a demand-oriented fluid supply in grinding. CIRP Ann. Manuf. Technol. 2015, 64, 333–336. [Google Scholar] [CrossRef] [Green Version]
  20. Morgan, M.N.; Jackson, A.R.; Wu, H.; Baines-Jones, V. Optimisation of fluid application in grinding. CIRP Ann. Manuf. Technol. 2008, 57, 363–366. [Google Scholar] [CrossRef]
  21. Denkena, B.; Becker, J.; Jung, M.; Catoni, F. Optimization of the cooling conditions in continuous generating grinding of gears. In Proceedings of the 3rd International Conference and Exhibition on Design and Production of Dies Molds, Bursa, Turkey, 17–19 June 2004; pp. 339–344. [Google Scholar]
  22. Ott, H.W. Richtig gekühlt ist halb geschliffen-Eine eher physikalische Betrachtung. Semin. Mod. Schleiftechnol. Feinstbearbeitung 2002, 32, 1–7. [Google Scholar]
  23. Webster, J.A.; Cui, C.; Mindek, R.B. Grinding fluid application system design. CIRP Ann. Manuf. Technol. 1995, 44, 333–338. [Google Scholar] [CrossRef]
  24. Geilert, P.; Heinzel, C.; Wagner, A. Grinding fluid jet characteristics and their effect on a gear profile grinding process. Inventions 2017, 2, 27. [Google Scholar] [CrossRef] [Green Version]
  25. Wittmann, M. Methode zur Bewertung der Kühlwirkung des Kühl-schmierstoff-Zufuhrsystems beim Schleifen. In Proceedings of the 14th International Colloq Tribology-Tribology and Lubrication, Esslingen, Germany, 13–15 January 2004. [Google Scholar]
  26. Kirsch, B. Wirkmechanismen der Kühlschmierstoff-Zufuhr beim Schleifen: Analyse externer und interner Kühlschmierstoff-Zufuhrmethoden. Ph.D. Thesis, Technical University of Kaiserslautern, Kaiserslautern, Germany, 2013. [Google Scholar]
  27. Kirsch, B.; Aurich, J.C. Kontaktzonenvolumenstrom und Überflutungskühlung -Kühlmechanismen von Freistrahl- und Schuhdüsen bei hoher Wärmebelastung. Jahrb. Schleif. Honen Läppen Polier. 2013, 66, 81–99. [Google Scholar]
  28. Qiu, B.; Yin, J.; Ding, W.; Xu, J.; Guo, Q. Flow field and cooling capacity in workpiece-tool contact zone during ultra-high-speed grinding. Int. J. Adv. Manuf. Technol. 2020, 111, 2349–2359. [Google Scholar] [CrossRef]
  29. Stabauer, R.; Saxler, W. Investigation of the Influence of the Airflow Around a Grinding Wheel on the Coolant Supply. WMMES 2021, 1190, 1–10. [Google Scholar] [CrossRef]
  30. Gviniashvili, V.; Webster, J.; Rowe, B. Fluid flow and pressure in the grinding wheel-workpiece interface. J. Manuf. Sci. 2005, 127, 198–205. [Google Scholar] [CrossRef]
  31. Mandal, B.; Singh, R.; Das, S.; Banerjee, S. Improving grinding perfomance by controlling air flow around a grinding wheel. Int. J. Mach. Tool Manu. 2011, 51, 670–676. [Google Scholar] [CrossRef]
  32. Webster, J.A. Optimizing coolant application systems for high productivity grinding. Abras. Mag. 1999, 34–41. [Google Scholar]
  33. Gori, F.; Petracci, I.; Angelino, M. Flow evolution of a turbulent submerged two-dimensional rectangular free jet of air. Average Particle Image Velocimetry (PIV) visualizations and measurements. Int. J. Heat Fluid Flow 2013, 44, 764–775. [Google Scholar] [CrossRef]
  34. Espenhahn, B.; Schumski, L.; Vanslow, C.; Stöbener, D.; Meyer, D.; Fischer, A. Optical flow field measurements of the coolant in a grinding machine. Appl. Sci. 2021, 11, 24. [Google Scholar] [CrossRef]
  35. Powell, J. The Application of Grinding Fluid in Creep Feed Grinding. Ph.D. Thesis, University of Bristol, Bristol, UK, 1979. [Google Scholar]
  36. Howes, T.D.; Neailey, K.; Harrison, J. Fluid Film Boiling in Shallow Cut Grinding. Ann. CIRP 1990, 39, 313–316. [Google Scholar] [CrossRef]
  37. Wittmann, M.; Heinzel, C.; Brinksmeier, E. Evaluating the Efficiency of Coolant Supply Systems in Grinding, Production Engineering Research and Development. Ann. WGP 2004, 6, 39–42. [Google Scholar]
  38. Wittmann, M. Bedarfsgerechte Kühlschmierung Beim Schleifen; VDI Verlag: Düsseldorf, Germany, 2007. [Google Scholar]
  39. Mindek, R.B.; Webster, J. Minimizing thermal damage of aero-space components using coolant nozzle and coolant system optimization. IGTI ASME Cogen-Turbo 1994, 9, 97–104. [Google Scholar]
  40. Canny, J. A Comutational Approach to Edge Detection. IEEE Trans. Pattern Anal. Mach. Intell. 1986, 8, 679–698. [Google Scholar] [CrossRef] [PubMed]
  41. Czenkusch, C. Technologische Untersuchungen und Prozessmodelle zum Rundschleifen; VDI Verlag: Düsseldorf, Germany, 2000. [Google Scholar]
  42. Vits, R. Technologische Aspekte der Kühlschmierung Beim Schleifen; VDI Verlag: Düsseldorf, Germany, 1985. [Google Scholar]
Figure 1. MWF supply during grinding.
Jmmp 06 00051 g001
Figure 2. Procedure for analyzing and characterizing the coolant supply.
Jmmp 06 00051 g002
Figure 3. Experimental setup for high-speed records.
Jmmp 06 00051 g003
Figure 4. Parameter of the nozzle design.
Jmmp 06 00051 g004
Figure 5. Setup for the evaluation of the cooling effect of the MWF supply.
Jmmp 06 00051 g005
Figure 6. Flowchart for the evaluation of the shadowgraphy recordings, (ac) evaluation steps of the free jet, (df) evaluation steps of the interaction area.
Jmmp 06 00051 g006
Figure 7. Shadowgraphy of the free jet in side view and top view.
Jmmp 06 00051 g007
Figure 8. Jet expansion over the flow rate with variation of the entry length, contraction ratio, and aspect ratio.
Jmmp 06 00051 g008
Figure 9. Exemplary results of the shadowgraphy and the associated SIV-derived velocity field.
Jmmp 06 00051 g009
Figure 10. Jet velocity in the relevant free jet area and over the entire free jet width for different distances from nozzle outlet sjet.
Jmmp 06 00051 g010
Figure 11. Jet velocity at the distance of L = 100 mm over the flow rate with variation of the entry length, contraction ratio, and aspect ratio.
Jmmp 06 00051 g011
Figure 12. Shadowgraphy records of the interaction area under different flow rates.
Jmmp 06 00051 g012
Figure 13. Velocity field in the interaction area under different flow rates.
Jmmp 06 00051 g013
Figure 14. Velocity field in the interaction area under different grinding wheel velocities.
Jmmp 06 00051 g014
Figure 15. Evaluation of the shadowgraphy records with two different thresholds, (ac) high-speed-records, (df) shadowgraphy records for threshold A, (gi) shadowgraphy records for threshold B.
Jmmp 06 00051 g015
Figure 16. Black pixel fraction with different threshold values.
Jmmp 06 00051 g016
Figure 17. Course of the temperature over the black pixel fraction by different flow rates.
Jmmp 06 00051 g017
Figure 18. False-color images of an exemplary examination of the nozzle position during coolant supply.
Jmmp 06 00051 g018
Table 1. Varied parameters of the nozzle geometry.
Height H of the Inner ProfileOutlet Height h of the NozzleOutlet Width b of the NozzleEntry Length LContraction Ratio CRAspect Ratio AR
10 mm0.83 mm20 mm50 mm88
15 mm1.25 mm20 mm100 mm1216
20 mm1.67 mm20 mm150 mm1624
Publisher’s Note: MDPI stays neutral with regard to jurisdictional claims in published maps and institutional affiliations.

