Abstract
The present paper proposes a combined tribo-mechanical methodology for assessing friction under conditions representative of metal cutting, without resorting to machining process monitoring. The purpose is to withdraw the size effect’s contribution due to tool edge radius to the well-known overestimation of the friction coefficient. Comparative numerical analysis of several tribological tests led us to conclude that the ring compression test is one of the most suitable for reproducing the frictional conditions at the chip–tool interface. Two distinct metallic alloys were selected to demonstrate the application of the proposed methodology (UNS L51120 lead alloy and 18Ni300 maraging steel in conventional and additively manufactured conditions). The results help to better explain the influences of process parameters on the friction coefficient value under high temperature and high strain rate conditions. Results showed a typical increase in the coefficient of friction of up to 20% due to both temperature and strain rate parameters for 18Ni300. The results are of interest because they allow considering potential sources of error in the numerical simulation of metal cutting when the same friction coefficient value is considered for a wide range of cutting parameters.
1. Introduction
Metal cutting simulations have become everyday practice to assist in tool design and determination of optimal cutting parameters, aiming towards performance improvements of machining processes [1]. The reliability of such numerical predictions depends mainly on the accuracy of the calibration data. This is of crucial importance in the context of metal cutting, where friction, plastic deformation and fracture occur under extreme loading conditions, making tribological and mechanical testing challenging and leading frequently to intricate calibration procedures. Despite the clear need for appropriate tribological calibration techniques, no significant progress in metal cutting tribology has been achieved over the last few years, especially regarding independent calibration of friction under controlled laboratory conditions. Most research in metal cutting continues to consider machining operations as go-to procedures towards friction calibration. Turning operations are usually the first choice of calibration technique in metal cutting tribology because they resort to experimental apparatuses readily available and can successfully evaluate wear resistance of coated and uncoated tools under industrial operative conditions. Additionally, the turning machine axes have an ideal orientation for continuous monitoring of cutting force components, and thus there is the possibility of direct calibration of the average friction coefficient (COF). However, despite their adequacy in wear tests, machining operations present some level of inconsistency, which leads to the known overestimation of COF and restricts the use of machine tools as laboratory tribometers. The chip formation mechanism includes some physicochemical singularities located where chip formation begins and where chip–tool contact ends. In the first zone, the size effect due to cutting edge radius, or the ploughing effect [2], is a disturbing contribution to the overall cutting load, and therefore, to the calculation of the apparent friction coefficient [3,4]. Some authors yet support that contact between the clearance surface and workpiece is an extremely dynamic process (chatter), penalizing surface roughness and leading to thrust force peaks and overestimation of the static component, even in the case of stable contact between rake surface and chip [5].
Vibration amplitude is promoted by the low structural stiffness of the machine tool–workpiece set and high mechanical strength of workpiece material. The latter is a major obstacle when machining difficult-to-cut materials, such as hardened steels and titanium alloys [6]. The surface condition at clearance contact is also responsible for concealing the effective contribution of the rake face to the resultant force amplitude, since the texture of the clearance face is constantly rubbing against the machined surface. This undesired contribution becomes particularly relevant as the rigidity of the machine tool–workpiece setup decreases. Another area with singular conditions occurs at the interface where the chip detaches from the cutting tool. The occurrence of pressure has been seen to induce welded spots at the areas adjacent to this interface, and it has been recognized that the formation of oxide films is promoted by an active surrounding medium with high concentrations of oxygen. Thus, as these pressure-induced welds occur, an additional shear force is required to break the built-in material and allow the chip to flow. At these areas, the shear force acts along and in parallel to the contact interface, with no significant normal force on the rake surface. The contribution of this effect is more relevant to the overall results for narrower chips [7,8]. Thus, the friction coefficient can be artificially overestimated, often exceeding physically admissible values (above 0.577), as discussed in the literature [9,10,11,12]. These values cannot be taken lightly nor accepted. Moreover, the convergence of numerical simulation is only possible through the introduction of artificial features based on adaptive remeshing techniques, automatic adjustment of the friction value, friction threshold regardless of experimental calibration values, etc., to meet the requirements of the mathematical theory of plasticity [9,13,14,15].
Adequate calibration methodologies can eliminate unwanted contributions, promoting accurate determination of the friction coefficient values. Yet, which independent tribological technique should be employed for friction calibration is still not clear. This is probably the key issue in metal cutting tribology. Under these circumstances, the main objective of this research was to evaluate the tribological conditions at chip–tool contact interface to support a transparent selection of the best tribological calibration methodologies. However, no calibration methodology was expected to cover the complete range of cutting conditions, and therefore, the advantages, disadvantages and application ranges of each calibration methodology were also identified.
In light of the above considerations, we have re-examined and compared the frictional contact conditions provided by each of the commonly used friction calibration techniques with those at the chip–tool contact interface. The ring test proved to be appropriate for friction assessment in the metal cutting domain. A combined tribo-mechanical methodology is proposed for assessing friction under conditions representative of metal cutting. This methodology involves the use of uniaxial compression tests on cylinder- and ring-shaped specimens. Further, an application of the methodology is provided. Ring compression experiments were carried out under extreme conditions of pressure, strain rate and temperature representative of the machining processes for two metallic materials. Such conditions were reached by combining an impact testing machine with an electric furnace to allow testing temperatures above reference room temperature. These experiments have allowed for sensitivity analysis concerning the rate- and temperature-dependent tribological response. Experiments with a high strength and low ductility material (conventional and additively manufactured 18Ni300 Maraging steel) have exposed the feasibility window of the proposed methodology, which was further validated using a very soft material (UNS L51120 lead alloy).
2. Efficient Methodology for Independent Calibration of Friction and Plasticity
Experimental procedures for friction calibration must be able to reproduce most physicochemical aspects of the chip–tool contact interface, but also the mechanical response of workpiece material under similar conditions. This could be achieved by controlling the major parameters that impact friction, namely, material pair, tool surface texture, contaminants at contact interface and loading conditions. The first two requirements are generally met by obtaining tribo-tools with the same materials, manufacturing processes and coating procedures employed in cutting tools production. The existence of unwanted contaminants and cleaning procedures is also of concern due to their impacts on tribological conditions, due to lubricants and debris, for instance. Yet, this can be controlled moderately, as industrial machining processes are usually undertaken in the environmental conditions of machining shops. The major challenge for the independent calibration techniques is to ensure representative loading signatures for metal cutting processes under controlled laboratory conditions. This includes the specific cutting pressure, relative cutting velocity and dynamic conditions, two-dimensional stagnation-point flow, system stiffness and contact temperature (calculated based on tool temperature, frictional heating and mechanical equivalent of heat), among others. Only after a clear and complete identification of those frictional conditions at the chip–tool contact interface will it be possible to select an adequate experimental technique and proper calibration procedures.
In what follows, we attempt to identify the tribological test that best reproduces the tribological conditions of metal cutting, among various independent techniques in the literature. Such realism should substantially increase the accuracy of the theory and experiments, which should help with COF calibration. Then, a methodology is demonstrated in a simulation environment aiming at evaluation of tribo-plastic properties.
2.1. Candidate Calibration Techniques for Friction Evaluation
The candidate calibration techniques must meet mandatory criteria before a detailed analysis and selection can be pursued. Such criteria arise from a simple description of the chip formation mechanism from a tribological point of view. The chip formation mechanism is characterized by a high plastic strain (e.g., effective strain typically above 1) without cracking due the negative state of stress (e.g., triaxiality of −0.3 or lower and Lode angle of −1), high strain rates (e.g., typically above 104 s−1) and elevated temperatures due to adiabatic plastic shearing throughout the shear plan and friction energy dissipation over the rake face (e.g., 500 °C). Contact pressure over the tool surface is another fundamental parameter. It is directly related to material strength, and its value (that can be approximated by specific cutting pressure, Ks) is several times higher than the peaks of flow stress curves from uniaxial compression tests. A maximum contact pressure can be found for the cutting edge surface, as a near-stagnation point flow, from where workpiece material flow begins to branch out into two different directions: (i) the chip sliding direction over the rake surface, and (ii) the machined surface sliding direction underneath the clearance surface. Both contact interfaces become dry, since the formation of new surfaces occurs during contact under high pressure, and thus contaminants cannot penetrate contact interfaces. Relative velocities for both chip–rake and machined surface–clearance contact interfaces have extremely high values and can be directly correlated with cutting velocity. Such velocity values are much higher than those usually found in other manufacturing technologies and machine elements applications, and those in traditional tribology testing. The preceding operative conditions promote significant challenges to experimental techniques, and possibly due to such harsh conditions and the need to control multiple parameters simultaneously, most tribometers are not adequate for metal cutting tribology.
Various tribological tests have been suggested in the literature to study and evaluate the frictional conditions in metalworking processes [16,17,18,19]. These can be systematized into two main groups in metal cutting tribology: process tests and simulative tests [20,21,22]. Process tests apply typical machining operations without changing the basic process kinematics (e.g., orthogonal cutting tests, turning operations and drilling processes, among others). Simulative tests apply laboratory apparatus methods, mainly according to several testing standards, such as ASTM (e.g., G77, G99, G133, D2266, D3702, D4172 and A514) and DIN (e.g., 50324), among others. However, their kinematics and operative conditions usually differ from the real metal cutting processes. Therefore, improvements to such simulative tests are often introduced to model metal cutting tribological conditions in attempts to study friction in a process-independent way. The simulative tests (e.g., pin-on-disc, ball-on-plate, ring compression, reciprocating sliding friction and cup tests) are the least employed, with the exception of the pin-on-disc test, due to its ease-of-use and affordability, and its ability to act as a wear test. Significant conversion of experimental apparatuses is required to meet such specific tribological conditions, which restricts the universal and multipurpose utilization of the laboratory tribometers. Therefore, application-oriented tests are a branch of the simulative tests for specific application areas and to promote appropriate technical standardization. A linear relation between tribometer design and frictional interface allows one to ensure all specific tribological conditions to be simulated under controlled laboratory conditions for wear rate and COF measurements (e.g., tribometer for railways and biotribometer measurements).
Pin-on-disc is one of the most commonly utilized simulative tests for evaluating COF in domains of machine elements, machine tools and manufacturing processes, and for various other industrial applications. This experimental technique consists essentially of a pin in contact with a rotating disc, and the COF is determined by measuring the tangential and normal forces acting on the pin via a two-dimensional load cell. For analysis of frictional sliding contact in metal cutting, the pin is usually made of workpiece material, and the disc is obtained using the same material and coating as the cutting tool. Complementary configurations are also possible. Some of the criticism of this technique derives from the fact that in metal cutting, chip slides over the rake surface and never comes back again, whereas the pin rubs the disc on the same cyclical path. Some researchers also claim that pin-on-disc testing is not adequate for evaluating the COF in metal cutting because it is not capable of reproducing the contact pressure, interface temperature and relative velocity that are found in real metal cutting applications [23]. As a result, several improvements and alternatives to pin-on-disc testing have been proposed [24,25,26]. Another criticism on this technique derives from the fact that in metal cutting, the underside of the chip is of virgin and chemically active metal, whereas the pin always slides over a metallic oxide layer. Other continuous and reciprocating sliding friction tests and wear evaluation tests, such as ball-on-disc, ball-on-plate, cylinder-on-disc, cylinder-on-plate and disc-on-disc, despite different types of contact geometries, suffer from the same problems as the pin-on-disc test. Similarly, extreme contact pressures (e.g., approx. 3 GPa for maraging steels) and temperatures (e.g., 900 °C in titanium alloys) at the chip–tool contact interface can serve as elimination criteria for most of the commonly used and referred tribometers and methodologies in literature for COF calibration [27,28,29]. Nevertheless, a possible candidate may come from the domain of metal forming where extreme loading conditions can be also found in hot forging and extrusion processes, among others. Simple metal forming operations can be used here as simulative tests to reproduce such extreme tribological conditions. In the literature, several types of tribological tests can be found, such as ring compression, upsetting, cigar test, double cup extrusion, compression twist, strip reduction and indenter sliding tests, among others [30,31,32,33,34,35,36,37,38]. They are often characterized by resorting to machine tools, such as hydraulic presses, eccentric presses, sheet metal rolling machines and drop hammers, among others, as viable alternatives to laboratory tribometers. This is because machine tools can easily deliver high compressive loads with tens or hundreds of tons in order to reach high contact pressures. Furthermore, they can also provide severe plastic deformation to assess friction sensitivity to strain hardening [39]. Strain rate and temperature can be also controlled in some of these machine tools. Thus, specific tribological conditions can be achieved by combining a proper tribological test with the loading signature of a machine tool. For the specific case of metal cutting, frictional conditions involving severe plastic deformation, elevated temperatures and high strain rates can be only compared to ring compression under similar operative conditions of hot forging with a drop hammer.
The ring compression test is widely accepted as a reliable tribological test, particularly for bulk and sheet metal forming applications [40,41,42]. This tribological test consists of uniaxial plastic compression of ring-shaped specimens between two flat parallel platens. As its height is reduced, the ring expands radially outward, and inner diameter variation depends on the frictional conditions at the ring–platens contact interface. Friction limits expansion, and thus inner diameter expands less as friction increases. After a critical friction value, the inner diameter can become smaller than the original diameter [43,44]. The calibration procedure consists of comparing experimental measurements with a calibration diagram. Each of its calibration curves is determined by numerical simulation using the flow stress of the workpiece material, and therefore, a numerical value can be assigned to friction. The preferences for friction factor (FOF) and friction coefficient (COF) in the domains of metal forming and metal cutting, respectively, could be conveniently discussed. Yet, when polished compression platen is employed, a clear correlation between both parameters can be found.
One of the drawbacks of ring test is the need for an effective mechanical characterization under a wide range of loading conditions. This is not only a time-consuming process, but can also affect the numerical accuracy of the calibration diagram. Another disadvantage is its low friction sensitivity for small plastic deformations that, when combined with small and difficult-to-measure inner diameters, reduces experimental accuracy. Moreover, opponents of the ring test point out that experimentation is usually performed with platens that have surface roughness significantly different from that of real industrial applications. Indeed, the ring test has its origins in metal forming tribology, where tools typically have polished or mirrored surfaces to help material flow. Yet, the compression platens can be easily textured to reproduce the surfaces microgeometry of cutting tools. Research on this topic reveals the need for a comprehensive discussion about the influences of surface roughness and relative mechanical properties of tribo-pair materials under dry and lubricated conditions [45,46]. From a metal cutting point of view, there is another issue which causes concern. In metal cutting, contact surface is formed near the cutting edge and is integrally made of non-oxidized and chemically active metal, whereas in the ring test, the non-oxidized surfaces are formed by breakage of oxide films as compression proceeds and the ring specimen expands. It is still possible to remove oxide films from the surface prior the uniaxial compression of the ring specimen [47]. Moreover, it has been argued that simpler and linear plastic flow of ring test is not yet well correlated with complex sliding and curling of chip flow. These and many other issues need to be clarified before accepting the ring test as a viable technique for COF calibration.
2.2. Compliance of the Ring Test with Metal Cutting
The orthogonal cutting test can be used as a simplification of complex machining processes in order to better understand the associated chip formation mechanisms. Although not considered a tribological model, it can still be adapted in order to directly evaluate the friction coefficient, as a simulative test. A cutting tool with null rake angle and sharp cutting edge oriented perpendicular to the cutting direction grants suitable conditions for direct measurement of the associated normal and tangential forces relative to the rake face, and thus allows a simple estimate for the value of the apparent friction coefficient (aCOF). Figure 1 illustrates the tribological interaction between a just-formed chip and a cutting tool. Material flow is redirected by the cutting tool, which applies significant contact pressure to achieve fully plastic deformation across the chip depth-wise and its separation from the workpiece. Thus, there is a rapid change in both velocity and direction for the plastic flow, and the chip starts to slide progressively until it reaches a constant exit velocity (Ve) parallel to the rake surface and thrust force (Ft), as shown in Figure 1b. For a null rake angle, thrust force (Ft) is usually considered identical to friction force (Ff). However, an unintended round cutting edge close to chip separation zone promotes a complex material flow that limits a proper evaluation of the friction coefficient, as shown in Figure 1c. As material flows around the tool’s cutting edge, a vector normal to the tool surface turns by approximately 90° and the local friction force vector is no longer parallel to the thrust force (Ft), affecting the friction coefficient assessment. The direction of the newly formed surface is perpendicular to the chip flow as the vector normal to friction. In this way, it can be concluded that a commercial cutting insert is not suitable for evaluating the tribology in the cutting process due to its geometry. In this sense, tribological tools with well-defined contact geometries are necessary for the correct evaluation of friction, while at the same time ensuring adequate control of the chip plastic flow. In addition to the tool geometry, the surface condition is also extremely relevant for friction assessment. Tools with polished clearance surfaces are necessary, as the use of tools with rough surfaces will increase the associated forces, and thus the apparent coefficient of friction will increase. Thus, the clearance surface should be polished as much as possible, and the rake face roughness is a tribological parameter that depends on the insert’s manufacturing procedures and wear evolution during machining. In summary, the cutting edge’s sharpness, clearance angle and clearance surface condition are also of crucial importance for metal cutting tribology.

Figure 1.
Schematic representations of the tribological interactions between a tool and a workpiece material under orthogonal metal cutting conditions. (a) Schematic representation of plastic flow over the rake surface and relative mean stress during chip formation. Schematic representations of two main tribological zones: (b) Rake surface having a null rake angle for easy determination of friction based on cutting load monitoring, and (c) rounded cutting-edge near the separation zone influencing the friction stress components and friction coefficient assessment.
In general, the cutting tool interface is divided into at least three different zones: (i) a first zone contiguous to the cutting edge (blue solid line in Figure 1c), in which material separation occurs under extreme contact pressure and the just-machined surface slides underneath the clearance face, despite a positive clearance angle; here, determination of the strain and stress distributions is challenging due to several factors, such as the size effect (e.g., small contact area), process dynamics (e.g., tool vibrations) and system rigidity (e.g., elasto-viscoplastic behavior of material flow, elastic deformation of workpiece-tool-part set and material elastic recovery) [48,49,50]; (ii) a second zone (red solid line in Figure 1c) in which the chip slides on the tool rake surface without material built up, despite the high contact pressures and high temperatures; (iii) a tertiary region which is not accounted for in the current research, where the chip material attaches to the tool rake surface, in the vicinity of the point where the chip detaches from the tool, contributing to an increase in the thrust force. Attached material zones promote an apparent increase in rake face roughness, which requires further energy to be sheared out, allowing chip sliding. These welded spots’ density increases with the oxygen concentration and temperature [51,52,53,54]. Even if different contact zones are expected, in practice the tribological tool has a single continuous solid surface of homogeneous material and superficial texture. The plastic deformation and chip separation are material responses to the cutting load.
Figure 2 shows a finite element model utilized in the numerical simulation of orthogonal metal cutting for the analysis of material flow over the tool surface and qualitative identification of the tribological conditions. These numerical simulations were performed with the finite element program Deform 2D under plane strain conditions considering both initial (transient) and steady-state material flow. The models were obtained by discretizing the cross-section of the workpiece into quadrilateral elements, along with the contour of the cutting tools (considered as rigid), by means of contact-friction linear elements. Simulations made use of the Amontons–Coulomb friction law under a friction coefficient of 0.4 and a material initial flow stress of 1 MPa. Strain hardening was taken into account with a 20% slope (linear strain hardening rule) based on a Lagrangian with remeshing and implicit integration schemes. The material flow is depicted in Figure 2c, together with the tangent material speed relative to the tool surface. This simulation corroborates with the schematic representation presented in Figure 1, wherein the stagnation-point (N) is visualized and the tangent material speed increase as the material flows further away from the stagnation point. In general, tool surface locations with relatively lower contact velocity (tangent velocity) correspond to higher hydrostatic pressures, which could be well above the material flow stresses. The maximum pressure is correlated with the two-dimensional stagnation-point flow where material is separated and forced to slide over the rake face to form the chip and underneath the clearance face to form the machined surface. Beyond the description of the bulk plastic flow based on the typical tool features (rake and clearance faces, and cutting edge), the tool surface can be considered as a continuous surface over which material slides under frictional contact conditions.
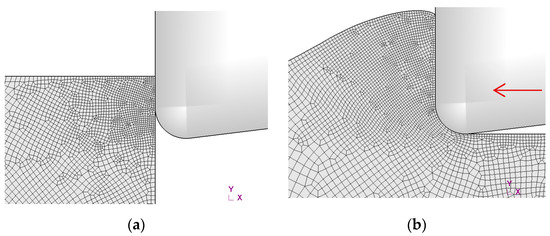
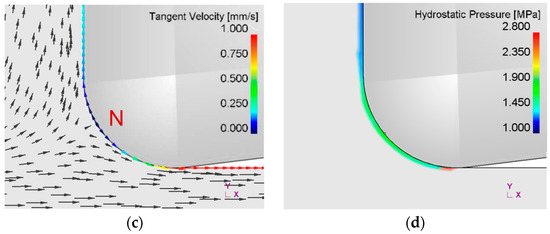
Figure 2.
Numerical simulation of orthogonal metal cutting for analysis of material flow over the tool surface and qualitative identification of tribological conditions: (a) undeformed mesh of the finite element model; (b) deformed mesh under chip formation conditions; (c) material flow direction around the cutting edge with illustration of the tangent velocity over the tool surface with a clear two-dimensional stagnation-point flow; (d) numerical estimate of hydrostatic pressure for finite elements with tool contact.
Simulative calibration techniques must be able to reproduce the frictional conditions occurring at the contact interface under laboratorial conditions. Figure 3 illustrates the tribological interaction between the ring-shaped specimen and flat compression platens. Fully plastic expansion occurs due to high contact pressure imposed by the compression platens. Compression velocity (Vc) could be constant or variable but must be adjusted in order to reach a comparable relative velocity at the contact interface. There is a rapid change in velocity and direction of plastic flow and the material starts to slide progressively in opposite directions: (i) inward material flows over a relief contact length, Lr, at relief velocity, Vr, and (ii) outward material flows over an exit contact length, Le, at exit velocity, Ve, by analogy with metal cutting nomenclature. Therefore, one can conclude that tribological conditions at the contact interface are relatively well defined without any significant singularity, and the ring test can be used for a proper evaluation of friction.
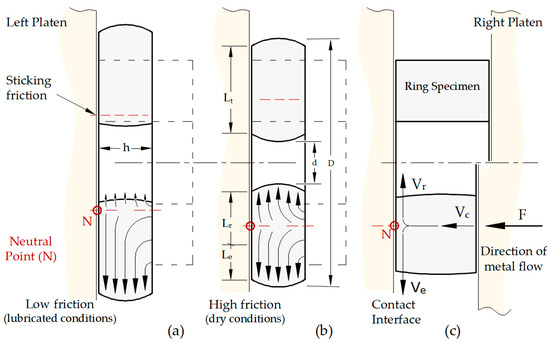
Figure 3.
Schematic representation of the tribological interaction between the tool and workpiece under the plane strain conditions of the ring compression test. Schematic representation of different lubrication conditions: (a) lubricated contact interface in order to obtain low contact friction typical of mechanical testing, and (b) dry contact interface in order to simulate frictional conditions at the tool–chip interface; (c) schematic representation of the stagnation point, also known as the neutral point (N)—the outcome of plastic deformation whose radial positions depend on the friction value.
Figure 4 shows the finite element model used in numerical simulations of the ring compression test for analysis of material flow and quantification of mechanical parameters that affect tribological conditions. Numerical parameters (e.g., element type and size, material model, numerical integration scheme, isothermal conditions and tool rigidity, among others) and physical input data (e.g., material constants, friction coefficient value and quasi-static deformation) employed in the ring test simulation were equal to those of metal cutting presented above, in order to guarantee comparable results, except for compression velocity, whose value was reduced by a factor of 0.7 due to relative differences between two-dimensional deformation of metal cutting and axisymmetric deformation of ring test, both under plane strain deformation. Additionally, input data were defined based on unit values for the sake of clarity, which will be presented in the following section. Figure 4e shows material flow for the ring test, together with the tangent material velocity over tool surface. This simulation corroborates the schematic representation presented in Figure 3, where the stagnation point (N) is visualized and the tangent material speed increases as the material flows further away from the stagnation point. Numerical distribution of bulk horizontal stress through ring section is shown in Figure 4c, and the corresponding bulk vertical stress is depicted in Figure 4d. The stress field distribution presents some symmetry. This stress equilibrium points to a near bulk stagnation region in plastic flow. This plastic stagnation occurs at a constant orientation of the normal vector, perpendicular to compression platens’ surfaces. Both plastic contraction and plastic expansion occur simultaneously on the same radial direction over a flat surface with the same origin (two-dimensional stagnation-point flow). Thus, plastic flow is well-confined between flat and parallel compression platens, which promotes the accuracy of inverse calibration procedures. By contrast, single rake surface allows the chip to flow more freely under unconfined compression and variable chip curling. This free plastic flow promotes variable contact area and contact pressure, affecting the accuracy of friction calibration. Moreover, the cutting edge size effect makes the influence of small shifts of the stagnation point significant on cutting force vector values. Thus, direct and inverse calibration of the friction coefficient based on orthogonal cutting are both expected to result in lower accuracy compared to a much more controlled tribological test than the ring compression test.

Figure 4.
Numerical simulation of the ring compression test utilized for analysis of material flow over the tool surface and qualitative identification of tribological conditions. Representations of (a) undeformed mesh and (b) deformed mesh of the finite element model. Numerical distributions of (c) bulk radial stress and (d) bulk axial stress in a cross-section of the ring specimen. Numerical estimate of the material flow direction (e) with the tangent material velocity at the ring–platen interface with a clear label for two-dimensional stagnation point (N).
2.3. Estimation of Mechanical Contact Conditions
A candidate tribological test must be able to provide mechanical contact conditions similar to those at chip–tool interface. These mechanical conditions can be described by several interface parameters, such as contact pressure, relative velocity, material strength, strain rate and interface temperature. In what follows, a quantitative evaluation of some of these parameters will be presented for both the orthogonal cutting test and the tribological ring test. Special emphasis is placed on contact pressure and relative velocity as the mechanical parameters that most influence the friction coefficient. However, the complex geometry of cutting tools does not allow a direct comparison with the ring test. The vector normal to the contact interface changes direction as plastic flow passes around the cutting edge, which makes normal and tangential forces difficult to measure in metal cutting. Thus, unfolding the chip–tool interface in one-dimensional space is proposed to facilitate the analysis. A pivot point at the intersection between cutting edge (non-linear contact) and rake surface (linear contact) has been defined for contact interface rotation, as shown in Figure 5. An adimensionalization procedure was also applied to the contact length with the stagnation point as a reference point (abscissa axis origin) for simplicity.
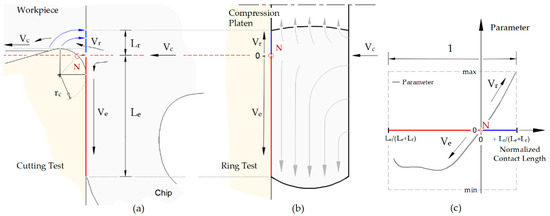
Figure 5.
Frictional interface correlation of the metal cutting test with the ring compression test. (a) Planification of the cutting tool surface for comparative proposes. (b) Dry frictional interface of the ring test as most appropriate due material flow lines (specially under high strain rate conditions). (c) Schematic representation of relative velocity over the contact length (tangential velocity between surfaces in contact) with reference to the neutral point (N).
Figure 6 shows the computed relative velocity at the contact interface for the proposed mechanical analogy. The ring test and the cutting test present similar relative velocity curves, each with an obvious null value at the abscissa axis origin (defined as reference or neutral point, N). Exit velocity (Ve) and reverse velocity (Vr) were defined as positive and negative directions, respectively. The trends and velocity values are quantitatively comparable. It should be noted that adimensionalized direct length (Le) and reverse contact length (Lr) present similar relations for both orthogonal cutting and ring compression tests. The adimensionalization of total contact length (Lt = Le + Lr, unitary value depicted in Figure 5c) did not impose a similar relation for each component (Le and Lr). The good correlation summarized in Figure 6 resulted from an adequate selection of the cutting-edge radius and uncut chip thickness values. In contrast, rake angle should be a fixed null-valued parameter. A small decrease in its value considerably influences contact pressure and contact area, making chip sliding over the rake surface more difficult, and chip deviation inefficient. The chip tends to become thicker and straighter as the sliding velocity reduces (chip velocity). This is even more significant as friction increases, also promoting reverse material sliding towards the clearance surface. Such complex tribo-mechanical conditions were also present in the ring compression test, where the internal diameter was found to decrease with increasing friction, and the main plastic flow still occurred in the reverse direction. The inward and outward flow rates were controlled by the frictional conditions.
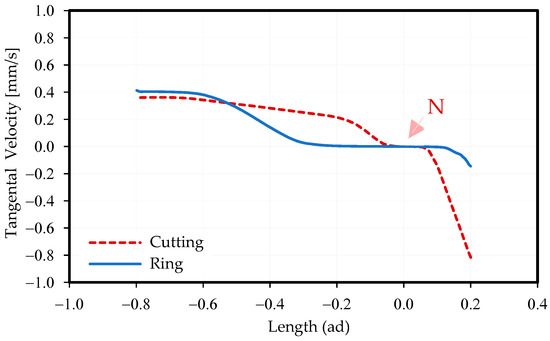
Figure 6.
Relative velocities of the finite element nodes in the tangential direction as plastic flow proceeds with reference to the neutral point (N).
Contact pressure favors the real contact area between the workpiece material and tool. The higher the contact pressure and the more asperities protruding out of surface, the more significant the sliding resistance. Figure 7 shows an estimate of the mechanical pressure distribution over the contact interface and the transition towards bulk mean stress of finite elements with tool contact. The ring test and cutting test present good qualitative correlations for both contact pressure distribution at contact interface (Figure 7a) and mean stress of external material layer (Figure 7b) for the proposed mechanical analogy. Contact pressure reaches local maximum values at the extremities, where material separates from tool and discontinuities are expected to occur. Yet, stable high-pressure values can be observed around the stagnation point. Contrary to common belief, often referred to in metal cutting literature, contact pressure values at the chip–tool contact interface are substantially lower and more localized than those of ring test. The double contact interface of the ring test further limits material expansion, and higher contact pressure can be expected. Moreover, a higher friction sensitivity is also expected for the ring test.
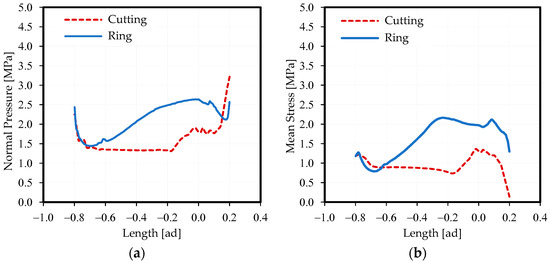
Figure 7.
Mechanical contact loading: (a) calculated normal contact pressure distribution over the tool surface based on the numerical solution for the state of stress, in which (b) mean stress of finite elements with tool contact is the bulk parameter that best reflects superficial contact loading.
The contact pressure of ring test can be adjusted by controlling the height reduction of test specimens, since its value is correlated with plastic deformation. This allows one to reproduce contact pressure from the transient regime to the steady-state conditions of metal cutting. The contact pressure of metal cutting can be also influenced by geometric parameters of the cutting tool, such as rake angle. The rake angle may have positive, negative or even null values, varying usually between −15° and +15°. This indirectly affects machinability by changing the contact pressure, friction force, chip flow, strain and state of stress, among other parameters. For instance, negative rake angles and large cutting-edge radii are typically employed in rough machining operations to promote tool strength. For those conditions, the ring specimens should be submitted to larger plastic deformation in order to reach appropriate contact pressure values. In Figure 7a, a smaller specimen height reduction would allow a better quantitative correlation between both normal contact pressure curves.
Figure 8 shows calculated stress and strain distribution for finite mesh elements with tool contact. Effective strain (Figure 8a) and effective stress curves (Figure 8a) of the ring test and cutting test correlate qualitatively well for the proposed mechanical analogy. Effective strain curve reached a few numerical simulation steps before getting to a steady-state regime, a maximum value at the extremity where the machined surface separated from relief surface (Lc). Effective strain is a non-obvious contact mechanics parameter that is yet relevant, since contact interlocking strength also depends on asperities’ strength. Their structural strength increases with plastic deformation and strain hardening. Although a higher effective strain at relief contact length was expected for metal cutting (twice that of ring test, Figure 8a), its impact on friction depends on strain hardening coefficient value. As the mechanical responses of most materials in the high strain rate conditions of practical machining tend toward the perfectly plastic response, differences between cutting and ring tests at the relief surface can be considered as minor issues. On the contrary, at the neutral line of the ring test, there is a dead zone where friction stress changes direction and effective strain reaches a minimum; this position remains almost unchangeable during the uniaxial compression and thus no significant strain hardening nor heat generation are expected to occur. Finally, both effective strain (Figure 8a) and effective stress curves (Figure 8b) are shown to have similar signatures over the exit contact length (Le). As chip flow proceeds and effective strain reaches a steady-state regime at the exit contact length, a better correlation of those parameters could be expected.
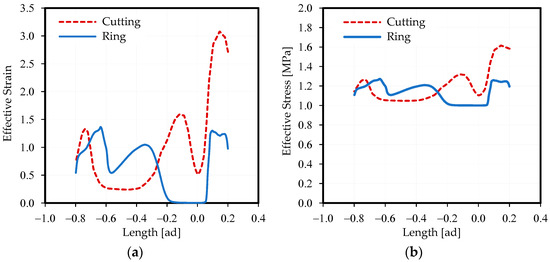
Figure 8.
Calculated stress and strain distribution for finite mesh elements with tool contact (outer layer): (a) effective strain and (b) effective stress.
2.4. Identification of Tribology and Plasticity Models Constants
In this research, a methodology for independent identification of friction and plasticity models’ constants is proposed. The methodology can be also applied under extreme mechanical conditions. For that, a combination of both ring and cylinder compression tests (performed in identical tribo-mechanical conditions) has to be employed, enabling not only the estimation of the friction coefficient (COF) for the selected specimen–platens pair, but also the frictionless flow stress curves. The cylinder compression tests are affected by the COF, leading to overestimated flow stress data, also known as apparent flow stress curves. Nevertheless, the real flow stress curves, herein referred to as frictionless flow stress, can be estimated by resorting to numerical simulations and inverse analysis, if the COF involved in the compression test is anticipated. With a proper friction coefficient value, the load–displacement curve of the cylinder compression test can be fitted through a try-and-error iteration process. In this respect, the ring compression tests performed in the same test setup and conditions of the cylinder compression tests constitute an excellent way to provide the required friction data. Still, the COF assessment through the ring compression tests requires the evaluation of the friction calibration curves via numerical simulation, which in turn requires the material’s mechanical response. Therefore, the proposed methodology leads to an iterative process where the flow stress and friction coefficient must be iterated between the cylinder compression and ring calibration simulations until convergence is attained for frictionless flow stress curves and friction coefficient values. Figure 9 illustrates the proposed flowchart that can be used to extract the friction coefficient value and the frictionless flow stress curve from a combination of cylindrical and ring compression tests. This flowchart can be applied for any tribo-mechanical testing conditions (e.g., strain, strain rate, temperature and lubricant type), since the same conditions are strictly applied to the ring and cylinder compression tests.
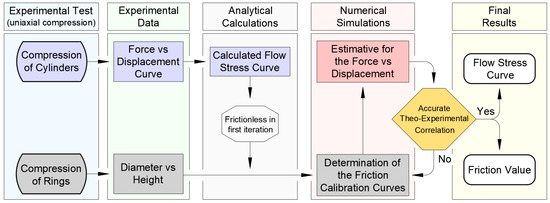
Figure 9.
Flowchart of the optimization-based methodology for the independent calibration of tribology and plasticity models’ constants for metal cutting simulations.
In order to validate the applicability of the proposed methodology, a virtual simulation environment was adopted (refer to Figure 10). Later in this paper, applications of the methodology to real materials are provided. Nevertheless, this virtual simulation environment is the ideal place to start, since friction value and material model constants are known a priori (refer to Figure 10a), thereby facilitating the validation of the convergence methodology. In addition, any experimental scatter or bias is disregarded, as the experimental testing is replaced by virtual testing, avoiding any interference in the analysis procedure and discussion. Therefore, experimental data are substituted with computed data obtained from the ring and cylinder compression simulations with the imposed reference tribo-mechanical conditions (given friction value and frictionless flow stress curve). Figure 10b shows the computed load–displacement curves for the cylinder test, and the computed diameter vs. height plot for the ring compression tests, which should be assumed as virtual test data. The apparent flow stress curve is calculated based on the load–displacement curve of the virtual cylinder compression test. The friction calibration curves are computed using different COF values, and a first guess for the friction coefficient value is obtained by comparing the reference diameter vs. height plot with the friction calibration diagram. These first estimations for the tribo-mechanical parameters are considered iteration 0 of the proposed methodology (refer to Figure 10c).
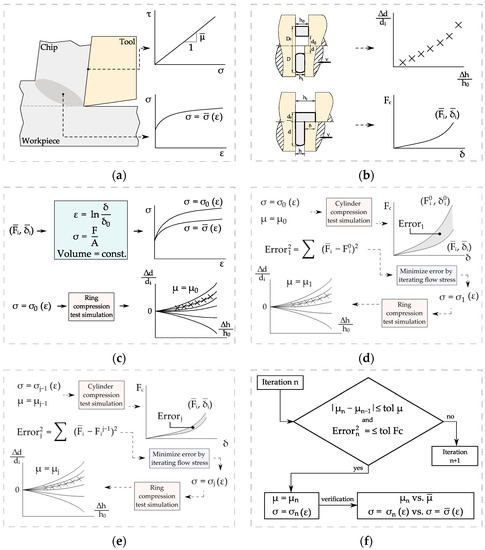
Figure 10.
Workflow proposed for the friction and flow stress determination: (a) reference tribo-mechanical parameters; (b) virtual test data (simulation) of ring and cylinder compression tests calculated using reference tribo-mechanical parameters; (c) iteration 0 of the proposed procedure; (d) iteration 1 of the proposed procedure; (e) iteration j of the proposed procedure; (f) convergence criteria check of the iterative process and final verification.
The apparent COF value and flow stress curve serve as initial conditions for the iterative process (refer to Figure 10d,e). The iterative process begins with the inverse simulation of the cylinder compression test (keeping the COF constant at the reference value), which should be performed until the error in the simulated F-δ plot with respect to its reference value is minimized. This can be performed using an optimization procedure aiming at the minimization of the error function (objective function) by changing the flow stress function parameters. Then, the friction calibration curves are updated using the new flow stress curve, and a new COF value is obtained. With the new flow stress curve and COF value, the iterative process could be repeated until stabilization between iterations of the COF value is verified, and the F-δ error is lower than a stipulated tolerance (refer to Figure 10f).
In order to demonstrate the proposed methodology, a virtual material with a simplified flow stress model was assumed. Its mechanical response was defined by a unitary yield stress combined with a 20% linear flow stress increase with plastic strain (refer to Figure 11a). As concerns the friction model, the Coulomb friction model with a constant COF value of 0.3 was assumed. Numerical implementation of the workflow presented in Figure 10 was performed using ABAQUS with a static-implicit integration scheme. Compression platens were simulated using a rigid contour profile with a penalty contact algorithm. It is important to highlight that the proposed methodology is sufficient in general to accommodate other friction models or flow stress models. Concerning the flow stress evaluation, the frictionless stress–strain relation is sought out, which may be established in a tabular form or using predefined constitutive equations. While the first is more adequate for completely unknown or complex mechanical response materials, the second is advised for materials known to follow certain types of constitutive equations. Depending on the form adopted for the flow stress representation, the inverse determination of the flow stress may be more or less computationally challenging, requiring in some cases automated optimization algorithms. In order to make it simple and clear, in this demonstration process, linear strain hardening was assumed for the material, and during the iterative process, we limited the search to the same kind of flow stress behavior, which means searching for the plastic tangent modulus value. Nevertheless, the generality of the procedure was not touched, since continuously linear hardening would be more challenging for optimization convergence than the strength saturation behaviors of ordinary engineering materials. Thus, with that assumption for the strain hardening, we highlight the convergence robustness of the prosed algorithm.
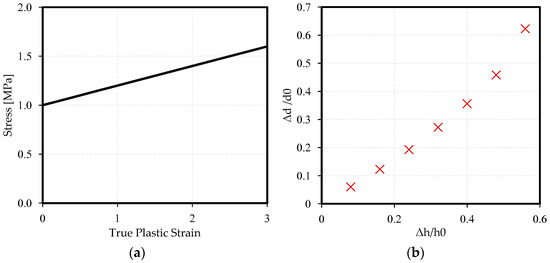
Figure 11.
Virtual tribo-mechanical input data for demonstrative purposes related to the proposed methodology; (a) frictionless flow stress and (b) ring compression test data (COF value of 0.3).
Figure 11b illustrates the virtual ring compression test data simulated using the known conditions of flow stress (Figure 11a) and a constant COF value of 0.3. Figure 12a presents the load-displacement (F-δ) curves for the cylinder compression: “ref” curve corresponds to the virtual test data simulated using the known conditions of flow stress and friction; “it1” and “it2” curves correspond to the starting points for the iterations. It is clear that the starting point for the first iteration significantly overestimated the F-δ reference curve, due to an overestimation of both the flow stress curve and the COF value (refer to Figure 12a). Nevertheless, the algorithm had fast convergence, since the F-δ curve estimated at the beginning of iteration 2 is almost coincident with the virtual friction calibration curve (refer to Figure 12b). Additionally, the COF at the end of iteration 2 is 0.28 and fully converged in the third iteration (refer to Figure 12c).
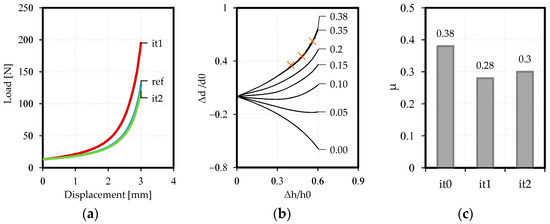
Figure 12.
Numerical application related to the workflow proposed for the independent friction and flow stress estimations: (a) load–displacement curves for uniaxial compression of cylindrical specimens, (b) initial estimates for the friction coefficient based uniaxial compression of ring specimens, and (c) iterative convergence for the COF value.
3. Materials and Experimental Methods
This section presents the materials and experimental methods used to perform the tribo-mechanical tests. It also details the experimental setup proposed for the independent calibration of friction and plasticity models under controlled laboratory conditions.
3.1. Materials
The choice of test materials to ensure a wide range of tribomechanical conditions was of crucial importance for assessing the calibration methodology proposed. Two distinct metallic materials were chosen: (i) UNS L51120 lead alloy was chosen because its low mechanical strength, high strain-hardening and ductility, and (ii) 18Ni300 maraging steel was chosen owing to its complementary mechanical response. Two distinct metallurgical conditions for 18Ni300 were considered, conventional (CM 18Ni300) and additively manufactured (AMed 18Ni300), owing to the novelty of this materials and the scarce information about the influences of its metallurgical conditions on friction. The AMed 18Ni300 material batch was built through laser powder bed fusion [55]. The porosity of the AMed 18Ni300 maraging steel was calculated through metallographic imaging for the two distinct relevant directions: perpendicular and parallel to the build, as shown in Figure 13. There was no influence of printing direction on the materials’ porosity, and a relative density of 99.7% was measured, very close to the manufacturer’s technical description (99.8%). The grain morphology and melt pool bath structure were revealed using chemical and electrolytical etching, respectively. Figure 14a,b shows the distribution of lath and plate martensite in the austenite matrix for the AMed (in perpendicular-to-build direction) and CMed metallurgical conditions. Figure 14c,d shows electrolytically etched samples in the perpendicular and parallel-to-build directions, where laser trace and melt pool geometry are evident. Spark emission spectroscopy enabled verification of compliance of the alloys’ chemical compositions with the relevant material standards (refer to Table 1). The suitability of the 18Ni300 maraging steel towards AM processing was evidenced by the residual carbon content (martensite crystal structure is obtained by nickel addition), which promotes the material’s weldability/printability [56,57]. Reference values for chemical composition of UNS L51120 lead alloy are depicted in Table 2.

Table 1.
Chemical composition (wt%) of 18Ni300 AMed maraging steel with respective reference values, based on [58].
Table 1.
Chemical composition (wt%) of 18Ni300 AMed maraging steel with respective reference values, based on [58].
| Ni | Co | Mo | Ti | Si | Mn | C | P | S | |
|---|---|---|---|---|---|---|---|---|---|
| Standard min | 18.0 | 8.5 | 4.6 | 0.5 | - | - | - | - | - |
| Standard Max | 19.0 | 9.6 | 5.2 | 0.8 | 0.10 | 0.10 | 0.03 | 0.01 | 0.01 |
| Current | 18.80 | 8.84 | 5.15 | 0.65 | 0.05 | 0.03 | 0.02 | <0.001 | <0.001 |
Table 2.
Reference values for chemical composition of UNS L51120 lead alloy, based on [59,60].
Table 2.
Reference values for chemical composition of UNS L51120 lead alloy, based on [59,60].
| (wt%) | Ag | As + Sb + Sn | Bi | Cu | Fe | Pb | Zn |
|---|---|---|---|---|---|---|---|
| Standard min | 0.002 | - | - | 0.04 | - | 99.90 | - |
| Standard Max | 0.02 | 0.002 | 0.005 | 0.08 | 0.002 | - | 0.001 |
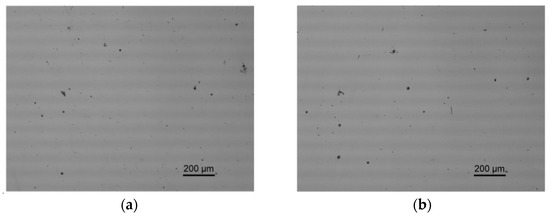
Figure 13.
Unetched metallographic samples showing voids in both (a) perpendicular and (b) parallel-to-build directions of 18Ni300 AMed maraging steel [61].
Figure 13.
Unetched metallographic samples showing voids in both (a) perpendicular and (b) parallel-to-build directions of 18Ni300 AMed maraging steel [61].
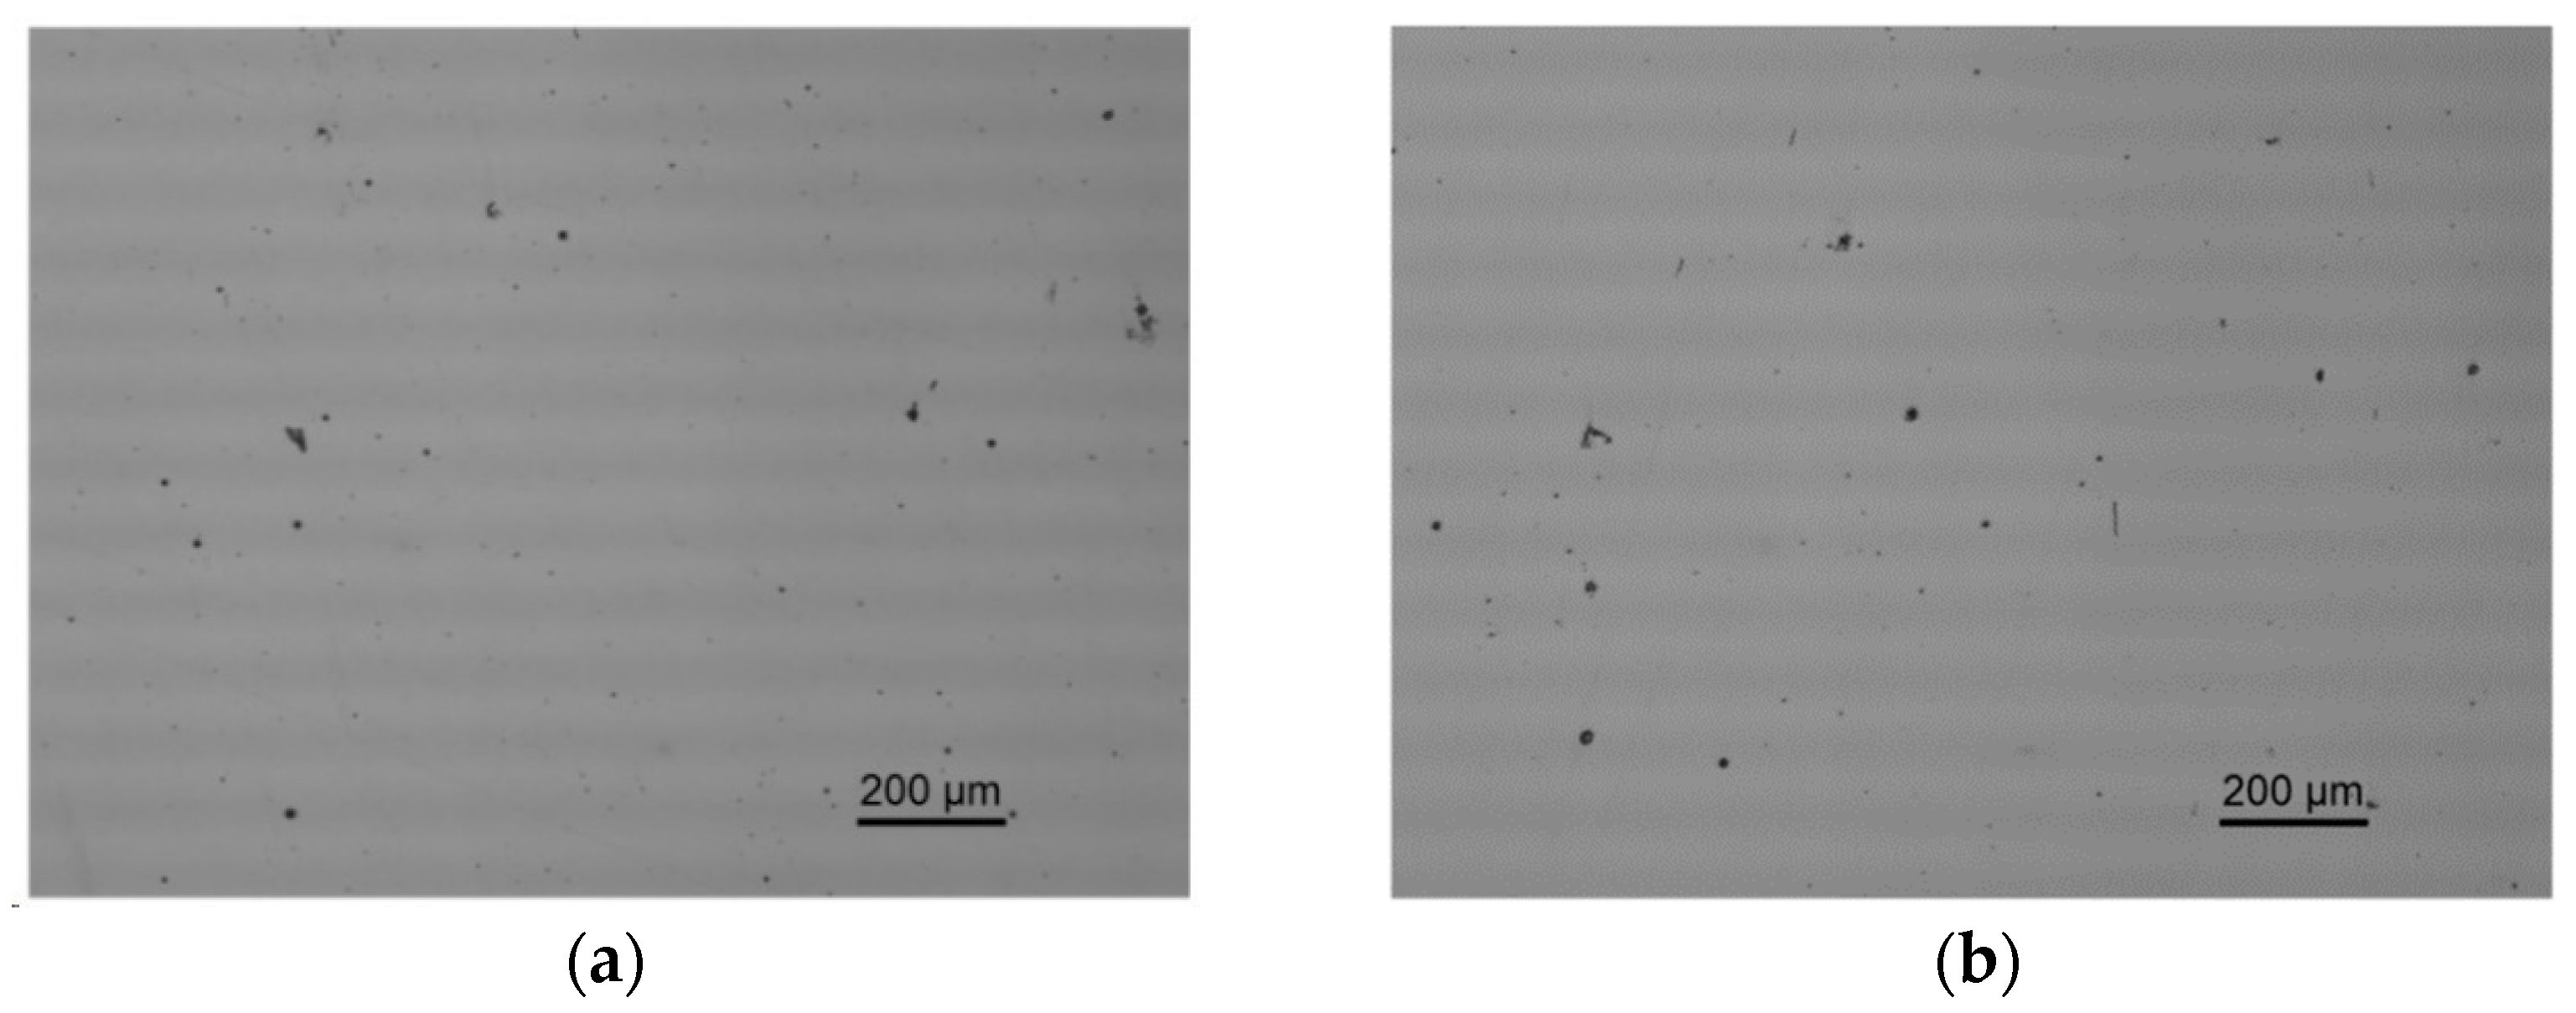
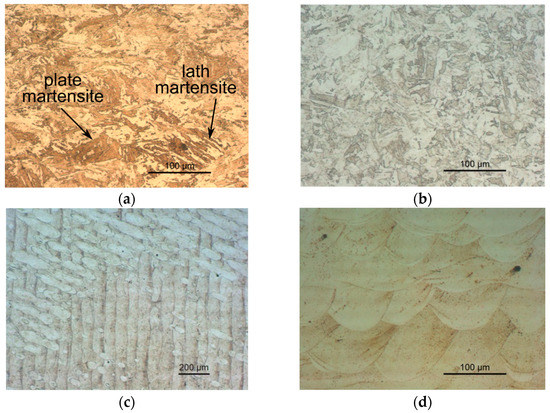
Figure 14.
Chemically etched metallographic samples of (a) AMed and (b) CMed maraging steel; electrolytically etched samples in (c) perpendicular and (d) parallel-to-build directions of AMed maraging steel [55].
Figure 14.
Chemically etched metallographic samples of (a) AMed and (b) CMed maraging steel; electrolytically etched samples in (c) perpendicular and (d) parallel-to-build directions of AMed maraging steel [55].

The tribo-pair was constant throughout the experimental research. Tungsten carbide cutting tools and compression platens were used, given the required compromise in terms of hardness and toughness. They were manufactured through powder metallurgy, compactation and consolidation of tungsten carbide with 15 wt% cobalt metallic binder provided by Palbit S.A (Albergaria-a-Velha, Portugal). This material is specially produced with a high cobalt content to promote fracture toughness and withstand the shocks and vibrations of impact testing in total safety. WC–Co cemented carbide has a very high material hardness, even when subjected to severe mechanical and thermal conditions, which is relevant because one of the test materials was a high strength steel. Compression platens were polished to an arithmetical mean height of the profile lower than 0.05 μm, in order to minimize the asperity’s interlocking contribution when it comes to friction mechanisms. A PVD TiAlSiN coating approximately 2.5 μm in thickness (using HiPIMS process, provided by Palbit S.A.) was applied to the compression platens and cutting tools to control the chemical adhesion between the platens–specimen material pairs. Industrial inserts with a higher arithmetic average roughness profile (Ra) were also employed, as seen in Table 3. The profile roughness of the industrial inserts was measured by a roughness tester (Kosaka Lab SE 1200), and the cutting inserts that have been prepared for the laboratorial tribological tests were measured by an atomic force microscope, Veeco, Digital Instruments D3100 + Nanoscope IIIa, using a Veeco Tesp tip, tapping mode over a measuring area of 20 × 20 μm2. In the latter case, average profile roughness was determined based on the surface topography analysis perpendicular to the cutting edge. At least 3 measurements were taken on each side of the cutting inserts considering the possible influence of Ra deviations on the accuracy and repeatability of the tribological tests. Average values and standard deviations of Ra are presented in Table 3.
Table 3.
Technical specifications of the tools.
3.2. Experimental Setup
Both cylinder and ring uniaxial compression tests were carried out in a customized universal testing machine, specially designed to provide a wide range of temperatures and strain rate conditions. This apparatus makes use of a single load cell and specific displacement transducers for all testing conditions, ranging from quasi-static to high strain rate tests, thereby eliminating errors induced by experimental methodologies using a wide range of testing machines. Depending on the testing requirements, a suitable actuator was selected (Figure 15). For tests at quasi-static conditions and very low strain rates (less than 1 s−1), a hydraulic ram cylinder was used, since it allows steady engagement with no compromise on the attained loads. Dynamic testing conditions could be grouped into two categories: (i) medium strain rate tests (102 to 103 s−1) and (ii) high strain rates (over 103 s−1). For the former, an electromagnetic actuator was used, whereas for the latter, a pneumatic gun was employed (Figure 16a). To allow thermo-mechanical testing conditions above reference room temperature, up to 900 °C, a heating unit was installed. This heating unit was composed of an electric furnace (Figure 16c) that enclosed the compression platens, as seen in Figure 16b.
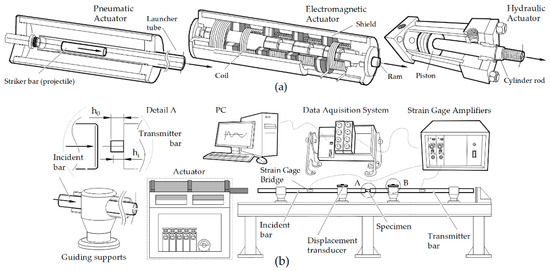
Figure 15.
Schematic representation of the uniaxial testing machine. (a) Interchangeable actuators to enable a wide range of strain rate conditions, and (b) overview of the experimental apparatus. “A” shows the specimen’s position in detail, and “B” shows the displacement transducer mounted on the linear guide.
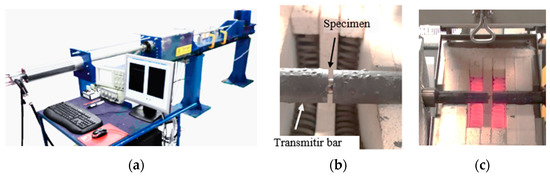
Figure 16.
Uniaxial testing machine: (a) machine configuration for uniaxial compression tests at high strain rates and different thermal conditions, (b) close-up view of a compression specimen under uniaxial compression at room temperature; (c) a uniaxial hot compression test using an electric furnace.
In order to calculate the instantaneous stress, strain and strain rate, the three main physical parameters (time, load and displacement) were monitored. While acquisition of time instant is implicit in data acquisition systems, the recording of both force and displacement needs a series of dedicated transducers. For monitoring load, a full Wheatstone bridge arrangement was used and installed in the first quarter of the transmitter bar, allowing an extended period before the interference of the reflecting waves. To amplify the electrical output, a VISHAY 2310B signal conditioning amplification system was used. Two types of displacement transducers were installed: (i) inductive position sensors and (ii) linear sliding potentiometer sensors; and the applicability of one rather than the other was solely dependent on the thermal conditions. For tests at room temperature, inductive type transducers were mounted directly in between compression platens. These allowed the highest resolution for the experimental measurements at high velocities and harsh accelerations, but also the highest precision and accuracy by evading the complex post-processing procedures necessary to account for the elastic deformation of the apparatus. For tests performed above room temperature, inductive position sensors can no longer be used, so linear sliding potentiometers were adopted. These were mounted directly on both transmitter and incident bars, outside the thermostatic chambers, so that their performance was not affected even by the most demanding thermal conditions. A total of three potentiometers were installed over the set of bars: the incident bar was equipped with 1 potentiometer and the transmitter bar with 2. Thus, the correlation of the differential values of the electrical signals between the potentiometers (Figure 15b) allowed for the determination of the distance between compression platens. A National Instruments PCI-6115 data acquisition board enabled monitoring and recording of all mentioned parameters with simultaneous sampling rates of 2 Mhz.
3.3. Experimental Methodology and Work Plan
The mechanical and tribological characterization were determined following the theoretical and experimental procedures that were previously described, using different temperatures (22, 200 and 370 °C) and strain rate conditions (quasi-static, 300 and 6000 s−1). It should be noted that strain rate was controlled by the normal vector of velocity that was perpendicular to the contact interface, such as impact velocity toward the compression platens and cutting velocity toward the rake surface in the metal cutting tests. Experiments were carried out under dry, unlubricated conditions and in air, similarly to metal cutting conditions. The compression platens utilized in the tribology tests were manufactured and coated using the same materials as the cutting tools to allow the investigation to be exclusively focused on the assessment of the ring compression test to reproduce realistic metal cutting tribological conditions. WC–15 wt% Co substrate and TiAlSiN coat were chosen to be representative of various industrial applications. Compression platens and cutting tools were polished to reduce the number of parameters and its interdependence that influences friction. Otherwise, the number of possible combinations of variables would have become quite large. Specimens were cleaned in an ultrasonic bath and degreased with ethanol, due to the handling of the specimens before and during each test. The cleaning procedures are crucial for reducing contaminants such as hydrocarbons, solid particles, adsorbed moisture and oxides, which can greatly affect an overall friction value. The experiments were done in a random order, and at least two replicates were produced for each test configuration in order to provide statistical meaning. As described in Section 2, complementary to the dry ring compression and cutting tests, lubricated cylinder and ring compression tests were carried out to correct the flow stress curves (frictionless flow stress curve).
Compression tests were performed on axisymmetric specimens in a procedure that involved reducing their heights between two parallel platens by means of uniaxial compression (Figure 17). Two different lubrication conditions were evaluated during ring compression tests: (i) dry contact, to assess the evolution of the friction coefficient with temperature and loading rate conditions representative of metal cutting applications, and (ii) lubricated contact, resorting to a thin layer of graphite grease between contacting interfaces, in order to favor homogeneous plastic deformation during the mechanical testing. The ring compression tests were performed in several compressive stages in order to allow a sequence of experimental measures and thus better describe the evolution of the inner diameter as the compression proceeded. Under high-speed testing, it is not possible to adopt the same practice of the quasi-static testing, where interrupted tests are common. High-speed tests involve a high kinetic energy impact from an incident bar, only permitting a single measure per test. The dimensions of the ring specimens (inner diameter and height) were assessed before and after testing. We used a digital precision caliper, and one experimental point was plotted on the friction calibration diagram for each test. Each specimen was also measured under a microscope using diascopic illumination. Subsequently specimens were cut in half, and their cross-sectional profiles were examined under diascopic illumination in order to detect possible gaps in the experimental data, which could be related to the homogeneity and isotropy challenges of the AMed material and the manufacturing procedures of the test specimens.
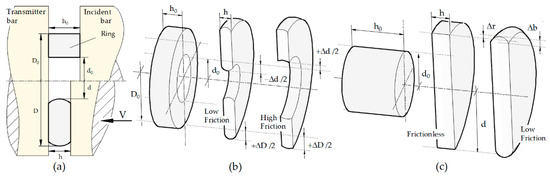
Figure 17.
Basic concepts of the uniaxial compression test for axisymmetric specimens: (a) schematic representation, kinematics and nomenclature of the compression test; (b) schematic representation of the friction’s influence on the deformed ring morphology; and (c) schematic representation of the friction’s influence on the cross-section of a deformed cylindrical specimen: the outer diameter increases with higher friction as compression proceeds.
Ring compression tests were performed using specimens with the following initial dimensions: outside diameter (D0) of 7 mm, inside diameter (d0) of 3.5 mm and height (h0) of 2.5 mm, resulting in an approximate ratio of 6:3:2. Compression tests were carried out on cylindrical specimens with diameters of 4 mm and initial heights of 4 mm. These tests were carried out for a wide range of strain rates, under quasi-static conditions, of up to 6000 s−1, at temperatures up to 370 °C, representing the typical conditions of metal cutting.
This research was mainly focused on tribomechanical characterization of the new AMed metallic materials and friction’s impact on metal cutting processes. Nevertheless, it was important to calibrate the proposed theoretical and experimental system using different kinds of materials. In addition to the AMed 18Ni300 maraging steel (high strength and fragile response), a UNS L51120 lead alloy was also introduced for contrast (low strength and ductile response). The material characterization of UNS L51120 lead alloy was performed by means of compression tests carried out at room temperature on cylindrical specimens using four different strain-rate conditions 0.02, 0.2, 2 and 20 s−1. Specimens with h/d = 1.5 (height to diameter ratio) and h0 = 8 mm (height) were manufactured from the supplied raw material. The larger dimensions of these specimens allowed for an increase in the precision of the experimental measurements compared to the specimens of 18Ni300 maraging steel, which due to their high mechanical strength, required smaller dimensions in order to be able to be compressed in the test machine. Temperature was limited to room temperature due to the extremely low melting temperature of this second material. The experimental planning data are presented in Table 4. The plan was designed to analyze the performance of the ring compression test for friction calibration in metal cutting, and the experiments were performed in a random order. We produced at least two replicates for each test condition. However, not all the experiments provided a valid experimental measure, as will be discussed in what follows. Despite the small number of experiments, these tests seem to provide evidence of the proposed methodology’s performance.
Table 4.
Experimental plan (QS, quasi-static conditions).
4. Results
The results of the present work are divided into three subsections. In the first subsection, the corrected flow stress curves resulting from the procedure described in the previous section are shown alongside the lubricated ring compression results. In the second subsection, the final friction calibration curves for dry ring compression experiments are presented, in addition to the variations in the friction coefficient with temperature, relative velocity and metallurgical condition. Finally, in the last subsection, the estimated friction coefficients are compared with those from metal cutting experiments in order to discuss the adequacy of the ring compression test for metal cutting tribology.
4.1. Tribological and Plastic Determination
The inverse calibration methodology to identify the individual contributions of friction and plasticity has been presented in detail previously. Regarding the mechanical response, it is usually described using an adequate material law and constitutive model, whose parameters must be calibrated. When reliable material constants of the model are not available, the proposed methodology can become a lengthier process. As an alternative, the material response can be described directly by the experimental measurements of the uniaxial compression test under adequate loading conditions, and the constitutive model calibration can be postponed until after the identification of the individual contribution of friction. The following illustrates this idea based on the tribo-mechanical characterization of two distinct materials. One of them is a soft, isotropic and ductile lead alloy whose strain hardening signature is well described by standard material law equations, but the model parameters values are unknown. The second material is an anisotropic and high strength maraging steel. Its mechanical response is unknown a priori, and no regular material law equation provides an adequate level of adjustment.
The tribo-mechanical characterization of UNS L51120 was based on traditional rigid-viscoplastic modelling methodologies, whereas the mechanical response of the conventional 18Ni300 maraging steel (18Ni300 CMed) was described directly by the experimental data. To achieve this, a cylindrical specimen and a ring specimen were both compressed under the same operative conditions (strain, strain rate and temperature), after which the tabular experimental data were employed for friction and plasticity calibration under the individual tribo-mechanical conditions. This methodology was repeated for 18Ni300 CMed under a wide range of operative conditions. Once an adequate number of frictionless flow curves are determined, it is possible to calibrate the constitutive model. Yet, it must be done carefully so as not to penalize the mechanical response accuracy, as that would alienate the rate-dependent sensitivity from the loading signature by using an average strain-rate value of the mechanical test. A final check of the friction calibration curves using the just calibrated constitutive model is often necessary and desirable.
The flow stress curves of UNS L51120 lead alloy and conventional 18Ni300 maraging steel (18Ni300 CMed) obtained from the compression tests under different strain rate conditions are presented in Figure 18 and Figure 19, respectively. The additive manufacturing conditions of the 18Ni300 maraging steel (18Ni300 AMed) that was also tested are shown in Figure 20. Due to the relative low melting temperature of UNS L51120, only room temperature tests were carried out, whereas for 18Ni300, the temperature was limited to a maximum of 370 °C in order to avoid the aging transformations of the maraging steel that start at 450 °C [57]. Both materials were tested in quasi-static conditions to strain rates of 6000 s−1. The stress–strain responses of both materials seem to present typical asymptotic saturation curve morphology, whose value increases with strain rate. It ought to be noted, however, that three distinct stages can be also noted for the 18Ni300 maraging steel: (i) for initial plastic deformation (ε < 0.1), strain hardening was observed, (ii) followed by material softening down to minimum values of flow stress and (iii) succeeding to another strengthening stage. With regard to the temperature effect on the stress–strain response of 18Ni300, a typical softening for increasing temperature was noticed in both CMed and AMed metallurgical conditions. Experimental data resulting from the compression tests on UNS L51120 (Figure 18) were mathematically fitted by means of the following rigid viscoplastic material law (Equation (1)). The optimization procedure for the independent calibration of friction and plasticity has been based on the refereed equation and both experimental, and optimized material parameters are presented in Table 5. On the contrary, experimental data resulting from the compression tests on 18Ni300 were directly used in the numerical determination of the friction calibration curves in tabular form, as presented in Figure 19 and Figure 20. Though tabular forms are presented here for demonstrative proposes, it is also important to highlight that most constitutive models were unable to reproduce the singular response of maraging steel due to its complex combination of strain hardening and thermal softening phenomena.
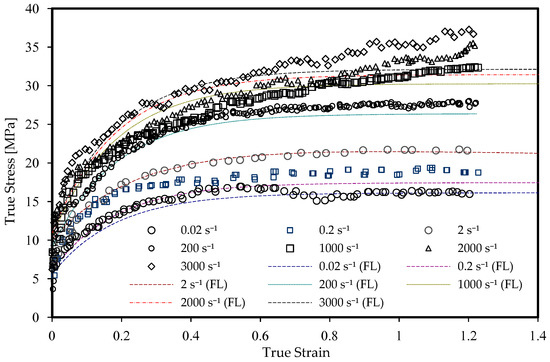
Figure 18.
Compressive stress–strain response of UNS L51120 lead alloy under a wide range of strain rate conditions, at room temperature, with lubrication. Experimental data (points) were taken directly from mechanical tests, and the stress–strain curves (dashed lines) were determined by the proposed methodology (frictionless flow stress).
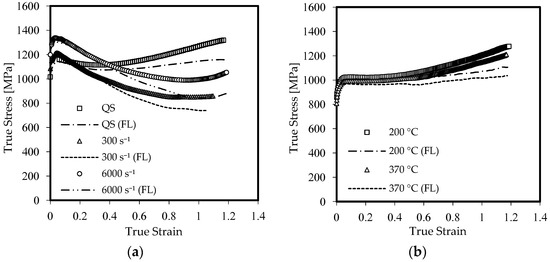
Figure 19.
Compressive stress–strain response of CMed 18Ni300 maraging steel under a wide range of strain rate conditions at room temperature with lubrication. Experimental results show the influences of (a) strain rate and (b) temperature on the flow stress curve. Experimental data (points) were taken directly from mechanical tests, and the stress–strain curves (solid and dashed lines) were determined by the proposed methodology (frictionless flow stress).
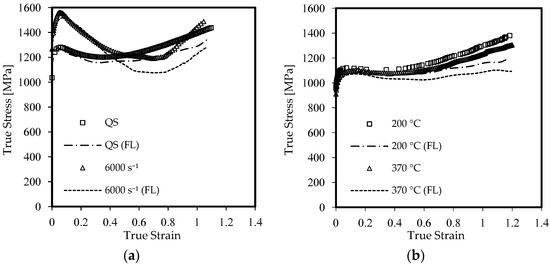
Figure 20.
Compressive stress–strain response of AMed 18Ni300 maraging steel under a wide range of strain rate conditions at room temperature, with lubrication. Experimental results show the influences om (a) strain rate and (b) temperature on the flow stress curve. Experimental data (points) was taken directly from mechanical tests, and the stress–strain curves (solid and dashed lines) were determined by the proposed methodology (frictionless flow stress).
Table 5.
Constitutive model constants for UNS L51120.
The real mechanical response can be only attained by eliminating the contribution of frictional shear to the experimental load–displacement curve. For that purpose, the previously described post-processing techniques were employed to eliminate friction’s contribution at the contact interfaces between the compression platens and test specimens. The estimated frictionless flow curves (labelled as FL) for UNS L51120, 18Ni300 CMed and 18Ni300 AMed obtained under simulated homogeneous deformation are shown in Figure 18, Figure 19 and Figure 20, respectively. By subtracting the friction overestimation, one can derive the corrected frictionless material response and its significant contribution for effective strain over 0.6. This, however, is not so obvious for UNS L51120, for which the mathematical adjustment introduces an overall average smoothing of the material law.
The frictionless flow curves were used in the numerical determination of the friction calibration curves. These calibration curves in combination with the experimental data from the ring compression tests made it possible to assess the friction coefficient under a wide range of operative conditions. Due to extremely low mechanical strength of UNS L51120, the strain rate was limited to quasi-static and low strain rate conditions to allow better control of deformation level. The specimen height reduction of such a soft material is difficult to limit under impact conditions, making the dimensional and geometrical characterization of the ring-shaped specimens tricky. Figure 21 shows the friction calibration curves for UNS L51120 under room temperature and quasi-static conditions, where the ring inner diameter variation (Δd/d0) is plotted as a function of ring height reduction (Δh/h0). The comparison of these curves with comparable experimental results allowed the estimation of a friction coefficient value. As a result, it was possible to identify two sets of experimental measures aligned with the calibration curves. One is related to the lubricated tests necessary for the independent calibration of plasticity, whose results correlate well with the friction curve, μ = 0.1 (QS Dry); and the second is related to the dry tests representing metal cutting conditions, whose results correlate well with the friction curve, μ = 0.2 (QS Lub). Additionally, some experimental measures under medium strain rate and dry conditions have been included for references (MS Dry, approximately 20 s−1), having good correlations with friction curve μ = 0.25. It is also important to note that the friction calibration curves are rate-dependent, and thus a specific friction curve was determined according to the relative velocity at the contact interface.
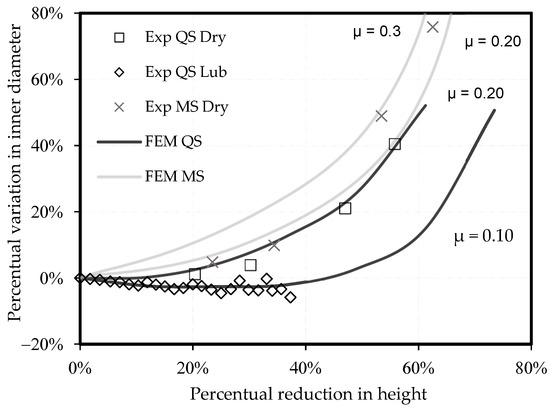
Figure 21.
Experimental results and friction calibration curves obtained by finite element analysis of the ring compression of the UNS L51120 lead alloy between compression platens of WC–15 wt% with a TiAlSiN coating. Experimental results show the influences of lubrication under quasi-static conditions and relative velocity under sliding contact on the friction coefficient value.
Figure 22 shows the friction calibration curves and experimental measures for 18Ni300 CMed maraging steel for different temperatures under quasi-static conditions (Figure 22a) and for different impact velocities under room temperature (Figure 22b). Contrary to the low mechanical strength materials, 18Ni300 maraging steel promotes good dissipation of the impact momentum and easy control of the deformation, and therefore was tested under quasi-static conditions with strain rates of up to 6000 s−1. Each calibration curve was computed for a specific ring compression test using only a tabular description of the stress–strain relationship obtained from the uniaxial compression of cylinders under similar strain-rate and temperature conditions, and subsequently updated by the proposed methodology. A similar tribological response was found for 18Ni300 AMed, as shown in Figure 23.
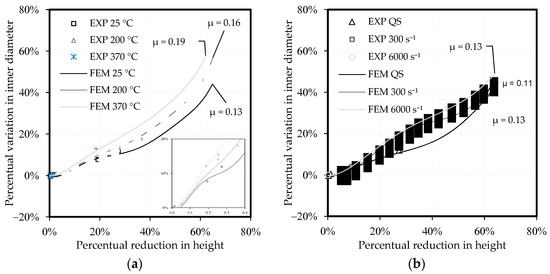
Figure 22.
Experimental results and friction calibration curves obtained by finite element analysis for the ring compression of 18Ni300 CMed maraging steel between compression platen of WC–15 wt% with a TiAlSiN coating. Experimental results show the combined influences of temperature under (a) quasi-static conditions and loading rate at (b) room temperature on the friction coefficient value.
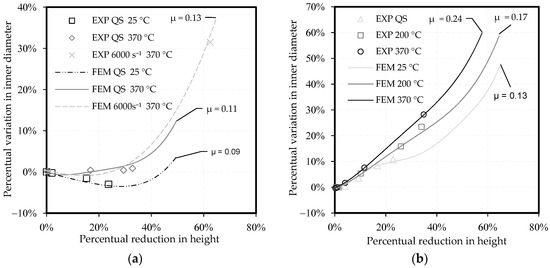
Figure 23.
Experimental results and friction calibration curves obtained by finite element analysis for the ring compression of 18Ni300 AMed maraging steel between compression platens of WC–15 wt% with a TiAlSiN coating. Experimental results show the combined influence of temperature and loading rate with (a) lubrication, and (b) dry sliding contact on the friction coefficient value.
4.2. Measurement of the Coefficient of Friction
The frictionless flow curves in combination with the experimental data from the ring compression tests made it possible to assess the friction coefficient under a wide range of operative conditions. Figure 24 shows the influences of lubrication, temperature and strain rate on the friction coefficient for the maraging steel (18Ni300) and the tool material (WC-Co polished and TiAlN, PVD coated). One can realize that the graphite lubricant (marked as Lub) significantly reduced adhesion in all test conditions. The friction coefficient showed a modest increase as either temperature or strain rate increased, and this was consistent and reproducible.
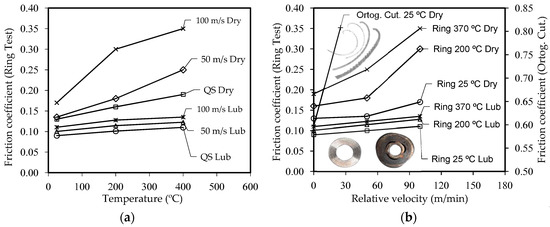
Figure 24.
Influences of (a) temperature and (b) relative velocity on the friction coefficient between the AMed 18Ni300 maraging steel and TiAlN PVD-coated tools under different lubrication conditions.
For dry conditions (marked as Dry), the friction coefficient is highly temperature dependent, as it doubled when the temperature increased from room to 370 °C, as depicted in Figure 24. The friction coefficient also increased with strain rate. These results provide a clear confirmation of the dependency of the friction coefficient on the cutting parameters. In metal cutting, the material undergoes intense plastic work combined with extreme strain rates in the primary shear zone, generating heat which is conveyed to the chips [62], which will then slide on the rake surface of the tool along the so-called secondary deformation zone. The sliding velocity of the chip can be correlated with the average expansion velocity of the ring’s outer diameter and the strain rate of the external material layer at the contact interface. As reference, a strain rate of approximately 6000 s−1 can be correlated with a relative velocity at the contact interface of 100 m/s.
4.3. Adequacy of the Ring Test
In previous sections, the ring compression test was demonstrated to be a suitable calibration technique for metal cutting tribology. Despite the expected predictability, it provided estimates in the range of 0.13–0.35 for the friction pair composed of AMed 18Ni300 maraging steel and TiAlN PVD-coated tools under dry conditions, which is significantly lower than the process-based estimates in the range of 0.58–0.82, as depicted in Figure 24b. Process-based estimates also showed lower strain-rate and temperature sensitivity when compared to the independent calibration methodology: the maximum COF variations were 140% and 240%, respectively. Similar results were observed for CMed 18Ni300 maraging steel and UNS L51120 lead alloy. It should be noted that UNS L51120 lead alloy showed a larger increase in friction value when compared to 18Ni300 maraging steel.
A weakness of the ring test is the superficial condition of the ring specimens, each of which will have a thin oxide layer, differently from non-oxidized and chemically active surfaces on the underside of a newly formed chip [7]. A metal oxide film provides weaker adhesive forces and consequently a lower friction coefficient value at the contact interface. Yet, this drawback exclusively concerns low deformation and room temperature experiments, since the ring underside expansion (rupture of oxide layer) under typical metal cutting conditions (large deformation and high temperature) allows neglecting the contribution of the thin oxide layer during the steady-state regime of metal cutting. Furthermore, even if a room temperature workpiece and cold cutting tools are used, the contact interface temperature at the rake surface will necessarily result in high temperatures, and thus, the friction calibration should be based on a ring test with temperature-controlled conditions. The authors of this research argue that ordinary process-based methodologies are particularly useful for conducting comprehensive sensitivity analyses. However, their use needs to be considered on a qualitative basis unless a reasonable improvement is introduced. In fact, the lower experimental measure based on metal cutting tests was 0.58, surpassing the theoretical maximum of 0.577 determined by the von Mises plastic flow rule.
Another weakness is concerns the existence of an occult fracture due to the aims of correct treatment of plastic flow and numerical estimation of the deformed ring geometry. The presence of this fracture promotes an inhomogeneous stress and strain field distribution, and material continuity is interrupted after a critical deformation. Some rigid bodies detach from the bulk material, making the dimensional control of deformed specimens difficult. This is particularly important in the context of brittle materials, since fracturing occurs for lower-level plastic deformation. Figure 25 shows the correlation between numerical (dashed line) and experimental cross-sectional profiles for ring test specimens. Figure 25a shows the numerical estimate for UNS L51120 lead alloy based on the frictionless plastic response and estimated friction coefficient in order to emphasize the excellent correlation of theoretical analysis with experimental data. Instead, Figure 25b shows a numerical cross-sectional profile for 18Ni300 AMed maraging steel which is somewhat different from that of experimental observations. Micrography shows a clear fracture with a fishbone tread, which disturbs the diameter variation as a function of ring height reduction. After determining the apparent integrity of ring specimens and fracture lines that are impossible to be detected by the naked eye, experimental data are generally accepted. In this research, we observed remarkable fracture propagation for 18Ni300 AMed maraging steel under room temperature after a specimen height reduction of approximately 35%, and thus, such data were not considered for the tribological characterization. Thus, lower calibration accuracy can be expected for fragile materials, since the friction sensitivity decreases in line with decreasing plastic deformation.
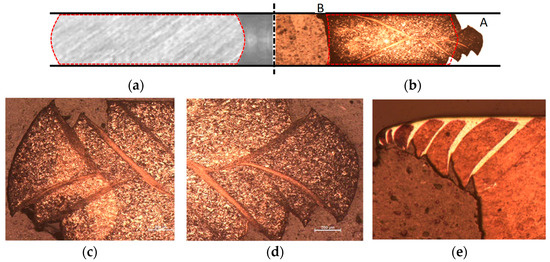
Figure 25.
Experimental and numerical cross-sections (red dashed line) of ring test specimens of (a) UNS L51120 lead alloy and (b) 18Ni300 maraging steel (normalized by height). Details show fracture and salient fragments detached from bulk material; (c) left outer diameter, (d) right outer diameter in zone A, and (e) inner corner in zone B.
5. Conclusions
We examined the adequacy of a proposed methodology for tribo-mechanical characterization of metallic alloys under extreme loading and temperature conditions typical of metal cutting processes. The focus of the research deviated from traditional process-based calibration techniques to the finding of independent calibration methodologies for friction and plasticity models. The tribo-mechanical approach was considered necessary to better understand how the extreme mechanical conditions involved in the chip formation mechanism can influence the frictional interface conditions. The main results demonstrate that only frictionless flow stress curves should be employed in the determination of the friction calibration curves to avoid cross-contributions of friction and overestimations of the fundamental tribo-mechanical parameters. The above results also provide evidence for the proposed methodology’s advantages and limitations related to the evaluation of the friction coefficient by means of the ring test under uniaxial impact at high temperature.
Numerical study has showed the ring compression test to be a suitable technique for metal cutting tribology. In fact, most of the tribological parameters, such as pressure, relative velocity, strain rate and strain, were shown to have signatures and absolute values comparable to those of machining processes. It was shown that the ring test captures adequate friction coefficient values, and that it is dependent on strain rate and temperature conditions. This is of particular interest, since contact pressure, relative velocity and average temperature at the contact interface are strongly influenced by the basic operating parameters of the machining processes. However, there exist specific conditions that limit the calibration accuracy of the ring test technique. Experimental results showed that fractures can easily occur in fragile materials, affecting plastic flow and thus the final geometries of ring specimens. This indicates why the experimental measurements of the inner diameter variation as a function of the height reduction deviate from the calibration curves. Thus, damage mechanics should also be considered in the numerical resolution of the plasticity problem. An alternative method can be introduced to avoid critical damage calibration tasks by limiting the height reductions of the ring specimens. However, this would affect the estimation quality for the friction coefficient values, since the ring compression test has poorer accuracy with lower plastic deformation. Another weakness identified is that the superficial condition of the ring specimens causes the existence of a thin metal oxide layer on each, in contrast to the non-oxidized and chemically active surfaces on the newly formed undersides of chips. This weakness was discussed, and although a solution was proposed by Valentino et al. [47] for a transient regime at room temperature, now it appears to be somewhat less of an issue considering the steady-state regime of metal cutting under high-contact interface temperatures.
The overall results have shown the friction coefficient to be a function of the main process parameters, rather than a constant value as it is regularly treated in the numeric simulations of metal cutting. By combining both the ring test and the impact test under controlled temperature, typical tribological conditions of metal cutting can be replicated in the laboratory. This way of proceeding allows one to overcome the typical friction overestimation of the process-based calibration methodologies. The friction coefficient increases with temperature and relative velocity for both materials. This increase is significant in dry conditions, similar to those that occur in metal cutting processes.
Author Contributions
Conceptualization, P.A.R.R. and A.M.P.d.J.; methodology T.E.F.S., P.A.R.R. and A.M.P.d.J.; software, T.E.F.S., A.P.R. and A.V.L.G.; validation, T.E.F.S., A.V.L.G. and P.A.R.R.; formal analysis, P.A.R.R. and A.M.P.d.J.; investigation, T.E.F.S. and A.V.L.G.; resources, P.A.R.R. and A.M.P.d.J.; data curation, A.V.L.G., A.P.R. and T.E.F.S.; writing—original draft preparation, T.E.F.S. and P.A.R.R.; writing—review and editing, A.M.P.d.J. and P.A.R.R.; visualization, A.V.L.G.; supervision, A.M.P.d.J. and P.A.R.R.; project administration, A.M.P.d.J. and P.A.R.R.; funding acquisition, A.M.P.d.J. and P.A.R.R. All authors have read and agreed to the published version of the manuscript.
Funding
This work has been conducted under the scope of MAMTool (PTDC/EME-EME/31895/2017) and AddStrength (PTDC/EME-EME/31307/2017) projects, funded by Programa Operacional Competitividade e Internacionalização, and Programa Operacional Regional de Lisboa funded by FEDER and National Funds (FCT). This work was supported by FCT, through IDMEC, under LAETA, project UIDB/50022/2020.
Data Availability Statement
Not applicable.
Conflicts of Interest
The authors declare no conflict of interest.
Abbreviations
The following abbreviation and symbols are used in this manuscript:
| aCOF | Apparent coefficient of friction |
| AMed | Additively manufactured |
| CMed | Conventionally manufactured |
| COF | Average coefficient of friction |
| FEM | Finite element method |
| HiPIMS | High power pulsed magnetron sputtering |
| OCT | Orthogonal cutting test |
| PVD | Physical vapor deposition |
| RCT | Ring compression test |
| A | Material hardening parameter |
| B | Material hardening parameter |
| C | Material hardening parameter |
| d | Inner diameter |
| D | Material hardening parameter, Outer diameter |
| Cutting force, compression force | |
| Feed force, longitudinal force | |
| Thrust force, expansion force | |
| h | height |
| L | Characteristic length |
| Contact length of secondary plastic flow | |
| Contact length of primary plastic flow | |
| Total contact length | |
| Material hardening parameter | |
| Material hardening parameter | |
| N | Neutral line, stagnation-point |
| Arithmetic average of the roughness profile; | |
| Cutting edge radius; | |
| Room temperature | |
| Uncut chip thickness | |
| Cutting velocity (metal cutting) or compression velocity (ring test) | |
| Exit velocity of primary plastic flow, tangential velocity in the chip-tool contact interface or expansion velocity in the ring-tool contact interface | |
| Relief velocity in metal cutting or reverse inward velocity in ring test | |
| Tool rake angle | |
| Strain rate | |
| Effective plastic strain | |
| μ | Coulomb friction parameter |
| Relief angle, clearance angle |
References
- Melkote, S.N.; Grzesik, W.; Outeiro, J.C.; Rech, J.; Schulze, V.; Attia, H.; Arrazola, P.J.; M’Saoubi, R.; Saldana, C. Advances in material and friction data for modelling of metal machining. CIRP Ann. 2017, 66, 731–754. [Google Scholar] [CrossRef] [Green Version]
- Sahoo, P.; Patra, K.; Szalay, T.; Dyakonov, A.A. Determination of minimum uncut chip thickness and size effects in micro-milling of P-20 die steel using surface quality and process signal parameters. Int. J. Adv. Manuf. Technol. 2020, 106, 4675–4691. [Google Scholar] [CrossRef]
- Kronenberg, M. Machining Science and Application. In Theory and Practice for Operation and Development of Machining Processes; Pergamon Press: Oxford, UK, 1966. [Google Scholar]
- Vipindas, K.; Anand, K.N.; Mathew, J. Effect of cutting edge radius on micro end milling: Force analysis, surface roughness, and chip formation. Int. J. Adv. Manuf. Technol. 2018, 97, 711–722. [Google Scholar] [CrossRef]
- Munoa, J.; Beudaert, X.; Dombovari, Z.; Altintas, Y.; Budak, E.; Brecher, C.; Stepan, G. Chatter suppression techniques in metal cutting. CIRP Ann. 2016, 65, 785–808. [Google Scholar] [CrossRef]
- Singh, K.; Kartik, V.; Singh, R. Modeling dynamic stability in high-speed micromilling of Ti–6Al–4V via velocity and chip load dependent cutting coefficients. Int. J. Mach. Tools Manuf. 2015, 96, 56–66. [Google Scholar] [CrossRef]
- Rosa, P.A.R.; Gregorio, A.V.L.; Davim, J.P. The Role of Oxygen in Orthogonal Machining of Metals. In Measurement in Machining and Tribology; Springer: Cham, Switzerland, 2019; pp. 49–88. [Google Scholar] [CrossRef]
- Brinksmeier, E.; Lucca, D.A.; Walter, A. Chemical Aspects of Machining Processes. CIRP Ann. 2004, 53, 685–699. [Google Scholar] [CrossRef]
- Astakhov, V.P. Tribology of Metal Cutting; Tribology and Interface Engineering Series; Elsevier: Amsterdam, The Netherlands, 2006; Volume 52, pp. 1–425. [Google Scholar]
- Silva, T.E.; Rosa, P.A.; Reis, A.R.; de Jesus, A.M. Machinability of the 18Ni300 Additively Manufactured Maraging Steel Based on Orthogonal Cutting Tests. In Innovations in Mechanical Engineering; Springer: Cham, Switzerland, 2021; pp. 1–13. [Google Scholar] [CrossRef]
- Markopouls, A.P.; Vaxevanidis, N.M.; Manolakos, D.E. Friction and Material Modelling in Finite Element Simulation of Orthogonal Cutting. Tribol. Ind. 2015, 37, 440–448. [Google Scholar]
- Armarego, E.J.; Brown, R.H. The Machining of Metals; Prentice-Hall: Hoboken, NJ, USA, 1969. [Google Scholar]
- Astakhov, V.P.; Outeiro, J.C. Metal Cutting Mechanics, Finite Element Modelling. In Machining, Fundamentals and Recent Advances; Springer: London, UK, 2008; pp. 1–27. [Google Scholar] [CrossRef]
- Lin, Z.C.; Pan, W.C.; Lo, S.P. A study of orthogonal cutting with tool flank wear and sticking behaviour on the chip-tool interface. J. Mater. Process. Technol. 1995, 52, 524–538. [Google Scholar] [CrossRef]
- Lin, Z.C.; Lin, S.Y. A Coupled Finite Element Model of Thermo-Elastic-Plastic Large Deformation for Orthogonal Cutting. J. Eng. Mater. Technol. 1992, 114, 218–226. [Google Scholar] [CrossRef]
- Schey, J.A. Tribology in Metal Working: Friction, Lubrication and Wear; American Society for Metals: Metals Park, OH, USA, 1983. [Google Scholar]
- Kačmarčik, I.; Movrin, D.; Ivanišević, A. One Contribution to the Friction Investigation in Bulk Metal Forming. J. Technol. Plast. 2011, 36, 35–48. [Google Scholar] [CrossRef] [Green Version]
- Groche, P.; Müller, C.; Stahlmann, J.; Zang, S. Mechanical conditions in bulk metal forming tribometers—Part one. Tribol. Int. 2013, 62, 223–231. [Google Scholar] [CrossRef]
- Plančak, M.; Car, Z.; Kršulja, M.; Vilotić, D.; Kačmarčik, I.; Movrin, D. Possibilities to measure contact friction in bulk metal forming. Teh. Vjesn. 2012, 19, 727–734. [Google Scholar]
- Totten, G.; Liang, H. Mechanical Tribology: Materials, Characterization, and Applications; CRC Press: Boca Raton, FL, USA, 2004. [Google Scholar]
- Bay, N.; Wibom, O.; Martins, P.A.F. Testing of Friction and Lubrication in Bulk Metal Forming. In Proceedings of the IMECE 98-International Mechanical Engineering Conference and Exhibition, Anaheim, CA, USA, 15–20 November 1998. [Google Scholar]
- Cristino, V.A.M.; Rosa, P.A.R.; Martins, P.A.F. On the utilization of pin-on-disc simulative tests for the calibration of friction in metal cutting. Proc. Inst. Mech. Eng. Part J J. Eng. Tribol. 2009, 224, 169–177. [Google Scholar] [CrossRef]
- Grzesik, W.; Zalisz, Z.; Nieslony, P. Friction and Wear Testing of Multilayer Coatings on Carbide Substrates for Dry Machining Applications. Surf. Coat. Technol. 2002, 155, 37–45. [Google Scholar] [CrossRef]
- Olsson, M.; Soderberg, S.; Jacobson, S.; Hogmark, S. Simulation of Cutting Pin-on-Disc Test. Int. J. Mach. Tools Manuf. 1989, 29, 377–390. [Google Scholar] [CrossRef]
- Hedenquist, P.; Olsson, M. Sliding Wear Testing of Coated Cutting Tool Materials. Tribol. Int. 1991, 24, 143–150. [Google Scholar] [CrossRef]
- Zemzemi, F.; Rech, J.; Salem, W.B.; Kapsa, P.; Dogui, A. Development of a Friction Model for the Tool–Chip–Workpiece Interface during Dry Machining of AISI4142 Steel with TiN Coated Carbide Cutting Tools. Int. J. Mach. Mach. Mater. 2007, 2, 361–367. [Google Scholar] [CrossRef]
- Sun, K.; Peng, W.; Wei, B.; Yang, L.; Fang, L. Friction and Wear Characteristics of 18Ni(300) Maraging Steel under High-Speed Dry Sliding Conditions. Materials 2020, 13, 1485. [Google Scholar] [CrossRef] [Green Version]
- Tomaz, Í.V.; Pardal, J.M.; Fonseca, M.C. Influence of minimum quantity lubrication in the surface quality of milled maraging steel. Int. J. Adv. Manuf. Technol. 2019, 104, 4301–4311. [Google Scholar] [CrossRef]
- Jaffery, S.H.I.; Mativenga, P.T. Wear mechanisms analysis for turning Ti-6Al-4V—towards the development of suitable tool coatings. Int. J. Adv. Manuf. Technol. 2011, 58, 479–493. [Google Scholar] [CrossRef]
- Male, A.T.; Cockcroft, M.G. A method for the determination of the coefficient of friction of metals under conditions of bulk plastic deformation. J. Inst. Met. 1964, 93, 38–46. [Google Scholar]
- Lazzarotto, L.; Dubar, L.; Dubois, A.; Ravassard, P.; Oudin, J. Identification of Coulomb’s coefficient of friction in real contact conditions applied to a wire drawing process. Wear 1997, 211, 54–63. [Google Scholar] [CrossRef]
- Hill, R. LXVI. On the inhomogeneous deformation of a plastic lamina in a compression test. Lond. Edinb. Dublin Philos. Mag. J. Sci. 1950, 41, 733–744. [Google Scholar] [CrossRef]
- Schrader, T.; Shirgaokar, M.; Altan, T. A critical evaluation of the double cup extrusion test for selection of cold forging lubricants. J. Mater. Process. Technol. 2007, 189, 36–44. [Google Scholar] [CrossRef]
- Bay, N.; Wibom, O.; Nielsen, J.A. A new friction and lubrication test for cold forging. CIRP Ann. Manuf. Technol. 1995, 44, 217–221. [Google Scholar] [CrossRef]
- Andreasen, J.L.; Bay, N. A Strip Reduction Test for Measurement of Lubricity in Ironing. In Proceedings of the 19th IDDRG Biennial Congress, Eger, Hungary, 10–14 June 1996; pp. 435–444. [Google Scholar]
- Fereshteh-Saniee, F.; Pillinger, I.; Hartley, P. Friction modelling for the physical simulation of the bulk metal forming processes. J. Mater. Process. Technol. 2004, 153–154, 151–156. [Google Scholar] [CrossRef]
- Wagener, H.W.; Wolf, J. Coefficient of friction in Cold Extrusion. J. Mater. Process. Technol. 1994, 44, 283–291. [Google Scholar] [CrossRef]
- Zhang, Q.; Felder, E.; Bruschi, S. Evaluation of friction conditions in cold forging by using T-shape compression test. J. Mater. Process. Technol. 2009, 209, 5720–5729. [Google Scholar] [CrossRef]
- Hou, G.; Li, A. Effect of Surface Micro-Hardness Change in Multistep Machining on Friction and Wear Characteristics of Titanium Alloy. Appl. Sci. 2021, 11, 7471. [Google Scholar] [CrossRef]
- Srivastava, A.; Srivastava, A.; Mishra, A. Analysis of Friction Factor & Coefficient of Friction Using Ring Compression Test under Various Lubricants. Int. J. Eng. Tech. Res. 2019, 9, 17–23. [Google Scholar] [CrossRef]
- Martín, F.; Martín, M.J.; Sevilla, L.; Sebastián, M.A. The Ring Compression Test: Analysis of Dimensions and Canonical Geometry. Procedia Eng. 2015, 132, 326–333. [Google Scholar] [CrossRef] [Green Version]
- Sofuoglu, H.; Rasty, J. On the measurement of friction coefficient utilizing the ring compression test. Tribol. Int. 1999, 32, 327–335. [Google Scholar] [CrossRef]
- Kunogi, M. On Plastic Deformation of Hollow Cylinders under Axial Compressive Loading. J. Sci. Res. Inst. 1954, 2, 63–92. [Google Scholar]
- Hu, Z.M.; Dean, T.A. A study of surface topography, friction and lubricants in metal forming. Int. J. Mach. Tools Manuf. 2000, 40, 1637–1649. [Google Scholar] [CrossRef]
- Mahrenholtz, O.; Bontcheva, N.; Iankov, R. Influence of surface roughness on friction during metal forming processes. J. Mater. Process. Technol. 2005, 159, 9–16. [Google Scholar] [CrossRef]
- Sahin, M.; Cetinarslan, C.S.; Akata, H.E. Effect of surface roughness on friction coefficients during upsetting processes for different materials. Mater. Des. 2007, 28, 633–640. [Google Scholar] [CrossRef]
- Cristino, V.A.M.; Rosa, P.A.R.; Martins, P.A.F. The Role of Interfaces in the Evaluation of Friction by Ring Compression Testing. Exp. Tech. 2015, 39, 47–56. [Google Scholar] [CrossRef]
- Wright, P.K. Frictional interactions in machining: Comparisons between transparent sapphire and steel cutting tools. Metall. Res. Technol. 1981, 8, 150–160. [Google Scholar] [CrossRef]
- Bagchi, A.; Wright, P.K. Stress analysis in machining with the use of sapphire tools. Proc. R. Soc. Lond. A. 1987, 409, 90–113. [Google Scholar] [CrossRef]
- Seward, O.; Cepero-Mejías, F.; Fairclough, J.P.A.; Kerrigan, K. Development of a Novel Friction Model for Machining Simulations in Unidirectional Composite Materials. Polymers 2022, 14, 847. [Google Scholar] [CrossRef]
- Kuhlmann-Wilsdorf, D. What role for contact spots and dislocations in friction and wear? Wear 1996, 200, 8–29. [Google Scholar] [CrossRef]
- Pepper, S. Effect of interfacial species on shear strength of metal-sapphire contacts. J. Appl. Phys. 1979, 50, 8062–8066. [Google Scholar] [CrossRef]
- Williams, J.A.; Tabor, D. The role of lubricants in machining. Wear 1977, 43, 275–292. [Google Scholar] [CrossRef]
- Madhavan, V.; Chandrasekar, S.; Farris, T.N. Direct observations of the chip-tool interface in the low speed cutting of pure metals. J. Tribol. 2002, 124, 617–626. [Google Scholar] [CrossRef]
- Silva, T.; Gregório, A.; Silva, F.; Xavier, J.; Reis, A.; Rosa, P.; de Jesus, A. Numerical-Experimental Plastic-Damage Characterisation of Additively Manufactured 18Ni300 Maraging Steel by Means of Multiaxial Double-Notched Specimens. J. Manuf. Mater. Process. 2021, 5, 84. [Google Scholar] [CrossRef]
- Lang, F.H.; Kenyon, N. Welding of maraging steels. In WRC Bulletin; Welding Research Council: New York, NY, USA, 1971; Volume 159. [Google Scholar]
- Król, M.; Snopiński, P.; Czech, A. The phase transitions in selective laser-melted 18-NI (300-grade) maraging steel. J. Therm. Anal. Calorim 2020, 142, 1011–1018. [Google Scholar] [CrossRef] [Green Version]
- U.S. Department of Defense. MIL-S-46850D—Steel: Bar, Plate, Sheet, Strip, Forgings, and Extrusions, 18 Percent Nickel Alloy, Maraging, 200 KSI, 250 KSI, 300 KSI, and 350 KSI, High Quality; U.S. Department of Defense: Washington, DC, USA, 1991.
- SAE International. Metals and Alloys in the Unified Numbering System (UNS), 13th ed.; SAE International: Warrendale, PA, USA, 2017. [Google Scholar]
- Properties and Selection: Nonferrous Alloys and Special Purpose Materials. In ASM Handbook; American Society of Materials: Cleveland, OH, USA, 2005; Volume 2.
- Silva, T.E.F.; Gregório, A.V.L.; de Jesus, A.M.P.; Rosa, P.A.R. An Efficient Methodology towards Mechanical Characterization and Modelling of 18Ni300 AMed Steel in Extreme Loading and Temperature Conditions for Metal Cutting Applications. J. Manuf. Mater. Process. 2021, 5, 83. [Google Scholar] [CrossRef]
- Shaw, M.C. Metal Cutting Principles, 2nd ed.; Oxford University Press: New York, NY, USA, 2005. [Google Scholar]
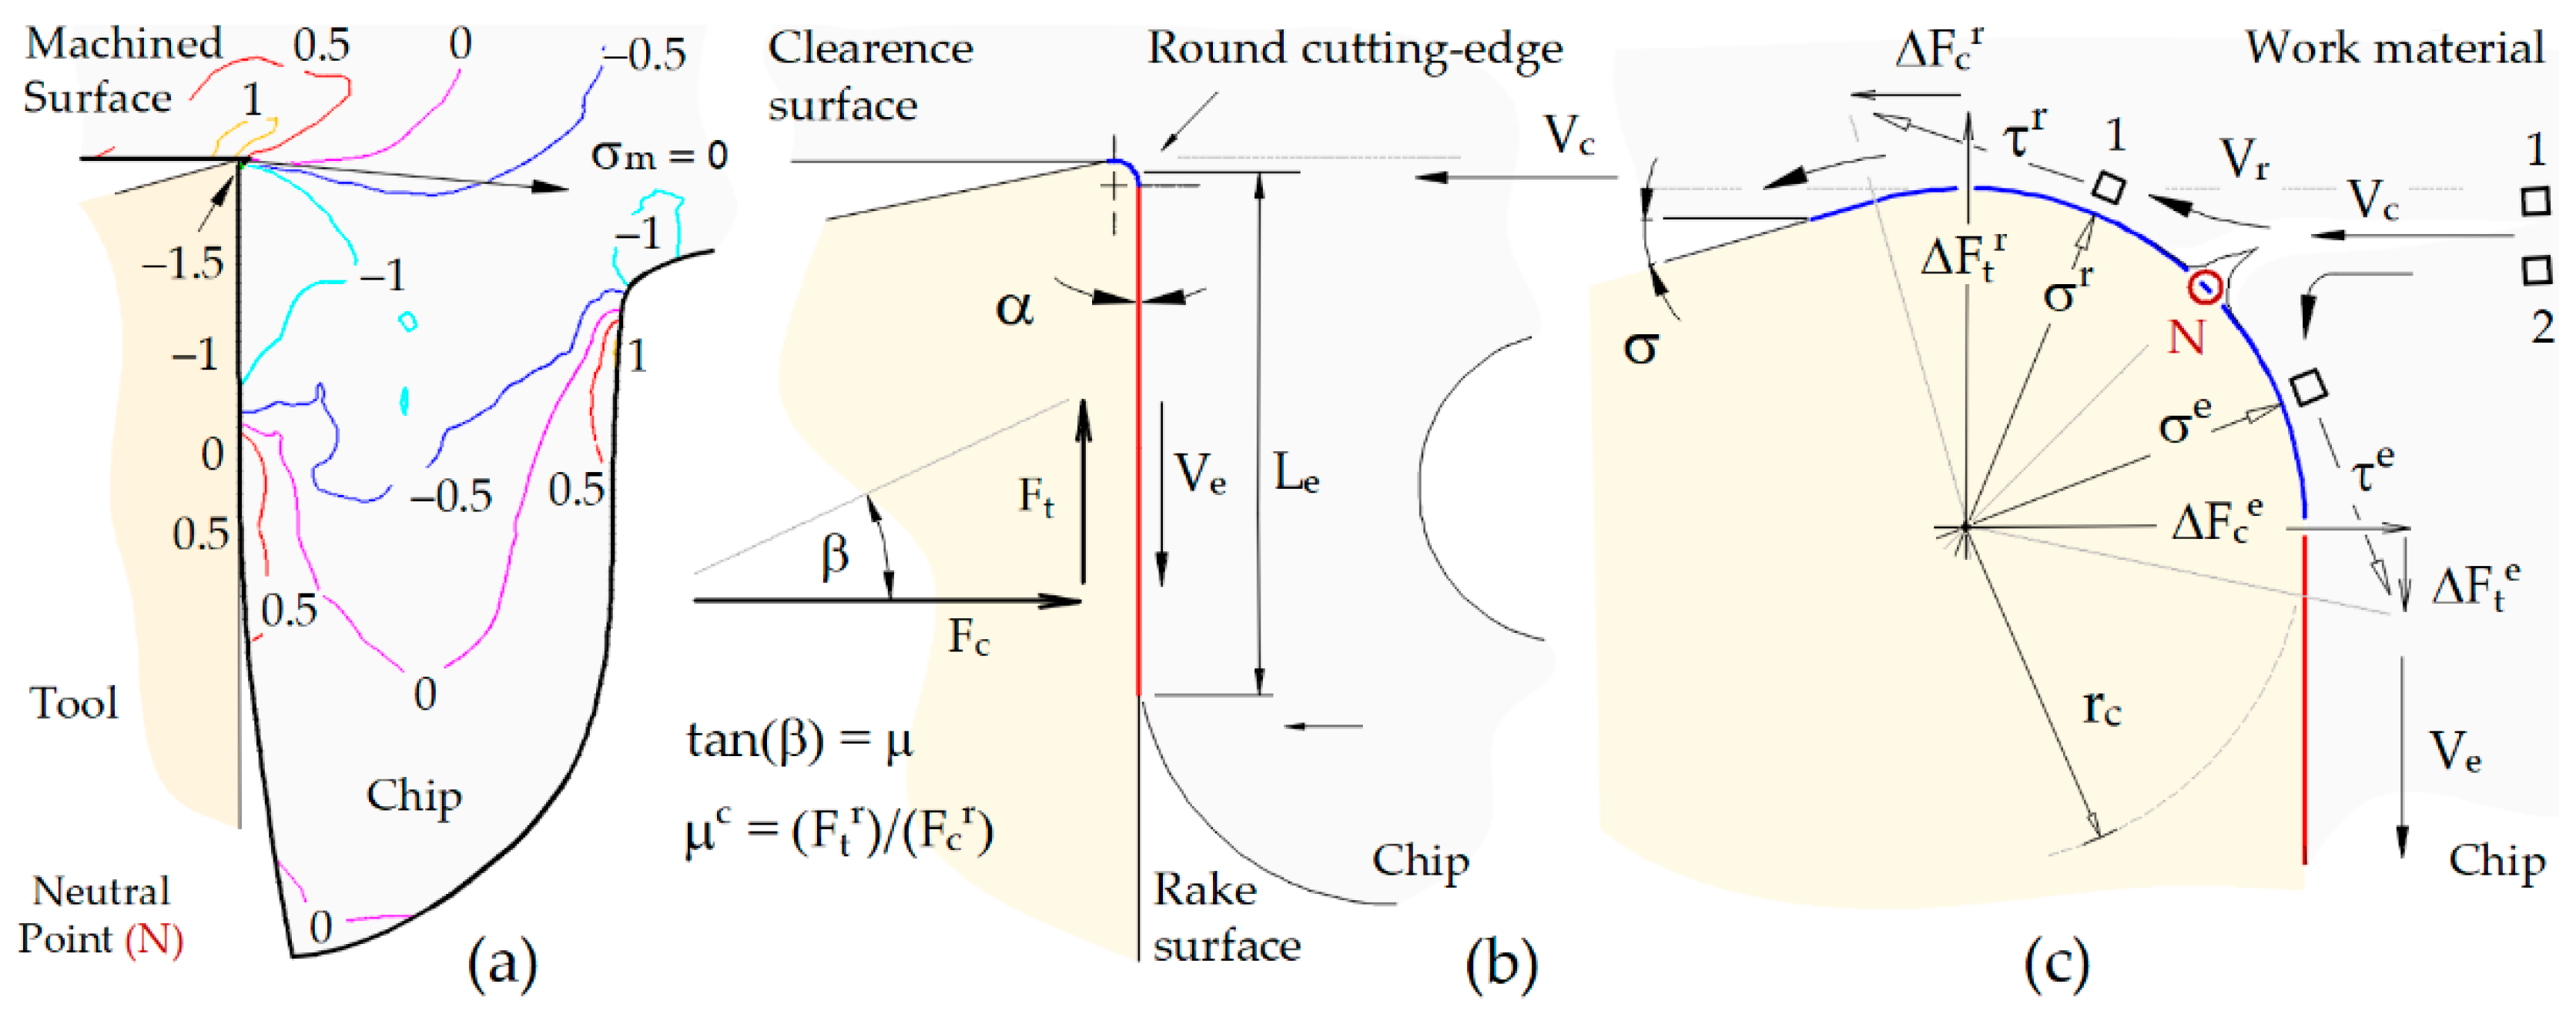

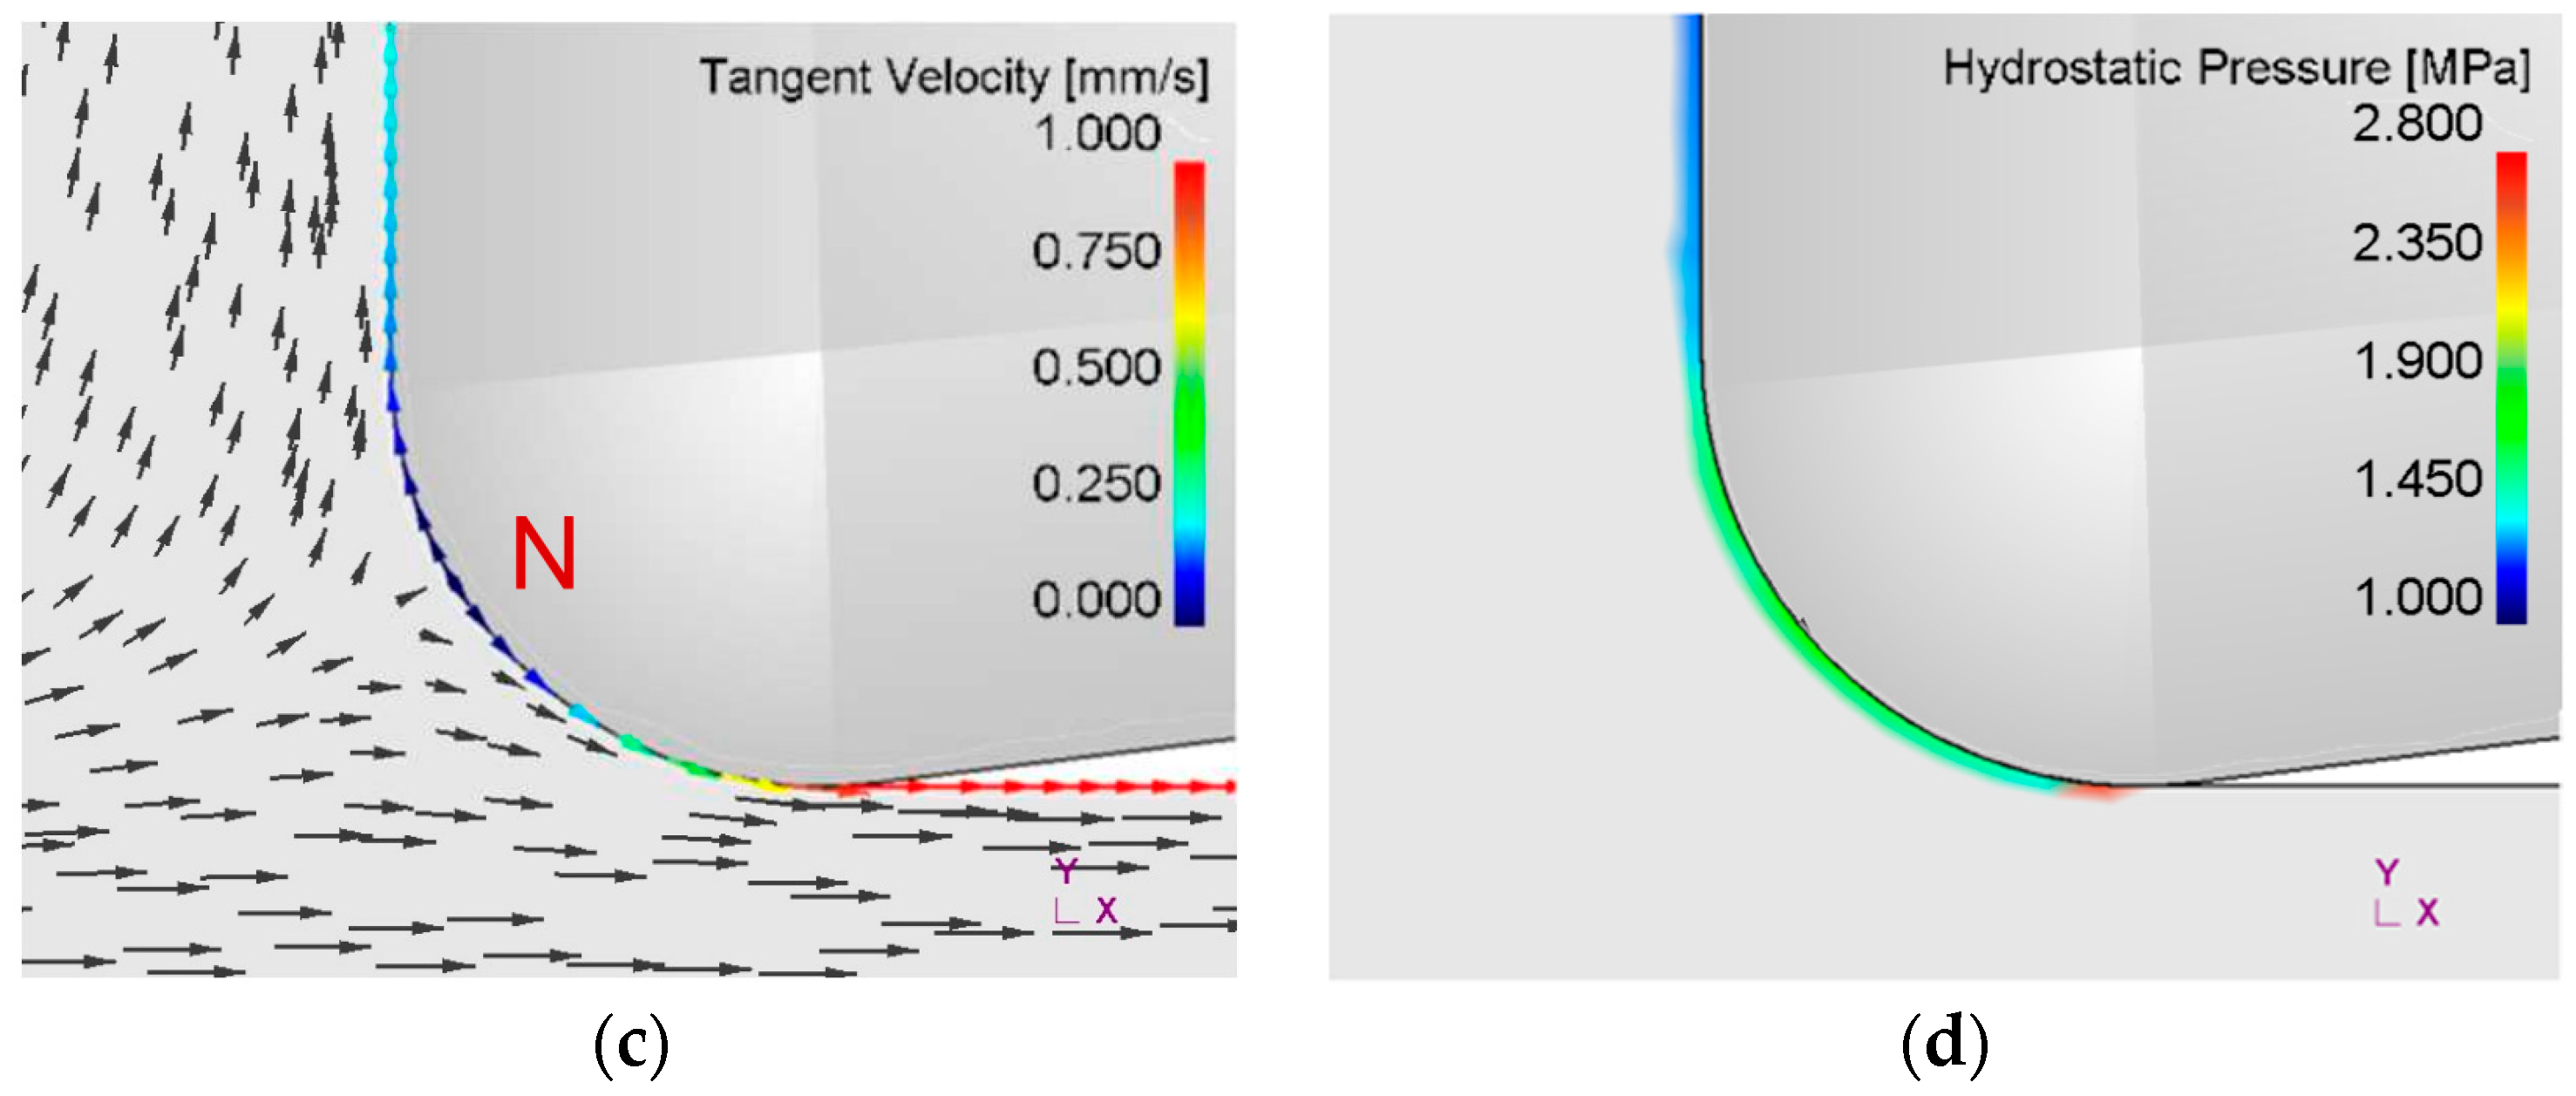
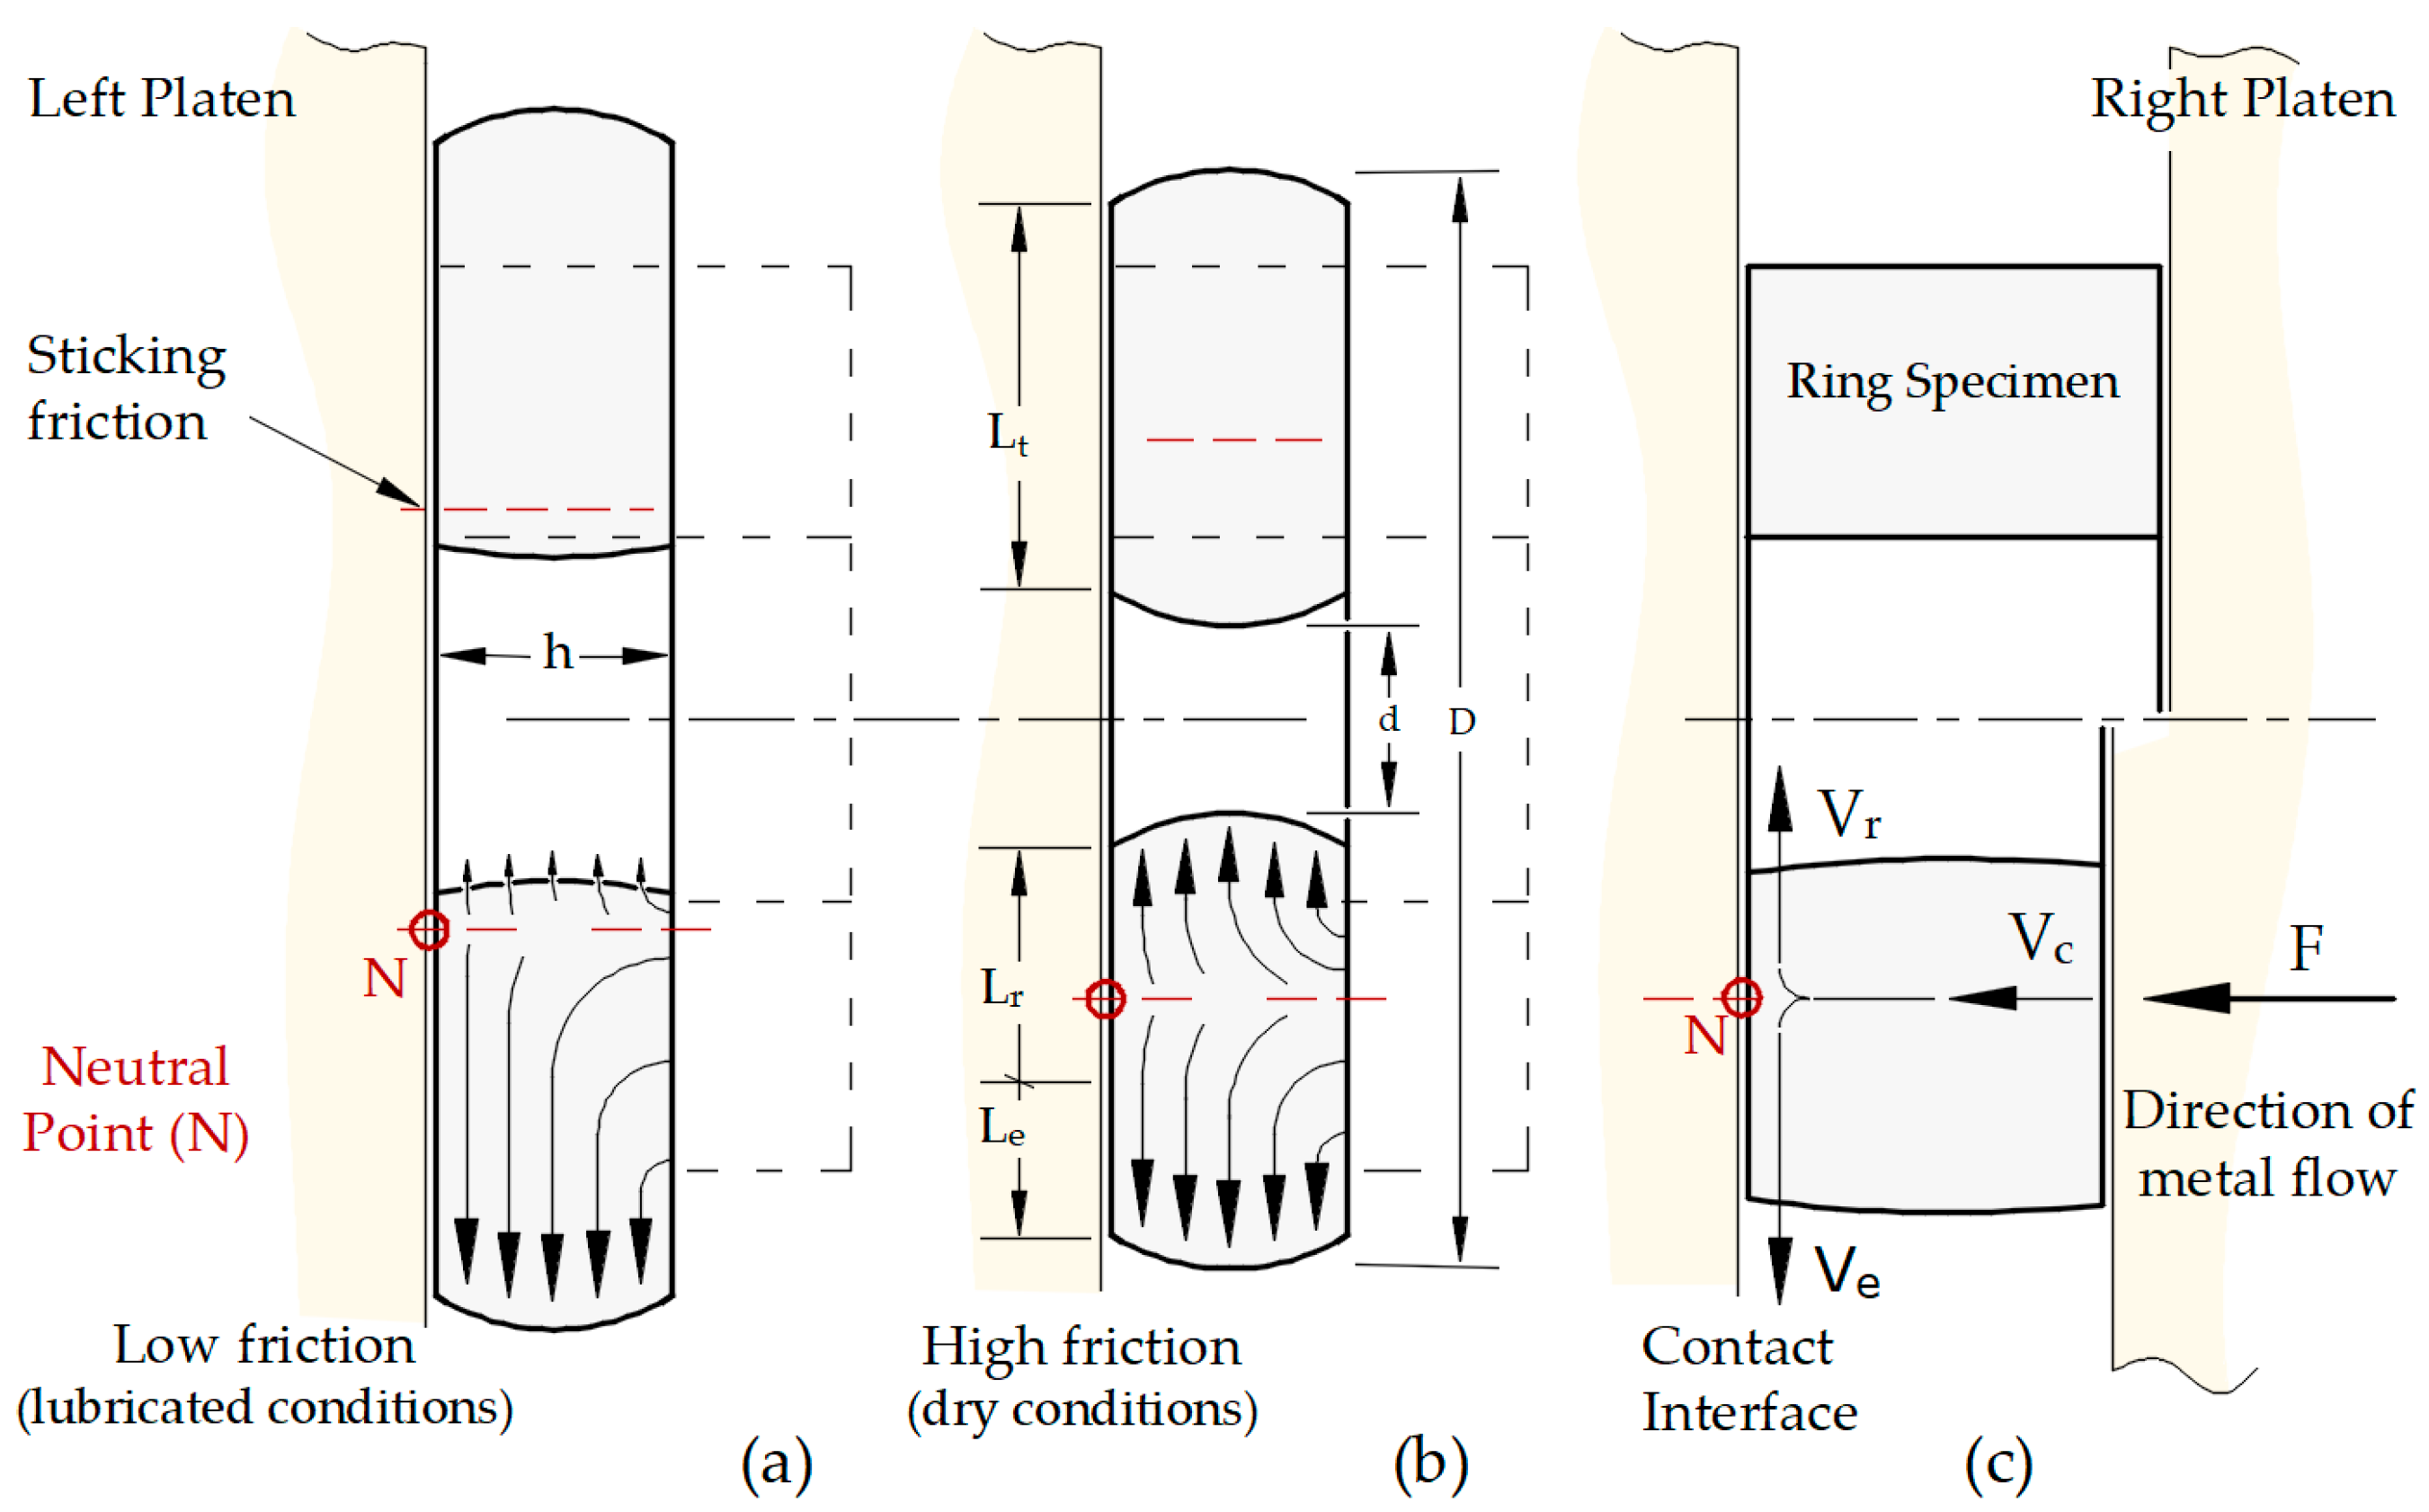
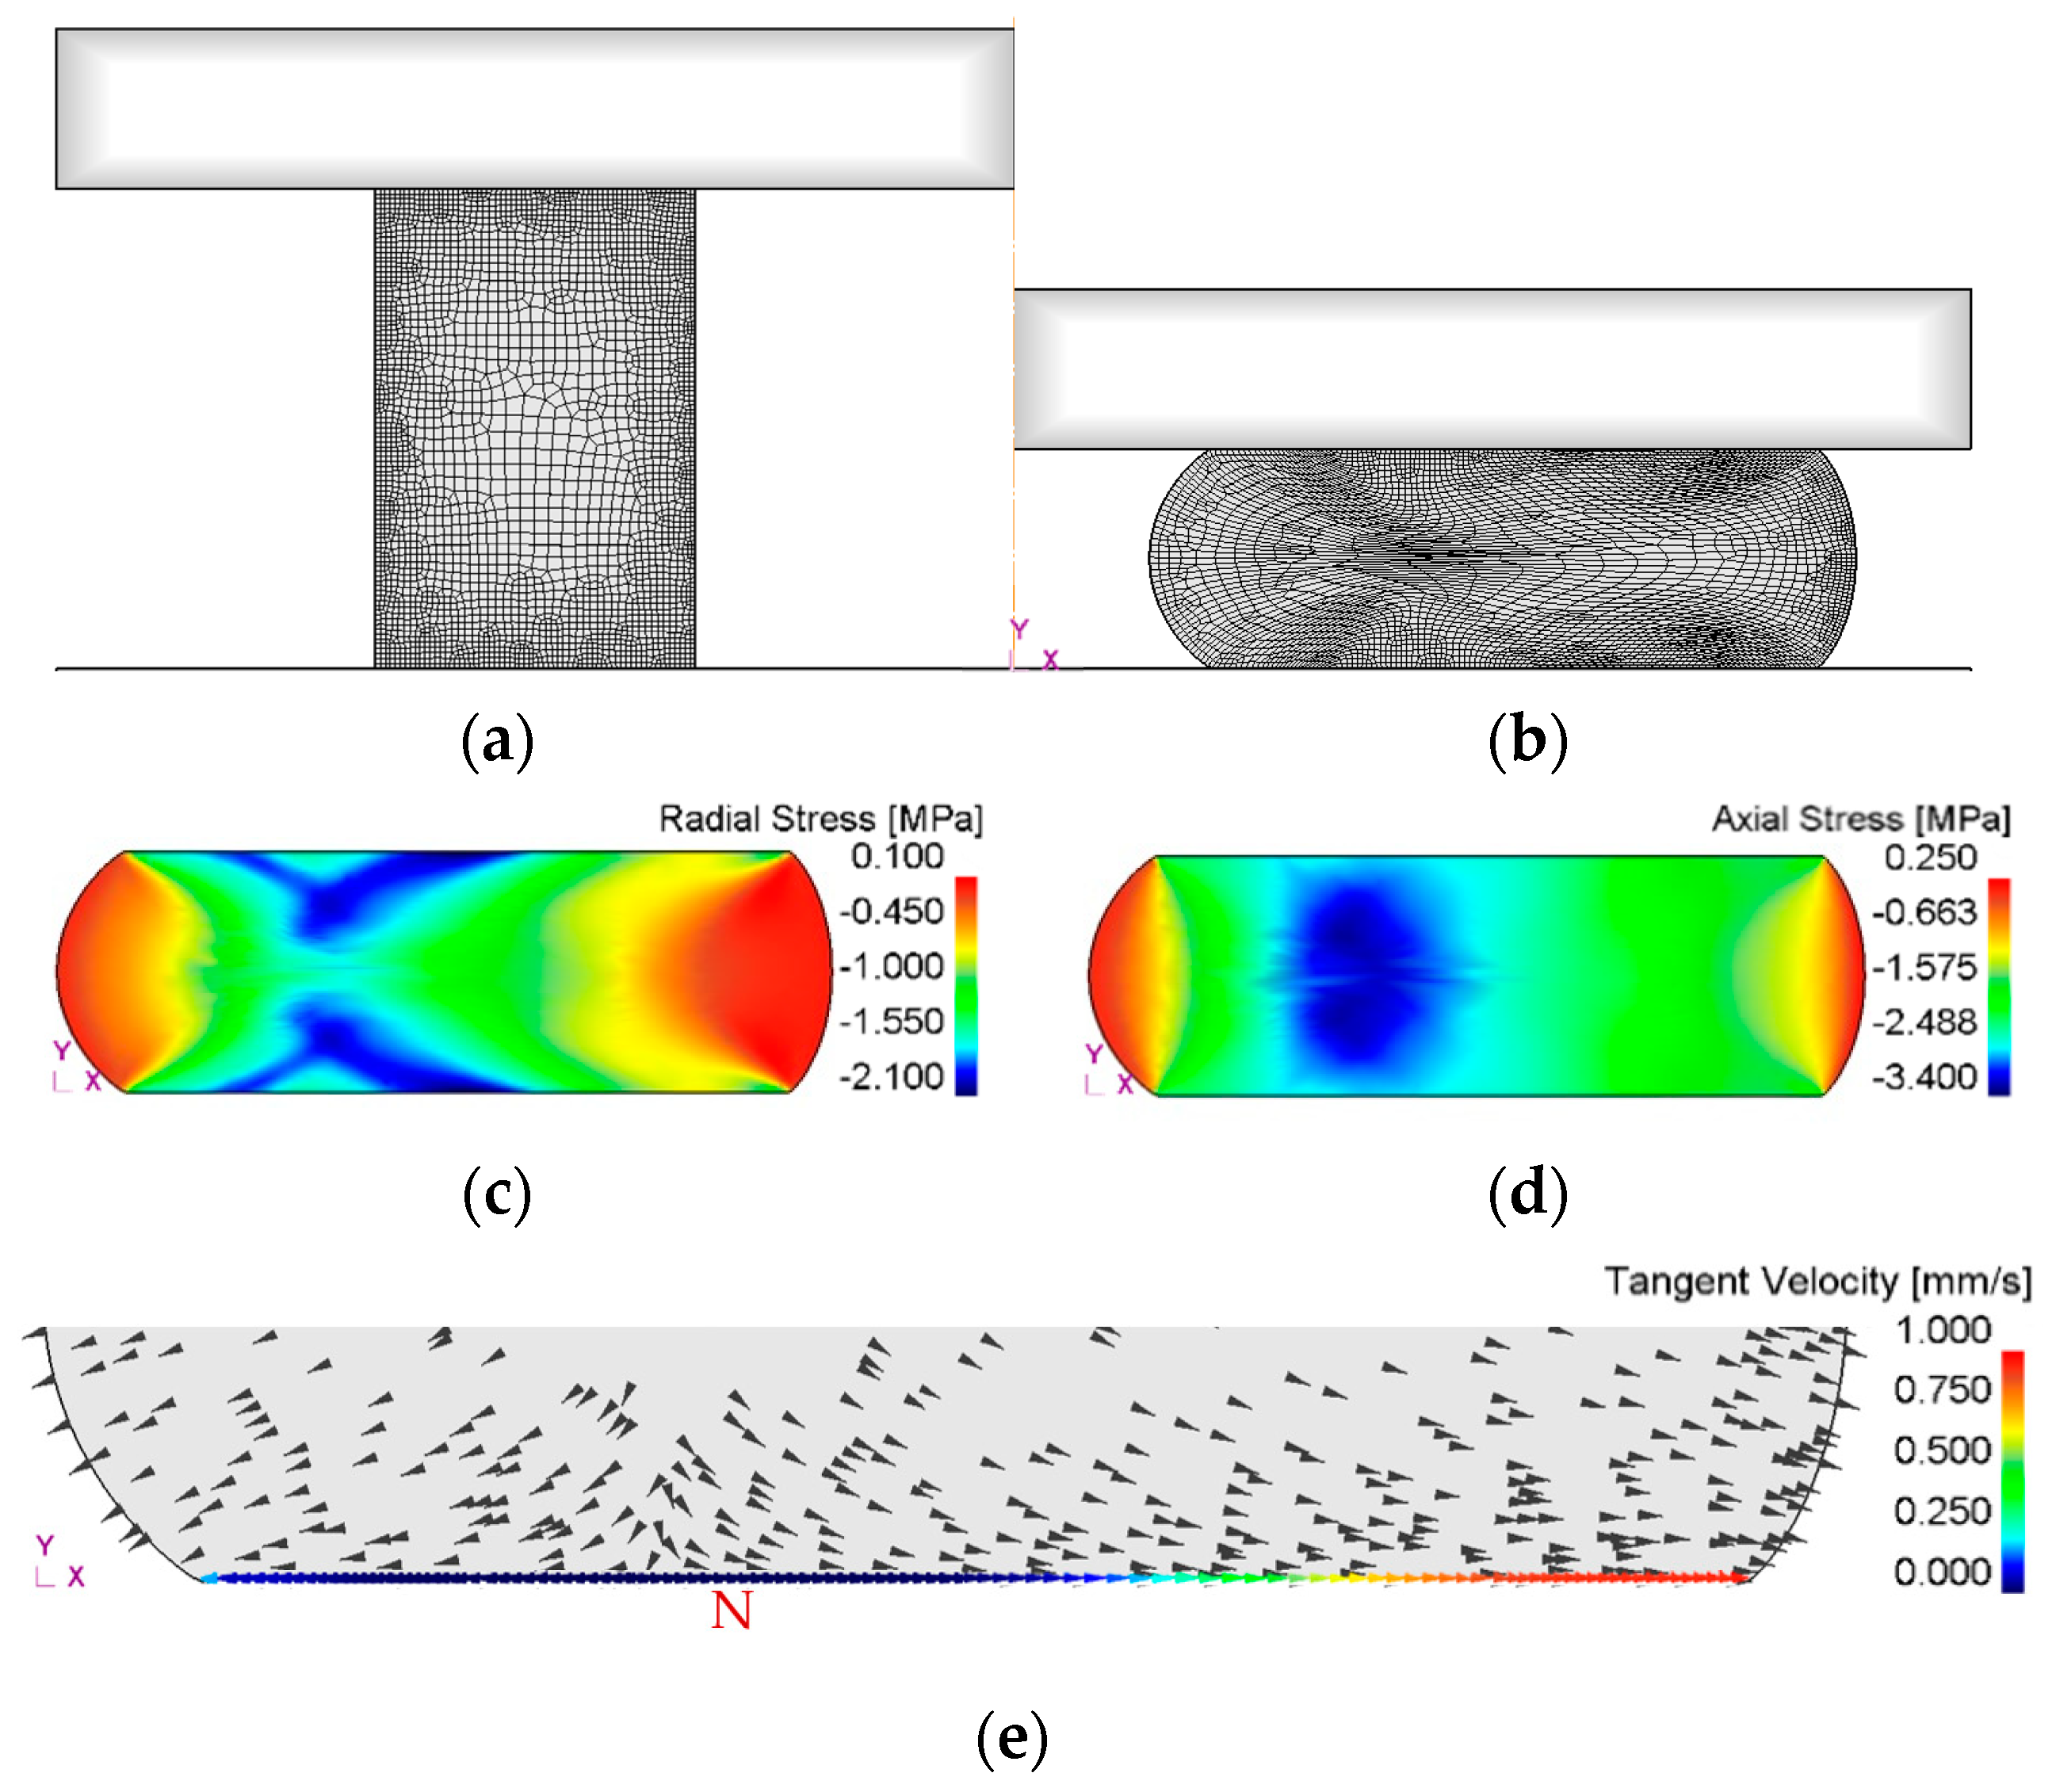
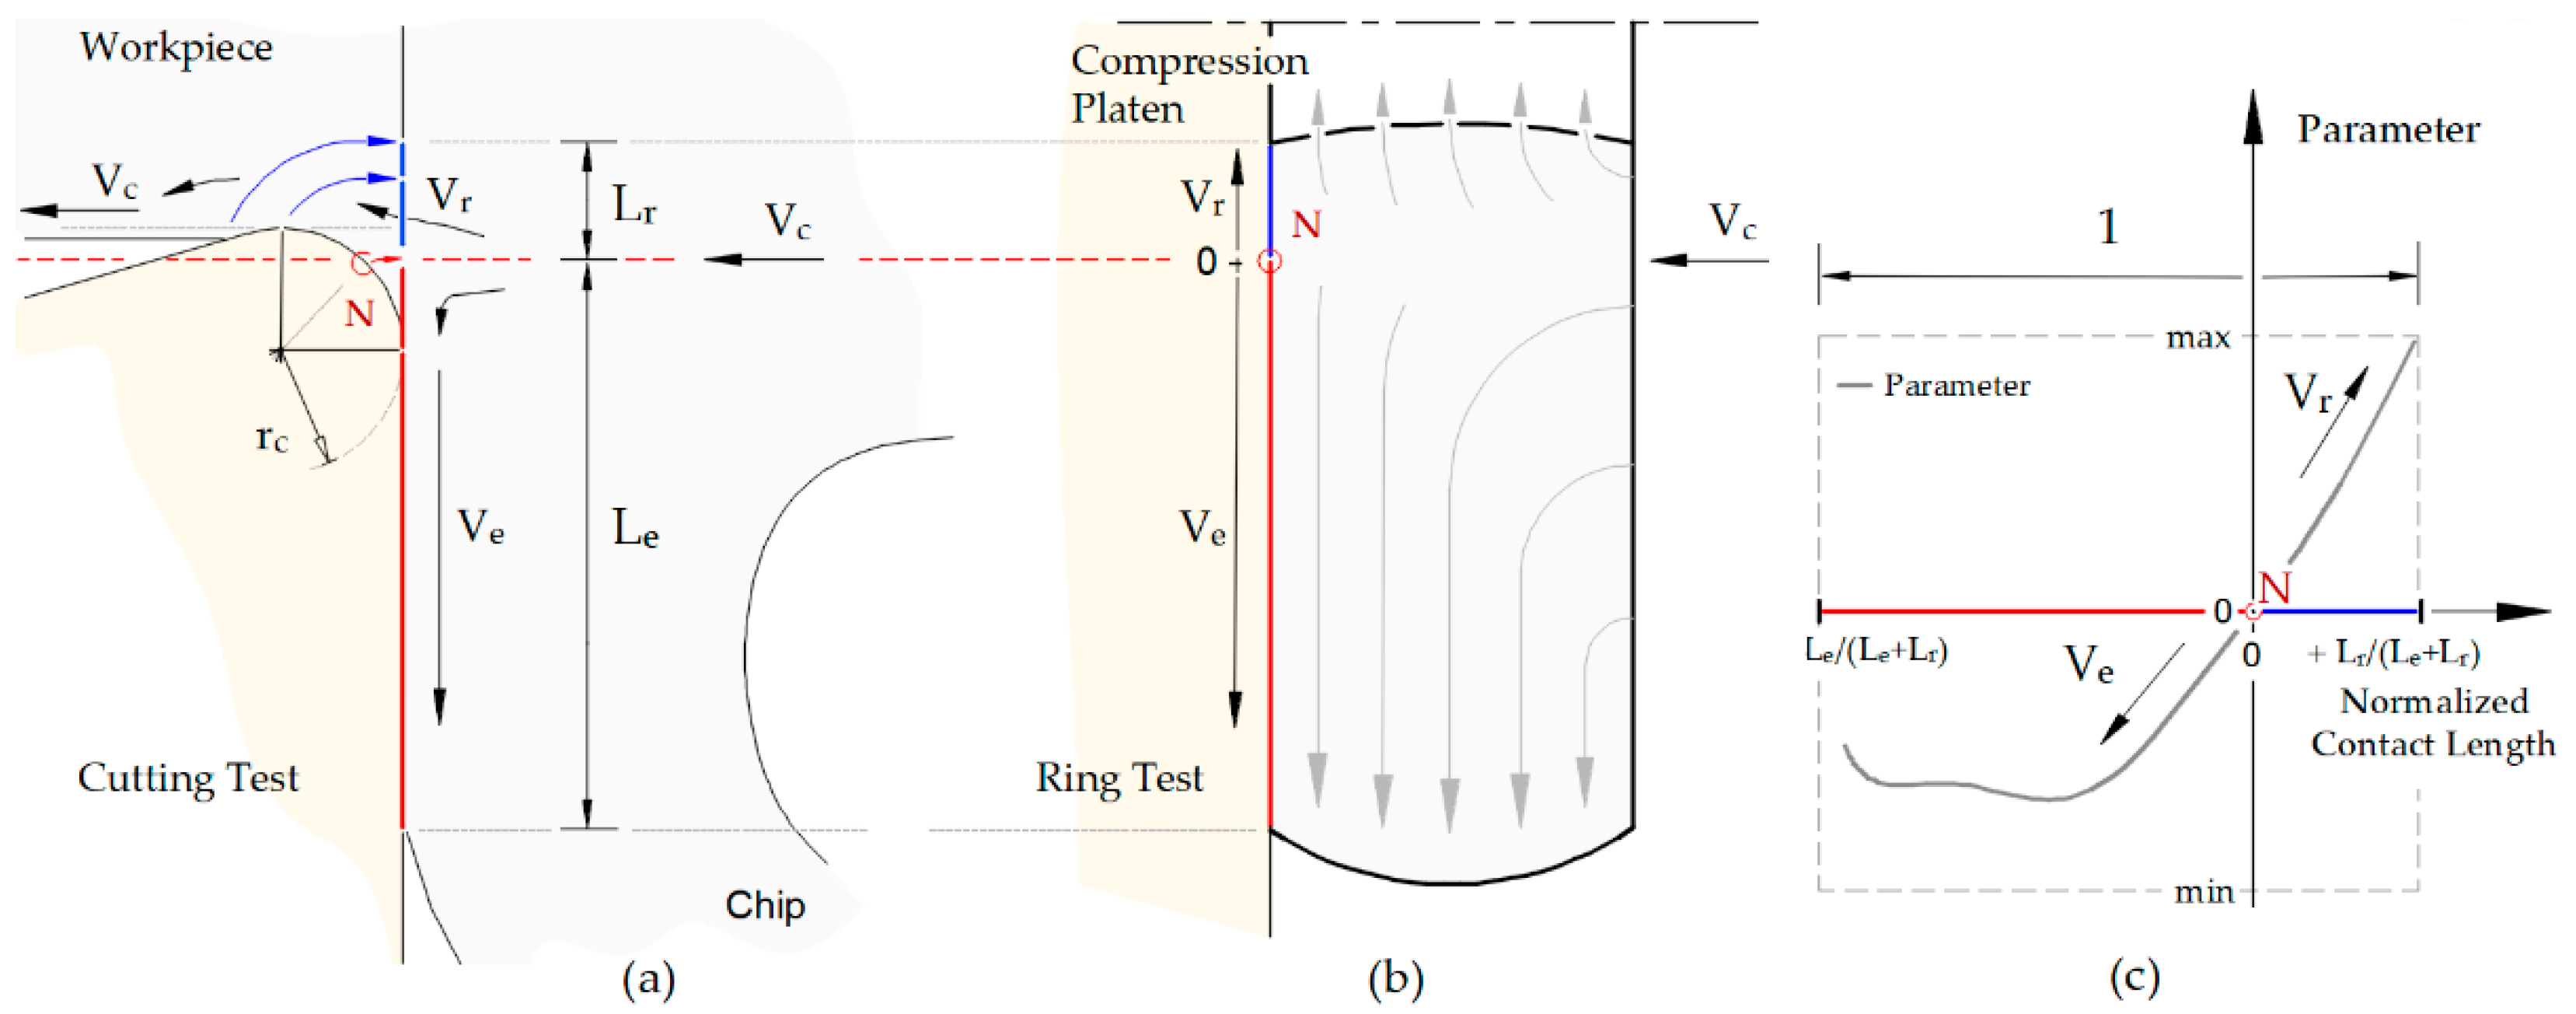

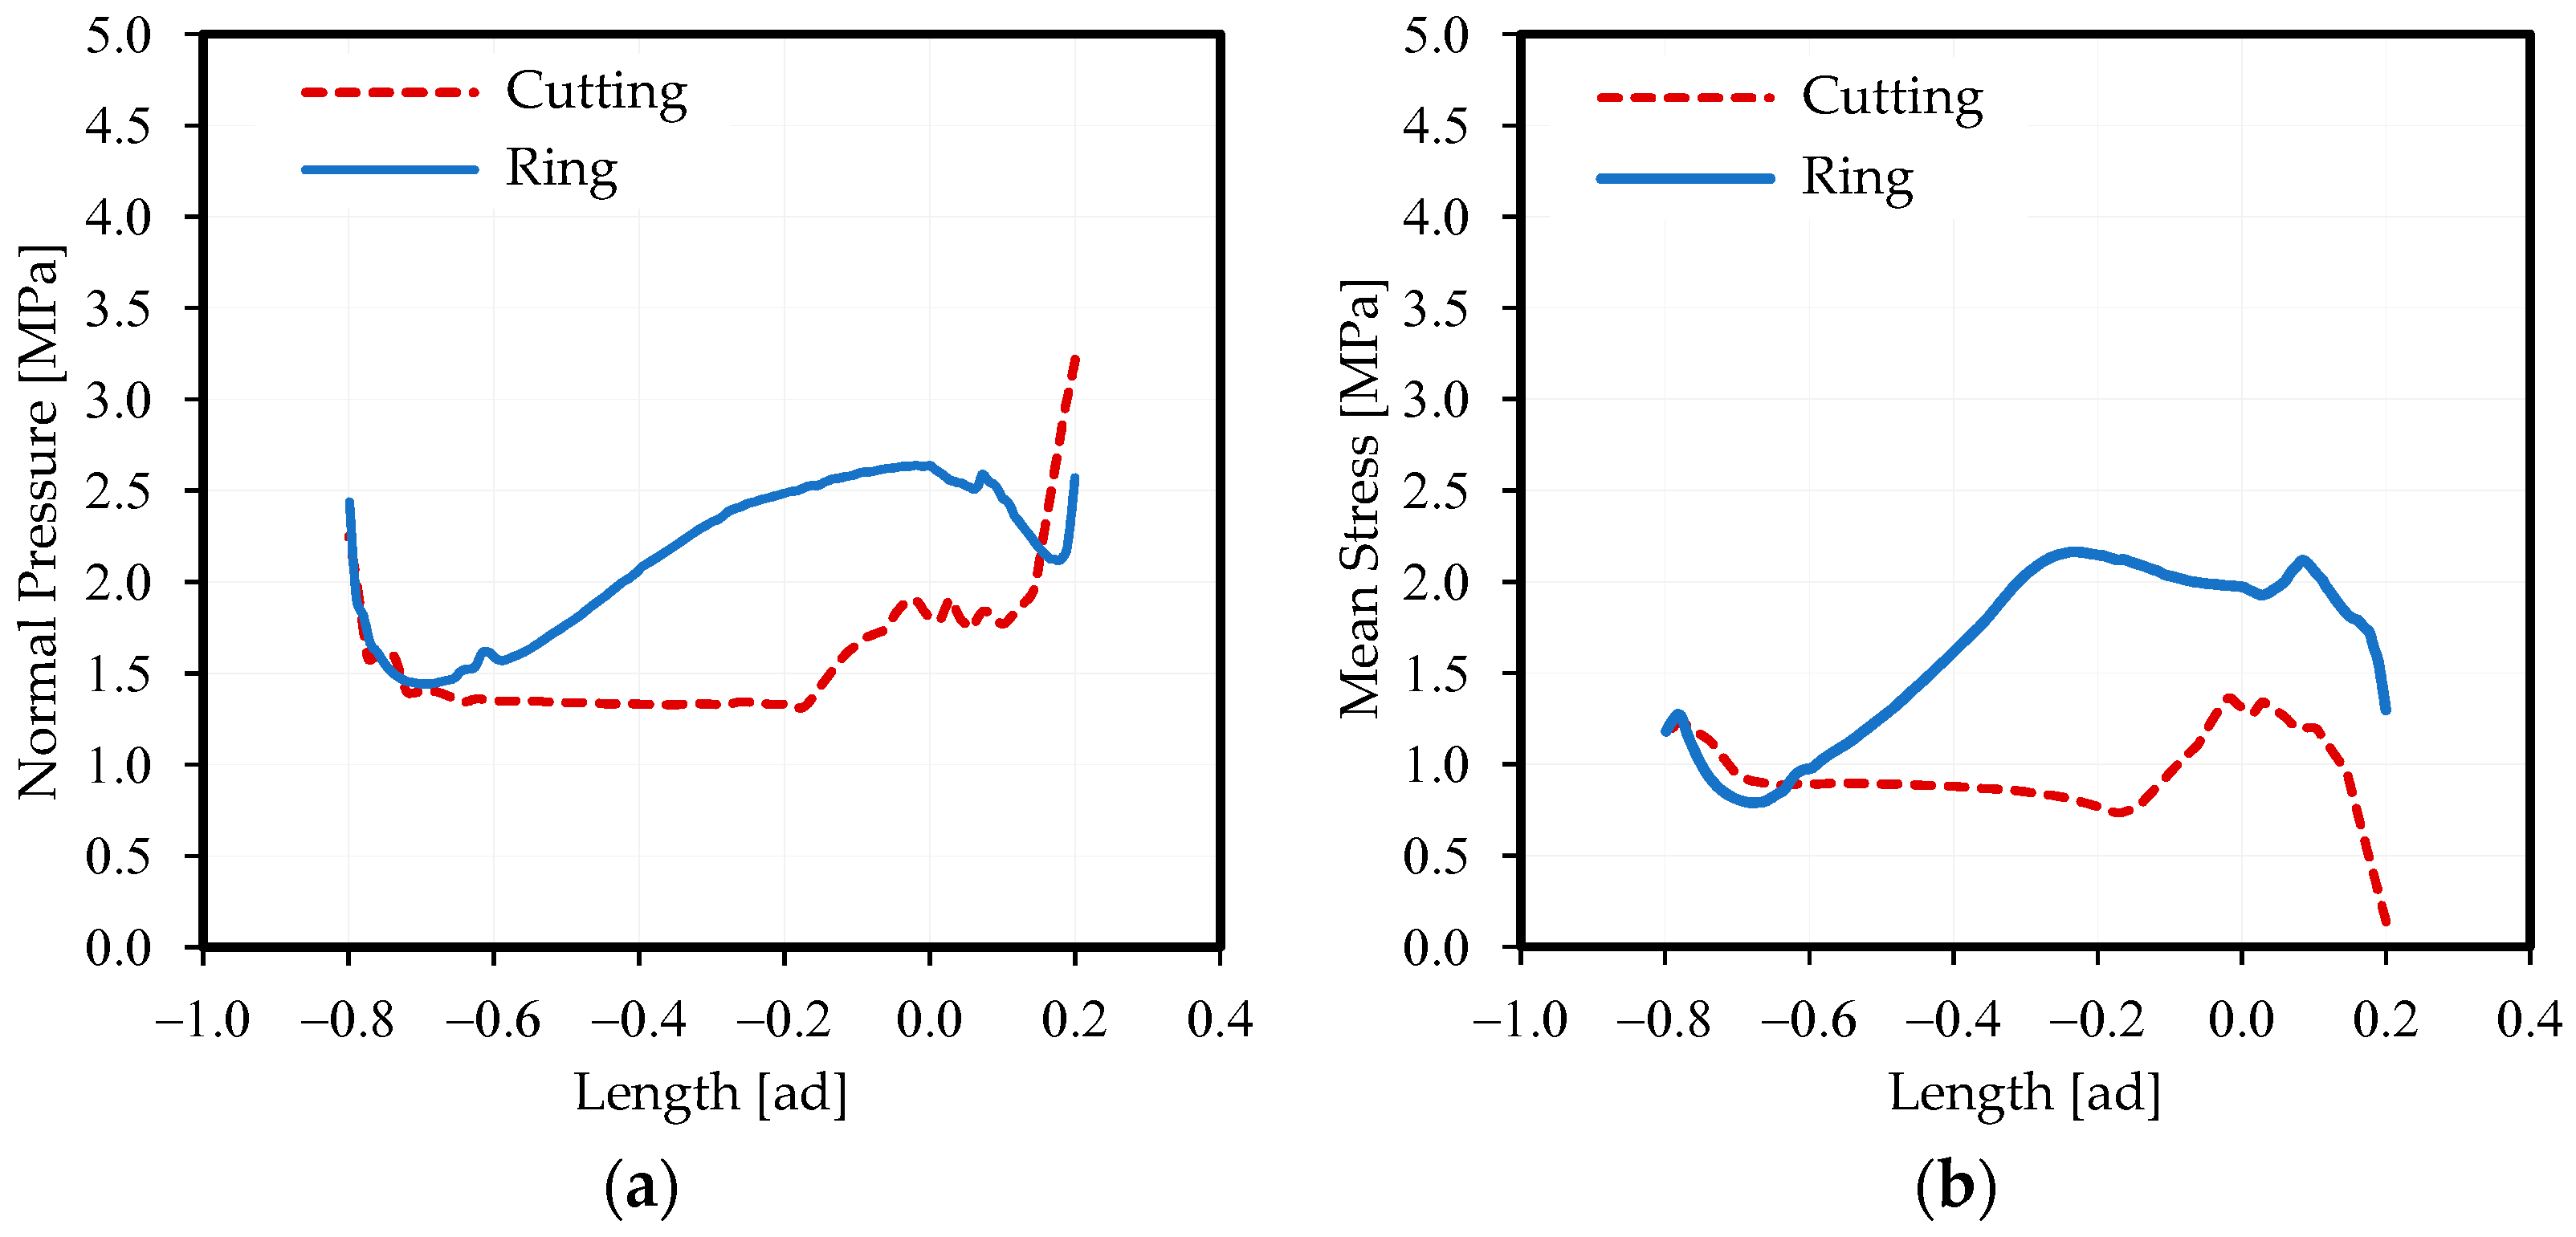
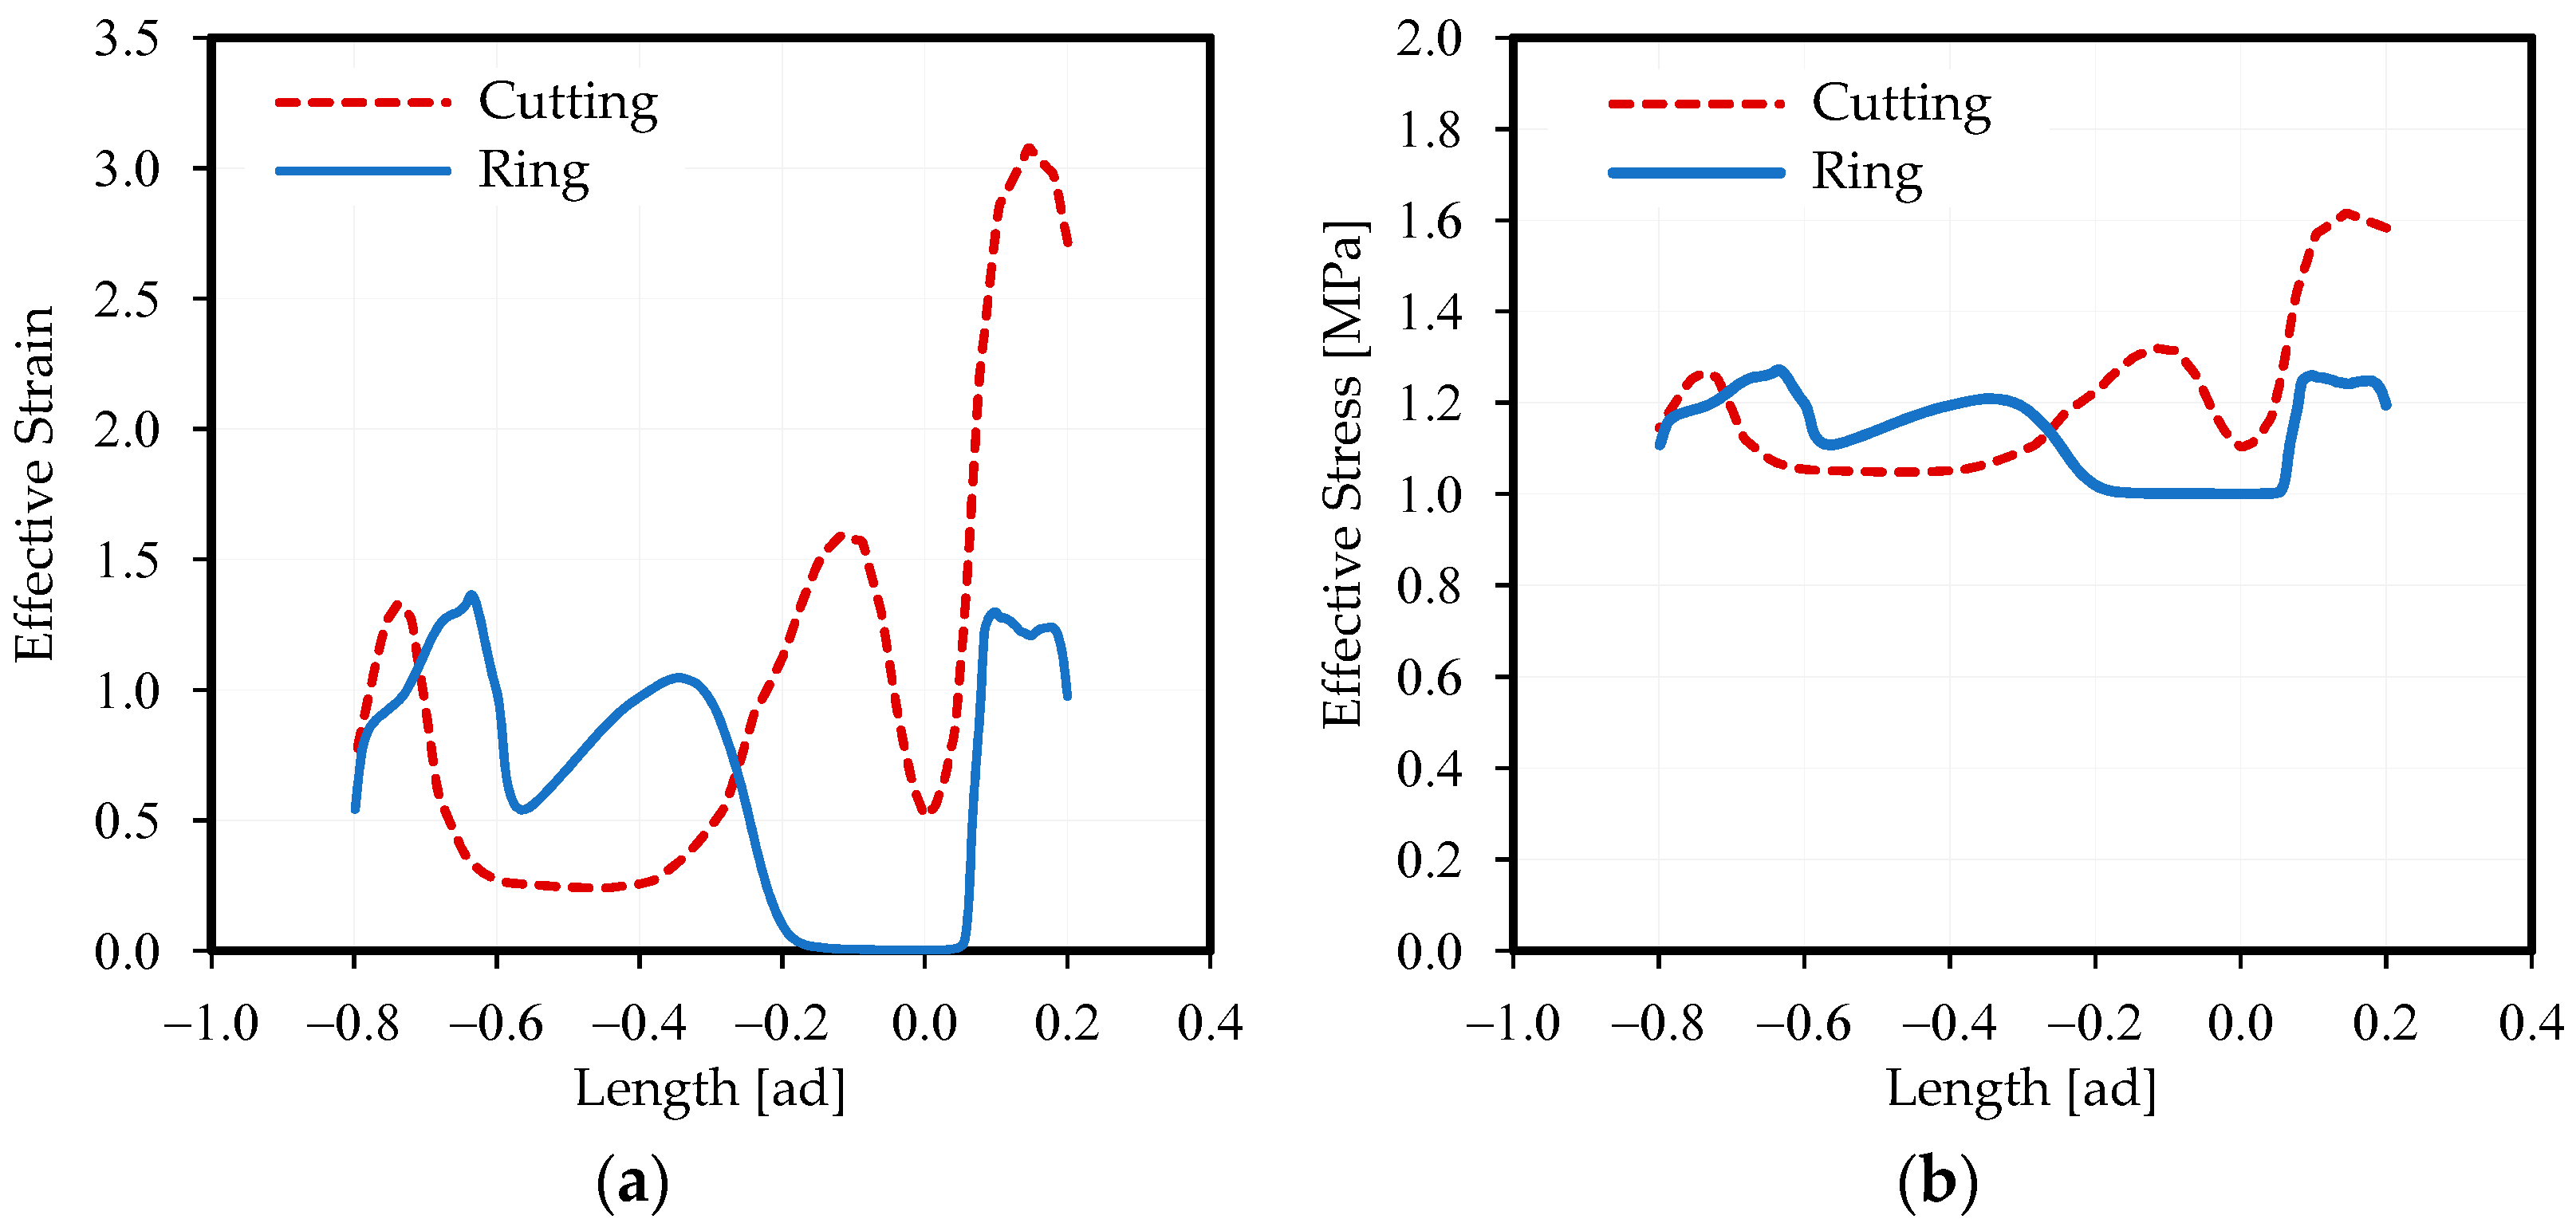
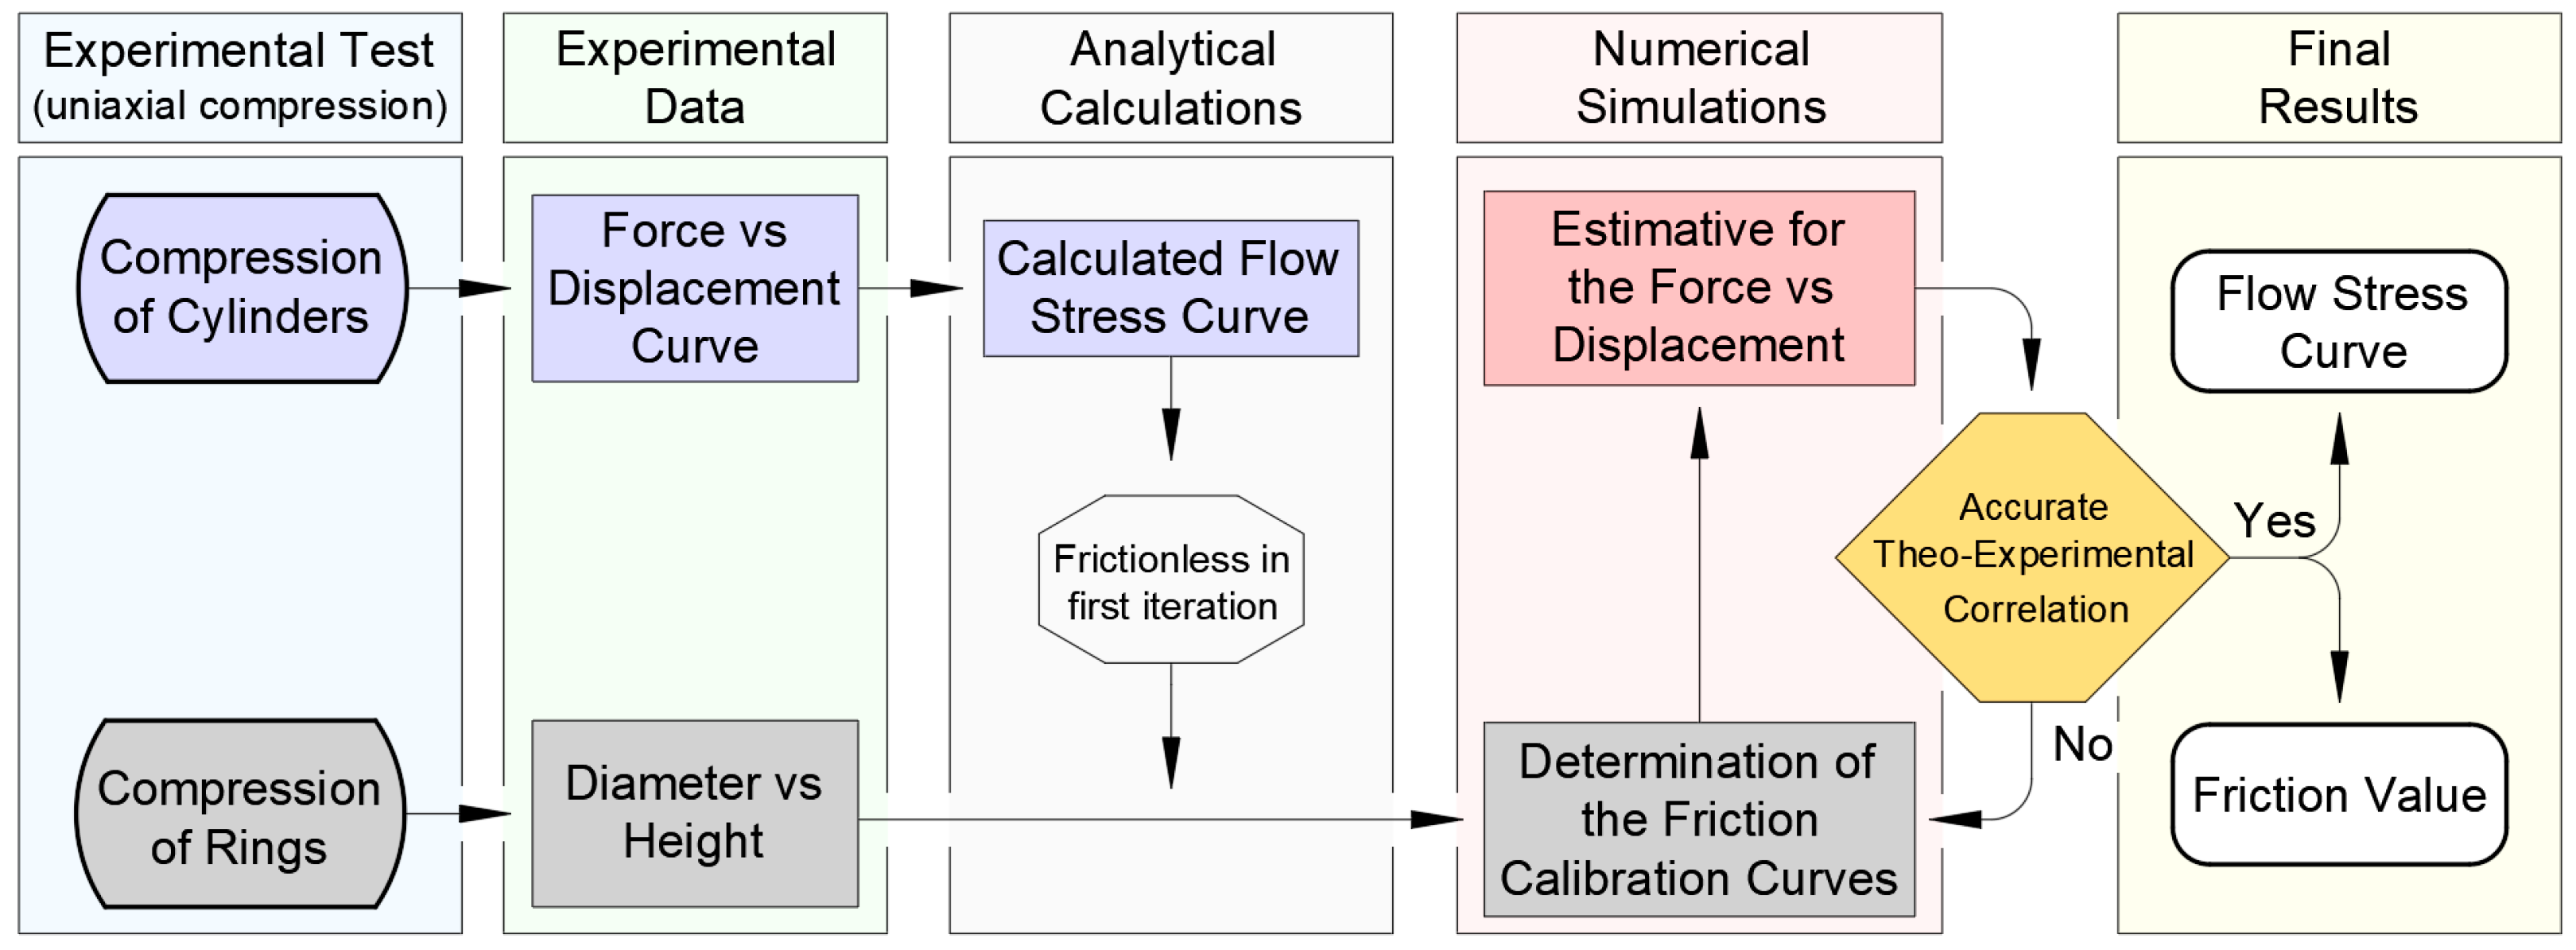
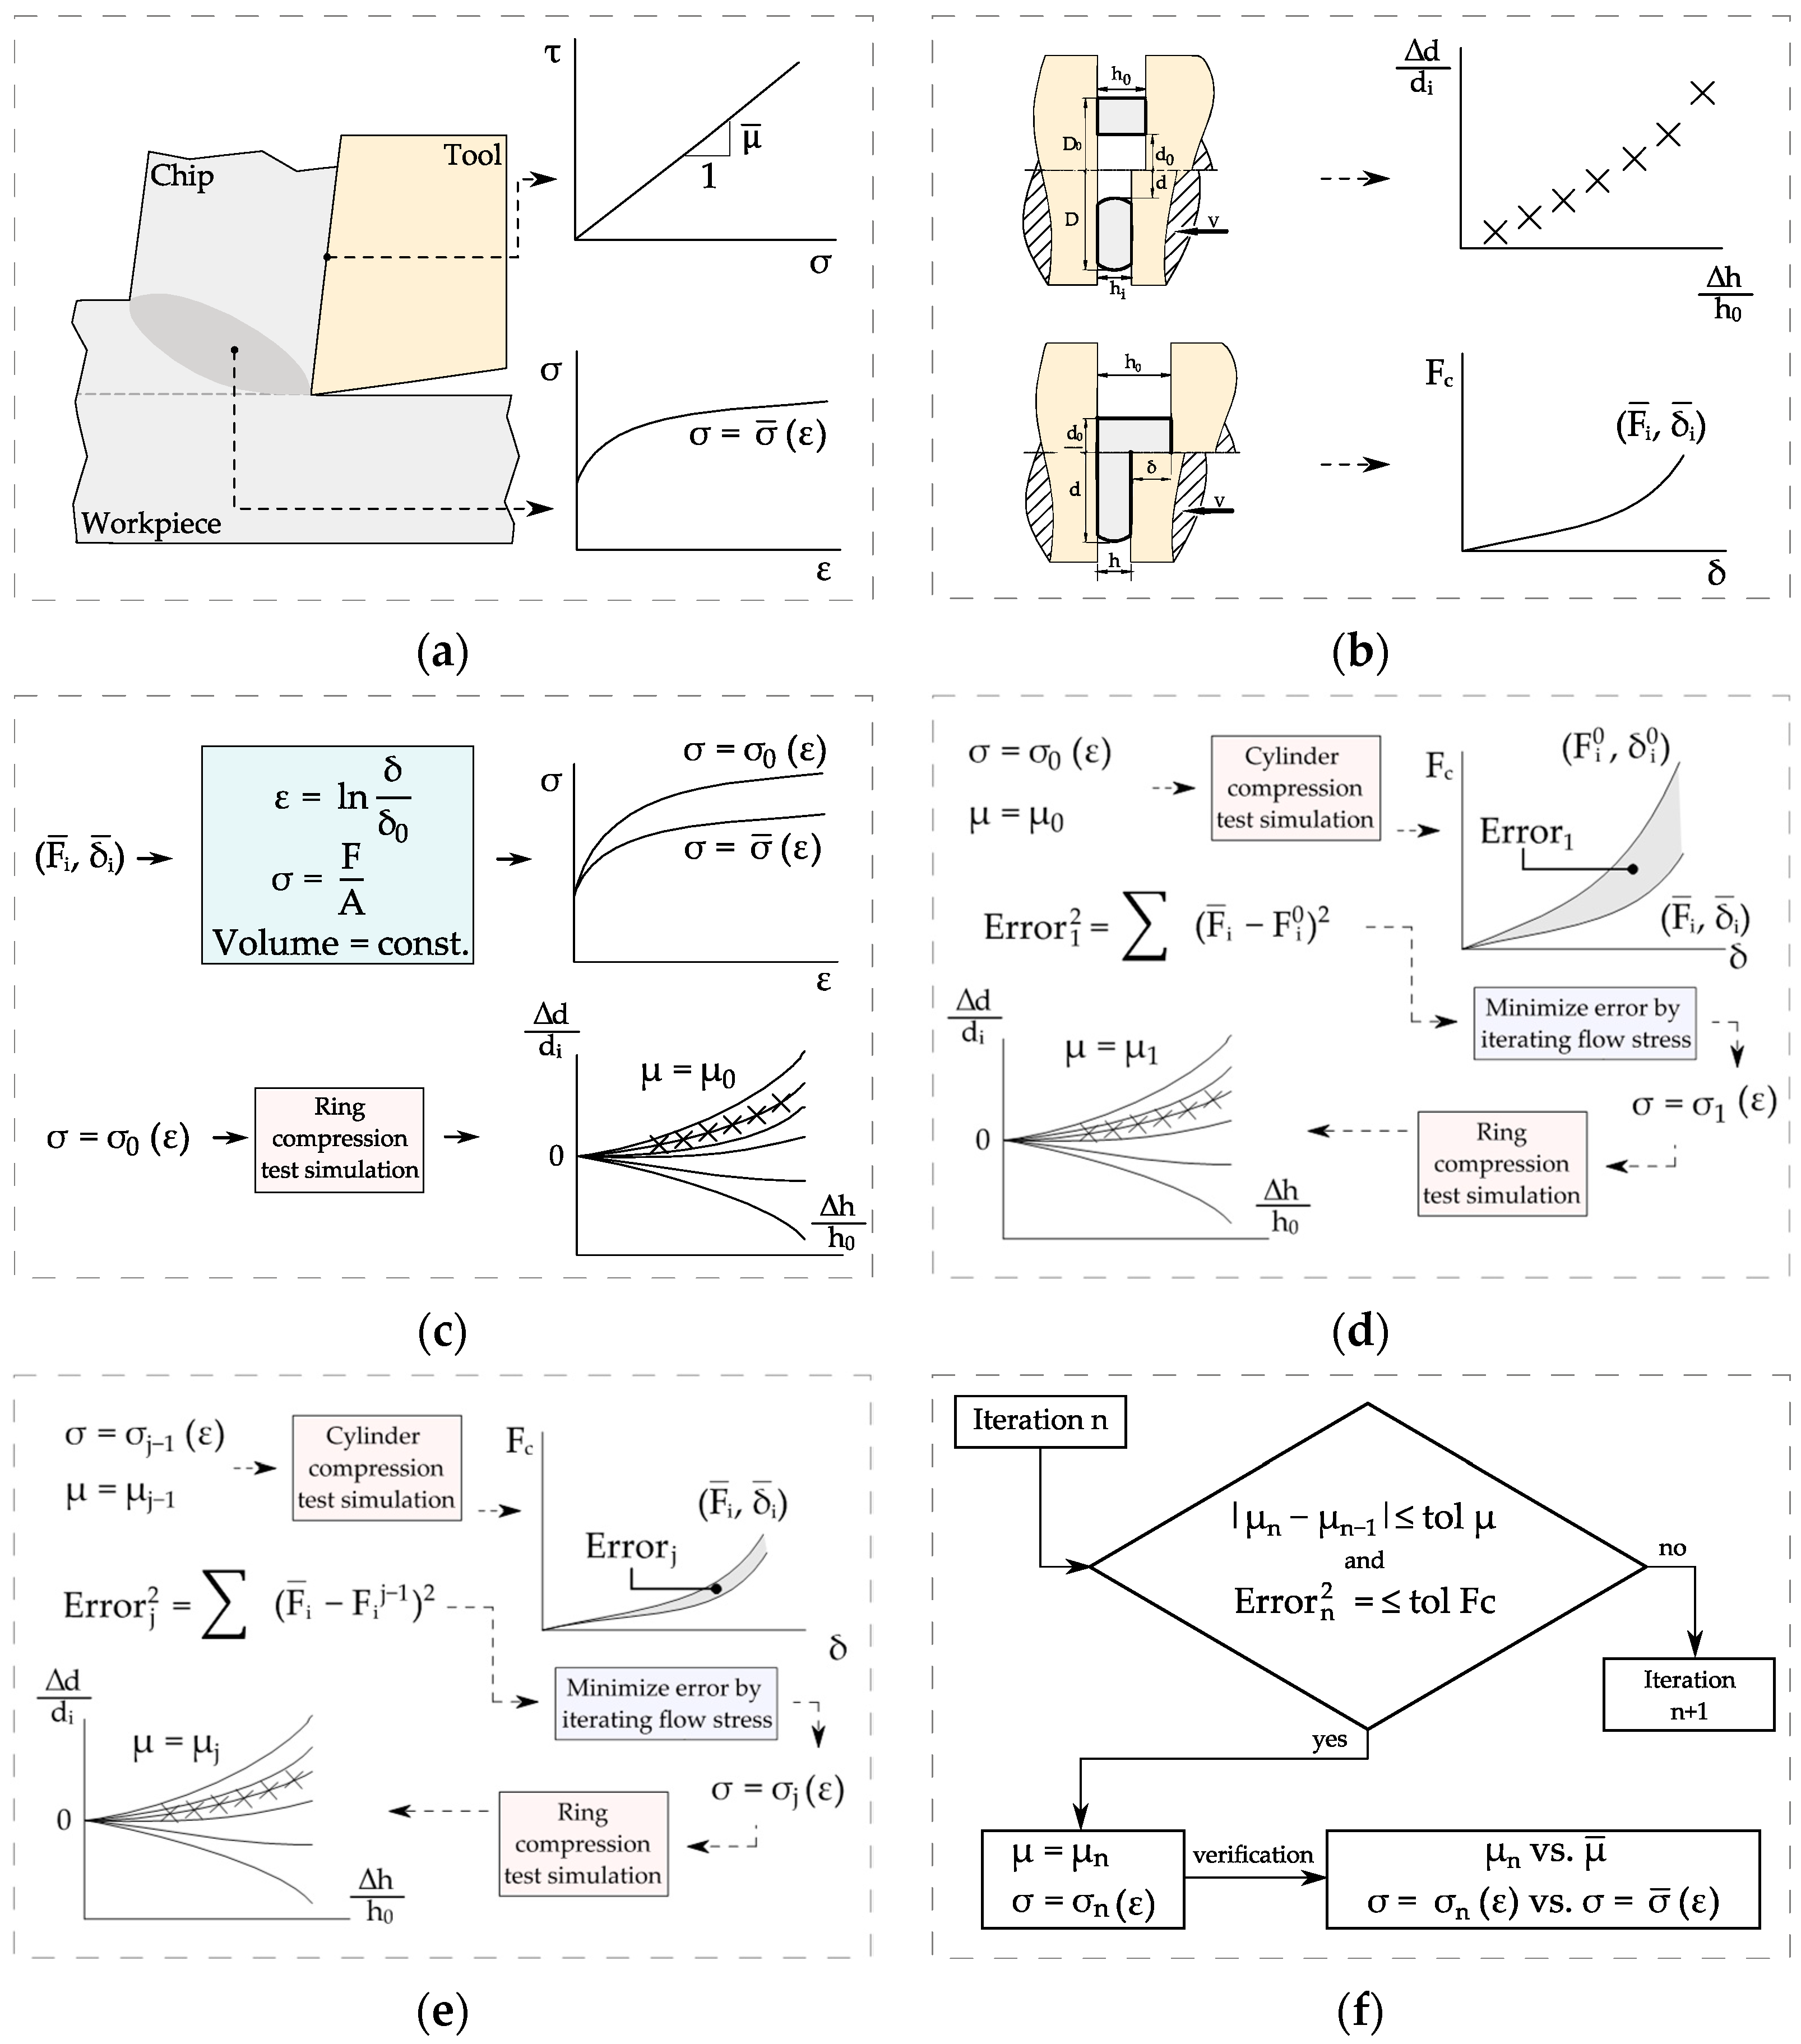
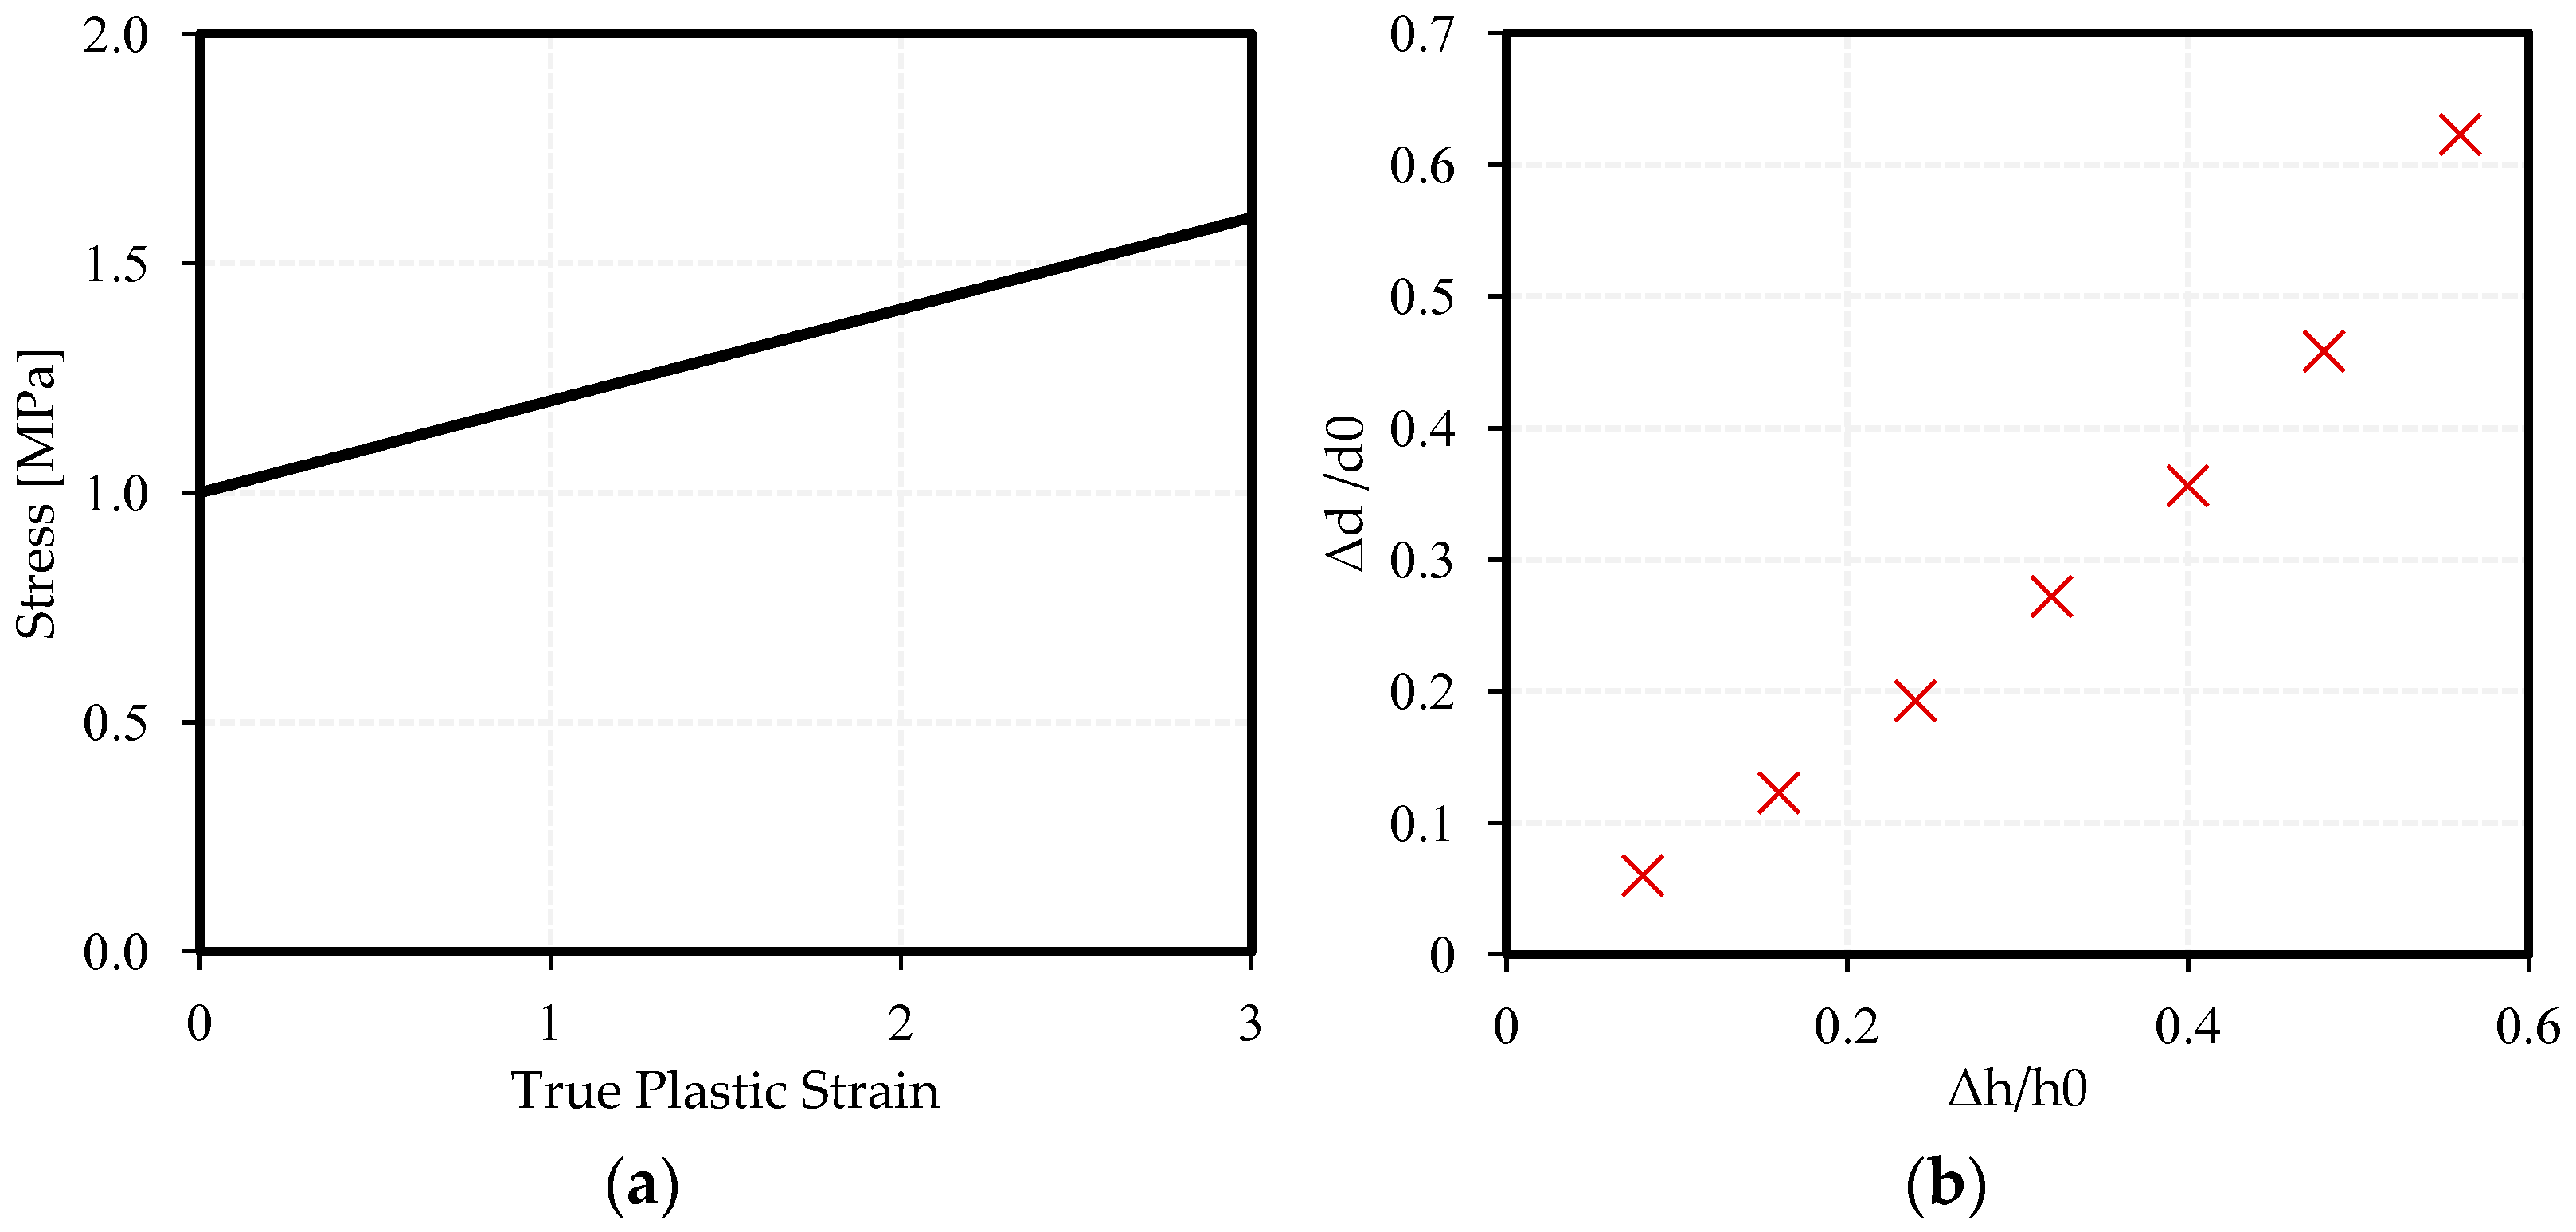
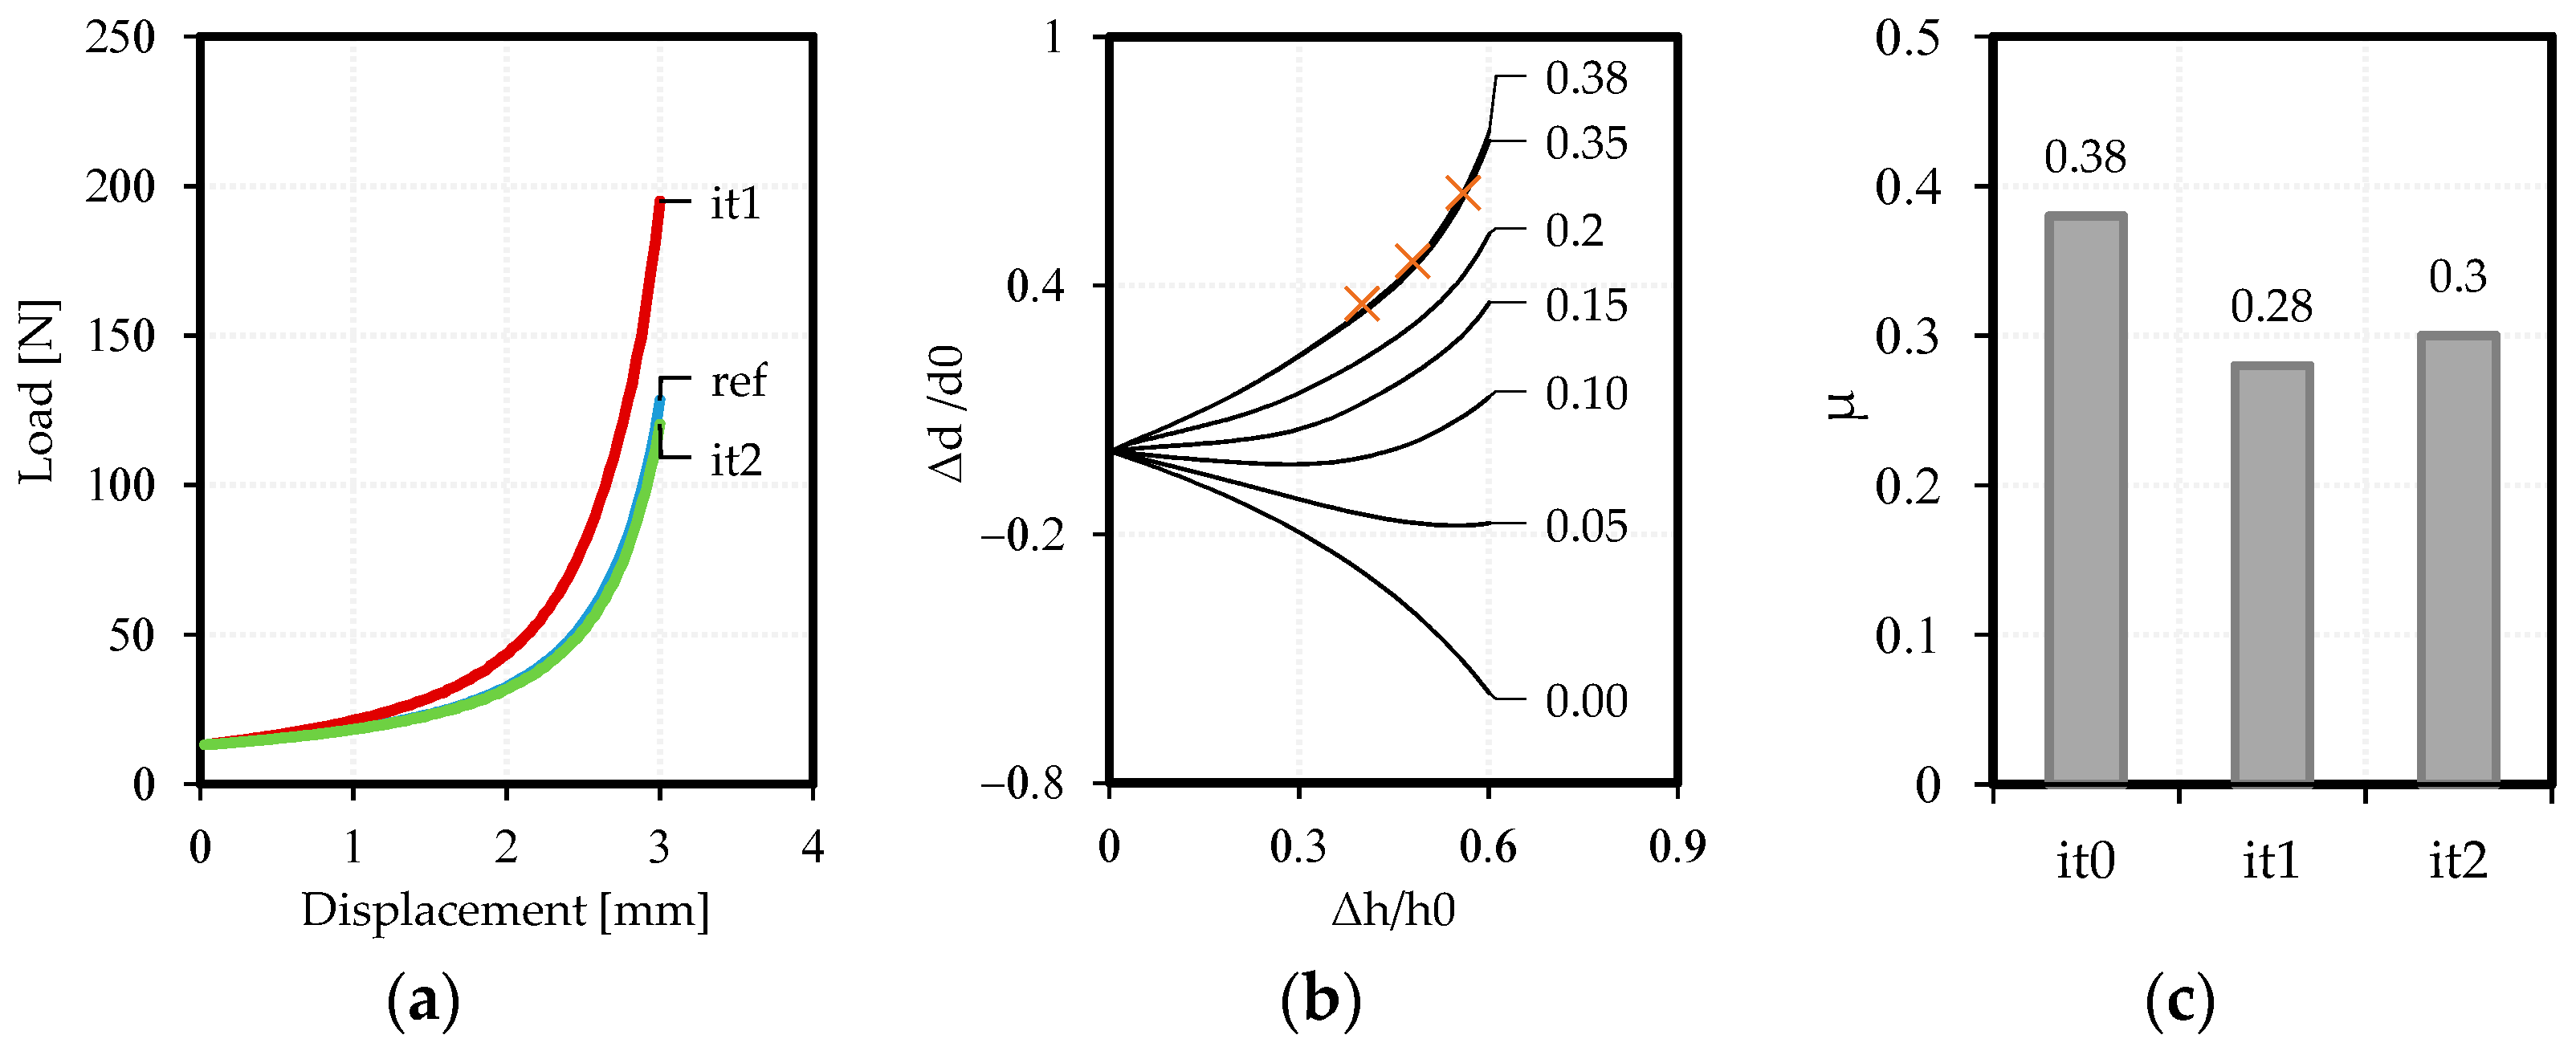
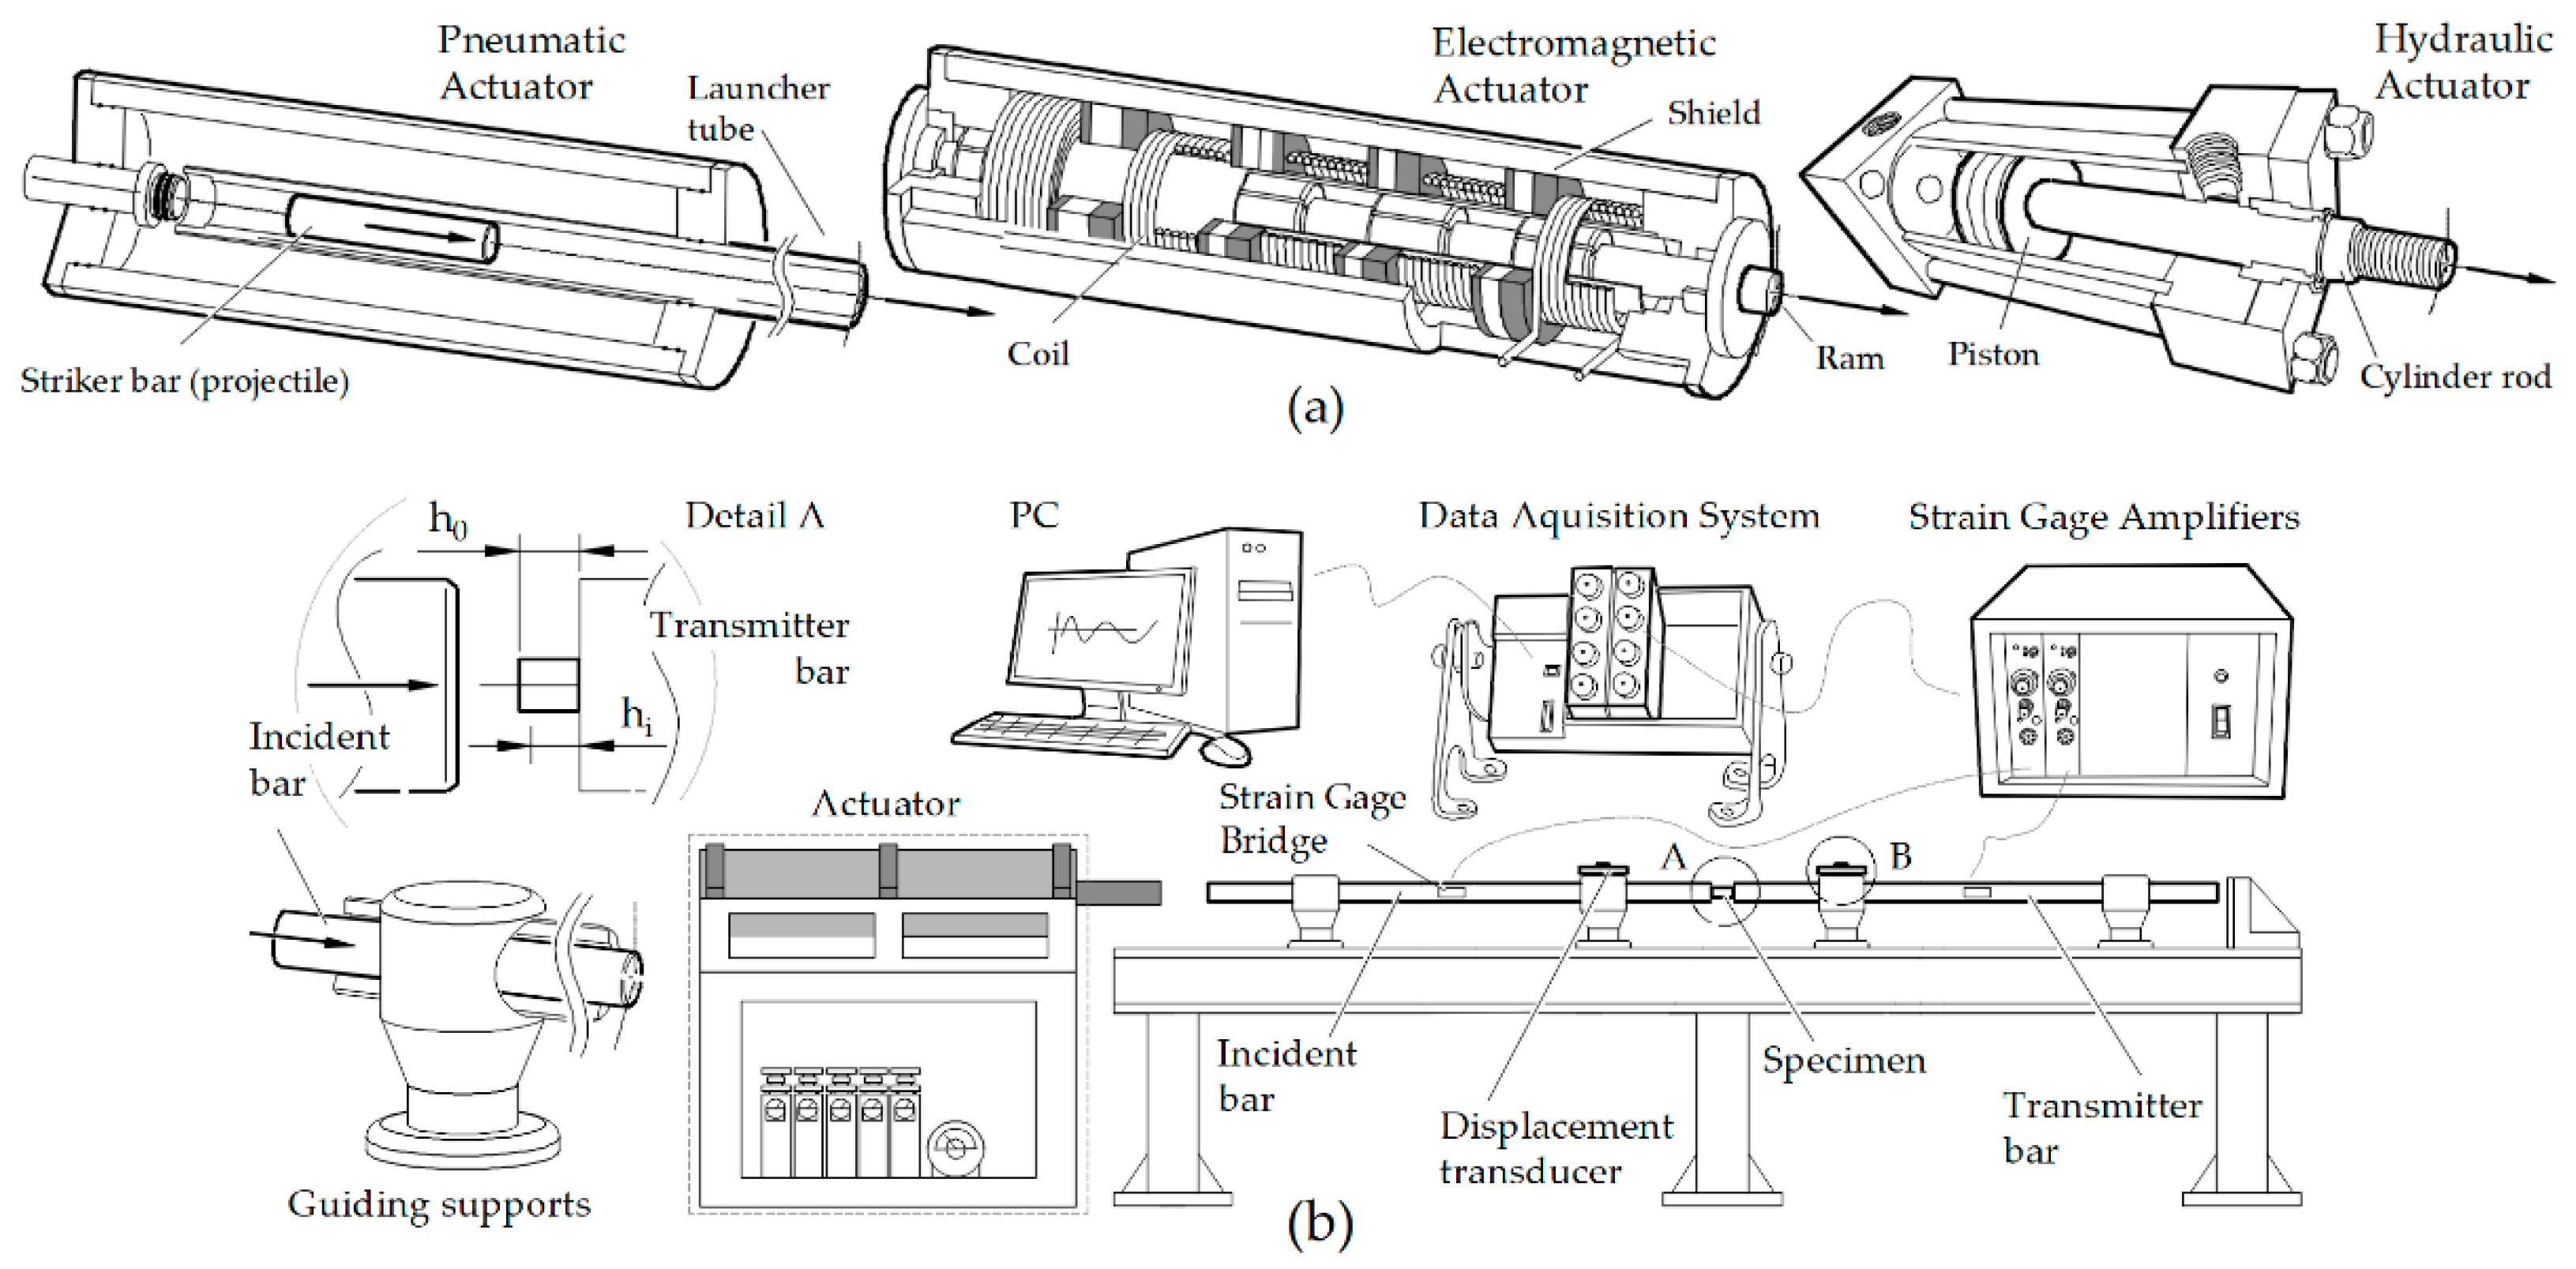

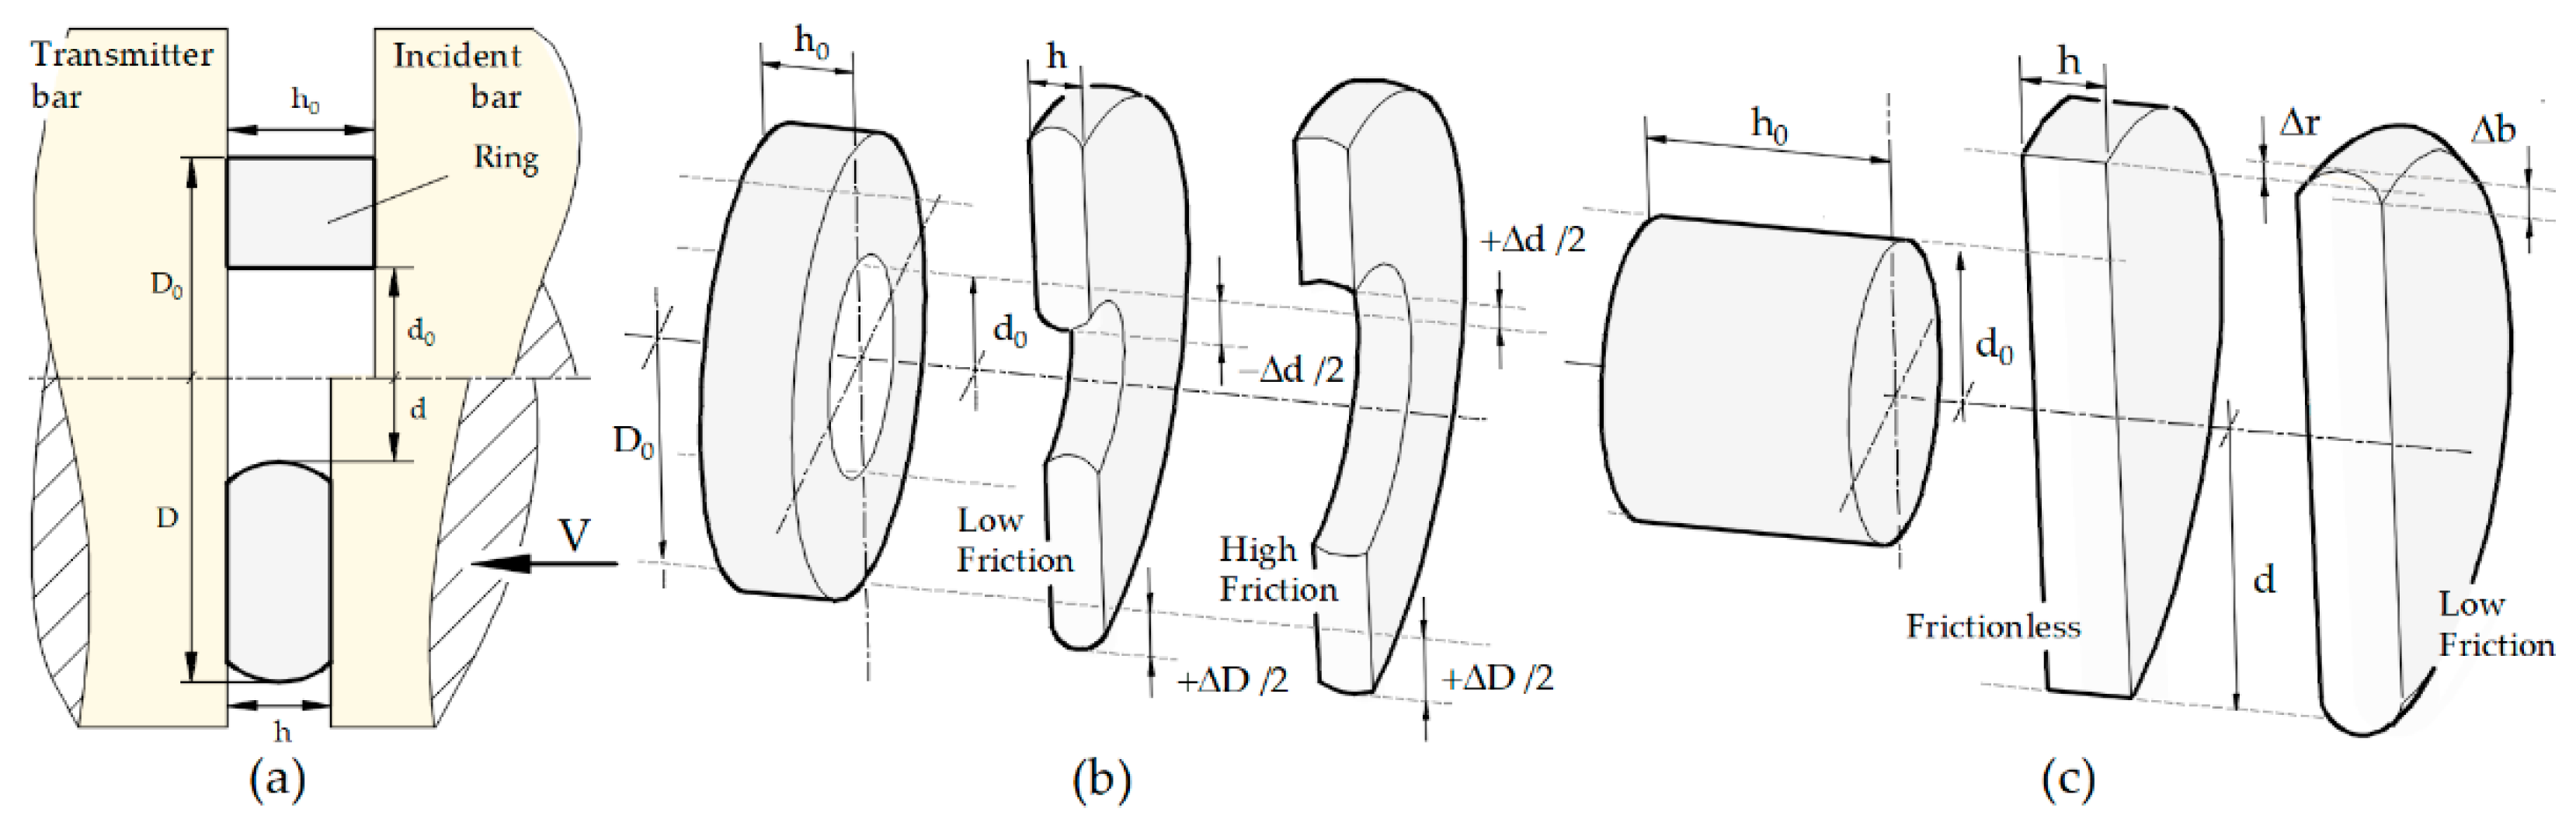
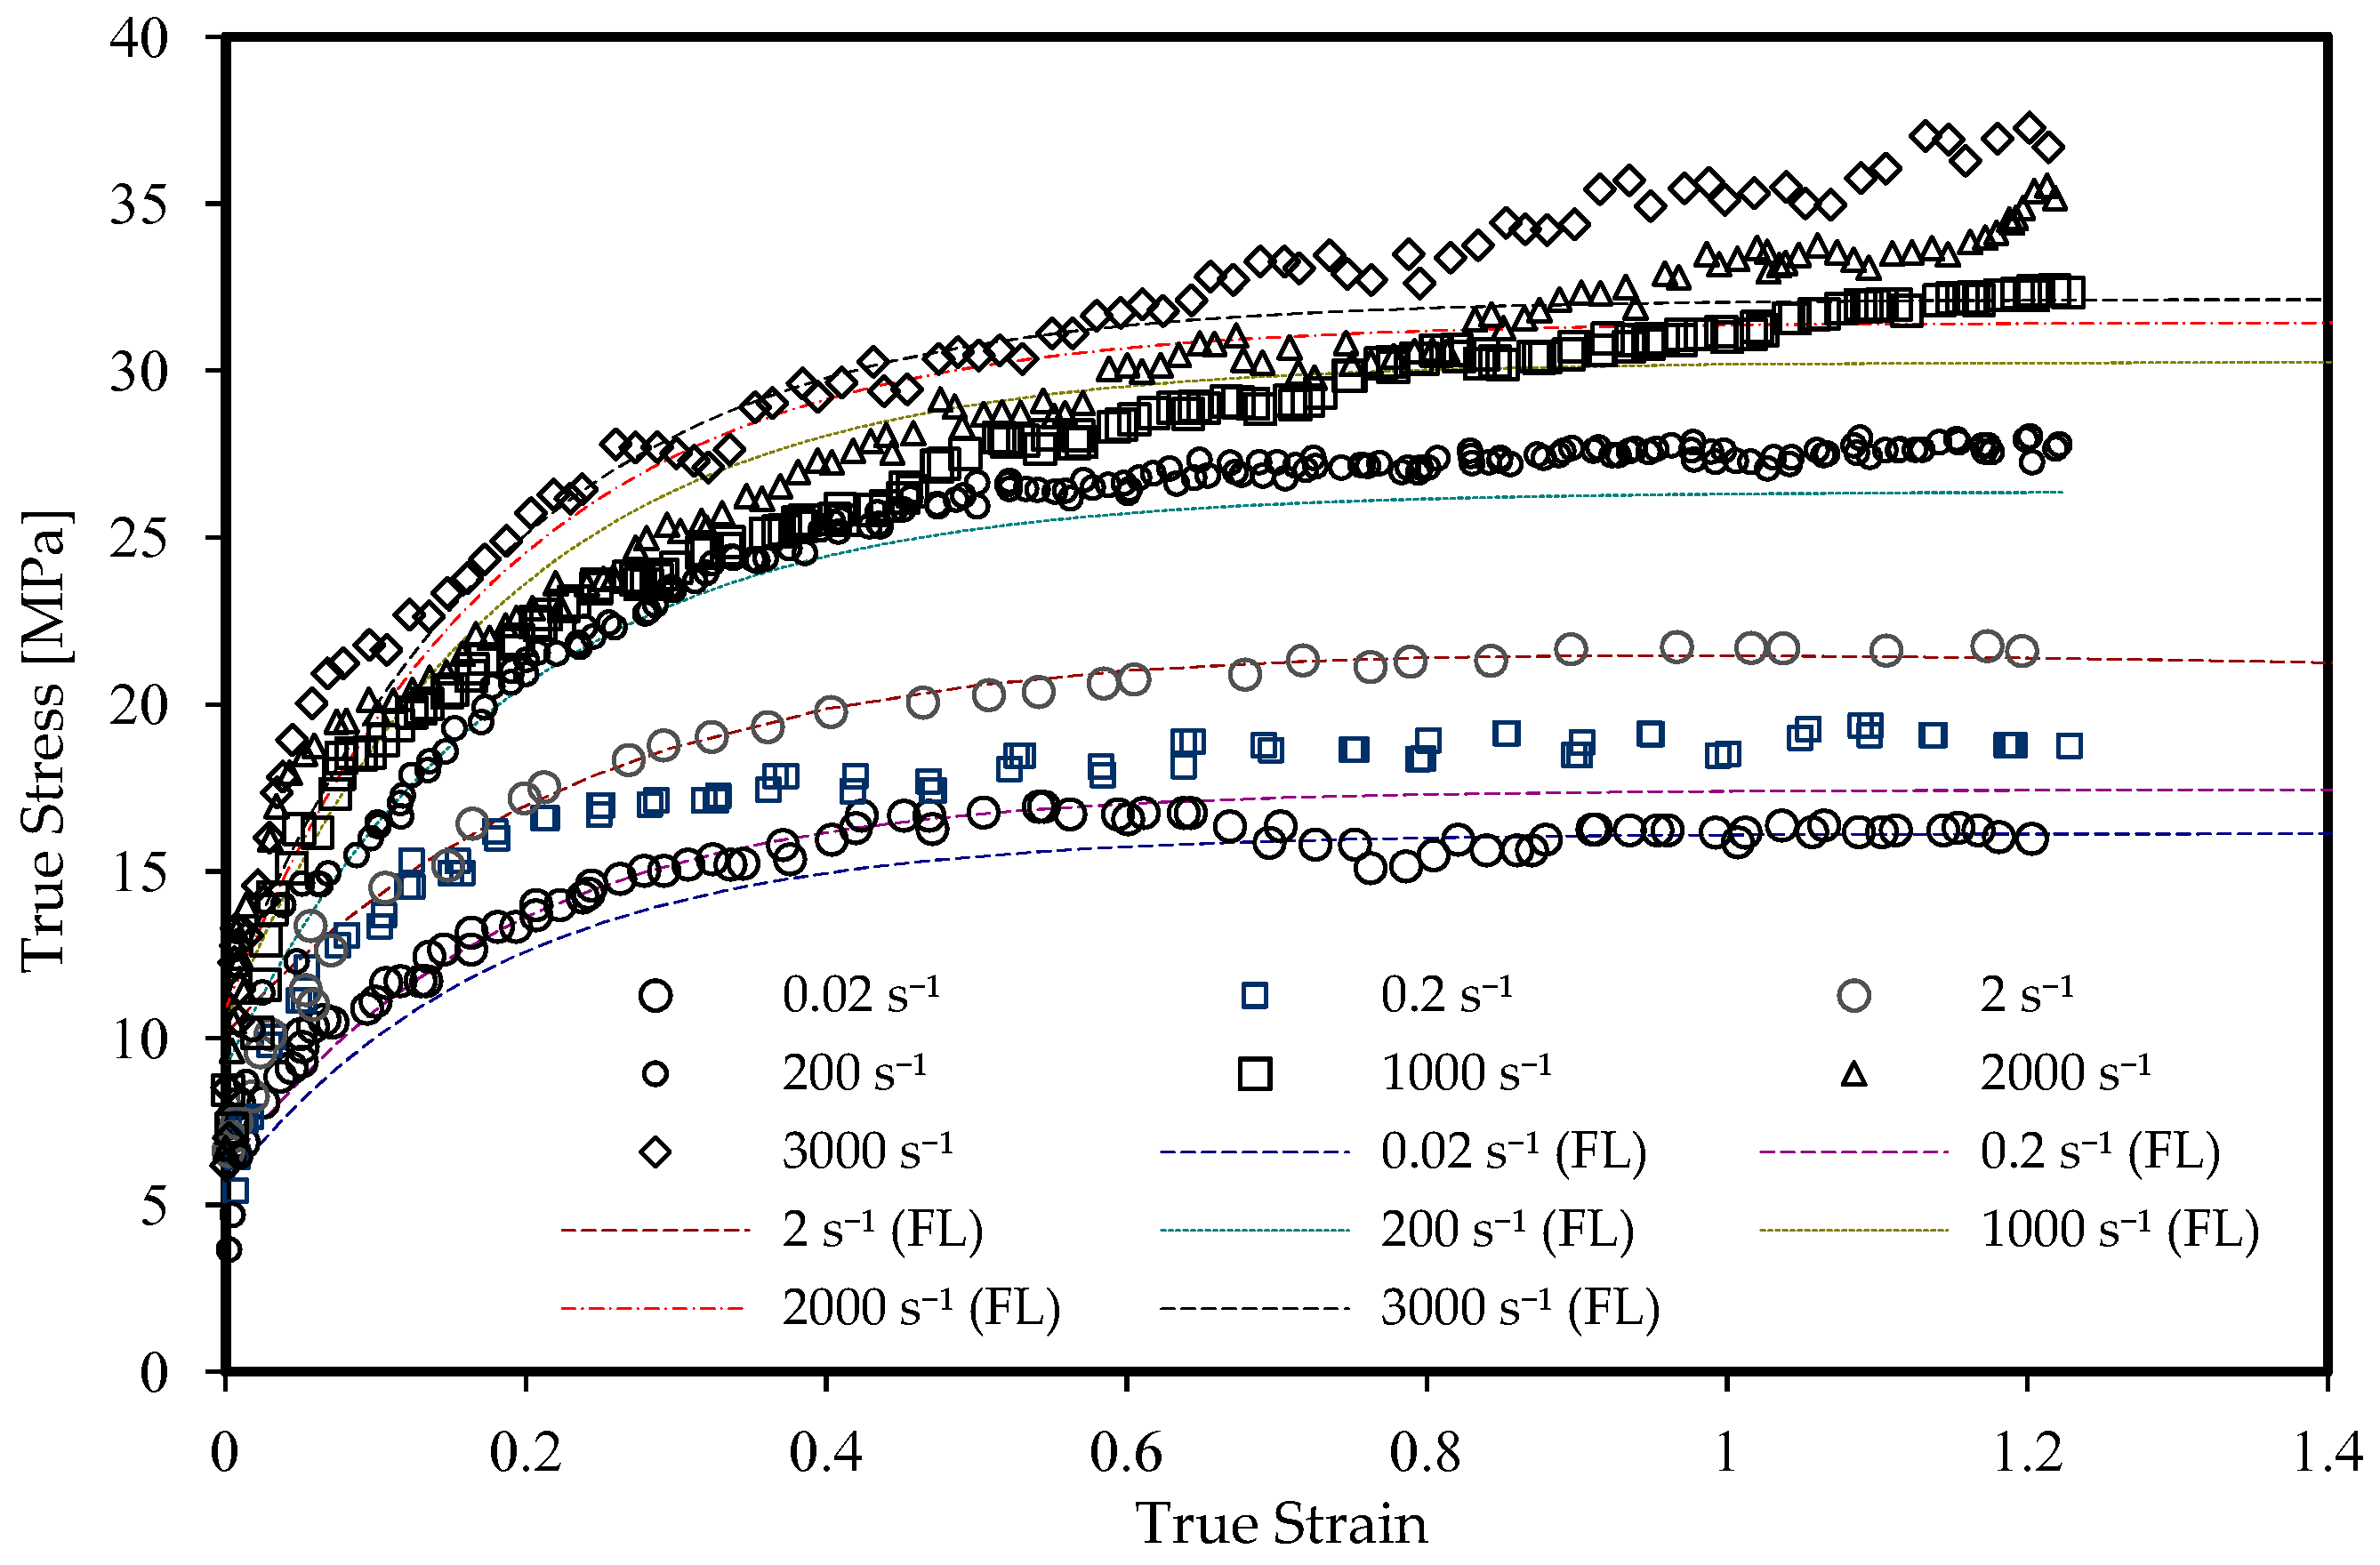
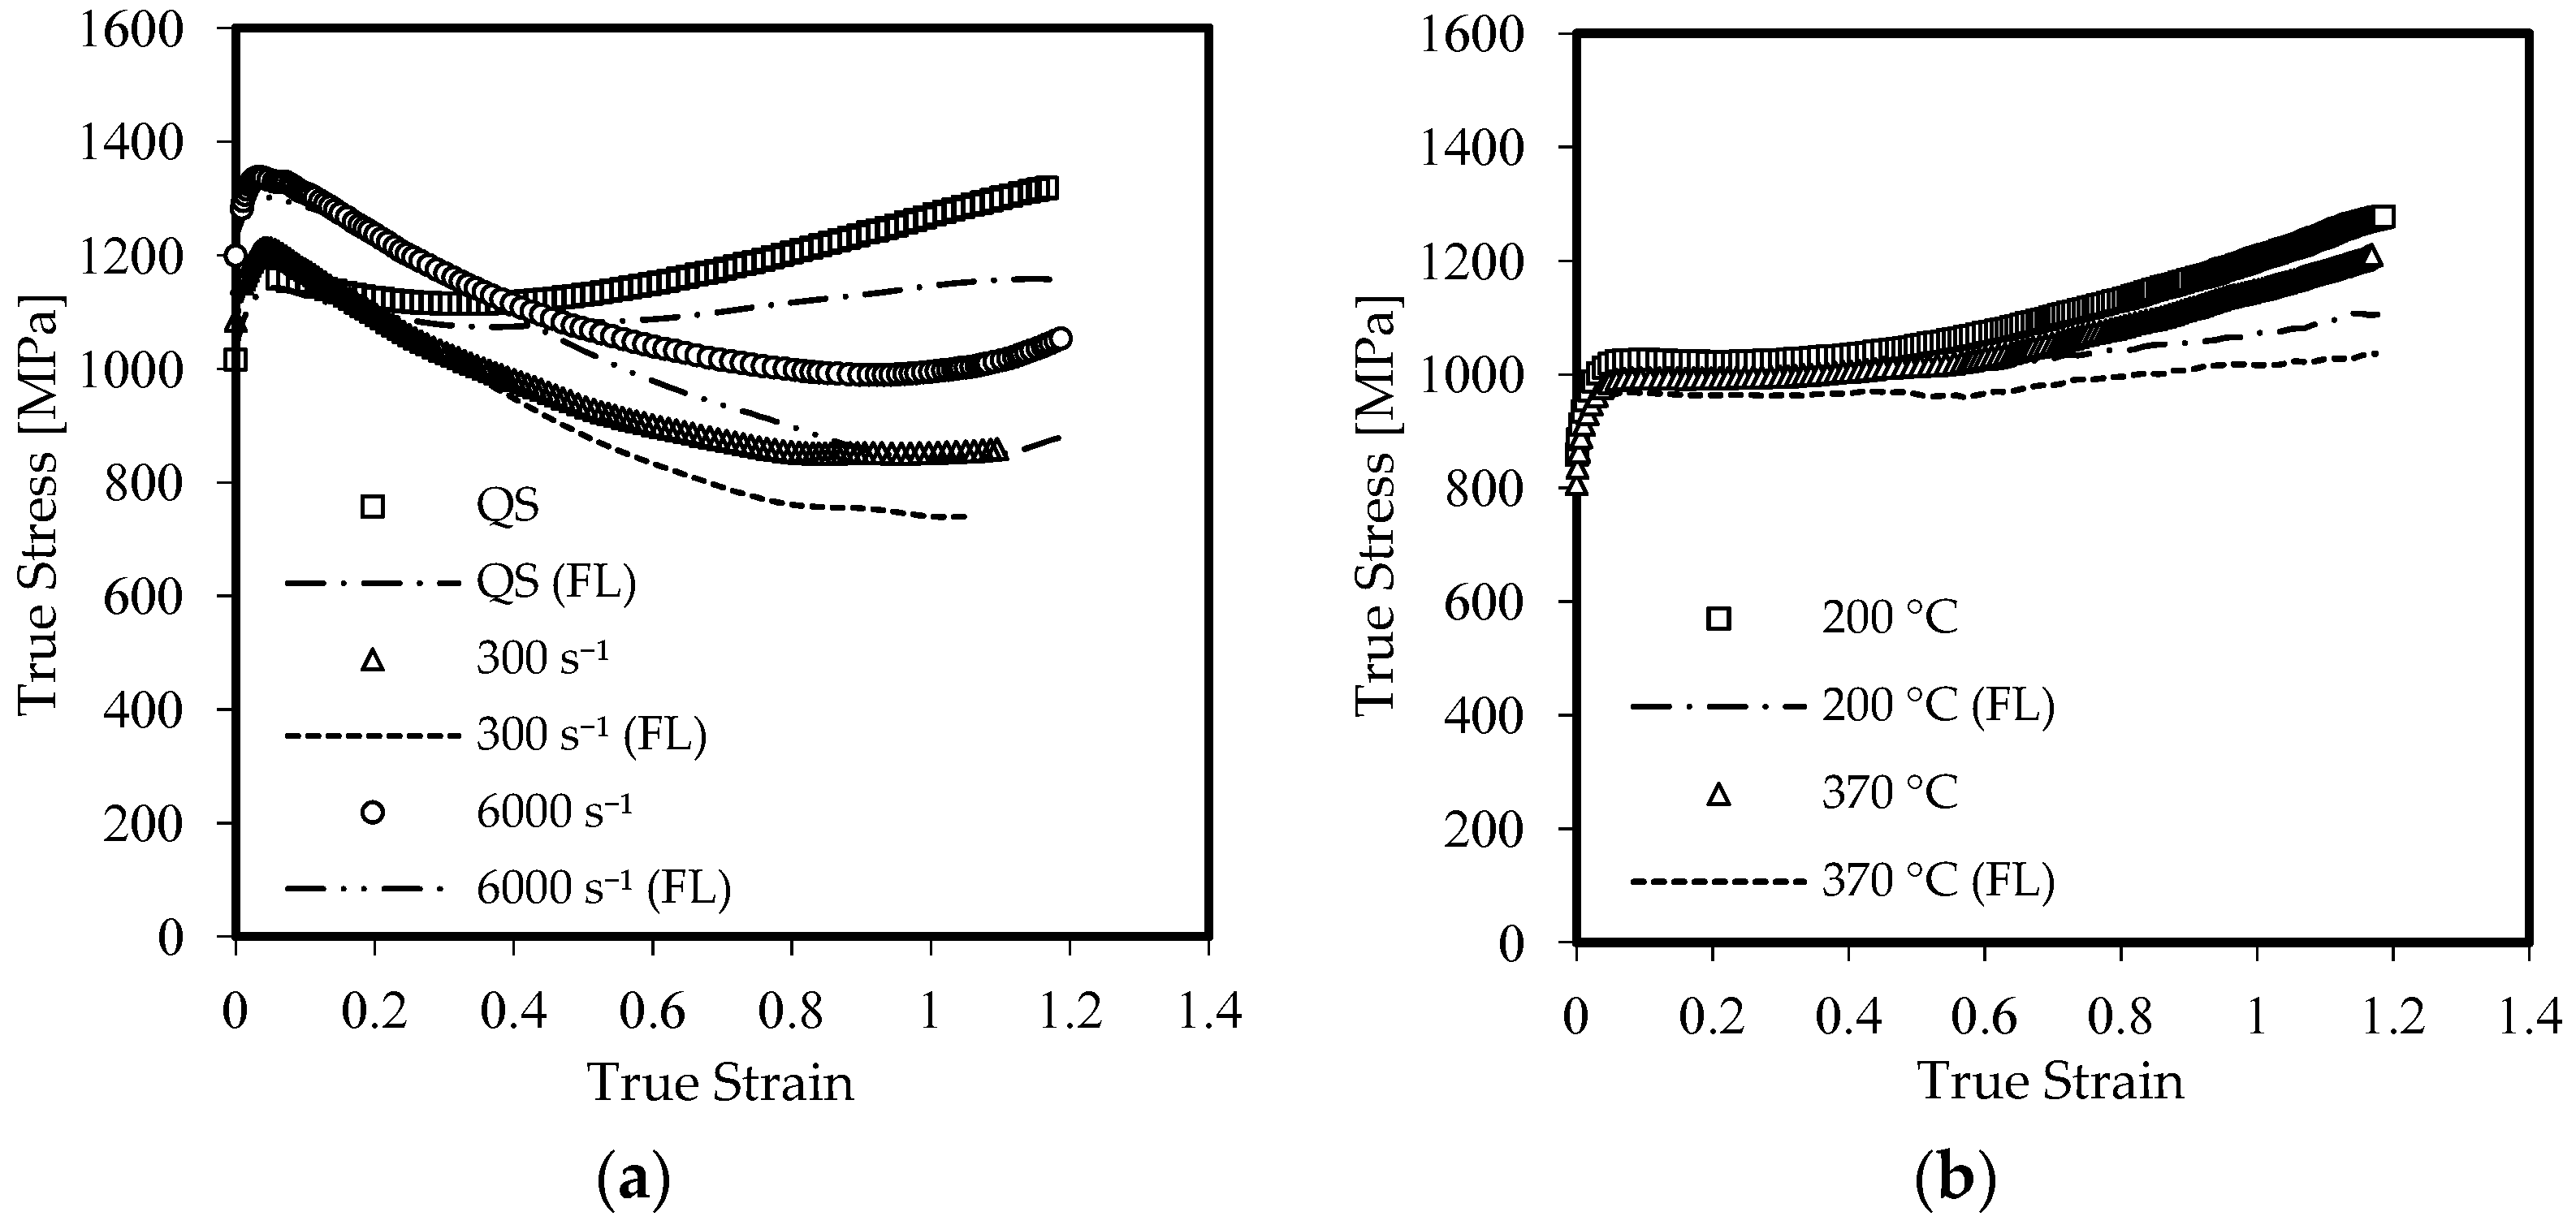
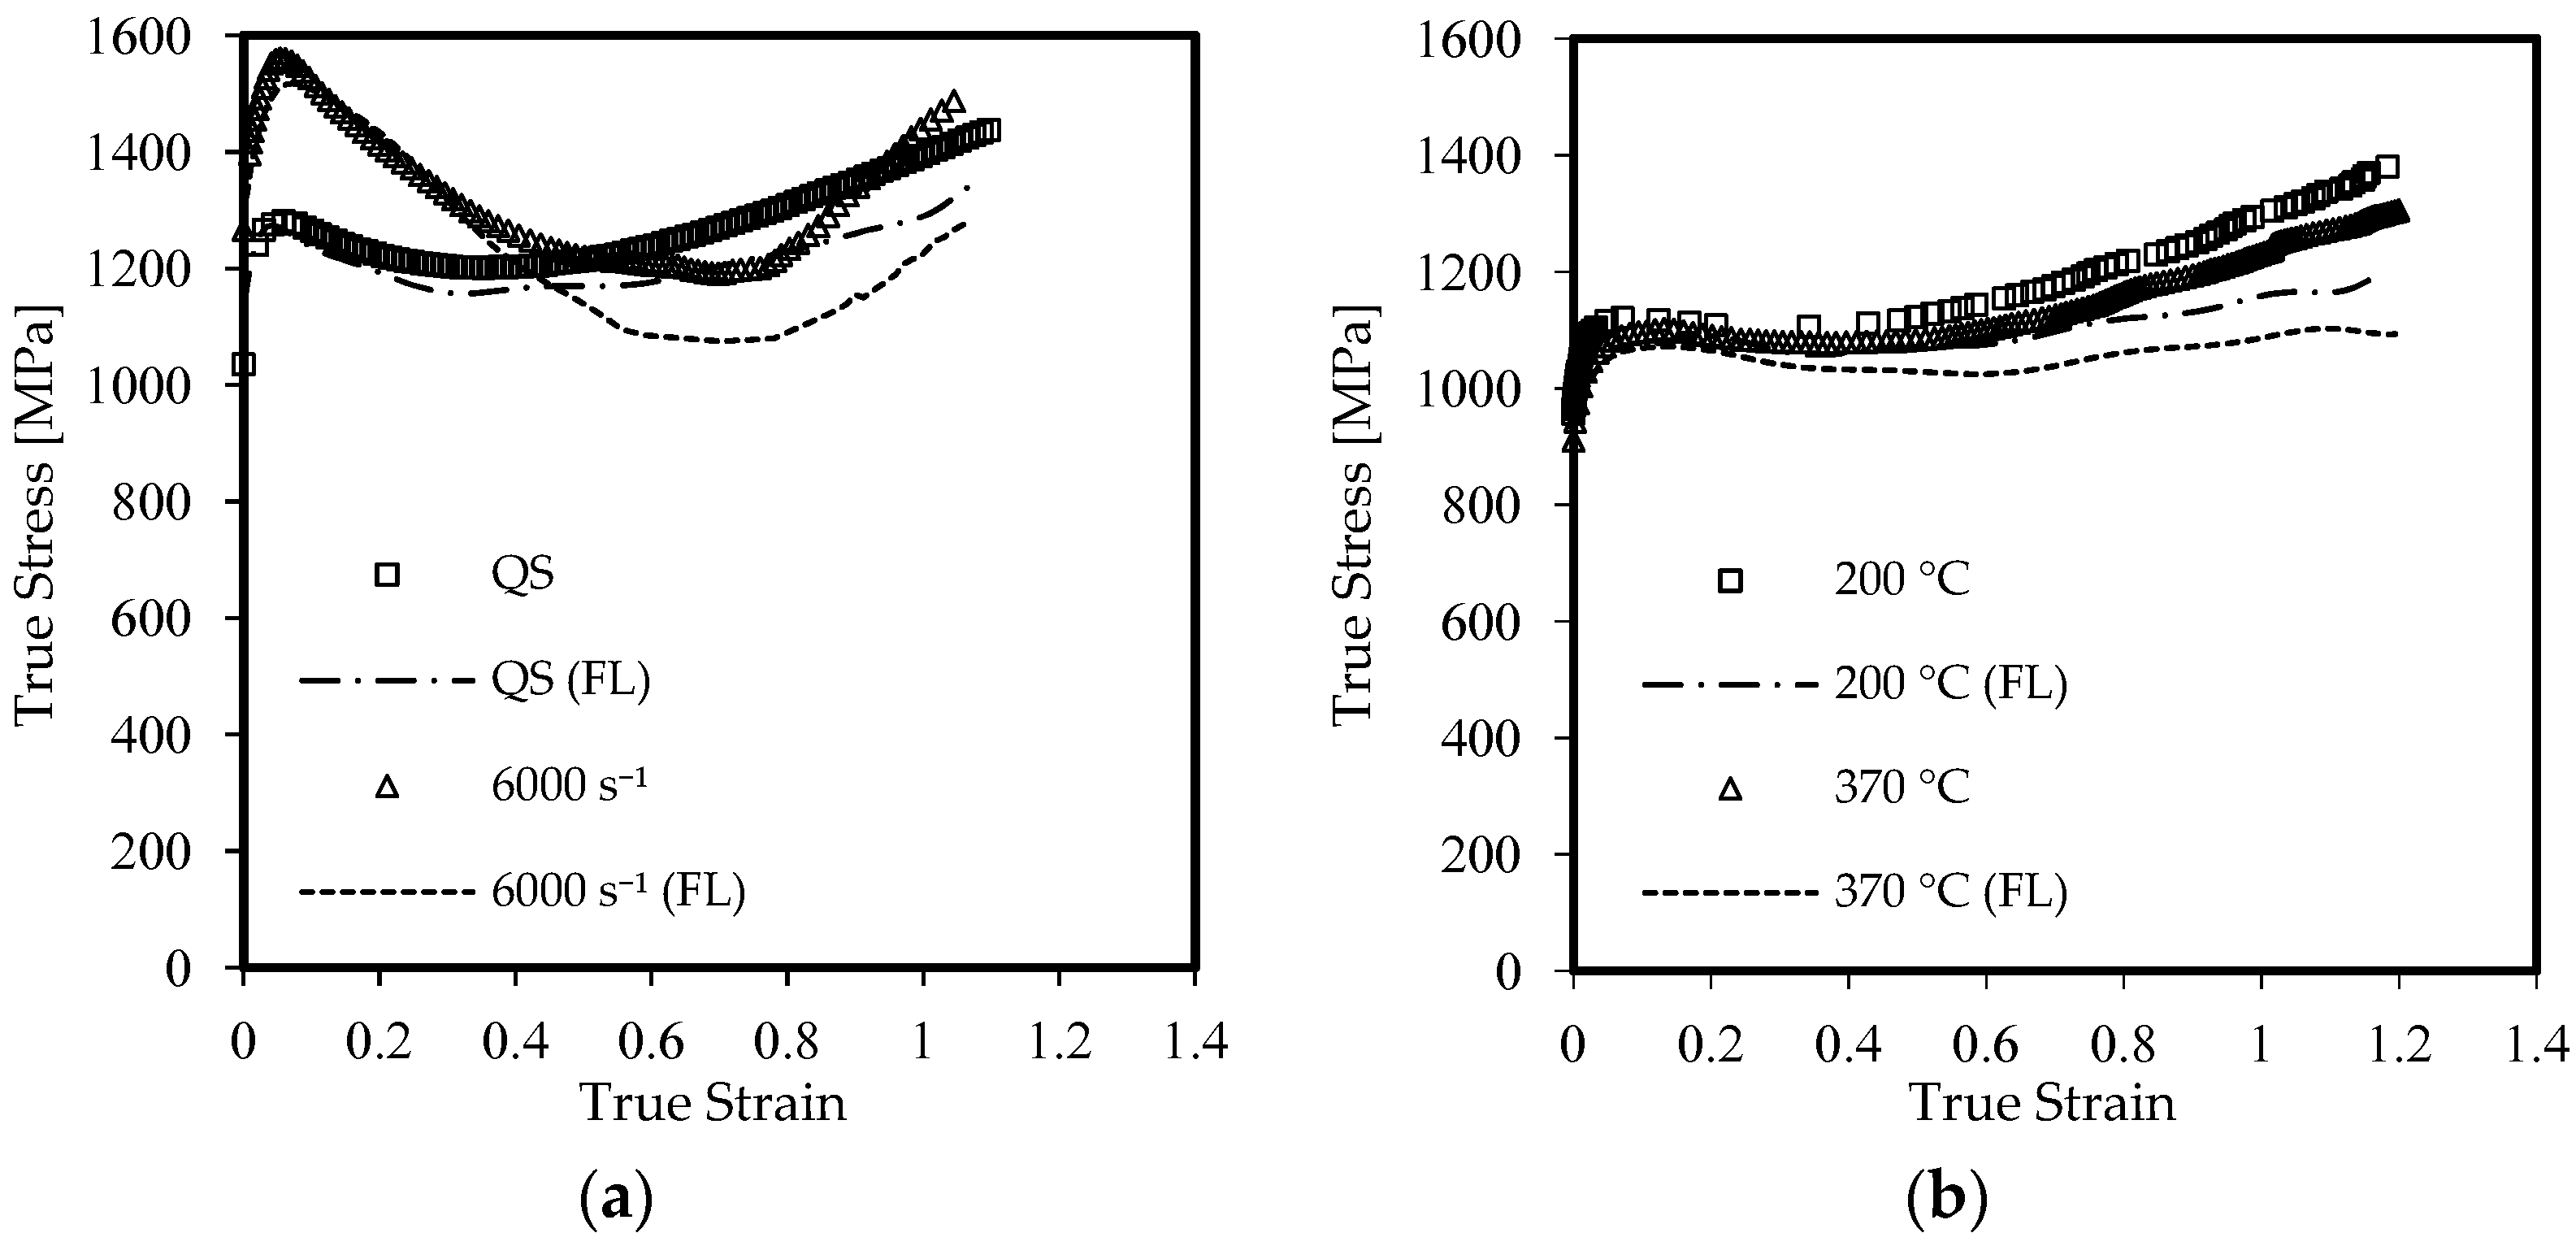

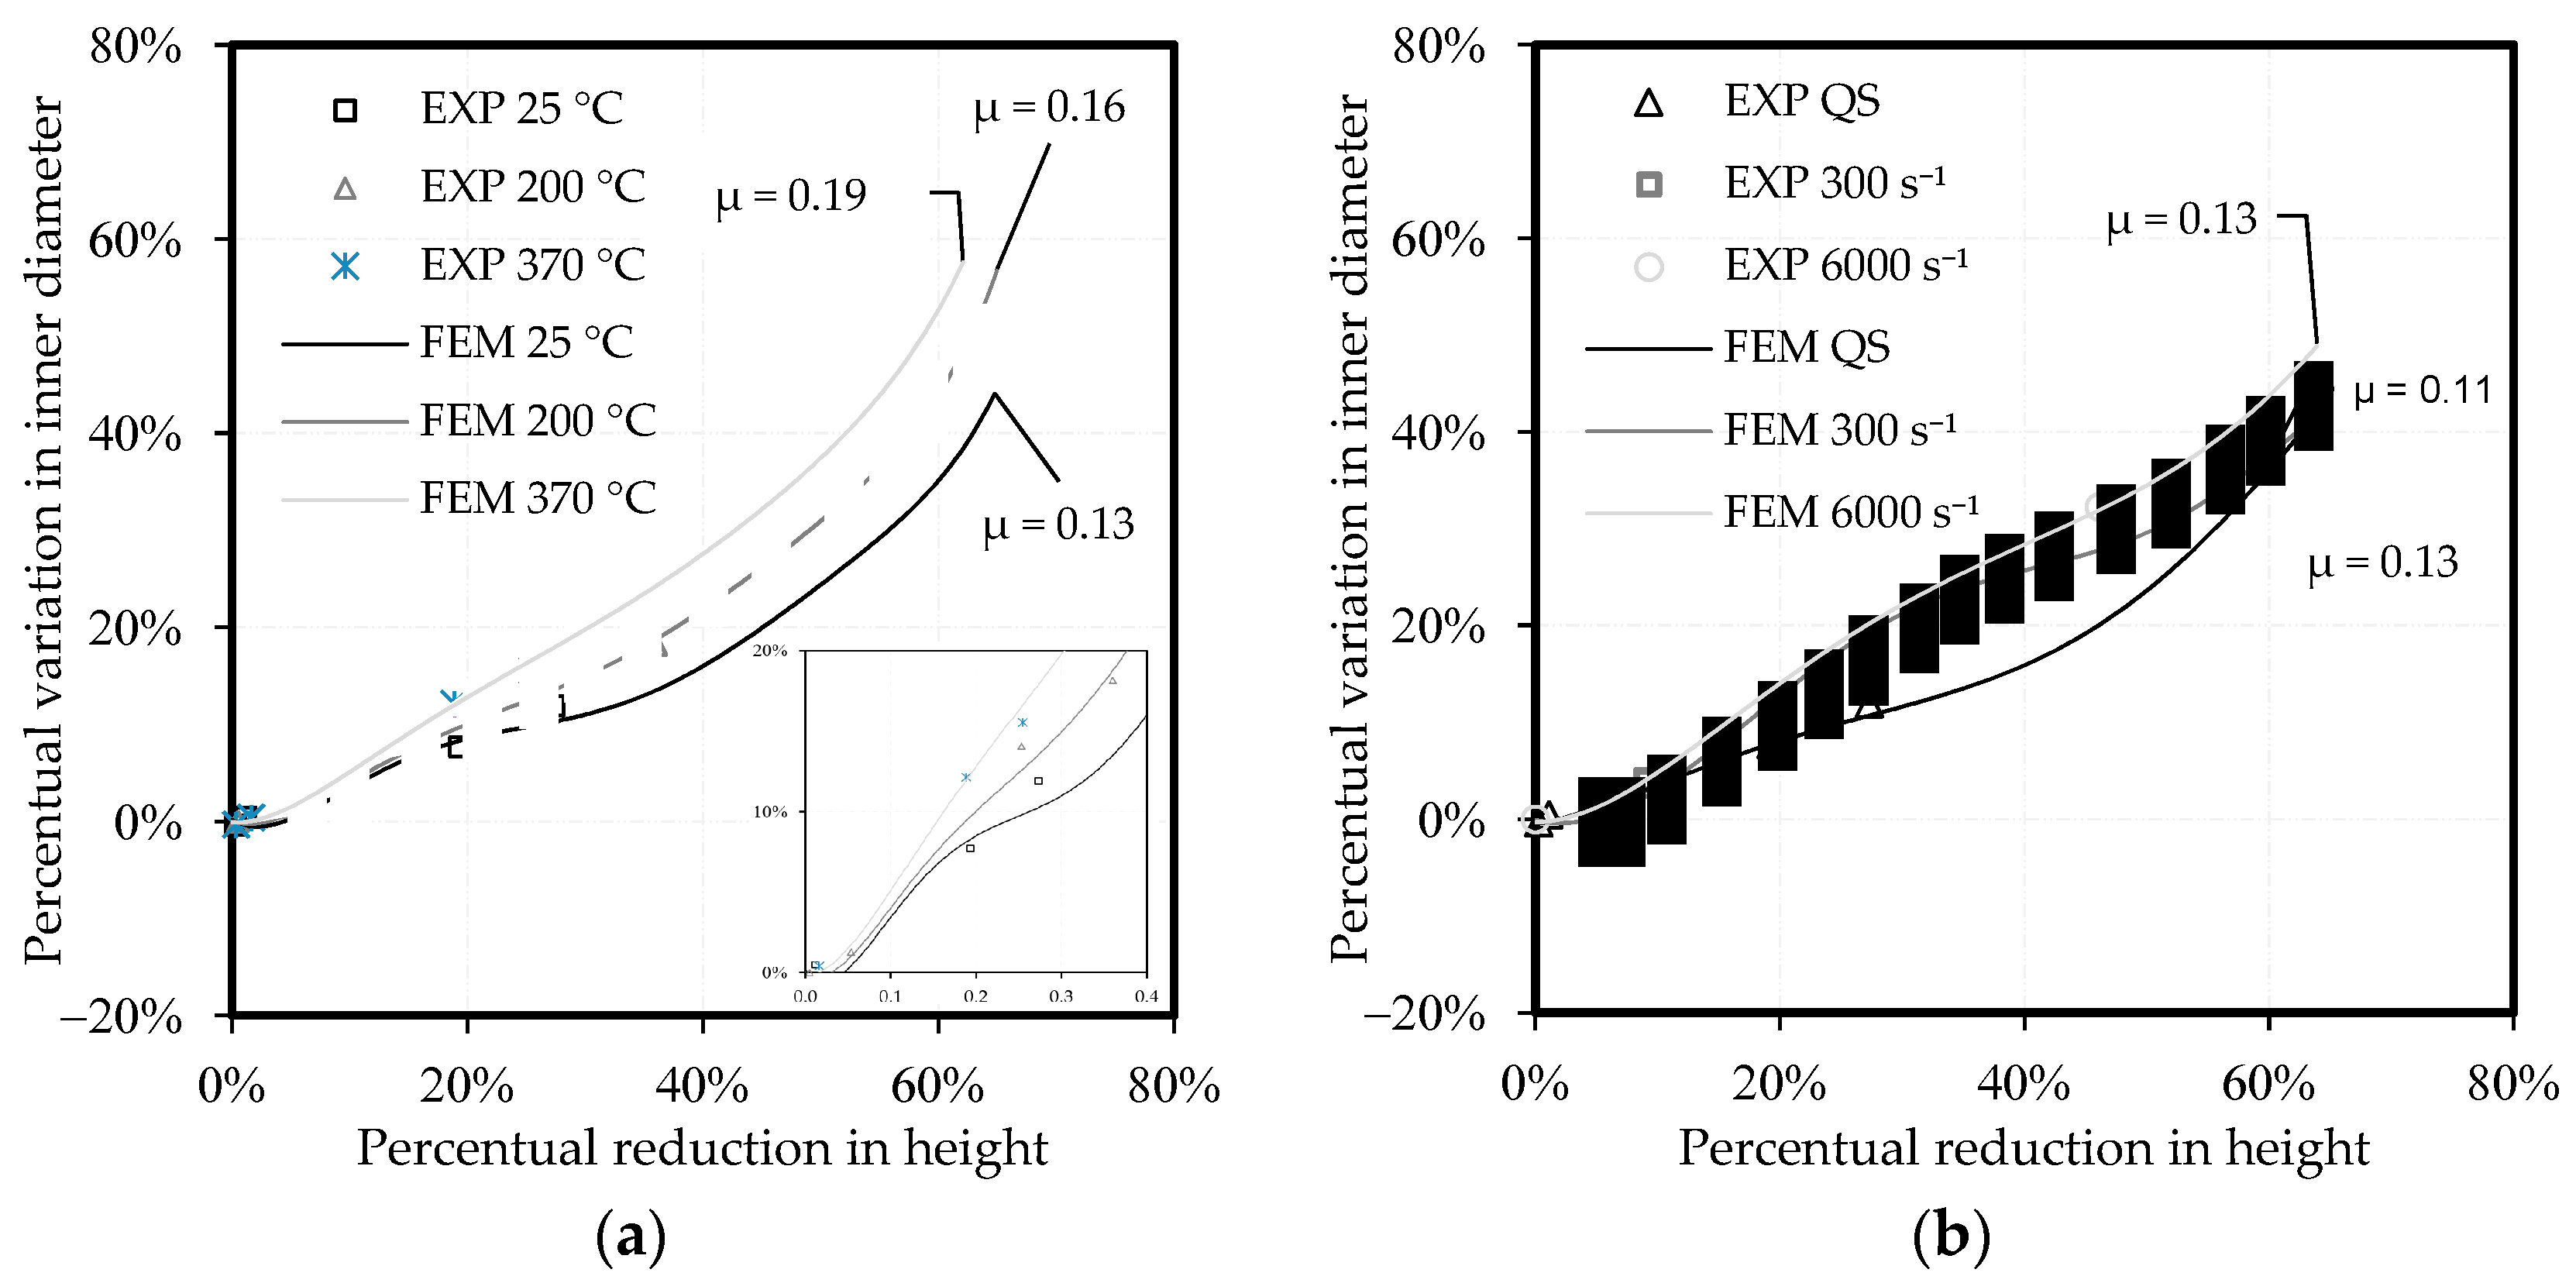
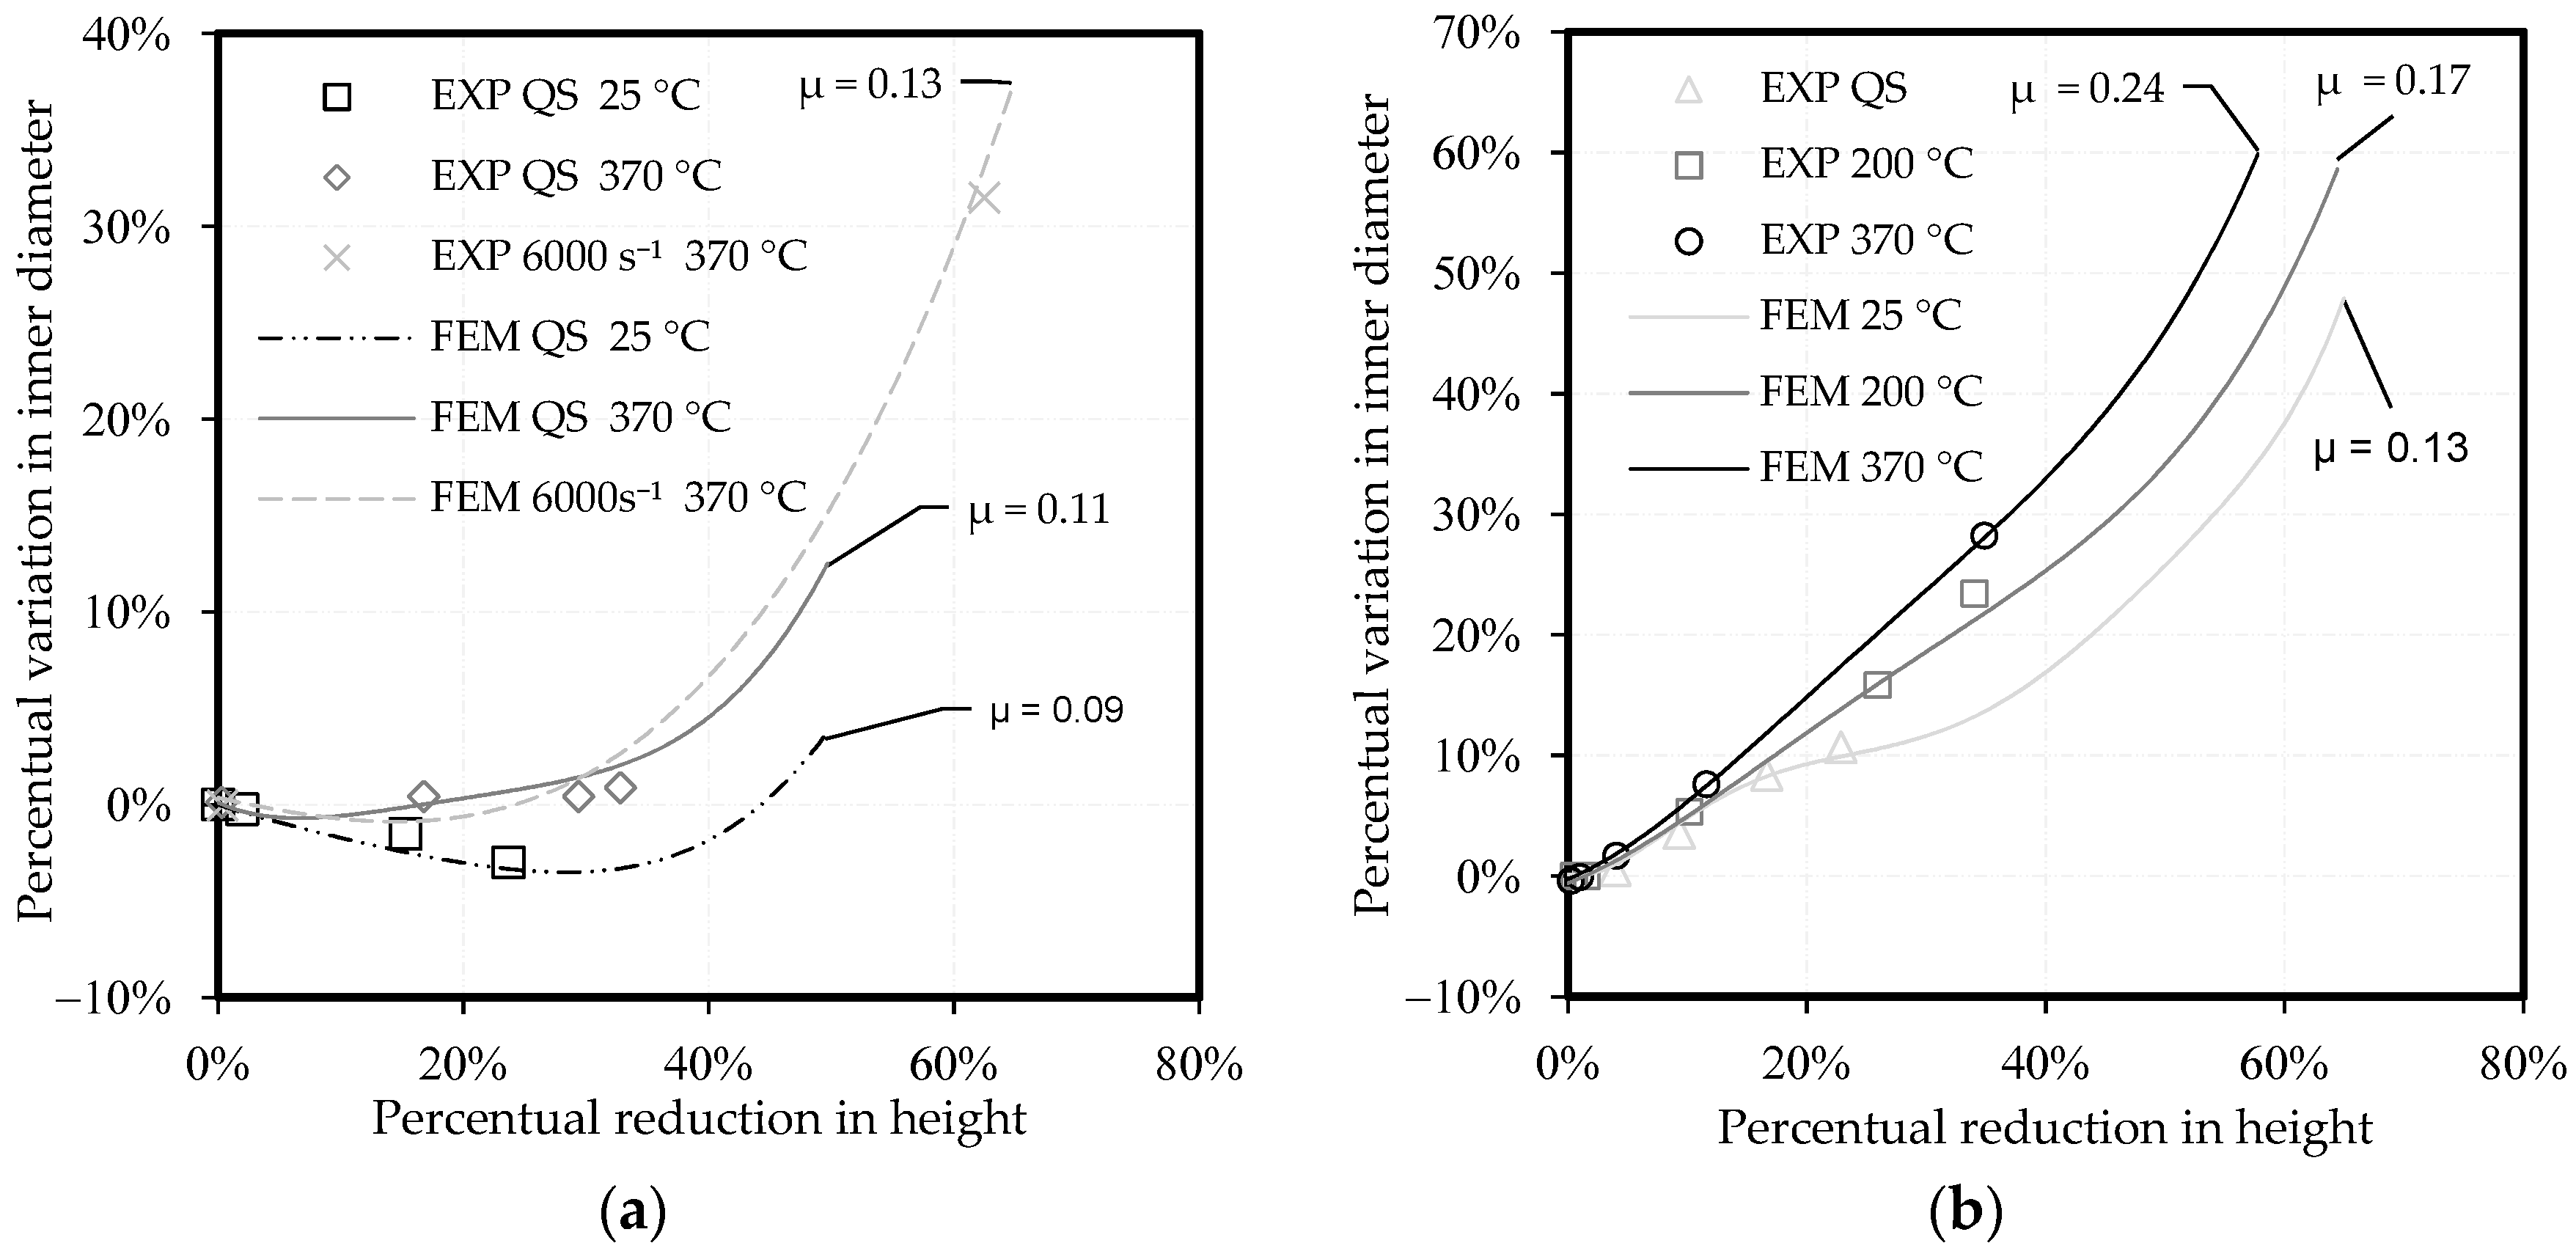
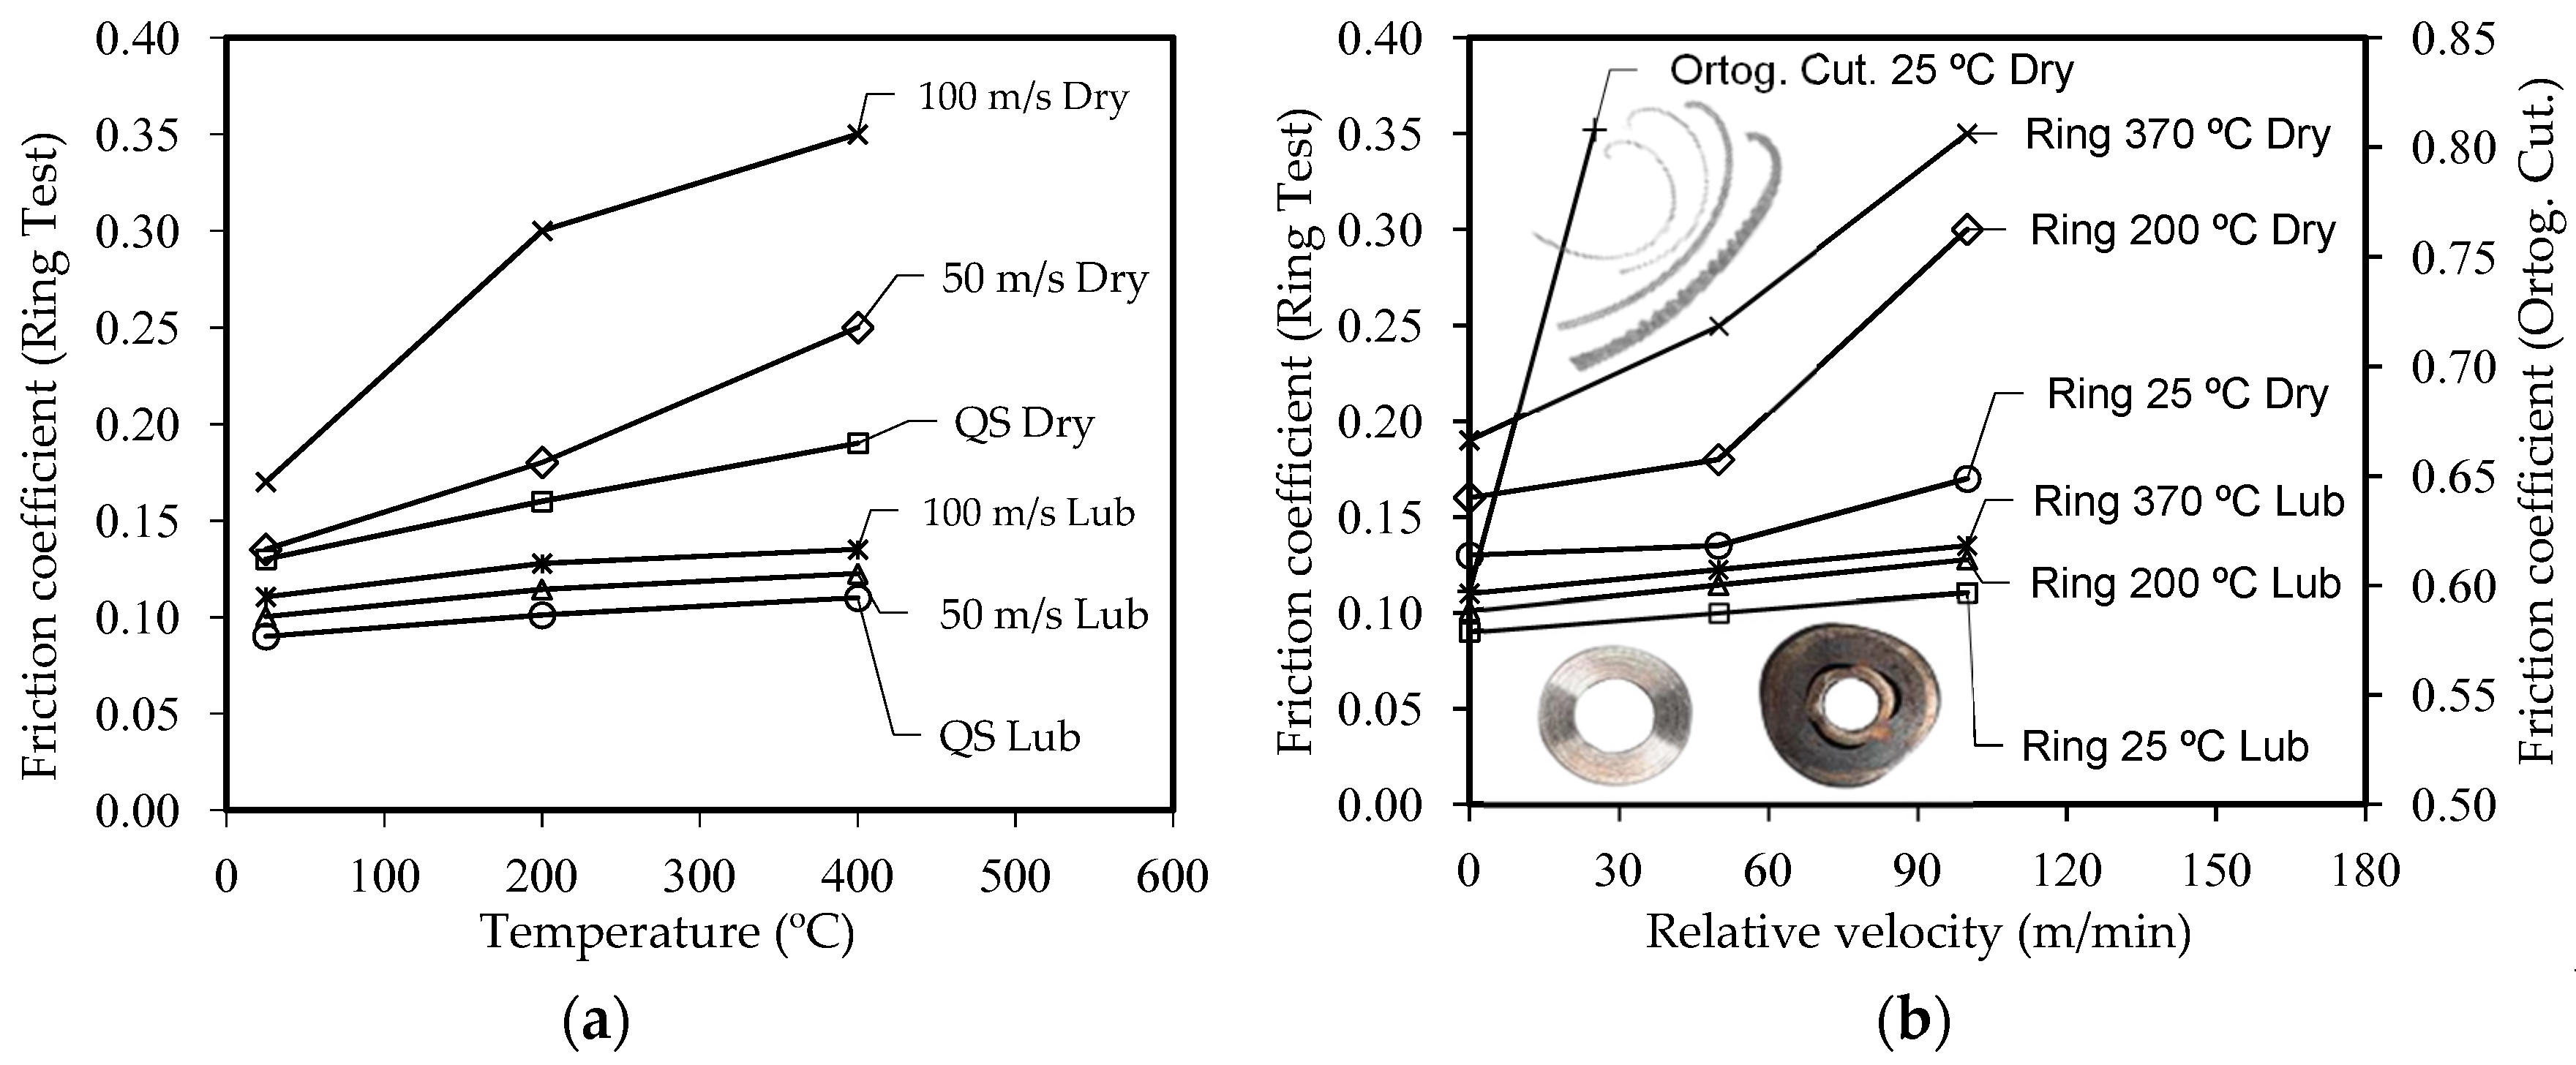
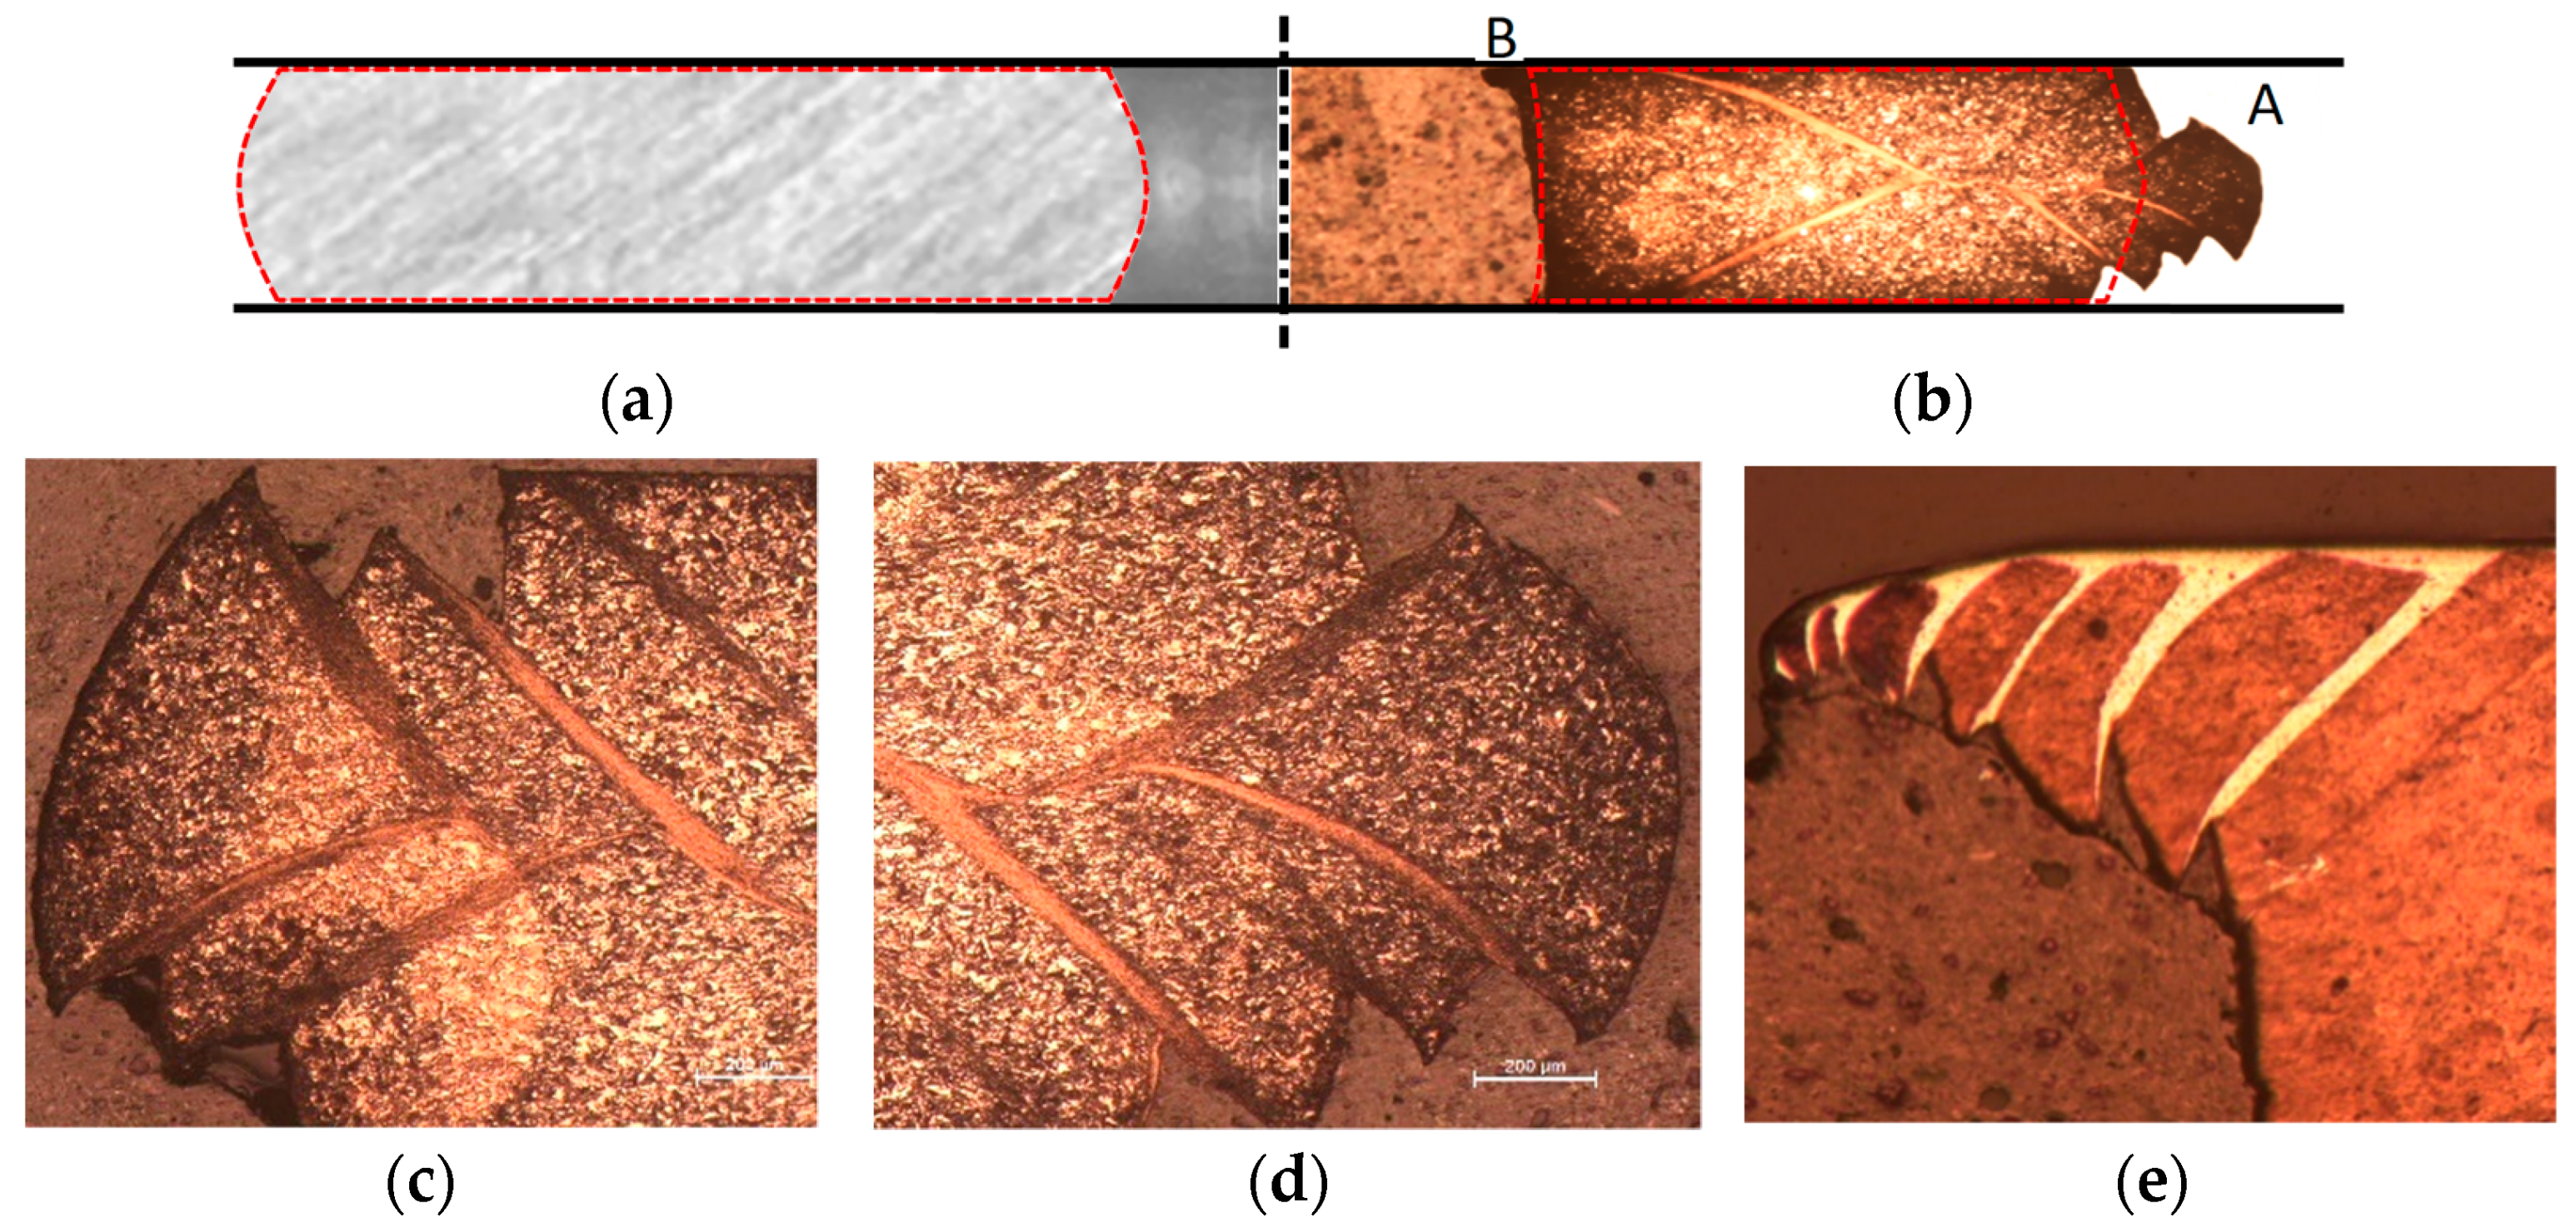
Publisher’s Note: MDPI stays neutral with regard to jurisdictional claims in published maps and institutional affiliations. |
© 2022 by the authors. Licensee MDPI, Basel, Switzerland. This article is an open access article distributed under the terms and conditions of the Creative Commons Attribution (CC BY) license (https://creativecommons.org/licenses/by/4.0/).