Article

Deformation Heating and Temperature Changes in a Near-β Titanium Alloy during β-Processed Forging

National Institute for Materials Science, 1-2-1 Sengen, Tsukuba 305-0047, Ibaraki, Japan
*
Author to whom correspondence should be addressed.
J. Manuf. Mater. Process. 2022, 6(2), 47; https://doi.org/10.3390/jmmp6020047
Submission received: 23 March 2022 / Revised: 13 April 2022 / Accepted: 14 April 2022 / Published: 15 April 2022

Abstract

:
We investigated the temperature increase caused by heat generation from plastic deformation during β-processed forging in a near-β titanium alloy, Ti-17 alloy (Ti-5Al-2Sn-2Zr-4Cr-4Mo, wt%), by inserting thermocouples into large workpieces (100 mm in diameter and 50 mm in height). The workpiece was initially heated and held at 1193 K (920 °C) in the single-β region. It was subsequently forged between hot dies in surrounding heaters at a compression percentage of 75% at strain rates of 0.05 and 0.5 s−1 at 1023–1123 K in the (α + β) region. At 0.05 s−1, the temperature logarithmically increased by 39 K in 28 s for 1023 K; it increased by 30 K in 28 s for 1073 K. However, at 0.5 s−1, the material temperature increased, in 3 s, beyond or close to the β-transus temperature during forging at 1023 and 1073 K. In addition, as the forging temperature decreased, the increase in material temperature moderated, resulting in a difference of 27 K in the last forging stage, between the conditions of 1023 and 1073 K. This would reduce the temperature difference effect on microstructure formation during β-processed forging.

1. Introduction

Near-β titanium alloys are used for compressor disks in jet engines because of their high strength to density ratio and high fracture toughness. These compressor disks are produced through β-processed die forging, and their microstructure formation is strongly affected by the forging process, which influences their mechanical properties. During the forging process, the temperature of the material gradually decreases, starting from the single β-phase region to the (α + β) dual-phase region through the β-transus temperature, Tβ, (so-called “through-transus” forging) [1,2]. This deformation increases plastic strain and generates dislocations, which may result in softening because of recovery and recrystallization during deformation. It is well known that dislocation behavior and the nucleation of, and growth of, the α phase are dependent on temperature. The hot deformation behavior, such as the microstructure formation, of Ti alloys has been extensively studied for isothermal forgings in the single β-phase or the (α + β) dual-phase regions [1,2,3,4,5]. However, there have been some reports on the microstructure formation of Ti alloys during through-transus forging. Wavy-shaped β grain boundaries (GBs) form during deformation in a single β region. After the temperature decreases below Tβ, the α phase precipitates from GBs with a round particle morphology. The Widmanstätten α phase and interior particle α phase precipitate within β grains, and they grow during deformation in the (α + β) dual-phase region and subsequent cooling [2,6,7,8,9,10]. In addition, Kitashima et al. and Meng et al. demonstrated, in Ti-6246 alloy [6,7,8], that, as the forging temperature in the (α + β) region decreased, the {001} β texture intensity weakened because the precipitated α phase promoted slip transmission between the α and β phases. Temperature is, thus, one of the crucial parameters in the forging process. However, it should be noted that material temperature increases during forging because plastic deformation generates heat. The temperature increase is noteworthy for higher strain rates and lower temperatures. Zhang et al. estimated the temperature increase caused by plastic deformation in the Ti-15-3 metastable β alloy [11], using the well-known equation [12,13]:
Δ T = η / ρ c 0 ε σ d ε
where ρ is the material density,   c is the specific heat, σ is the flow stress, ε is the strain, and η is the efficiency of deformation heating. The authors demonstrated that deformation heating caused flow softening in flow curves and localized band formation along the shear direction at low temperatures and high strain rates, such as 10 s−1. Li et al. adopted Equation (1) to estimate the temperature increase in the Ti-17 alloy during isothermal forging in the (α + β) region using two kinds of starting microstructures, that is, equiaxed and elongated primary α grains and Widmanstätten α platelets [14]. They showed that dynamic recovery (DRV) and dynamic recrystallization (DRX) caused flow softening at low strain rates in their temperature range. Few studies have measured and discussed temperature increase in through-transus forging. This is because the decrease in temperature from the single β-phase region to the (α + β) dual-phase region was controlled by high-frequency induction heating in thermomechanical physical simulation systems, such as Gleeble or THERMECMASTOR-Z in the aforementioned work [6,7,8,9,10,11,14]. In this case, during the temperature increase, due to deformation heating, the specimen’s temperature is reduced by powering down the high-frequency induction heating (and by gas cooling if set up so). This is carried out to maintain the target temperature but makes it difficult to estimate the temperature increase caused by deformation heating in the changing specimen heating conditions, especially as this temperature control effect is more notable in low-strain-rate deformation. In addition, in those studies, which used thermomechanical physical simulation systems, thermocouples were attached to the specimen’s surface to control temperature.
To adequately estimate the temperature increase due to deformation heating, temperature-measurement procedures and the correction of obtained data have been discussed in cold [15,16] and hot deformations [11,12,13,14,17,18]. The following factors are considered for hot forging in this study: (i) A large specimen with a large heat capacity, which is similar in size to materials used in real-world applications, is preferred for estimating deformation heating [17] because small specimens are sensitive to environmental temperature, where laboratory size specimens (8 mm in diameter and 12 mm in height) are often used. (ii) Hot die that is heated as close to the specimen temperature as possible before forging allows us to obtain a wide, small-temperature-gradient area in the large workpiece [17], which also results in a wide homogeneous microstructure distribution [19]. (iii) It is favorable to embed thermocouples into the forging specimen [12,13,17], otherwise they are exposed to heat transfer between the specimen and atmosphere.
Finite element analysis is a powerful tool for predicting deformation heating during forging [13,17] using true-stress–true-strain curves, which can be corrected for deformation heating using Equation (1) [12,13,17,18]. However, Kitashima et al. demonstrated the estimation of a conversion factor for plastic deformation energy to heat energy, such as the validity of η in (1), and the use of adequate physical properties, especially near Tβ, to improve the prediction accuracy of the temperature change during forging in the finite element analysis (FEA) [17].
Thus, the temperature increase from the plastic deformation affects the microstructure formation of Ti alloys during through-transus forging. However, there have been no reports on the temperature increase during the forging process. Especially, the temperature increase across Tβ during the forging is crucial. In this study, the temperature increase during the through-transus forging of the Ti-17 alloy was measured by inserting thermocouples into the center of large workpieces on hot dies, using a 1500-ton forging press. The effect of the temperature increase on microstructure formation was also discussed.

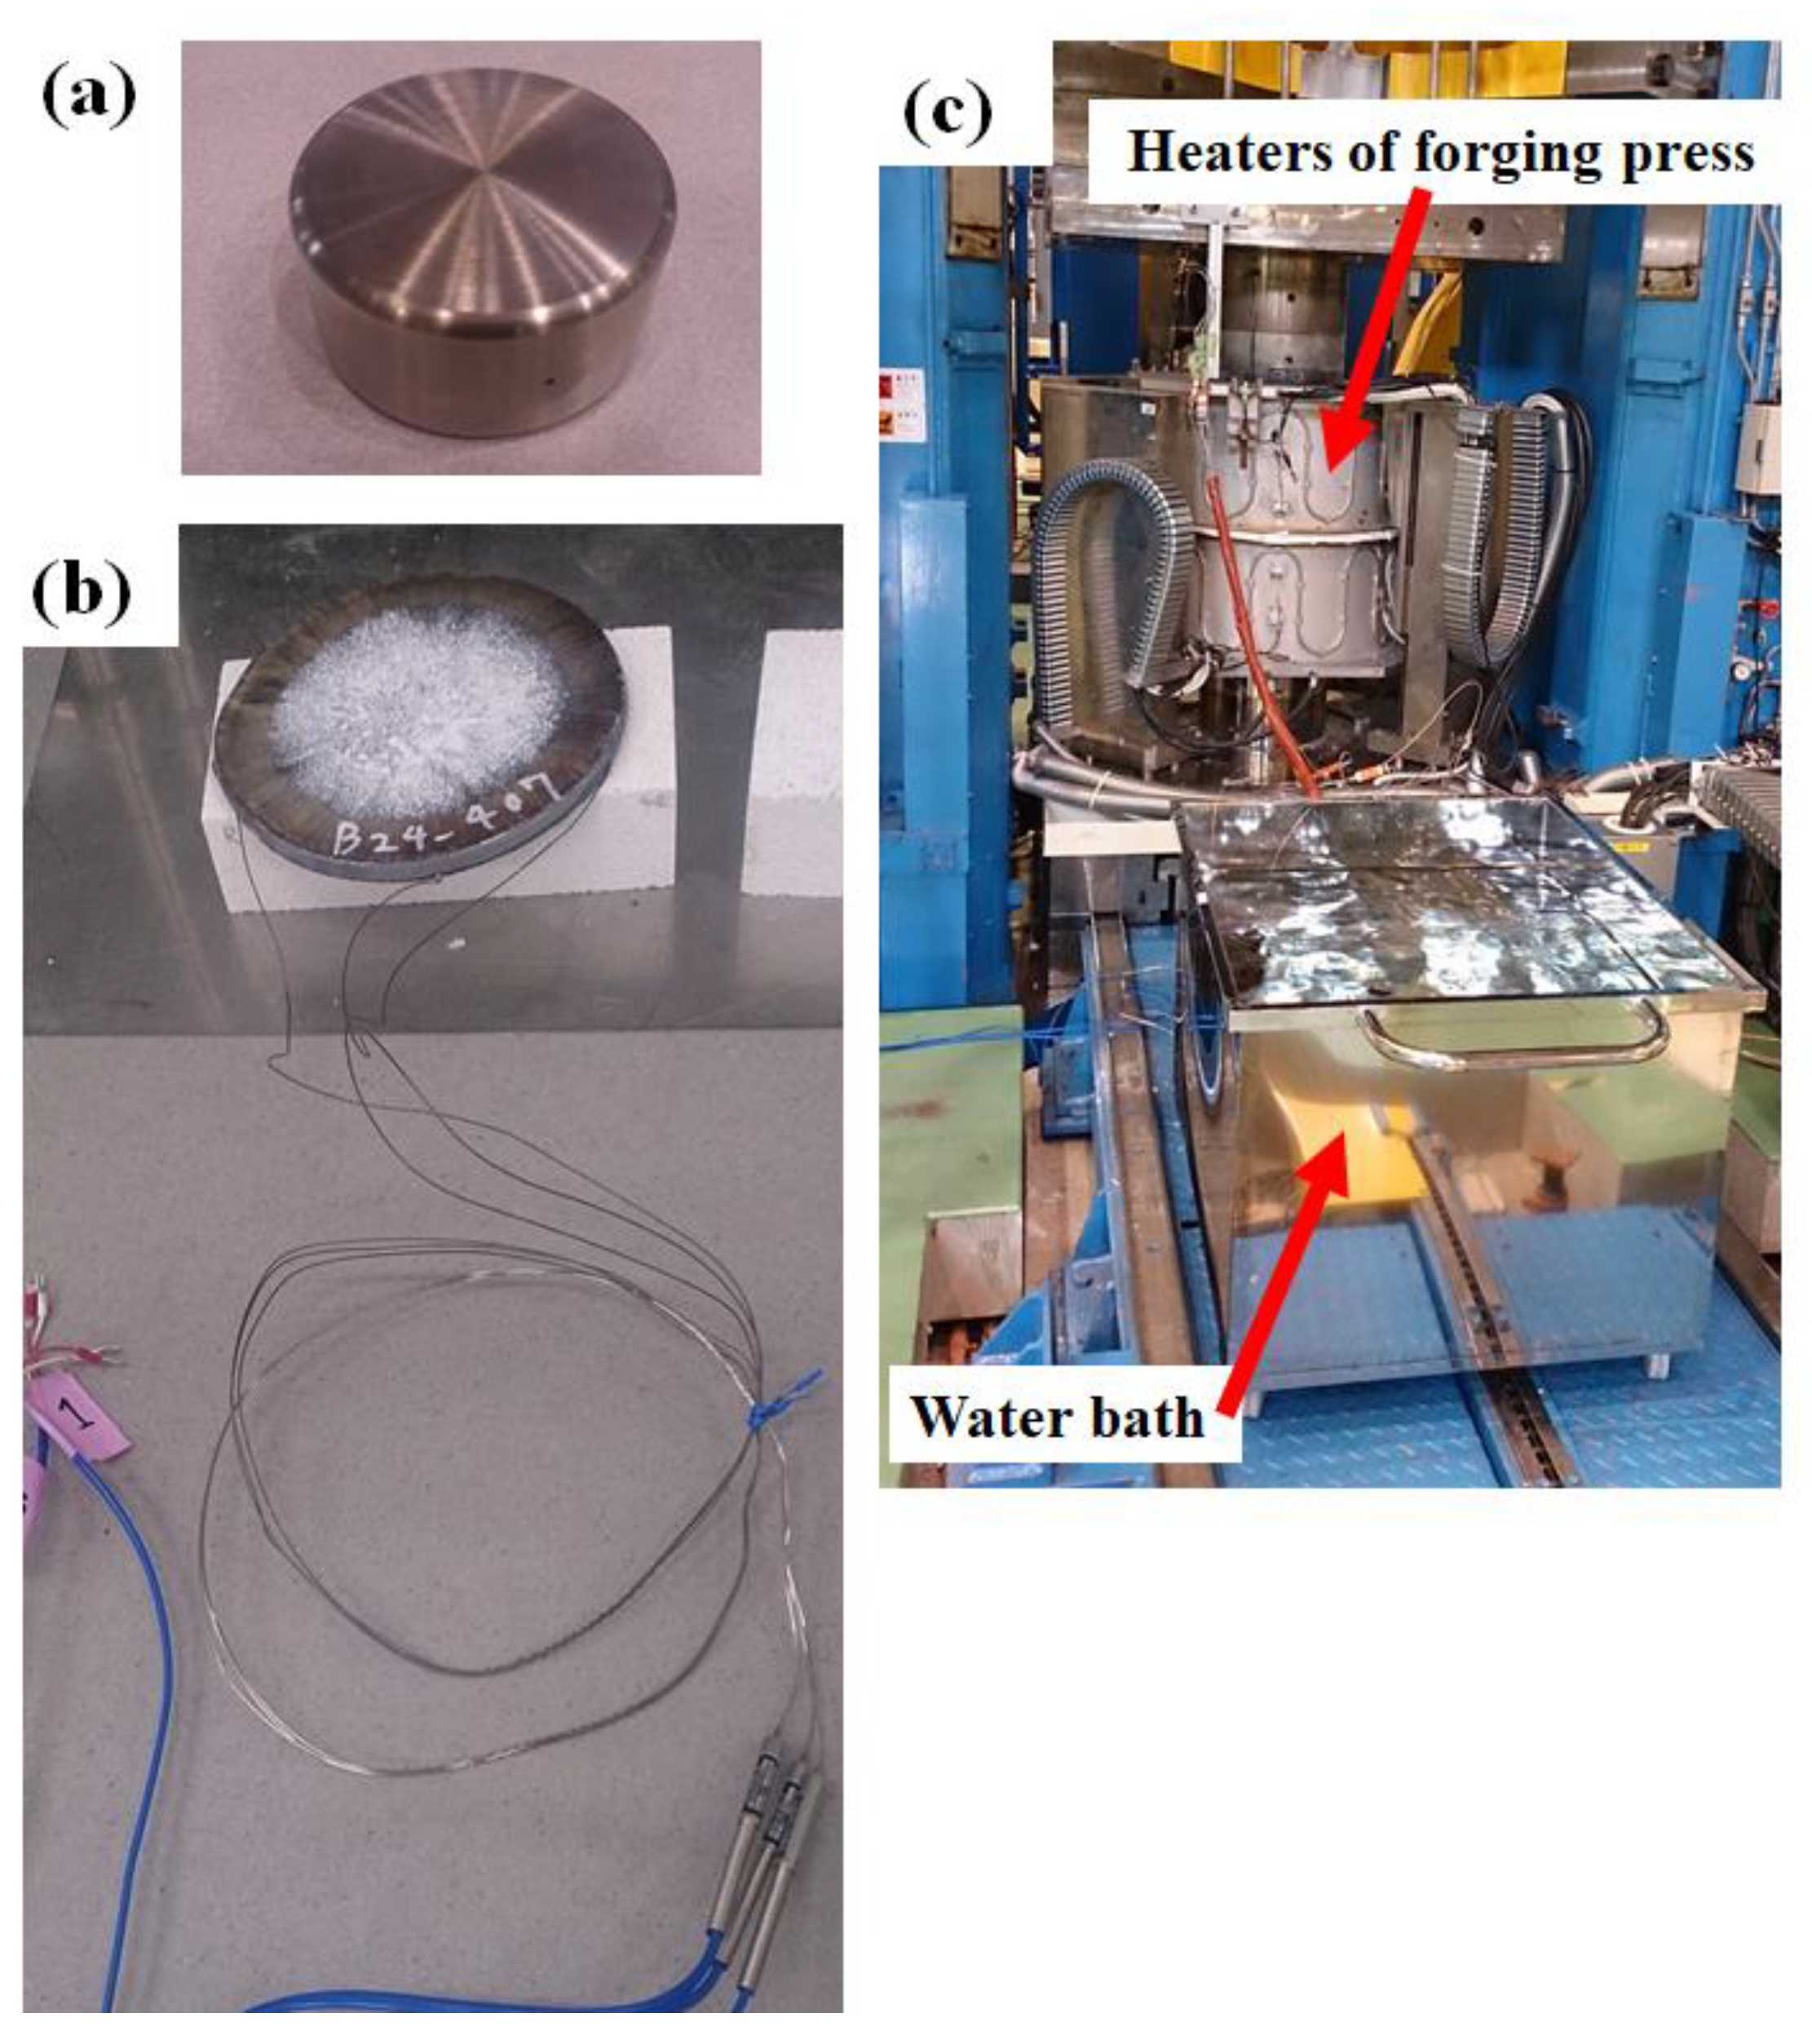
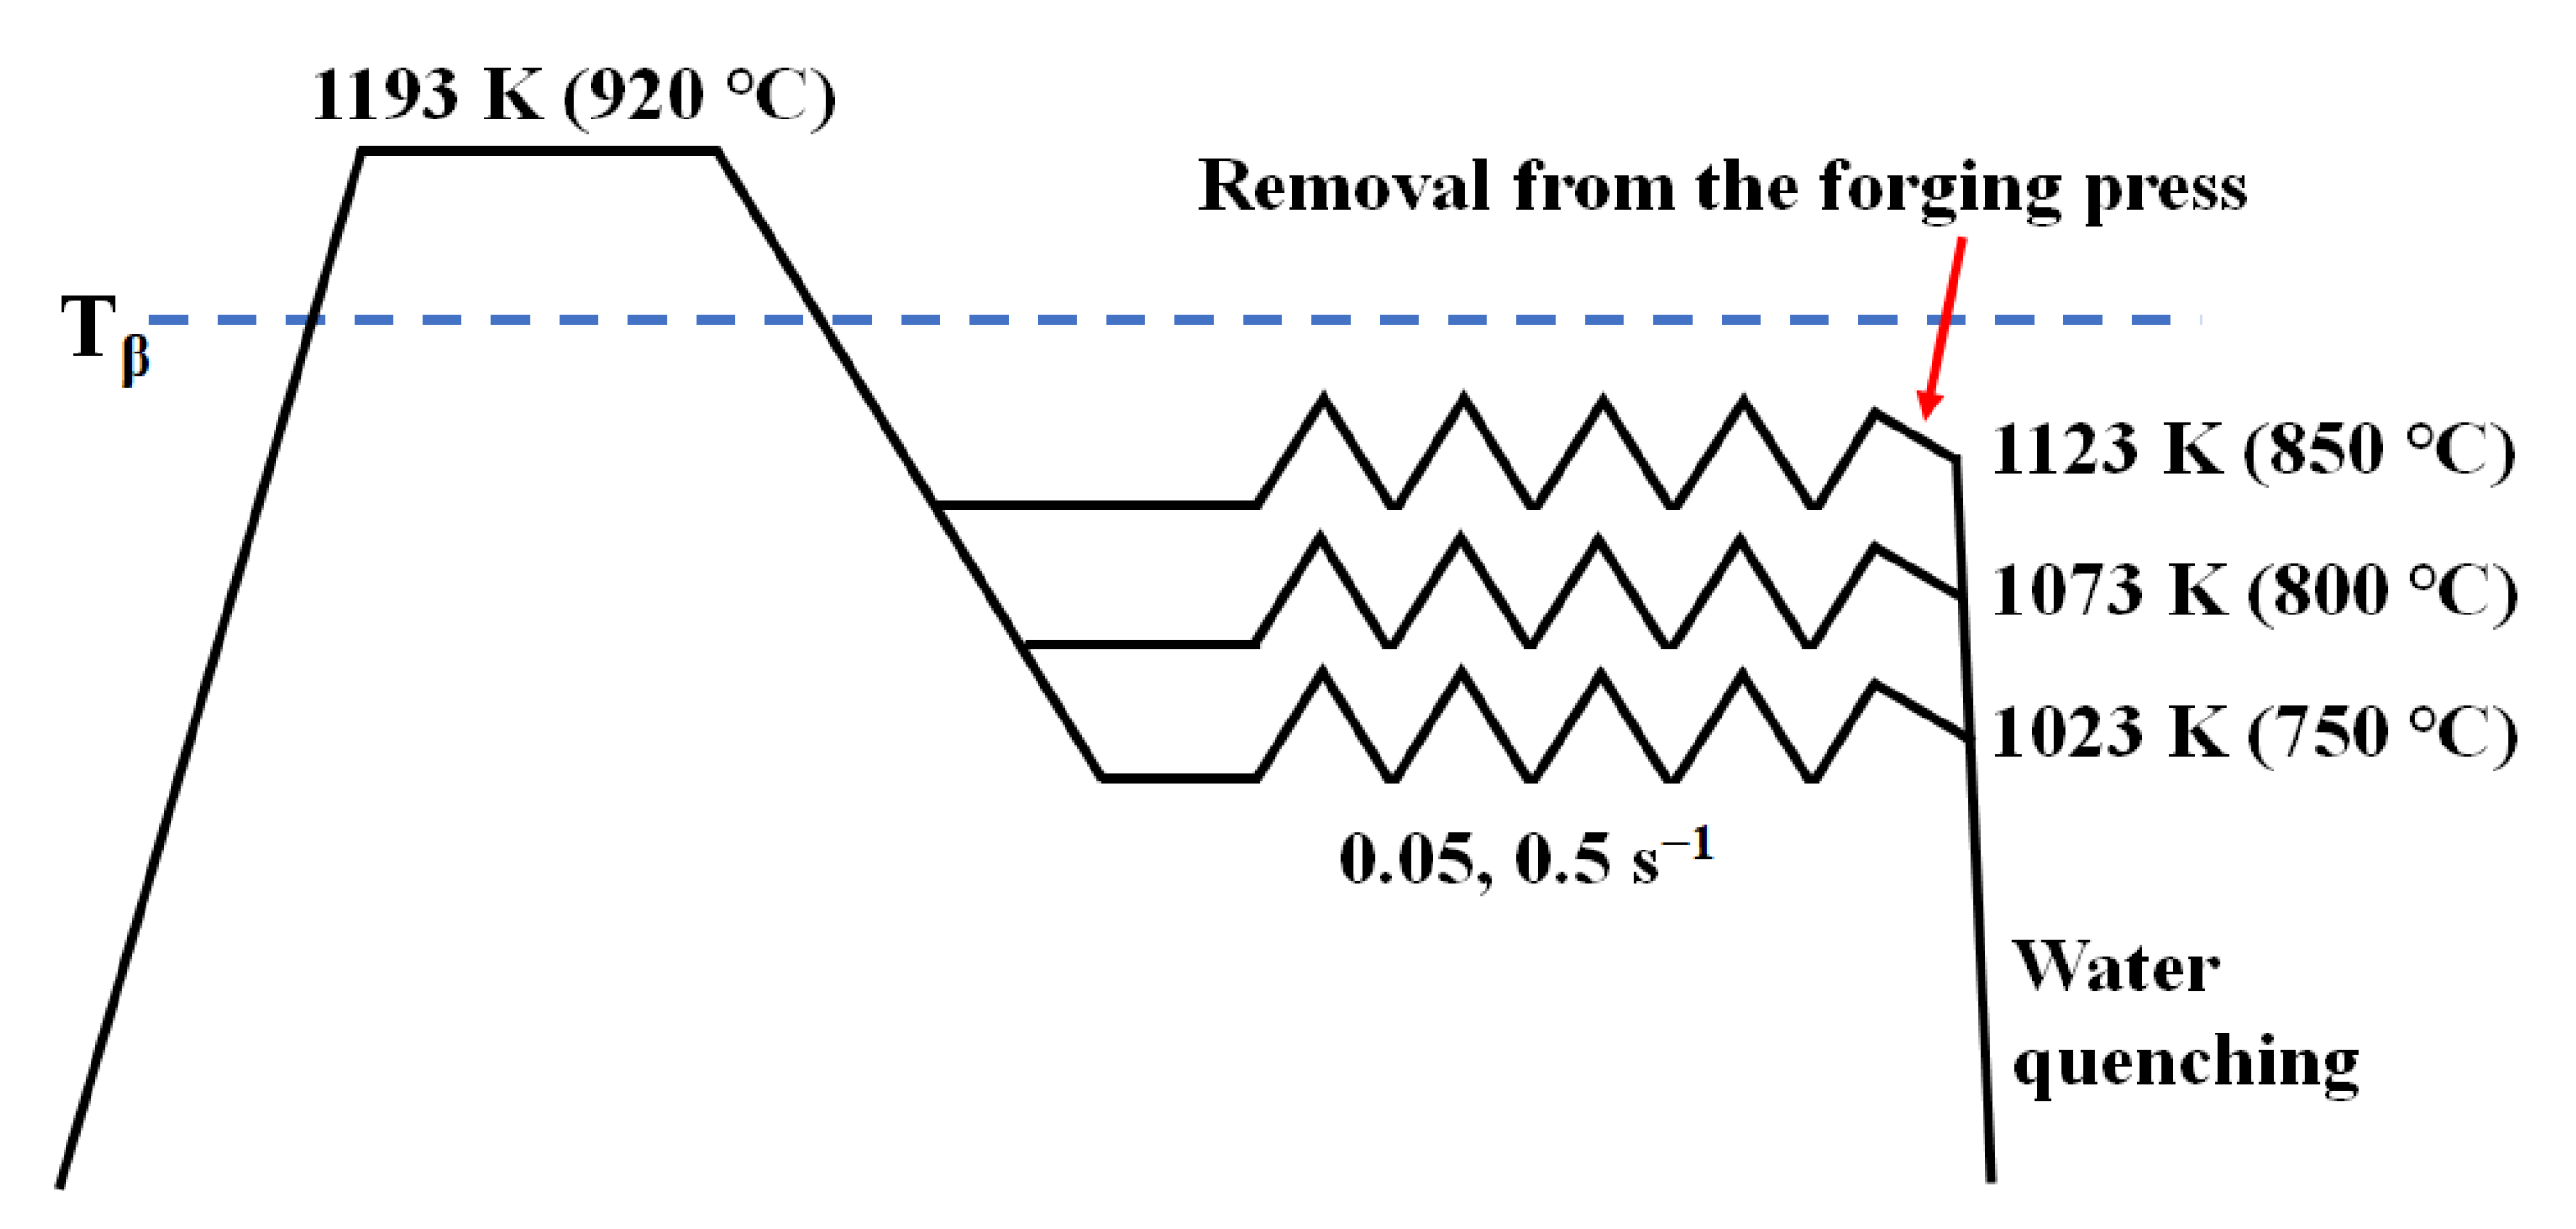
2. Materials and Methods

The chemical composition (in wt%) of an as-received Ti-17 alloy bar was 5.09 Al, 2.04 Sn, 2.01 Zr, 3.88 Mo, 3.83 Cr, 0.48 Fe, 0.105 O, with balance Ti [20]. The β-transus temperature is dependent on alloy composition and it is the temperature designating the phase boundary between the single-β region at higher temperatures and (α + β) region at lower temperatures. The β-transus temperature of the Ti-17 alloy was determined as 1148 ± 5 K (875 °C ± 5 °C) in the following way. The as-received bar was machined into cuboidal workpieces (10 × 10 × 10 mm) and they were isothermally heat treated for 1 h in a muffle furnace at selected temperatures in the range 1123–1173 K (850–900 °C) at intervals of 5 K, followed by water quenching. The tip of the R-type thermocouple in the muffle furnace was set up close to the workpiece. These workpieces were cut, mechanically polished, then polished with diamond paste (9 and 3 μm, respectively), and, finally, polished with colloidal silica solution. The microstructure of the center of the workpieces was analyzed via scanning electron microscopy (SEM, JSM-7001F) to confirm the existence of α phase in β matrix.
The as-received Ti-17 alloy bar was further machined into cylindrical workpieces (100 mm in diameter and 50 mm in height), as shown in Figure 1a. The arithmetic average roughness value of the workpiece surface was approximately 6.3 μm. Three holes with diameters of 1.5 mm were machined from the lateral surface of the workpiece to the center in the direction parallel to the top and bottom surfaces. The tips of these holes were located at the center and midpoint of, and a quarter of the way along, the radius. Subsequently, three sheathed K-type thermocouples were inserted into each hole. A lubricant of oxide glass (glass-transition temperature approximately 993 K (720 °C)), with an average thickness of 200 μm, was applied on the top, bottom, and lateral surfaces of the workpiece. The friction between the workpiece and dies was obtained in ring compression tests using the lubricant. It was estimated to be a friction coefficient of m = 0.1 at 1023 K (750 °C), 1073 K (800 °C), and 1123 K (850 °C), suppressing the barreling of the workpieces’ free surface [17]. Those workpieces were forged using a 1500-ton forging press at the National Institute for Materials Science, which is capable of isothermal forging by heating a workpiece and top and bottom dies with circumferential electrical-resistance heaters. A heat-resistant nickel alloy was used for the top and bottom dies. The workpiece was initially heated and held at 1193 K (920 °C) in the single-β region for 1 h for thermal equilibration in a preheated furnace. This was then held by a robot arm in air until its temperature decreased to near forging temperatures, that is, 1023, 1073, and 1123 K (750 °C, 800 °C, and 850 °C, respectively). The workpiece was subsequently set on the bottom die in the forging press, which was previously heated and held at the forging temperature in the (α + β) dual-phase region. The circumferential heaters of the forging press were then closed, and the workpiece was heated on the bottom die. The forging conditions are shown in Figure 2. The forging temperatures were 1023, 1073, and 1123 K (750 °C, 800 °C, and 850 °C, respectively) in the (α + β) dual-phase region, and the strain rate was 0.05 and 0.5 s−1 at each temperature. The compression percentage was 75% for all conditions. After the forging, the furnace heaters opened, and the forged workpiece was manually plunged into a water bath (Figure 1c). The forged workpiece is shown in Figure 1b. The forged workpieces were cut and polished in the same manner as the workpieces for the Tβ determination. The microstructure at the center region of the forging direction (FD)—radial direction (RD) plane was analyzed via SEM. To discuss the precipitation and growth of the α phase during holding in the (α + β) region before forging, a workpiece of 10 × 10 × 10 mm was cut from the as-received bar and was heat-treated at 1193 K (920 °C) for 1 h in a muffle furnace. After the heat treatment, the workpiece was immediately transferred to another muffle furnace that was previously held at each forging temperature, that is, 1023, 1073, and 1123 K (750 °C, 800 °C, and 850 °C, respectively). The workpiece was kept in the furnace for 500, 1000, 3600, and 7200 s followed by water quench. The microstructure of the center of the workpieces was observed using SEM after polishing. Thermo-Calc software version 2017a and the Ti-DATA version 3 database were used to estimate the temperature dependency of the equilibrium phase fraction in the Ti-17 alloy, as shown in Figure 3. The calculated β-transus temperature was 1145.5 K (872.5 °C), which is close to the obtained value, 1148 K (875 °C).

3. Results and Discussion

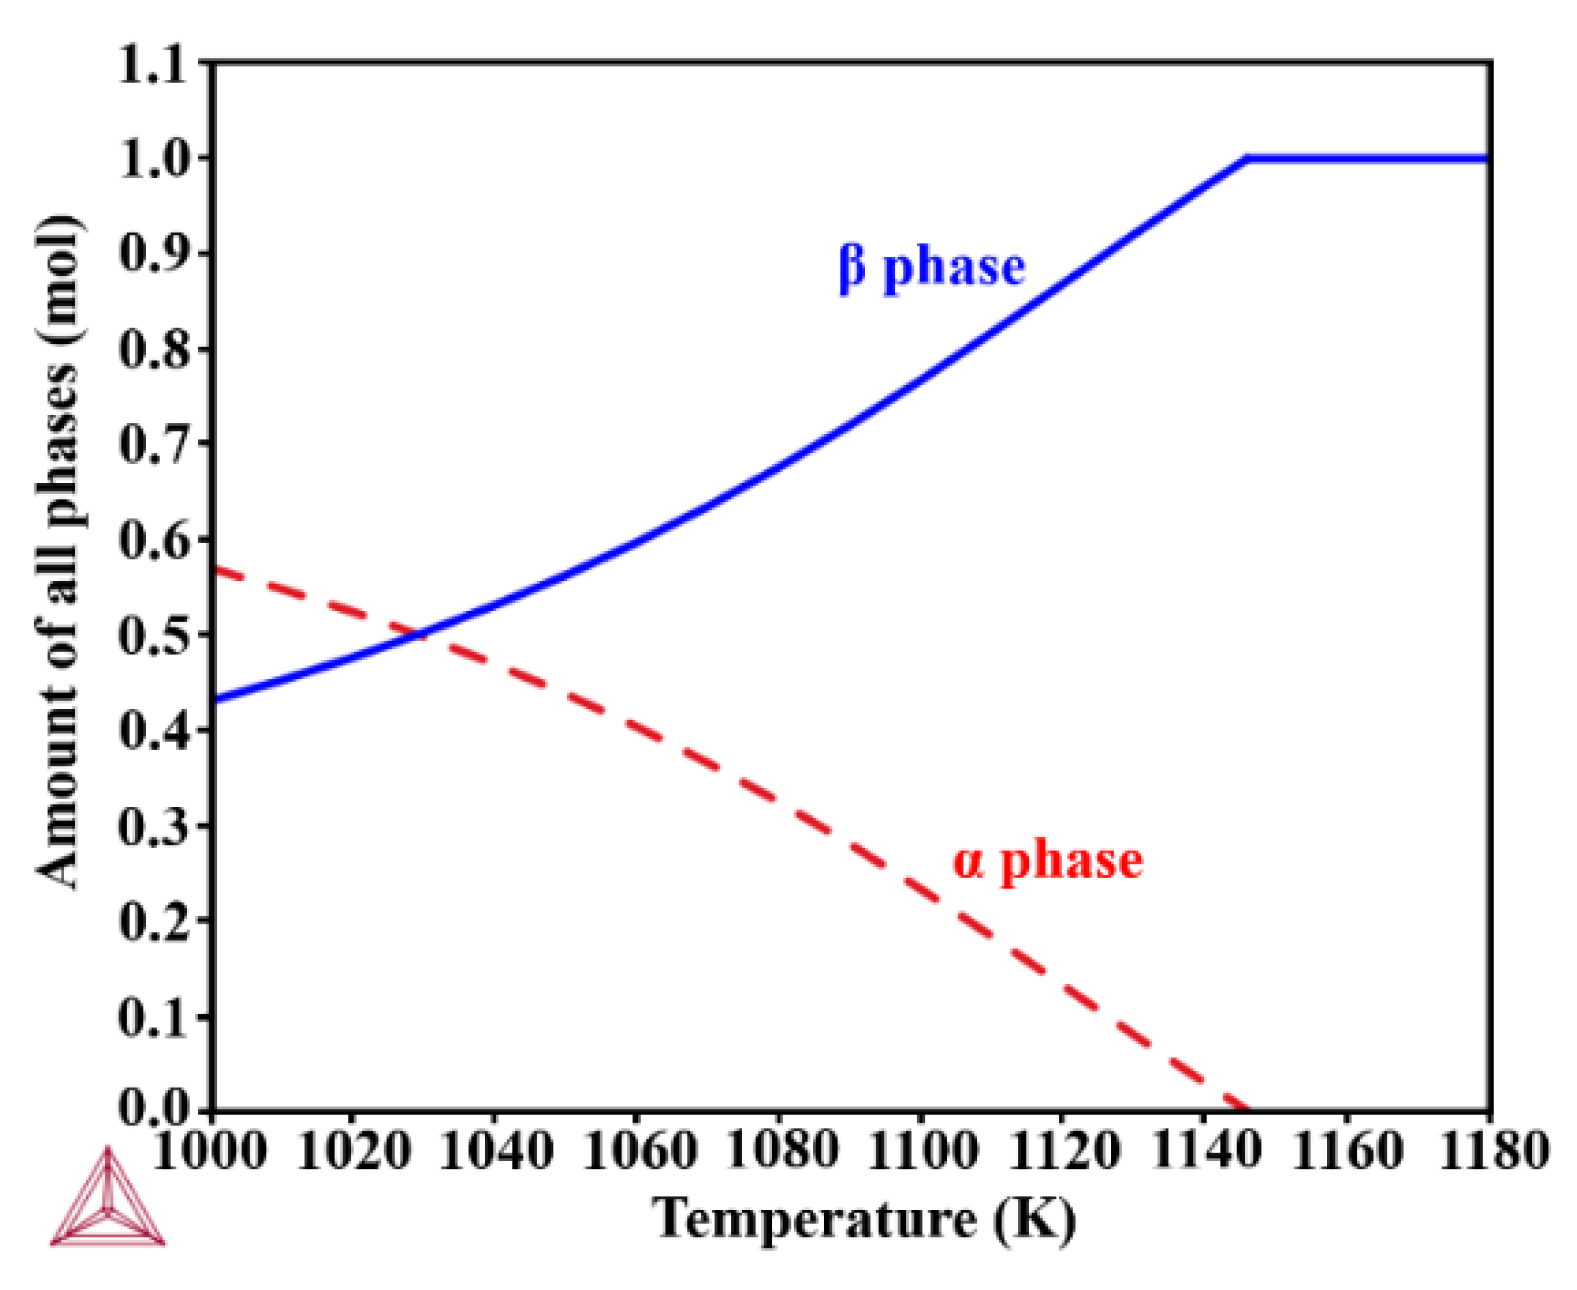
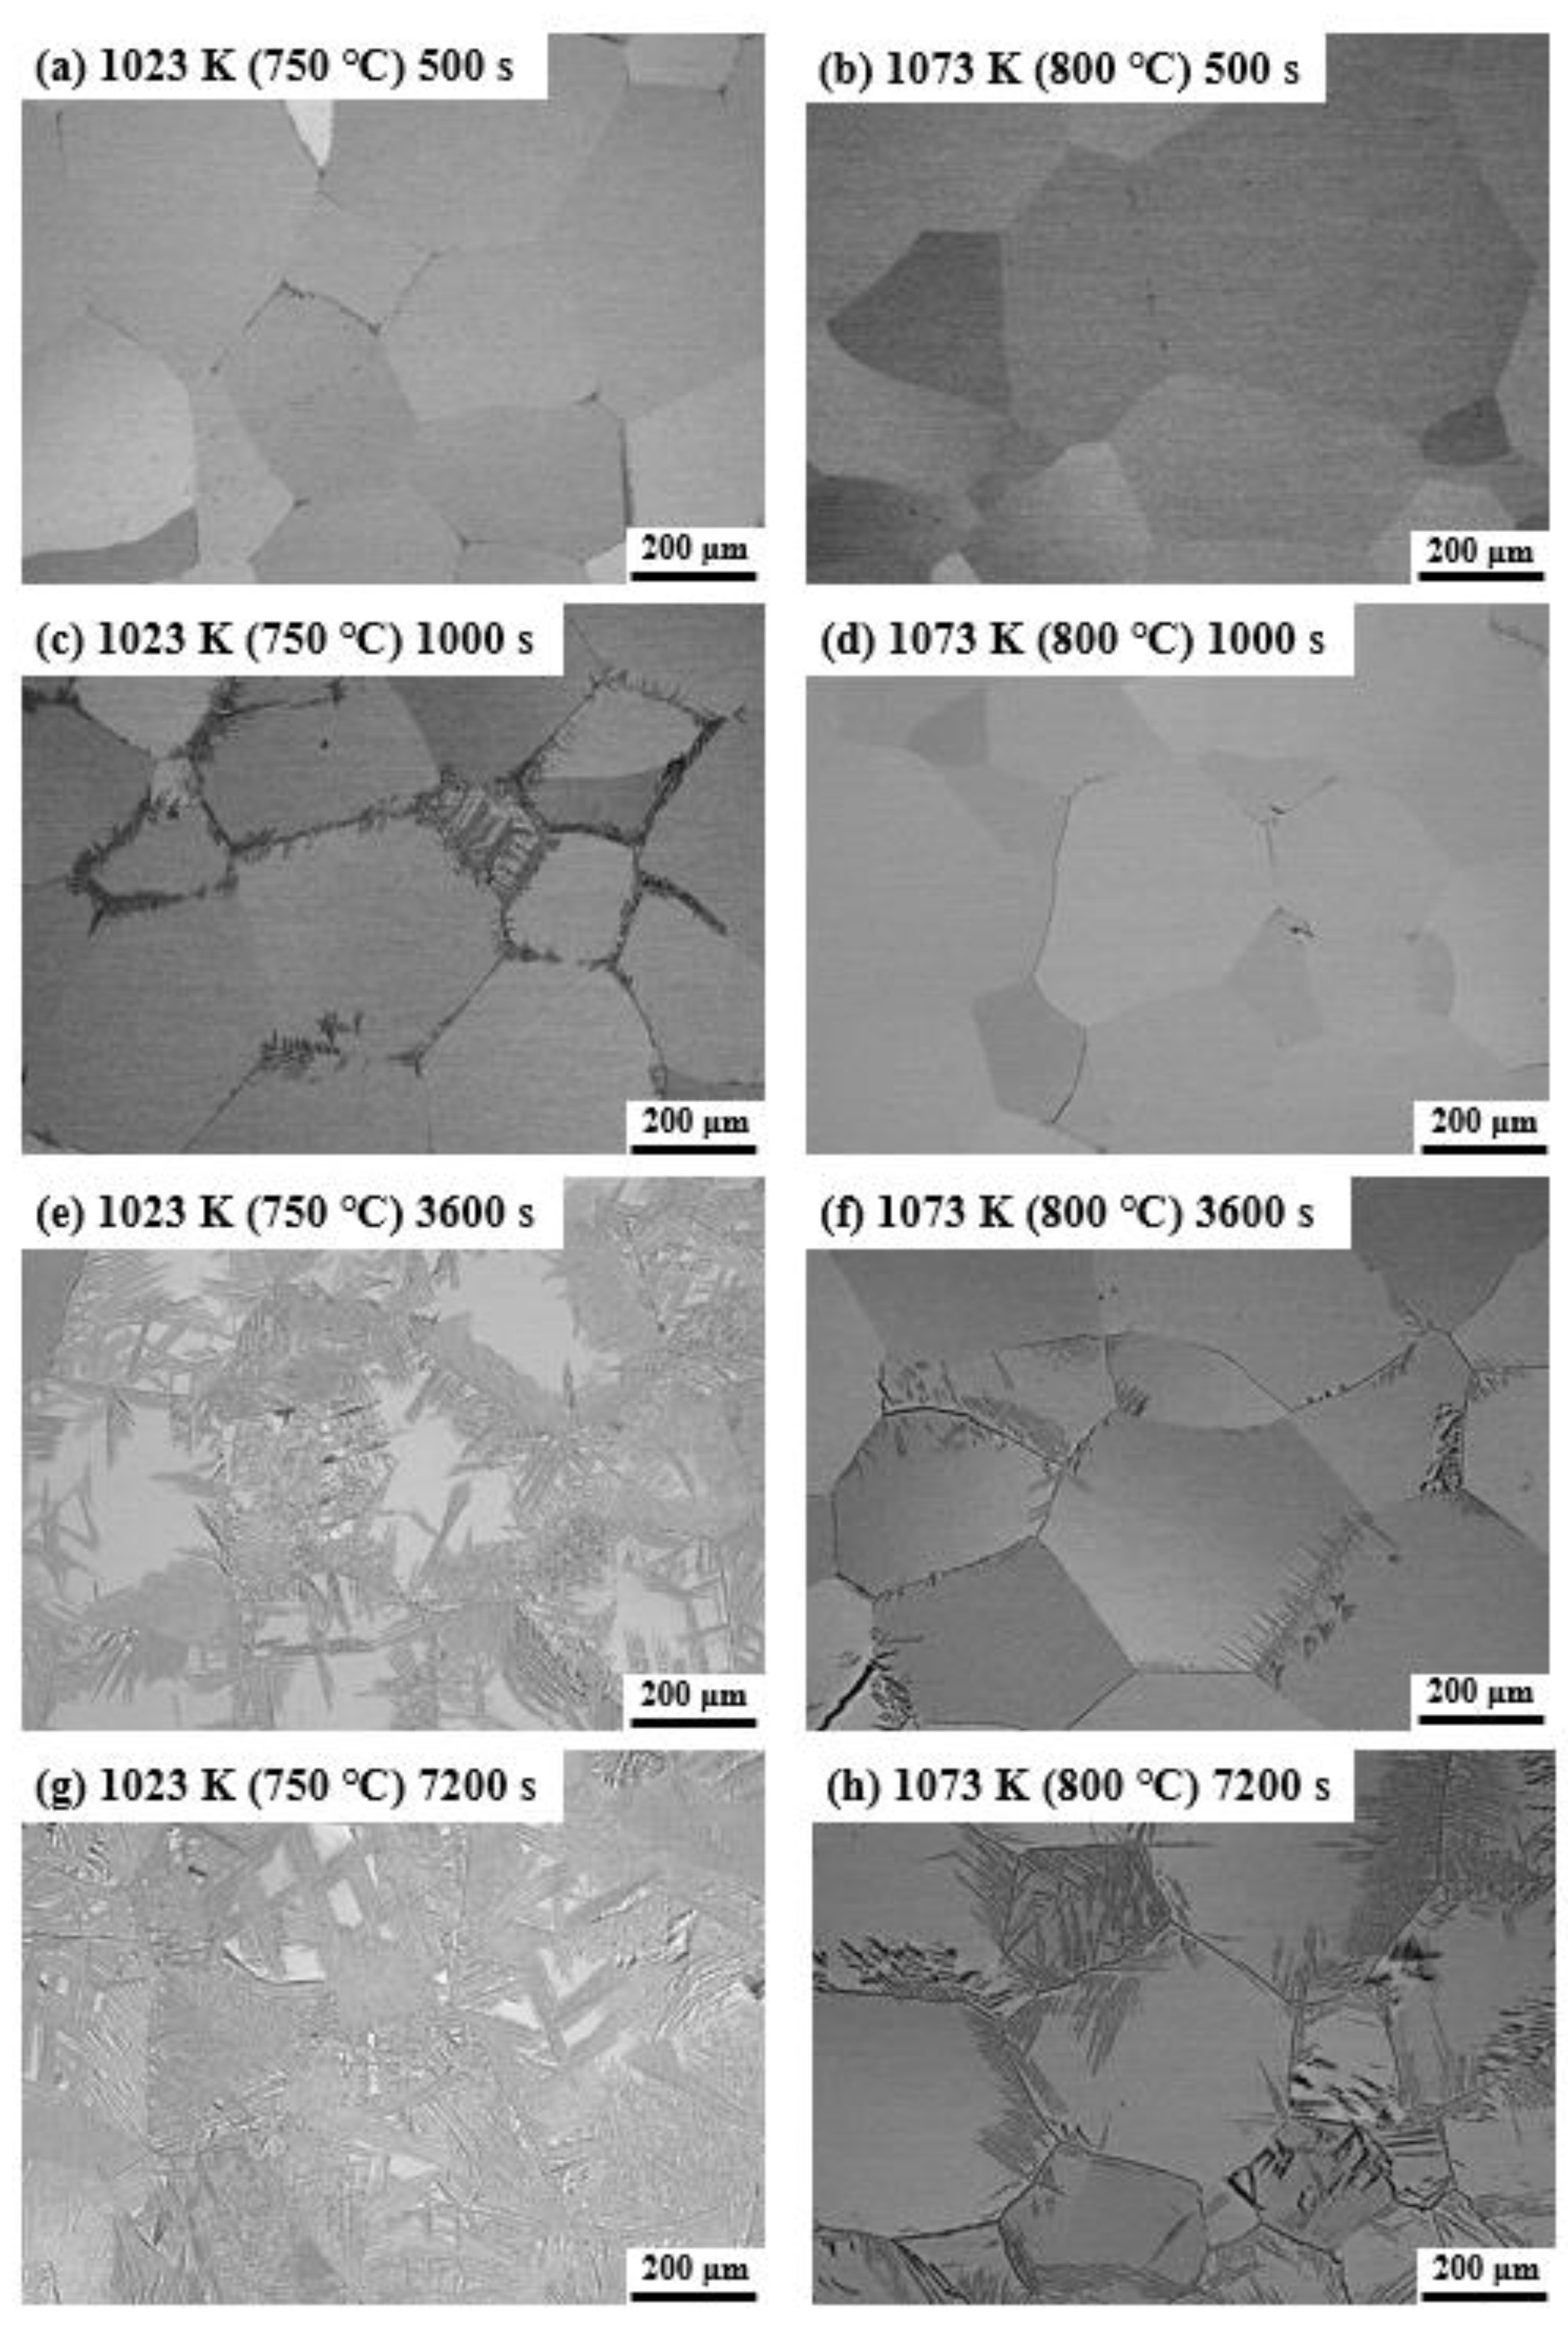
3.1. α Precipitation in the (α + β) Region after Cooling from the β Region

The temperature change in the workpiece was tracked with a thermocouple inserted into the center of the workpiece, as shown in Figure 4a for the process with a strain rate of 0.05 s−1, and Figure 4b for that with a strain rate of 0.5 s−1. In the through-transus forging, the temperature decreased from the preheating treatment at 1193 K (920 °C) in the single β-phase region to 1123, 1073, or 1023 K (850 °C, 800 °C, 750 °C, respectively) in the (α + β) dual-phase region. When the temperature was held at each forging temperature, a workpiece was forged. It is evident that the rate of the increase in temperature at 0.5 s−1 in Figure 4b is higher than that at 0.05 s−1 in Figure 4a, which will be discussed in more detail in Section 3.2. When the material temperature was held in the (α + β) dual-phase region before forging, the α phase hardly precipitated. Figure 5 shows the time–temperature–precipitation (TTP) diagram of the Ti-17 alloy [21]. The α phase could not be observed even at 105 s above 1090 K (817 °C). The difference in the precipitation starting time between 1023 and 1073 K (750 °C and 800 °C, respectively) was approximately 2700 s. However, the time difference between 1073 and 1090 K (800 °C and 817 °C, respectively) was longer and more than 9.5 × 10⁻⁴ s. This means that the starting time of the α precipitation is sensitive to temperature around the upper range in the curve. The microstructure formation was analyzed at 1023 and 1073 K (750 °C and 800 °C, respectively) after cooling from 1193 K (920 °C), as shown in Figure 6, using smaller specimens, as mentioned in Section 2. It can be seen in Figure 6 that small amounts of GB α formed on some GBs after 500 s at 1023 K (750 °C), which is similar to the curve in Figure 5. After 1000 s at 1073 K (800 °C), in Figure 6, a tiny amount of GB α phase started to form on a few GBs, even though Figure 5 suggests that it takes approximately 3000 s at 1073 K (800 °C). After the formation of GB α at both temperatures, an α phase grew from GBs toward the β grain interior, accompanied by precipitation and diffusion-controlled growth of the interior α phase within β grains. Figure 4a,b shows that holding the material in the (α + β) region took less than 400 s at 1023 K (750 °C) for both strain rates before forging, resulting in the existences of only a single β phase or a tiny amount of GB α phase in the β phase. At 1073 K (800 °C), for both strain rates, the temperature dropped below 1073 K (800 °C) and immediately returned to 1073 K (800 °C). It took 555 s for 0.05 s−1 and 498 s for 0.5 s−1, from when the temperature started to fall from Tβ (1148 K) to when the forging started. This results in a single β phase state or minimal amount of GB α phase in the β phase before forging at 1073 K (800 °C). At 1123 K (850 °C), the temperature decreased and immediately increased to higher than 1093 K (820 °C); this is above the precipitation curve in Figure 5, which suppresses α phase precipitation. Thus, only a single β phase or a tiny amount of GB α phase in the β phase existed before forging commenced.

3.2. Temperature Increase during Forging

Figure 7 shows temperature changes at the center of the workpiece during forging at (a) 1023 K (750 °C), (b) 1073 K (800 °C), and (c) 1123 K (850 °C), where temperature data was recorded at intervals of 0.1 s. A thermocouple broke at 1073 K (800 °C) at 0.05 s−1 during the forging, as shown by a cross mark in Figure 7b and Figure 4a. The forging was completed in approximately 28 s for the strain rate of 0.05 s−1 and 3 s for 0.5 s−1. At 1023 K (750 °C) for 0.5 s−1, the temperature instantly reached 1124 K (851 °C). In contrast, at 0.05 s−1, as the forging time proceeded, the temperature logarithmically increased, i.e., the rate of the increase in temperature decreased, accompanied by an increase in the contact area between the dies and workpieces, as shown in Figure 7c. After approximately 18 s, which corresponds to approximately 60% deformation, the heat transfer from the heat-generated workpiece to the dies resulted in a moderate temperature increase at the late stage. Finally, it reached 1062 K (789 °C). It is clear that the temperature at the end of forging for 0.5 s−1 is higher than that for 0.05 s−1, and this trend is the same for other forging temperatures. Moreover, a logarithmic increase in temperature at 0.05 s−1 was also observed for other temperatures. However, as the forging temperature increased, the increase in temperature decreased for both strain rates, that is, for 0.5 s−1, 101 at 1023, 78 at 1073, and 67 at 1123 K (750 °C, 800 °C, and 850 °C, respectively). As for 0.05 s−1, it was 39 at 1023, 30 at 1073, and 23 at 1123 K (750 °C, 800 °C, and 850 °C, respectively). In the Ti-6Al-4V alloy, consisting of a bimodal structure, the temperature increase was 39 during forging at 1073 K (800 °C) in the (α + β) dual-phase region at a strain rate of 0.05 s−1 [17], which is higher than the 30 at 1073 K (800 °C) for the Ti-17 alloy. It is almost the same as that at 1023 K (750 °C) in this study.
The temperature change during forging is dependent on the strain rate, plastic strain, temperature, and material. Such temperature change is affected by the heat transfer between the workpiece and dies, especially for lower strain rates, as mentioned before. However, it is also interactively related to deformation behaviors, such as work hardening (from dislocation gliding accumulation and pileup) and softening (from DRV and DRX). Such heat generation caused by plastic deformation has been discussed from the viewpoint of dislocation theories. Le et al. developed a thermodynamic dislocation theory relying on plastic strain, strain rate, and temperature, and the authors validated the theory in Al binary and Fe binary alloys [22]. Longère and Dragon also proposed a model combining a dislocation theory based on thermally activated inelastic deformation mechanisms and an internal variable approach in pure Cu and Ta [23]. However, it is difficult to theoretically predict the temperature increase in two-phase alloys, and there is still a gap in the literature on the problem of such plasticity-induced heat and currently reported dislocation theories [24,25].
It should be noted here that the temperature difference before the forging started was 50 K. However, this difference became small as the forging proceeded, as shown in Figure 7. As a result, this temperature difference at the last stage of forging for the strain rate of 0.5 s−1 became 27 between 1023 and 1073 K (750 °C and 800 °C, respectively) and 39 between 1073 and 1123 K (800 °C and 850 °C, respectively). As for the strain rate of 0.05 s−1, that difference was 41 between 1023 and 1073 K (750 °C and 800 °C, respectively) and 43 between 1073 and 1123 K (800 °C and 850 °C, respectively). Thus, the effect of the initial temperature difference on the microstructure formation can be decreased at higher strain rates and lower temperatures. At 0.05 s−1, the decrease in the temperature difference was not significant, even though the final temperature difference was smaller than the temperature difference before forging started. Notably, at 1073 and 1123 K (800 °C and 850 °C, respectively) at the strain rate of 0.5 s−1, the temperature exceeded Tβ at the last stage of forging. In contrast, at 1123 K (850 °C) at 0.05 s−1, the temperature logarithmically increased and reached 1146 K (873 °C), which was only 2 K below Tβ, where the equilibrium amount of the α phase is small, as shown in Figure 3, even though the α formation on dislocations near the GBs may be promoted during deformation. The temperature increase is a sensitive issue in the forging process near Tβ. Temperature changes from forging to water quenching in Figure 4a,b are enlarged in Figure 4c. The starting time of forging was discretionally justified at each temperature. The cooling rate of a large workpiece with a large heat capacity is generally smaller than that of a small workpiece. The cooling rate during water quenching was approximately 60 K/s over 500 K using a large workpiece, in this study. The thermocouple for 0.05 s−1 at 1123 K (850 °C) broke during the cooling operation in a water bath, as shown by a cross mark in Figure 4a,c. It should be noted that, after forging, the workpiece was cooled at approximately 2 K/s for approximately 40 to 70 s while the workpiece was manually grabbed, and it was transferred into the water after opening the heaters of the forging press, as mentioned in Section 2. The time spent for these operations is shown in Figure 4c.

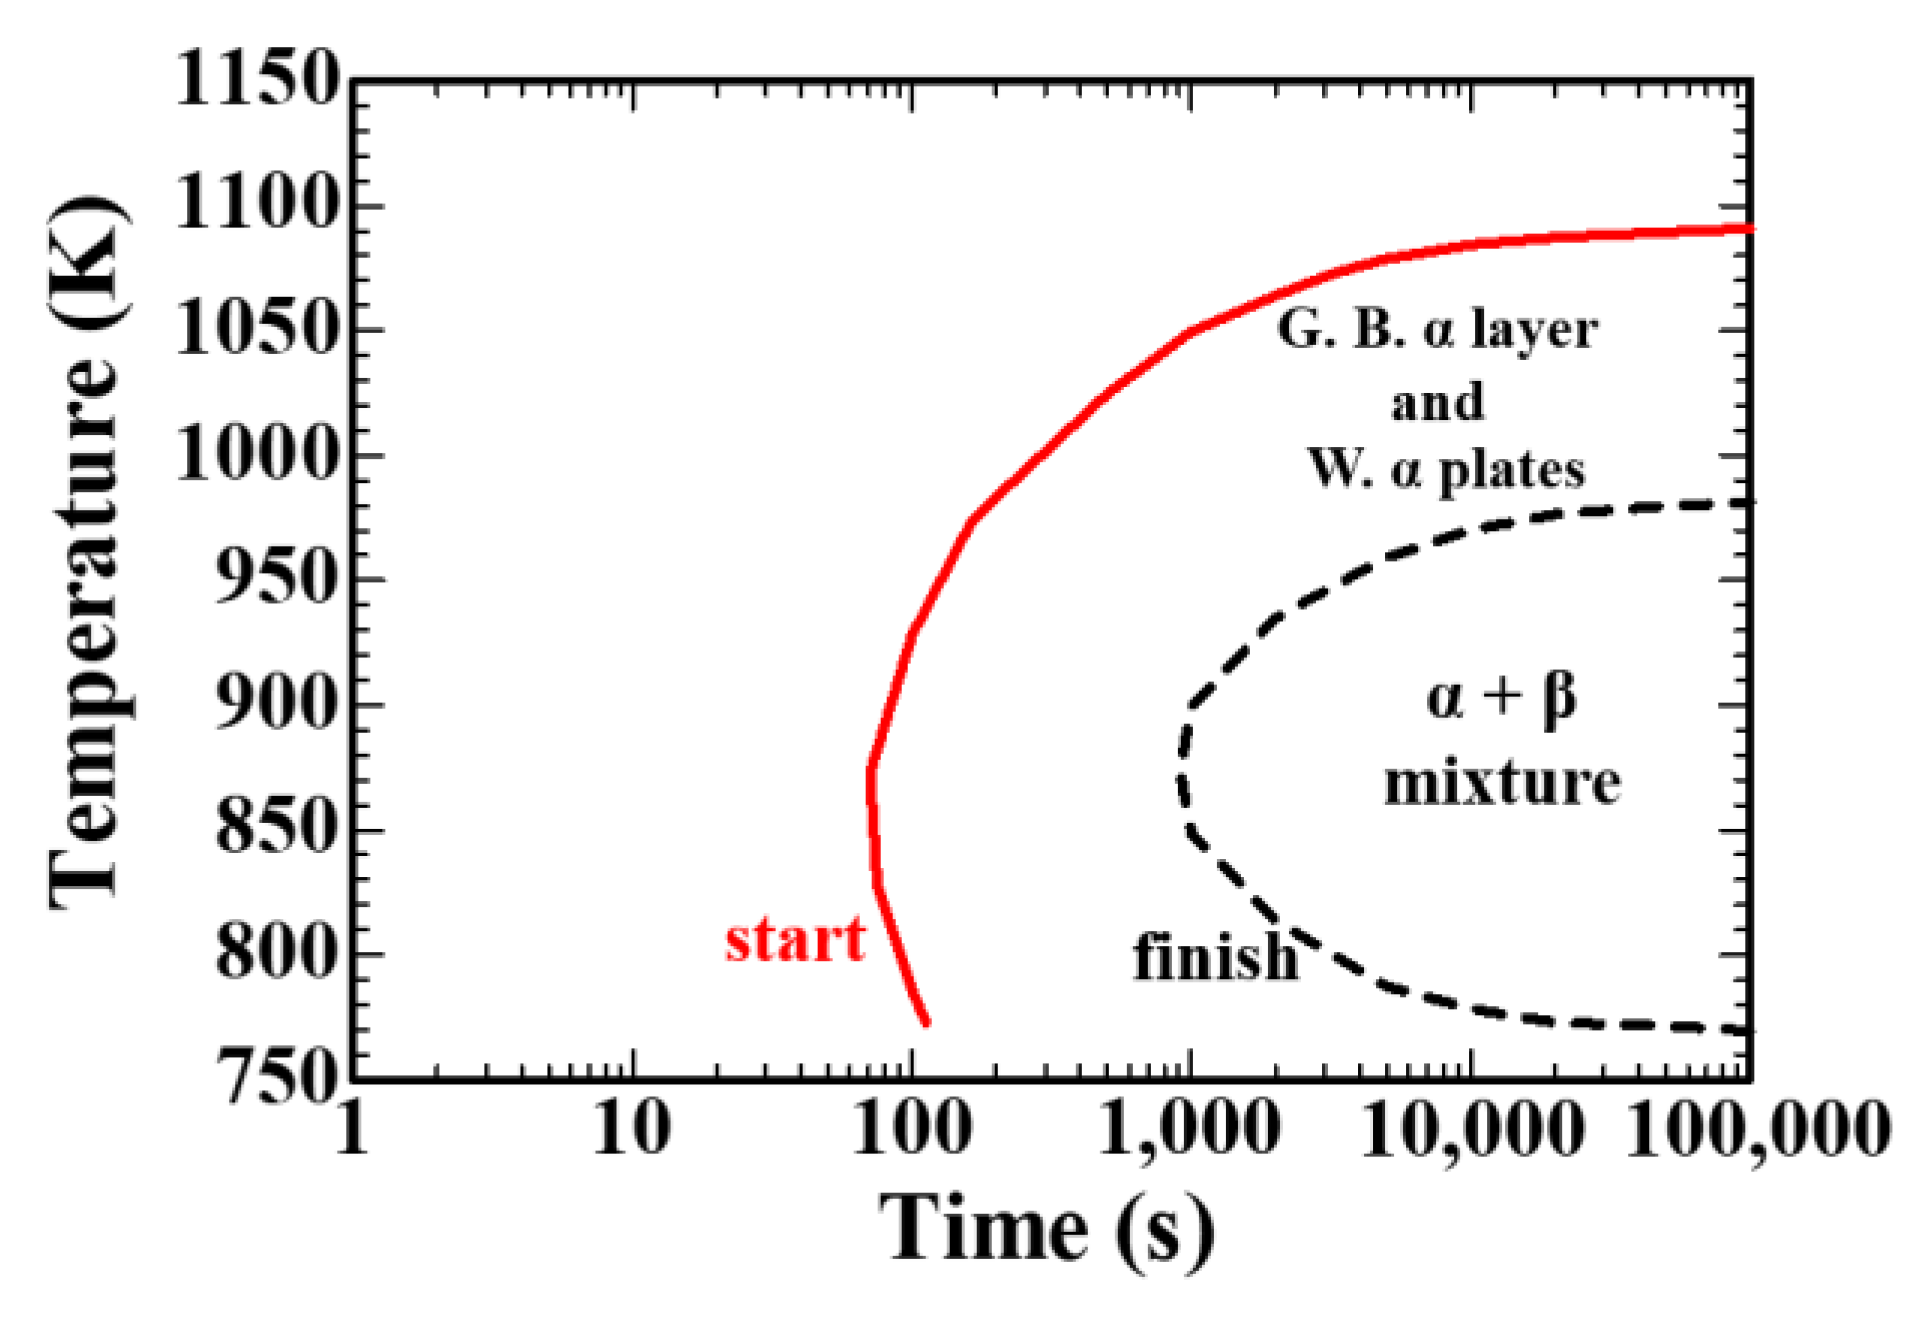
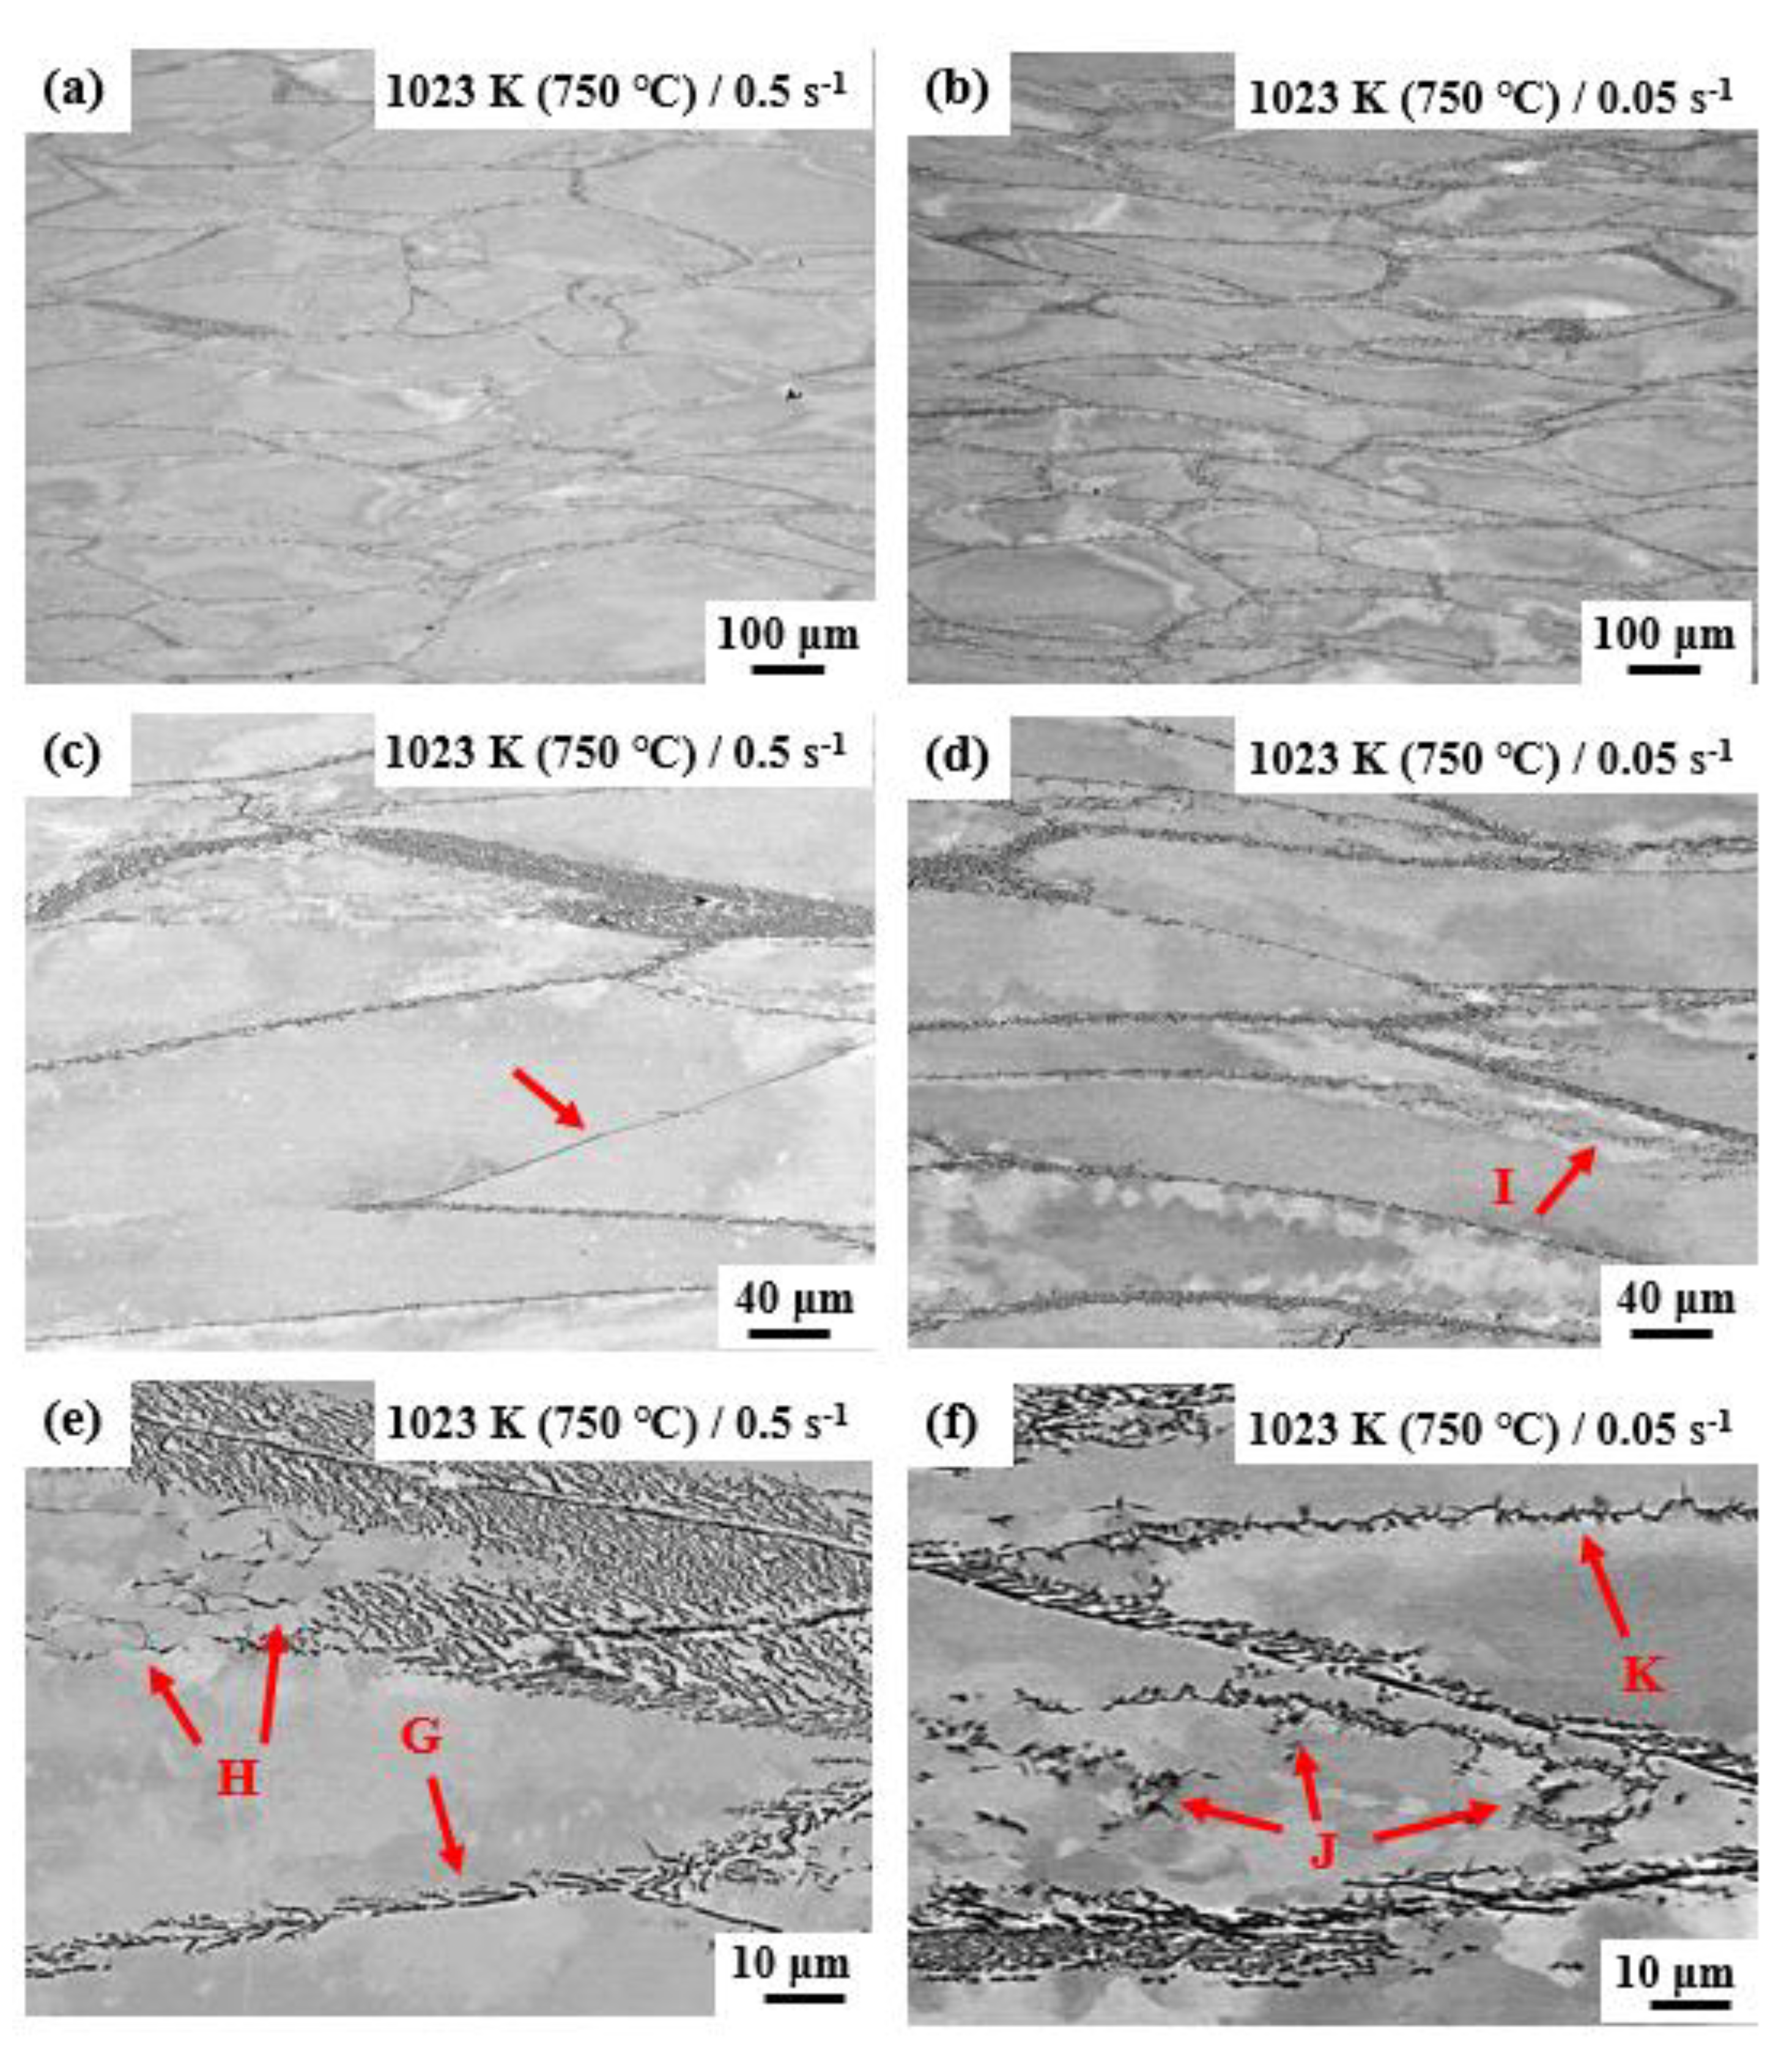
3.3. Microstructure Formation during Forging and Cooling

After forging and cooling, the diameter and height of workpieces were not significantly different between forging conditions because a compression percentage of 75% led to a height of approximately 13 mm for all workpieces, resulting in the material flow to RD with the maintenance of a constant volume causing the diameter of approximately 230 mm. We analyzed the microstructures at the center of the workpiece in the FD–RD plane, which was obtained after water quenching following forging with 75% compression at 1023 K (750 °C) (Figure 8) and 1073 K (800 °C) (Figure 9), at strain rates of 0.05 s−1 and 0.5 s−1. Figure 8c,e are the enlarged areas of Figure 8a, and Figure 8d,f are the enlarged areas of Figure 8b. GB α formed in all of the microstructures, and the β grains were deformed and elongated perpendicular to the FD. At 1023 K (750 °C), at 0.5 s−1, some rectilinear GBs were observed, as shown by an arrow in Figure 8c. In contrast, other GBs showed discontinuous α layers resulting from the nucleation and growth of the α phase on the serrated GBs, which is marked by arrow G in Figure 8e. The amount of such discontinuous GB α increases as the temperature decreases, and the plastic strain increases during deformation in the (α + β) phase region because of the promoted diffusion-controlled growth of the GB α in the (α + β) region and the increase in the nucleation rate due to dislocation accumulation near the GBs [6,8]. In the grain interiors, the α phase precipitated on the subgrain boundaries, as shown by arrow H in Figure 8e. It can also be seen in Figure 8e that the deformed acicular α grew from GB α toward the β grain interior. At a lower strain rate of 0.05 s−1, the fraction of GB α increased, and more α phases precipitated on the subgrain boundaries within the β grains, as shown by arrow I in Figure 8d and J in Figure 8f. In addition, the zigzag morphology of the GBs was formed, as shown by arrow K in Figure 8f, which is attributed to DRV [24]. In this study, after the forging, the workpieces were cooled at 2 K/s for different cooling times, i.e., approximately 40 to 70 s, because of the aforementioned manual operations, as shown in Figure 4c. The cooling after forging also promoted dislocation rearrangement and recrystallization at the GBs [8,26]. The deformed microstructures at 1073 K (800 °C) were similar to those at 1023 K (750 °C), as shown in Figure 9. Straight GB α and discontinuous GB α were observed at 1073 K (800 °C), as shown by arrows L and M in Figure 9, in addition to α precipitation inside the β grains, as shown by arrow N, even though this was a smaller amount.
The α phase shown in Figure 8 and Figure 9 mainly precipitated during forging and cooling because only a single β phase or minimal amount of GB α phase in the β phase existed before forging, as demonstrated in Section 3.1. The deformation during forging induces substantial dislocation accumulation near GBs and inside β grains. These dislocations increase the nucleation rate of α phase below Tβ [6,7,8]. It is known that the density of the heterogeneous nucleation sites of the α phase is dependent on dislocation density, and this is dependent on the temperature and strain rate based on the relationship between the dislocation density and flow stress [27,28]. At a higher strain rate of 0.5 s−1, a higher dislocation density can be formed at 1023 (750 °C) than 1073 K (800 °C). However, the temperature difference reduced as the forging proceeded, for example, to 27 K at the last stage of the forging, which reduced the temperature effect on the dislocation density during forging. The generated dislocations and defects remain in the microstructure after the temperature increase, and they become nucleation sites of the α phase during cooling, and discontinuous GB α and interior α form. At the lower strain rate of 0.05 s−1, the degree of logarithmic temperature increase during forging was closer to the temperature difference before forging between 1023 and 1073 K (750 °C and 800 °C, respectively), that is, the difference of 41 K at the last stage of forging between those two conditions. Therefore, the effect of temperature difference on microstructure formation may be larger than that at the higher strain rate, 0.5 s−1. The amount of α precipitation on the subgrain boundaries inside the β grains at 1023 K (750 °C) was higher than that at 1073 K (800 °C). It should be emphasized here that, during forging, the α phase may dissolve and the α volume fraction may decrease because of the temperature increase. The deformed microstructures at 1123 K (850 °C) are not discussed here. At 1123 K (850 °C), the α phase did not precipitate because the equilibrium amount of the α phase is low at 1123 K (850 °C), as shown in Figure 3. In addition, after forging, those workpieces were water-quenched at relatively higher temperatures, approximately 1080 K (807 °C) as shown in Figure 4c, which is the upper part of the precipitation curve in Figure 5, resulting in no α precipitation.
Finally, it is noted that there have been some reports on the prediction of temperature increase during deformation using FEA. This prediction accuracy is dependent on the accuracy of physical properties, heat transfer, and friction coefficients between a workpiece and dies, and true-stress–true-strain curves [17]. In through-transus forging, the α phase dynamically precipitates during forging [6,7,8]. Some physical properties of near-β Ti alloys are not entirely linear near Tβ, and they are also dependent on both temperature and microstructure morphology in thermal-unstable states. The acquisition of such microstructure-dependent physical properties will be the subject of future work for FEA. This study is the first to demonstrate temperature changes caused by deformation heating during the through-transus forging of a titanium alloy.

4. Conclusions

We measured the temperature increase caused by deformation heating during the through-transus forging of a Ti-17 alloy. Large workpieces with a large heat capacity were forged between hot dies using circumferential electrical-resistance heaters at strain rates of 0.05 and 0.5 s−1 at 1023–1123 K (750 °C to 850 °C) in the (α + β) dual-phase region after cooling from 1193 K (920 °C) in the single-β region without deformation.
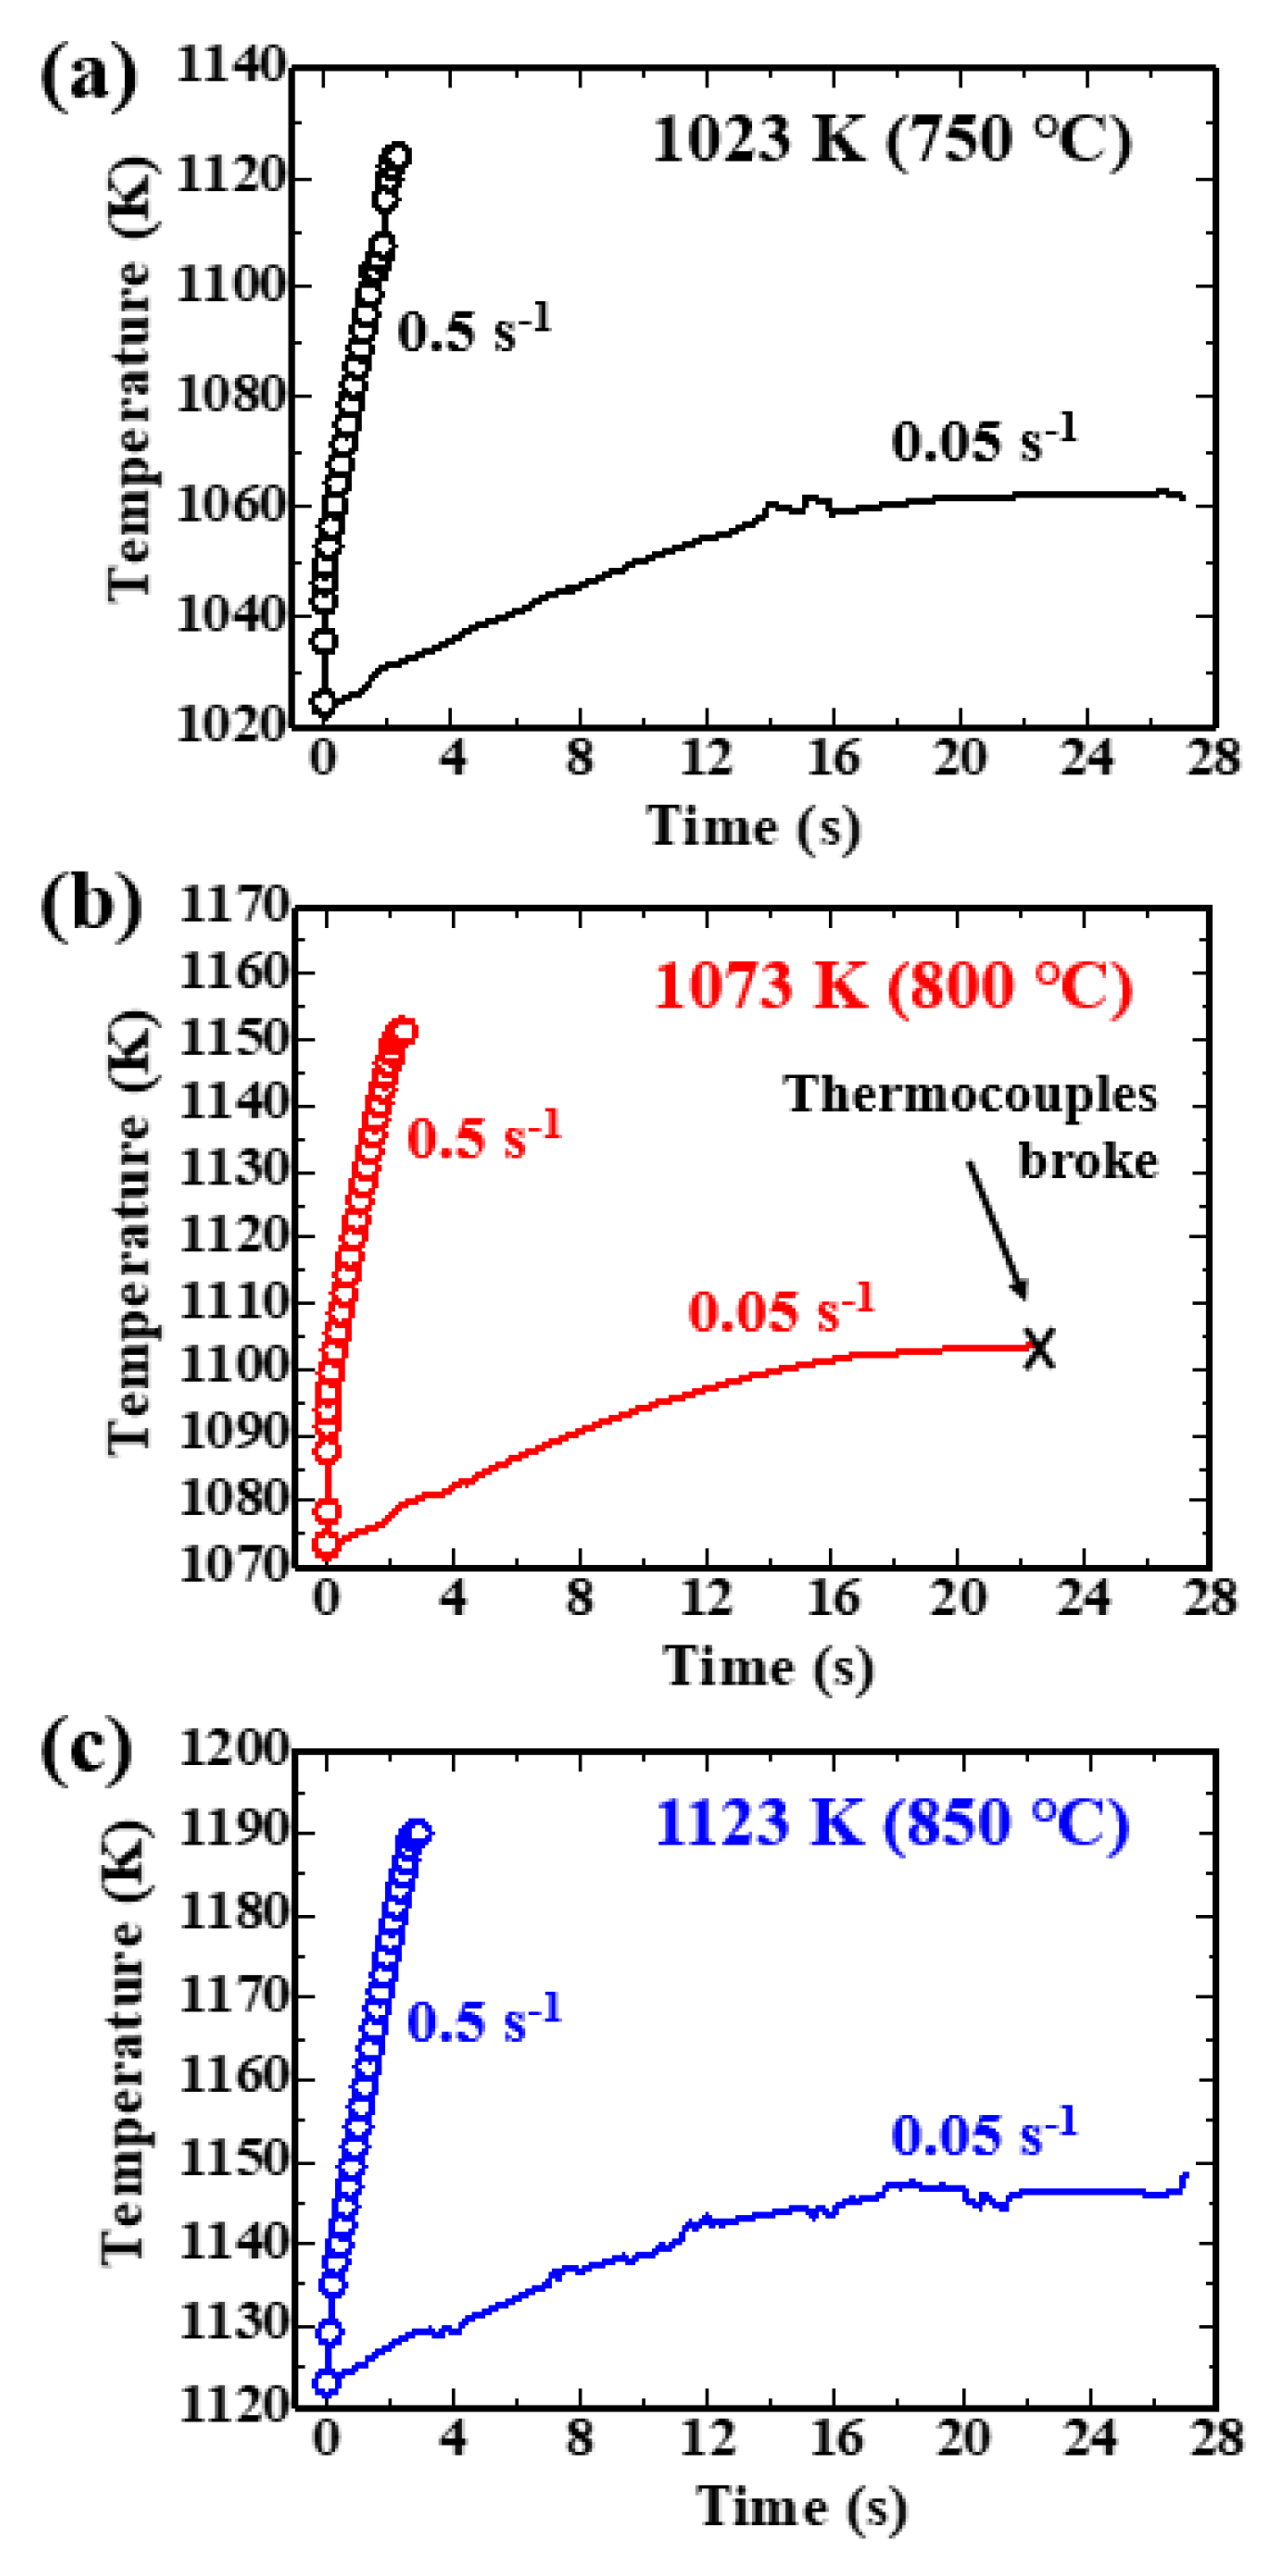
  • The lower the forging temperature, the higher the strain rate, and the larger the temperature increase because of deformation heating. At 0.5 s−1, the difference in the temperature increase between 1023 and 1073 K grew small as the forging proceeded, that is, being 27 K at the last stage of forging. In contrast, at 0.05 s−1, the difference in the temperature increase between those temperatures was 41 K, which was closer to the temperature difference before forging (50 K).
  • The material temperature instantly exceeded and reached close to β-transus temperature during forgings at 0.5 s−1. At 0.05 s−1, the temperature increase was not significant.
  • These results would affect underlying microstructure and texture changes during the β-processed forging.

Author Contributions

Conceptualization, T.K.; methodology, T.K.; software, T.K.; formal analysis, T.K.; investigation, T.K.; writing—original draft preparation, T.K.; writing—review and editing, L.M.; funding acquisition, T.K. All authors have read and agreed to the published version of the manuscript.

Funding

This research was funded by the Council for Science, Technology, and Innovation (CSTI), the Cross-Ministerial Strategic Innovation Promotion Program (SIP), and the Process Innovation for Super Heat-Resistant Metal (PRISM) (funding agency: Japan Science and Technology (JST) Agency).

Acknowledgments

One of the authors (T.K.) gratefully thanks S. Kuroda and N. Motohashi at the National Institute for Materials Science (NIMS) for forging and cooling materials. In addition, the author, T.K., also thanks Y. Yoshida at Gifu University and R. Matsumoto at Osaka University for useful discussions. The provision of materials from Kobe Steel, Ltd. is gratefully acknowledged.

Conflicts of Interest

The authors declare no conflict of interest.

References

  1. Lütjering, G.; Williams, J.C. Titanium, 2nd ed.; Springer: Berlin/Heidelberg, Germany, 2007; ISBN 978-3-540-71397-5. [Google Scholar]
  2. Sauer, C.; Luetjering, G. Thermo-mechanical processing of high strength β-titanium alloys and effects on microstructure and properties. J. Mater. Process. Technol. 2001, 117, 311–317. [Google Scholar] [CrossRef]
  3. Lütjering, G. Influence of processing on microstructure and mechanical properties of (α + β) titanium alloys. Mater. Sci. Eng. A 1998, 243, 32–45. [Google Scholar] [CrossRef]
  4. Weiss, I.; Semiatin, S.L. Thermomechanical processing of alpha titanium alloys—An overview. Mater. Sci. Eng. A 1999, 263, 243–256. [Google Scholar] [CrossRef]
  5. Le Corre, S.; Forestier, R.; Brisset, F.; Mathon, M.; Solas, D. Influence of Beta-Forging on Texture Development In Ti 6246 Alloy. In Proceedings of the 13th World Conference on Titanium, San Diego, CA, USA, 16–20 August 2015; John Wiley & Sons, Inc.: Hoboken, NJ, USA, 2016; pp. 757–764. [Google Scholar] [CrossRef]
  6. Kitashima, T.; Meng, L.; Watanabe, M. Deformation-Induced Grain-Interior α Precipitation and β Texture Evolution during the β-Processed Forging of a Near-β Titanium Alloy. Metals 2021, 11, 1405. [Google Scholar] [CrossRef]
  7. Meng, L.; Kitashima, T.; Tsuchiyama, T.; Watanabe, M. β-Texture Evolution During α Precipitation in the Two-Step Forging Process of a Near-β Titanium Alloy. Metall. Mater. Trans. A 2020, 51A, 5912. [Google Scholar] [CrossRef]
  8. Meng, L.; Kitashima, T.; Tsuchiyama, T.; Watanabe, M. Effect of α precipitation on β texture evolution during β-processed forging in a near-β titanium alloy. Mater. Sci. Eng. A 2020, 771, 138640. [Google Scholar] [CrossRef]
  9. Hua, K.; Xue, X.; Kou, H.; Fan, J.; Tang, B.; Li, J. Characterization of hot deformation microstructure of a near beta titanium alloy Ti-5553. J. Alloys Compd. 2014, 615, 531–537. [Google Scholar] [CrossRef]
  10. Dehghan-Manshadi, A.; Dippenaar, R.J. Strain-induced phase transformation during thermo-mechanical processing of titanium alloys. Mater. Sci. Eng. A 2012, 552, 451–456. [Google Scholar] [CrossRef] [Green Version]
  11. Zhang, J.; Di, H. Deformation heating and flow localization in Ti-15-3 metastable β titanium alloy subjected to high Z deformation. Mater. Sci. Eng. A 2016, 676, 506–509. [Google Scholar] [CrossRef]
  12. Charpentier, P.L.; Stone, B.C.; Ernst, S.C.; Thomas, J.F., Jr. Characterization and modeling of the high temperature flow behavior of aluminum alloy 2024. Metall. Trans. A 1986, 17A, 2227–2237. [Google Scholar] [CrossRef]
  13. Mataya, M.C.; Sackschewsky, V.E. Effect of internal heating during hot compression on the stress–strain behavior of alloy 304L. Metall. Mater. Trans. A 1994, 25A, 2737–2752. [Google Scholar] [CrossRef]
  14. Li, L.; Li, M.Q.; Luo, J. Flow softening mechanism of Ti-5Al-2Sn-2Zr-4Mo-4Cr with different initial microstructures at elevated temperature deformation. Mater. Sci. Eng. A 2015, 628, 11–20. [Google Scholar] [CrossRef]
  15. Knysh, P.; Korkolis, Y.P. Determination of the fraction of plastic work converted into heat in metals. Mech. Mater. 2015, 86, 71–80. [Google Scholar] [CrossRef]
  16. Rittel, D.; Zhang, L.H.; Osovski, S. The dependence of the Taylor-Quinney coefficient on the dynamic loading mode. J. Mech. Phys. Solids 2017, 107, 96–114. [Google Scholar] [CrossRef]
  17. Kitashima, T.; Matsumoto, R.; Yoshida, Y.; Matsumoto, H.; Nishihara, T.; Kuroda, S.; Motohashi, N.; Hagiwara, M.; Emura, S. Measurement and prediction of temperature increase during isothermal forging of Titanium-6Aluminium-4Vanadium. Mater. Perform. Charact. 2019, 8, 389–401. [Google Scholar] [CrossRef]
  18. Laasraoui, A.; Jonas, J.J. Prediction of steel flow stresses at high temperatures and strain rates. Metall. Trans. A 1991, 22A, 1545–1558. [Google Scholar] [CrossRef]
  19. Elagina, L.A.; Brun, M.Y.; Brailovskaya, B.F. Isothermal forging of titanium alloys. Met. Sci. Heat Treat. 1980, 22, 447–450. [Google Scholar] [CrossRef]
  20. Niinomi, M.; Akahori, T.; Nakai, M.; Koizumi, Y.; Chiba, A.; Nakano, T.; Kakeshita, T.; Yamabe-Mitarai, Y.; Kuroda, S.; Motohashi, N.; et al. Quantitative and Qualitative Relationship between Microstructural Factors and Fatigue Lives under Load- and Strain-Controlled Conditions of Ti-5Al-2Sn-2Zr-4Cr-4Mo (Ti-17) Fabricated Using a 1500-ton Forging Simulator. Mater. Trans. 2019, 60, 1740–1748. [Google Scholar] [CrossRef] [Green Version]
  21. Bèchet, J.; Hocheid, B. Decomposition of the Beta-Phase in Titanium Alloy Ti-17. In Titanium, Science and Technology; Lutjering, G., Zqicker, U., Bunk, W., Eds.; Deutsche Gesellschaft für Metallkunde: Oberursel, Germany, 1985; pp. 1613–1619. [Google Scholar]
  22. Le, K.C.; Tran, T.M. Thermodynamic dislocation theory of high temperature deformation in aluminum and steel. Phys. Rev. E 2017, 96, 013004. [Google Scholar] [CrossRef] [Green Version]
  23. Longère, P.; Dragon, A. Evaluation of the inelastic heat fraction in the context of microstructure-supported dynamic plasticity modelling. Int. J. Impact Eng. 2008, 35, 992–999. [Google Scholar] [CrossRef]
  24. Nieto-Fuentes, J.C.; Rittel, D.; Osovski, S. On a dislocation-based constitutive model and dynamic thermomechanical considerations. Int. J. Plast. 2018, 108, 55–69. [Google Scholar] [CrossRef]
  25. Zubelewicz, A. Century-long Taylor-Quinney interpretation of plasticity-induced heating reexamined. Sci. Rep. 2019, 9, 9088. [Google Scholar] [CrossRef] [PubMed] [Green Version]
  26. Meng, L.; Kitashima, T.; Tsuchiyama, T.; Watanabe, M. β-Texture Evolution of a Near-β Titanium Alloy During Cooling After Forging in the β Single-Phase and (α + β) Dual-Phase Regions. Metall. Mater. Trans. A 2021, 52A, 303. [Google Scholar] [CrossRef]
  27. Seshacharyulu, T.; Dutta, B. Influence of prior deformation rate on the mechanism of β to α + β transformation in Ti–6Al–4V. Scripta Mater. 2002, 46, 673–678. [Google Scholar] [CrossRef]
  28. Guo, B.; Liu, Y.; Jonas, J.J. Dynamic transformation of two-phase titanium alloys in stable and unstable alloys. Metall. Mater. Trans. A 2019, 50A, 4502–4505. [Google Scholar] [CrossRef]
Figure 1. Workpiece (a) before and (b) after forging. (c) External view of the heaters of the 1500-ton forging press and a water bath located next to the press.
Jmmp 06 00047 g001
Figure 2. Schematic of the temperature–time sequences of the thermomechanical processes.
Jmmp 06 00047 g002
Figure 3. Calculated equilibrium phase fractions of Ti-17 alloy from 1000 to 1180 K.
Jmmp 06 00047 g003
Figure 4. Temperature changes for the strain rates of (a) 0.05 s−1 and (b) 0.5 s−1 during the β-processed forging and subsequent cooling. (c) The enlarged temperature changes from forging to cooling. The starting time of the forgings was discretionally justified at each temperature in (c).
Jmmp 06 00047 g004
Figure 5. Time–temperature–precipitation diagram for Ti-17 alloy [19].
Jmmp 06 00047 g005
Figure 6. Microstructure changes during holding at 1023 and 1073 K (750 °C and 800 °C, respectively) after cooling from 1193 K (920 °C) in the (α + β) dual-phase region. Holding time was (a,b) 500, (c,d) 1000, (e,f) 3600, and (g,h) 7200 s at each temperature.
Jmmp 06 00047 g006
Figure 7. Temperature increases at the center of the workpiece during forging with 0.5 and 0.05 s−1 at (a) 1023, (b) 1073, and (c) 1123 K (750 °C, 800 °C, and 850 °C, respectively).
Jmmp 06 00047 g007
Figure 8. Deformed microstructures at 1023 K (750 °C) for the strain rates of 0.5 s−1 (a,c,e) and 0.05 s−1 (b,d,f). Here, (c,e) are the enlarged areas in (a,d,f) are the enlarged areas in (b).
Jmmp 06 00047 g008
Figure 9. Deformed microstructures at 1073 K (800 °C) for the strain rates of 0.5 s−1 (a,c,e) and 0.05 s−1 (b,d,f). Here, (c,e) are the enlarged areas in (a,d,f) are the enlarged areas in (b).
Jmmp 06 00047 g009
Publisher’s Note: MDPI stays neutral with regard to jurisdictional claims in published maps and institutional affiliations.

