Abstract
Process variables of bioprinting (including extrusion pressure, nozzle size, and bioink composition) can affect the shape fidelity and cell viability of printed constructs. Reported studies show that increasing extrusion pressure or decreasing nozzle size would decrease cell viability in printed constructs. However, a smaller nozzle size is often necessary for printing constructs of higher shape fidelity, and a higher extrusion pressure is usually needed to extrude bioink through nozzles with a smaller diameter. Because values of printing process variables that increase shape fidelity can be detrimental to cell viability, the optimum combination of variables regarding both shape fidelity and cell viability must be determined for specific bioink compositions. This paper reports a designed experimental investigation (full factorial design with three variables and two levels) on bioprinting by applying layer-by-layer photo-crosslinking and using the alginate-methylcellulose-GelMA bioink containing algae cells. The study investigates both the main effects and interaction effects of extrusion pressure, nozzle size, and bioink composition on the shape fidelity and cell viability of printed constructs. Results show that, as extrusion pressure changed from its low level to its high level, shape fidelity and cell viability decreased. As nozzle size changed from its low level to its high level, shape fidelity decreased while cell viability increased. As bioink composition changed from its low level (with more methylcellulose content in the bioink) to its high level (with less methylcellulose content in the bioink), shape fidelity and cell viability increased.
1. Introduction
Green bioprinting fabricates constructs layer-by-layer, using bioink containing photosynthetic cells [1,2,3]. Constructs printed with green bioprinting have a wide range of potential applications such as metabolite production [2,3,4], removal of metal ions from contaminated water [5], biofuel production [2,4], and tissue engineering [2].
In order to be functional, printed constructs should possess sufficiently high shape fidelity and cell viability [6]. Shape fidelity, also known as print accuracy or dimensional accuracy, describes the shape retention of the printed construct compared with the designed shape [7,8,9]. Cell viability describes the health of living cells in printed constructs [10,11,12].
Extrusion-based bioprinting uses a mechanical screw or compressed air to extrude bioink and fabricate the constructs [13,14]. Other bioprinting techniques include inkjet bioprinting and stereolithography [15]. Inkjet bioprinting forms droplets for printing [16]. Stereolithography is where layers of the liquid precursor in a vat are sequentially exposed to ultraviolet (UV) light and are thereby selectively solidified [17]. More details on these bioprinting techniques can be found in a review paper [18].
Crosslinking [19] is usually performed after a construct is printed to impart a certain shape fidelity of the printed construct [7]. Reported methods of crosslinking include ionic crosslinking [19] and photo-crosslinking [19]. The main drawback of ionic crosslinking is that it does not usually result in high shape fidelity [3].
Constructs crosslinked with photo-crosslinking have higher shape fidelity [10]. However, photo-crosslinking, due to its use of ultraviolet (UV) radiation, may decrease cell viability of printed constructs [19]. UV-B radiation is harmful to mammalian cells (damaging DNA, proteins, lipids, and membranes) [20,21] and plant cells [22]. Furthermore, photo-crosslinking can only be used with photo-crosslinkable bioinks. Photo-crosslinking can be performed “once-post-printing”, meaning that it is performed after the construct is printed [23]. It can also be performed “layer-by-layer”, meaning that it is performed after each layer is printed [24]. Layer-by-layer photo-crosslinking ensures relatively uniform crosslinking throughout the construct. As can be seen in Table 1, in reported studies on green bioprinting, either shape fidelity was not investigated, or the achieved shape fidelity was low. In reported studies [2,3,4], the width of the printed stands was measured. The measured strand width was then compared to the strand width of the computer model used for printing. Larger variation between these two width values indicates lower shape fidelity. Reported studies on green bioprinting applying ionic crosslinking showed that increasing extrusion pressure and decreasing nozzle size decrease the cell viability of printed constructs [25]. Additionally, different bioink compositions have different biocompatibilities, affecting the cell viability of printed constructs [26]. However, there are no reported studies regarding the effects of the three printing process variables (extrusion pressure, nozzle size, and bioink composition) on shape fidelity and cell viability in green bioprinting applying layer-by-layer photo-crosslinking. The objective of this study is to determine the main effects and interaction effects of extrusion pressure, nozzle size, and bioink composition on the shape fidelity and cell viability of printed constructs by applying layer by layer photo-crosslinking and using the alginate-methylcellulose-GelMA bioink containing algae cells.

Table 1.
Summary of reported studies on green bioprinting.
2. Experimental Methods
2.1. Preparation of Algae Cells
Chlamydomonas reinhardtii algae strain cc125 (Chlamydomonas Resource Center, University of Minnesota, Minneapolis, MN, USA) was used for bioink preparation. Using a sterile inoculating loop (Fisher Scientific, Waltham, MA, USA), a streak of cc125 algae was transferred from a petri dish of solid tris-acetate-phosphate (TAP) medium to a flask containing 100 mL of liquid TAP medium. The flask containing the TAP-algae solution was placed under lightbulbs for 72 h to promote algae cell growth.
After the 72 h of growth, 10 mL of the TAP-algae solution were added to a new flask containing 100 mL of fresh liquid TAP medium. The fresh medium provides fresh nutrients to algae cells, and does not contain accumulated cellular waste products (such as free radicals and methane). The new flask was then placed under lightbulbs for 24 h.
2.2. Synthesis of Alginate-Methylcellulose-GelMA Bioink
The main ingredients of the bioink include alginate, methylcellulose, GelMA, and photoinitiator. Alginate is hydrogel that supports cell growth, methylcellulose is visco-modifier used to alter the viscosity of the bioink, GelMA is hydrogel that can be photo-crosslinked, and photoinitiator (Irgacure, in this study) is used to initiate the photo-crosslinking of GelMA. Bioink synthesis was performed in the dark to prevent premature photo-crosslinking of the photoinitiator.
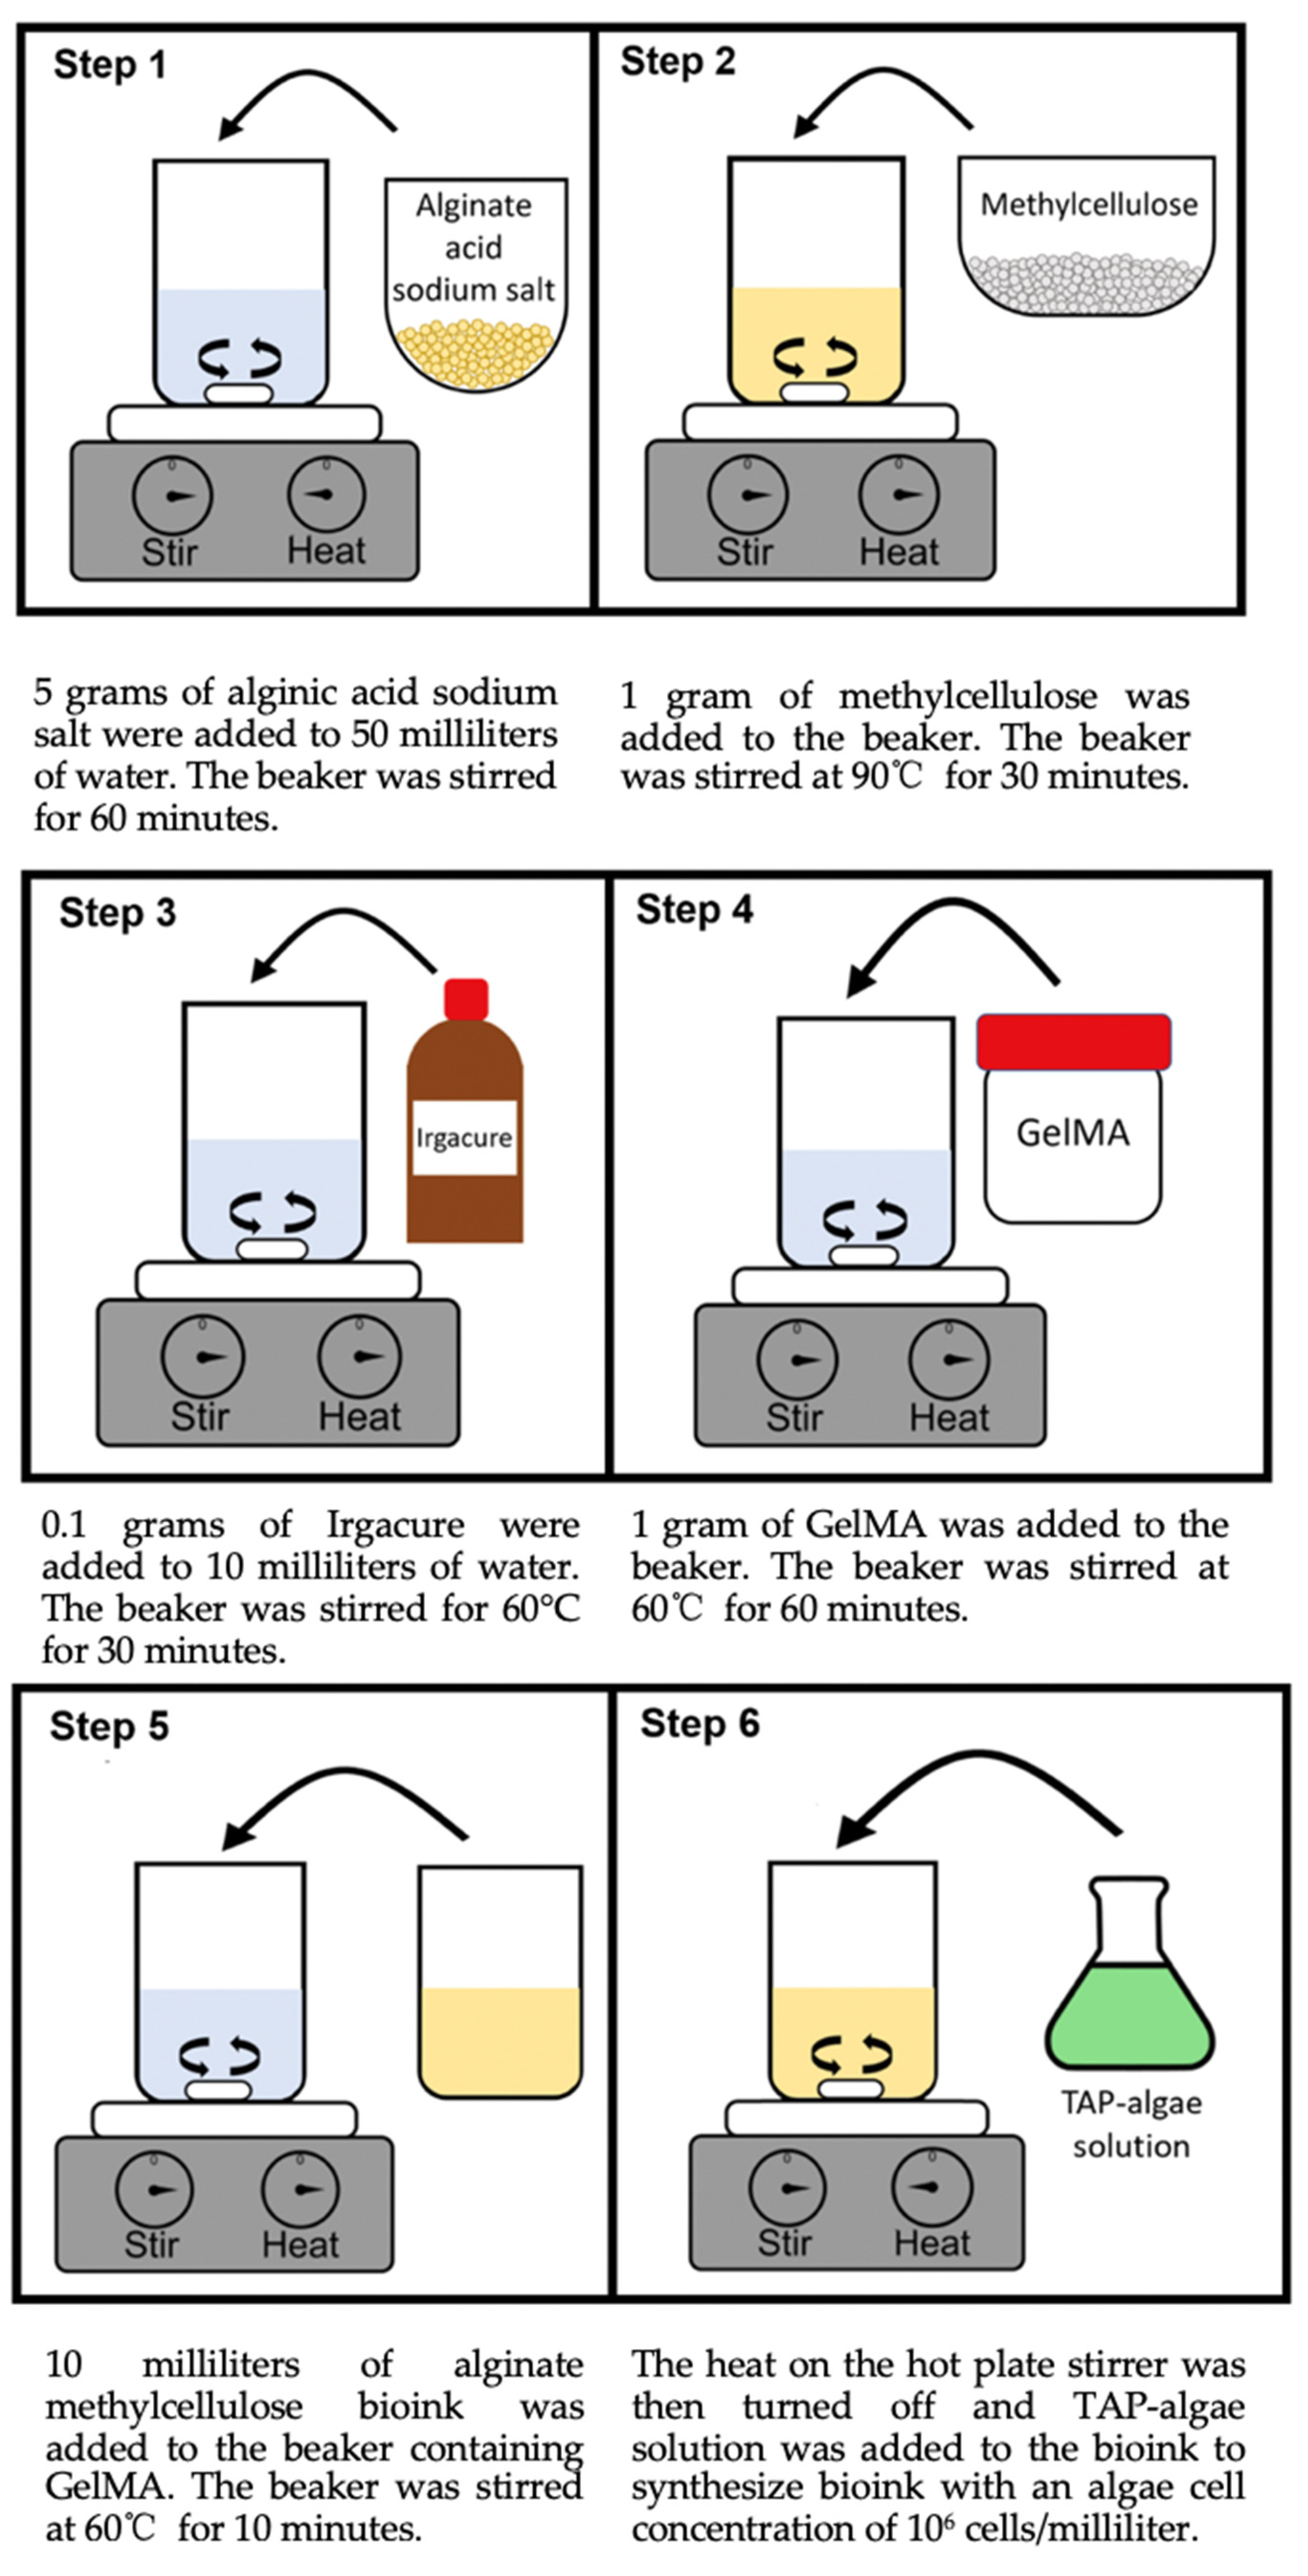
Figure 1 illustrates the synthesis process of alginate-methylcellulose-GelMA bioink with the alginate:methylcellulose:GelMA ratio of 5:1:5 (% w/v). To prepare the alginate-methylcellulose solution, a 150 mL beaker (VWR, Radnor, PA, USA) was filled with 50 mL of deionized water. A magnetic stir bar (Fisher Scientific, Waltham, MA, USA) was placed in the beaker and was set to rotate at 1000 rpm on a hot plate stirrer (Fisher Scientific, Waltham, MA, USA). The stir bar was used for all stirring during bioink synthesis, and the hot plate stirrer was used to rotate the stir bar. A total of 5 g of alginic acid sodium salt dry powder (Sigma-Aldrich, Saint Louis, MO, USA) were slowly added to the beaker over a period of 10 min to prevent clumping of the alginate. Alginic acid sodium salt forms alginate after dissolving in water [27]. After alginic acid sodium salt was added, the solution was stirred for 60 min to allow alginate to dissolve completely. The hot plate stirrer was then heated to 90 °C, and 1 g of methylcellulose dry powder (Sigma-Aldrich, Saint Louis, MO, USA) was added to the beaker containing the alginate solution. The alginate-methylcellulose solution was stirred on the hot plate stirrer for 30 min while rotating the stir bar at 500 rpm. During stirring, aluminum foil was tightly placed over the top of the beaker to prevent evaporation of the solution.
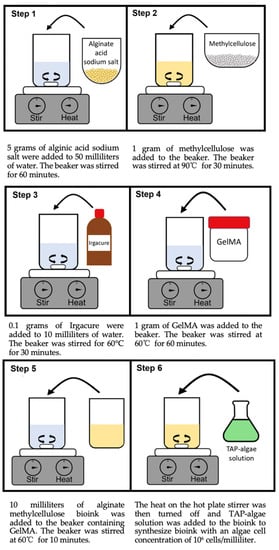
Figure 1.
Synthesis of alginate-methylcellulose-GelMA.
To prepare the GelMA solution, a separate 50 mL beaker (VWR, Radnor, PA, USA) was filled with 10 mL of deionized water. Aluminum foil was wrapped tightly around the sides and top of the beaker to block light and prevent evaporation. The beaker was placed on a hot plate stirrer (Fisher Scientific, Waltham, MA, USA), and a magnetic stir bar (Fisher Scientific, Waltham, MA, USA) was placed in the beaker. The hot plate stirrer was heated to 60 °C and set to stir at 700 rpm. While stirring, 0.1 g of Igracure (Sigma-Aldrich, Saint Louis, MO, USA) was added to the beaker, and the beaker was stirred for 30 min to allow the Igracure to dissolve completely. After dissolving the Igracure completely, 1 g of lyophilized GelMA (Allevi Inc., Philadelphia, PA, USA) was added to the beaker and stirred on the hot plate stirrer for 60 min at 60 °C while rotating the stir bar at 700 rpm.
After preparing the alginate-methylcellulose solution and the GelMA solution in separate beakers, 10 mL of the alginate-methylcellulose solution was added to the beaker containing 10 mL of GelMA solution to form the alginate-methylcellulose-GelMA solution at a ratio of 5:1:5 (% w/v). The new solution was stirred on the hot plate stirrer at 60 °C for 10 min while rotating the stir bar at 700 rpm. This process was performed in order to homogenously mix the alginate-methylcellulose-GelMA solution. The heat on the hot plate stirrer was then turned off and the solution was cooled to 20 °C.
The TAP-algae solution was added to the solution to synthesize alginate-methylcellulose-GelMA bioink to obtain an algae cell concentration of 106 cells/milliliter in the bioink. Before adding, Auto T4 cell counter (Nexcelom, Lawrence, MA, USA) was used to determine the algae cell concentration of the TAP-algae solution, according to the instructions from the cell counter manufacturer.
In order to synthesize alginate-methylcellulose-GelMA bioink at a ratio of 5:3:5 (% w/v), 3 g (instead of 1 g) of methylcellulose were added to the alginate solution to prepare the alginate-methylcellulose solution. The rest of the synthesis steps remained the same.
2.3. Construct Design
A commercial CAD (computer-aided design) software (SolidWorks, Waltham, MA, USA) was used to design the 3D model of the construct (Figure 2). The STL file of the designed 3D model was also generated using the CAD software. Prior to printing, the STL file was converted into G-code (which contains specific instructions for the printer), using Allevi Bioprint software (Allevi Inc., Philadelphia, PA, USA). The model with thickness of 1 mm was sliced with a layer thickness of 0.2 mm, infill pattern as grid, and infill distance of 0.5 mm. Part of the 3D model (7 mm out of 15 mm) contained a section completely filled with bioink. This section provided a continuous substrate for the cells in the bioink to grow. The shape was chosen as it allowed to obtain data of both shape fidelity (via the grid part), and cell viability (via the solid part) from one sample. The values for the two levels for each input variable were selected based on previous experimental studies [25].
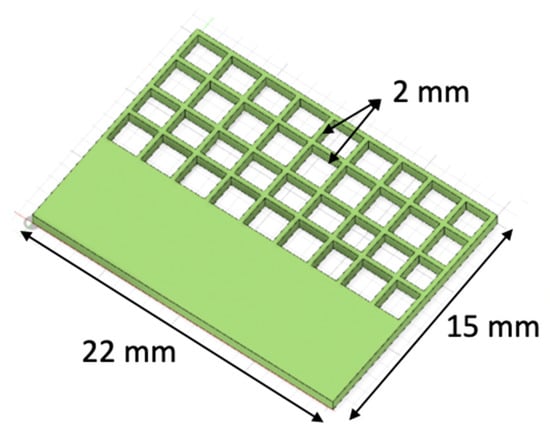
Figure 2.
CAD model of the printed constructs.
2.4. Bioprinting
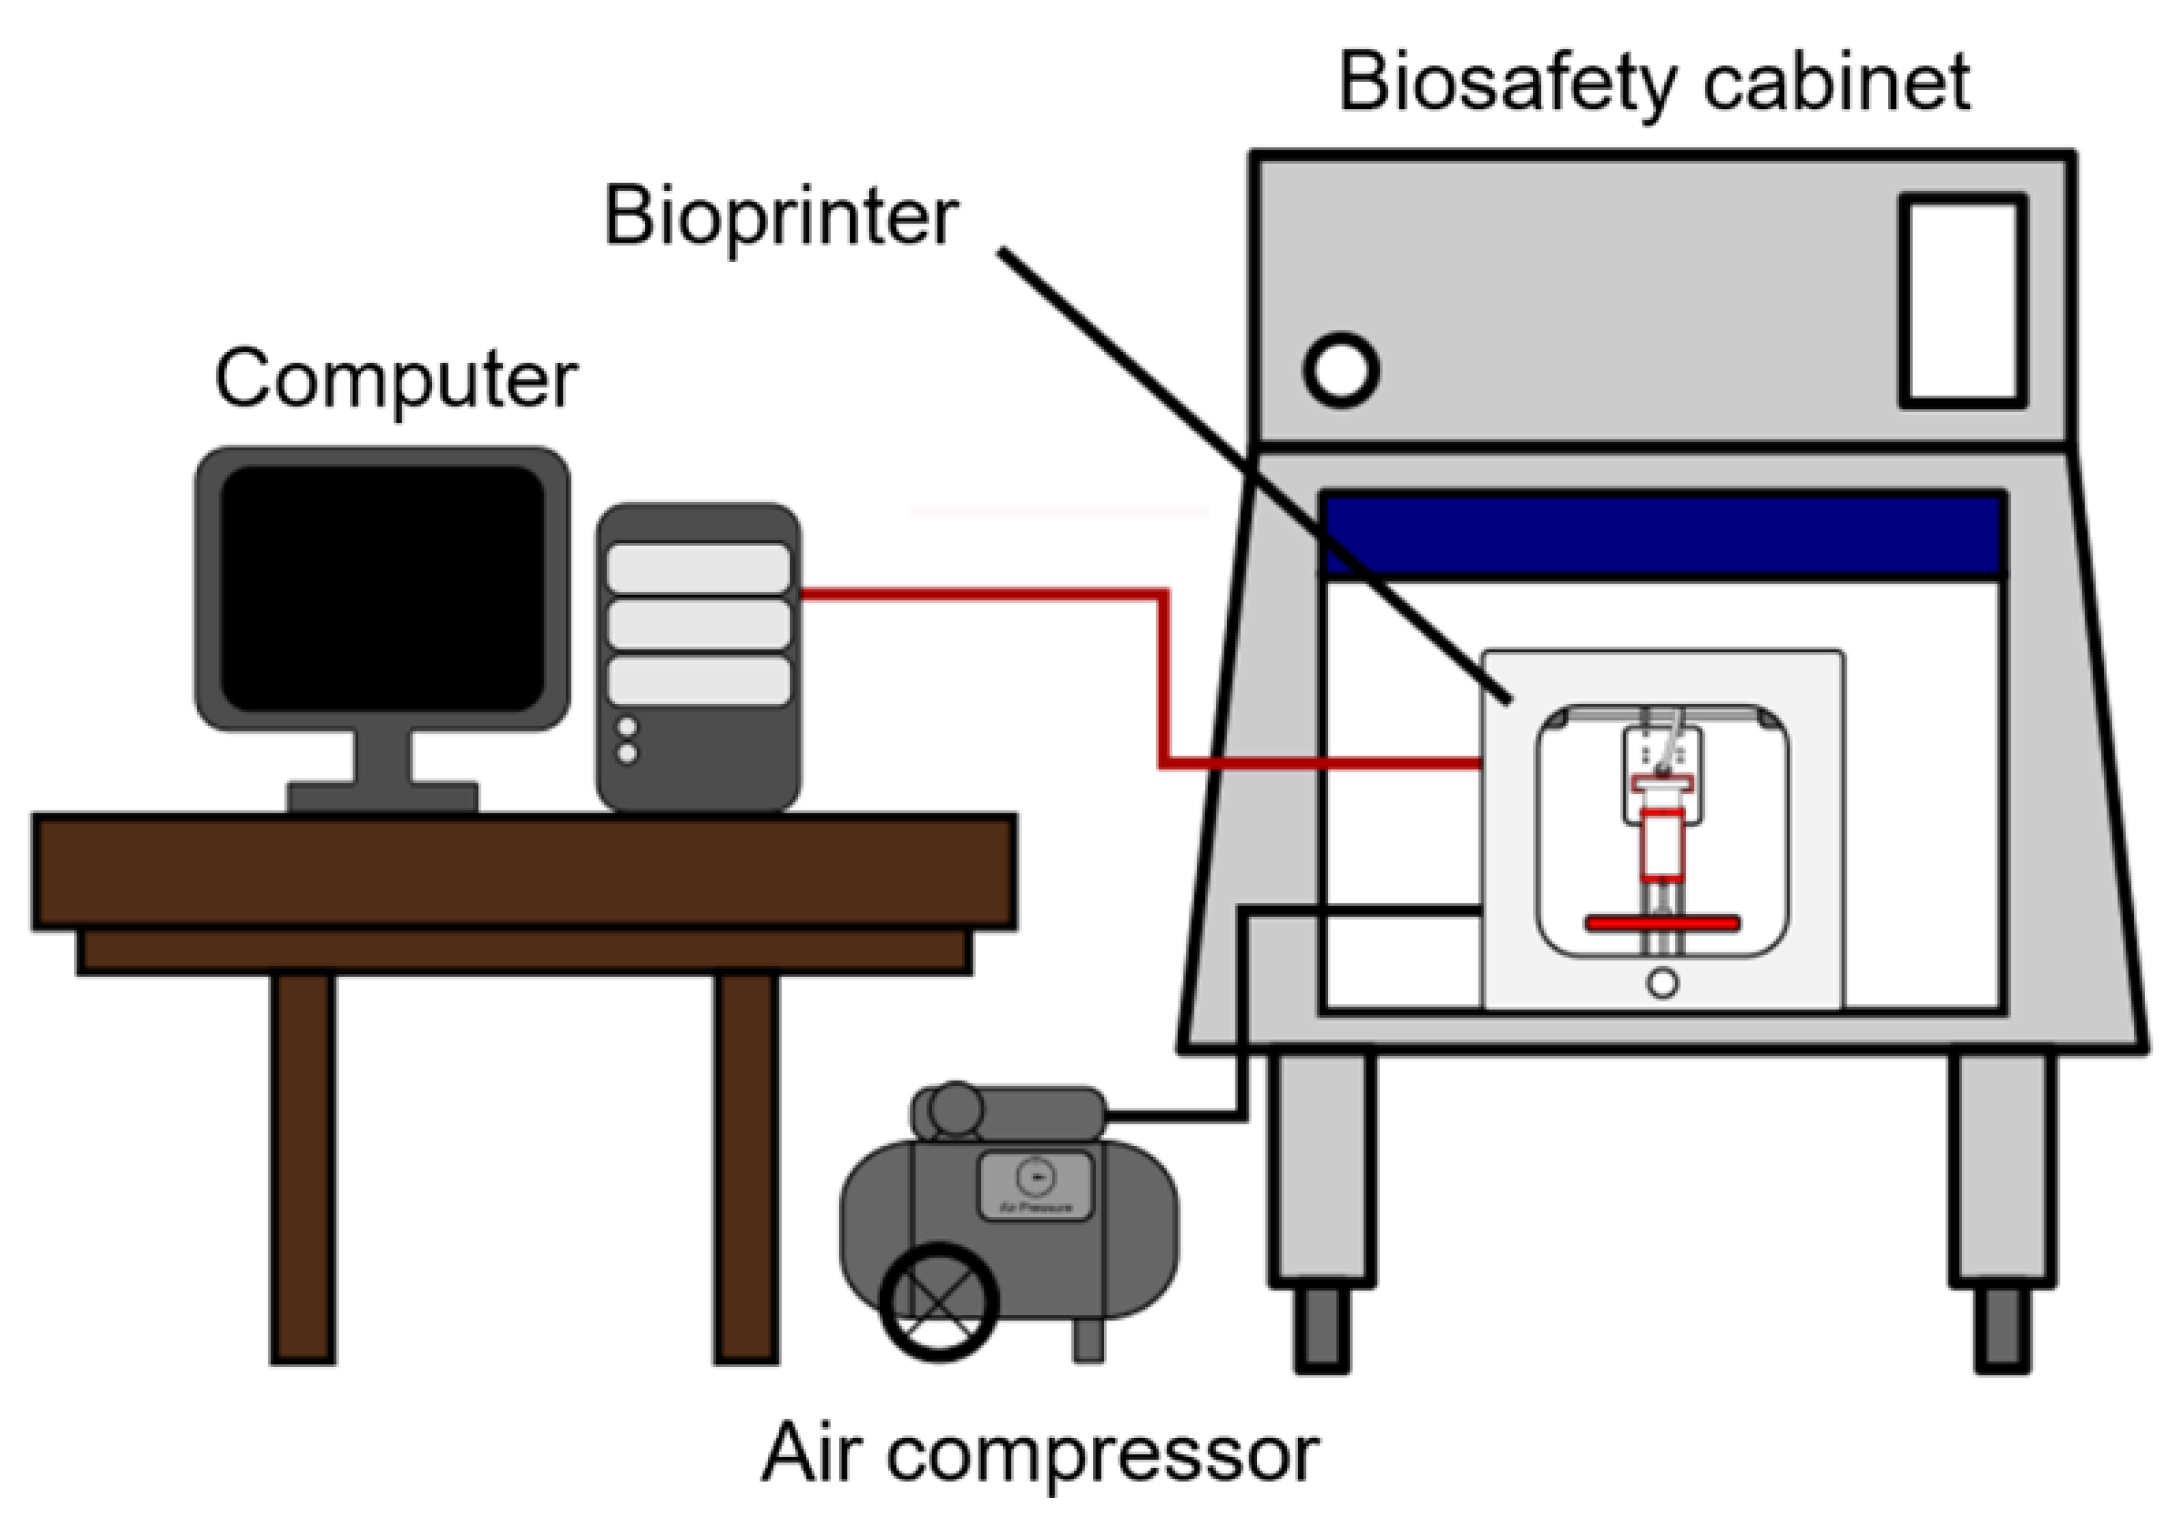
Bioprinting experiments were conducted using the extrusion-based bioprinting process (illustrated in Figure 3). The cartridge holds the bioink, and compressed air is used to extrude the bioink from the cartridge through the nozzle onto the printing platform. The thermal jacket controls the temperature of the bioink. Figure 4 illustrates the experimental setup. Allevi 1 bioprinter (Allevi Inc., Philadelphia, PA, USA) was used. The bioprinter was inside the biosafety cabinet. It was connected to a computer and an air compressor.

Figure 3.
Illustration of extrusion-based bioprinting.
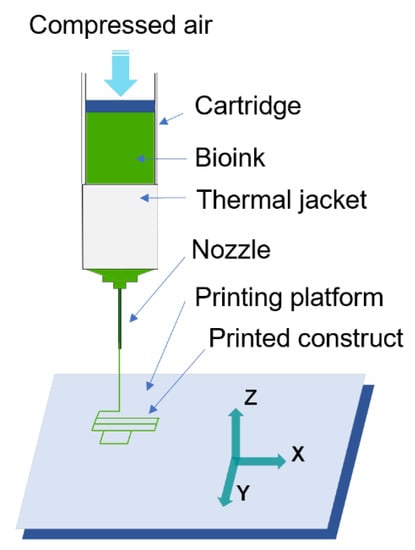
Figure 4.
Illustration of the experimental setup.
Allevi Bioprint software was used to set printing speed at 6 mm/s and extrusion temperature at 21 °C for all constructs. Each construct was individually printed inside a petri dish (Fisher Scientific, Waltham, MA, USA).
Figure 5 illustrates the process of layer-by-layer photo-crosslinking. UV lightbulbs contained in the print head of the bioprinter were used to photo-crosslink the constructs. After each layer of a construct was printed, UV light was shone on the constructs. Allevi Bioprint software was used to control the intensity of the UV light and the exposure time of each layer to UV light. UV light intensity was 7 mW/cm2, and exposed time was 15 s. The wavelength of the light emitted by the UV lightbulbs is 315 nm. The constructs were exposed to UV light for an additional 45 s after printing was complete to ensure full photo-crosslinking. After being photo-crosslinked, the printed constructs were ionically crosslinked with 100 millimolar CaCl2 for four minutes.
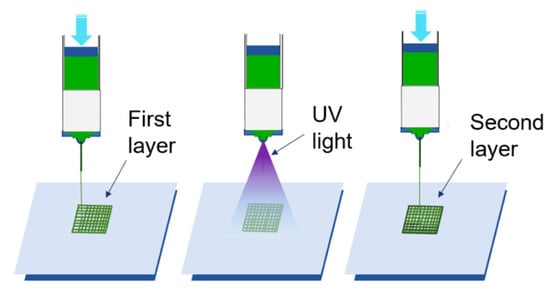
Figure 5.
Illustration of layer-by-layer photo-crosslinking using UV light.
2.5. Design of Experiments
The 23 (three variables, two levels, eight conditions) full factorial design was used for the experiments. Detailed description of factorial design can be found in many textbooks, such as the one by DeVor et al. [28].
The three variables are:
- Extrusion pressure: the pressure with which bioink is extruded through the nozzle while printing.
- Nozzle size: inner diameter of the nozzle used for printing.
- Bioink composition: the composition of bioink used for printing, i.e., the ratio of three major ingredients in the bioink (alginate:methylcellulose:GelMA).
Six replicate constructs were printed under each experiment condition (a unique combination of extrusion pressure, nozzle size, and bioink composition). Among these six replicates, three were used for shape fidelity measurements, and three were used for cell viability measurements.
This two-level factorial design was based on the assumption that the change of output variables is approximately linear when an input variable varies between the two levels. This assumption was reasonable in this study for two reasons. (1) The selected two levels are not too far from each other. Therefore, the change in perimeter deviation (or living cell concentration) is approximately linear when a variable (extrusion pressure, nozzle size, or bioink composition) varies from its low level to its high level. (2) In some of the authors’ previous green bioprinting experiments, one input variable was changed at a time. As an input variable changes, shape fidelity (or cell viability) changes approximately linearly. Some experiment results have been reported in a separate paper [25].
Table 2 shows the matrix of the experiments, and Table 3 lists the values at each level of the variables.
Table 2.
Matrix of experiments.
Table 3.
Values at each level of variables.
2.6. Shape Fidelity Measurement
For each experiment condition, three replicate constructs were used for shape fidelity measurements. After printing and crosslinking the constructs, the constructs were imaged using Dino-Lite AM73115MZT handheld microscope (Dino-Lite, Torrance, CA, USA) in conjunction with DinoCapture software. ImageJ software (ImageJ, Bethesda, MD, USA) was used to measure the perimeter (total length of the four edges of the construct on the top surface) for each construct image. The perimeter for each construct image was manually measured with the help of imageJ software. The length of the four edges on the top surface of each construct image was measured using the line length tool of ImageJ software. Shape fidelity was quantitatively evaluated using perimeter deviation—the deviation of the perimeter of the printed construct from the perimeter of the CAD model, 74 mm.
where P is measured perimeter.
2.7. Cell Viability Measurement
For each experiment condition, three replicate constructs were used for cell viability measurements, and cell growth was used to measure cell viability [29].
The initial cell concentration of each printed construct was 106 cells/mL. The initial cell concentration was measured with Auto T4 cell counter. The following procedure was used to evaluate final cell concentration of the algae cells in printed constructs.
- Step 1:
- A petri dish was weighed before printing. A construct was then printed inside the petri dish. The petri dish with the printed construct was weighed again. The difference of the two weight measurements determined the weight of the printed construct.
- Step 2:
- To allow the algae cells in the printed constructs to grow, the petri dishes with printed constructs described in step 1 were placed under lightbulbs (General Electric, Boston, MA, USA) for four days.
- Step 3:
- The constructs were transferred from the petri dishes to separate BD tubes (Becton Dickinson, Franklin Lakes, NJ, USA). Each BD tube contained 5 mL of a dissolving solution. The dissolving solution contained 0.9% NaCl (Sigma Aldrich, Saint Louis, MO, USA) and 55 millimolar of sodium citrate (Sigma Aldrich, Saint Louis, MO, USA) [4]. The BD tubes were put on a vortex mixer (Sigma Aldrich, Saint Louis, MO, USA) at 2000 rpm for 10 min to dissolve the constructs.
- Step 4:
- Auto T4 cell counter (Nexcelom, Lawrence, MA, USA) was used to measure the concentration of the algae cells in the dissolved constructs, according to the instructions from the cell counter manufacturer. A pipette (Rainin, Oakland, CA, USA) was used to insert 0.02 mL of solution into a chambered slide. The chambered slide was then inserted into the T4 cell counter. Before using the Auto T4 cell counter, the dead cells in the solution were stained blue, allowing them to be differentiated from living cells by the cell counter. To achieve this, some 0.2% trypan blue solution (Fisher Scientific, Waltham, MA, USA) was added to the BD tubes containing the dissolved constructs. The amount of trypan blue added to the BD tube equaled the volume of the solution already in the tube. The volume of each construct was determined using the weight of the construct, determined in step 1, and the density of the bioink.
- Step 5:
- Cell concentration of the printed constructs (four days post bioprinting) was calculated as follows.
3. Results and Discussion
3.1. Effects on Shape Fidelity
Table 4 shows the experimental data used for shape fidelity measurements. Table 5 is the ANOVA (analysis of variance) table of effects on perimeter deviation for the factorial design. The significant effects identified by the analysis are: extrusion pressure (A), nozzle size (B), bioink composition (C), two-factor interaction between nozzle size and bioink composition (BC), and three factor interaction between extrusion pressure, nozzle size, and bioink composition. Other interaction effects are not statistically significant at the significance level of 0.01. Only these significant effects will be presented in graphs and discussed below.
Table 4.
Experimental data for shape fidelity measurements (perimeter deviation).
Table 5.
ANOVA Table for effects on perimeter deviation (shape fidelity).
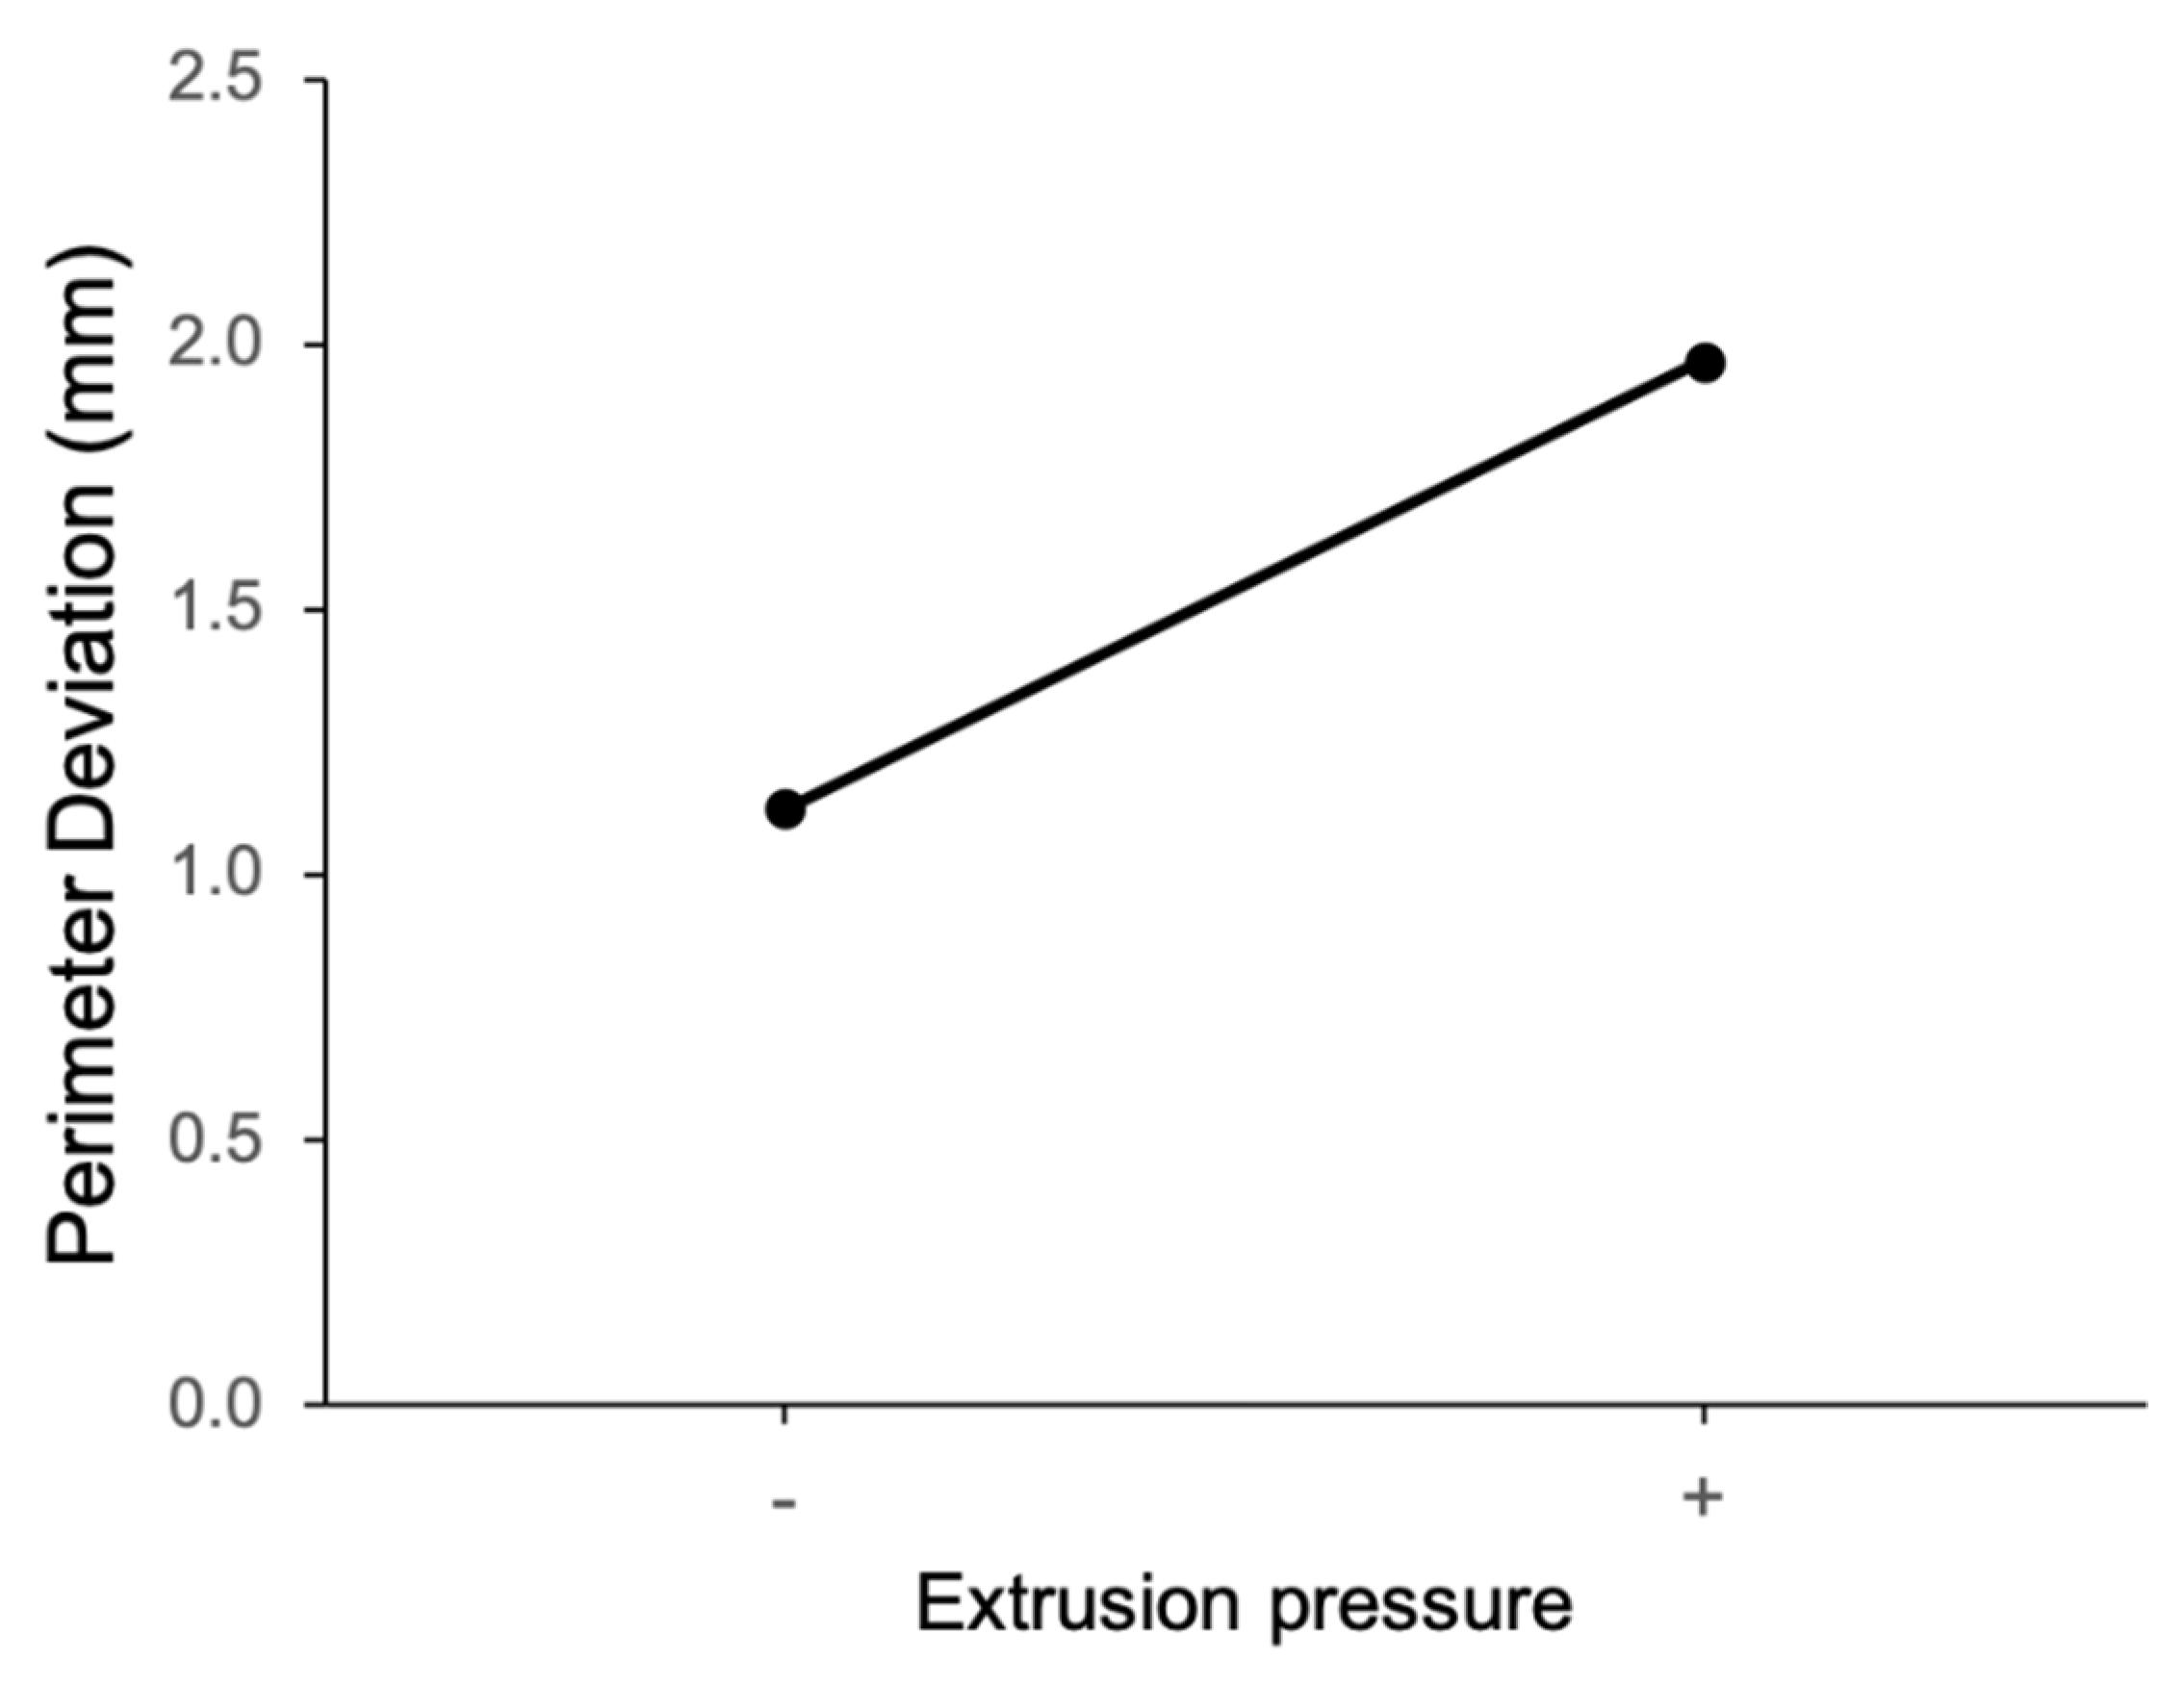
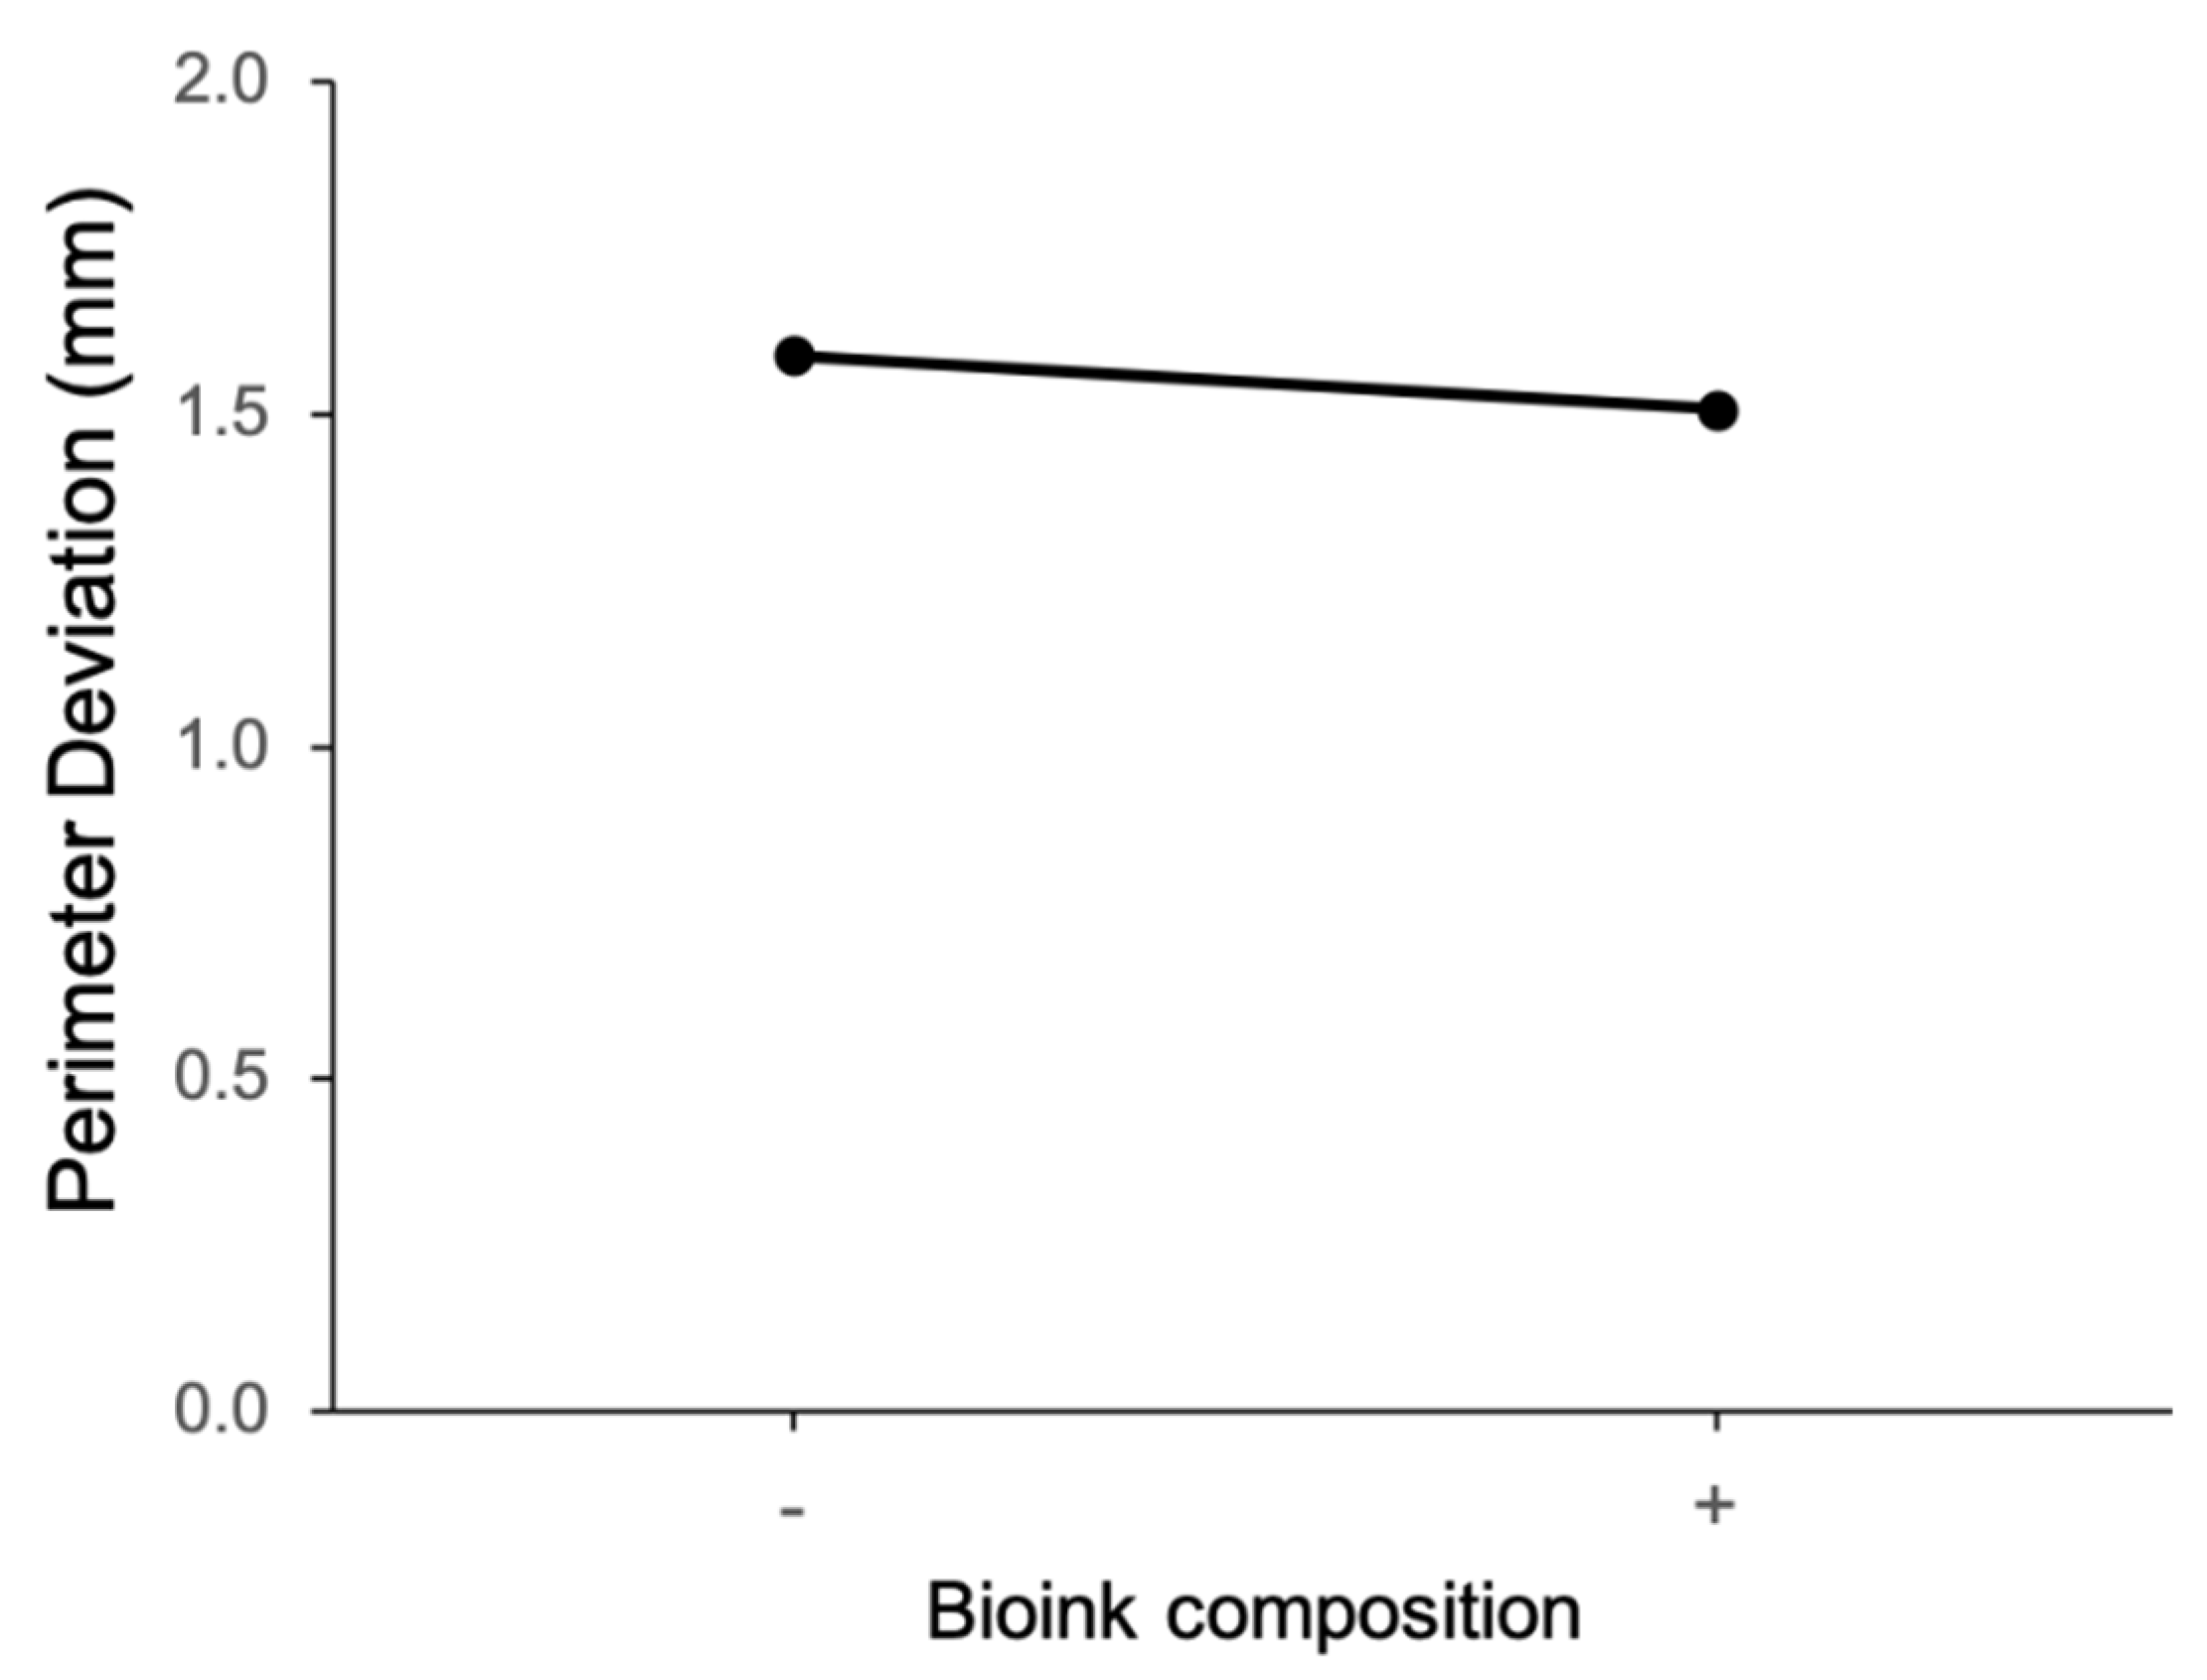
The main effect of extrusion pressure on perimeter deviation is shown in Figure 6. It can be observed that perimeter deviation is larger at the high level of extrusion pressure (50 psi). Figure 7 shows the main effect plot of the nozzle size on the perimeter deviation. The perimeter deviation is larger at the high level of nozzle size. From the main effect plot of bioink composition on perimeter deviation, as shown in Figure 8, it can be observed that, at the low level of bioink composition with the alginate:methylcellulose:GelMA ratio of 5:3:5 (% w/v), the perimeter deviation is higher.

Figure 6.
Main effect of extrusion pressure on perimeter deviation.
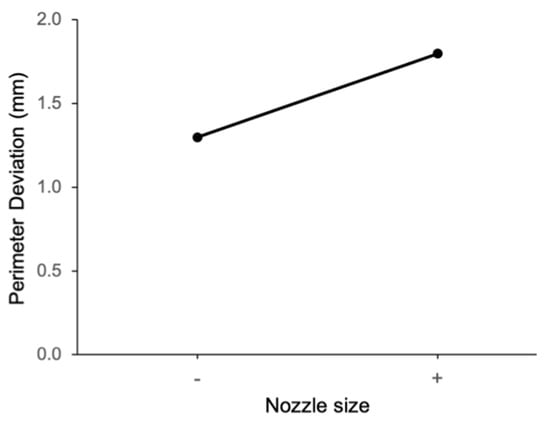
Figure 7.
Main effect of nozzle size on perimeter deviation.

Figure 8.
Main effect of bioink composition on perimeter deviation.
The above results regarding the main effects of extrusion pressure and nozzle size on shape fidelity are consistent with those reported by Cleymand et al. [30], MacCallum et al. [31], and Paxton et al. [32]. During printing, Cleymend et al. used acellular chitosan-guar gum hydrogel, MacCallum et al. used sodium alginate bioink containing neuron cells, and Paxton et al. used sodium alginate bioink containing stem cells.
However, the results regarding the main effect of the bioink composition on the shape fidelity are not consistent with those reported by Cleymand et al. [30], MacCallum et al. [31], and Wu et al. [33]. In Cleymand et al.’s study, they measured the shape fidelity of printed strands. As the concentration of chitosan-guar gum increased, the shape fidelity increased and then decreased. MacCallum et al. also measured the shape fidelity of printed strands in their study, and concluded that the shape fidelity decreased as the concentration of sodium alginate in the bioink decreased. Wu et al. printed hexagon shaped constructs using alginate-cellulose nanocrystal bioink containing liver cells. They found that shape fidelity decreased as the concentration of alginate-cellulose nanocrystal in the bioink decreased.
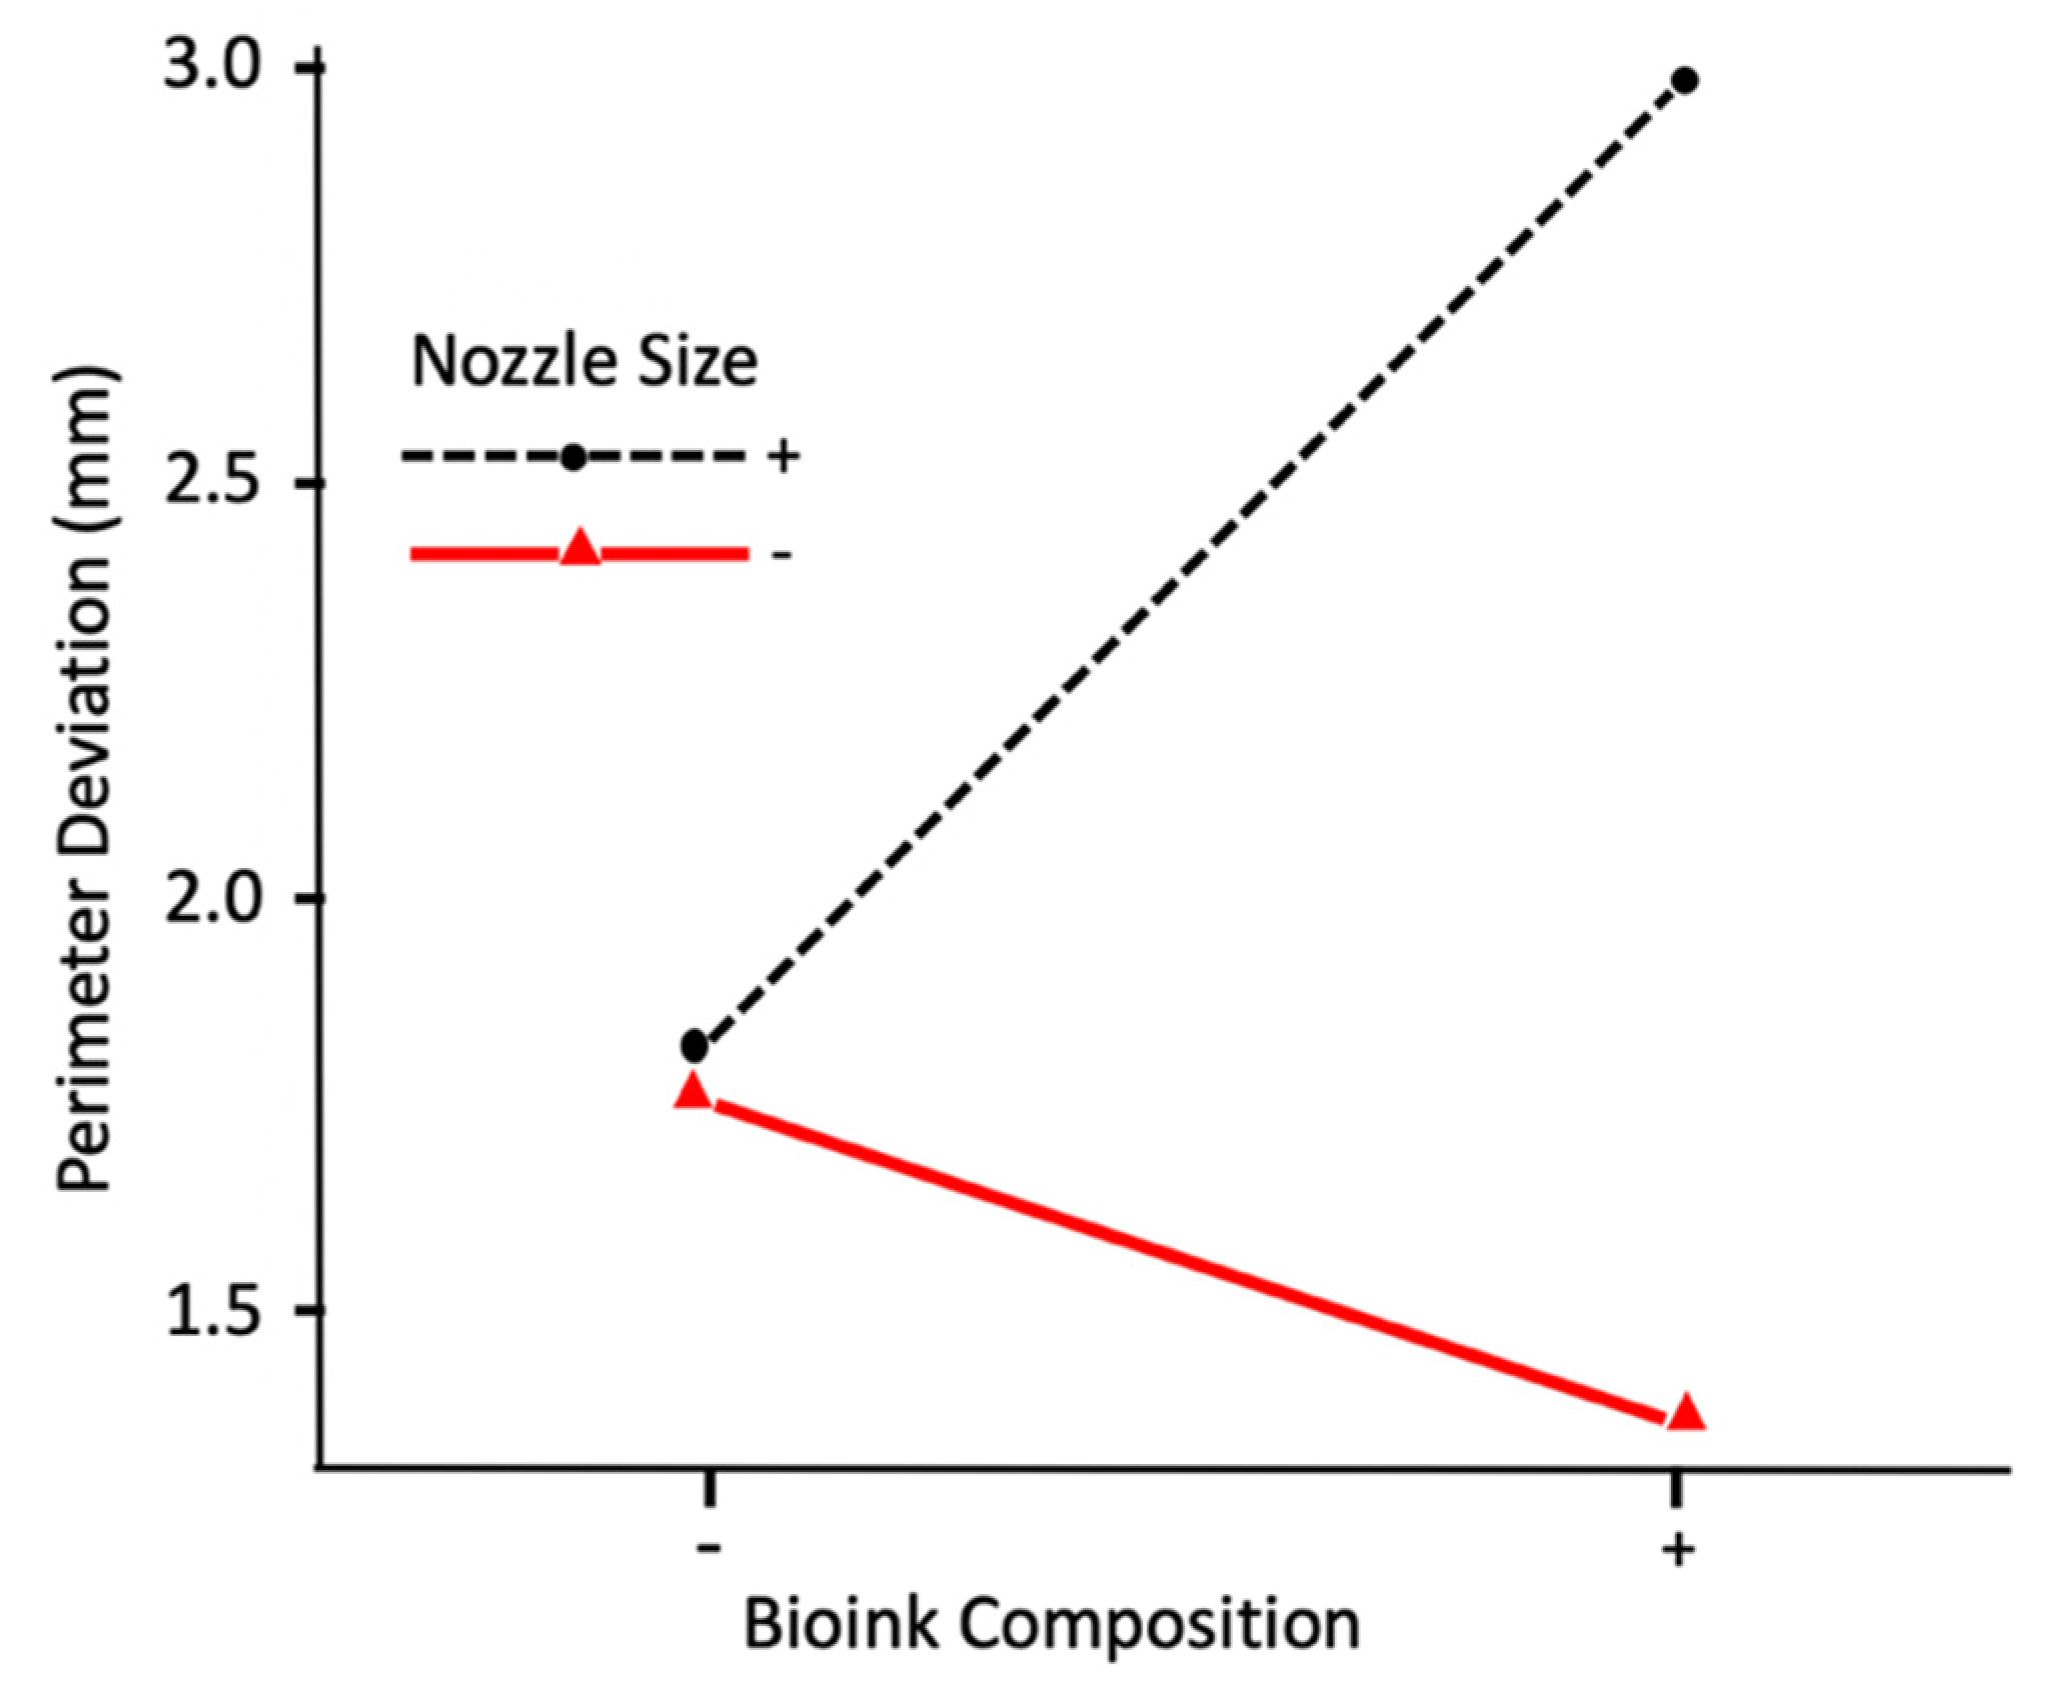
Figure 9 shows the interaction effect on perimeter deviation between bioink composition and nozzle size. It can be observed that, at the low level of nozzle size (0.2 mm diameter), the perimeter deviation is smaller at the high level of bioink composition (the alginate:methylcellulose:GelMA ratio of 5:1:5). However, at the high level of nozzle size (0.4 mm diameter), the perimeter deviation is larger at the high level of bioink composition. Figure 10 shows the interaction effect on perimeter deviation between the extrusion pressure, nozzle size, and bioink composition. It can be observed that, at the high level of nozzle size, as extrusion pressure changes from its low level to high level, perimeter deviation increases at the low level of bioink composition but decreases at the high level of bioink composition. At the low level of nozzle size, as extrusion pressure changes from its low level to high level, the perimeter deviation decreases at the low level of bioink composition but increases at the high level of bioink composition.
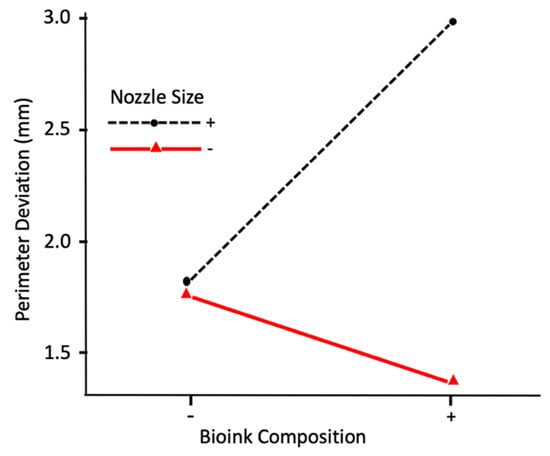
Figure 9.
Interaction effect on perimeter deviation between nozzle size and bioink composition.
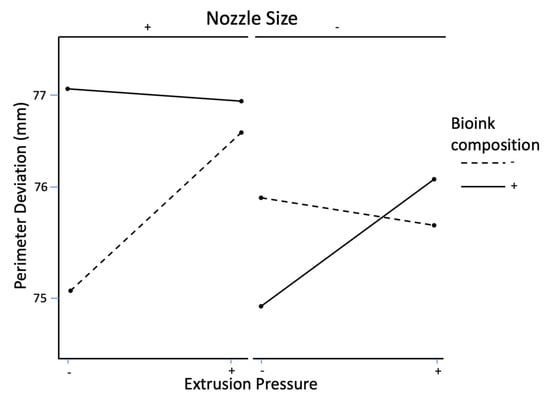
Figure 10.
Interaction effect on perimeter deviation of extrusion pressure, nozzle size, and bioink composition.
3.2. Effect on Cell Viability
Table 6 shows the experimental data used for living cell concentration measurements. Table 7 is the ANOVA (analysis of variance) table of effects on living cell concentration (cell viability) for the factorial design. The significant effects identified by the analysis are: extrusion pressure (A), nozzle size (B), and bioink composition (C). None of the interaction effects are statistically significant at the significance level of 0.01. Only these significant effects will be presented in graphs and discussed below.
Table 6.
Experimental data for cell viability measurements (living cell concentration).
Table 7.
ANOVA Table for effects on living cell concentration (cell viability).
Figure 11 shows the main effect plot of extrusion pressure on living cell concentration. It shows that, at the low level of extrusion pressure, the living cell concentration is higher, meaning that cell viability is higher. The main effect plot of the nozzle size on the living cell concentration in Figure 12 shows that, at the high level of nozzle size, the living cell concentration is higher. These results are consistent with those reported in a review paper by Boularaoui et al. [34]. These reported results were observed for alginate, collagen, and gelatin-based bioinks containing animal cells. The reported results are also consistent with studies performed by Thakare et al. [25] and Raveendran et al. [35]. Thakare et al. measured the cell viability of Chlamydomonas reinhardtii algae cells in alginate-methylcellulose bioink. Raveendran et al. measured the cell viability of ligament cells in GelMA bioink in constructs printed with extrusion-based bioprinting.
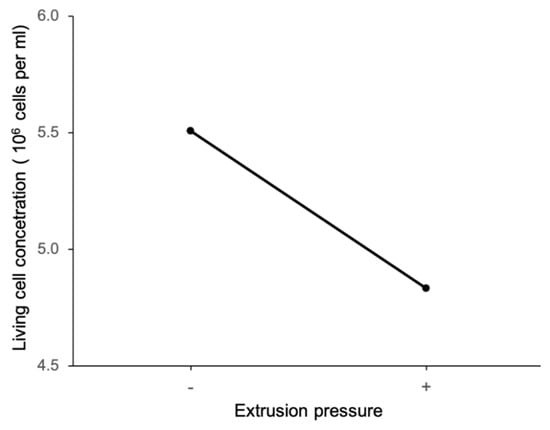
Figure 11.
Main effect of extrusion pressure on living cell concentration.
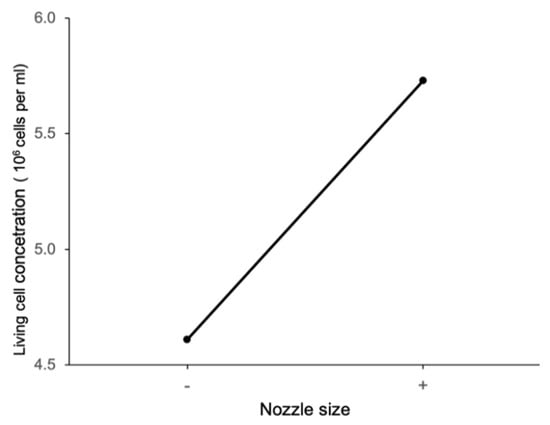
Figure 12.
Main effect of nozzle size on living cell concentration.
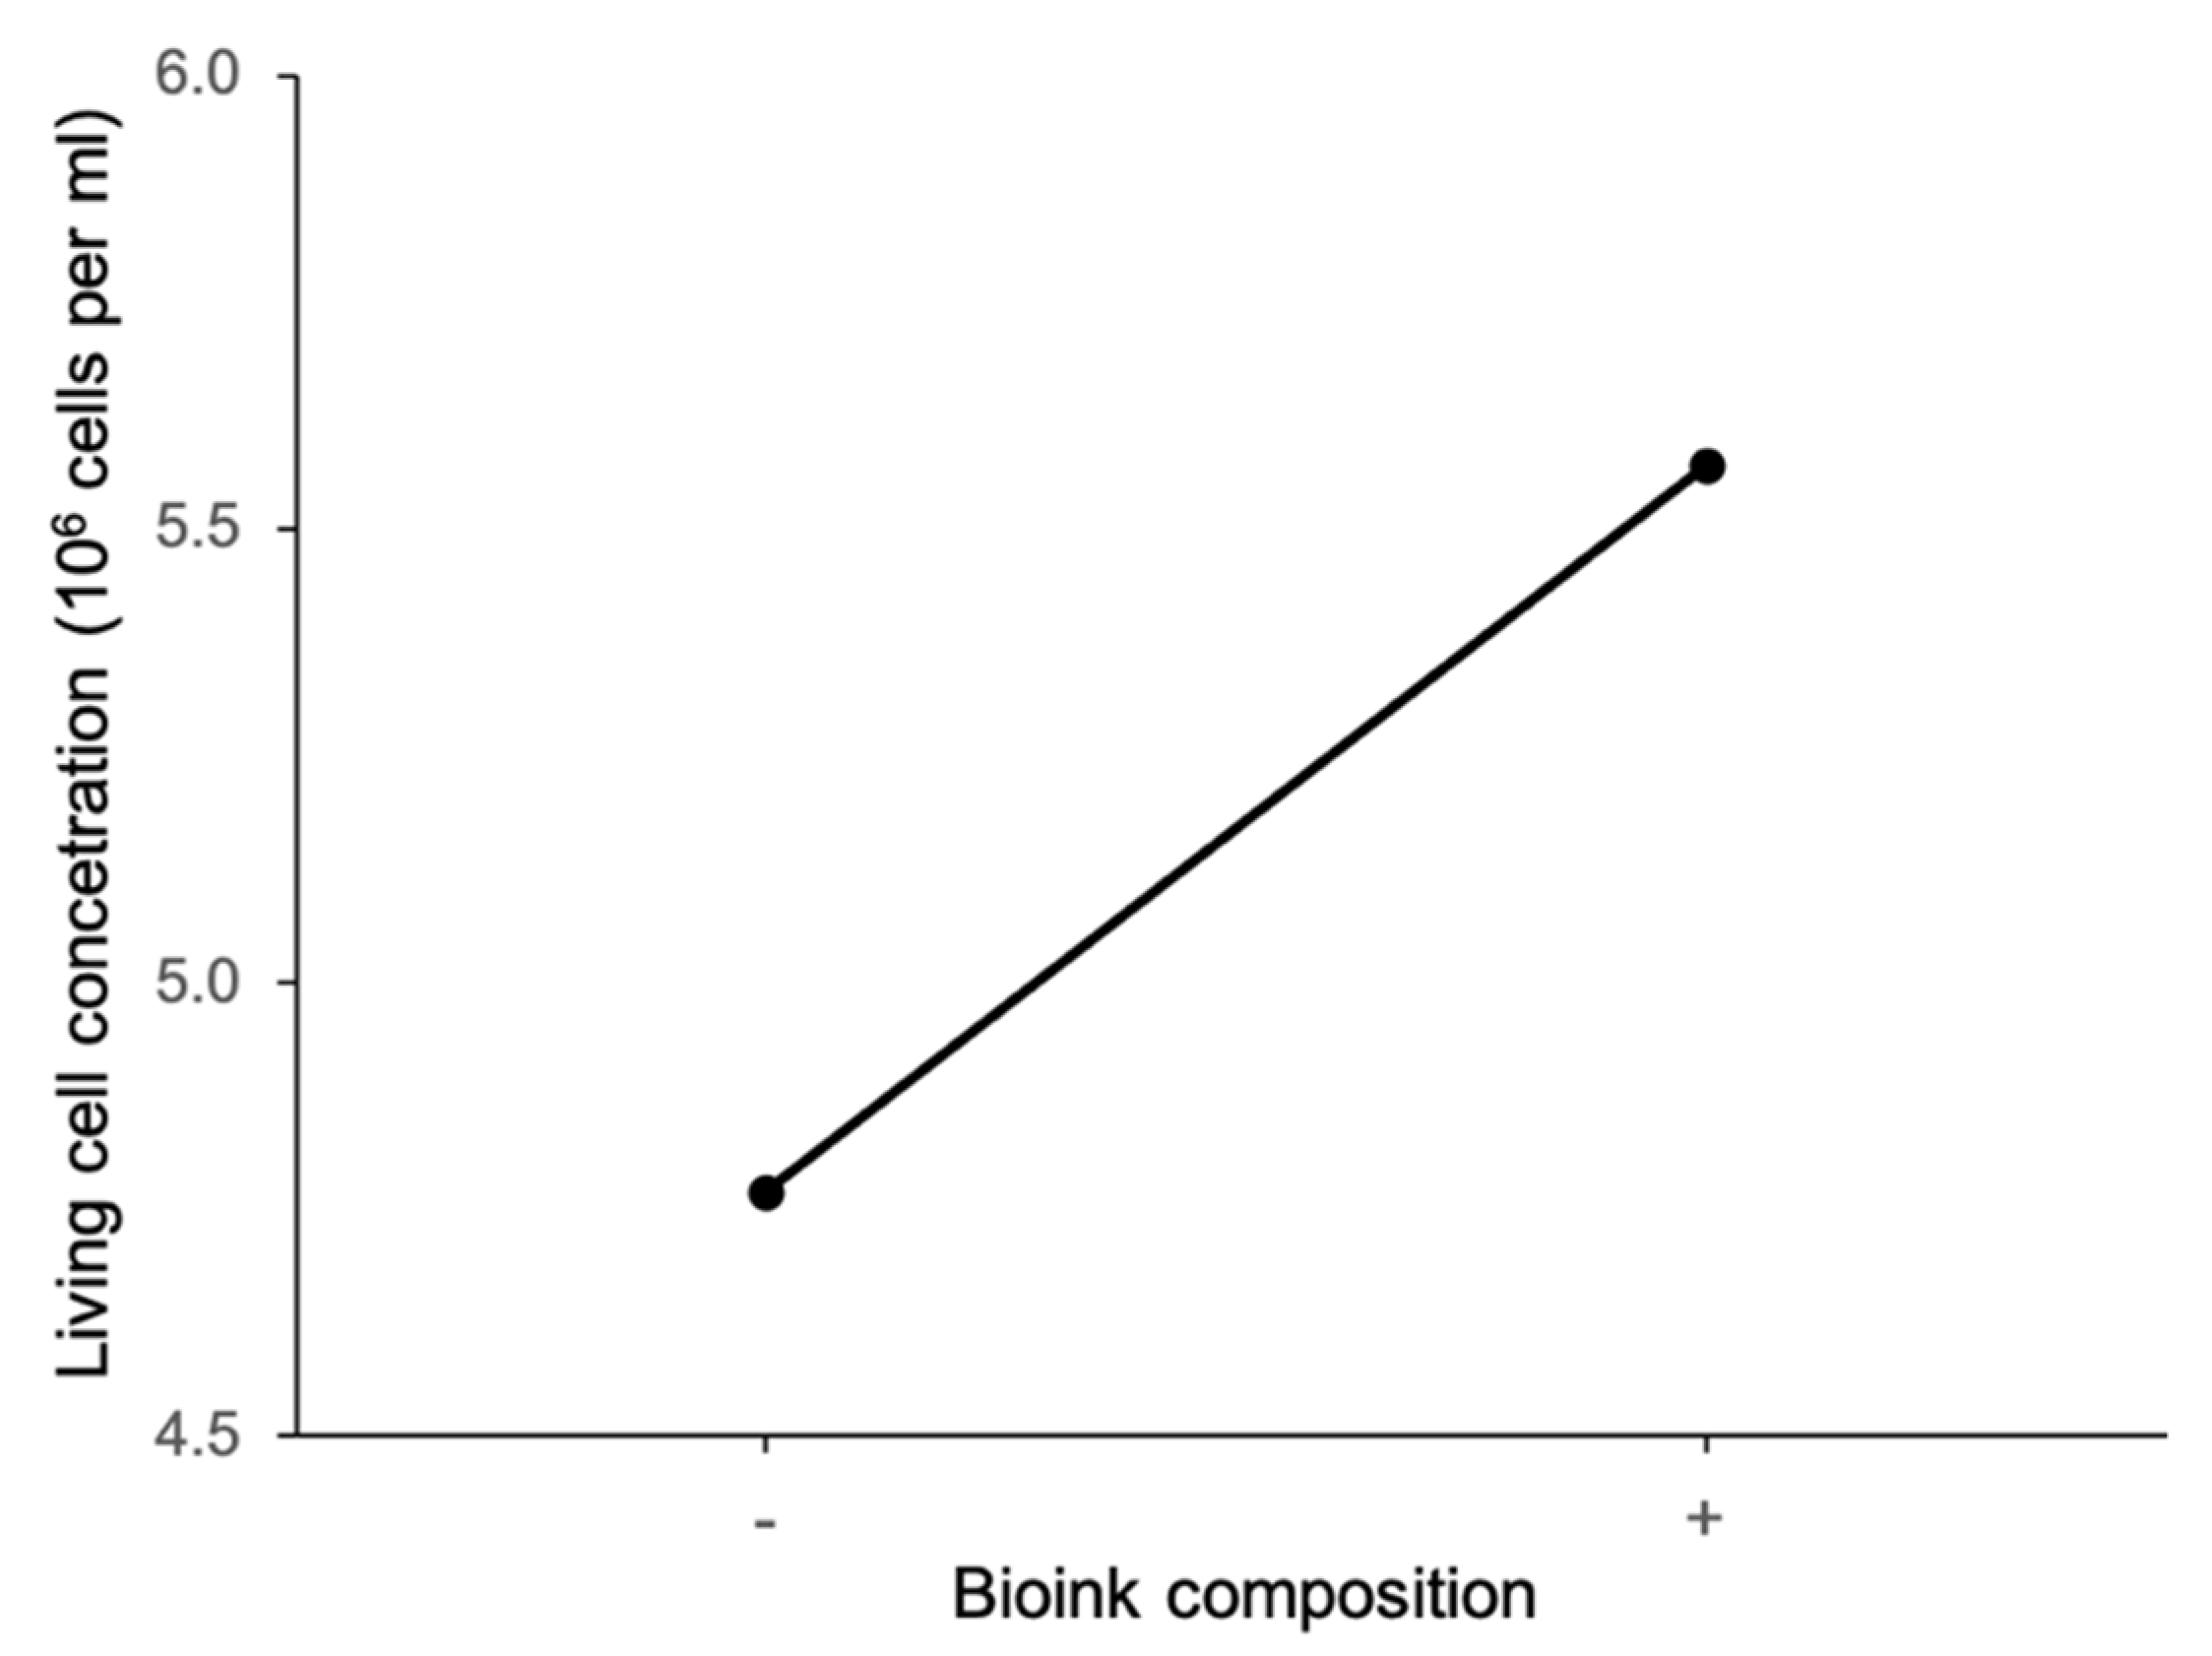
Figure 13 shows the main effect plot of bioink composition on living cell concentration. It can be seen that the living cell concentration is lower at the low level of bioink composition with the alginate:methylcellulose:GelMA ratio of 5:3:5 (% w/v) than that at the high level of bioink composition with the alginate:methylcellulose:GelMA ratio of 5:1:5 (% w/v). Note that bioink composition with the alginate:methylcellulose:GelMA ratio of 5:3:5 (% w/v) has higher viscosity. This trend is contrary to those reported by Zheng et al. [36], MacCallum et al. [31], and Fantini et al. [37]. Zheng et al. measured cell viability of stem cells in constructs printed with silk-polyethylene glycol bioink. Three different bioink compositions were used, and each bioink had either a low, intermediate, or high concentration of silk-polyethylene glycol. Bioinks with a higher ratio of silk-polyethylene glycol had higher viscosity. These researchers concluded that stem cells had the highest cell viability when bioink with a high viscosity was used for printing. MacCallum et al. printed sodium alginate bioink containing neuron cells, and concluded that the ratio of ingredients in the bioink did not affect cell viability. Fantini et al. printed sodium alginate-gelatin bioink containing stem cells, and reported that cell viability increased as the concentration of alginate and gelatin in the bioink increased. The bioinks with higher concentrations of alginate and gelatin also had higher viscosity. These contrary results suggest that bioink ingredients and cell types might respond differently to differences in bioink viscosity.

Figure 13.
Main effect of bioink composition on living cell concentration.
4. Concluding Remarks
Shape fidelity and cell viability were studied for alginate-methylcellulose-GelMA constructs printed by an extrusion-based bioprinter. Experiments were conducted according to a full factorial design with three variables (extrusion pressure, nozzle size, and bioink composition) and two levels. At the low levels of extrusion pressure and nozzle size, perimeter deviation of printed constructs from the perimeter of the CAD model is smaller, and therefore shape fidelity is higher. The perimeter deviation is lower (shape fidelity is higher) at the high level of bioink composition, i.e., with an alginate:methylcellulose:GelMA ratio of 5:1:5 (% w/v). At the significance level of 0.10, the interaction effect on perimeter deviation between bioink composition and nozzle size, and the interaction effect between the three variables are significant.
This study has revealed the main effects and interaction effects of extrusion pressure, nozzle size, and bioink composition on the shape fidelity and cell viability of printed constructs by applying layer-by-layer photo-crosslinking and using the alginate-methylcellulose-GelMA bioink containing algae cells. However, this study only covered three input variables. Additional experimentation is needed in order to determine the effects of other input variables, including extrusion temperature, printing speed, UV light intensity, and UV light exposure time. Furthermore, this study used perimeter deviation to evaluate shape fidelity. Although it is effective for this preliminary investigation, a more comprehensive evaluation of shape fidelity involving length deviation, thickness deviation, angle deviation, and internal feature quality (similar to the evaluation used in another study [38] should be beneficial.
The cell viability of printed constructs, determined by living cell concentration in the constructs four days post printing, is higher at the low level of extrusion pressure, the high level of nozzle size, and the high level of bioink composition, i.e., with the alginate:methylcellulose:GelMA ratio of 5:1:5 (% w/v). At the significance level of 0.10, none of the interaction effects on cell viability between variables are significant.
In the future, the effects of other printing variables should be studied on the shape fidelity and cell viability of alginate-methylcellulose-GelMA constructs. These printing variables include printing speed, extrusion temperature, UV intensity, and UV exposure time. Potential applications of printed constructs similar to those printed in this study include tissue engineering [2,3], producing metabolite [1,2,4,39], removing metal contaminants from water [5] and pollution from air [40], producing biofuels [41], and synthesizing food additives [42] and pharmaceuticals [4].
Author Contributions
Conceptualization, K.T., L.J., Z.P. and H.Q.; methodology, K.T. and L.J.; software, K.T.; validation, K.T. and L.J.; formal analysis, K.T. and L.J.; investigation, K.T. and L.J.; resources, K.T., L.J., Z.P. and H.Q.; data curation, K.T. and L.J.; writing—original draft preparation, K.T.; writing—review and editing, K.T., L.J., Z.P. and H.Q.; visualization, K.T. All authors have read and agreed to the published version of the manuscript.
Funding
This research received no external funding.
Data Availability Statement
Data are available upon reasonable request made to the authors.
Conflicts of Interest
The authors declare no conflict of interest.
References
- Balasubramanian, S.; Yu, K.; Meyer, A.S.; Karana, E.; Aubin-Tam, M. Bioprinting of Regenerative Photosynthetic Living Materials. Adv. Funct. Mater. 2021, 31, 2011162. [Google Scholar] [CrossRef]
- Lode, A.; Krujatz, F.; Brüggemeier, S.; Quade, M.; Schütz, K.; Knaack, S.; Weber, J.; Bley, T.; Gelinsky, M. Green bioprinting: Fabrication of photosynthetic algae-laden hydrogel scaffolds for biotechnological and medical applications. Eng. Life Sci. 2015, 15, 177–183. [Google Scholar] [CrossRef]
- Seidel, J.; Ahlfeld, T.; Adolph, M.; Kümmritz, S.; Steingroewer, J.; Krujatz, F.; Bley, T.; Gelinsky, M.; Lode, A. Green bioprinting: Extrusion-based fabrication of plant cell-laden biopolymer hydrogel scaffolds. Biofabrication 2017, 9, 045011. [Google Scholar] [CrossRef] [PubMed] [Green Version]
- Krujatz, F.; Lode, A.; Brüggemeier, S.; Schütz, K.; Kramer, J.; Bley, T.; Gelinsky, M.; Weber, J. Green bioprinting: Viability and growth analysis of microalgae immobilized in 3D-plotted hydrogels versus suspension cultures. Eng. Life Sci. 2015, 15, 678–688. [Google Scholar] [CrossRef]
- Thakare, K.; Jerpseth, L.; Pei, Z.; Tomlin, B.; Qin, H. Three-Dimensional Printing of Hydrogel Filters Containing Algae Cells for Copper Removal From Contaminated Water. J. Manuf. Sci. Eng. 2021, 143, 104502. [Google Scholar] [CrossRef]
- Ouyang, L.; Yao, R.; Zhao, Y.; Sun, W. Effect of bioink properties on printability and cell viability for 3D bioplotting of embryonic stem cells. Biofabrication 2016, 8, 035020. [Google Scholar] [CrossRef]
- Ozbolat, I.T. Bioprinting scale-up tissue and organ constructs for transplantation. Trends Biotechnol. 2015, 33, 395–400. [Google Scholar] [CrossRef]
- Ribeiro, A.; Blokzijl, M.M.; Levato, R.; Visser, C.W.; Castilho, M.; Hennink, W.E.; Vermonden, T.; Malda, J. Assessing bioink shape fidelity to aid material development in 3D bioprinting. Biofabrication 2017, 10, 014102. [Google Scholar] [CrossRef]
- Schwab, A.; Levato, R.; D’Este, M.; Piluso, S.; Eglin, D.; Malda, J. Printability and shape fidelity of bioinks in 3D bioprinting. Chem. Rev. 2020, 120, 11028–11055. [Google Scholar] [CrossRef]
- Lepowsky, E.; Muradoglu, M.; Tasoglu, S. Towards preserving post-printing cell viability and improving the resolution: Past, present, and future of 3D bioprinting theory. Bioprinting 2018, 11, e00034. [Google Scholar] [CrossRef]
- Nair, K.; Gandhi, M.; Khalil, S.; Yan, K.C.; Marcolongo, M.; Barbee, K.; Sun, W. Characterization of cell viability during bioprinting processes. Biotechnol. J. Healthc. Nutr. Technol. 2009, 4, 1168–1177. [Google Scholar] [CrossRef] [PubMed]
- Stoddart, M.J. Cell viability assays: Introduction. Mamm. Cell Viability 2011, 740, 1–6. [Google Scholar]
- Ozbolat, I.T.; Hospodiuk, M. Current advances and future perspectives in extrusion-based bioprinting. Biomaterials 2015, 76, 321–343. [Google Scholar] [CrossRef] [PubMed] [Green Version]
- Bonatti, A.F.; Chiesa, I.; Vozzi, G.; De Maria, C. Open-source CAD-CAM simulator of the extrusion-based bioprinting process. Bioprinting 2021, 24, e00172. [Google Scholar] [CrossRef]
- Ashammakhi, N.; GhavamiNejad, A.; Tutar, R.; Fricker, A.; Roy, I.; Chatzistavrou, X.; Hoque Apu, E.; Nguyen, K.L.; Ahsan, T.; Pountos, I.; et al. Highlights on advancing frontiers in tissue engineering. Tissue Eng. Part B Rev. 2021. [Google Scholar] [CrossRef] [PubMed]
- Ji, S.; Guvendiren, M. Recent advances in bioink design for 3D bioprinting of tissues and organs. Front. Bioeng. Biotechnol. 2017, 5, 23. [Google Scholar] [CrossRef] [Green Version]
- Schmidleithner, C.; Kalaskar, D.M. Stereolithography; IntechOpen: Rijeka, Croatia, 2018. [Google Scholar]
- Thakare, K.; Jerpseth, L.; Pei, Z.; Elwany, A.; Quek, F.; Qin, H. Bioprinting of Organ-on-Chip Systems: A Literature Review from a Manufacturing Perspective. J. Manuf. Mater. Processing 2021, 5, 91. [Google Scholar] [CrossRef]
- GhavamiNejad, A.; Ashammakhi, N.; Wu, X.Y.; Khademhosseini, A. Crosslinking strategies for 3D bioprinting of polymeric hydrogels. Small 2020, 16, 2002931. [Google Scholar] [CrossRef]
- Coohill, T.P. Action spectra revisited. J. Photochem. Photobiol. B Biol. 1992, 13, 95–98. [Google Scholar] [CrossRef]
- Caldwell, M.M.; Camp, L.B.; Warner, C.W.; Flint, S.D. Action Spectra and Their Key Role in Assessing Biological Consequences of Solar UV-B Radiation Change; Springer: Berlin/Heidelberg, Germany, 1986; pp. 87–111. [Google Scholar]
- Hollósy, F. Effects of ultraviolet radiation on plant cells. Micron 2002, 33, 179–197. [Google Scholar] [CrossRef]
- Knowlton, S.; Yenilmez, B.; Anand, S.; Tasoglu, S. Photocrosslinking-based bioprinting: Examining crosslinking schemes. Bioprinting 2017, 5, 10–18. [Google Scholar] [CrossRef]
- Trachtenberg, J.E.; Placone, J.K.; Smith, B.T.; Piard, C.M.; Santoro, M.; Scott, D.W.; Fisher, J.P.; Mikos, A.G. Extrusion-based 3D printing of poly (propylene fumarate) in a full-factorial design. ACS Biomater. Sci. Eng. 2016, 2, 1771–1780. [Google Scholar] [CrossRef] [PubMed]
- Thakare, K.; Jerpseth, L.; Qin, H.; Pei, Z. Bioprinting Using Algae: Effects of Extrusion Pressure and Needle Diameter on Cell Quantity in Printed Samples. J. Manuf. Sci. Eng. 2021, 143, 014501. [Google Scholar] [CrossRef]
- Hospodiuk, M.; Dey, M.; Sosnoski, D.; Ozbolat, I.T. The bioink: A comprehensive review on bioprintable materials. Biotechnol. Adv. 2017, 35, 217–239. [Google Scholar] [CrossRef] [PubMed] [Green Version]
- Taubner, T.; Marounek, M.; Synytsya, A. Preparation and characterization of amidated derivatives of alginic acid. Int. J. Biol. Macromol. 2017, 103, 202–207. [Google Scholar] [CrossRef]
- DeVor, R.E.; Chang, T.-h.; Sutherland, J.W. Statistical Quality Design and Control: Contemporary Concepts and Methods; Pearson College Division: Engelwood Cliffs, NJ, USA, 2007. [Google Scholar]
- Riss, T.L.; Moravec, R.A.; Niles, A.L.; Duellman, S.; Benink, H.A.; Worzella, T.J.; Minor, L. Cell Viability Assays. Assay Guidance Manual [Internet]. 2016. Available online: https://www.ncbi.nlm.nih.gov/books/NBK144065/ (accessed on 22 February 2022).
- Cleymand, F.; Poerio, A.; Mamanov, A.; Elkhoury, K.; Ikhelf, L.; Jehl, J.-P.; Kahn, C.J.; Poncot, M.; Arab-Tehrany, E.; Mano, J.F. Development of novel chitosan/guar gum inks for extrusion-based 3D bioprinting: Process, printability and properties. Bioprinting 2021, 21, e00122. [Google Scholar] [CrossRef]
- MacCallum, B.; Naseri, E.; Butler, H.; MacNevin, W.; Tasker, R.; Ahmadi, A. Development of a 3D bioprinting system using a Co-Flow of calcium chloride mist. Bioprinting 2020, 20, e00085. [Google Scholar] [CrossRef]
- Paxton, N.; Smolan, W.; Böck, T.; Melchels, F.; Groll, J.; Jungst, T. Proposal to assess printability of bioinks for extrusion-based bioprinting and evaluation of rheological properties governing bioprintability. Biofabrication 2017, 9, 044107. [Google Scholar] [CrossRef]
- Wu, Y.; Lin, Z.Y.W.; Wenger, A.C.; Tam, K.C.; Tang, X.S. 3D bioprinting of liver-mimetic construct with alginate/cellulose nanocrystal hybrid bioink. Bioprinting 2018, 9, 1–6. [Google Scholar] [CrossRef] [Green Version]
- Boularaoui, S.; Al Hussein, G.; Khan, K.A.; Christoforou, N.; Stefanini, C. An overview of extrusion-based bioprinting with a focus on induced shear stress and its effect on cell viability. Bioprinting 2020, 20, e00093. [Google Scholar] [CrossRef]
- Raveendran, N.T.; Vaquette, C.; Meinert, C.; Ipe, D.S.; Ivanovski, S. Optimization of 3D bioprinting of periodontal ligament cells. Dent. Mater. 2019, 35, 1683–1694. [Google Scholar] [CrossRef] [PubMed]
- Zheng, Z.; Wu, J.; Liu, M.; Wang, H.; Li, C.; Rodriguez, M.J.; Li, G.; Wang, X.; Kaplan, D.L. 3D bioprinting of self-standing silk-based bioink. Adv. Healthc. Mater. 2018, 7, 1701026. [Google Scholar] [CrossRef] [PubMed]
- Fantini, V.; Bordoni, M.; Scocozza, F.; Conti, M.; Scarian, E.; Carelli, S.; Di Giulio, A.M.; Marconi, S.; Pansarasa, O.; Auricchio, F. Bioink composition and printing parameters for 3D modeling neural tissue. Cells 2019, 8, 830. [Google Scholar] [CrossRef] [PubMed] [Green Version]
- Thakare, K.; Jerpseth, L.; Qin, H.; Pei, Z. Applying Layer-by-layer Photo-crosslinking in Green Bioprinting: Shape Fidelity and Cell Viability of Printed Hydrogel Constructs Containing Algae Cells. J. Manuf. Sci. Eng. 2022; accepted. [Google Scholar]
- Varma, A.; Gemeda, H.B.; McNulty, M.J.; McDonald, K.A.; Nandi, S.; Knipe, J.M. Bioprinting transgenic plant cells for production of a recombinant biodefense agent. bioRxiv 2021. [Google Scholar] [CrossRef]
- Malik, S.; Hagopian, J.; Mohite, S.; Lintong, C.; Stoffels, L.; Giannakopoulos, S.; Beckett, R.; Leung, C.; Ruiz, J.; Cruz, M.; et al. Robotic Extrusion of Algae-Laden Hydrogels for Large-Scale Applications. Glob. Chall. 2020, 4, 1900064. [Google Scholar] [CrossRef] [PubMed]
- Menetrez, M.Y. An overview of algae biofuel production and potential environmental impact. Environ. Sci. Technol. 2012, 46, 7073–7085. [Google Scholar] [CrossRef]
- Vancauwenberghe, V.; Mbong, V.B.M.; Vanstreels, E.; Verboven, P.; Lammertyn, J.; Nicolai, B. 3D printing of plant tissue for innovative food manufacturing: Encapsulation of alive plant cells into pectin based bio-ink. J. Food Eng. 2019, 263, 454–464. [Google Scholar] [CrossRef]


Publisher’s Note: MDPI stays neutral with regard to jurisdictional claims in published maps and institutional affiliations. |
© 2022 by the authors. Licensee MDPI, Basel, Switzerland. This article is an open access article distributed under the terms and conditions of the Creative Commons Attribution (CC BY) license (https://creativecommons.org/licenses/by/4.0/).