Article

Mechanical Analysis of Parameter Variations in Large-Scale Extrusion Additive Manufacturing of Thermoplastic Composites

1
Chair of Carbon Composites, Department of Mechanical Engineering, TUM School of Engineering and Design, Technical University of Munich, Boltzmannstraße 15, 85748 Garching bei München, Germany
2
New Technologies and China, BMW Group, Petuelring 130, 80788 Munich, Germany
*
Author to whom correspondence should be addressed.
J. Manuf. Mater. Process. 2022, 6(2), 36; https://doi.org/10.3390/jmmp6020036
Submission received: 15 February 2022 / Revised: 9 March 2022 / Accepted: 11 March 2022 / Published: 16 March 2022
(This article belongs to the Topic Additive Manufacturing)

Abstract

:
Large structural parts manufactured by Extrusion Additive Manufacturing (EAM) are limited by strong anisotropy due to insufficient bond formation and reduced molecular entanglement along the layer interface. To understand the correlation between process and material parameters and to enable digital modeling of EAM, the effect of different substrate temperatures and layer heights on tensile strength was investigated. A simple testing methodology for pelletized carbon fiber-filled polyamide 6 was developed. Tensile tests were performed in a full factorial Design of Experiments (DoE) to determine the tensile properties. For bulk simulation, the nominal strength and modulus were also determined based on contact width obtained by optical microscopy. The results demonstrated high anisotropy, with the maximum transverse tensile strength reaching only 27% of the corresponding longitudinal results and the transverse tensile modulus reaching only 20% of its longitudinal value. The effects of varying layer height were less significant than varying substrate temperature. The results support the hypothesis that sufficient transverse tensile strength is achieved between the extrapolated crystallization onset and melt temperature. The methodology of this study can be used as a benchmark method to qualify new thermoplastic polymers for EAM processes and to determine optimal process parameters for improved fusion bonding.

1. Introduction

The rapid growth in the use of Additive Manufacturing (AM) in industrial applications has led to increased demand in structural AM applications. To enable Extrusion Additive Manufacturing (EAM) for large-scale industrial applications, the BMW Group has developed the Freeform Extrusion Additive Manufacturing (FEAM) technology. FEAM is a robot-based large-format deposition system with significantly higher deposition rates and strand dimensions than in conventional Fused Filament Fabrication (FFF) printers. To overcome limits of FFF build rates due to limited material heating, positioning and extrusion [1,2], the feedstock was changed to pellet form, which significantly reduced material costs. Instead of a filament feeding system as used in FFF, EAM relies on single-screw extruders to melt the pelletized feedstock and to convey the melt to the deposition nozzle, as presented in the conceptual illustration in Figure 1. This study relates the material and process parameters of FEAM to the challenges of layer-by-layer manufacturing and mechanical part performance. Since the interlayer strength and the corresponding anisotropy are the main drawback of extrusion additive manufacturing, it is also a promising lever for optimization.
Researchers have found the directional bias of mechanical properties to be significant for all types of layer-by-layer manufacturing, with the build direction being the weakest load orientation [2,3]. The interface between successive layers is similar to weld lines in injection molding, where two different polymer fronts meet and form a morphology different and inferior to that of the bulk due to less molecular entanglement [4]. While conventional FFF parts contain multiple strand and infill orientations that compensate for the anisotropy to some extent, FEAM tends to build highly oriented thin-walled structures that can be modeled only with data collected by equally highly oriented mechanical testing. To achieve higher mechanical performance, the semi-crystalline thermoplastic is reinforced with chopped carbon fibers that increase the stiffness and reduce the coefficient of thermal expansion [5,6], reducing the tendency for warpage and distortion [7]. While traditional composites often fail due to inhomogeneous fiber volume fractions, fiber orientation angles and fiber matrix interfaces [6], AM composite parts demonstrate incomplete fusion bonding across the layer interface as a major deficiency [2,3,8]. To optimize the process parameters for bond formation across the interface, a thorough methodology to qualify new materials for the FEAM process is also required.
In an initial attempt to reduce the effort in finding suitable temperature ranges for FEAM, a thermal analysis was used to narrow down the process window based on the characteristic temperatures of the material [9]. The study indicates that satisfactory fusion bonding occurs at substrate temperatures between the extrapolated onset of crystallization and the melting temperature. Based on this temperature range, a thorough mechanical investigation is required to understand the influence of various processing parameters on the mechanical strength and modulus of EAM parts.
A variety of mechanical tests have been conducted in research to characterize additively manufactured parts. Adhesion in PA6 samples has been tested using Double Cantilever Beam (DCB) tests [10], while others have used 3-point bending tests on directly fabricated FFF specimens [11,12]. Rodriguez et al. [13] tested directly manufactured FFF samples from ABS in different load orientations and verified large anisotropies. Duty et al. [2] and Ning et al. [14] also utilized tensile tests for the characterization of carbon fiber-reinforced FFF samples and achieved only a quarter of the strength in the transverse direction compared to the longitudinal load direction. While tensile test specimens fail considerably faster than samples under compressive loads [3], tensile tests are often easier and faster to manufacture and allow for thin-walled and highly oriented testing analogous to the thin-walled build structure in FEAM. If compressive strength values are required, they can be estimated at around twice the strength determined through tensile tests [3]. In FFF studies, dog bone specimens have often been used for tensile testing. For large-scale applications, direct fabrication is not an option, as deposition rates require greater layer times and longer paths. As water jetting or similar processes are required to cut dog bone structures from larger EAM sheets, the authors suggest specimens according to composite tests standard DIN EN ISO 527-4 [15], which can be prepared much more easily and quickly due to their rectangular shape.
While all process parameters have an influence on the final morphology and mechanical properties [7], temperature conditions and layer height are particularly impactful. Fusion bonding in semi-crystalline polymers depends mainly on thermal conditions during manufacturing and cooling, with slow cooling leading to large crystals and high crystallinity, which significantly affects the mechanical properties [4]. Similar to injection molding, where two of the most important processing parameters for tensile strength development are the melt and mold temperatures [4], the substrate temperature immediately before the deposition of the next layer is expected to have a great impact on fusion bonding and the final tensile strength of FEAM parts. A variation of layer height may lead to different pressure conditions during fusion bonding, which in turn can affect mechanical properties [16,17]. In general, the layer height represents a trade-off between lower surface roughness at lower layer heights and reduced manufacturing time for higher layer heights [3,18] and is therefore an important factor to consider in the investigation of tensile properties.
It can be argued that the interface temperature is the decisive factor for bond formation at the layer interface, but the resulting interface temperature at deposition cannot be determined in a non-intrusive way. At the same time, it is the substrate temperature that is crucial to the geometric stability and integrity of the part at deposition [4] and can be measured inline with optical sensors without any manual interference or manipulation of the part. To avoid fiber distortion due to forced planar flow [19], the aim was to neither push nor pull the strand, for which the traversing velocity must be identical to the extrusion velocity at the given screw speed. Other parameters such as extrusion zone temperatures had already been optimized for the FEAM system and were kept constant for the entire study. The aim was to determine the influence of layer height and substrate temperatures on interlayer bonding in large-scale extrusion additive manufacturing and to identify ideal parameters for strong bond formation. The focus was therefore placed on a full-factorial investigation of different substrate temperatures and layer heights based on the thermal analysis and the suggested process window for the utilized material [9].

2. Materials and Methods

Parts for testing within this study were manufactured and tested at the BMW Group Landshut plant. They were fabricated using FEAM technology, which is based on a single-screw extruder that conveys molten material through a 2-mm circular orifice and is guided by a KUKA articulated robot. Prior to each manufacturing process, residual material in the extruder was flushed out at high screw speeds to avoid polymer degradation and fiber agglomeration. An LT-CF1-CB15 infrared pyrometer by Micro-Epsilon Messtechnik GmbH & Co. KG (Ortenburg, Germany) was mounted along the x-axis of the unit at 150 mm from the nozzle to measure the hot end and cold end temperature on the opposite sides of the part. A 40 wt% chopped carbon fiber-reinforced polyamide 6 granulate from AKRO-PLASTIC GmbH (Niederzissen, Germany, Akromid B3 ICF40) was selected because it is significantly cheaper than filament [2] and readily available for injection molding purposes. The material was dried at 80 ° C for 4 h prior to part fabrication. The part geometry was modeled in CATIA V5, as shown in Figure 1, and sliced and converted to KUKA KRL Code using Siemens NX CAM (1953 Series) by Siemens Digital Industries Software (Plano, TX, USA).

2.1. Preliminary Tests

Several preliminary experiments were conducted to determine a suitable Design of Experiments (DoE). While tactile temperature measurements benefit from higher accuracy, optical temperature detection allows non-intrusive inline measurements within any manufacturing process. To eliminate unnecessary inaccuracy, preliminary testing determined correction factors for the pyrometer were determined compared to a tactile thermocouple on the identical material across the entire temperature range from room temperature to 300 °C. For the FEAM system, initial measurements determined consistent cooling behavior for identical layer times independent of path length or traversing velocity. Therefore, the layer time is the decisive factor for the resulting substrate temperature and thus interface temperature at the deposition of the next layer. Thus, to achieve different substrate temperatures, only varying layer times are required. This can be achieved either by varying the traversing velocity, by altering the path length, or by directly manipulating the layer duration through wait times.
Preparation and test conditions were evaluated. Accelerated conditioning according to DIN EN ISO 1110 [20] was performed at 70 ° C and 62% relative humidity with regular control of weight gain to validate the standards’ conditioning duration based on sample thickness. Karl–Fischer titration (DIN EN ISO 15512—method 2 [21]) was used to determine the moisture content at 1.67 ± 0.04%. Previous experiments suggested the use of tabs to prevent sample failure within the grip, as high compressive stresses may damage the samples. Tabbed specimen with tabs of 50 × 25 × 1 mm Glass Fiber Reinforced Plastic (GRP) epoxy with a fiber orientation of ±45°, bonded with Araldite 2011 and cured for 24 h, were compared to blank specimen through sample tensile tests. The results showed that the imperfect parallelism of the tabs led to increased failure within the grips, indicating tensile tests without tabs.

2.2. Design of Experiments

Layer height h and the substrate temperatures T s u b are major levers in the given FEAM process and thus were selected as independent variables for this investigation. In manufacturing with a 2-mm orifice, layer heights from 0.7 mm to 1.2 mm have shown to be mechanically possible, with acceptable part qualities achieved at layer heights between 0.8 mm and 1.1 mm. A layer height of less than 0.8 mm caused the strand to swell laterally around the nozzle geometry and therefore the strands did not align with each other, resulting in disintegration of the part after only a few layers. For layer height above 1.1 mm, the strand was not compressed well enough to form a flat surface, but remained nearly round. This also led to disintegration of the parts, as the successive strands “rolled off” the previous layer during the printing process without forming a noticeable bond. Table 1 presents the list of the chosen manufacturing parameters of this study including the information as whether they were modified throughout the experiments or kept constant as control variables. This should also enable reproducing this characterization approach for similar EAM facilities or new materials for this process.
As suggested by thermal investigations [9], the expected range of substrate temperatures for good fusion bonding of the used material is between the melt temperature at 221 ° C and the extrapolated onset of crystallization at 166 ° C . For substrate temperatures above the melt temperature, the viscosity of the substrate and extrudate remains too low, leading to polymer flow even after deposition and direct disintegration of the part. Target substrate temperatures of 220 ° C , 210 ° C , 200 ° C , 190 ° C and 170 ° C allowed the characterization of this ideal process window, while temperatures of 150 ° C , 130 ° C and 110 ° C were used to verify the given window and determine properties for parts fabricated at longer layer times. Parts manufactured at T s u b below 110 ° C delaminated when removed from the build base and were excluded from the study. A full factorial DoE was used to test the tensile properties at each layer height at each target substrate temperature. A full overview of the investigated setups, as combinations of temperature, layer height and sample direction, is provided in the Appendix A. This summary also includes the number of valid samples contributing to each obtained tensile strength and tensile modulus value, as well as whether the samples were taken from a single part or multiple identical parts.
Since only the layer time proved to be decisive for the substrate temperature achieved, unnecessary disturbance variables, such as varying pressure, thermal and shear conditions within the extrusion unit, were eliminated as much as possible. Thus, only a single setting of 72.04 rpm and a traversing velocity of 0.160 m/s were used to manufacture all parts. In addition, to keep the part geometry and the corresponding heat chimney identical, layer times were varied by utilizing a holding position outside the main geometry and varying the holding time. Five parts were fabricated per DoE configuration to determine the dependent variables of tensile strength and tensile modulus. While samples of multiple identical parts allow an evaluation of the reproducibility of the process, measurements of samples from a single part enable a judgement of the reproducibility and homogeneity of the parts themselves. Due to time and resource constraints, additional single part sampling was conducted only for layer heights of 1.0 mm.
The DoE was adapted after the first series of measurements at 170 ° C to 220 ° C . Since the samples taken from single parts showed no significant difference from the samples taken from multiple parts, and resources did not allow the continuation of 5 manufactured parts per setup, the specimens for lower substrate temperatures were all taken from single parts. In addition, the long holding times at temperatures below 170 ° C caused great material buildup at the holding position and demounted the parts during fabrication. The tensile strengths of specimens at 150 ° C with the screw rotating continuously were compared to those of specimens where the screw was turned off during the holding times. With the difference in tensile strength below 5% for all specimen orientations, the screw was stopped at the holding position for all further parts. The first measurement series also revealed slightly poorer mechanical properties for the 1.1-mm specimens as well as inhomogeneous material deposition under the microscope, resulting in low and insufficient optical quality of the parts. At lower temperatures, the 1.1-mm parts were therefore omitted.

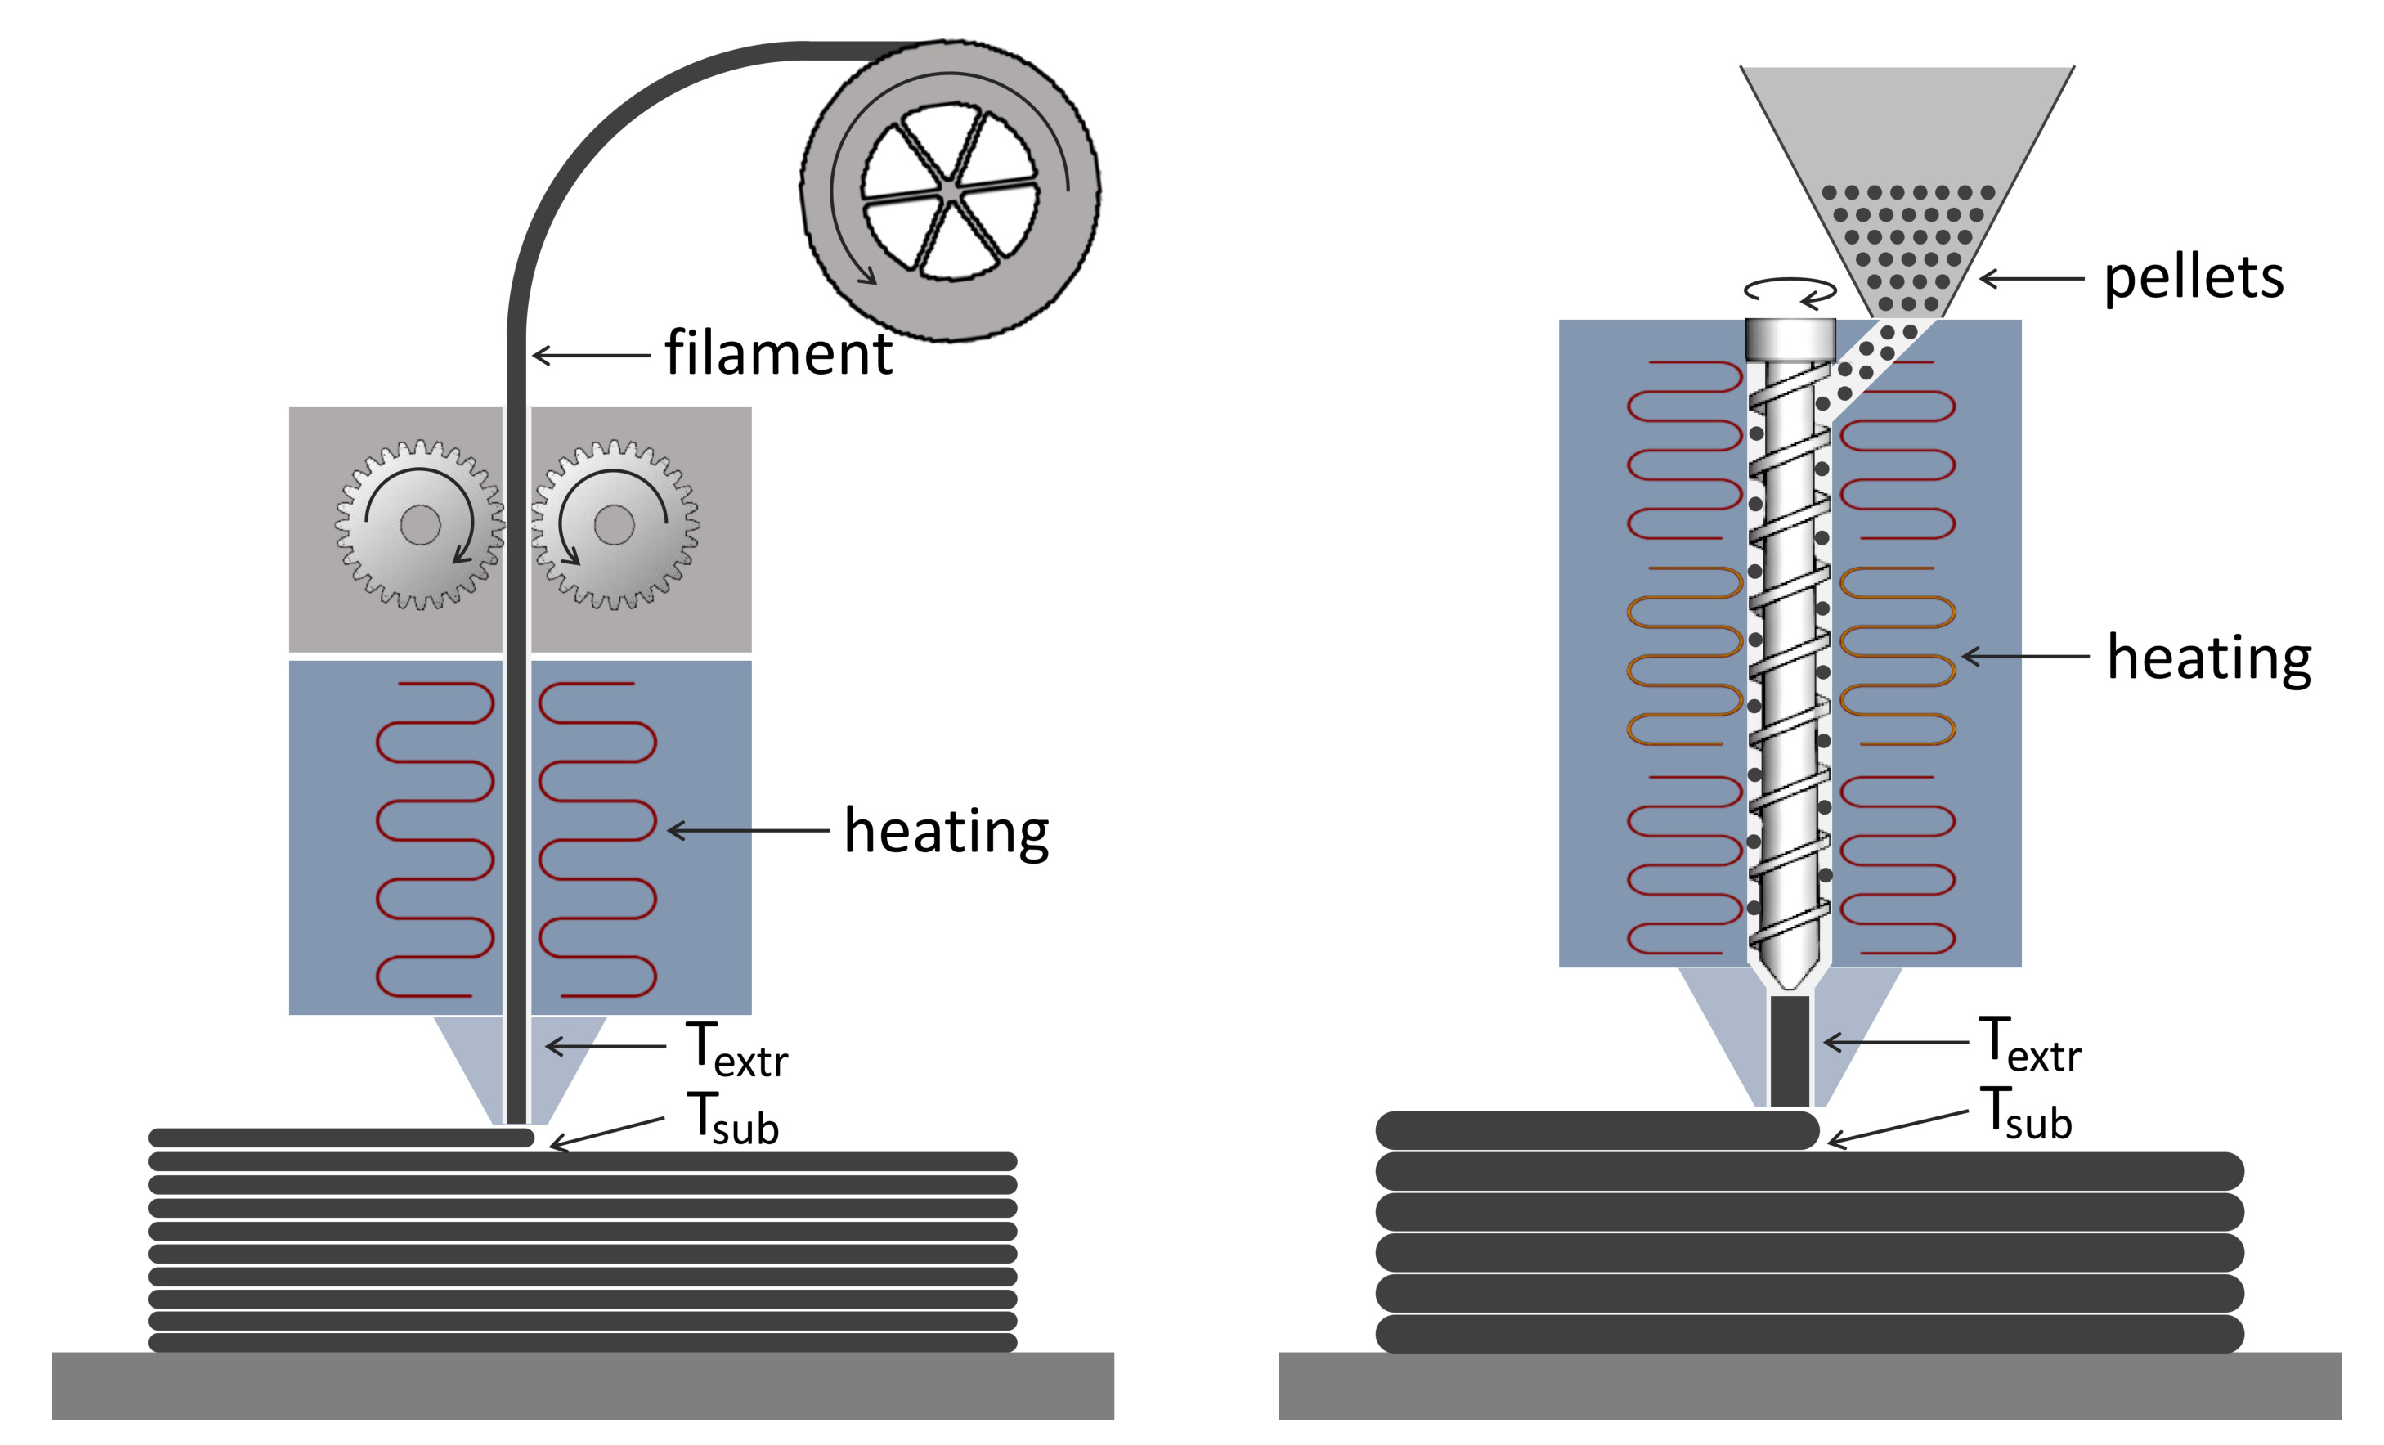
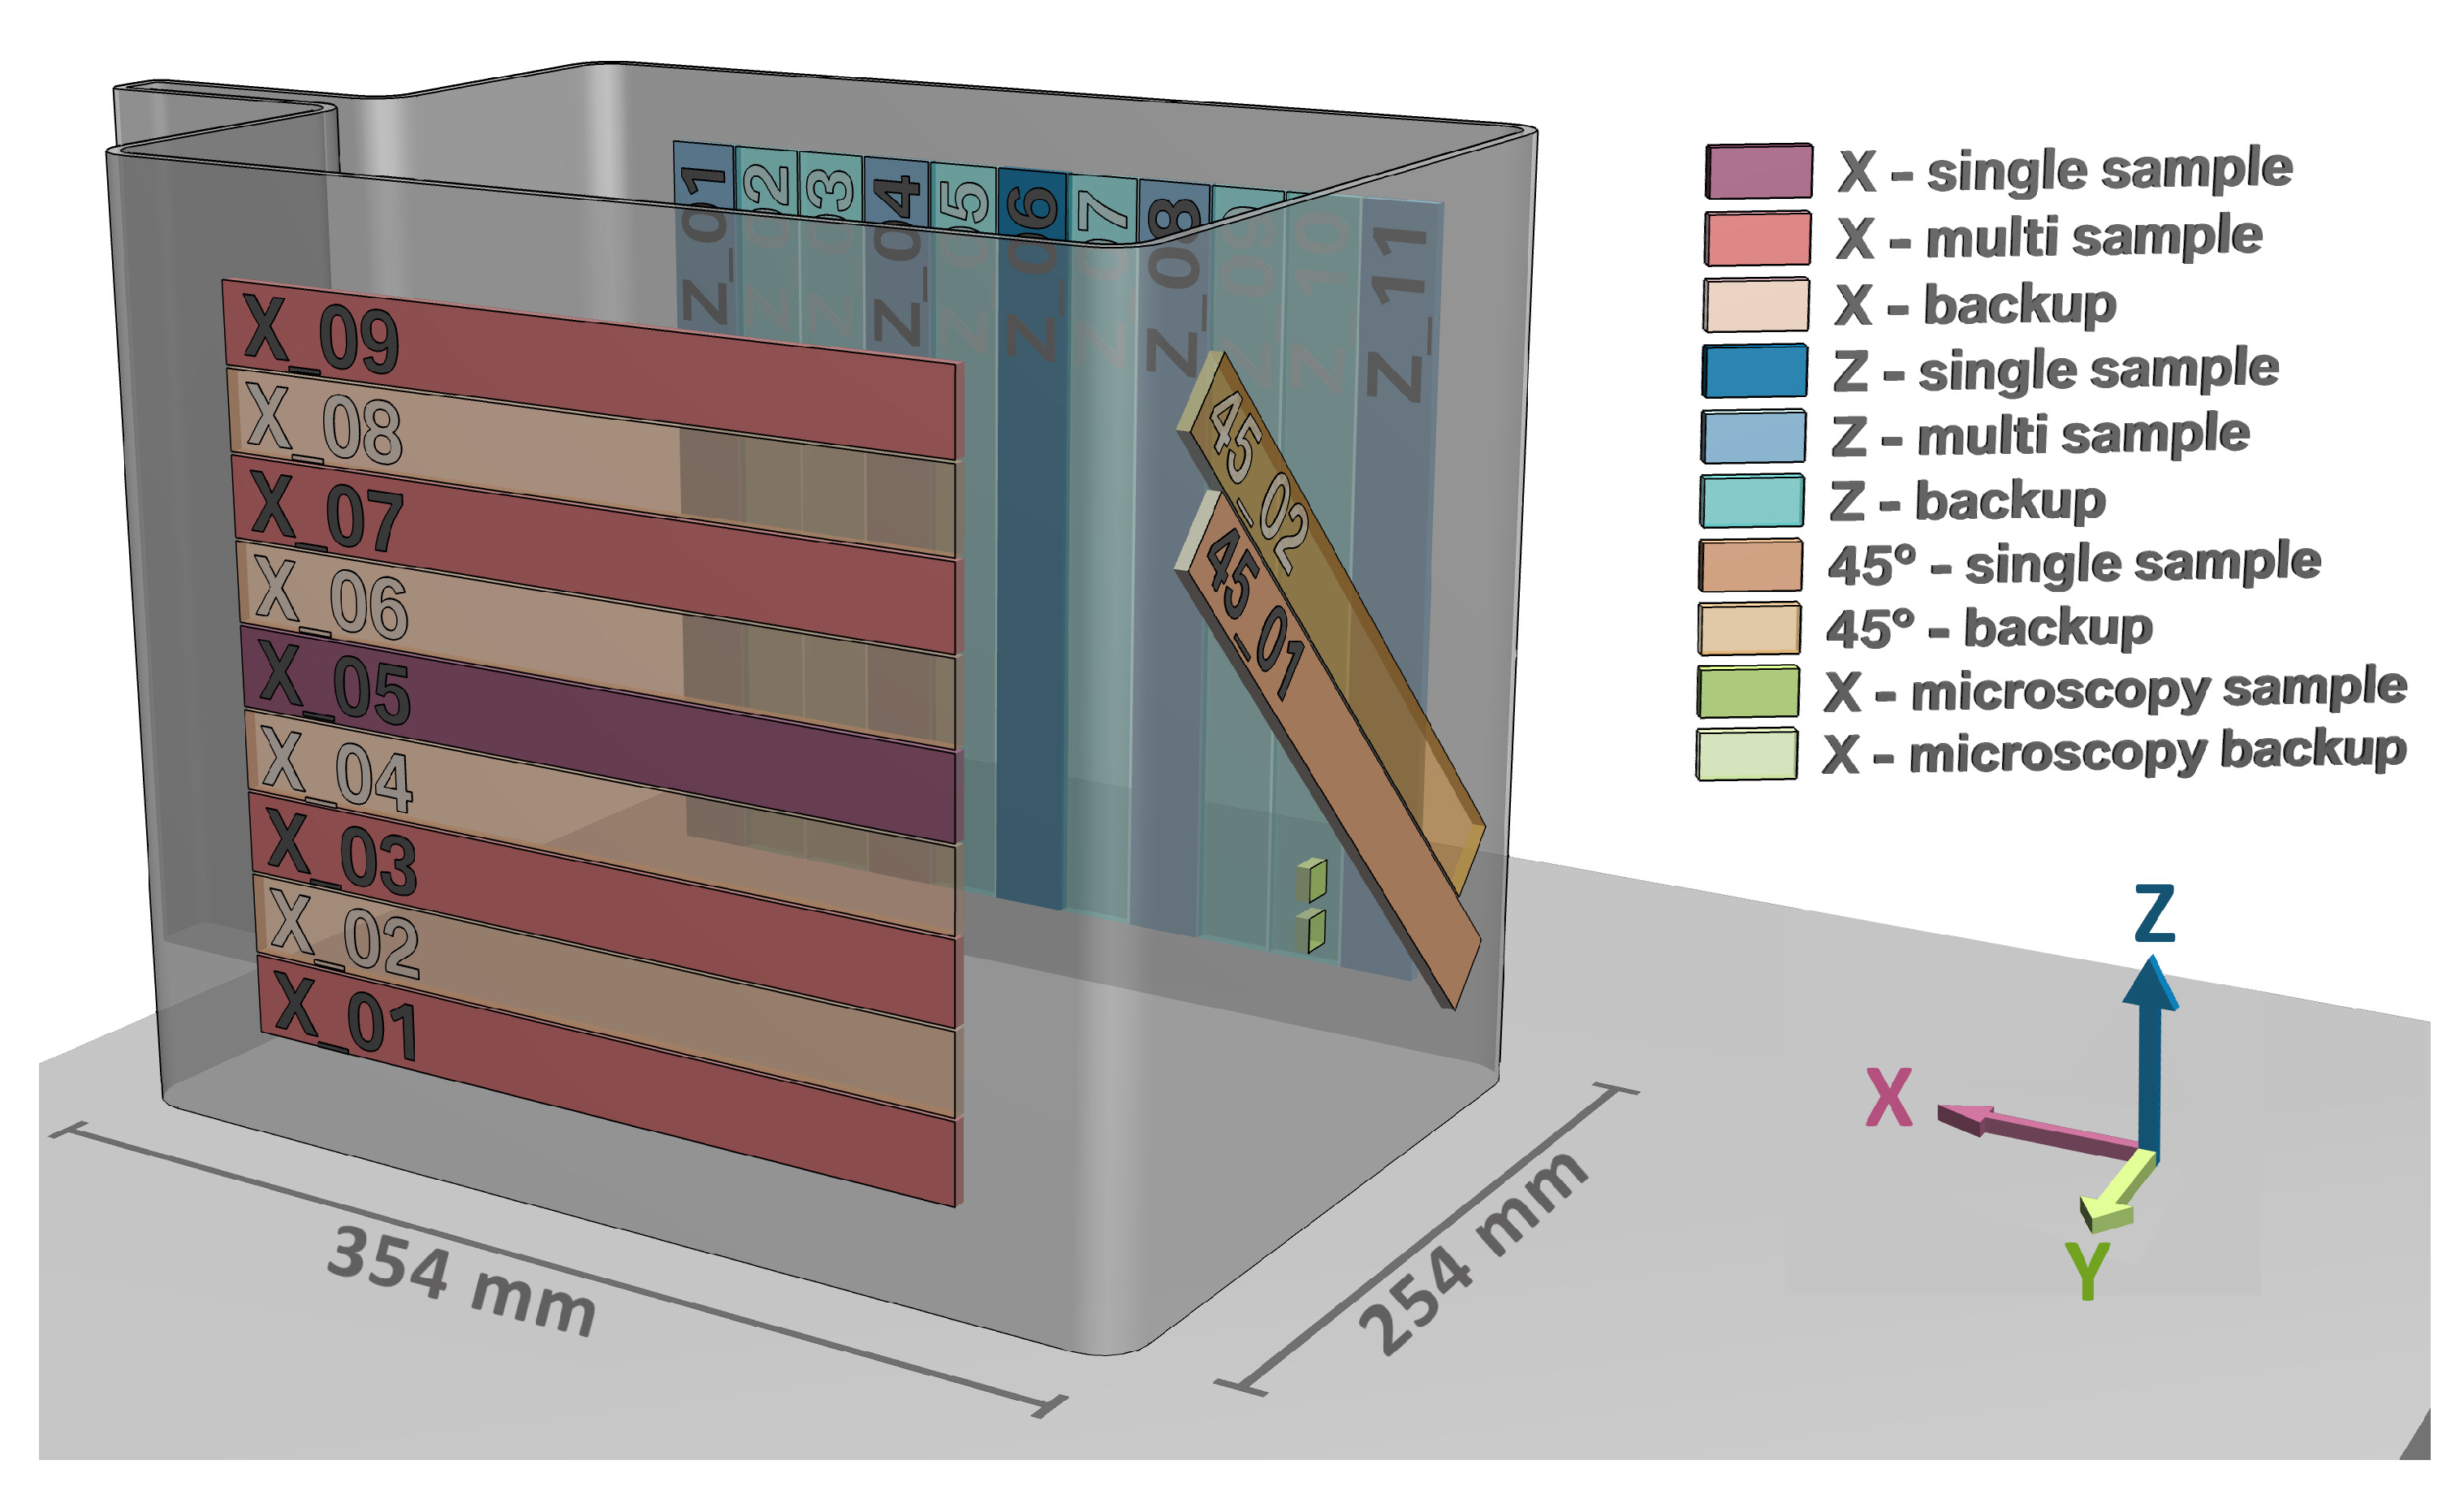
2.3. Sample Fabrication

During the manufacturing of the parts, the internal sensor data of the extrusion unit (heating zone temperatures; melt temperature; pressure downstream of the screw and directly upstream of the nozzle) and the pyrometer signal were aligned by the Programmable Logic Controller (PLC) with the movement data of the robot and recorded via an SPS-ANALYZER Pro 6 from AUTEM GmbH. Holding time was adjusted for each part to compensate for fluctuations in ambient temperature resulting from the industrial environment of the facility. For the adjustment, a sample was fabricated to a height of 30 mm before recording of the cooling curve and consideration of the time difference resulting from the 150 mm distance between the nozzle and the infrared pyrometer. The actual substrate temperature of the final parts was later determined by applying correction factors to the pyrometer data collected within the print process with 10 different layers in the first half and 10 layers in the second half of the part considered.
As shown in Figure 2, the longitudinal and transverse specimens were taken from the long side of the parts in x- and z-directions, respectively, while a single sample was taken from the short side at an angle of 45°. For setups at high temperatures and single samples per part, the samples were taken from the middle section of each side. For all setups where multiple parts were required, the specimen location was distributed evenly along the part length. The remaining samples were prepared as backup for invalid tests. During preparation, the top and bottom 25 mm were removed to disregard starting and finishing effects. A water-cooled abrasive cutter was used to cut the parts into strips of 250 mm × 25 mm according to DIN EN ISO 527-4 [15] with variable thicknesses depending on the chosen layer height. After manual deburring, the samples’ widths and thicknesses were measured at three different positions to determine the actual cross-sectional area of each sample. The samples were then conditioned at 70 ° C and at 62% relative humidity for 8–10 days according to DIN EN ISO 1110 [20] to resemble the conditioning state that samples will develop in long-term use.

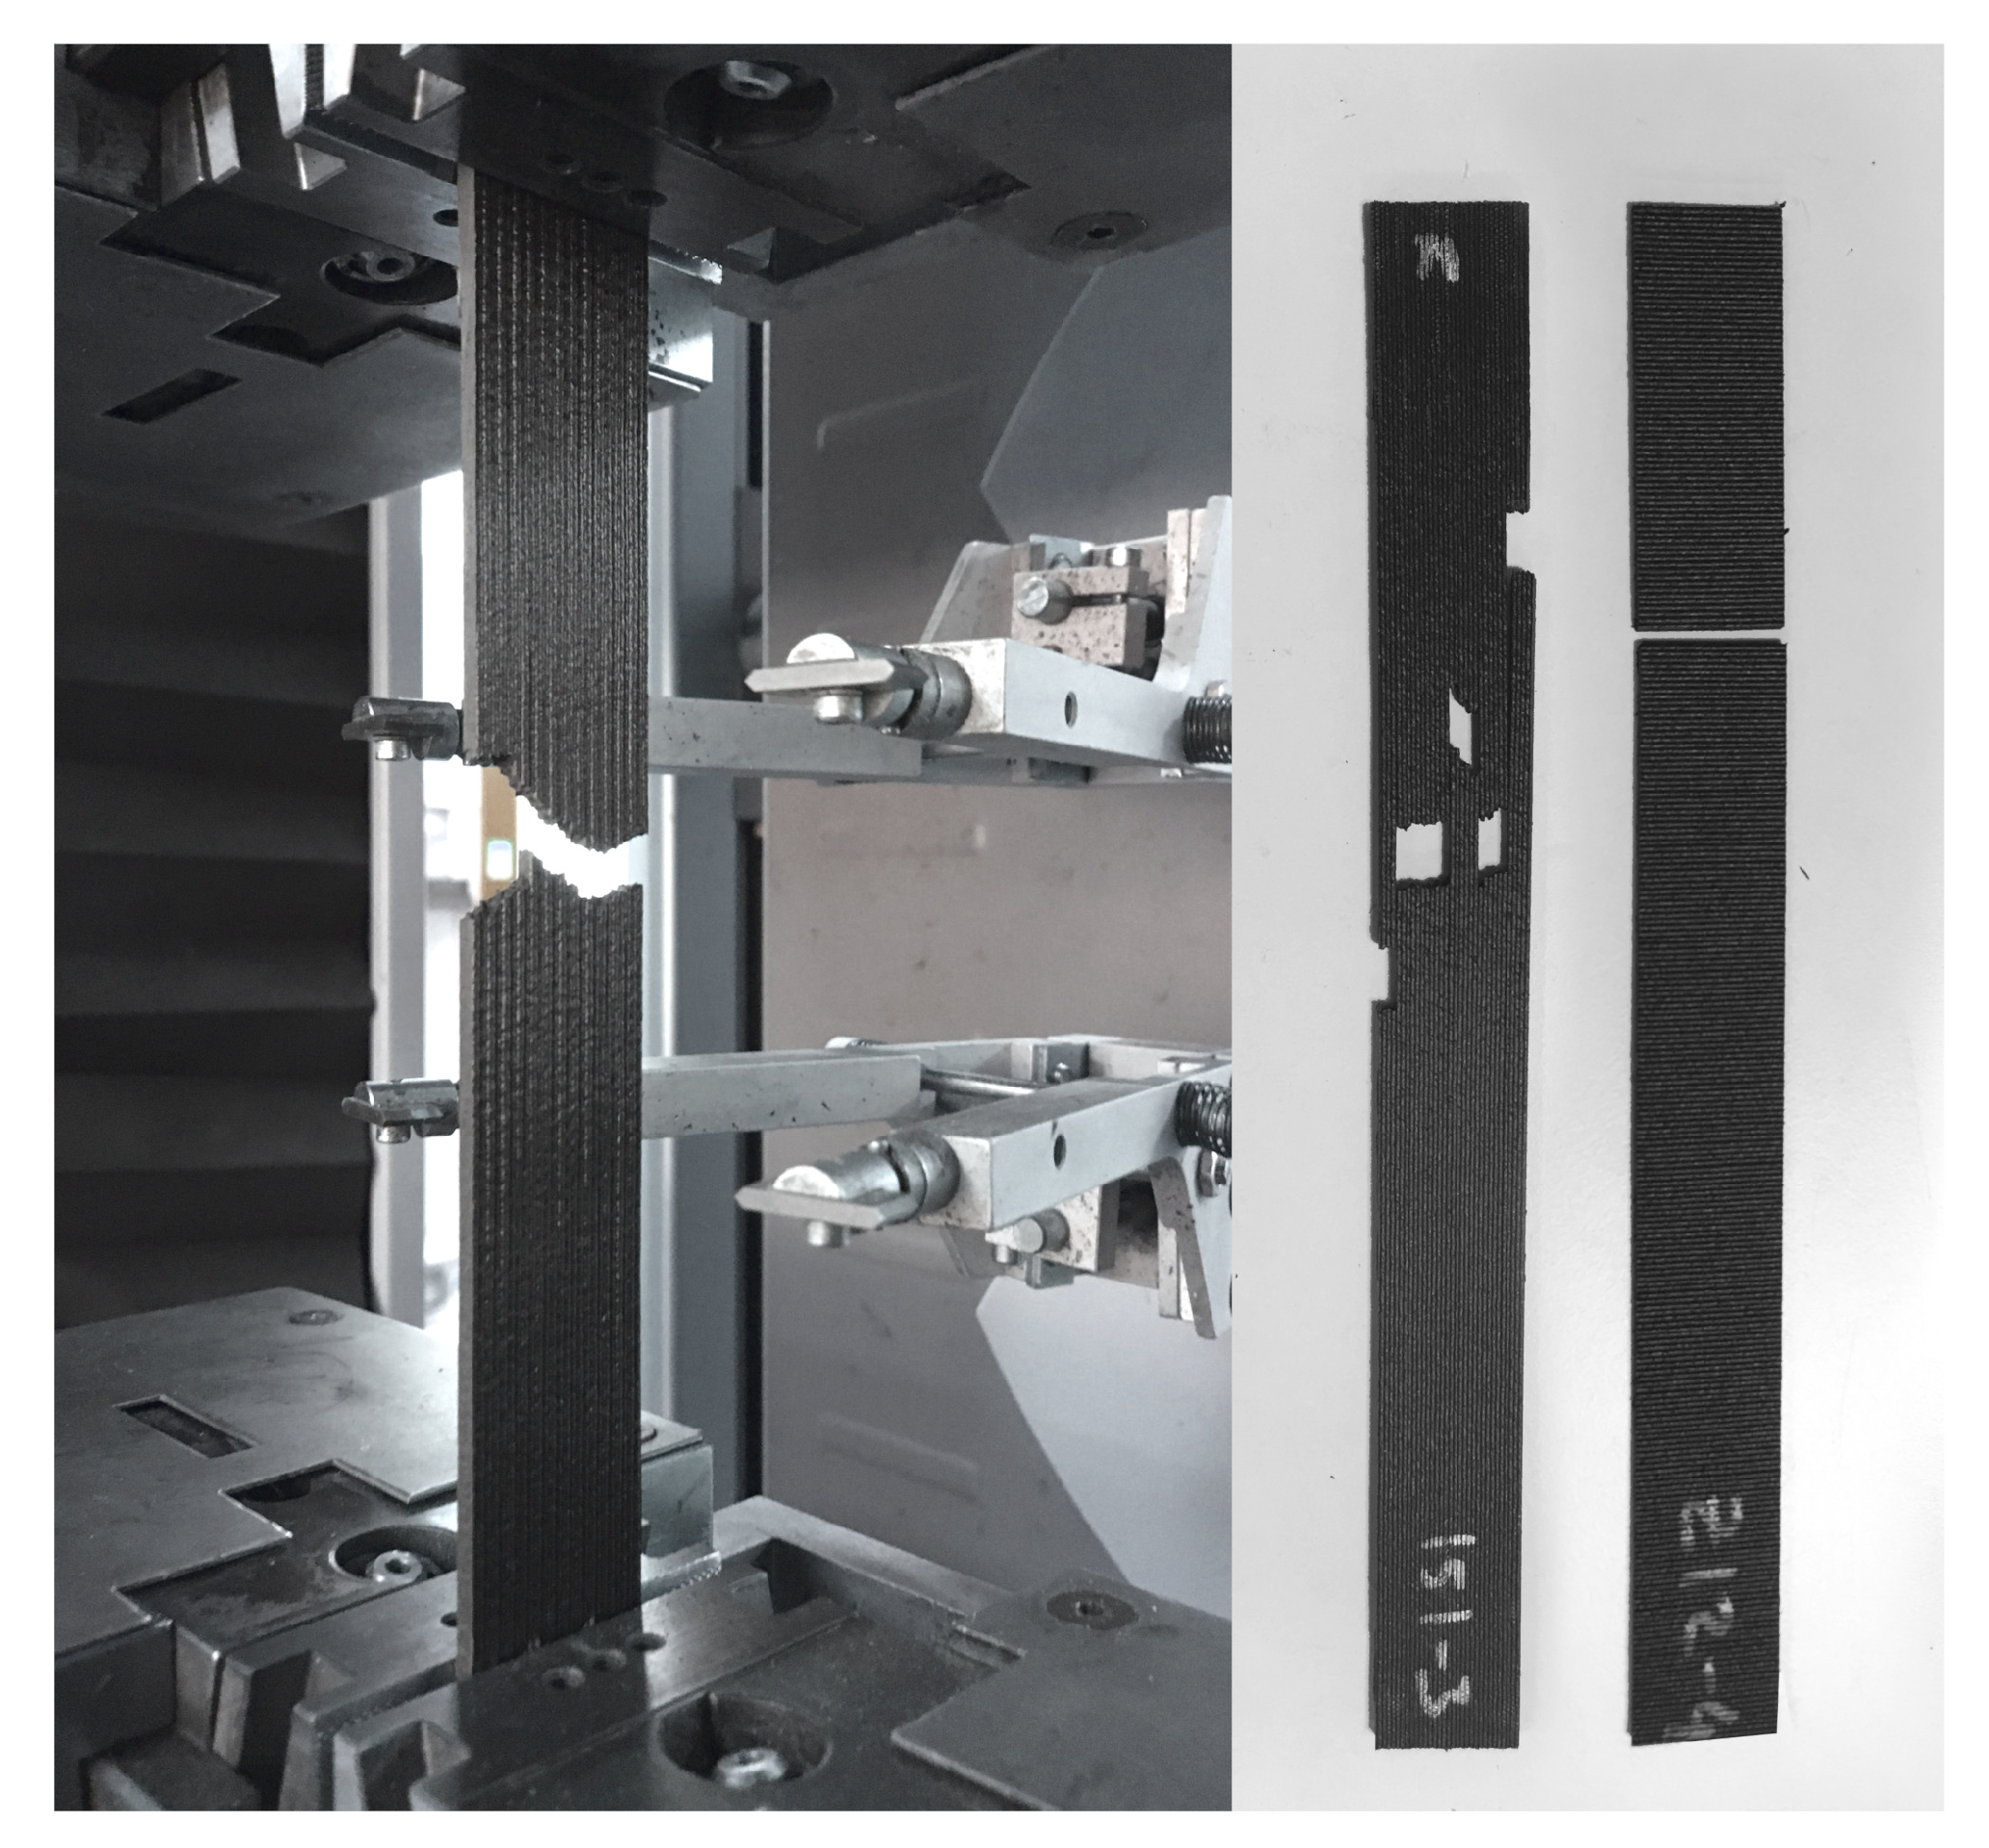
2.4. Tensile Tests and Analysis

Tensile testing was carried out at room temperature on a universal testing machine of type Z100/SN5A by ZwickRoell GmbH & Co. KG, with a 100 kN load cell, a force measurement accuracy of 0.2 kN according to class 1, and a loading rate of 2 mm/min. The specimens were inserted with a free gripping length of 150 mm and a gauge length of the axial strain extensometer of 50 mm. The preload was set to 20 N at a test speed of 2 mm/min. The tensile modulus was determined between 0.05 and 0.25% strain and evaluated using the secant of the stress–strain curve. For each sample, the failure mode was noted based on ASTM D3039 [22] codes to determine potential fracture patterns. Data analysis was performed on the collected data using the actual strand width for the cross-section calculation.
The same analysis was performed on the nominal cross section, for which the sample width was adjusted to the contact width between successive strands determined via optical microscopy. As explained in more detail and with respective photomicrographs in the Results section, the difference between the general tensile strength and modulus and the nominal results was the consideration of the contact width between successive strands. Since all specimens analyzed in this study were taken from thin, single walled parts, the specimen thickness as measured by a caliper, corresponded to the width of a single strand. However, due to the round shape of the outer edges of the strand, the actual width across which successive strands touch is less than the strand width which will be elaborated on in the results section. The nominal results therefore were calculated using the contact width as specimen thickness, yielding the actual strength per cross-sectional contact area. The nominal tensile strength becomes relevant, when considering bulk material or multi-strand samples with low macroporosity, as the rounded sides there become less relevant compared to the wall thickness.
For all experimental setups, the corresponding mean values and standard deviations were calculated from the five samples tested. Where applicable, the mean of five samples from multiple parts was compared to that of five samples from a single part. For all other setups, the means were calculated for each part. In several tests, the tactile strain gauge slipped on the ripped surface of the specimen, resulting in unusable strain data. These samples were marked invalid and were excluded from further analysis. Where available, spare samples from the same part were tested and substituted for the invalid measurements. The 95% confidence intervals for tensile strength and tensile modulus were determined for all setups of multiple samples. A two-dimensional linear regression model of second order was utilized to evaluate the linear regression coefficients, coefficient of determination, and standard error. For this purpose, a weight vector was calculated using the Moore–Penrose pseudo inverse. This resulted in a three-dimensional plane mapping the entire range of parameters tested while allowing prediction at any given point in between.

3. Results

The effects of the parameter variation of layer height and substrate temperatures were determined through extensive tensile testing and analysis.

3.1. Preliminary Tests

Multiple parts of various path lengths were manufactured to a height of 15 mm with different traversing velocities and extrusion speeds. After adjustment of the cooling curve start points to the time delta between nozzle and pyrometer passage, the cooling behavior aligned strongly as a function of the layer time. This behavior is illustrated in Figure 3 on the example of 1.25 m and 2.50 m path lengths printed with 0.050, 0.075, 0.100 and 0.150 m/s.
Preliminary tests of tensile specimen in longitudinal direction at a substrate temperature of 130 ° C were investigated for both dried and conditioned tensile properties. Using Karl Fischer titration [23], the moisture contents of dried and conditioned specimen were determined to 1.67 ± 0.04% and 0.08 ± 0.02%, respectively. It should be noted that the moisture content was calculated based on the total sample weight, even though only the polymer matrix can absorb moisture. Specimens of 0.8 mm, 0.9 mm, 1.0 mm and 1.1 mm layer height were manufactured for tensile tests. The conditioned samples obtained significantly lower tensile strength and tensile modulus for all layer heights. The conditioned samples at 0.8 mm layer height yielded only 78% of the dried tensile strength and 48% of the tensile modulus of the dried specimens, in line with prior studies [24]. For a layer height of 1.1 mm, only 66% of the tensile strength was obtained, already indicating lower tensile properties for higher layer heights. The conditioned samples also demonstrated a significantly higher elastic behavior compared to the dried samples, sustaining more than double the strain of the brittle dried samples at part failure. It is suggested that this change in micro-structure results from the water molecules in the amorphous regions and the related reduction in glass transition temperature [24].

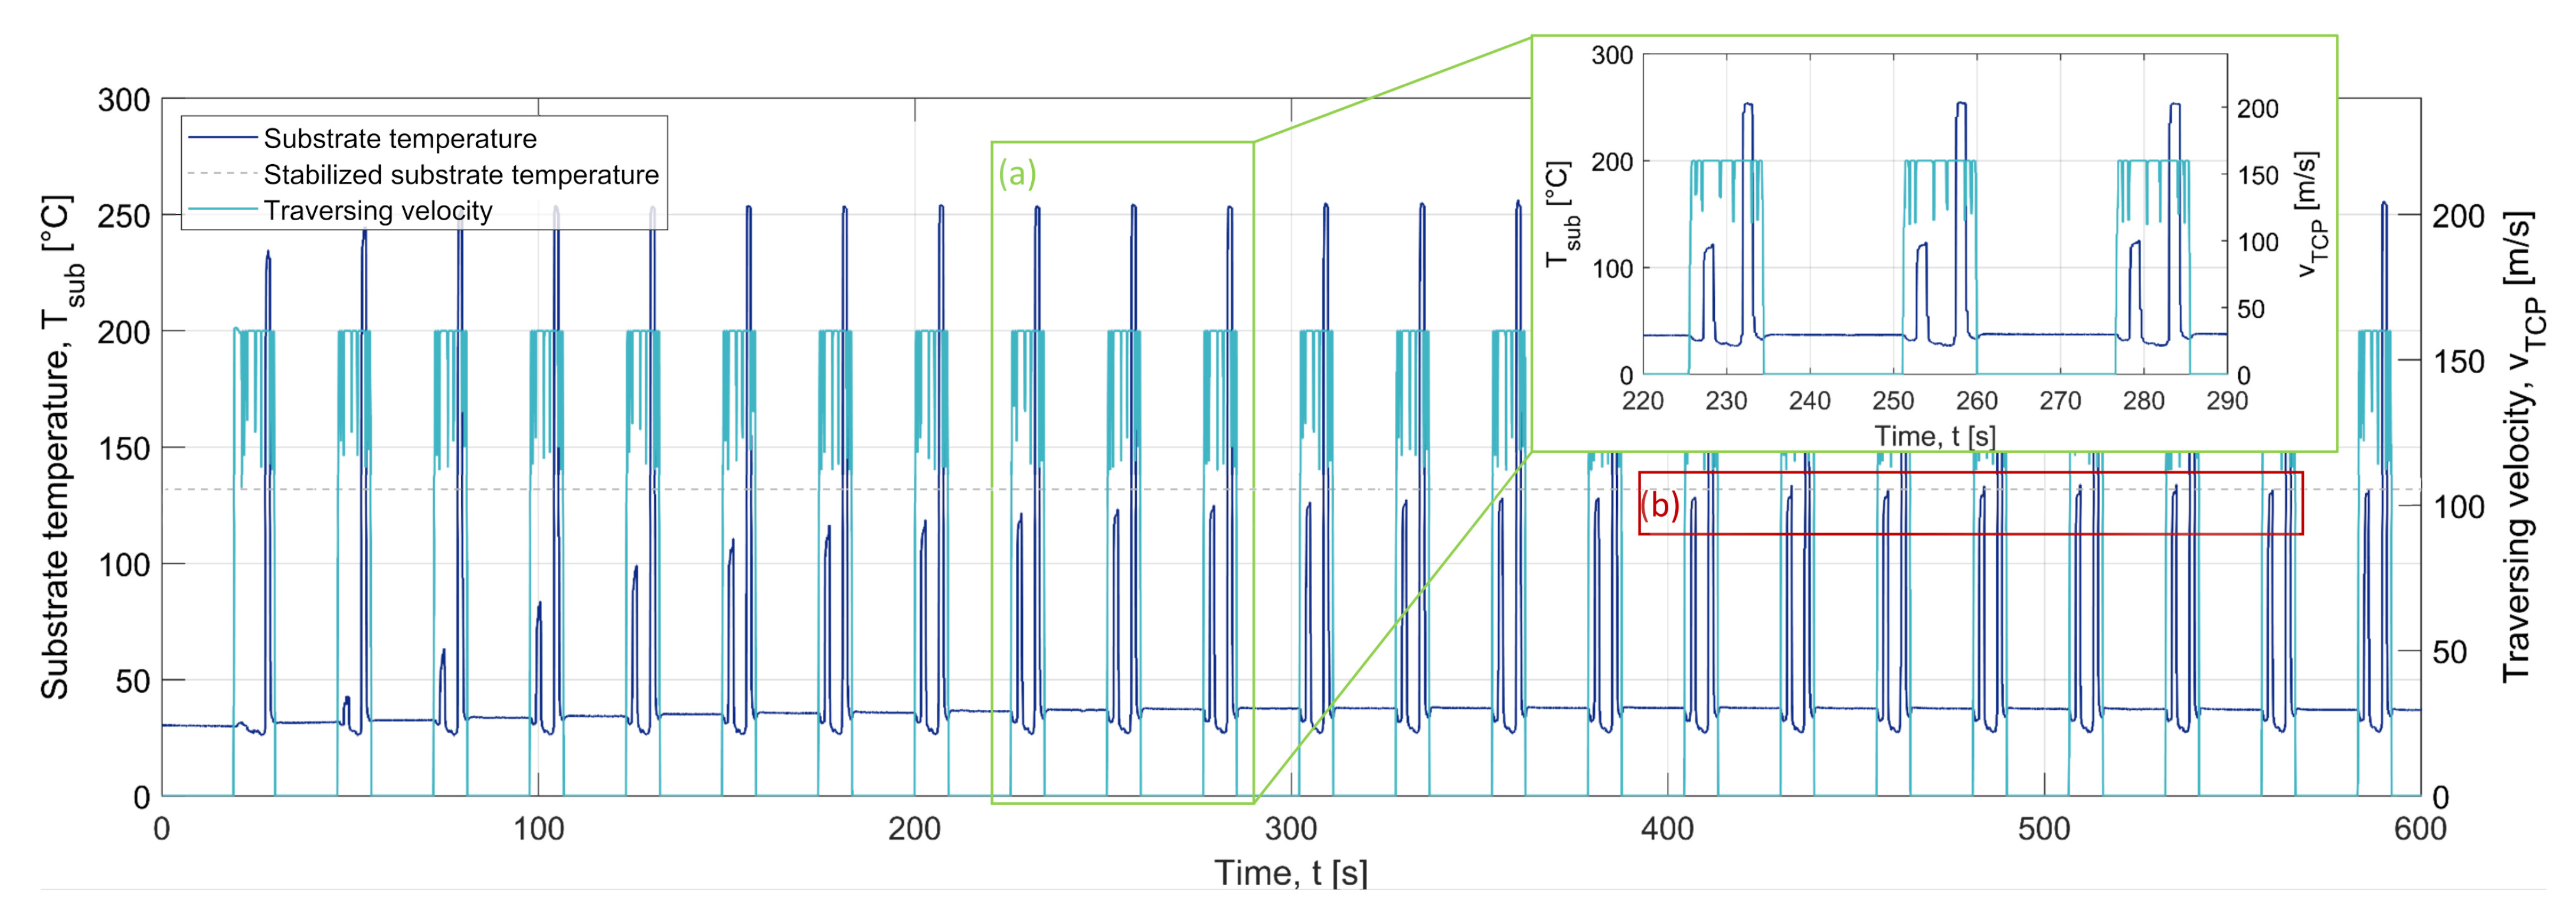
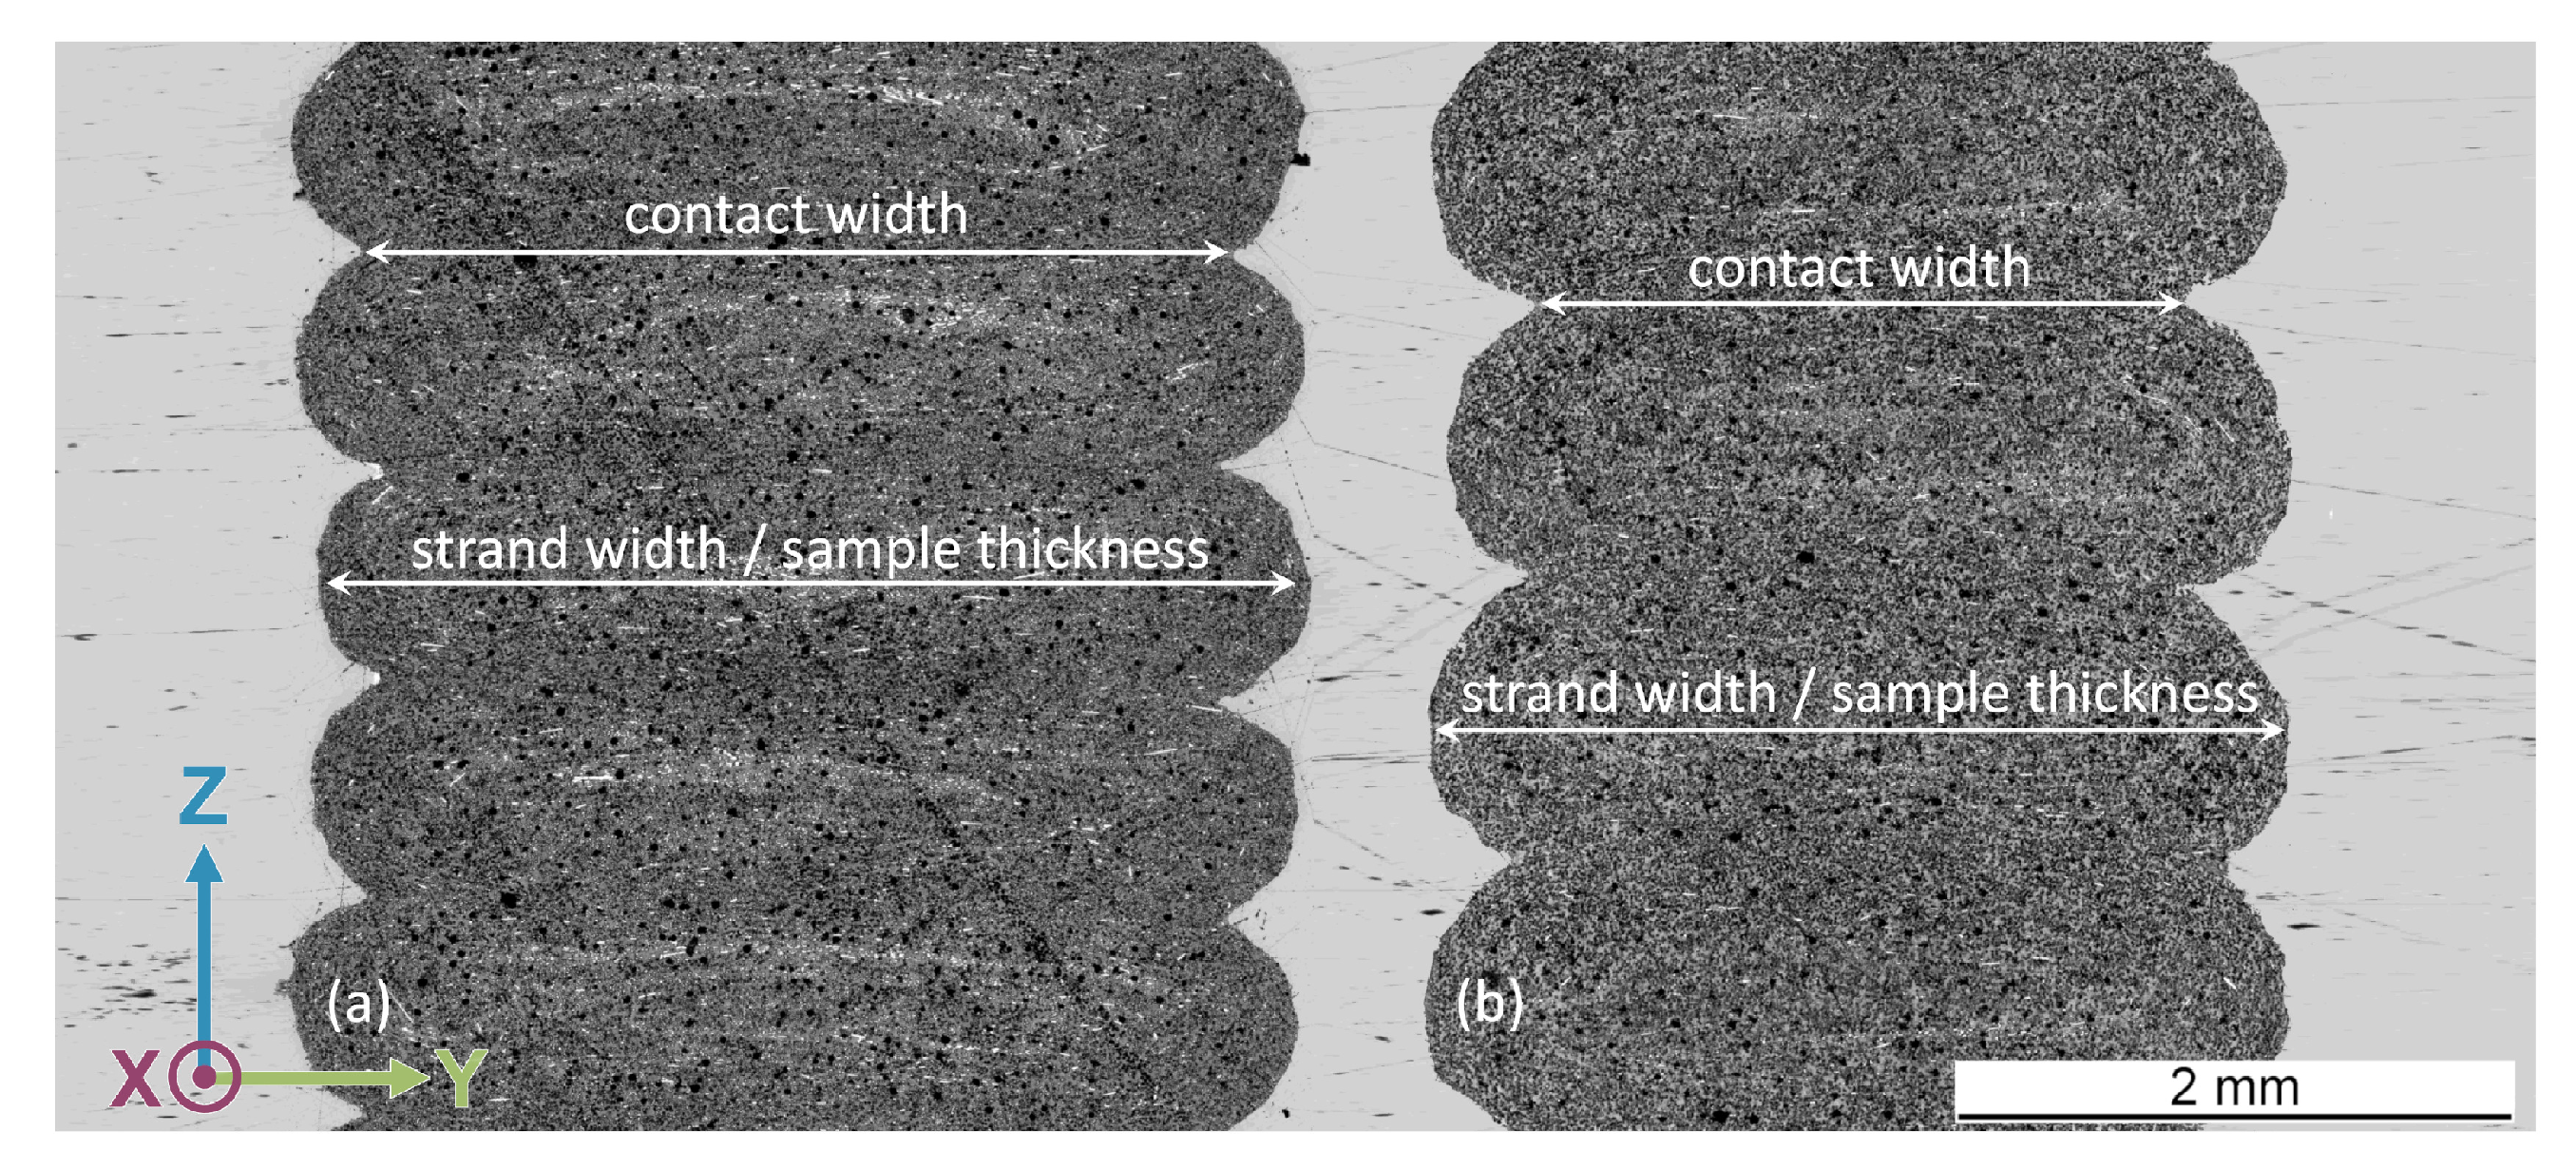
3.2. Sample Fabrication

Using the PLC for data collection allowed a coupled representation of the robot velocity with the inline pyrometer data collected during the manufacturing process. Figure 4 shows both the pyrometer signal and the actual traversing velocity, v T C P , of the robot for the first 10 min of the manufacturing, using the part at 130 ° C and a layer height of 1.0 mm as an example. The highlighted section (a) shows that the robot velocity not only dropped for the holding times, but also at each corner of the part. Therefore, the actual average velocity during the deposition phase amounted to 0.154 m/s for all setups. As in section (b), all substrate temperature measurements stabilized by h = 15 mm, leading to homogenous temperature conditions in the samples cut from h = 25 mm to h = 275 mm. In addition, the highest target temperature of 220 ° C was not physically feasible as the melt remained slightly too hot to achieve geometric integrity. The upper limit was adjusted to the lowest layer time yielding physically stable parts which corresponded to a substrate temperature of 216 ° C . The remaining holding times were chosen to meet the target temperatures with a tolerance of ±1 ° C . The fluctuations in ambient temperature during the winter led to deviations from the target temperatures of up to ±2 ° C when measured in the actual parts. This was not an issue as the actual part temperatures were considered later in the analysis.

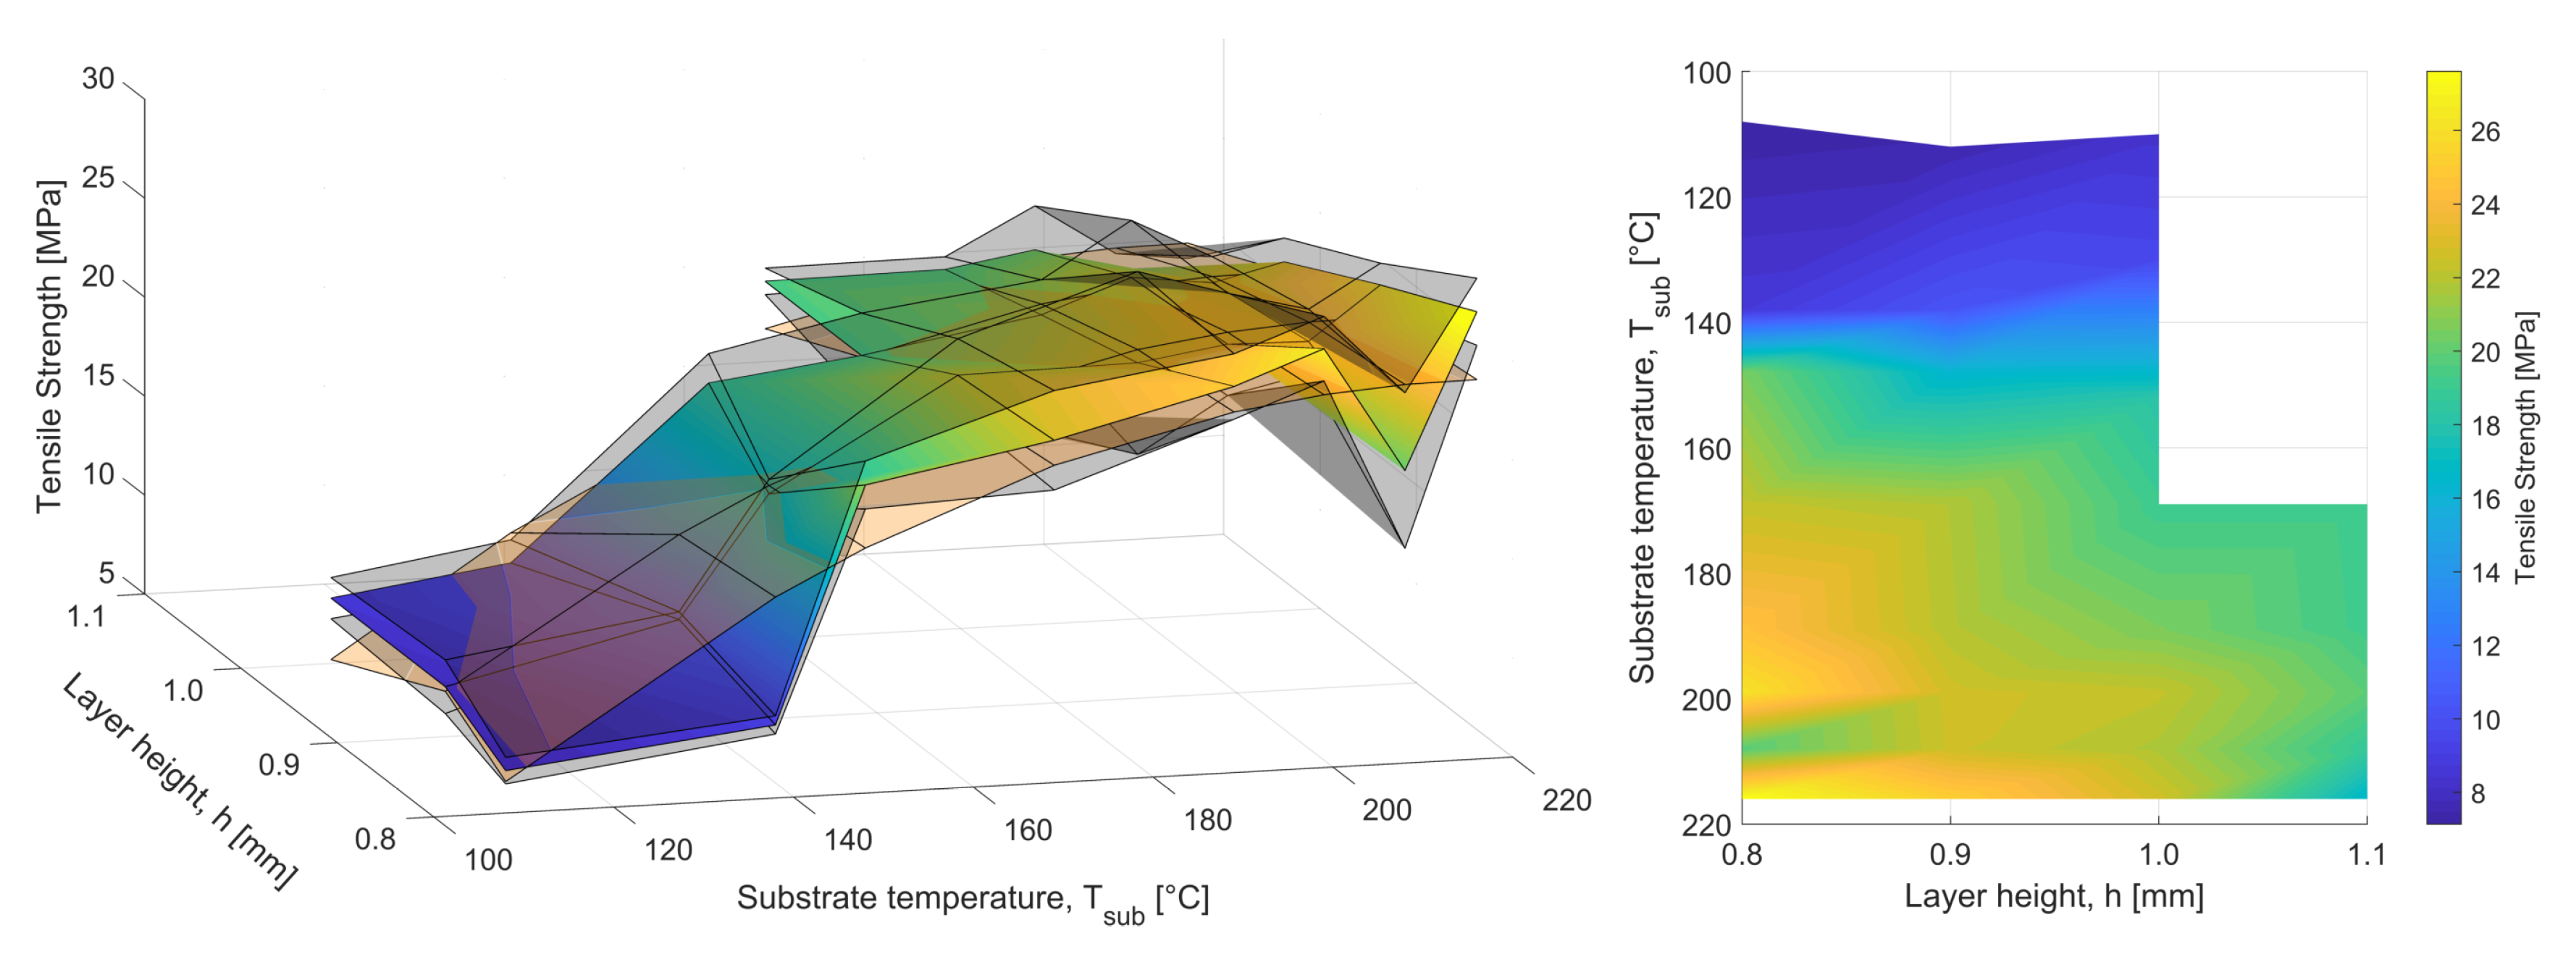
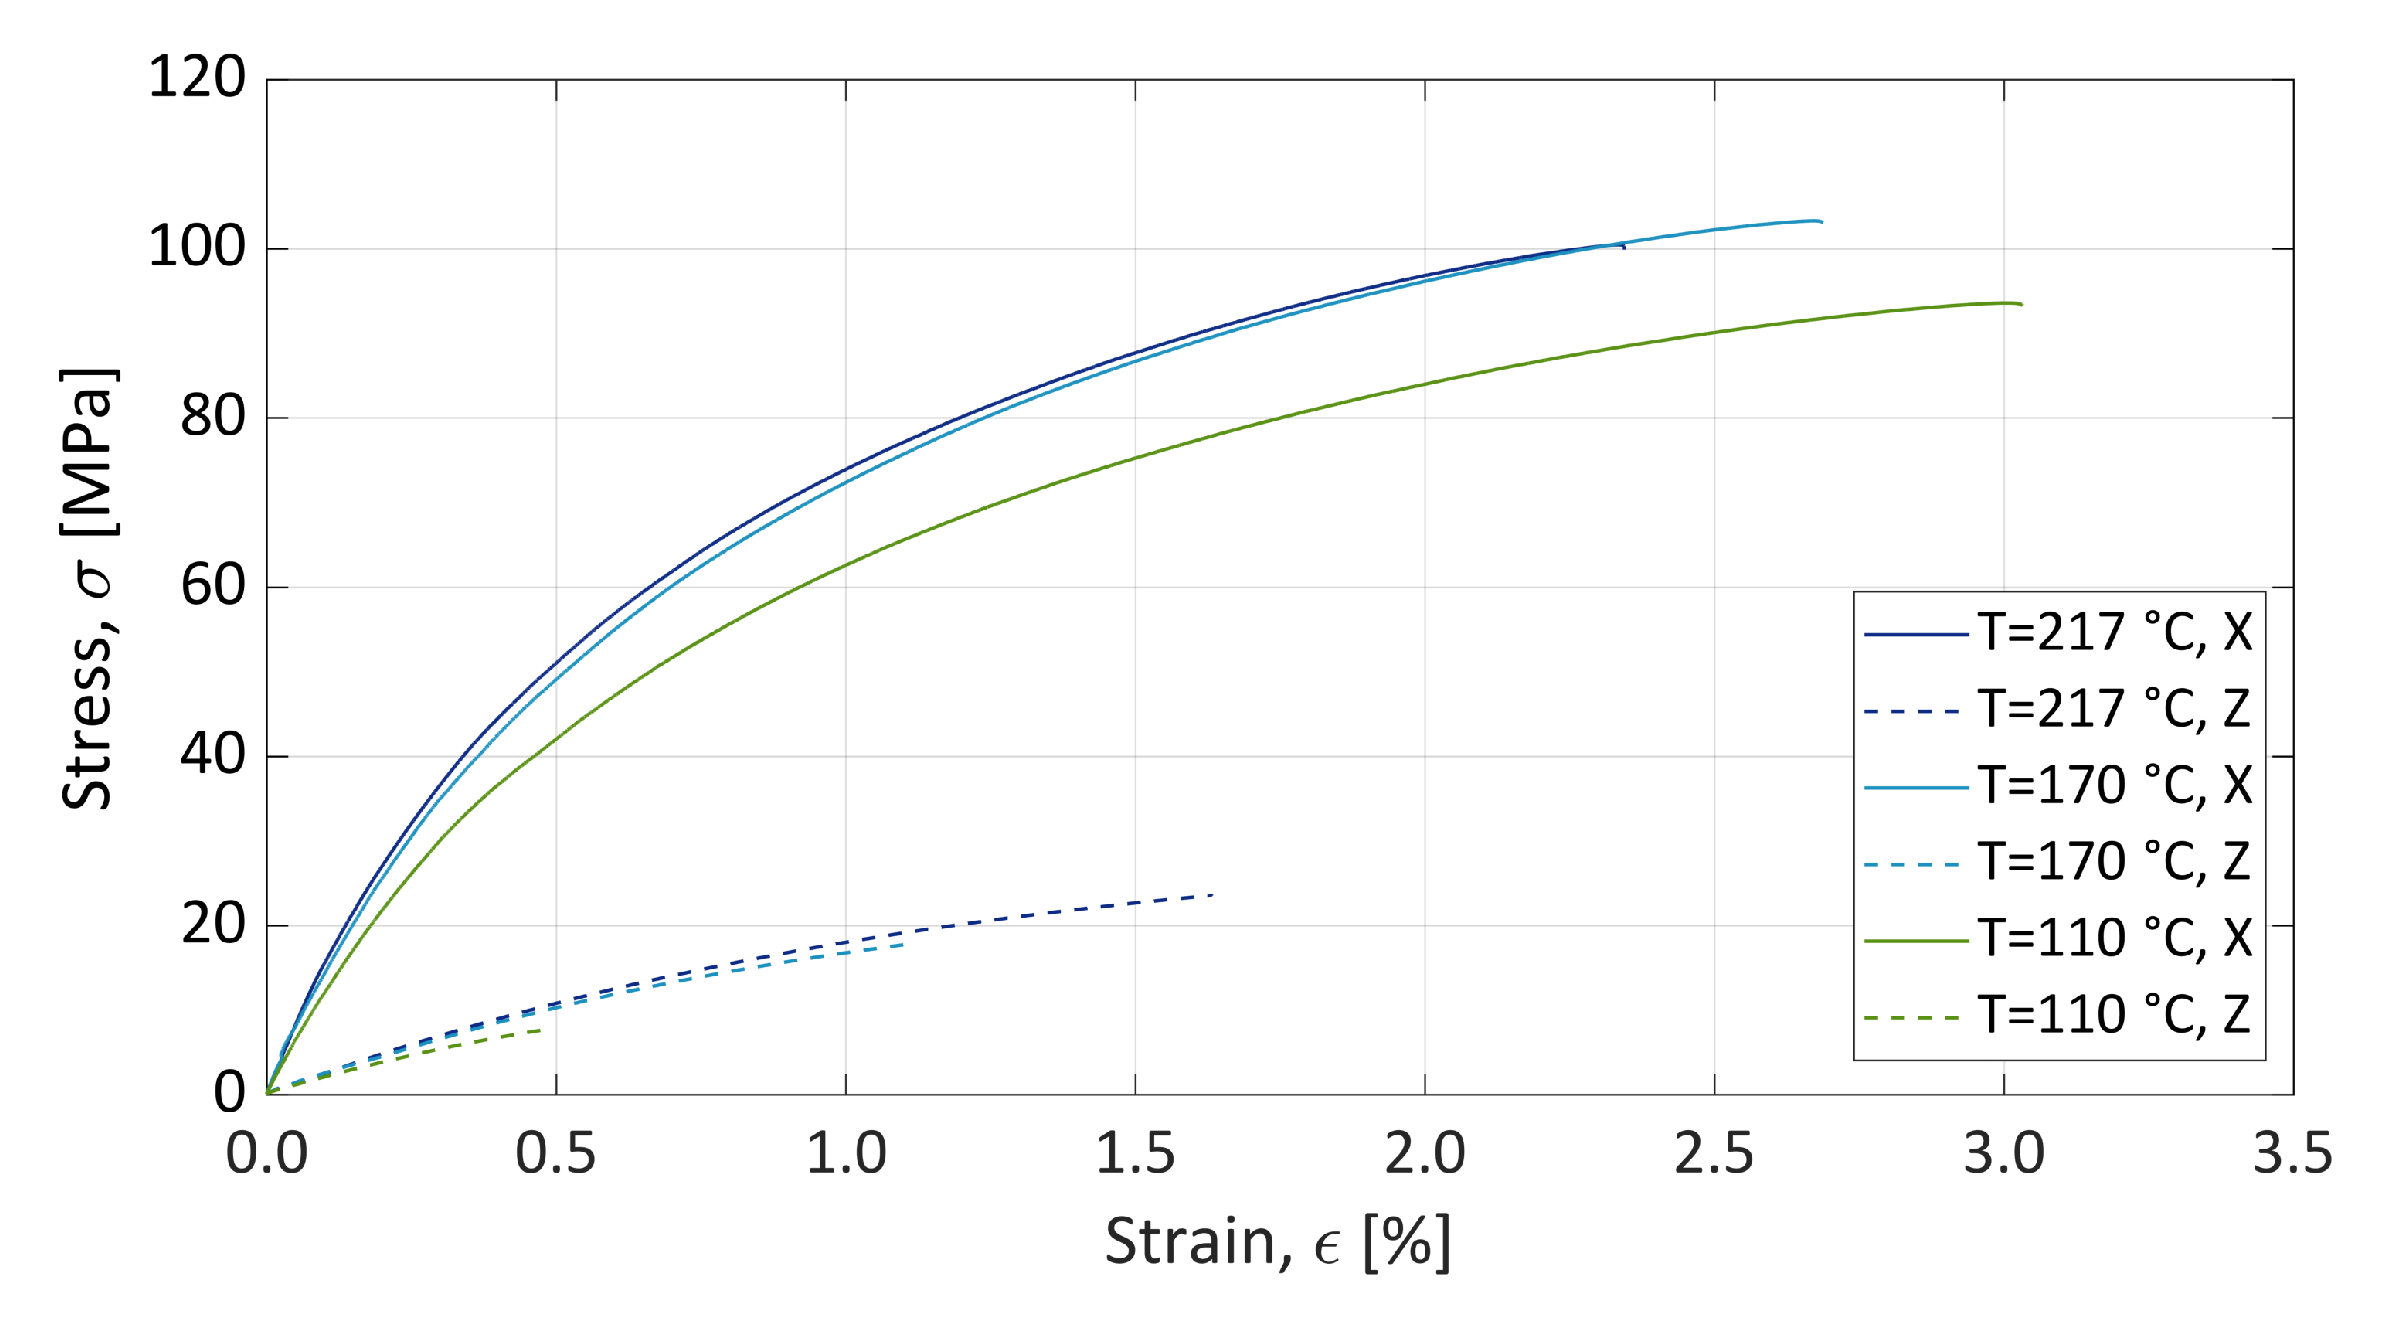
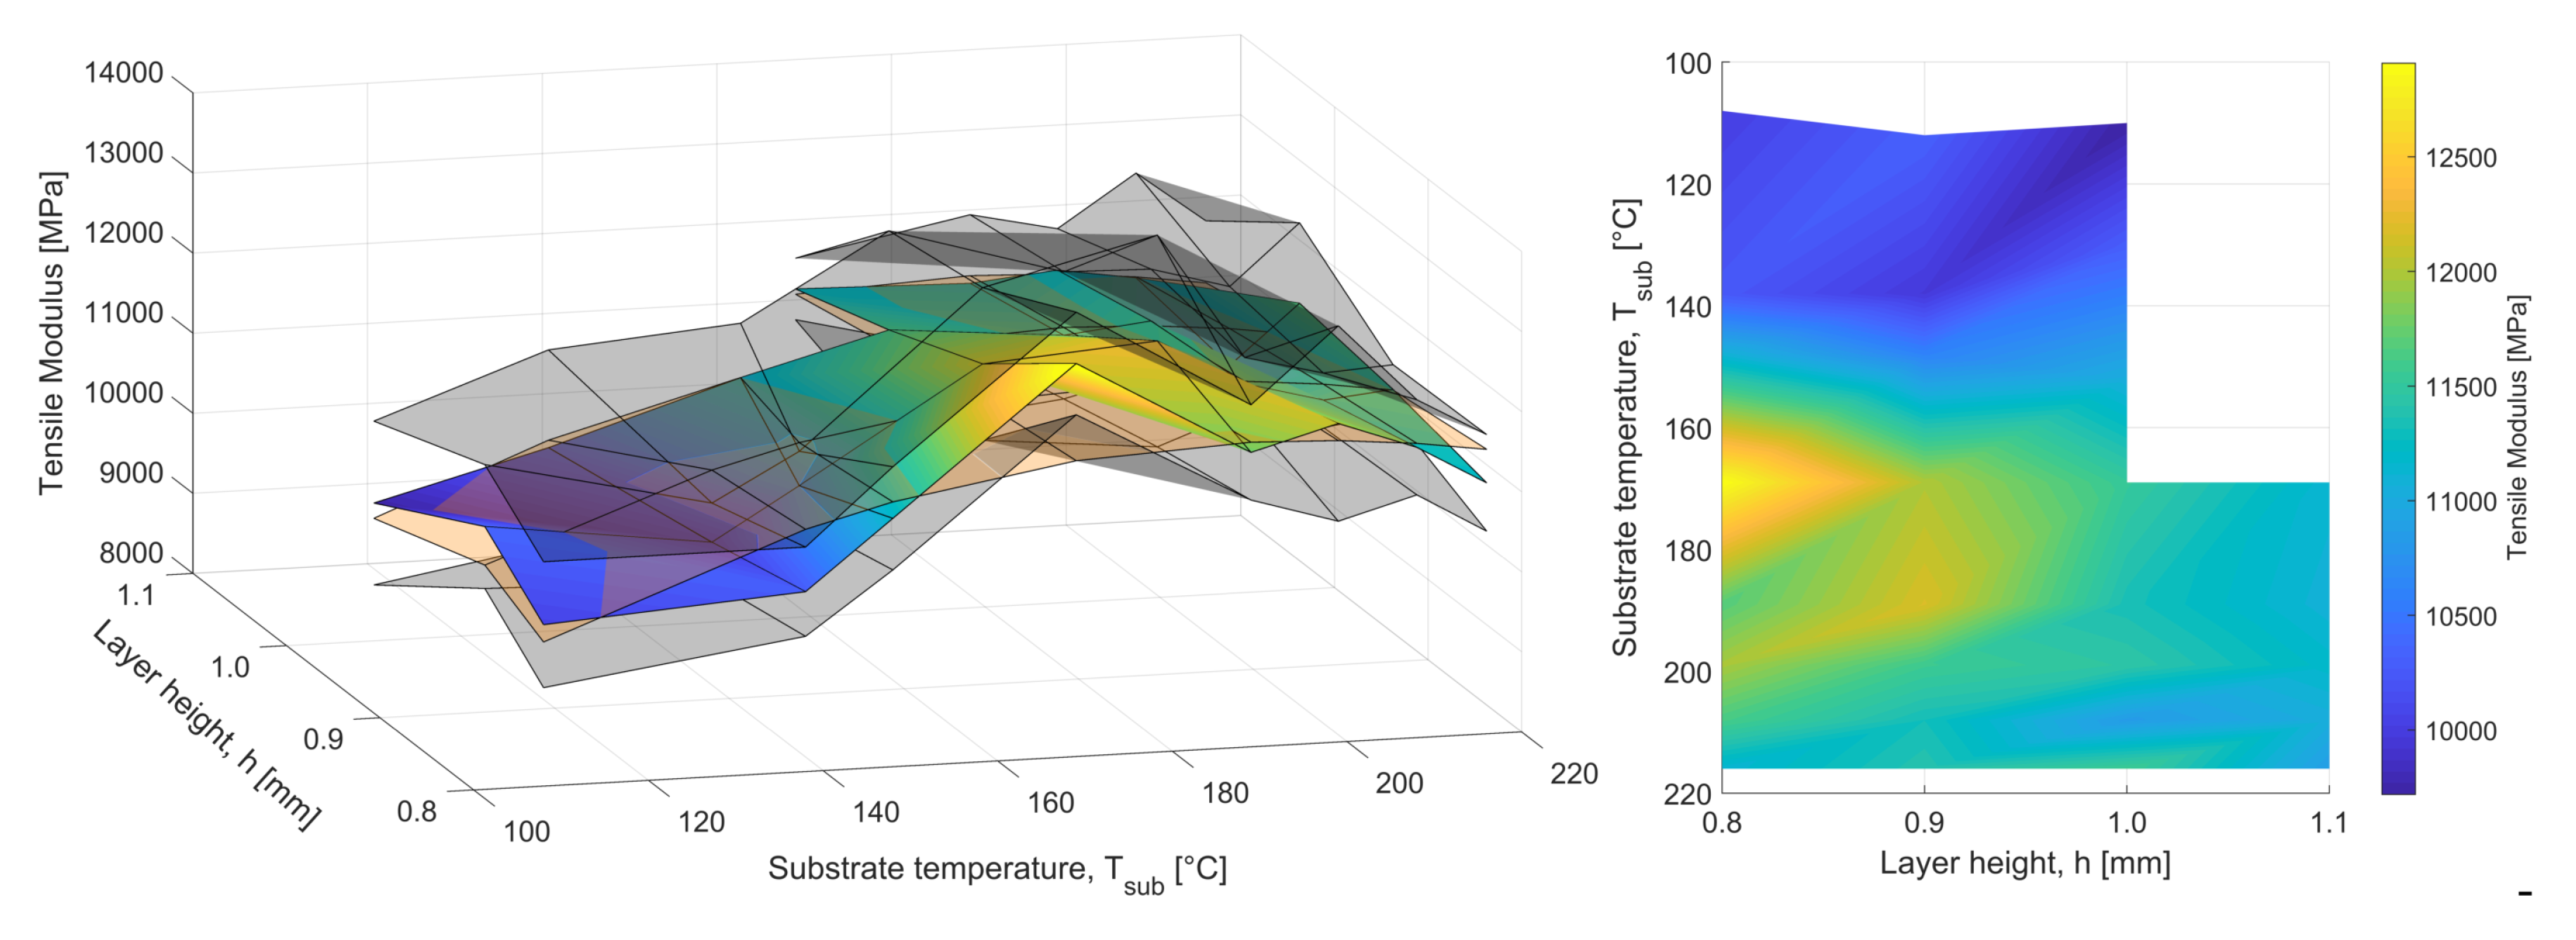
3.3. Tensile Tests and Analysis

Most of the values presented in this section were determined from five samples per setup. A few measurements were invalid because the displacement transducers slipped due to the grooves of the layer-wise formation, and were replaced by spare specimens where possible. Invalid measurements were excluded from the following analysis.
Figure 5 and Figure 6 depict tensile strength in longitudinal (x) and transverse (z) directions as 3D graphs plotted over the actual substrate temperatures and the chosen layer heights. The gray surfaces represent the 95% confidence intervals to allow judgement of the plausibility of the linear regression surface presented in orange. The 2D plots visualize the setups yielding the highest mechanical properties, suggesting an optimum in longitudinal direction for 0.8- and 0.9-mm layer height and substrate temperatures between 170 ° C and 210 ° C . This temperature range appears to shift to substrate temperatures above 190 ° C to 216 ° C for the transverse direction, with a suspected outlier at 210 ° C and 0.8 mm. A satisfactory tensile strength of at least 80% of the maximum tensile strength was achieved for layer heights from 0.8 to 1.0 mm, between 150 ° C and 216 ° C .
These results are based on the assumption that the cross-sectional area of the specimen is equal to the product of specimen width and strand width. However, as illustrated in Figure 7 for 200 ° C and layer heights of 0.8 and 1.0 mm, the actual contact area between successive layers is only the product of the sample width and the contact width of successive layers. The contact width for all setups was determined through optical microscopy to then reevaluate the data for nominal strength and modulus values.
Figure 8 and Figure 9 show nominal tensile strength based on the contact width. In the longitudinal direction, an optimum emerges for higher layer heights and temperatures between 140 ° C and 200 ° C . However, the transverse tensile strength in the build direction is more decisive as it characterizes the weakest area: the layer interface. The nominal transverse tensile strength in Figure 9 presents great strength of 90% of the maximum tensile strength across all layer heights for substrate temperatures down to around 170 ° C .
The expected high anisotropy was confirmed by the experimental data, as the transverse tensile strength reached only 17–27% of the longitudinal strength values at temperatures down to 150 ° C . At temperatures below 150 ° C transverse tensile strength amounted only to 8–11% of the longitudinal values. Figure 10 illustrates the percentage of transverse to longitudinal tensile strength. The apparent anisotropy increases for lower temperatures, especially below 150 ° C . As a representative sample, Figure 11 depicts the stress–strain curves of multiple measurements of samples with 1.0 mm layer height at various substrate temperatures. For the x- and z-direction, the curves at 217 ° C and 170 ° C are nearly congruent, while the maximum strain sustained by the 110 ° C samples is significantly lower. Interestingly, the longitudinal samples sustained higher strains the lower the temperature. Only minimal differences between the stress–strain curves of varying layer heights were found, compared to the influence of the various substrate temperatures.
An even higher anisotropy was found for the tensile modulus, which was calculated by secant slope according to DIN EN ISO 527-1 [25]:
E t = σ 2 σ 1 ϵ 2 ϵ 1
where E t is the tensile modulus in megapascal (MPa); σ 1 is stress in MPa measured at the strain value ϵ 1 = 0.0005 = 0.05%; σ 2 is stress in MPa measured at the strain value ϵ 2 = 0.0025 = 0.25%. The trends of tensile modulus results as a function of specimen thickness shown in Figure 12 and Figure 13 agree well with the nominal values adjusted for contact width. The tensile modulus in the transverse direction was only 17–22% of the longitudinal tensile modulus for substrate temperatures down to 170 ° C and 12–19% below 170 ° C . With a maximum tensile modulus in x- direction of 12,900 MPa, the bulk values provided by the manufacturer for injection molded and conditioned specimens tested according to DIN EN ISO 527-1 of 14,000 MPa [26] were almost achieved.
For both tensile strength and tensile modulus, the results at a 1.1-mm layer height and 216 ° C showed high standard deviations, which corresponded well with the low build quality achieved. A comparison was also made between the different sampling positions, comparing the test results of the top, middle and bottom samples of the longitudinal test, and the left, middle and right samples of the transverse tests. No apparent trends or significant deviations were identified. Similarly, a review of the fracture modes according to ASTM D3039 [22] did not reveal any clear trends. While longitudinal samples fractures were mostly angled or long splitting and the transverse samples fractures were consistently lateral through layer interfaces as expected [2], no trend in the location of the fracture was observed. This led us to conclude that the original parts’ mechanical properties are relatively homogenous in the longitudinal and transverse direction.
In determining the contact width through incident-light microscopy, the strand width was also measured to detect potential influences of the different substrate temperatures. Neither contact width nor strand width showed any trends as a function of temperature. The cross-sectional area of five strands was measured for each setup and showed no change for varying layer height or substrate temperature. The strand cross-section was used as quality control to ensure that all samples were manufactured at the same extrusion conditions and no technical issue such as clogging influenced the test results. Overall, the results aligned well with the expected process window, yielding satisfactory a tensile strength and tensile modulus for a wide range of substrate temperatures.

4. Discussion

In extrusion-based processes such as FDM, the interlayer strength has always been a shortcoming. Especially for large-scale deposition systems intended to manufacture large structural parts with substantial mechanical properties, the interlayer strength is an important factor to be investigated and optimized to reduce anisotropy and improve interlayer fusion bonding. Both tensile strength and tensile modulus show a trend of satisfactory values for temperatures of 170 ° C and above, with rapidly declining mechanical properties for lower temperatures. The results are in line with the hypothesis of the optimal process window for the used carbon fiber-reinforced PA6 for substrate temperatures between T e i c = 166 ° C and T m = 221 ° C [9]. Depending on the desired application, 150 ° C may be included into the process window as well, since only the tensile modulus in the longitudinal direction drops significantly beforehand. Furthermore, compared to in-house tests of injection molded dog bones of the same polymer, the results demonstrated a similar tensile strength and tensile modulus in longitudinal direction, for some setups even exceeding the injection molded results. This is expected to be due to the increased fiber alignment in the additively manufactured samples. The authors expected the highest interlayer bond strength to result from the highest feasible substrate temperature. However, both the original and nominal tensile strength results suggest that the optimum range expands over a wide temperature range, leading to the conclusion that it is not necessary to aim for the upper limit of the process window when optimizing for interlayer bond strength.
The results build on existing evidence that process temperature conditions are a major lever for optimizing fusion bonding in extrusion additive manufacturing. The results offer new insights into the relationship between strand shape and dimensions and mechanical performance. The original results, which were based on the manually measured specimen thicknesses, can serve as input for calculations and simulations of single-walled parts when correlated to their absolute wall thickness. On the other hand, the nominal results based on the contact width and area between the successive strands should be considered when modeling the mechanical properties of thick-walled or bulk material with low macro porosity. Testing multi-walled rather than single-walled parts was considered; however, real parts manufactured using FEAM technology for prototyping and production equipment manufacturing are mostly single-walled structures, therefore making the tensile properties of single-walled parts of primary interest. In addition, the use of single walled parts allowed the isolation of the effect of the actual temperature and layer height variation, without being affected by different infill patterns, the selected air gap and the overall manufacturing strategy.
The reliability of the results is impacted by the external limitations of the study, which allowed the parts to be manufactured only over several months with strongly varying ambient climate conditions, potentially affecting the variation and scatter in data. An example of such an unaccountable variation are the results of 130 ° C and of 210 ° C at 0.8-mm layer height, which deflect from the surrounding data points, suggesting some minor discrepancies in part manufacturing. Furthermore, the parts above 150 ° C were manufactured with a continuously rotating screw, while, for the remaining parts, the screw was stopped during the holding time to avoid large material build up and subsequent demounting and distortion during manufacturing. For future investigations, it is suggested that all parts be manufactured under identical and consistent conditions. Other researchers have challenged our strategy of a 1:1 ratio of extrusion and traversing velocity by manufacturing different layer heights with constant strand widths through adjustment of the extrusion speed [27,28]. We expect that this would lead to non-ideal fiber alignment, as the fibers are oriented by forced flow in a planar direction, which may have an untraceable effect on mechanical properties. While the extrusion and traversing velocity showed no effect on the cooling behavior of the parts for identical layer times, both may still have an influence on the general morphology of the printed part and thus may influence mechanical properties. However, the presented results suggest that the influence of the temperature is much more significant than the morphology within the strand, especially when considering that the layer interface is decisive for the fusion bonding and thus the tensile strength.

5. Conclusions

Anisotropy is a serious problem, since transverse strength and modulus yield only a fraction of the strength and modulus in the longitudinal direction. Process parameters have a significant effect on mechanical properties, in particular on interlaminar bond strength. Determining a suitable and full factorial process window for the major process parameters helps to achieve high part quality and good mechanical properties. In this study, we validated the proposed process window for satisfactory interlayer strength by using the presented FEAM process to manufacture identical parts at constant processing conditions, only varying layer heights and holding times for different substrate temperatures. The use of an infrared pyrometer allowed non-disruptive inline data acquisition and the correlation with robot velocity data and internal sensory data through the PLC. The expected range of high tensile strength and modulus values between 166 ° C and 220 ° C was confirmed, as was a high anisotropy between the longitudinal and transverse test results.
Since there are no specific test standards in place for large-scale additively manufactured parts, the experimental method in this study was designed to be easy and readily available, utilizing only basic laboratory equipment. This should allow easy replication of the method in other labs and with other thermoplastic materials. The resulting data from this study can further be used as a database for mechanical simulations of EAM parts and a targeted approach in choosing the right manufacturing parameters based on the parts’ desired mechanical properties.

Author Contributions

Conceptualization, N.T.; methodology, N.T.; validation, N.T.; formal analysis, N.T.; investigation, N.T. and A.M.B.; resources, N.T.; data curation, N.T.; writing—original draft preparation, N.T.; writing—review and editing, N.T., S.Z. and K.D.; visualization, N.T.; supervision, S.Z. and K.D.; project administration, N.T. All authors have read and agreed to the published version of the manuscript.

Funding

This research received no external funding.

Data Availability Statement

The data presented in this study are available on request from the corresponding author.

Acknowledgments

The authors acknowledge the material and process analysis department at BMW Group Landshut for the use of their mechanical testing facilities and climate chambers. The authors would like to thank Denis Vetters of BMW Group Landshut for his support in manufacturing and processing the parts of this study.

Conflicts of Interest

The authors declare no conflict of interest.

Abbreviations

The following abbreviations are used in this manuscript:
AMAdditive Manufacturing
DoEDesign of Experiments
DCBDouble Cantilever Beam
FEAMFreeform Extrusion Additive Manufacturing
FFFFused Filament Fabrication
GRPGlass Fiber Reinforced Plastic
PLCProgrammable Logic Controller

Appendix A

For a better understanding of the different experimental setups tested and to obtain an overview of how many samples each given value is based on, Table A1 is given below. For each temperature between 217 ° C and 110 ° C , three directions, namely x (longitudinal), z (transverse) and 45° to the printing direction, were investigated. The indices “m” and “s” indicate whether the number of samples was taken from multiple parts or a single part, respectively. As mentioned above, no significant variation between tensile strength and moduli of samples from single parts to those from multiple parts was found for the first half of the setups. For this reason, and because of the long print times, temperatures of 150 ° C and below were tested only by manufacturing a single part, so that only a single 45° specimen could be tested per setup. Since the longitudinal and transverse directions were of main interest, this was considered acceptable for the temperatures of 110–150 ° C .
Table A1. Number of valid samples contributing to the results above, with the indices “m” and “s” indicating whether the number of samples was taken from a single or multiple identical parts.
TemperatureDirectionLayer Heights [mm]
[°C][-]0.80.91.01.1
217x5 m5 m5 m, 5 s5 m
z4 m4 m5 m, 5 s5 m
45°4 m5 m5 m5 m
210x5 m5 m5 m, 5 s5 m
z4 m4 m5 m, 5 s5 m
45°5 m5 m4 m5 m
200x5 m5 m5 m, 5 s5 m
z5 m5 m4 m, 4 s5 m
45°5 m4 m5 m5 m
190x5 m5 m5 m, 5 s5 m
z5 m5 m5 m, 4 s5 m
45°5 m5 m5 m5 m
170x5 m5 m5 m, 5 s5 m
z5 m5 m5 m, 3 s5 m
45°5 m4 m4 m5 m
150x5 m5 m5 m, 5 s-
z4 s5 s5 m, 5 s-
45°1 m1 m4 m-
130x5 s5 s5 s-
z5 s4 s5 s-
45°1 m1 m1 m-
110x5 s5 s5 s-
z5 s4 s5 s-
45°1 m1 m1 m-
Figure A1 depicts a tested longitudinal test specimen after failure in the universal testing machine, together with a representative test specimen in the x (left) and z (right) direction after testing. Specimens with failure within the grip were marked as invalid and not included in this investigation.
Figure A1. Longitudinal test specimen after failure in the universal testing machine and representative test specimens in x (left) and z (right) directions after testing.
Jmmp 06 00036 g0a1

References

  1. Go, J.; Schiffres, S.N.; Stevens, A.G.; Hart, A.J. Rate limits of additive manufacturing by fused filament fabrication and guidelines for high-throughput system design. Addit. Manuf. 2017, 16, 1–11. [Google Scholar] [CrossRef]
  2. Duty, C.E.; Kunc, V.; Compton, B.; Post, B.; Erdman, D.; Smith, R.J.; Lind, R.; Lloyd, P.; Love, L.J. Structure and mechanical behavior of Big Area Additive Manufacturing (BAAM) materials. Rapid Prototyp. J. 2017, 23, 181–189. [Google Scholar] [CrossRef]
  3. Ahn, S.H.; Montero, M.; Odell, D.; Roundy, S.; Wright, P.K. Anisotropic material properties of fused deposition modeling ABS. Rapid Prototyp. J. 2002, 8, 248–257. [Google Scholar] [CrossRef] [Green Version]
  4. Malguarnera, S.C.; Manisali, A. The effects of processing parameters on the tensile properties of weld lines in injection molded thermoplastics. Polym. Eng. Sci. 1981, 21, 586–593. [Google Scholar] [CrossRef]
  5. Tekinalp, H.L.; Kunc, V.; Velez-Garcia, G.M.; Duty, C.E.; Love, L.J.; Naskar, A.K.; Blue, C.A.; Ozcan, S. Highly oriented carbon fiber–polymer composites via additive manufacturing. Compos. Sci. Technol. 2014, 105, 144–150. [Google Scholar] [CrossRef] [Green Version]
  6. Fu, S.Y.; Lauke, B.; Mai, Y.W. Strength of short fibre-reinforced polymers. In Science and Engineering of Short Fibre-Reinforced Polymer Composites; Elsevier: Amsterdam, The Netherlands, 2019; pp. 91–137. [Google Scholar] [CrossRef]
  7. van de Werken, N.; Tekinalp, H.; Khanbolouki, P.; Ozcan, S.; Williams, A.; Tehrani, M. Additively manufactured carbon fiber-reinforced composites: State of the art and perspective. Addit. Manuf. 2020, 31, 100962. [Google Scholar] [CrossRef]
  8. Bellini, A.; Güçeri, S. Mechanical characterization of parts fabricated using fused deposition modeling. Rapid Prototyp. J. 2003, 9, 252–264. [Google Scholar] [CrossRef]
  9. Tagscherer, N.; Consul, P.; Kottenstedde, I.L.; Latiri, H.; Zaremba, S.; Drechsler, K. Investigation of nonisothermal fusion bonding for extrusion additive manufacturing of large structural parts. Polym. Compos. 2021, 42, 5209–5222. [Google Scholar] [CrossRef]
  10. Boucher, E.; Folkers, J.P.; Creton, C.; Hervet, H.; Léger, L. Enhanced Adhesion between Polypropylene and Polyamide-6: Role of Interfacial Nucleation of the β-Crystalline Form of Polypropylene. Macromolecules 1997, 30, 2102–2109. [Google Scholar] [CrossRef]
  11. Riley, W.F.; Sturges, L.D.; Morris, D.H. Mechanics of Materials, 6th ed.; Wiley: Hoboken, NJ, USA, 2006. [Google Scholar]
  12. Zhuo, P.; Li, S.; Ashcroft, I.; Jones, A.; Pu, J. 3D Printing of Continuous Fibre Reinforced Thermoplastic Composites. In Proceedings of the 21st International Conference on Composite Materials, Xi’an, China, 20–25 August 2017. [Google Scholar]
  13. Rodríguez, J.F.; Thomas, J.P.; Renaud, J.E. Mechanical behavior of acrylonitrile butadiene styrene (ABS) fused deposition materials. Experimental investigation. Rapid Prototyp. J. 2001, 7, 148–158. [Google Scholar] [CrossRef]
  14. Ning, F.; Cong, W.; Hu, Y.; Wang, H. Additive manufacturing of carbon fiber-reinforced plastic composites using fused deposition modeling: Effects of process parameters on tensile properties. J. Compos. Mater. 2017, 51, 451–462. [Google Scholar] [CrossRef]
  15. DIN EN ISO 527-4:2020-08; Plastics—Determination of Tensile Properties—Part 4: Test Conditions for Isotropic and Orthotropic Fibre-Reinforced Plastic Composites. DIN Deutsches Institut für Normung e. V.: Berlin, Germany, 2020. [CrossRef]
  16. Sood, A.K.; Ohdar, R.K.; Mahapatra, S.S. Parametric appraisal of mechanical property of fused deposition modelling processed parts. Mater. Des. 2010, 31, 287–295. [Google Scholar] [CrossRef]
  17. Sood, A.K.; Ohdar, R.K.; Mahapatra, S.S. Experimental investigation and empirical modelling of FDM process for compressive strength improvement. J. Adv. Res. 2012, 3, 81–90. [Google Scholar] [CrossRef] [Green Version]
  18. Durgun, I.; Ertan, R. Experimental investigation of FDM process for improvement of mechanical properties and production cost. Rapid Prototyp. J. 2014, 20, 228–235. [Google Scholar] [CrossRef]
  19. Heller, B.P.; Smith, D.E.; Jack, D.A. Planar deposition flow modeling of fiber filled composites in large area additive manufacturing. Addit. Manuf. 2019, 25, 227–238. [Google Scholar] [CrossRef]
  20. DIN EN ISO 1110:2019-09; Plastics—Polyamides—Accelerated Conditioning of test Specimens. DIN Deutsches Institut für Normung e. V.: Berlin, Germany, 2019. [CrossRef]
  21. DIN EN ISO 15512:2019-09; Plastics—Determination of Water Content. DIN Deutsches Institut für Normung e. V.: Berlin, Germany, 2019. [CrossRef]
  22. ASTM D3039; Standard Test Method for Tensile Properties of Polymer Matrix Composite Materials. ASTM International: West Conshohocken, PA, USA, 2017. [CrossRef]
  23. ASTM D6869-17; Standard Test Method for Coulometric and Volumetric Determination of Moisture in Plastics Using the Karl Fischer Reaction (The Reaction of Iodine with Water). ASTM International: West Conshohocken, PA, USA, 2018. [CrossRef]
  24. Babatope, B.; Isaac, D.H. Annealing of isotropic nylon-6,6. Polymer 1992, 33, 1664–1668. [Google Scholar] [CrossRef]
  25. DIN EN ISO 527-1:2019-12; Plastics—Determination of Tensile Properties—Part 1: General Principles. DIN Deutsches Institut für Normung e. V.: Berlin, Germany, 2019. [CrossRef]
  26. PA6—Polyamide 6 PA6 CF40; Technical Datasheet—AKROMID® B3 ICF 40 black (5020). AKRO-PLASTIC GmbH: Niederzissen, Germany, 2018.
  27. Carneiro, O.; Silva, A.; Gomes, R. Fused deposition modeling with polypropylene. Mater. Des. 2015, 83, 768–776. [Google Scholar] [CrossRef]
  28. Eiliat, H.; Urbanic, R.J. Minimizing voids for a material extrusion-based process. Rapid Prototyp. J. 2018, 24, 485–500. [Google Scholar] [CrossRef]
Figure 1. Concept comparison between Fused Filament Fabrication (FFF) on the left and lagre-scale Extrusion Additive Manufacturing (EAM) on the right.
Jmmp 06 00036 g001
Figure 2. Part geometry with positions for single, multiple, and backup sampling in the x-, z- and 45°-direction.
Jmmp 06 00036 g002
Figure 3. Cooling curves for different traversing velocities and layer lengths.
Jmmp 06 00036 g003
Figure 4. Pyrometer signal and traversing velocity for T s u b = 130 ° C h = 1.0 mm, with region (a) displaying the variation of velocity in each layer, and region (b) illustrating the substrate temperature stabilization after 15 layers.
Jmmp 06 00036 g004
Figure 5. Tensile strength in the longitudinal direction with the left 3D plot presenting the gray surfaces as the 95% confidence intervals and the orange surface corresponding to the calculated linear regression model, and the heat map on the right depicting the test results for all parameter variations.
Jmmp 06 00036 g005
Figure 6. Tensile strength in the transverse direction with the left 3D plot presenting the gray surfaces as the 95% confidence intervals and the orange surface corresponding to the calculated linear regression model, and the heat map on the right depicting the test results for all parameter variations.
Jmmp 06 00036 g006
Figure 7. Photomicrographs of samples fabricated at a substrate temperature of 200 ° C and layer heights of (a) 0.8 mm and (b) 1.0 mm to illustrate the difference between the contact width and the strand width.
Jmmp 06 00036 g007
Figure 8. Nominal tensile strength in the longitudinal direction with the left 3D plot presenting the gray surfaces as the 95% confidence intervals and the orange surface corresponding to the calculated linear regression model, and the heat map on the right depicting the test results for all parameter variations.
Jmmp 06 00036 g008
Figure 9. Nominal tensile strength in the transverse direction with the left 3D plot presenting the gray surfaces as the 95% confidence intervals and the orange surface corresponding to the calculated linear regression model, and the heat map on the right depicting the test results for all parameter variations.
Jmmp 06 00036 g009
Figure 10. Ratios of transverse to longitudinal tensile strength in percent.
Jmmp 06 00036 g010
Figure 11. Stress–strain curves for 1.0 mm layer height at substrate temperatures of 217 ° C , 170 ° C , and 110 ° C .
Jmmp 06 00036 g011
Figure 12. Tensile modulus in the longitudinal direction with the left 3D plot presenting the gray surfaces as the 95% confidence intervals and the orange surface corresponding to the calculated linear regression model, and the heat map on the right depicting the test results for all parameter variations.
Jmmp 06 00036 g012
Figure 13. Tensile modulus in the transverse direction with the left 3D plot presenting the gray surfaces as the 95% confidence intervals and the orange surface corresponding to the calculated linear regression model, and the heat map on the right depicting the test results for all parameter variations.
Jmmp 06 00036 g013
Table 1. Manufacturing parameters for the FEAM process characterization approach.
Manufacturing ParameterValueUnitVariation
Envelope temperature23[°C]constant
(±2 °C fluctuation)
Extrusion temperature280[°C]constant
Screw speed72[rpm]constant
Extrusion velocity0.160[m/s]constant
Traversing velocity (robot)0.160[m/s]constant
Nozzle diameter2.0[mm]constant
Layer time-[s]directly varied
Substrate temperature-[mm]indirectly varied
(depending on layer time)
Layer height-[mm]directly varied
Publisher’s Note: MDPI stays neutral with regard to jurisdictional claims in published maps and institutional affiliations.

