1. Introduction
Because of globalization and product individualization, the demand for product variability and highly dynamic product lifecycles will grow in future years [
1]. Currently, machining small batches is characterized by many manual tasks, which result in long processing times, shape deviations, and high costs. To realize the aim of autonomous machining, the process planning of manufacturing processes, such as milling or drilling, has to become more flexible, versatile, and robust in order to adapt the initial process to the process changes [
1].
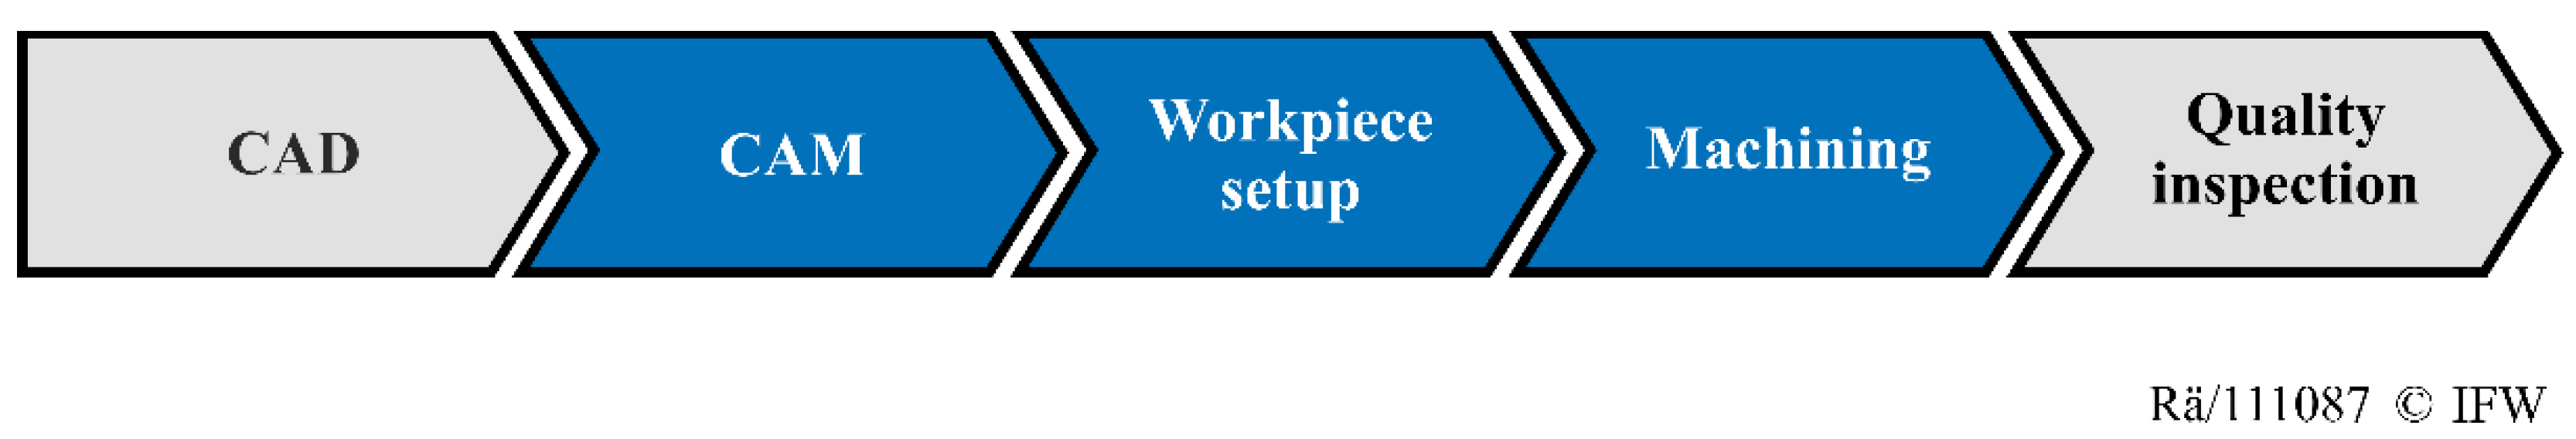
A typical process chain for milling processes is shown in
Figure 1, and can be sequenced in the following order [
1,
2,
3,
4]: After the computer-aided design (CAD) of the workpiece, process planning is conducted on computer-aided manufacturing (CAM) software to generate a numerical control (NC) code for the manufacturing process. Next, the machine tool is set up, meaning that the raw part is clamped, and the manual workpiece detection is applied using a probe. Then the machining process is executed. After machining, a quality inspection can be conducted to measure the shape and surface quality of the finished workpiece.
According to Schmitt [
4] and Zhu [
3], one of the challenges for developing an autonomous machine tool is flexible automatic blank detection. The exact location, the orientation of the blank, and its dimensions are required for the machining process [
4]. After clamping a blank in the machine tool, workpiece detection is required for collision-free and accurate machining. In order to overcome this challenge, a new method for automated shape acquisition is necessary [
3]. A digital shadow can be applied for autonomous raw-part detection to adapt the CAD/CAM planning to the real geometries [
3,
5]. In this case, the CAD file of the raw part represents the digital shadow. Therefore, the digital shadow can be seen as a preliminary stage of the digital twin [
6].
2. State of the Art
According to Kritzinger et al., the following distinction between the digital twin and digital shadow is made [
7]: A digital twin is a digital representation of a physical object. The data flows between the physical and the digital object are fully integrated into both directions. As a result, a change in the state of the physical object directly leads to an automatic change in the state of the digital object, and vice versa. By contrast, the digital shadow only represents an automated one-way data flow between the state of an existing physical object and a digital object. As a result, a change in the state of the physical object leads to a change of state in the digital object, but not vice versa.
Currently, process planning is primarily based on the expected raw-part geometry. The real shape of the raw part is not taken into account [
3]. Hence, shape deviations can lead to process deviations during machining. Digital twins are usually not applied in practice [
2]. As a result, the planning of manufacturing processes is a time-consuming and manual task, which requires the personal experience of the operator [
3]. Therefore, a digital shadow is required for the generation of a digital twin [
6]. An essential step in generating the digital shadow of a raw part is workpiece detection [
3]. This can be achieved by contact and noncontact measuring devices [
8]. A touch probe is an example of a contact measuring method that is commonly used for workpiece detection and inspection because of its high accuracy [
9]. However, the probing process cannot be fully automated because of the collision risk and the variety of workpiece properties [
8], e.g., different locations or shapes [
10]. Furthermore, probing is a time-consuming process that can take up to several hours for complex parts, such as sculptured or blade surfaces, because the reference points are difficult to identify and the planning of collision-free paths is time-consuming [
10,
11]. Another issue is that the measurement quality is dependent on the manual selection of the measuring points and the paths of the measuring process [
10].
An alternative for the contact measuring device is noncontact optical sensors. These sensors are fast and accurate. Several approaches use optical sensors based on structured light, conoscopic holography, photogrammetry, or laser triangulation [
12]. In the following sections, some of these implemented strategies will be further discussed. Son et al. introduce an implementation of a laser scanning system to measure freeform surfaces [
13]. A CNC laser scanner is embedded in a semiautomatic measuring process chain. This process chain consists of scan planning, scanning, and the alignment of the measured data to the predefined CAD model. Another integration of a laser triangulation sensor in a process chain is presented by Schmitt et al. [
14]. In this application, a laser scanner is used for scanning and for the digitalization of defect-forging tools. Similar to this approach, Denkena et al. describe an approach for an automatic re-contouring of repair-welded tool shapes using a laser line scanner for the optical acquisition of the actual workpiece geometry [
15]. The sensor is coupled with machine axis data for the registration of the point cloud during 5-axis scanning. Rajaraman et al. present a robot equipped with a laser distance sensor for the automatic digitalization of weld seams [
16]. The resulting point cloud is used for registration with the iterative closest point algorithm and for automatic object detection, which is based on two-dimensional template matching. These various examples show that laser scanning systems for raw-part detection can acquire high-precision data while accomplishing a short measuring time [
12,
17]. Furthermore, the appearance of reflections and other interferences in the measuring data can be a challenging task [
13,
17]. Automated object detection through the use of laser scan data is especially challenging. Current approaches utilize the time-consuming matching of the nominal user-defined CAD geometry with the measuring data [
13,
16].
An alternative for object detection is photogrammetry, which has been implemented in various semiautomatic approaches [
4,
18,
19]. By using a camera system and photogrammetry methods, many different shapes can be measured with a high speed. However, the accuracy is low compared to other technologies [
20,
21]. Besides these two measuring principles, structured light methods are used to acquire digital workpiece representations [
22,
23]. Structured light systems tend to have high accuracy, fast scanning speeds, and wide measuring ranges [
24]. However, the use of structured light antireflection coating is needed to reduce mismeasurements and the necessity for filtering in the 3D reconstruction [
23,
24]. Furthermore, because of insufficient accessibility, undercuts cannot be scanned properly [
24]. Moreover, chromatic confocal sensors are used for the acquisition of a digital workpiece representation in micromanufacturing [
25,
26]. Chromatic confocal sensors can achieve high accuracy but tend toward long measuring times in comparison to other sensors because of their low measuring range and the discrete point-by-point inspection [
25,
26,
27,
28].
The currently existing and proposed approaches are mostly semiautomatic configurations for workpiece detection. The main challenges to these approaches are automated sensor path planning and fast, robust, and automated object recognition. Moreover, the current approaches are mostly unable to automatically generate a digital shadow of the detected workpiece. Therefore, the real workpiece geometry is not considered in the CAD/CAM chain. Therefore, the processes cannot be adapted to real geometry.
3. Approach
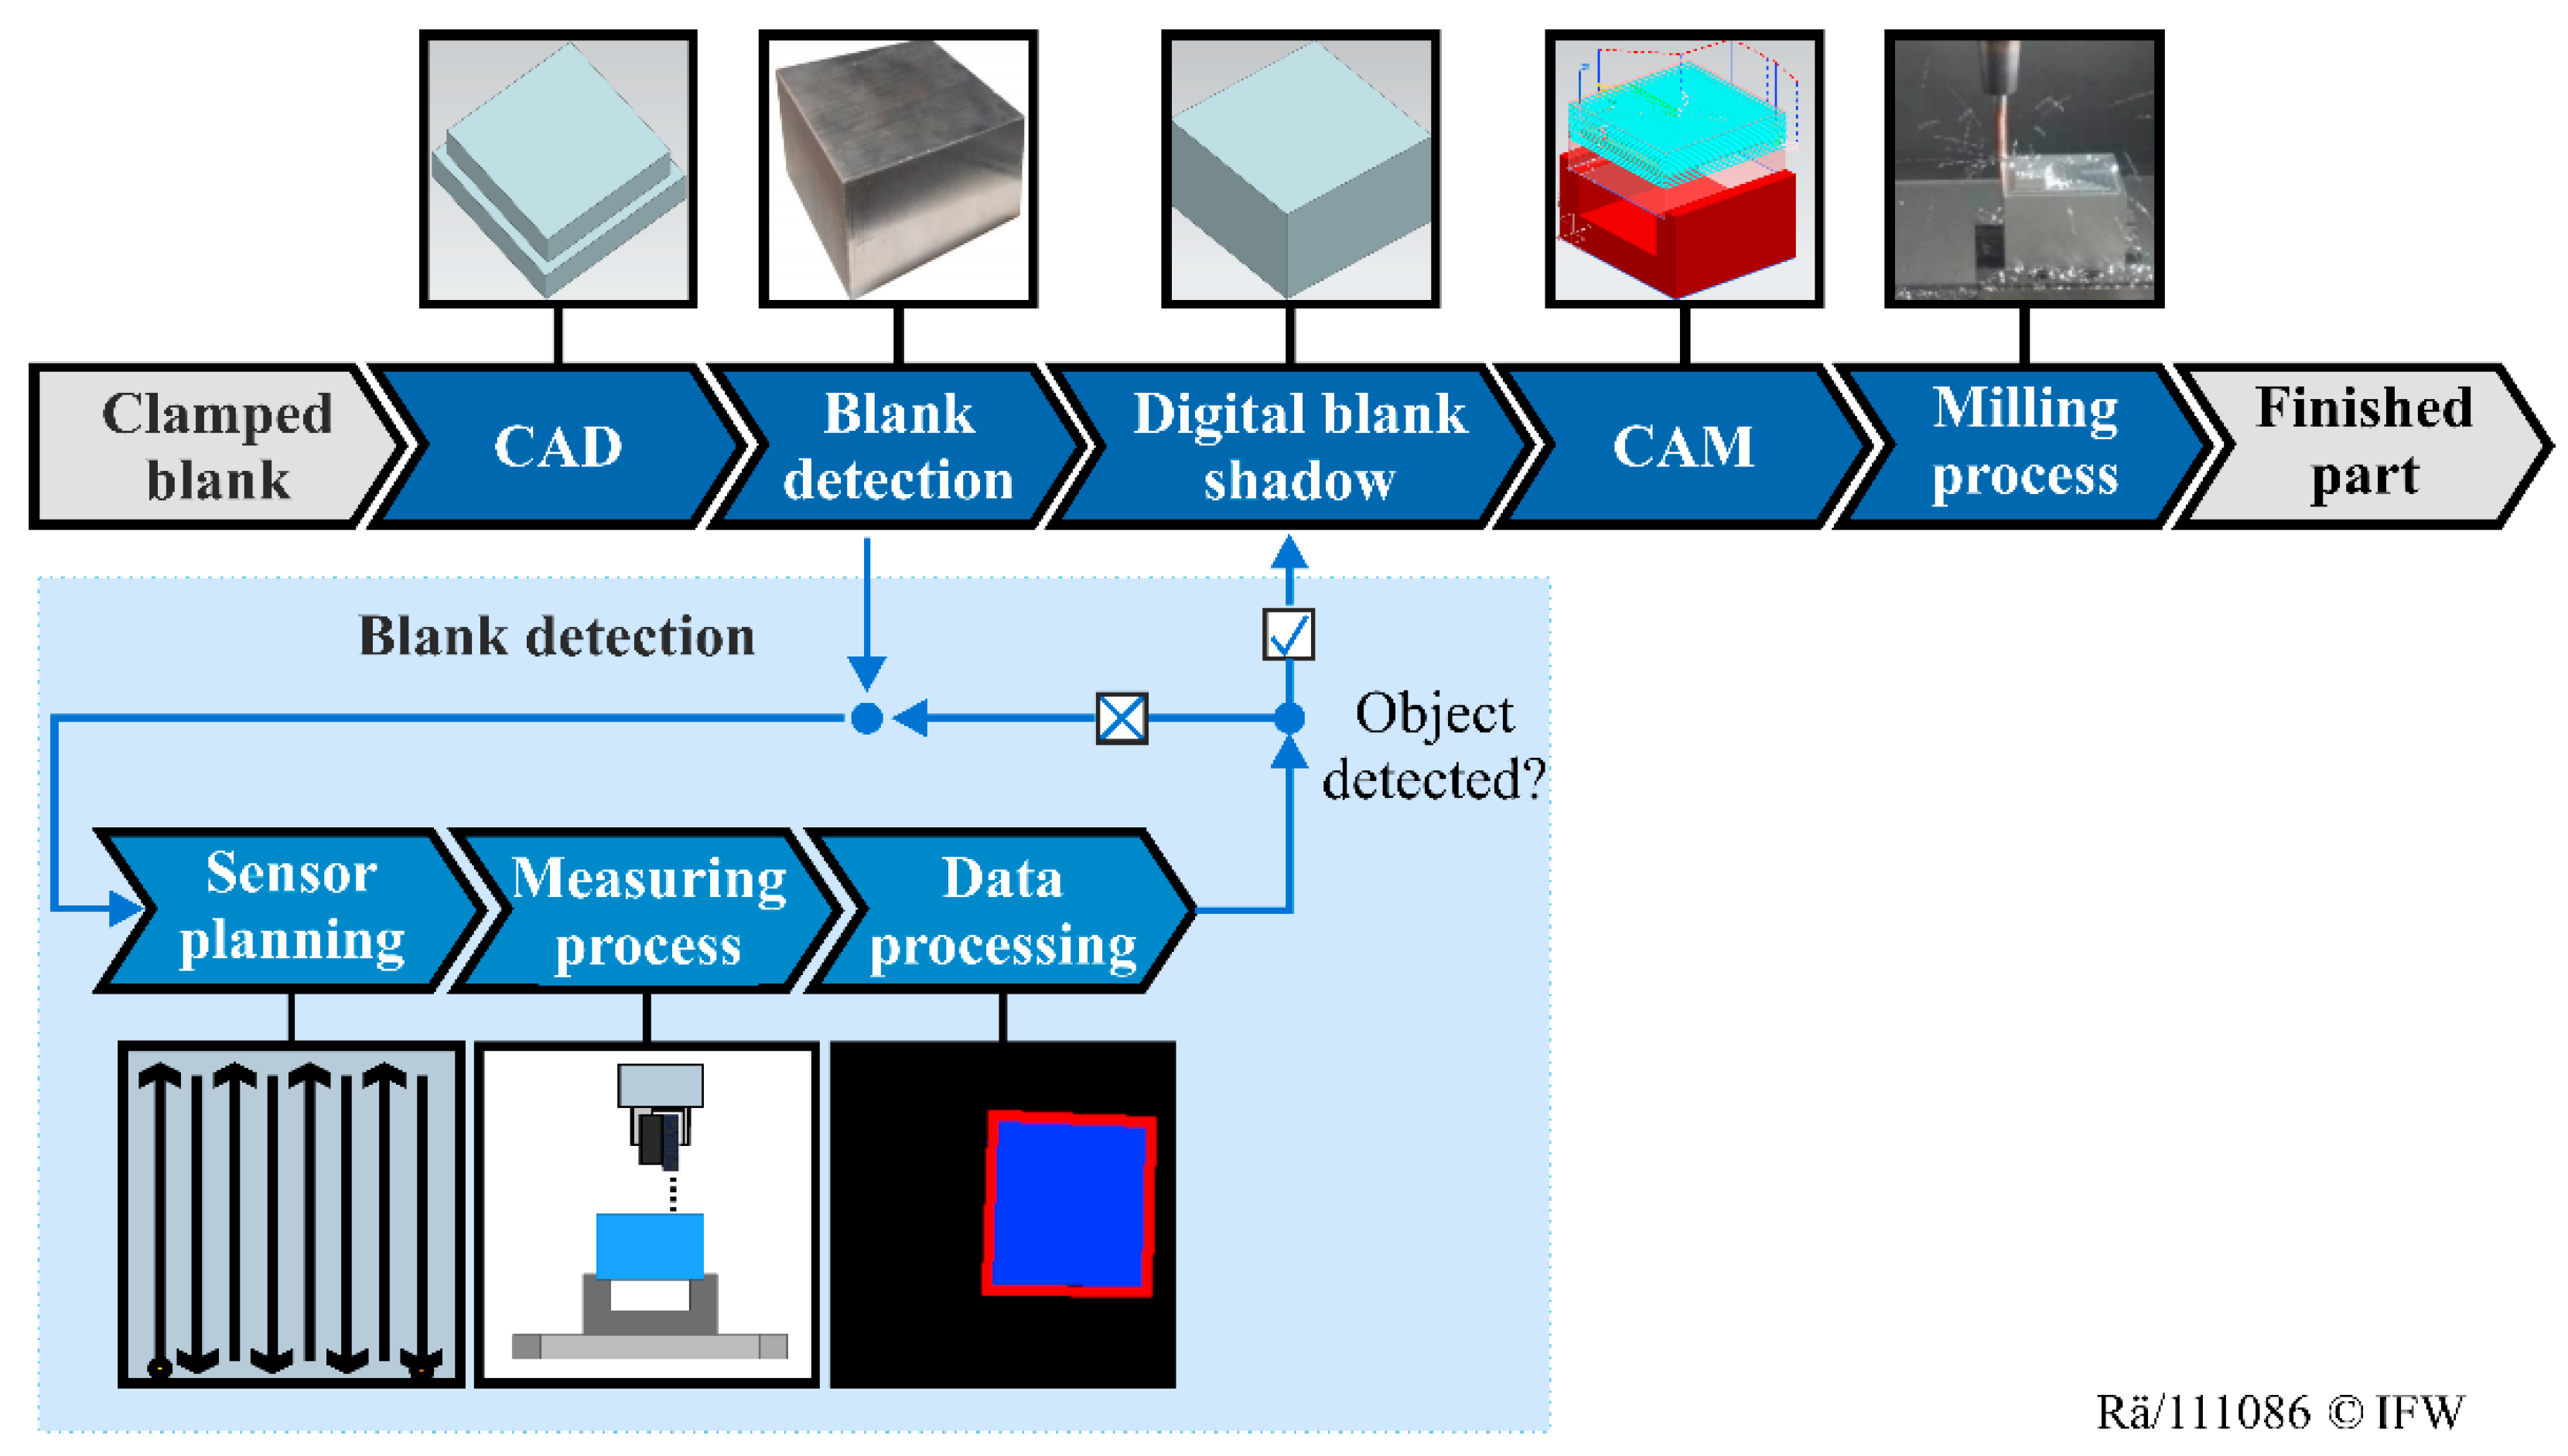
This work aims to investigate a fully automatic method for blank detection, which could be integrated into an overall developed CAD/CAM chain for an autonomous milling process. This CAD/CAM chain and its single sequences are illustrated in
Figure 2 and will be further discussed.
In the first step of the fully automatic process chain, a blank is clamped in a machine tool. After the workpiece CAD definition, automatic blank detection is initiated. Then, sensor path planning is executed, and this generates the NC code for the sensor paths automatically. This is an iterative process that consists of the following steps: sensor path planning, the measuring process, and data processing. Each step is described in the following sections. First, initial automatic sensor path planning is generated, which segments the workspace into measuring planes on different heights. Next, the automatic measuring process for the first measuring plane is executed. Afterward, as part of the data processing, object detection is applied to search for an object in the current measuring plane. If no object is found, sensor path planning for a further measuring area is conducted. If a raw part is detected by the automated object detection, a fine recognition with a touch probe could optionally be applied to achieve higher accuracy results. Prepositions for the touch probe measuring are created by means of automated object detection in order to avoid collisions and to enable small measuring paths close to the workpiece. After the blank detection, a corresponding digital blank shadow is automatically designed. On the basis of the digital blank shadow, the whole milling process for the defined workpiece could be planned automatically. In the current research, a digital blank shadow is applied for the adapted process planning of a simple cavity milling process. An automatic cutting face recognition, which is based on normal vector, position, and shape geometry, is implemented. In the current application, predefined process parameters and tools are used. This method focuses on raw-part detection, and even more complex process planning, further automation, and robustness against process interferences are not considered. Afterward, the NC code for all of the defined operations could be postprocessed and transferred to the CNC machine. Finally, the milling process could be conducted to machine the desired workpiece.
With autonomous process planning, the time and complexity for the milling process could be reduced by omitting time-consuming manual planning processes. Furthermore, this chain allows for adaptions of the milling process to different workpiece geometries, or to various blank types and dimensions. In the following sections, the process steps are explained in greater detail, with a focus on raw-part detection.
3.1. Sensor Path Planning
In this approach, a laser triangulation sensor is used for the noncontact blank detection because of its high precision and short measuring time compared to other sensors [
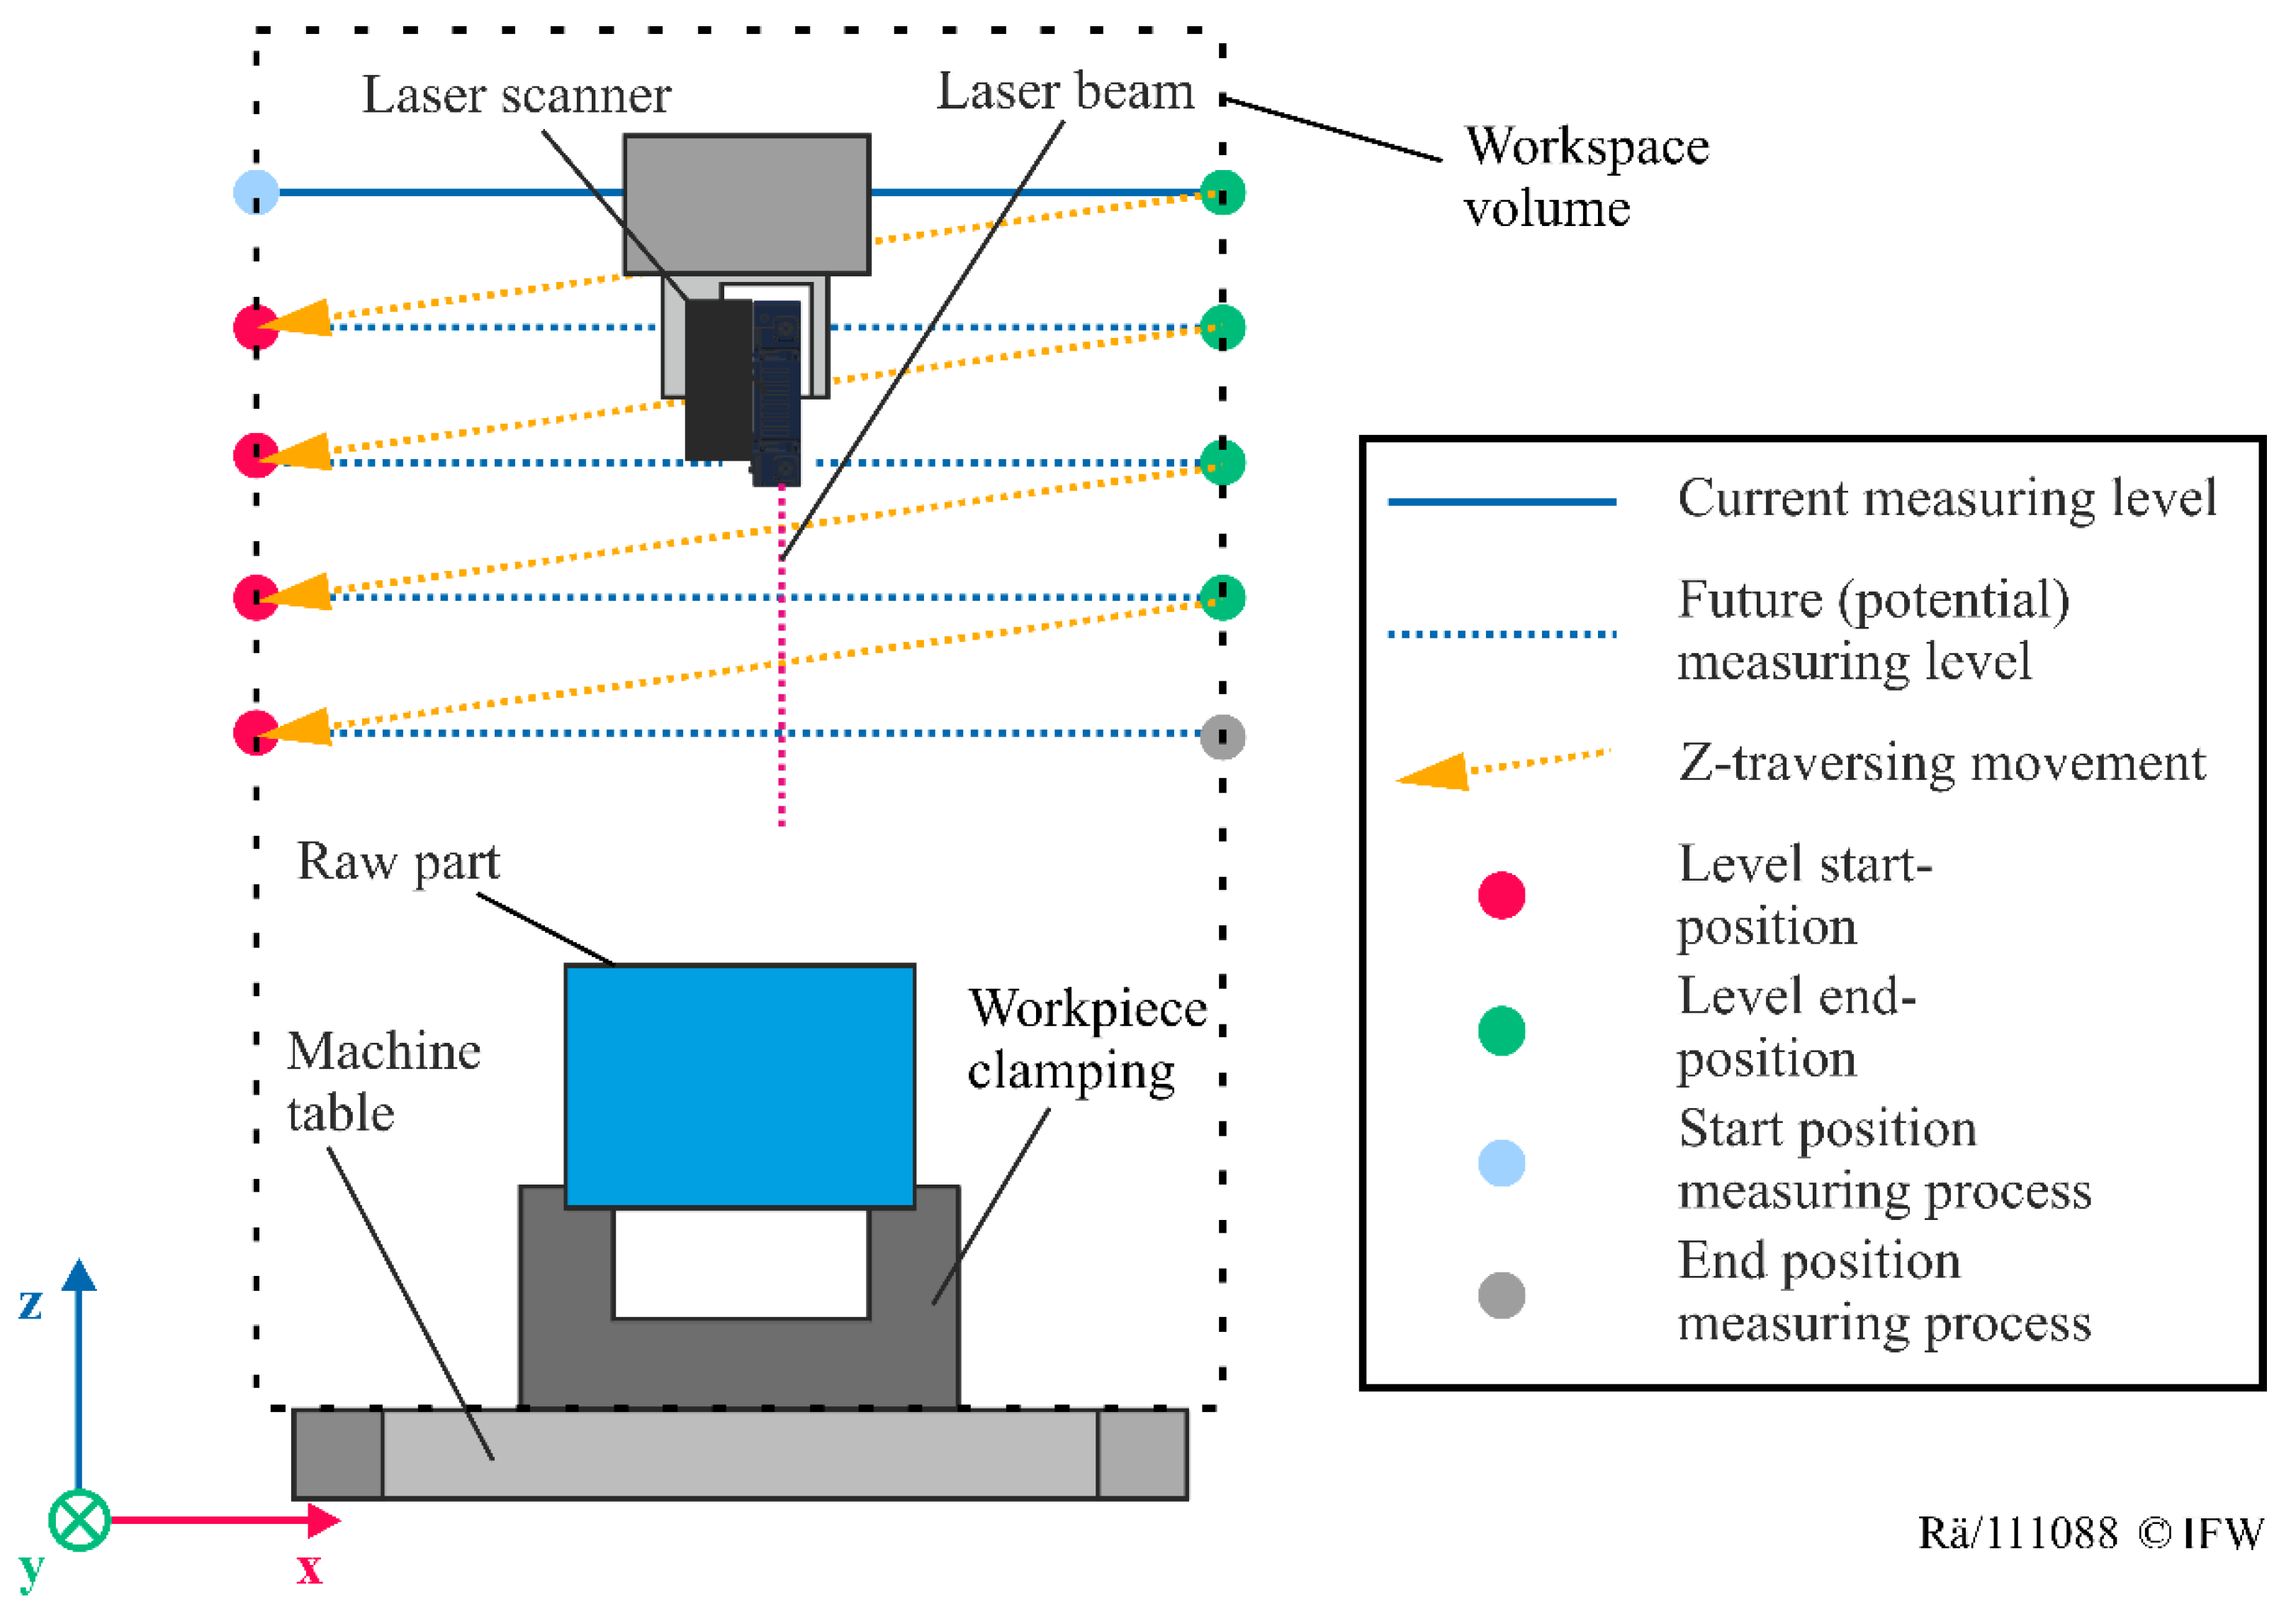
12]. The presented method can be easily adapted to other sensors. The application of a laser distance sensor for raw-part detection leads to challenges, especially for the inspection of complex shapes. One challenge is the limited two-dimensional measuring range of the sensor. This range, which is about 10–100 mm long, depends on the sensor model, the sensor manufacturer, and the requirements of sensor accuracy. For this reason, multiple measurement planes for the inspection are required. For the necessary movement of the sensor, it can be mounted on a movable component of the CNC milling machine. In the proposed application, the sensor is fixed to the spindle. The sensor is linked to the machine axis data, so that the movement of the spindle corresponds with the movement of the laser scanner and the acquired measuring points. To scan the whole workspace with the limited measuring depth and field of the sensor, several measurement planes and in-plane paths are created, as illustrated in
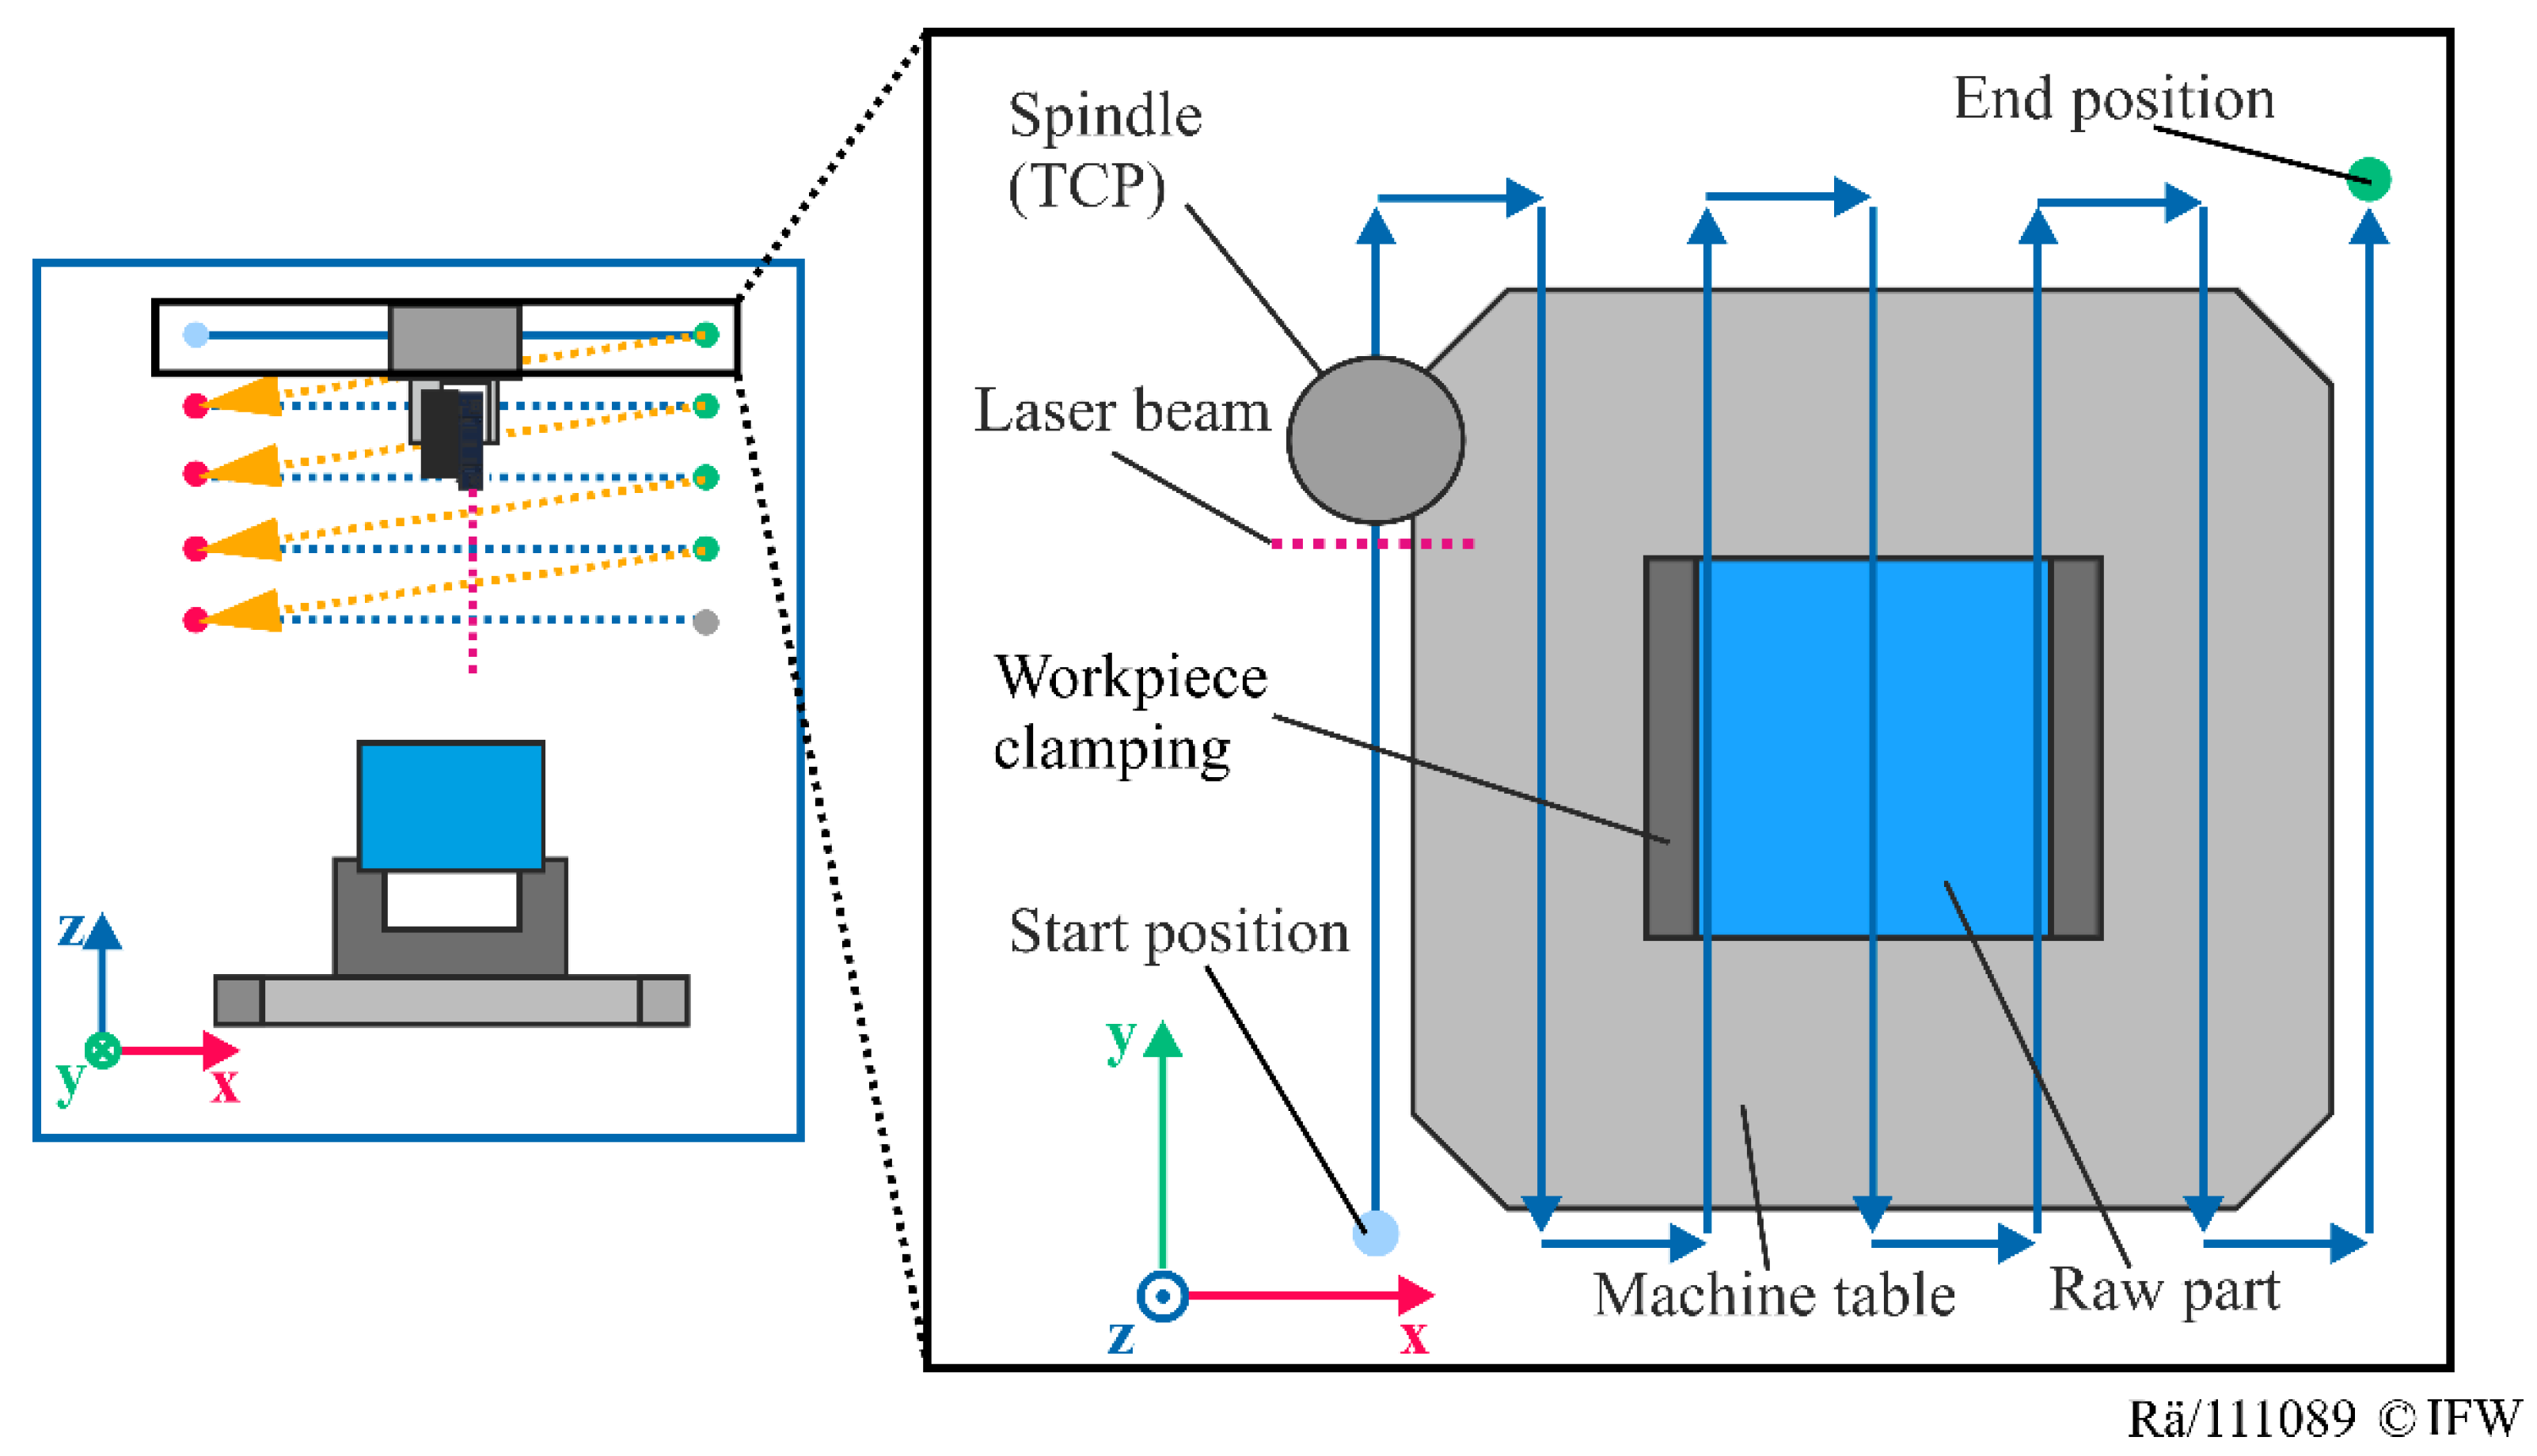
Figure 3. The first step in the algorithm divides the workspace volume into several planes in the z direction in order to overcome the challenge of a limited measuring depth. Starting from an initial height (“start position measuring process”), which is defined by the workspace limits, the sensor is moved as long as there is no detected shape (“end position measuring process”). The distance of these planes is equal to the measuring range of the sensor. In this way, the whole workspace can be mapped. Each plane is too large to be measured with a single scan. Therefore, the axis with the sensor is moved from the xy starting position to the xy end position of this plane. In
Figure 4, the principle of a potential path planning strategy is shown. To reduce the measuring time, the sensor is moved along a zigzag path in each plane where the scanning lines overlap in order to prevent gaps in the resulting point cloud.
After generating an NC code for the sensor path with CAD/CAM software, the code is automatically transferred to the machine tool. One approach is to automatically create the NC code using a template in C#, which is referenced to the machine coordinates. This NC-code template contains variables. The individual zigzag paths are generated by a loop. The specific start and end positions of the zigzag path are determined by the minimum and maximum positioning limits in the x and y directions of the machine tool. During processing, the variables in the NC-code template are replaced by the positioning limits,
xmin,
xmax,
ymin,
ymax, and the z-height. The distance between the paths of the zigzag path is specified by the line width of the sensor. Another option is to create the NC code using CAD/CAM software, such as Siemens NX. In this case, the machining area is represented by a scalable rectangular area. Furthermore, the sensor is defined as a simplified tool with a holder. By means of the defined holder, the sensor offset between the sensor center point and the tool center point (TCP) can be defined. For the definition of the zigzag measuring path, a simplified face milling operation in zigzag mode is defined. The positioning limits of the machine tool are defined by the size of the scalable rectangular area. The workpiece origin defined in the CAD/CAM software is displaced translationally to the position of the machine origin. As a result, the NC code generated by the machine-specific postprocessor is referenced to the machine coordinates. The sensor path planning in Siemens NX is automated by the software library, NXOpen, in C#. Afterwards, the transferred NC code is executed to move the sensor during the measuring process (see
Section 3.2).
3.2. Measuring Process
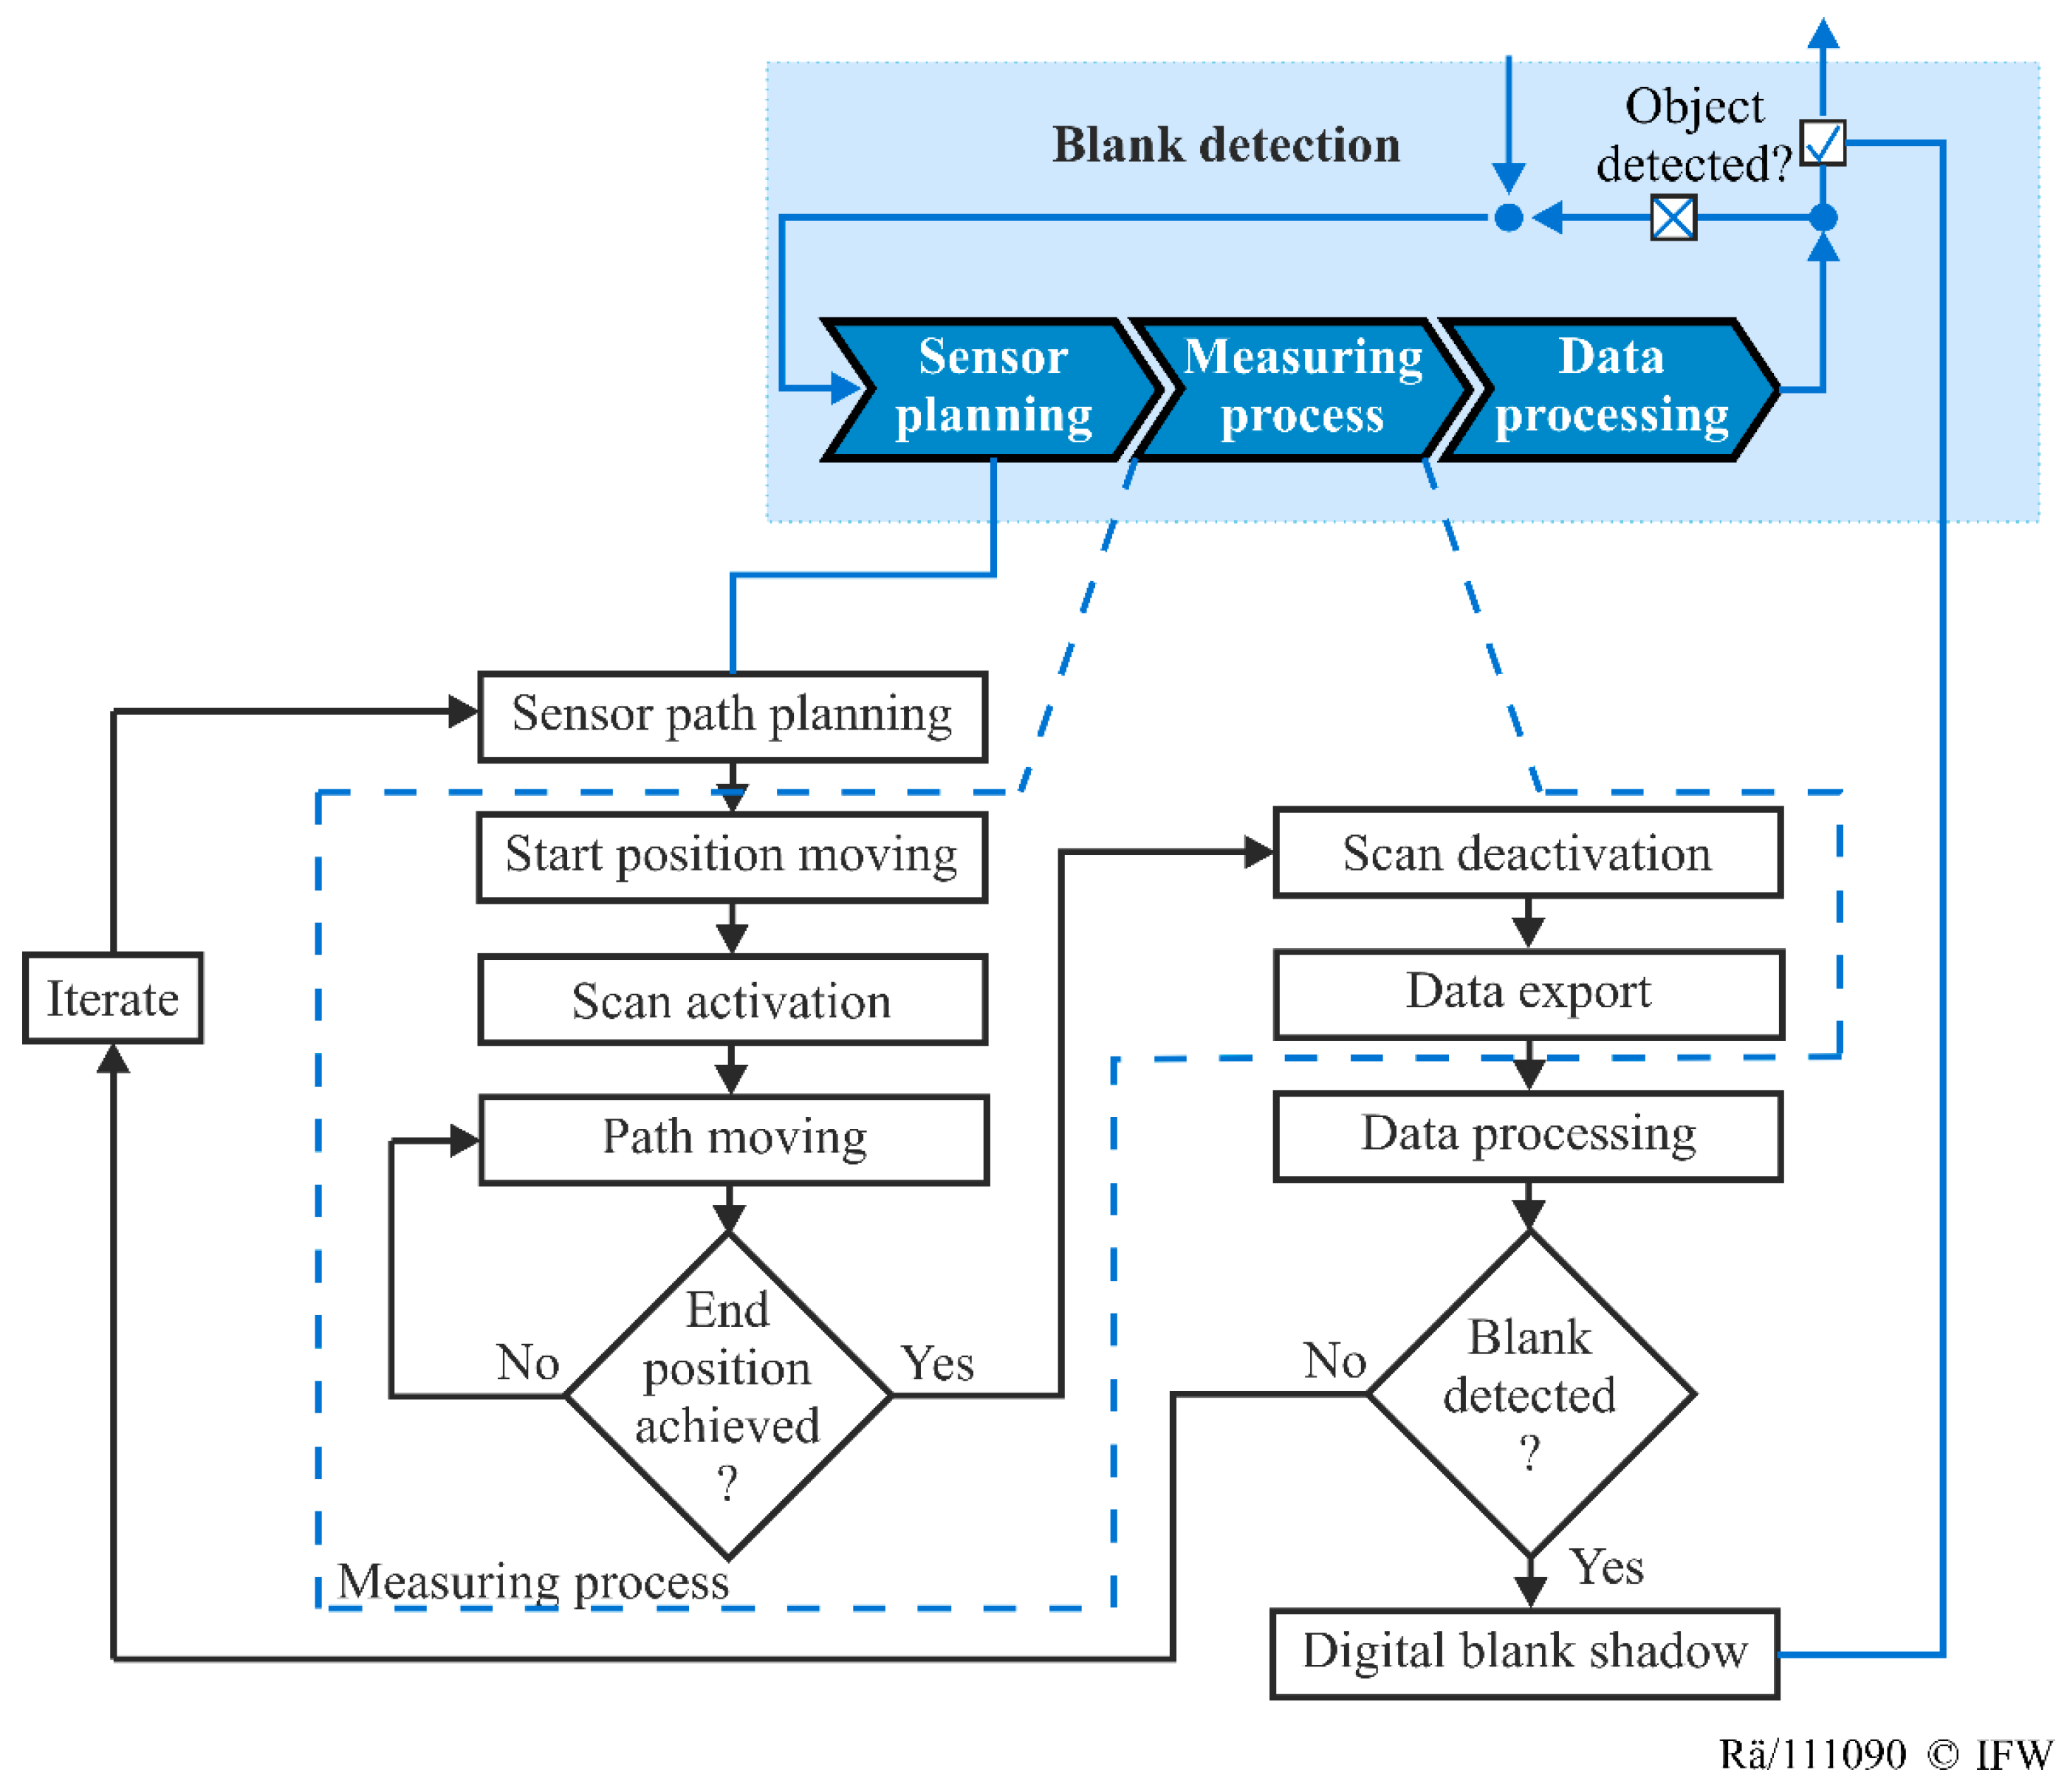
The measuring process is illustrated in
Figure 5. From the predefined global starting position, the sensor is moved to the local starting position of the first generated xy plane. After reaching the starting position, the scan process starts, and measuring data is recorded. The sensor is moved to the end position of the plane, as described in
Section 3.1. At this position, the recorded measuring data is exported, and data processing is conducted. During this processing, the resulting plane data is analyzed to recognize a raw part in the investigated xy plane. If no blank is detected, and if the lowest predefined z level before a collision is not reached, the NC code for the next measuring process is created by the sensor path planning and is started on the machine tool. This iterative process continues until a blank is detected, or until the minimum z level is reached.
3.3. Data Processing
The resulting data of the sensor, which is linked to the machine axis data, consists of three-dimensional coordinates of the surface, as illustrated in
Figure 6. The entity of these points is called the “point cloud”, and it contains information about the desired measuring object shape and mismeasurements. These mismeasurements are mainly caused by the metallic surfaces of the workpiece clamping, the machine table, or other surfaces of the blank. For data processing and automatic object detection, these points can lead to incorrect shapes and dimensions. Therefore, these components have to be removed by filters (z-interval decomposition, image conversion). Afterward, the bounding-box algorithm is applied for object detection. If an object is detected, interesting points, such as center or corner points, will be determined. To derive the machine coordinates of the interesting points, a coordinate transformation is applied. In addition, a digital blank shadow is generated for the CAM planning. In the following sections, the individual steps are described in detail. First, the z-interval decomposition will be discussed (see
Section 3.3.1).
3.3.1. Z-Interval Decomposition
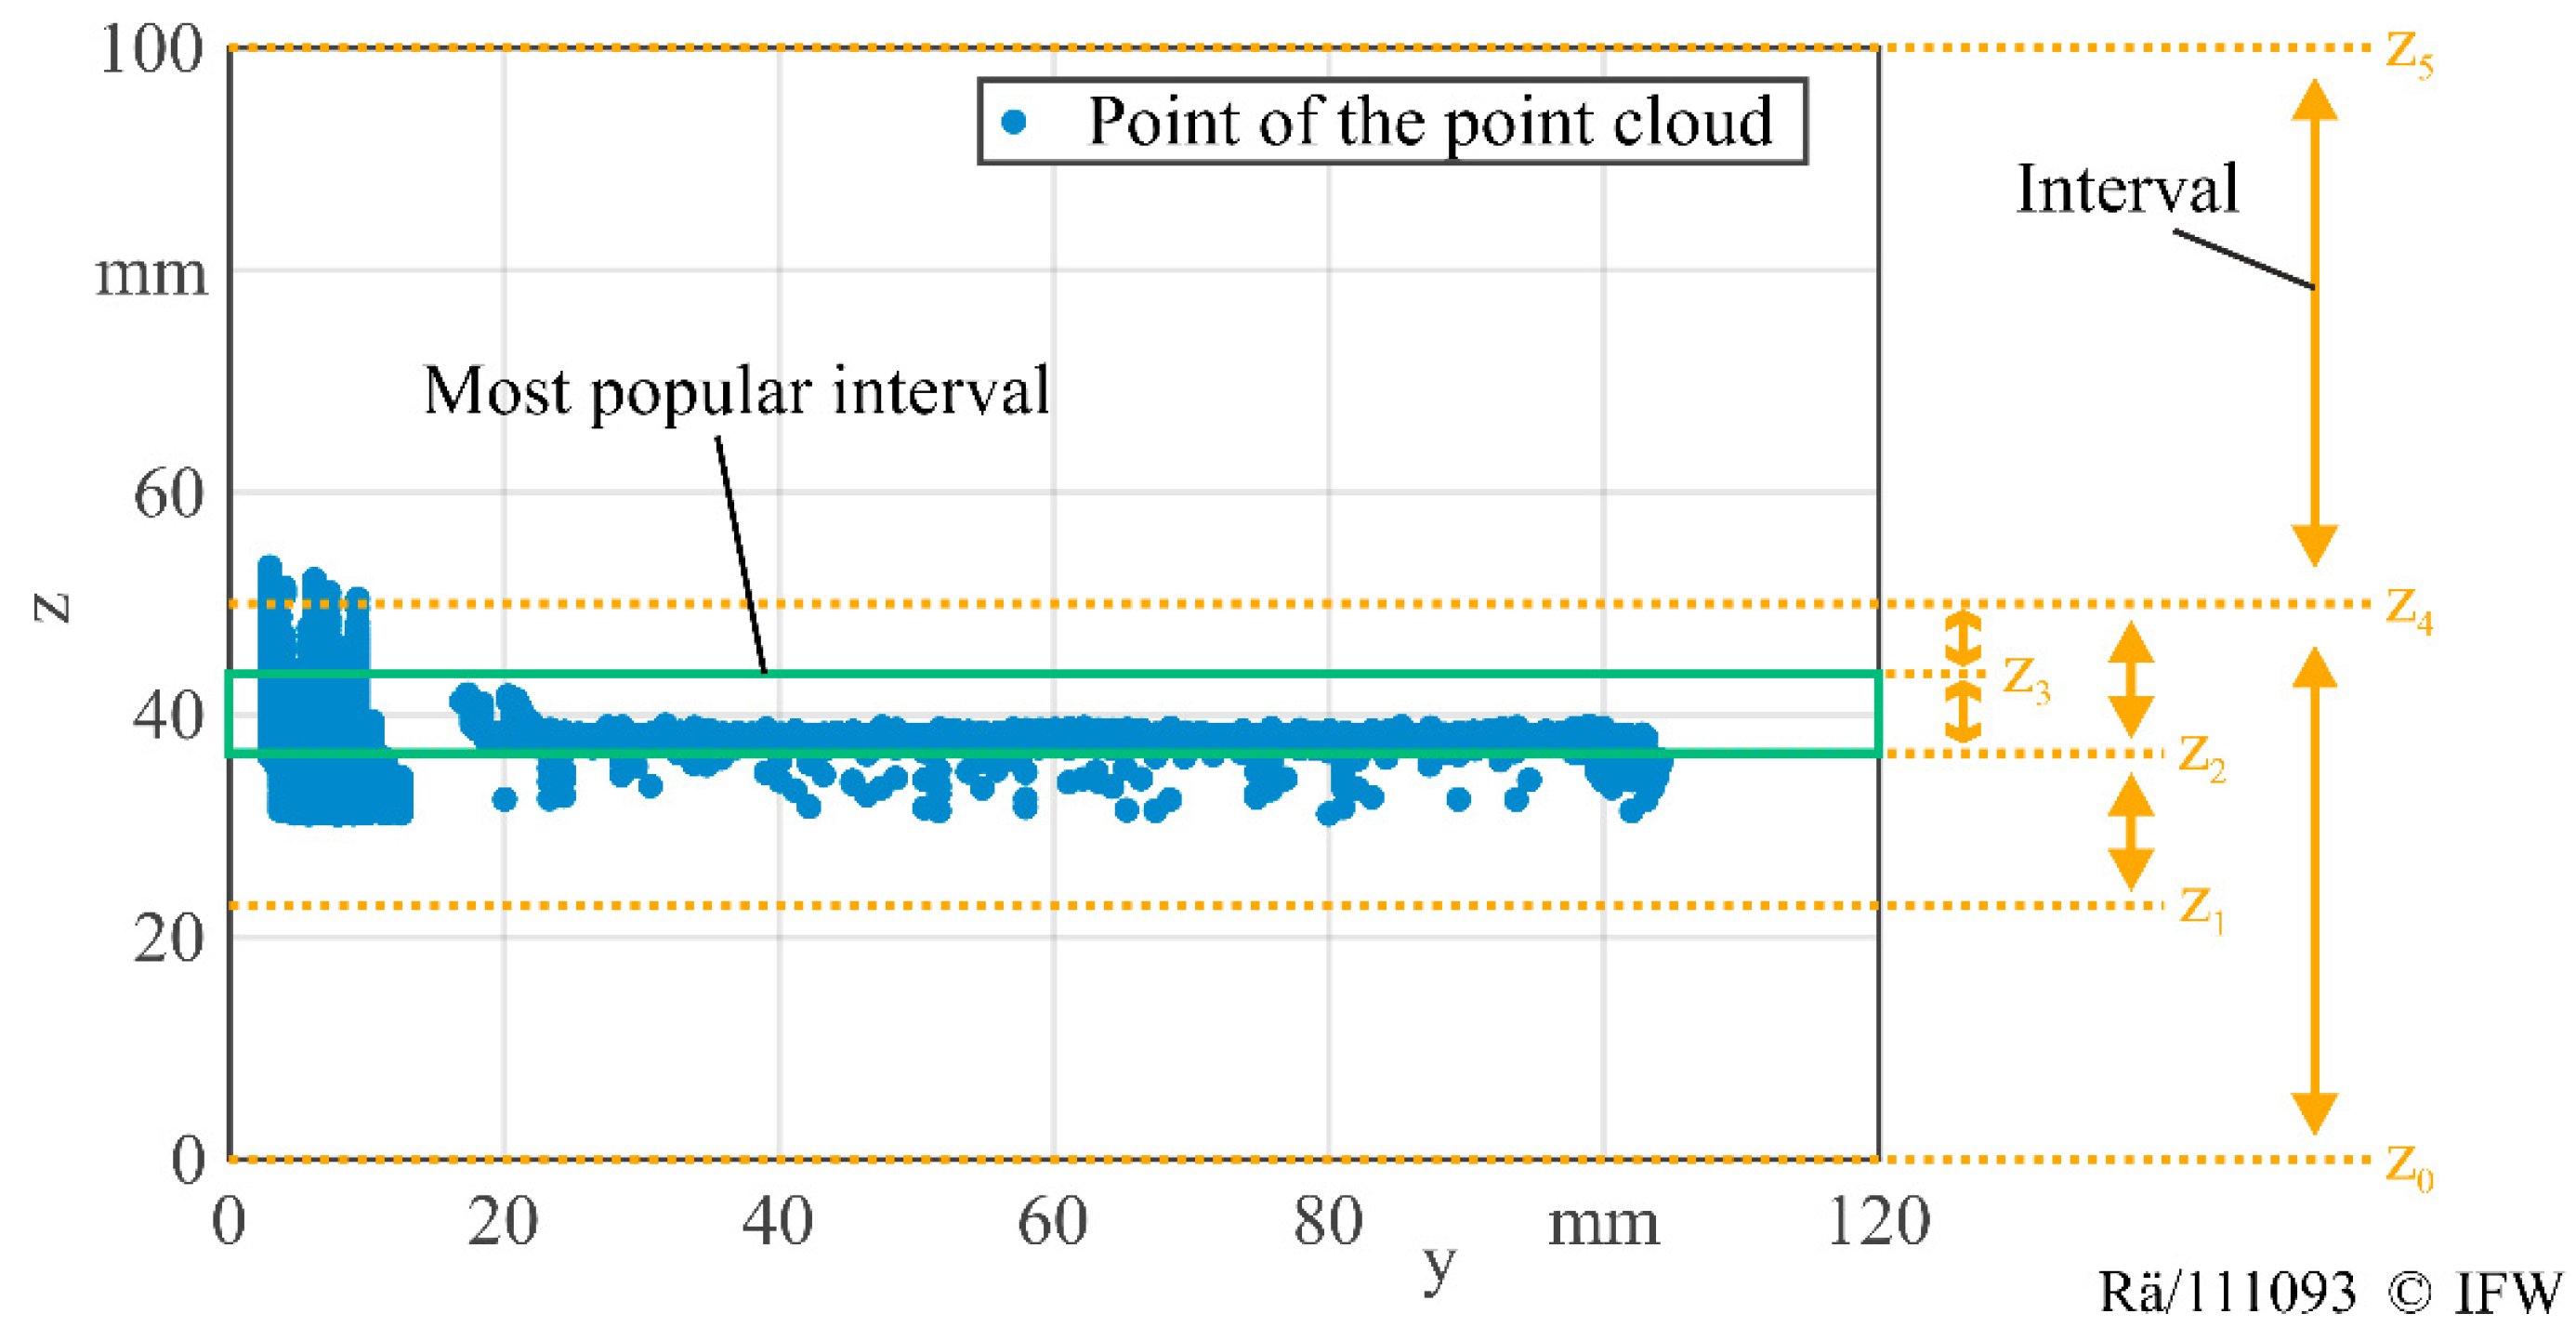
To determine simple component shapes, such as cuboids or cylinders, no information about the three-dimensional point cloud is necessary. Instead, it is sufficient to examine only the round or rectangular surfaces of these components. Using this approach, it is possible to transform an existing three-dimensional point cloud and use it as a two-dimensional dataset. This results in a shorter computational time and reduces the complexity of the process. Therefore, in the first step of the measurement data evaluation, the point cloud is decomposed into a defined number of z intervals, as shown in
Figure 7. With the decomposition into z intervals, the xy plane with the most measuring points is determined for each measuring process, which is called the most popular interval. To find the most popular interval, the point cloud is segmented into a distinct number of levels in the z direction (see z
0–z
5). To reduce the computing time, the search starts with large intervals and ends in small intervals. As shown in the figure, most points of the point cloud scatter in the intervals of z
2 and z
3. For blank shapes that are expected to be planar in the z planes, the z values of those points that are in this interval are set to the average value of all the points in this interval. Thus, a complex 3D problem is simplified into a 2D problem. The points outside the interval are removed since these coordinates are insignificant. As all points now have the same z value, only the x and y values of the remaining point cloud are considered in the next step (see
Section 3.3.2).
3.3.2. Image Converting
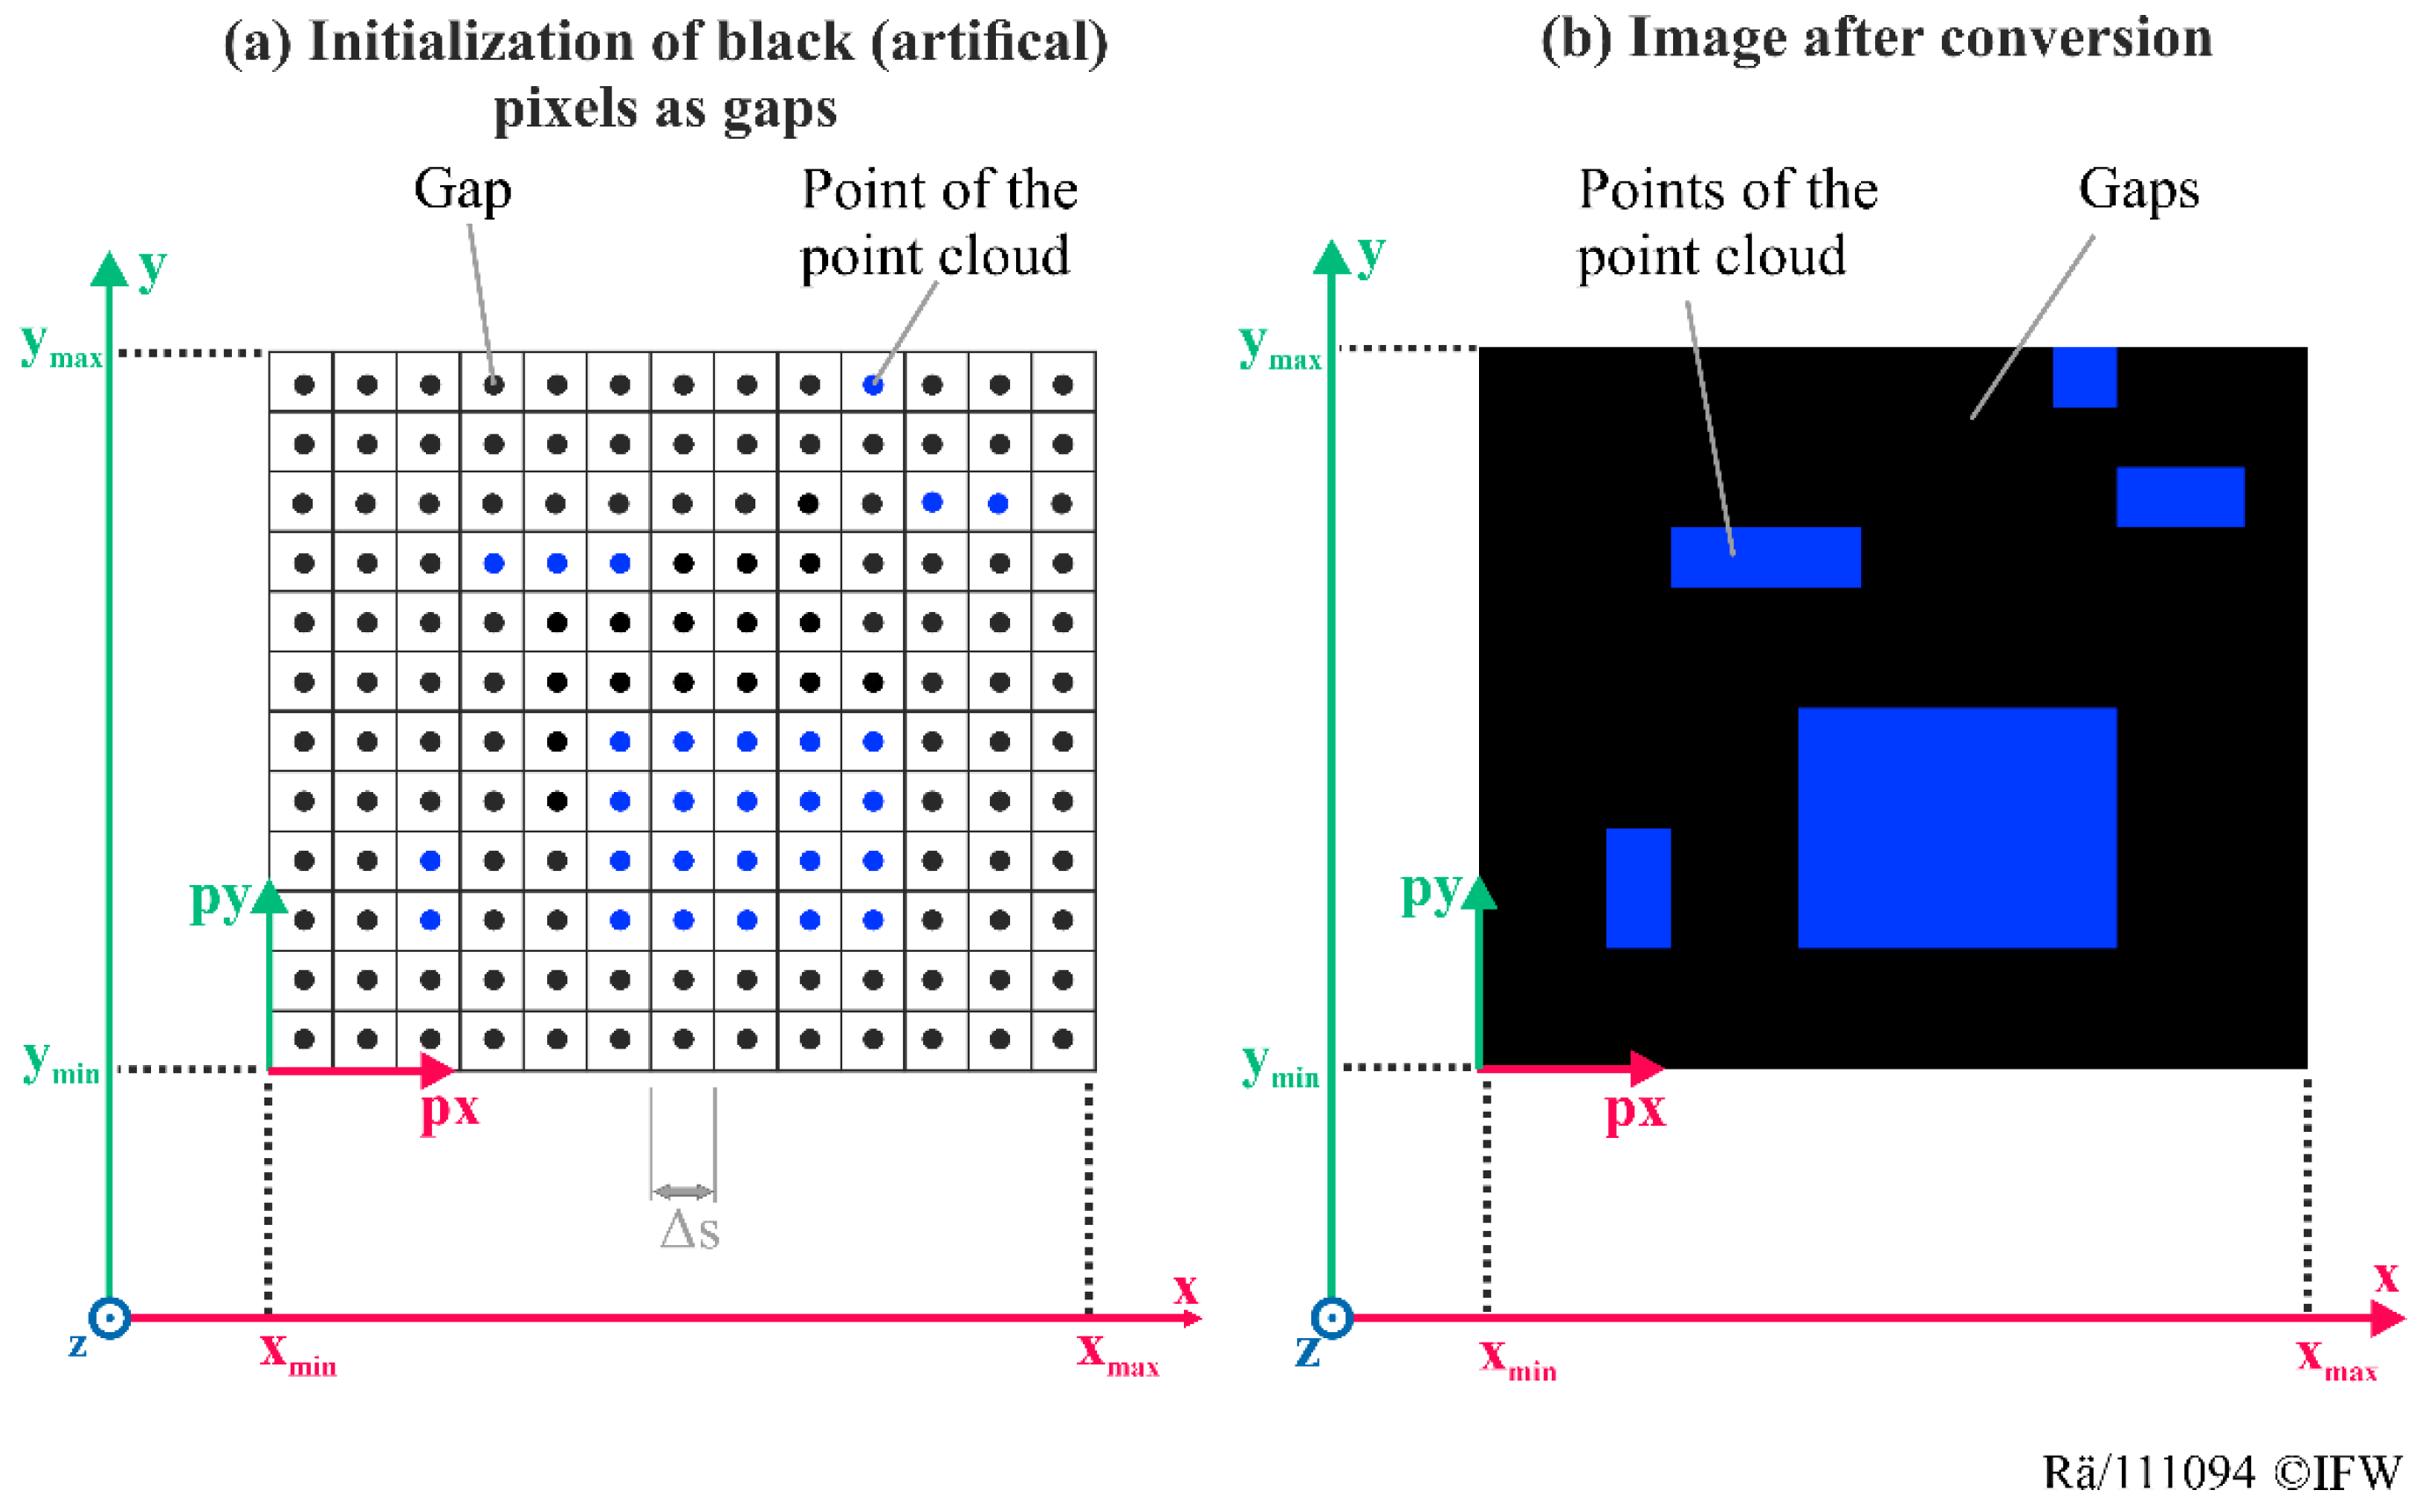
The remaining xy plane of
Section 3.3.1 is transformed into an image, as seen in
Figure 8. On the left side, an example for a filtered point cloud after the z-interval decomposition is shown. The blue dots or pixels represent the measurement points in the coordinate grid, while the black pixels describe empty gaps. These artificial black points are produced to ensure a fixed distance (step size, Δ
s) for all points. This step size is adapted to the point distance of the laser scanner. Thus, a rectangular matrix or image can be generated, as seen in
Figure 8b. The pixel intensities (colors) of an image are integers and cannot be decomposed into decimal pixels. Thus, the image size must be adapted to the point distance of the point cloud. In this research, the step size, Δ
s = 50 µm, is used, which is defined by the point distance of the laser scanner. Therefore, 20 pixels in an image represent 1 mm. This generated image is used for the next step: the bounding-box algorithm (see
Section 3.3.3).
3.3.3. Bounding-Box Algorithm
After image converting, a bounding-box algorithm, as explained in [
29], is applied to the generated image to detect primitive shapes, such as rectangles or circles. As shown in
Figure 9, there might still be pixel regions that hinder raw-part detection (“interferences”) in
Figure 9b.
In this case, pixel regions mean connected blue pixels enclosed by black pixels or the edge of a picture. However, some of the pixel regions can be neglected for the bounding-box algorithm, e.g., pixel regions that do not have a defined minimum height or width. These regions are removed at the beginning of the algorithm. An image can be interpreted as a matrix, in which black pixels are represented by “0”, and blue pixels by “1”, as shown in
Figure 9a. Thus, the edge points of every pixel region are calculated by a filter operator. Next, the centroid of the pixel region is estimated. Afterward, the major and minor axes of the object are determined. In the following, the upper and lower furthest points for the major axis, and the corresponding points for the minor axis, are determined. Besides rectangular shapes, other simple shapes, such as circles, can be calculated by the computation of geometric features, such as the circularity, moments, and various texture parameters [
29].
If no surface elements of a blank (primitive shapes) are detected, the next measuring process and plane detection are performed on a lower height. If the detection was successful, possible significant points, such as the corner points of a rectangle, are calculated. In the following section, the real machine coordinates of the detected points are calculated.
3.3.4. Coordinate Transformation
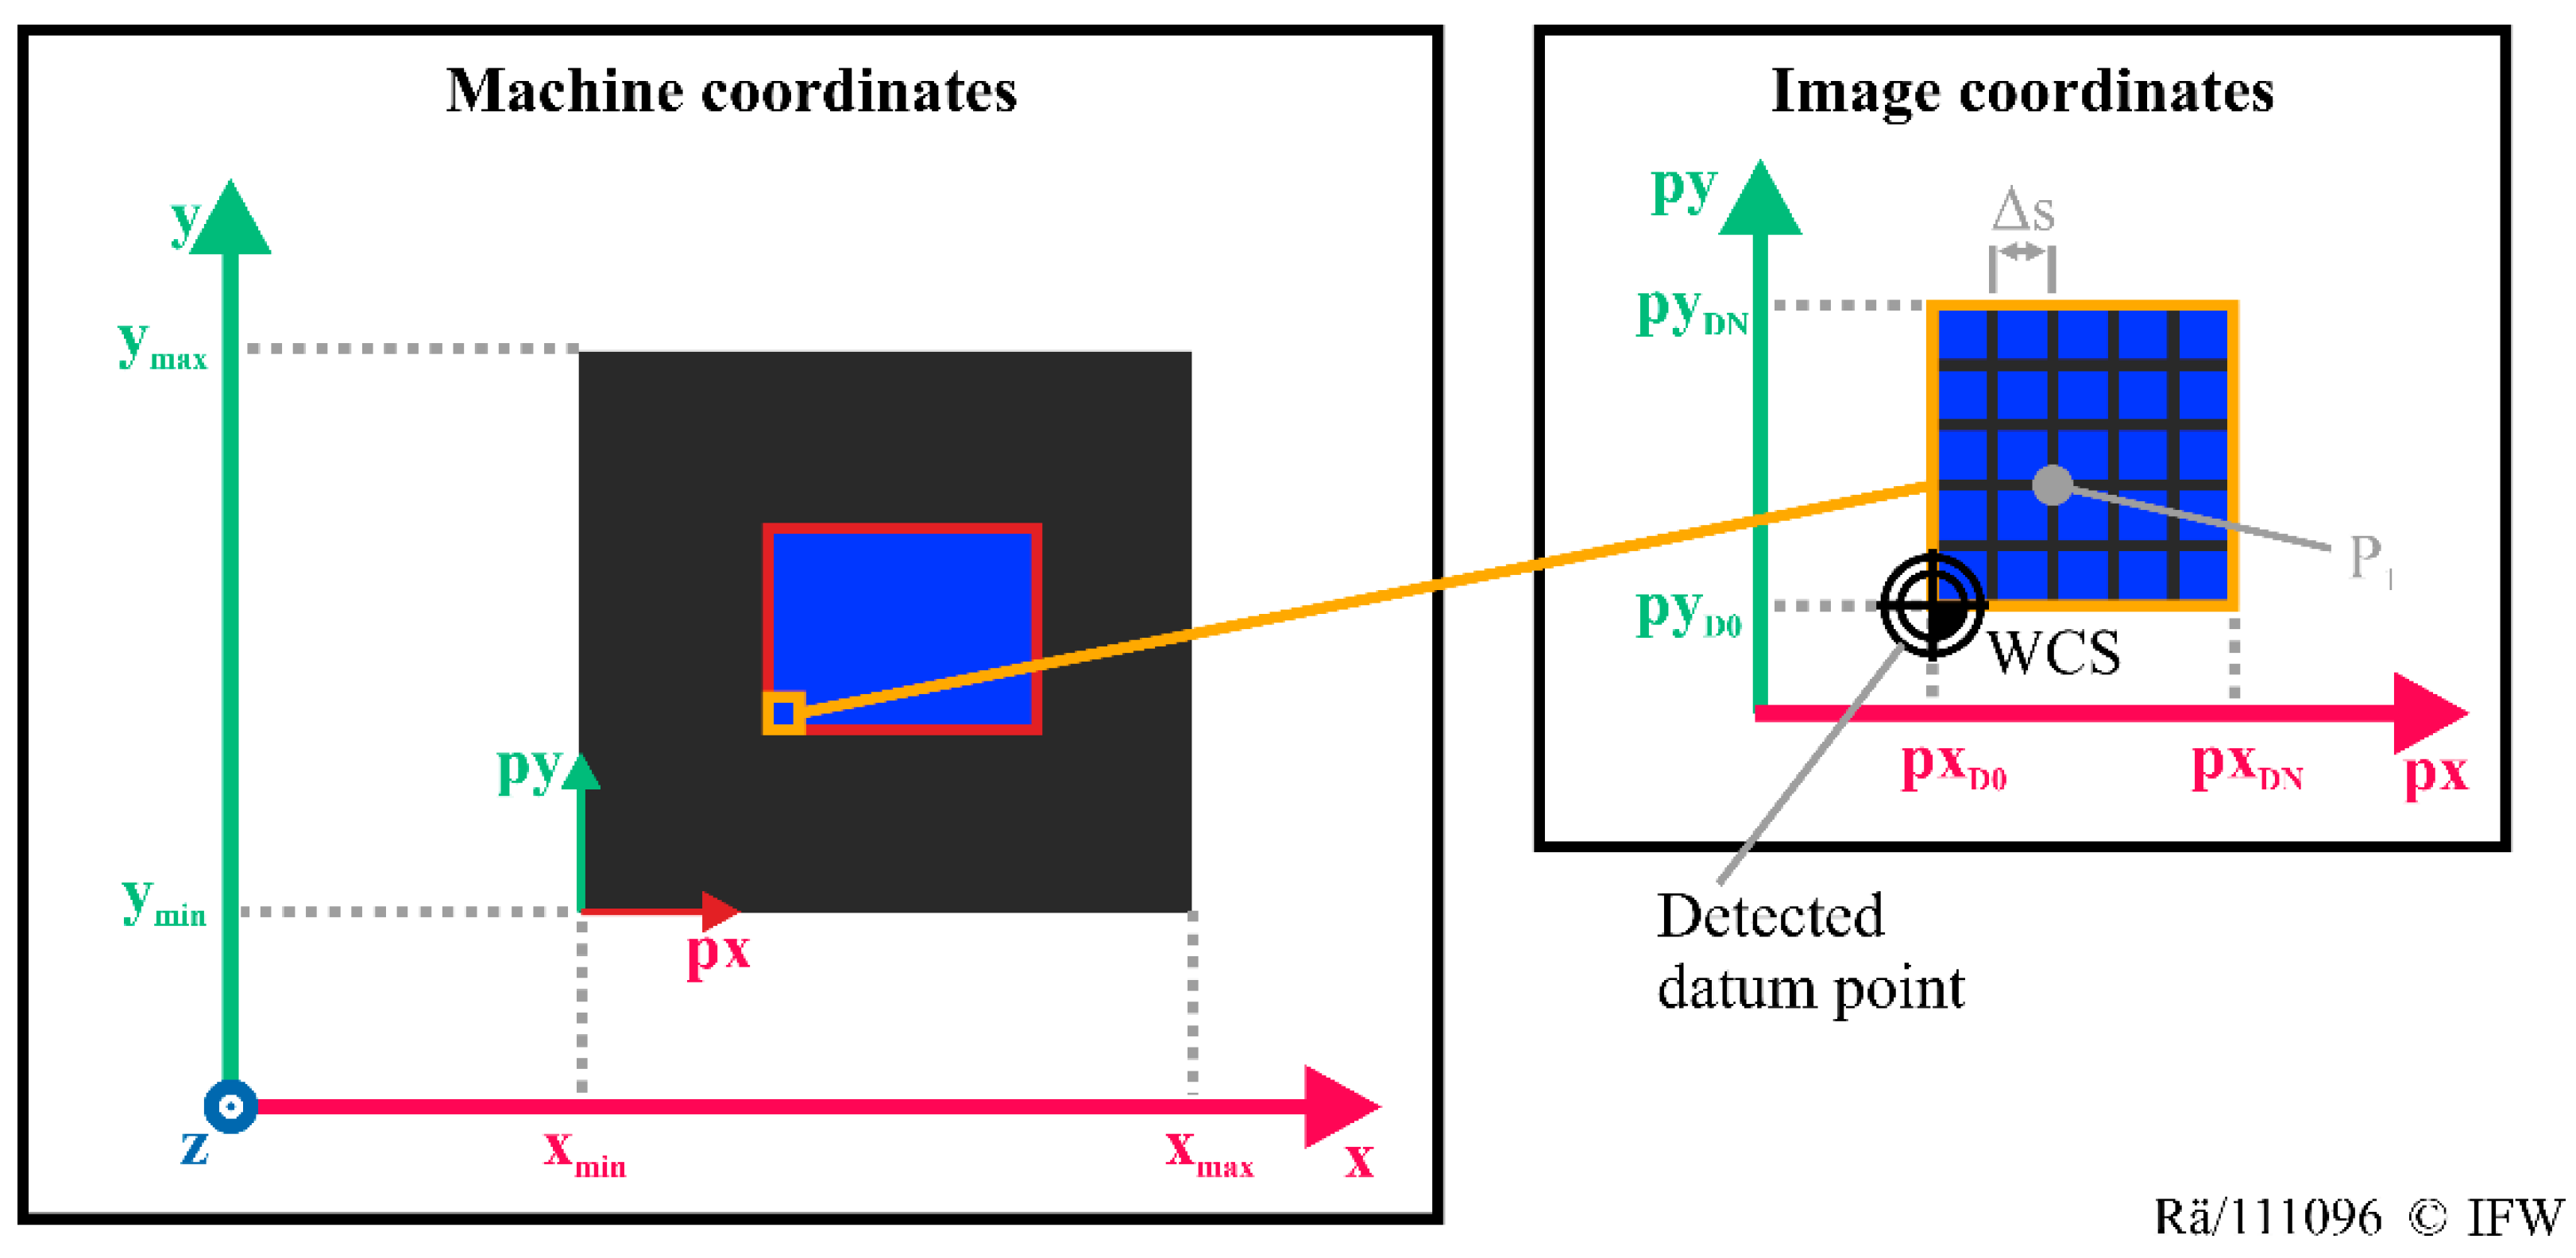
The classified pixels have to be transformed into machine coordinates (“coordinate transformation” in
Figure 6) to determine the exact datum point and the dimensions of the measured workpiece. The origin of an image is at the pixel location,
x = 0 and
y = 0. By contrast, the starting point of measurement in the machine room is usually not the machine zero point and is, therefore, translated. As seen in
Figure 10, the measuring process starts at the position,
xmin. This value is important for calculating the machine coordinates (
x,
y) by using the image coordinates (
px,
py), and must be considered as an offset. The procedure is applied to the
y value (here
ymin). In addition, the pixel resolution, Δ
s, must be considered for the coordinate transformation. As mentioned in
Section 3.3.2, this value depends on the step size of the laser scanner. Consequently, the coordinates of Point
P1 (shown in grey in
Figure 10) can be converted to the real coordinates as follows:
The coordinate transformation is applied to the characteristic points (corners, vertices, centers, etc.) of a detected geometry object since these points are relevant for further processing. For example, from the knowledge of the corner points of a cuboid blank, the datum point, WCS, and its xy dimensions can be derived.
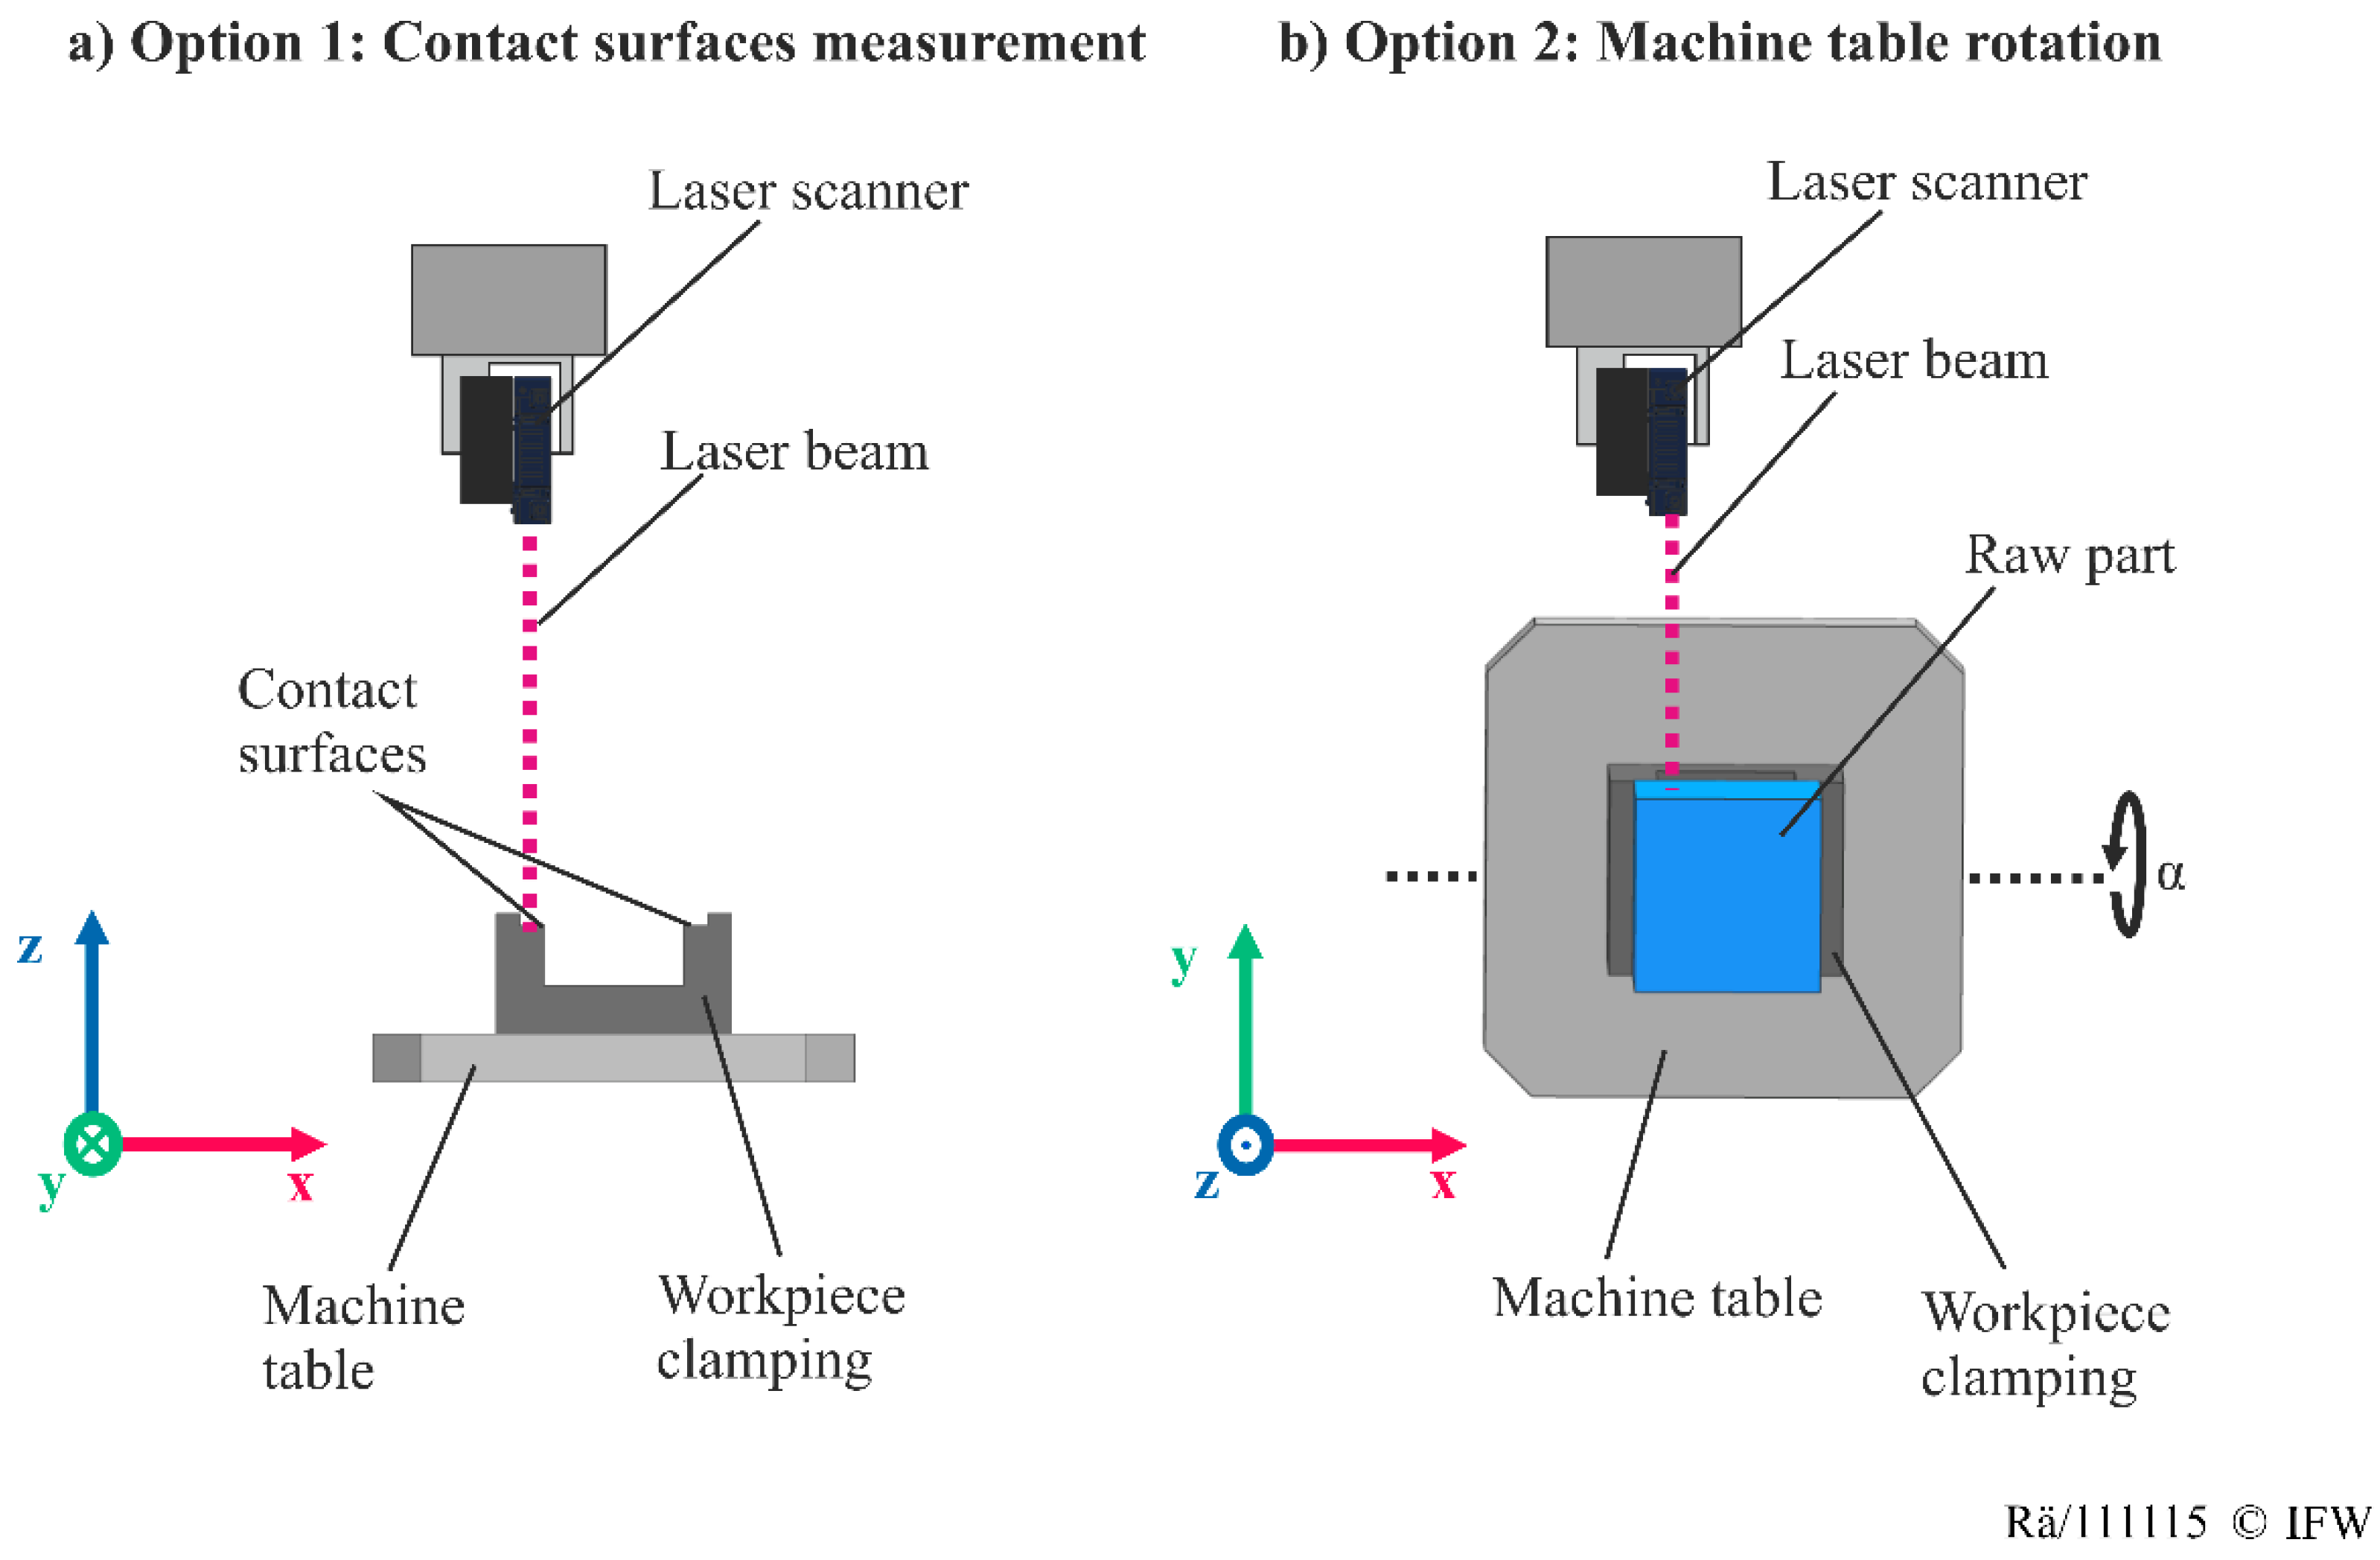
The height of the raw part can be estimated by using the average z coordinate of the detected surface. As shown in
Figure 11a, the distance between the contact surface of the workpiece clamp and the average z value of the surface can be calculated. Therefore, the contact surfaces of the workpiece clamping are measured once only before the measuring process. Furthermore, the blank height can be measured by rotating the machine table of the machine tool (
Figure 11b).
After estimating the dimensions and the coordinates of the workpiece origin, a digital blank shadow is automatically generated for the CAD/CAM planning of the milling process (see
Figure 2).
4. Implementation and Experimental Validation
To investigate the feasibility and practicability of the developed approach, an implementation of this method, initial use cases, and experimental results will be shown in the following sections.
4.1. Experimental Setup
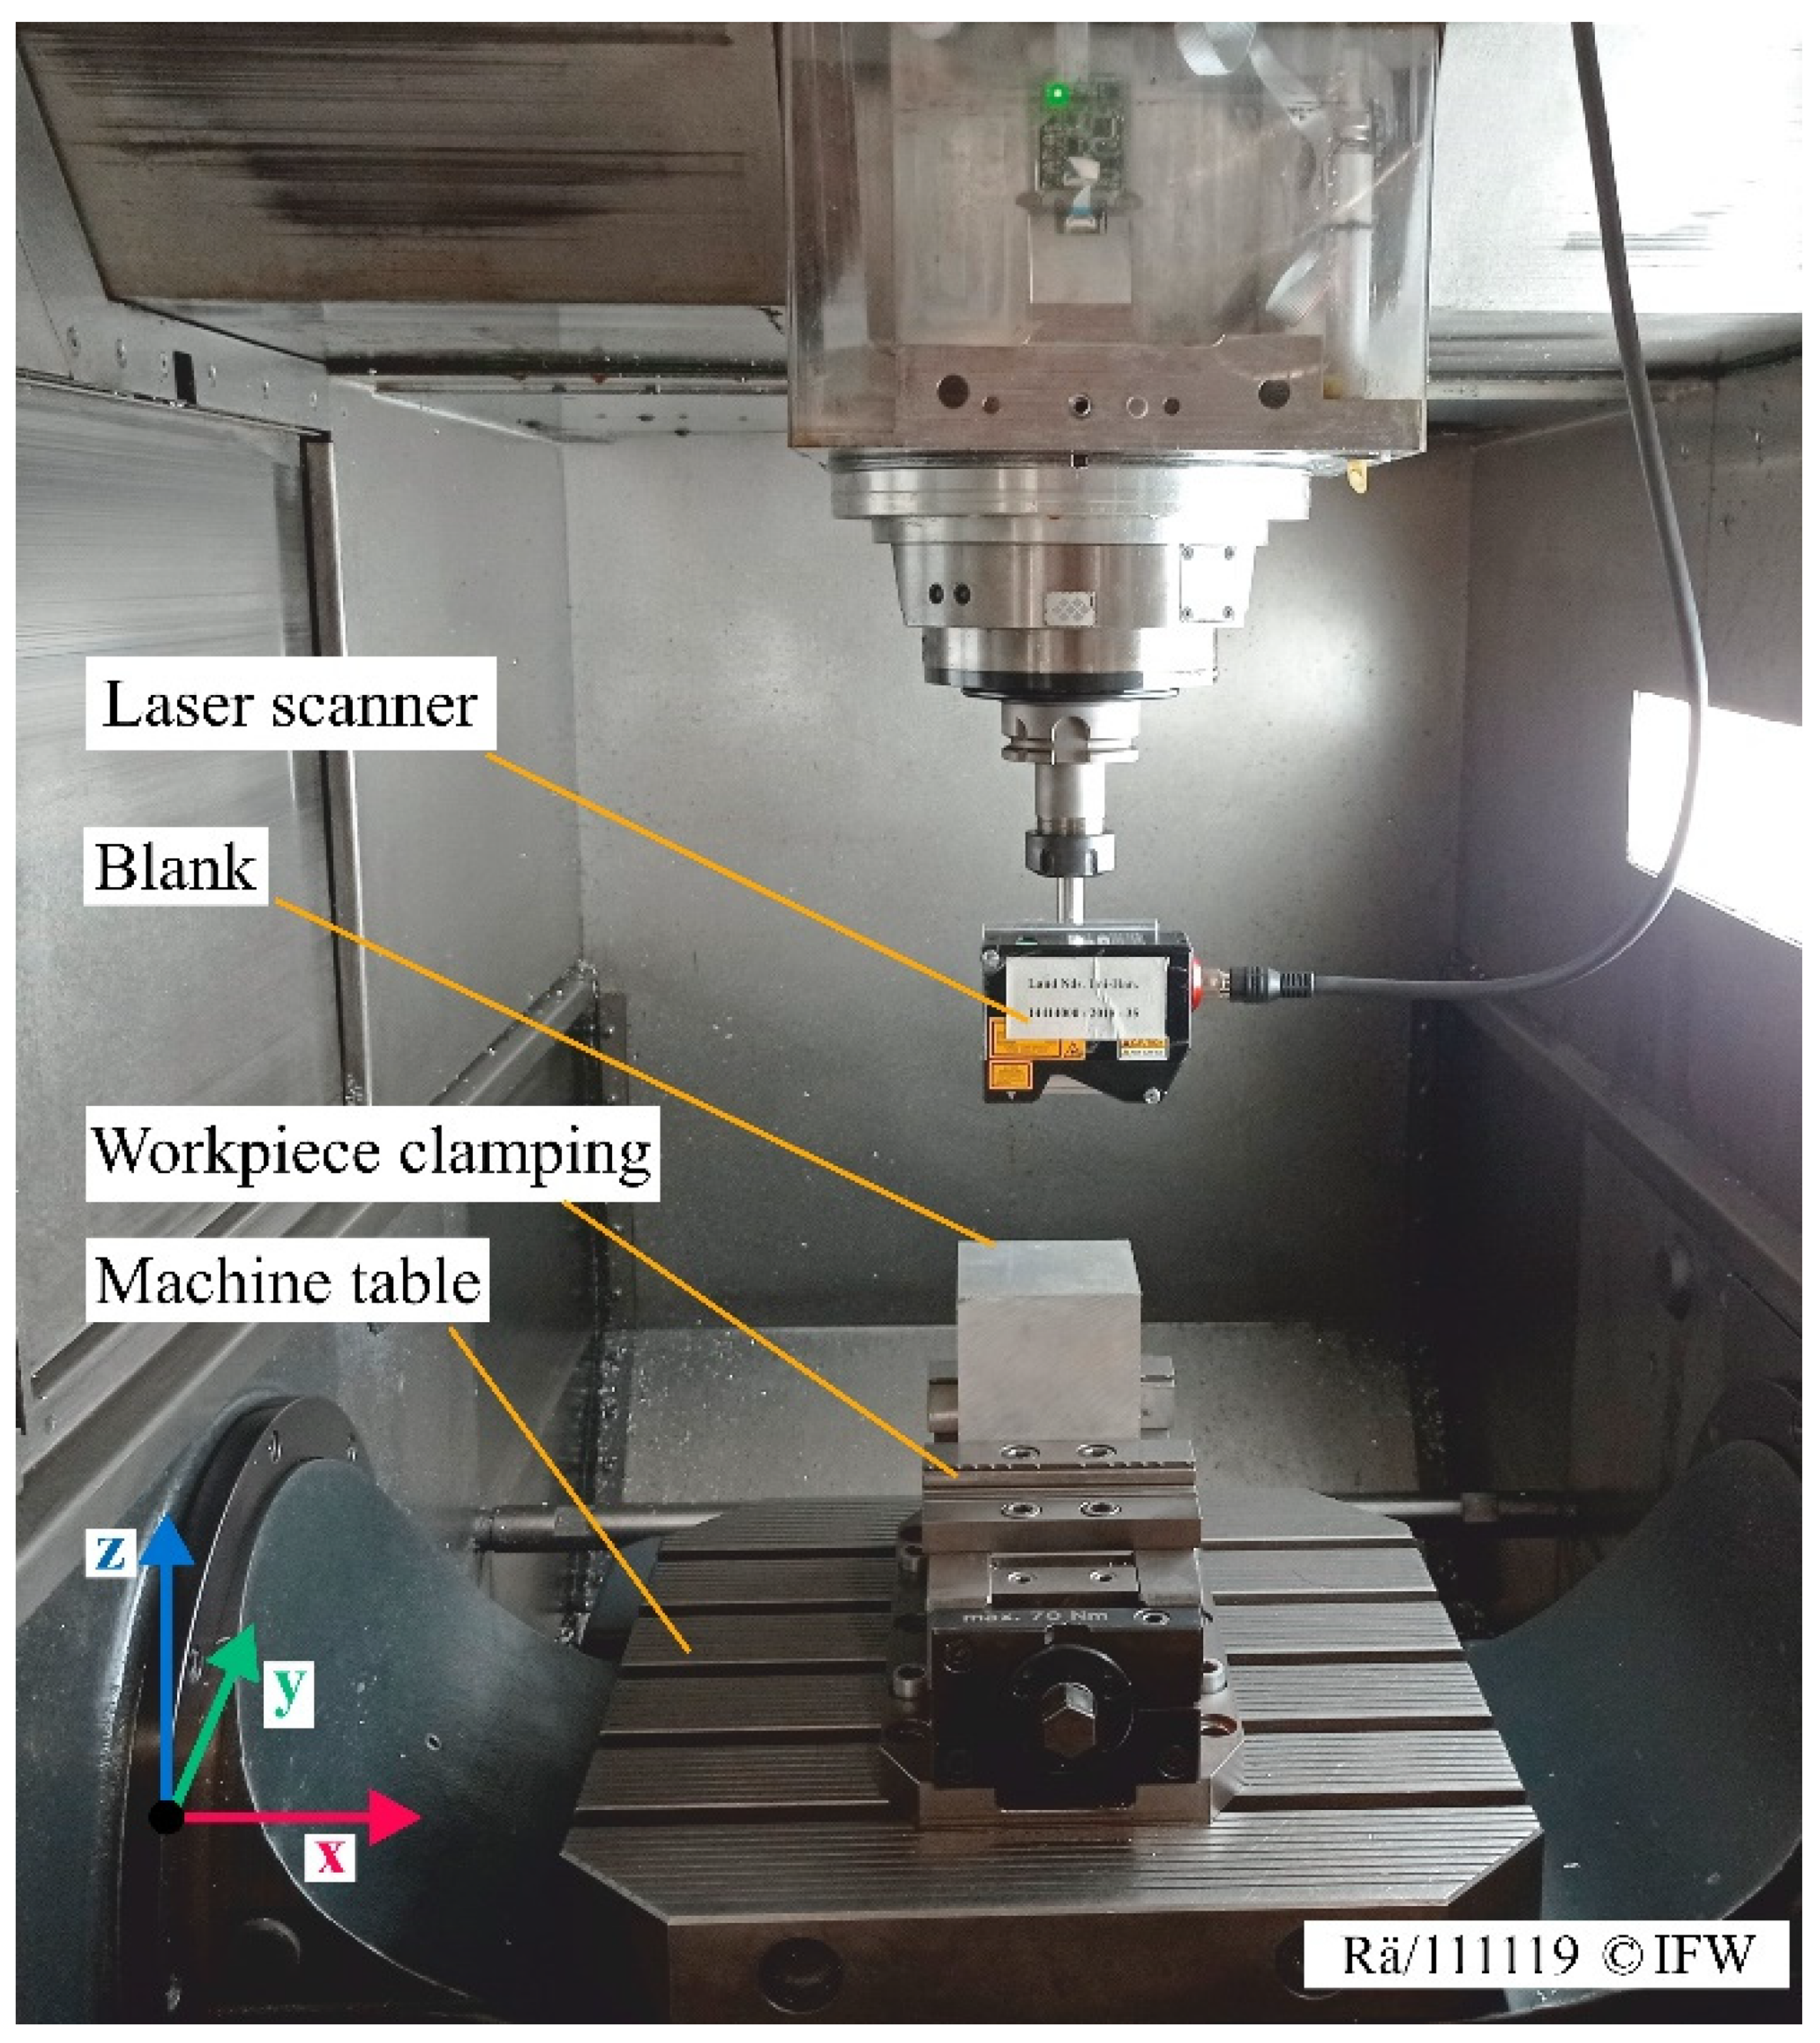
For the experimental investigations, a DMG MORI HSC55 Linear machine tool was used (see
Figure 12). This CNC machine was equipped with a Heidenhain iTNC530 control. For the laser scanning process, Keyence LJ-V7080 laser triangulation was used. The sensor was fixed to the top of the spindle by an individual holder system. Optionally, the sensor can also be placed on the spindle box in this configuration. To obtain three-dimensional point clouds as measuring data, several software libraries were implemented in the software tool, i.e., the Keyence DLL for the extraction of the laser scanning data, the TwinCat ADS library of Beckhoff, and the RemoTools SDK of Heidenhain for the machine axis data. To implement the bounding-box algorithm, several C# libraries of Accord were used (Accord, Accord.Math, and Accord.Imaging) [
30].
4.2. Experimental Design
To test the time and accuracy performances for the proposed approach, the following investigations were made: As raw-part objects, cuboids and cylinders were chosen. These objects have different dimensions with which to investigate the robustness of the introduced attachment. The selected cuboids, shown in
Table 1, were touched by a touch probe. Cuboid 1 is made of steel, and Cuboid 2 is made of aluminum.
Table 2 illustrates the dimensions of the used cylinders, which were also measured by a touch probe. Both cylinders are made of aluminum.
For the measuring process, the introduced laser scanner was used, and the raw parts were clamped in the machine tool. First, the sensor path planning for the laser scanner was conducted automatically, depending on the machine axis limitations. Next, the automatically generated NC paths of the sensor path planning were transferred and started on the CNC machine by the RemoTools SDK. Afterward, the measuring process was initiated, as well as the finalization of the automatic data processing checks if a workpiece was detected. If an object was recognized, the dimensions and the datum point were determined by the bounding-box algorithm. Furthermore, a digital blank shadow of the detected blank was automatically designed by the software library, NXOpen. This CAD file can be used for autonomous CAM-planning in NXOpen to realize the adapted milling process. If no object was recognized, a further measuring process was initiated.
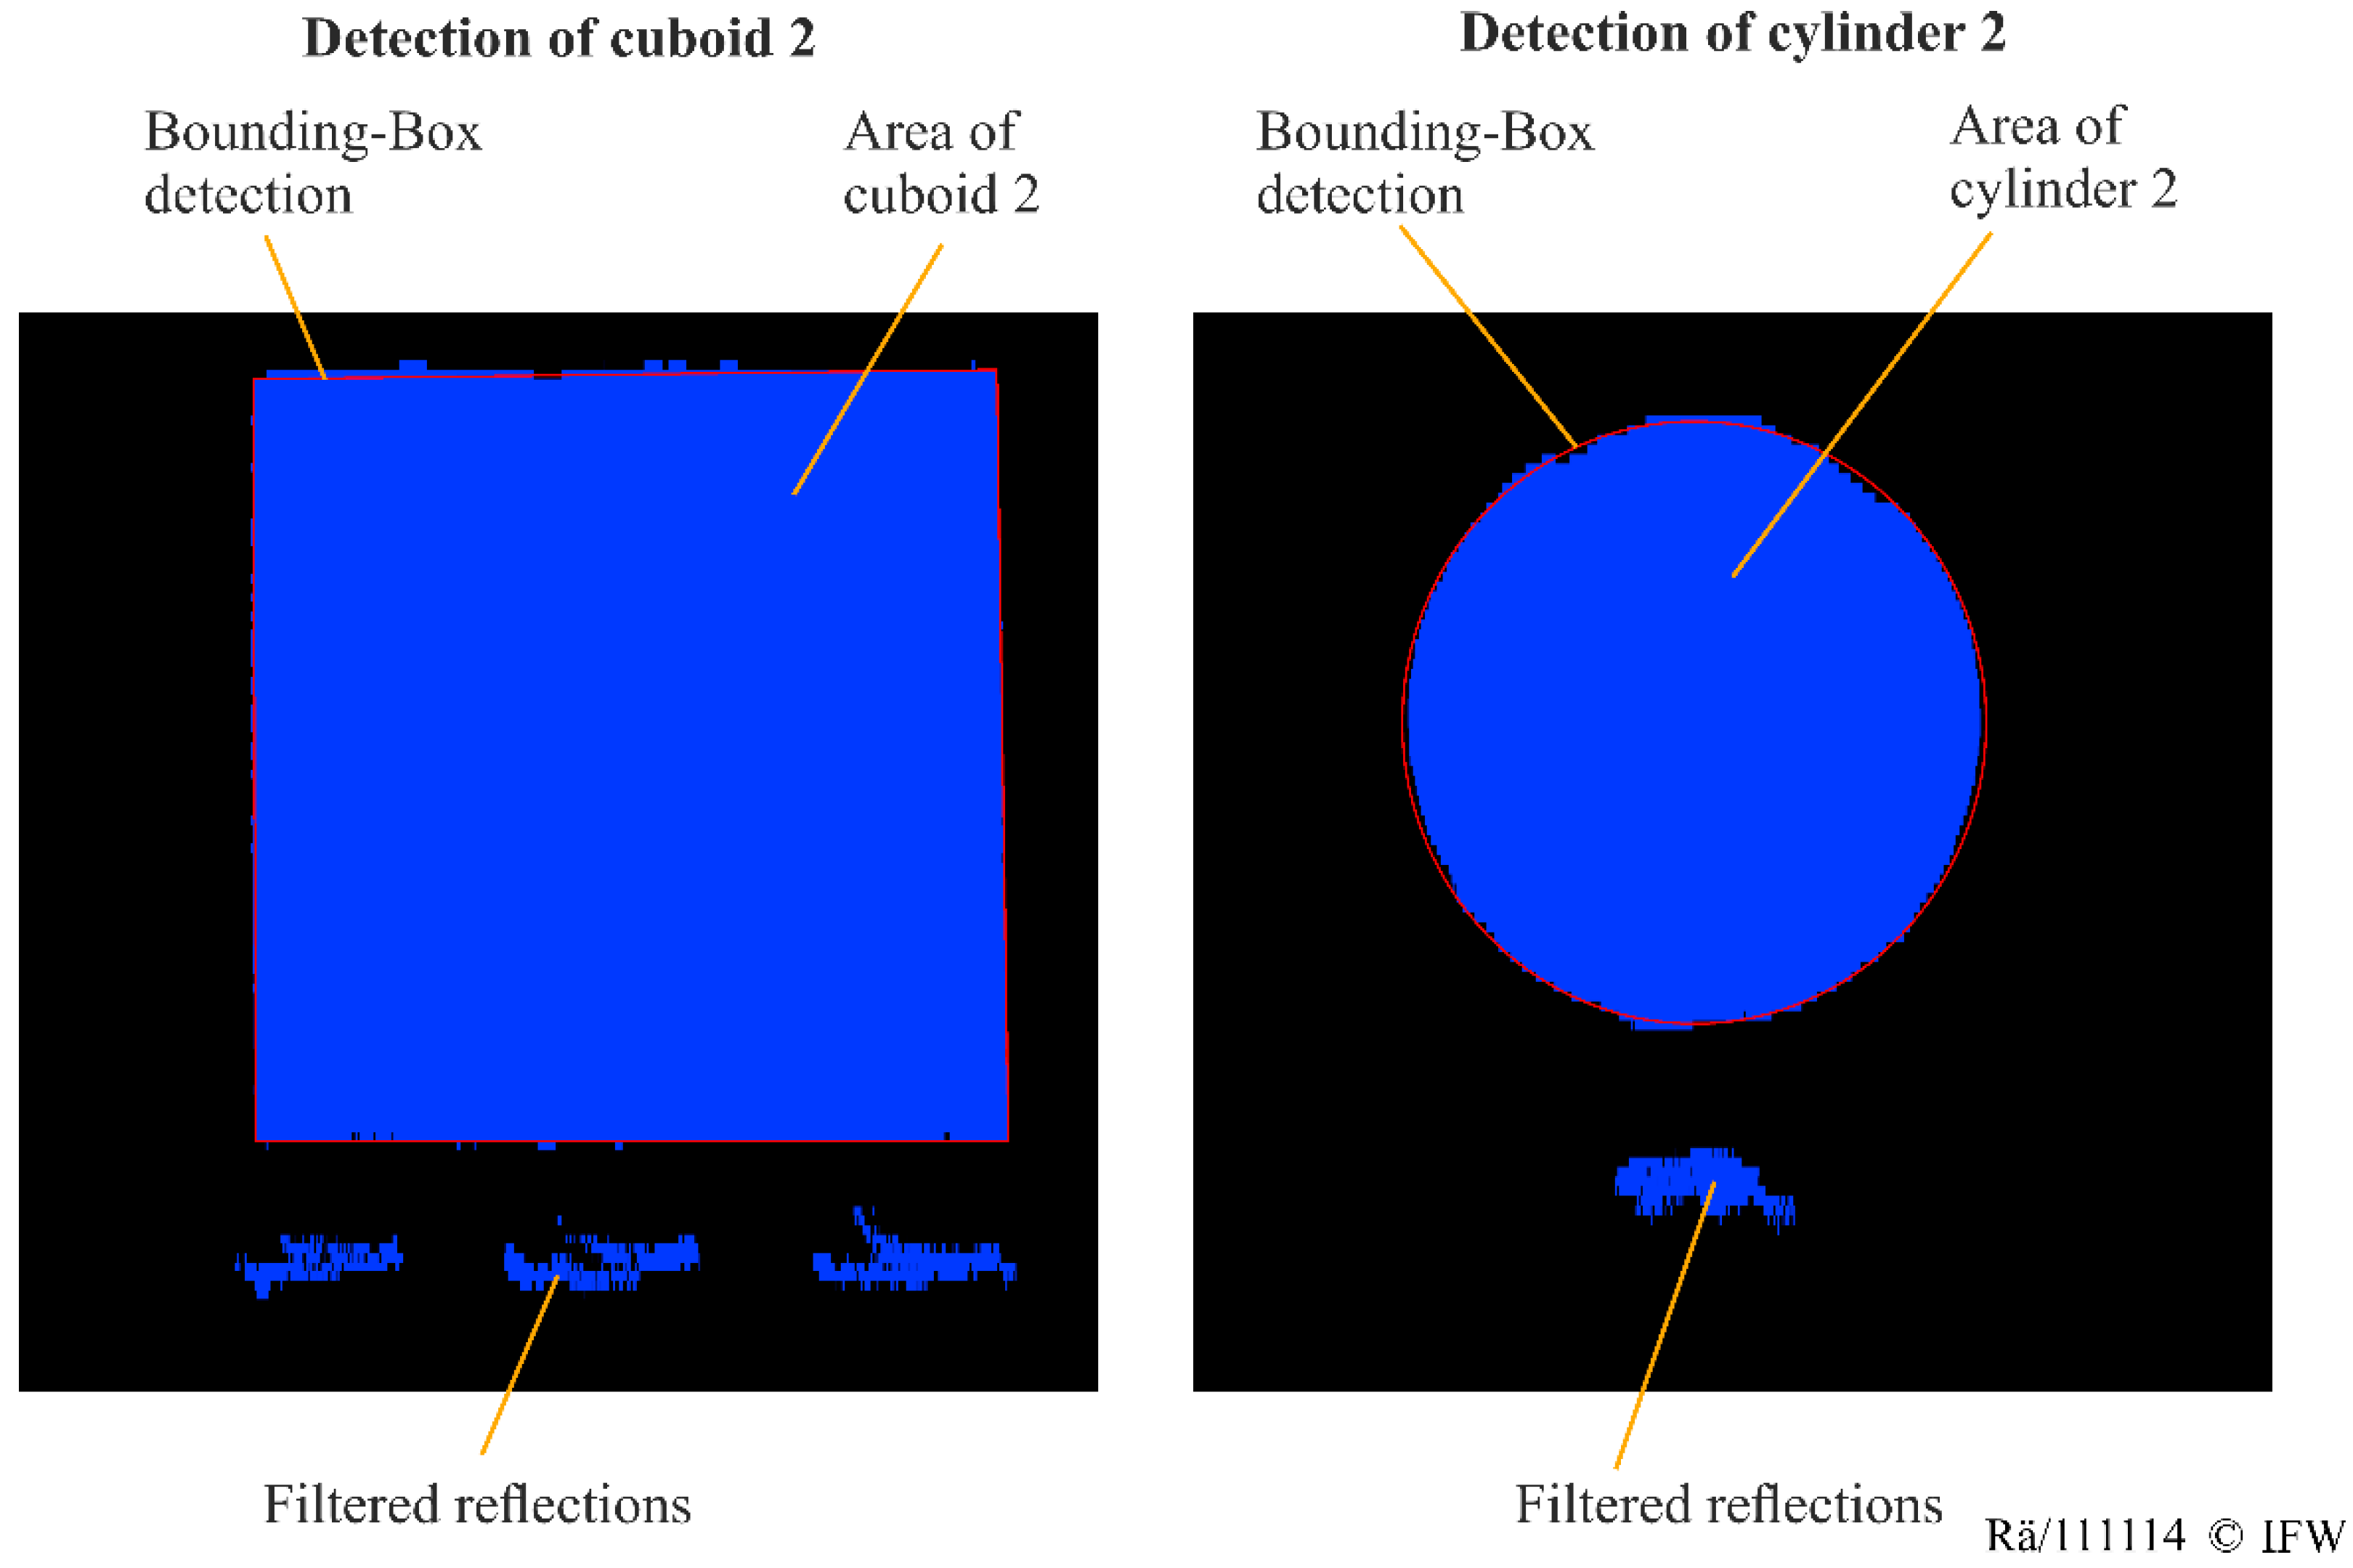
The automatic bounding-box object detection is presented in
Figure 13, where the point clouds of the measuring process are converted into images.
The rectangular shape of the cuboid surface and the circular shape of the cylinder were correctly captured by the red bounding box. Following the detection, the x and y dimensions and the locations of the bounding boxes were automatically determined. For the height of the detected objects, the average z value of the detected object points was calculated. In
Table 3, the deviations of the detected dimensions after the scanning process, compared to the dimensions that were measured by the touch probe, are listed:
The table shows that the deviations of the y and z dimensions are less than x, and that the maximum deviation in the x direction is 0.6860 mm. While the x and z coordinates solely depend on the used laser scanner, the y deviation is influenced by the measuring speed in the scan direction (feed rate). This value is limited by the coupling of the machining axis data because the automatic reading of the machine axis data is slower than the automatic export of the laser scan data. Therefore, a fixed scan line distance of 1 mm was applied to reduce the size of the resulting point cloud and to minimize the computing time. A smaller scan line distance could result in higher accuracy, but a longer computing time. For the cuboids and cylinders, the measuring time was about 2.5 min, using a feed rate of 1000 mm/min. In
Table 4, the results of the deviations of the cylinders can be seen.
The results show that the deviations of the radius and the z value are less than 1 mm. The deviations could be the result of different influences. For example, the used samples are raw parts that do not have exactly flat edges and surfaces. Furthermore, deviations could be caused by nonfiltered reflections or the measuring speed because the radius also depends on the feed. Using the acquired shape information of the blanks, a digital model was automatically generated by the software library, NXOpen.
In addition to the identification of the dimensions, the workpiece origin could automatically be extracted by the object detection. The results of the deviations are illustrated in
Table 5.
Similar to the acquired dimensions, the deviations of the detected workpiece reference points are less than 1 mm. These deviations could have different influences: First, it should be taken into account that the used samples are raw parts that do not have exactly flat edges and surfaces. Furthermore, the measuring speed, calibration errors, and reflections could lead to inaccuracies. Moreover, the accuracy of the algorithm for object detection could be optimized.
The workpiece reference points were automatically transferred to the preset table of the machine tool by a Heidenhain RemoTools implementation in C#. In this work, the workpiece reference points were used for a simple automatic cavity milling process. Standardized tools and process parameters were applied. Automated cutting face recognition of the raw part, which is based on normal vector, position, and shape geometry, was implemented for the adapted planning. To avoid collisions or shape errors during machining, a small safety distance for the workpiece zero point was considered.
5. Conclusions
In this paper, an approach for the autonomous workpiece detection of standardized blank shapes is proposed. Single steps, sensor path planning, a measuring process, and object detection are introduced. This method is suitable for a laser triangulation sensor, but it can also be adapted for other optical sensors. To show the flexibility and robustness of the proposed approach, the implementation of a machine tool was applied. For the experimental investigations, several raw parts, such as cuboids or cylinders, were used. By using bounding-box object detection, it is shown that the deviations of the fully automatic object detection are <1 mm for a feed rate of 1000 mm/min. Although the deviations of conventional blank detection with touch probes are more accurate, the achieved results are suitable for a rough blank detection. If there are higher requirements, a combination of the introduced approach and a touch probe can be considered. For a feed rate of 1000 mm/min, the time for the measuring process and object detection is about 2.5 min, which was about 50% faster than a manual touch probe measurement.
The experimental investigations illustrate the robustness of the proposed approach for the autonomous workpiece detection of standardized blank shapes. Different dimensions and locations could automatically be determined. In addition, the measuring time and effort can be reduced for accuracy requirements less than 1 mm, such as for rough detection. The automatic generation of a digital blank shadow makes it possible to automate the subsequent steps of process planning to make it even more adaptable. The presented approach is a solution for the rough detection of blanks with simple geometries, such as cylinders or cuboids, with accuracy requirements less than 1 mm. The detection of more diverse geometries is much more complex. Accuracy, time, the reliability of a high measurement quality, and the avoidance of collisions are criteria that should be considered in further research. In the current research, an extension of the proposed measuring strategy was investigated. This approach is applicable for rough detection. The rough detection was used to supply the probe measurement with small measuring distances, without the risk of collision. Currently, manual prepositioning is required for measurement with a touch probe. Even if manual measurement by a touch probe is faster than the described measurement strategy in certain applications, the degree of automation is not given for a touch probe measurement. This also applies when the ideal geometry is assumed and a fine detection, which is based on this assumption, is used. In certain cases, collision-free measurement with a touch probe cannot be guaranteed for these assumptions because the real location of the workpiece can deviate from the assumption. Therefore, the measuring directions of the touch probe cannot be enabled correctly. In this respect, the presented approach represents a technical solution for the automatic and collision-free blank recognition of simple shape geometries.
Further investigations will focus on the optimization of the measuring settings and the object detection to increase the accuracy. An evaluation as to how complex shapes, besides cuboids or cylinders, can be detected by applying further image processing algorithms, such as Hough transforms, template matching, or flexible shape extraction (snakes) will be performed. While the current detection is focused on surface detection, further investigations on edge and burr detection will be conducted in the following steps of the research project, “AdaPES”, in order to automate a deburring process. In this process, the edge detection will use the digital shadow of the raw part to apply an iterative closest point algorithm. In addition, the presented approach could be extended by a self-optimizing process parameter and tool selection on the basis of an extensive experimental dataset. These are key issues for further research. Furthermore, an automatic milling strategy operator becomes necessary to create and select the optimal milling strategies for workpiece machining. To extend the current digital blank shadow into a digital twin in further research, further digitalization of the physical properties is necessary, such as the material properties of the measured blank. Therefore, the proposed method of autonomous workpiece detection could be an essential contribution to approaches for autonomous milling machines.
Author Contributions
Conceptualization, B.D., M.W., K.M.H. and R.R., methodology, K.M.H. and R.R.; software, K.M.H. and R.R.; validation, K.M.H. and R.R.; formal analysis, K.M.H. and R.R.; investigation, K.M.H. and R.R.; resources, B.D.; data curation, K.M.H. and R.R.; writing—original draft preparation, K.M.H. and R.R.; writing—review and editing, B.D., M.W., K.M.H. and R.R.; visualization, K.M.H. and R.R.; supervision, B.D. and M.W.; project administration, K.M.H. and R.R.; funding acquisition, B.D. All authors have read and agreed to the published version of the manuscript.
Funding
The Federal Ministry of Economics and Technology (BMWi) funded this research, with the grant number, ZF4070527. The Lower Saxony Ministry for Science and Culture (MWK) funded this research, with the grant number, ZN3246. Furthermore, the Sieglinde-Vollmer-Foundation funded this research.
Data Availability Statement
The data presented in this study are available upon request from the corresponding author.
Acknowledgments
The authors would like to thank the Sieglinde-Vollmer-Foundation, the Federal Ministry of Economics and Technology (BMWi), and the Lower Saxony Ministry for Science and Culture (MWK) and their partners for funding this paper as part of the research projects, “AdaPES” and “MOBILISE”.
Conflicts of Interest
The authors declare no conflict of interest.
References
- Dittrich, M.-A.; Denkena, B.; Boujnah, H.; Uhlich, F.U. Autonomous machining–Recent advances in process planning and control. J. Mach. Eng. 2019, 19, 28–37. [Google Scholar] [CrossRef]
- Schleich, B.; Dittrich, M.-A.; Clausmeyer, T.; Damgrave, R.; Erkoyuncu, J.A.; Haefner, B.; de Lange, J.; Plakhotnik, D.; Scheidel, W.; Wuest, T. Shifting value stream patterns along the product lifecycle with digital twins. Procedia CIRP 2019, 86, 3–11. [Google Scholar] [CrossRef]
- Zhu, Z.; Xi, X.; Xu, X.; Cai, Y. Digital Twin-driven machining process for thin-walled part manufacturing. J. Manuf. Syst. 2021, 59, 453–466. [Google Scholar] [CrossRef]
- Schmitt, R.; Pfeifer, T.; Hafner, P.; Dietrich, B. Machine vision and ultrasonic supported measuring and monitoring concept for economical quality enhancement in small batch production. In Proceedings of the 10th IMEKO TC10 Conference on Technical Diagnostics, Budapest, Hungary, 9–10 June 2005. [Google Scholar]
- Uhlemann, T.H.-J.; Schock, C.; Lehmann, C.; Freiberger, S.; Steinhilper, R. The Digital Twin: Demonstrating the Potential of Real Time Data Acquisition in Production Systems. Procedia Manuf. 2017, 9, 113–120. [Google Scholar] [CrossRef]
- Bergs, T.; Gierlings, S.; Auerbach, T.; Klink, A.; Schraknepper, D.; Augspurger, T. The Concept of Digital Twin and Digital Shadow in Manufacturing. Procedia CIRP 2021, 101, 81–84. [Google Scholar] [CrossRef]
- Kritzinger, W.; Karner, M.; Traar, G.; Henjes, J.; Sihn, W. Digital Twin in manufacturing: A categorical literature review and classification. IFAC-Pap. 2018, 51, 1016–1022. [Google Scholar] [CrossRef]
- Jeon, H.; Lee, J.; Yang, J. A touch-probe path generation method through similarity analysis between the feature vectors in new and old models. J. Mech. Sci. Technol. 2016, 30, 4705–4716. [Google Scholar] [CrossRef]
- Xiong, Z.; Li, Z. Probe Radius Compensation of Workpiece Localization. J. Manuf. Sci. Eng. 2003, 125, 100–104. [Google Scholar] [CrossRef]
- Li, Z.; Gou, J.; Chu, Y. Geometric algorithms for workpiece localization. IEEE Trans. Robot. Automat. 1998, 14, 864–878. [Google Scholar] [CrossRef]
- Heo, E.-Y.; Kim, D.-W.; Lee, J.-Y.; Kim, K.-Y. Computer-aided measurement plan for an impeller on a coordinate measurement machine with a rotating and tilting probe. Robot. Comput. Integr. Manuf. 2008, 24, 788–795. [Google Scholar] [CrossRef]
- Martínez, S.; Cuesta, E.; Barreiro, J.; Álvarez, B. Analysis of laser scanning and strategies for dimensional and geometrical control. Int. J. Adv. Manuf. Technol. 2010, 46, 621–629. [Google Scholar] [CrossRef]
- Son, S.; Park, H.; Lee, K.H. Automated laser scanning system for reverse engineering and inspection. Int. J. Mach. Tools Manuf. 2002, 42, 889–897. [Google Scholar] [CrossRef]
- Schmitt, R.; Mönning, F. Ensure Success with Inline-Metrology. In Proceedings of the Metrology for a Sustainable Development: IMEKO XVIII World Congress and IV Brazilian Congress of Metrology, Rio de Janeiro, Brazil, 17–22 September 2006. [Google Scholar]
- Denkena, B.; Dittrich, M.-A.; Heide, K.M. Automatic re-contouring of repair-welded tool moulds. Procedia Manuf. 2019, 40, 45–50. [Google Scholar] [CrossRef]
- Rajaraman, M.; Dawson-Haggerty, M.; Shimada, K.; Bourne, D. Automated workpiece localization for robotic welding. In Proceedings of the 2013 IEEE International Conference on Automation Science and Engineering (CASE), Madison, WI, USA, 17–20 August 2013; pp. 681–686, ISBN 978-1-4799-1515-6. [Google Scholar]
- Vukašinović, N.; Bračun, D.; Možina, J.; Duhovnik, J. The influence of incident angle, object colour and distance on CNC laser scanning. Int. J. Adv. Manuf. Technol. 2010, 50, 265–274. [Google Scholar] [CrossRef]
- López-Estrada, L.; Fajardo-Pruna, M.; Sánchez-González, L.; Pérez, H.; Fernández-Robles, L.; Vizán, A. Design and Implementation of a Stereo Vision System on an Innovative 6DOF Single-Edge Machining Device for Tool Tip Localization and Path Correction. Sensors 2018, 18, 3132. [Google Scholar] [CrossRef] [PubMed] [Green Version]
- Wang, Z.; Liu, R.; Sparks, T.; Liu, H.; Liou, F. Stereo vision based hybrid manufacturing process for precision metal parts. Precis. Eng. 2015, 42, 1–5. [Google Scholar] [CrossRef] [Green Version]
- Luo, Z.; Zhang, K.; Wang, Z.; Zheng, J.; Chen, Y. 3D pose estimation of large and complicated workpieces based on binocular stereo vision. Appl. Opt. 2017, 56, 6822–6836. [Google Scholar] [CrossRef] [PubMed]
- Ge, J.; Li, J.; Peng, Y.; Lu, H.; Li, S.; Zhang, H.; Xiao, C.; Wang, Y. Online 3-D Modeling of Complex Workpieces for the Robotic Spray Painting with Low-Cost RGB-D Cameras. IEEE Trans. Instrum. Meas. 2021, 70, 1–13. [Google Scholar] [CrossRef]
- Abele, E.; Schützer, K.; Bauer, J.; Pischan, M. Tool path adaption based on optical measurement data for milling with industrial robots. Prod. Eng. Res. Dev. 2012, 6, 459–465. [Google Scholar] [CrossRef]
- Kwok, K.S.; Loucks, C.S.; Driessen, B.J. Automatic tool path generation for finish machining. In Proceedings of the International Conference on Robotics and Automation, Albuquerque, NM, USA, 20–25 April 1997; pp. 1229–1234. [Google Scholar]
- He, K.; Sui, C.; Lyu, C.; Wang, Z.; Liu, Y. 3D reconstruction of objects with occlusion and surface reflection using a dual monocular structured light system. Appl. Opt. 2020, 59, 9259–9271. [Google Scholar] [CrossRef]
- Müller, C.; Reichenbach, I.G.; Bohley, M.; Aurich, J.C. In Situ Topology Measurement of Micro Structured Surfaces with a Confocal Chromatic Sensor on a Desktop Sized Machine Tool. AMR 2016, 1140, 392–399. [Google Scholar] [CrossRef]
- Denkena, B.; Dittrich, M.-A.; Nguyen, H.N. Technological CAD/CAM chain for automated polishing of geometrically complex workpieces. Procedia CIRP 2018, 78, 313–317. [Google Scholar] [CrossRef]
- Chen, L.-C. Full-field chromatic confocal surface profilometry employing digital micromirror device correspondence for minimizing lateral cross talks. Opt. Eng 2012, 51, 81507. [Google Scholar] [CrossRef]
- Claus, D.; Nizami, M.R. Influence of aberrations and roughness on the chromatic confocal signal based on experiments and wave-optical modeling. Surf. Topogr. Metrol. Prop. 2020, 8, 25031. [Google Scholar] [CrossRef]
- Chaudhuri, D.; Samal, A. A simple method for fitting of bounding rectangle to closed regions. Pattern Recognit. 2007, 40, 1981–1989. [Google Scholar] [CrossRef]
- Accord.NET. Framework Modules. Available online: http://accord-framework.net/docs/html/R_Project_Accord_NET.htm (accessed on 28 October 2021).
| Publisher’s Note: MDPI stays neutral with regard to jurisdictional claims in published maps and institutional affiliations. |
© 2021 by the authors. Licensee MDPI, Basel, Switzerland. This article is an open access article distributed under the terms and conditions of the Creative Commons Attribution (CC BY) license (https://creativecommons.org/licenses/by/4.0/).


