Article

Simulation Based Prediction of Compliance Induced Shape Deviations in Internal Traverse Grinding

1
Institute of Machining Technology, TU Dortmund University, 44227 Dortmund, Germany
2
Institute of Mechanics, TU Dortmund University, 44227 Dortmund, Germany
3
Division of Solid Mechanics, Department of Construction Sciences, Lund University, P.O. Box 118, SE-22100 Lund, Sweden
*
Author to whom correspondence should be addressed.
J. Manuf. Mater. Process. 2021, 5(2), 60; https://doi.org/10.3390/jmmp5020060
Submission received: 15 May 2021 / Revised: 3 June 2021 / Accepted: 4 June 2021 / Published: 8 June 2021
(This article belongs to the Special Issue Progress in Digital Twin Integration for Smart Machining)

Abstract

:
Internal traverse grinding (ITG) using electroplated cBN tools in high-speed grinding conditions is a highly efficient manufacturing process for bore machining in a single axial stroke. However, process control is difficult. Due to the axial direction of feed, changes in process normal force and thus radial deflection of the tool and workpiece spindle system, lead to deviations in the workpiece contour along the length of the bore, especially at tool exit. Simulations including this effect could provide a tool to design processes which enhance shape accuracy of components. A geometrical physically-based simulation is herein developed to model the influence of system compliance on the resulting workpiece contour. Realistic tool topographies, obtained from measurements, are combined with an FE-calibrated surrogate model for process forces and with an empirical compliance model. In quasistatic experimental investigations, the spindle deflection is determined in relation to the acting normal forces by using piezoelectric force measuring elements and eddy current sensors. In grinding tests with in-process force measurement technology and followed by measurement of the resulting workpiece contours, the simulation system is validated. The process forces and the resulting characteristic shape deviations are predicted in good qualitative accordance with the experimental results.

Graphical Abstract

1. Introduction

The continuous improvement of tools and machining processes in terms of product quality is essential in order to maintain competitiveness in the future and to save limited resources. Grinding is an energy-intensive hard machining process which is typically at the end of the manufacturing chain and which is used to produce the final workpiece quality [1,2,3]. In hard machining of chuck components, such as bearing rings, the manufacturers aim is a high productivity and efficiency on the one hand, while on the other hand a good surface quality as well as a high product quality in terms of shape and dimensional accuracy are required [1,3]. The realisation of these demands, which partly contradict each other, is difficult to achieve with grinding processes widely used in industrial applications, such as internal plunge grinding (IPG) with vitrified-bonded grinding tools [3,4]. Internal plunge grinding is a machining process in which the full width of the grinding wheel is usually in contact with the workpiece bore length. The material removal takes place through a continuous radial infeed. Workpiece bores can be machined productively in this way, and a high surface quality can be produced due to a high coverage ratio between grinding wheel and workpiece [4,5,6]. However, this grinding process is limited in terms of maximal material removal rate. Due to the large contact surface between grinding tool and workpiece, high normal forces arise even at low radial feed rates, so that rigid spindle systems are necessary [6,7,8]. However, high-speed grinding spindles, which are required for internal cylindrical machining, exhibit low stiffness. In combination with slim tool holders, usually used in internal grinding operations so that the grinding tools can enter the bore, elastic deformations of tool and workpiece spindle are caused [4]. Both spindle systems, the tool-side spindle as well as the workpiece-side spindle, shift relative to each other during the grinding process, and dimensional as well as shape deviations of the workpiece are the result [6,8,9].
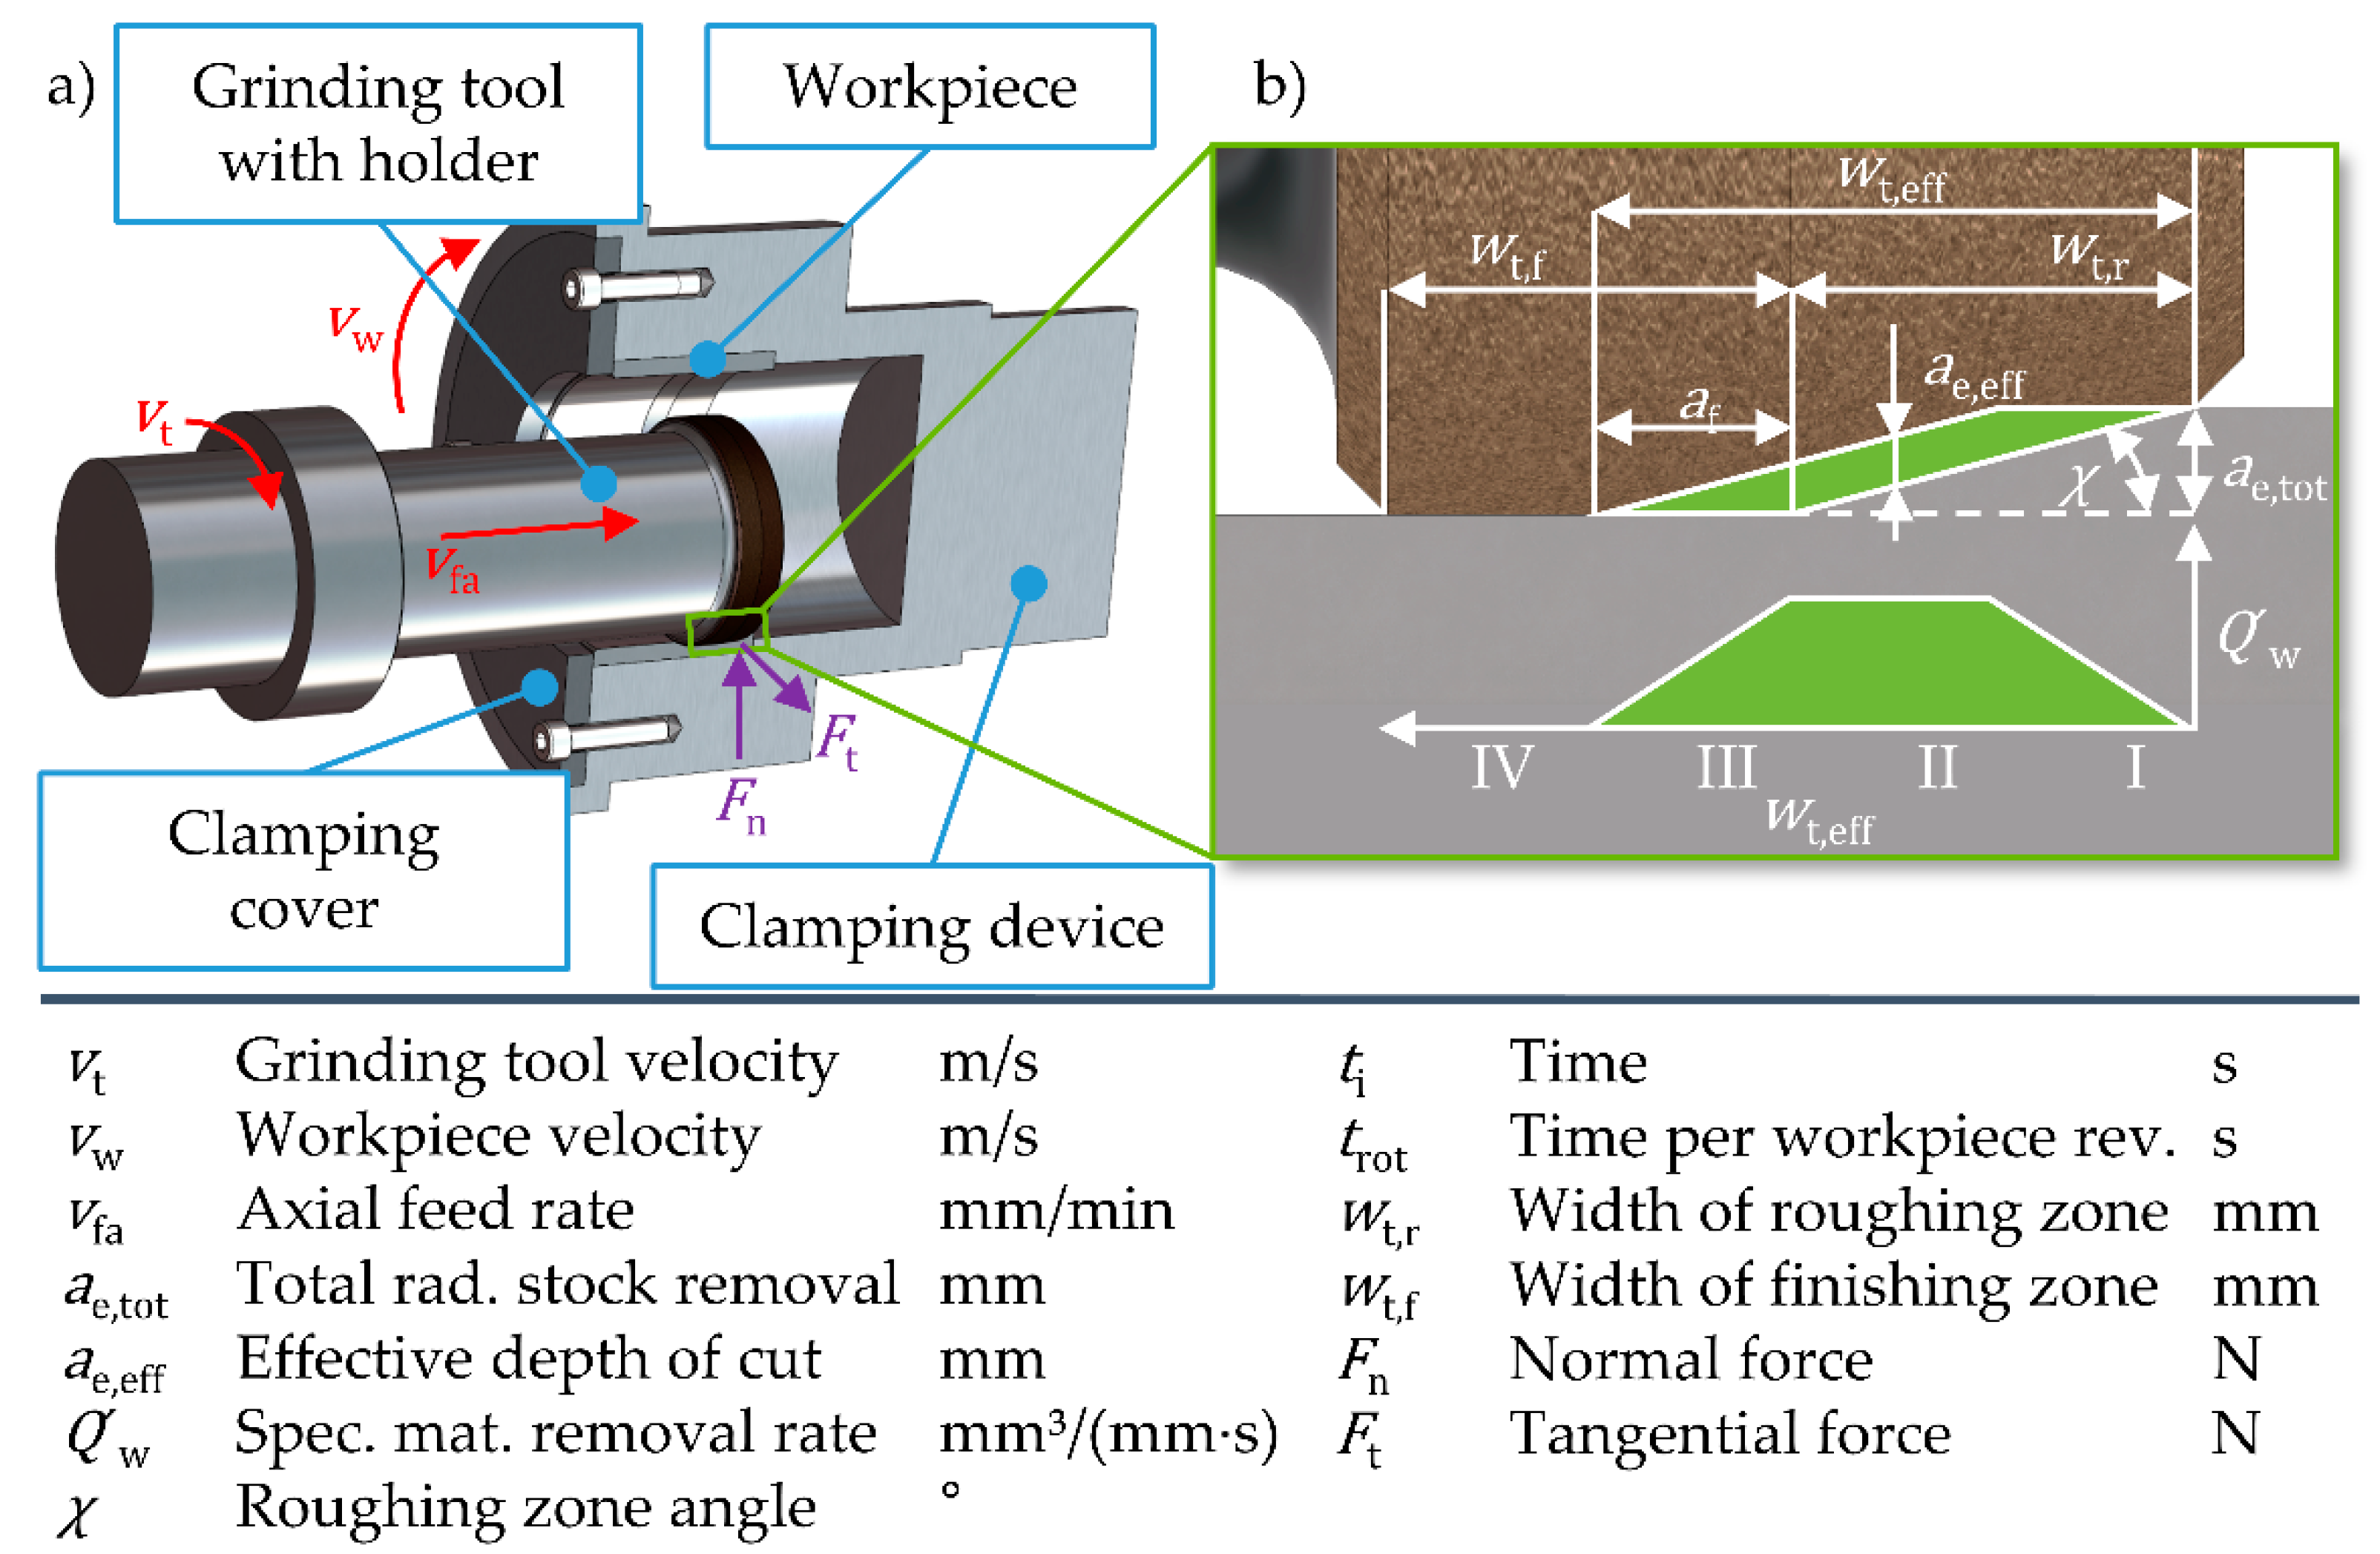
Various studies [9,10,11] showed that internal traverse grinding has a high potential to achieve high material removal rates in combination with good surface quality in bore machining. Traverse grinding also offers high potential for external cylindrical and surface grinding operations [12,13]. High performance internal traverse grinding with electroplated cBN grinding tools is an established manufacturing process for the efficient internal machining of chuck components, such as gears or bearing rings. This manufacturing process uses bifunctional grinding tools with a tapered roughing zone and a cylindrical finishing zone. This allows a combined machining in a single axial stroke. While high material removal rates can be realised in the roughing zone, the finishing zone is used to smoothen the surface [6,10]. This manufacturing process combines the material removal rate of hard turning with the advantages of grinding, such as a high surface quality with low shape deviations. Using high speed conditions, these advantages can be further enhanced. The fundamental kinematics of ITG are shown in Figure 1.
Tool and workpiece rotate in the same direction with the circumferential velocities v s and v w . The total radial stock removal a e , tot is set prior to contact between tool and workpiece. In a single axial stroke, the grinding wheel moves parallel to the bore length with an axial feed rate v fa . Material removal mainly takes place in the conical roughing zone, while in the cylindrical finishing zone the surface is smoothened with minor material removal. In ITG, the material removal is distributed over four zones along the grinding wheel and its rate is only constant in zone 2, see Figure 1b). In the first section (I) of the grinding wheel, the material removal rate increases. This is followed by a section (II) in which a continuous material removal occurs with an effective depth of cut a e , eff . In the transition area between roughing and finishing zone, in zone III, the material removal rate decreases until there is no significant material removal in the finishing zone [10,14]. During internal traverse grinding, there are significant differences in the acting normal force F n at tool entry and exit. After the tool enters the workpiece, a normal force F n is built up.
The normal force causes the workpiece and grinding wheel to be pressed apart due to the compliance of the workpiece spindle and tool spindle. As a result, the set radial stock removal is not fully achieved in the grinding process. An exception is the area of tool entry and exit along the bore length. This effect is much less pronounced at the tool entry, as the roughing zone of the tool is fully in contact after only a few revolutions of the workpiece. The dimensional deviation is much more evident in the exit area [6]. At the exit of the roughing zone of the grinding wheel, the normal forces are strongly reduced when the roughing zone exits the workpiece, so that the spindle systems bounce back. Because the cylindrical finishing zone is still fully in contact, an increased material removal is generated in this zone, which leads to dimensional and form errors. Furthermore, the tool deflection varies along the bore length due to changing lever arms on the workpiece and tool parts during grinding, which causes additional shape deviations. The described shape errors due to the compliant spindle systems represent one of three major influencing factors that challenge the process control of internal traverse grinding. Other significant factors influencing the shape and dimensional deviations are the elastic deformation of the workpiece due to clamping and the high locally applied heat in grinding [9].
Fundamental investigations were carried out regarding the influence of clamping and local thermal deformations on the resulting contour, and compensation strategies were developed [6,9,15]. A multi-scale simulation system for the simulation of ITG processes was proposed in [16], including the effects of workpiece clamping and thermal load during grinding based on earlier studies [17,18,19]. Based on the simulations, compensation strategies were developed to reduce shape deviations. A similar simulation approach, incorporating the spindle compliances in a meta model of the process, was proposed in [6], highlighting the relevance of the compliances for the accurate prediction of process results. Both [6,16] modelled the process forces on the level of individual grains, identifying the rake angle and the undeformed chip thickness as the most relevant parameters. While the force model was calibrated using experimental data in [6], single grain finite element simulations were used in [16].
Various extensions of the finite element method have been shown to yield good results for cutting processes. The arbitrary Lagrangian Eulerian (ALE) method was applied e.g., in [20], while the coupled Eulerian–Lagrangian FEM (CEL) was applied to cutting simulations in [21,22,23,24]. Meshless methods for the simulation of cutting processes include smooth particle hydrodynamics (SPH) and the particle finite element method (PFEM), which were compared to classical Lagrangian FEM and ALE in [25]. SPH was used to model an internal grinding process, similar to ITG, for the medical application of atherectomy in [26].
The Johnson–Cook material model [27] is widely used for metal cutting simulations, see e.g., [23,28,29], but more complex material models were proposed to include additional effects such as phase transformations, see e.g., [30]. Various analytical models for the prediction of process forces during grinding were proposed e.g., in [31,32,33,34]. A simplified model for the effective compliance of the grinding machine system, accompanied by a static analogy test for the experimental calibration, has recently been proposed in [35].
Geometric physically-based simulations (GPS) are a proven concept for the simulation of machining processes such as e.g., milling and grinding [36,37]. The concept is characterised by short computation times for the simulation of whole machining processes, high precision in geometric approximation of the engagement situation plus the resulting workpiece and derivation of physical properties such as e.g., process forces from geometry using analytical or empirical surrogate models. Especially macroscopic grinding simulations are well established, for example to predict process forces [38] and deflections [39,40]. Mesoscopic simulations, which model the interaction between the workpiece and the complete grinding wheel down to the engagement of every single grain, were also presented for grinding processes [37,41,42] including internal traverse grinding [6], but are in practice limited to the simulation of a few grinding wheel rotations because of the much higher computational effort that is required. An enhanced method developed by Siebrecht for face grinding [43,44] is computationally more efficient than older approaches and well suited to incorporate the changes in grain shapes due to wear. Nonetheless, both concepts presented in [6,44] require an additional macro-scale simulation tool to simulate a complete grinding process.
In this work, a simulation system that incorporates an FE-based force model and an empirical compliance model into a mesoscale GPS is proposed. The resulting ability to predict process forces and system deflections in a fully coupled manner, enables the prediction of compliance-based shape deviations without incorporating simulations at the macro scale. An efficient calculation of the undeformed chip geometry, based on [44] and extended in this work, allows the simulation of the complete grinding process at the mesoscale. Furthermore, the simulation system is designed to be extensible for the inclusion of tool wear in the future. Simulation results are compared to experimental tests, performed on two different grinding machines, to validate the simulation system and to investigate the performance and transferability of the compliance and force models.

2. Materials and Methods

The simulation system presented in this work is an extension of the results presented in [35], where a compliance model which was calibrated based on static analogy tests was proposed. Using a kinematic simulation, final workpiece contours were predicted based on process forces recorded in grinding investigations. For the current work, a GPS was developed to directly integrate the compliance model, to approximate effective rake angles for each grain depending on the undeformed chip thickness, and to incorporate an FE-based force model. Process forces, elastic deflection and the resulting workpiece contours can therefore be predicted in a coupled manner.
To validate the models and to evaluate the transferability of the proposed methods between different machines and process strategies, the experimental results from the industrial setting presented in [35] are compared to the results of the new simulation system and additional experimental grinding tests. In addition, static compliance tests were performed in the laboratory setting in analogy to [35]. For the sake of clarity and for the reader’s convenience, the contents of the previous work are briefly recapitulated in the following sections whenever the same method was applied to the laboratory machine.

2.1. Experimental Setup for Compliance Tests

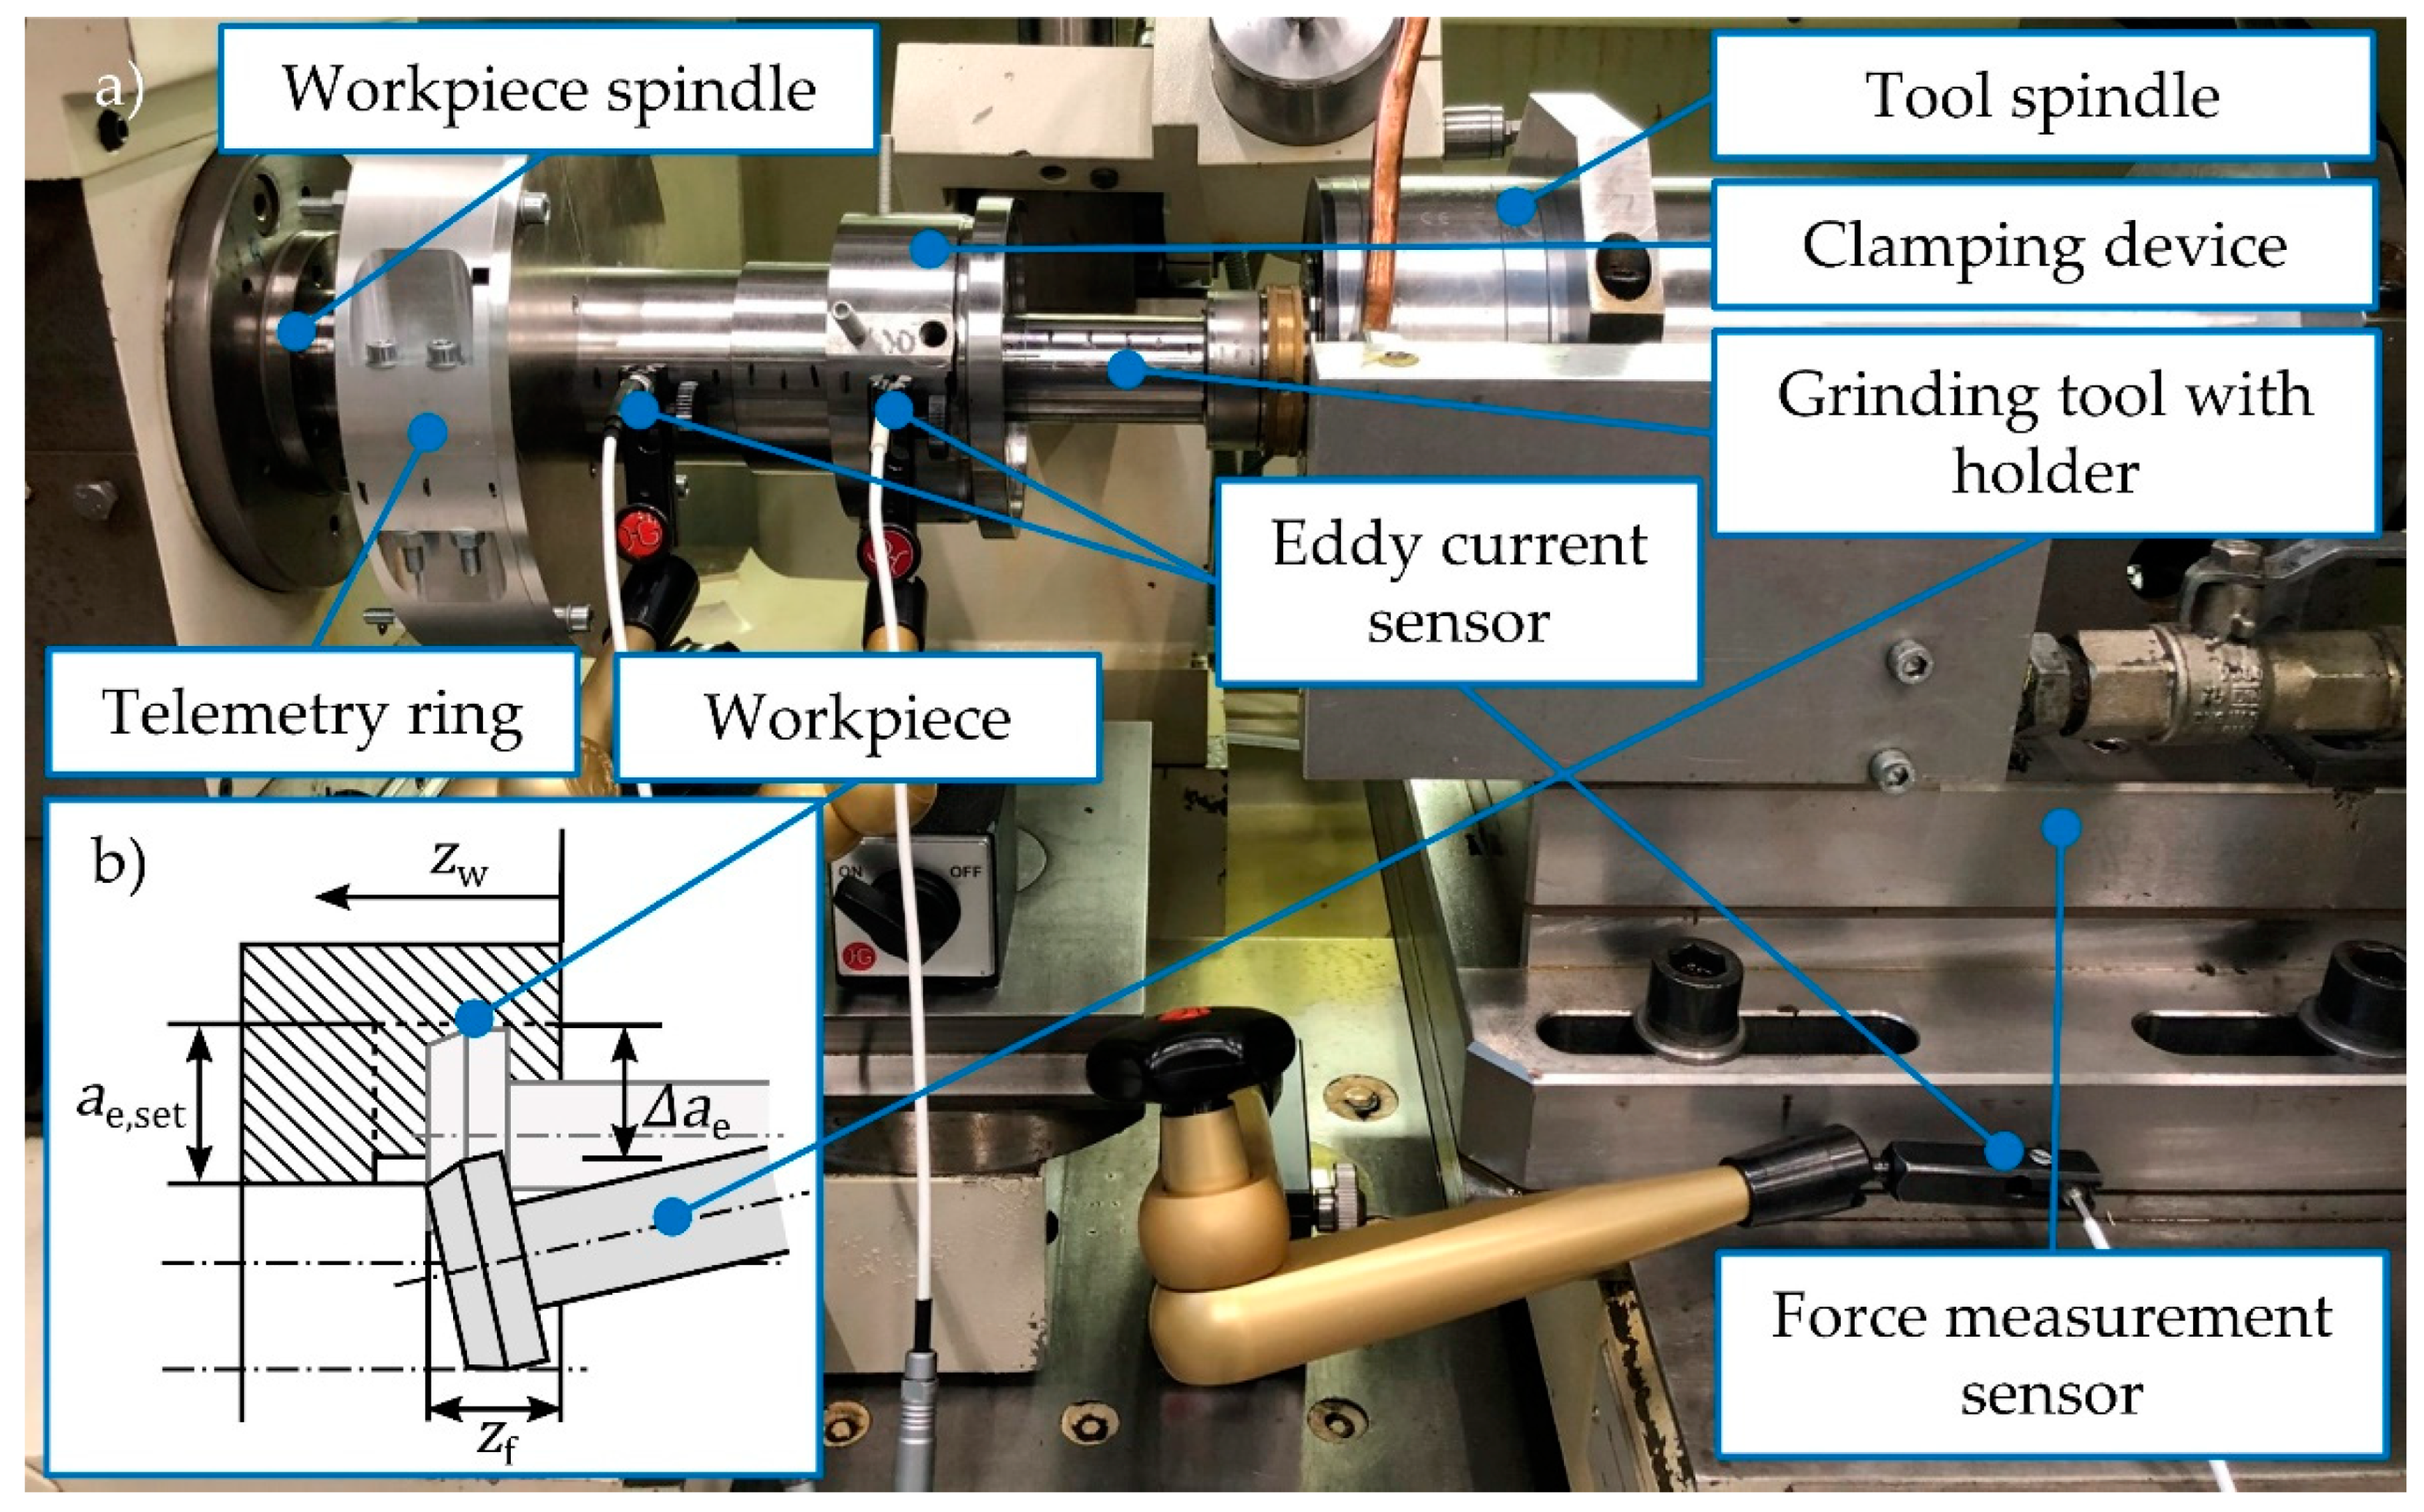
Using two internal cylindrical grinding machines with different workpiece clamping and spindle systems, static analogy investigations were carried out to determine the influence of spindle compliance on grinding results and to model it in a geometric kinematic grinding simulation. One test series took place on an internal cylindrical grinding machine in an industrial environment, in collaboration with Schaeffler Technologies AG & Co. KG (Herzogenaurach, Germany) [35]. Another series of tests was carried out on the internal grinding machine IC 400 by Danobat Overbeck in a laboratory environment for the current work. On the tool side, the high-speed grinding spindle HV-P 120-45.000/18 of the company GMN Paul Müller Industrie GmbH & Co.KG with an HSK-C40 interface was used in the first test series, while a grinding spindle HV-P 120 40.000/18 with an HSK-C50 interface was used in the laboratory environment. A monolithic grinding tool, consisting of a tool holder and an electroplated grinding wheel with cBN grains, manufactured by August Rüggeberg GmbH & Co. KG, was mounted in the spindle. The grains of size B181 cover the width w t , r of the conical roughing zone and the width w t , f of the cylindrical finishing zone, each measuring 4 mm. On the workpiece side, bearing rings were clamped in a modified clamping device in the first series of tests. A piezoelectric force measuring ring (Kistler 9251A) was integrated in the radial direction of the device, which was used for measuring the applied forces in all three dimensions. In the second test setup, a workpiece clamping device with a morsetaper of type MK5 was mounted in the workpiece spindle. The workpieces were placed in the clamping device and axially clamped with a cover. The test setup is shown in Figure 2.
In order to map the deformation of the spindle system, consisting of workpiece spindle and tool spindle, as a function of the acting normal forces, static analogy tests as described in [35] for the industrial setting were performed for the laboratory machine. The cylindrical finishing zone of the grinding tool was moved in 0.5 µm steps in radial direction against the workpiece clamped in the clamping device. To establish the correlation between the spindle deformation and the process forces, a piezoelectric three component force measuring device type 9255C from Kistler Instrumente GmbH was used, which had been mounted under the tool spindle. Three eddy current sensors of the type NCDT 3010-A U1 by Micro-Epsilon were positioned on the machine bed to measure distances between sensor and components due to the movement of the grinding tool. The first sensor was used as a reference sensor to measure the actual radial infeed on the headstock. Whereas the other two sensors can be used to differentiate between the compliances of individual system components, the results presented in this work do not rely on them.
The deformation of the spindle system was investigated for three different contact positions between tool and workpiece. The relative tool position z f between tool and workpiece is defined as the relative axial distance between the axial position of the leading tool face z t and the front workpiece edge z w . At each contact position z f , 24 tests were performed.

2.2. Compliance Model

A mathematical model is required to incorporate the effects of all relevant machine system compliances (including spindles, tool, workpiece, and workpiece clamping device) into process simulations. In ITG, the deformations of all system components under the influence of the process forces add up to a reduction Δ a e of the depth of cut. Based on the results of a static analogy test, the linear model
Δ a e ( F n ) c ¯   F n  
denoted model (1) in the following, for the relationship between the normal force F n and the the reduction of the depth of cut Δ a e was recently proposed [35], wherein the effective system compliance c ¯ is an experimentally determined model parameter. The experimental results indicated a strong influence of the relative tool position z f on c ¯ . In this work, we enhance this model to take the dependency of the effective system compliance on the relative tool position z f into account, i.e.,
Δ a e ( F n ,   z f ) c ˜ ( z f ) F n
The experimental investigations presented in the following were limited to three relative tool positions z f due to the required effort. Although the classic Bernoulli beam theory predicts a third order polynomial for the function c ˜ ( z f ) for a clamped cantilever beam of constant cross-section loaded by a point force, we restrict the model to the linear ansatz
c ˜ ( z f ) = a 0 + a 1 z f
to avoid extrapolation based on low-quality polynomial fitting. The combination of Equations (2) and (3) will be referred to as model (2).

2.3. Experimental Setup for Grinding Tests

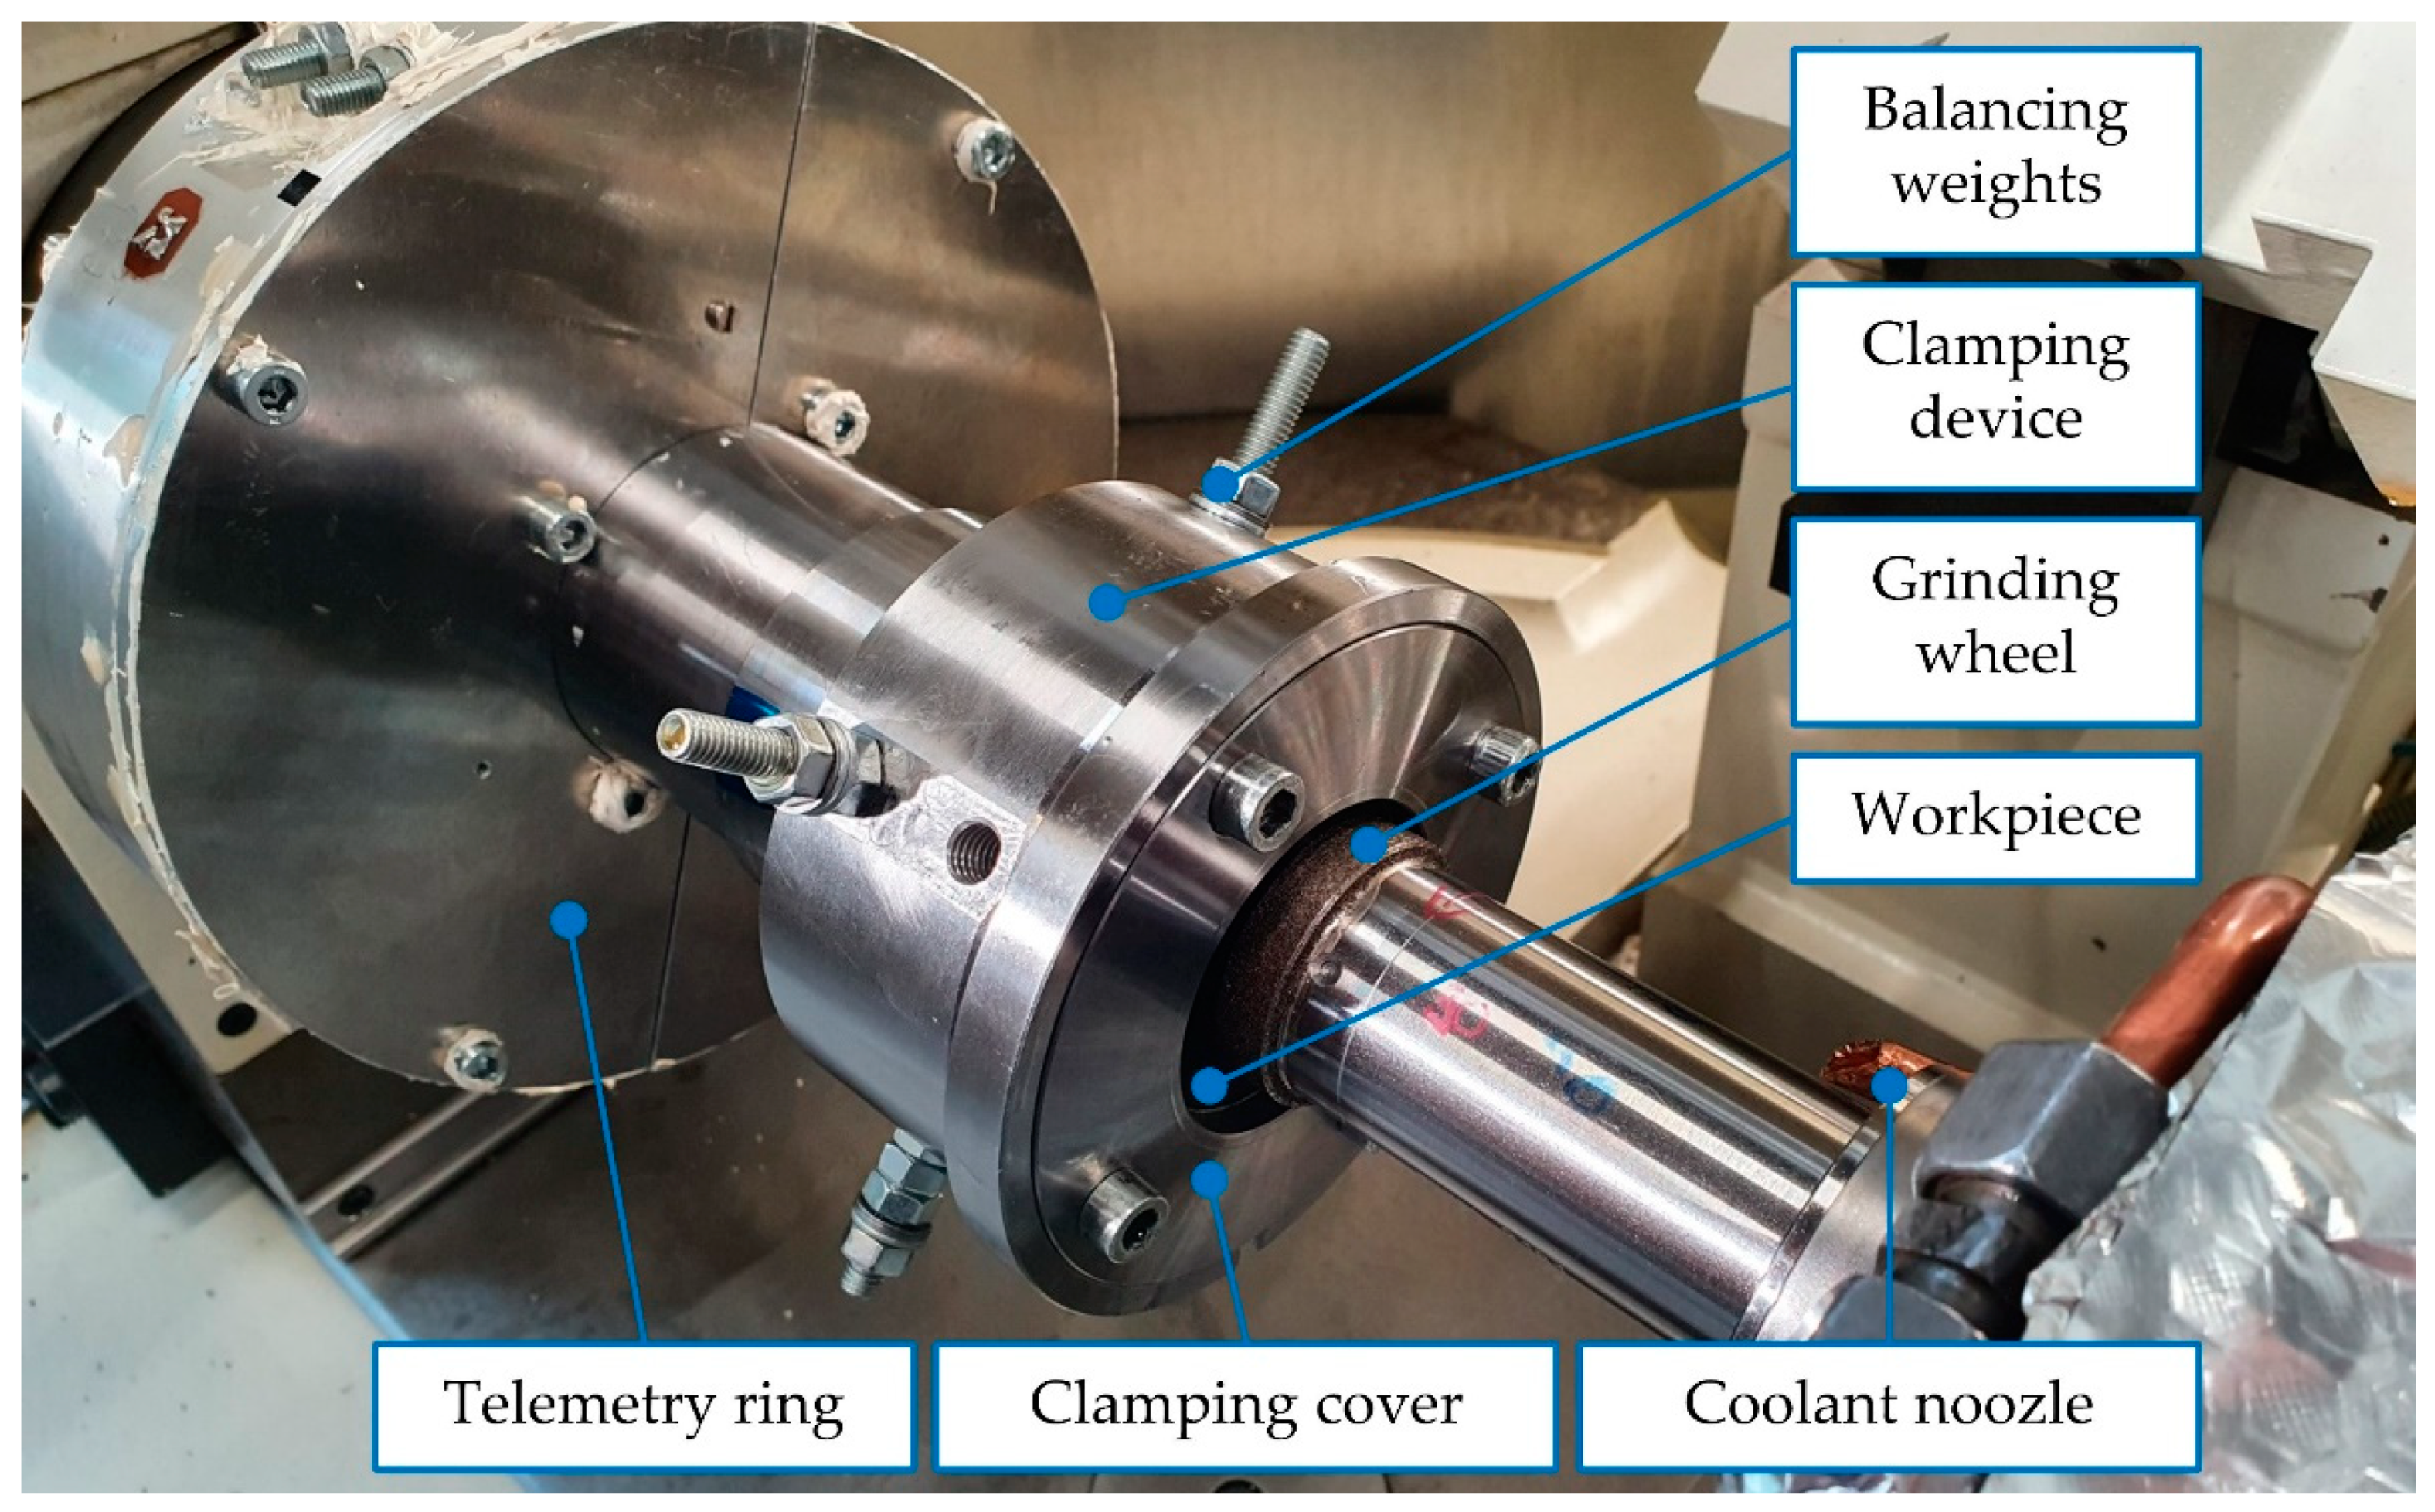
In addition to the static compliance tests, internal traverse grinding tests were performed on both internal grinding machines to determine the shape deviations due to ITG as well as the process forces. In the industrial setting, the normal forces F n were measured analogously to the static investigations in Section 2.1 by using piezoelectric force measuring elements, which were integrated into the clamping device [35]. In addition, a three phase effective power measurement unit, manufactured by Nordmann GmbH & Co.KG, was used to measure the effective power during internal grinding, and the tangential forces F t were calculated based on the measurements. The experimental setup used for the grinding tests in the laboratory setting, is presented in Figure 3.
For all grinding investigations in the laboratory setting, thin-walled bearing rings with a ground inner and outer contour were used. The workpieces were aligned in the clamping device and axially clamped with a cover at a tightening torque of 4 Nm. The inner diameter of the workpiece was measured with a three-point internal micrometer at three positions along the length of the bore after clamping, where each measurement has been performed twice, in order to determine the elastic deformation of the workpieces. Using the in-process piezoelectric force measurement device described in Section 2.2, a series of grinding tests was carried out to measure the process normal force F n and the process tangential force F t . The measured forces were filtered with a finite-impulse-response filter design based on a Kaiser window. A low-pass frequency of   v fa / 4   mm and a transition width of 2 Hz were used for the filter configuration. The filtering was followed by a linear drift correction between tool entry and exit. In the grinding tests performed, the axial feed rate v fa was varied in five steps for both spindle systems. The experimental conditions are listed in Table 1. Before and after grinding, the inner diameter of the workpieces was measured along the bore length with the 3D coordinate measuring system Zeiss Prismo Vast 5 HTG.

2.4. Geometric Physically-Based Grinding Simulation

Within the scope of these investigations, a geometric kinematic grinding simulation was further developed, based on modelling techniques successfully applied by Siebrecht [44] to the process simulation of face grinding. The simulation system reproduces the kinematics of internal traverse grinding and determines the engagements of each grain geometrically at process scale.
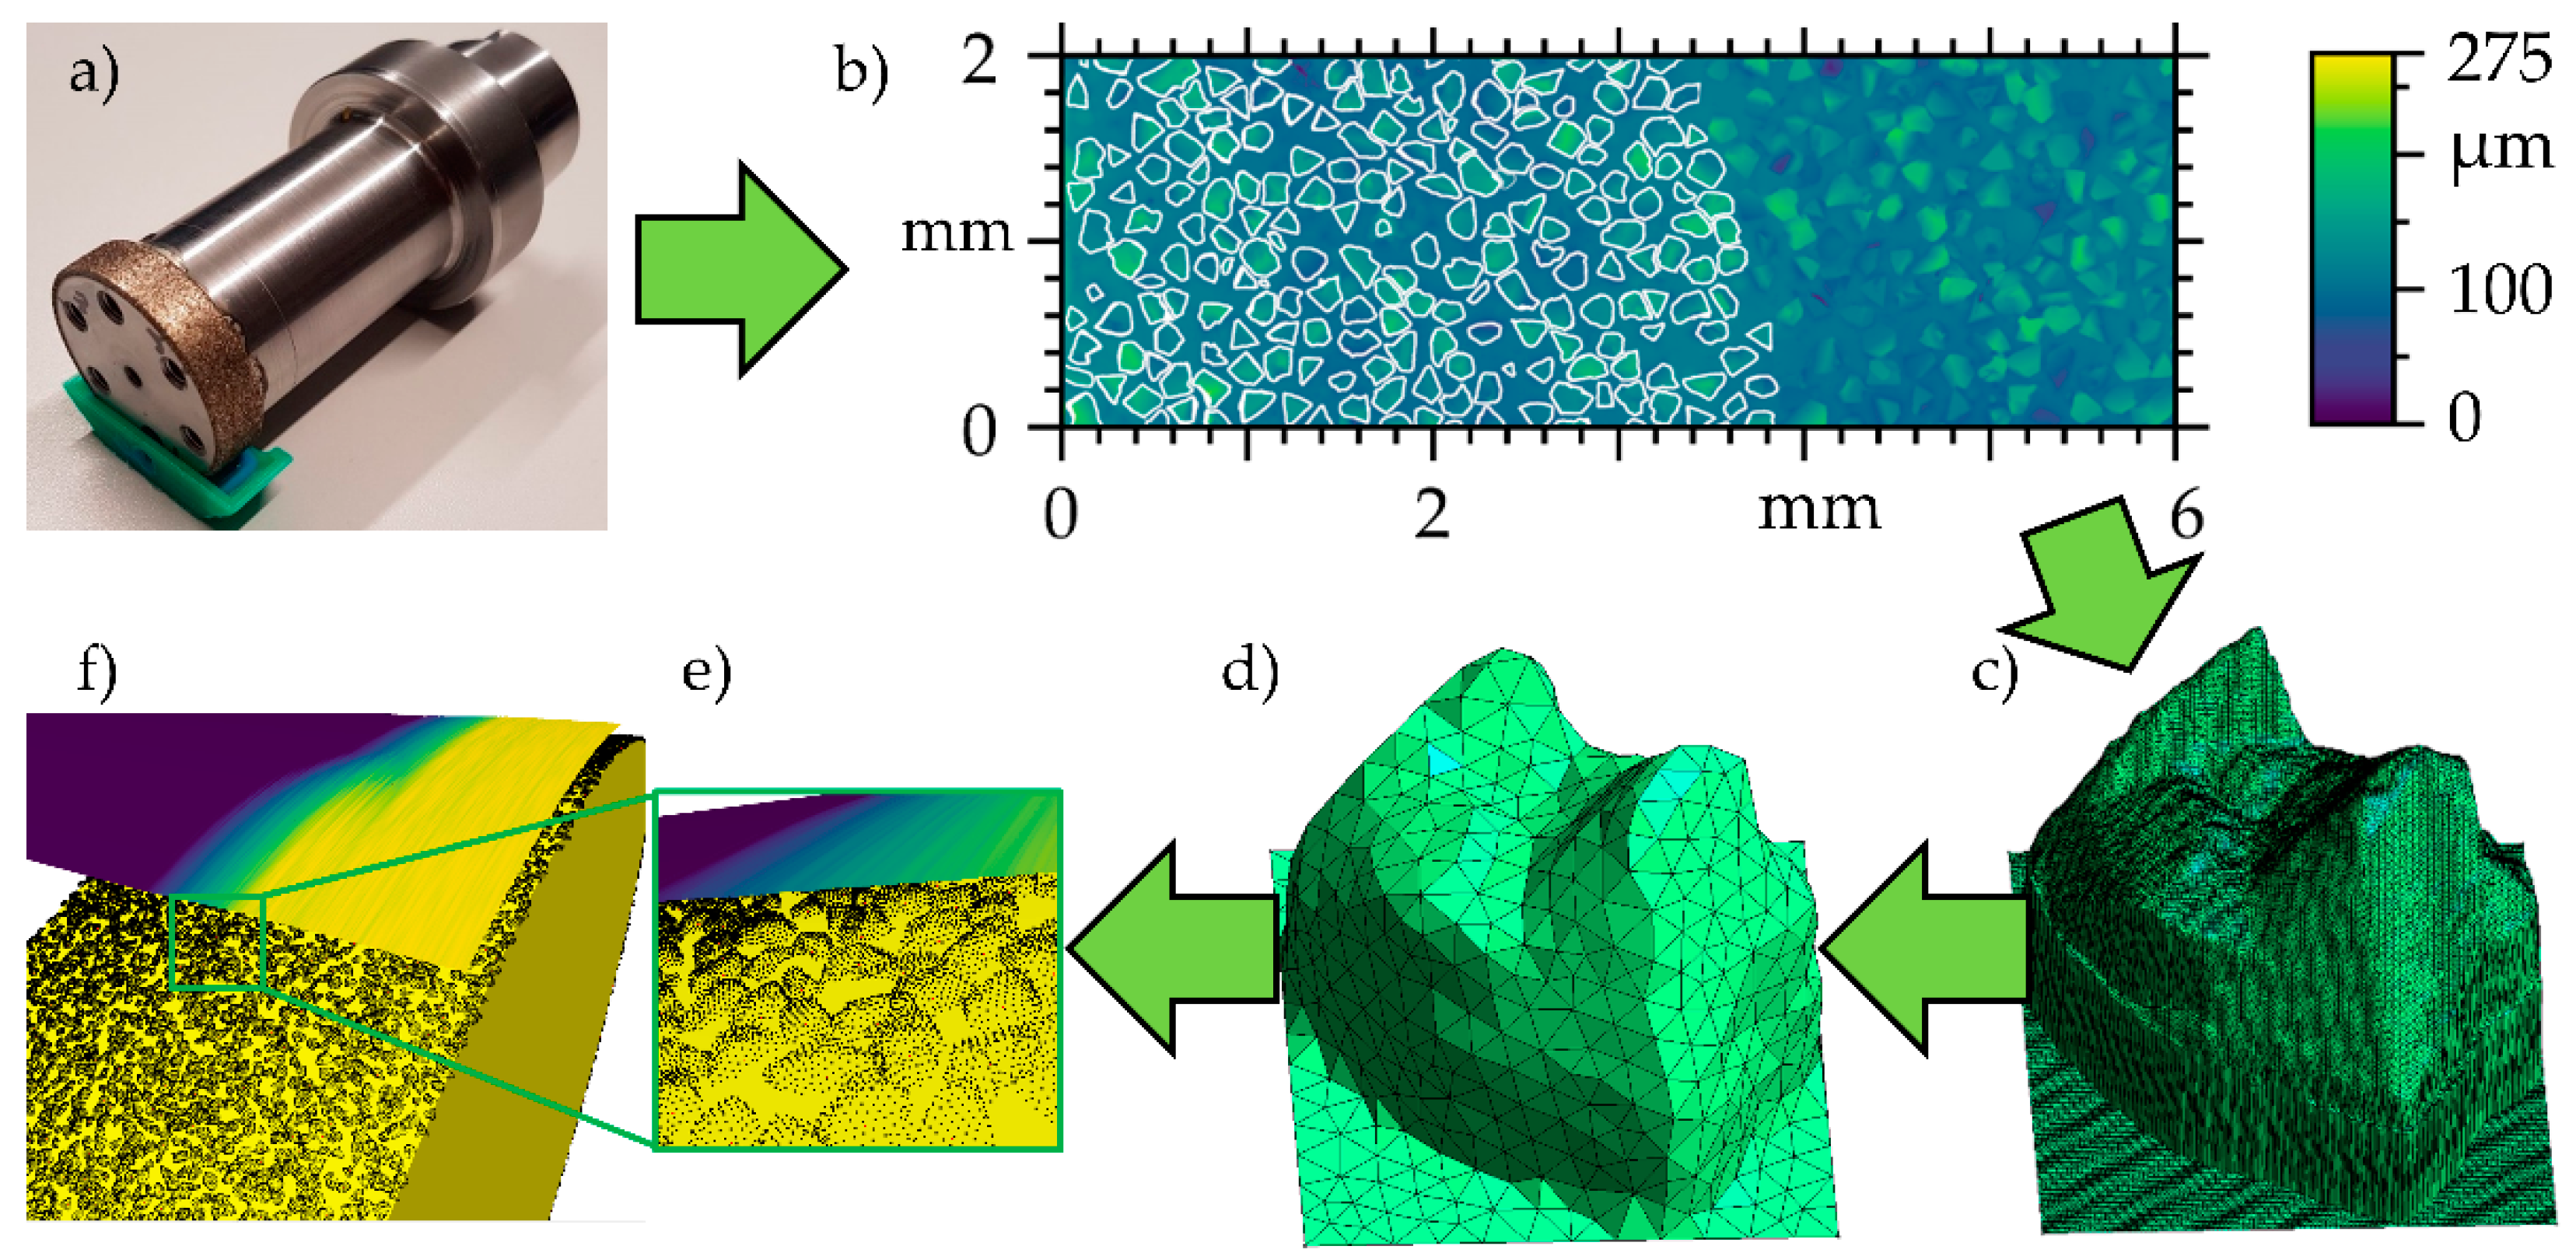
The grains were modelled by using triangle meshes. To this end, the electroplated cBN grinding wheels used for the experimental investigation were digitalised. For the grinding tools, 3D-printed shell containers were produced, and filled with the fast-curing two-part silicon rubber compound RepliSet-GF1 (Struers) to prepare high resolution 3D replicas of the tools, see Figure 4a. The grinding wheel replica was measured across the roughing and finishing zone widths by using the light microscope Alicona Infinite Focus G5. From the visualised measurement data, individual grains were manually masked, see Figure 4b. The height data of each grain were extracted and converted into a mesh to create a database of realistic grain geometries (Figure 4c). Because these meshes are based on evenly spaced vertices in a 2d projection, i.e., the top view, the 3d meshes exhibit elements with very small angles especially where the grains show large gradients in height. The open source software gmsh [45] was used to perform a remeshing of these 3d shell meshes, yielding near-uniform triangle meshes of a prescribed element size (Figure 4d).
The individual grains have been randomly rotated and placed on the surface of the grinding wheel model according to a Poisson disk sampling [46] to reach a realistic grain concentration [44]; see Section 3.3. For the modelling of the workpiece, represented by its roughly cylindrical inner surface, a grid-based radial height field was implemented; see Section 3.3. By intersecting the tool model with the workpiece model, the grain engagements are determined. To calculate the process forces for each individual grain, an analysis of the engagement situation and an approximation of the rake angle depending on undeformed chip thickness is carried out (cf. Section 3.3).
The individual rake angle and undeformed chip volume of each grain form the input variables of a surrogate model to calculate the grains’s contribution to the cutting forces in tangential and normal direction; cf. Section 2.5 and Section 3.2. The resulting total process forces are calculated by summing all individual grain forces occurring in a discrete simulation time step. By evaluating the compliance model presented in Section 2.2 for the calculated process normal force, the deflection is calculated for each simulation step. By using the deflection to radially offset the tool, the effects of the deflection on the resulting geometry and topography of the workpiece were modelled.

2.5. Finite Element Simulations of Single Grain Cutting

The incorporation of compliance effects into the geometrical-physical simulation of the grinding process requires a model for the prediction of the process forces, especially for the normal force F n . An approach to calculate these forces for individual grains, comprehensively described in [18], was adopted for this work. Thermo-mechanically coupled finite element (FE) simulations of single grain cuts under process conditions were carried out based on the commercial FE package Abaqus 2018. The approach assumes 2d plane-strain conditions, which have been shown to yield reasonable results, see [17]. Adaptive remeshing, as presented in [15], was applied to the simulations to deal with the large local deformations and associated mesh distortions occurring during the simulations. To predict the forces induced by individual grains, simulations with varying rake angles and undeformed chip thicknesses were performed, and a force model was calibrated based on the results. The boundary value problem for the simulations is shown schematically in Figure 5. Size and shape of the grain were varied between simulations, and a representative section of the workpiece is chosen so that the grain penetrates no more than 20% of the modelled workpiece depth. The grain is mechanically fully constraint, while a relative velocity v s   towards the grain was prescribed at the lower and left workpiece boundaries (blue colour).
A Johnson–Cook-type thermo-elastic and thermo-viscoplastic material model, see [27], was applied for the workpiece material. The Johnson–Cook yield stress
σ y JC = [ A + B [ 1 e ε p N ] ] [ 1 + C ln ( 1 + ε ˙ p ε ˙ p , 0 ) ] [ 1 θ θ 0 θ m θ 0 M ]
is defined in terms of the plastic strain rate ε ˙ p , the accumulated plastic strain
ε p ( t ) = ε p | t = 0 + 0 t 2 3 ε ˙ p : ε ˙ p   d t  
and of the temperature θ , and was combined with a local ductile damage variable d to model the softening of the material under high plastic strains, see e.g., [47]. The final yield stress reads
σ y = [ 1 d ] σ y JC  
and the evolution of the internal damage variable d , in terms of the saturation rate ϑ d , the damage saturation value d ¯ and the critical accumulated plastic strain ε p d to initiate the damage evolution, is governed by the equation
d ˙ = ϑ d   ε p ε p d [ d ¯ d ] ε ˙ p  
All material parameters for the Johnson–Cook model were chosen based on [48]. A comprehensive presentation of all model parameters for the boundary value problems, of which only the relative cutting velocity has been changed to v s = 75   mm / s , can be found in [15].

3. Results

In the following section, the calibration of the models for compliance and single grain forces is presented, and details of the implementation of the models into the GPS are discussed. Force curves and resulting workpiece shapes are then compared to the experimental findings.

3.1. Compliance Model Calibration

A total of 72 compliance tests were performed as described in Section 2.1. Figure 6a shows the distance d measured by the reference sensor at the headstock over the normal force F n for an exemplary measurement.
The headstock moves approximately 10 μm away from the sensor at zero force (grey dots), until contact with the workpiece holder is established. Any additional movement of the headstock results in a deflection of the system and in a corresponding increase of the normal force (blue dots). Although the loading and unloading paths can be visually distinguished, a reasonable approximation of the effective system compliance c was obtained from a linear regression of the force-distance-data, neglecting data points where the measured force does not exceed a threshold of F 0 = 3   N . An extensive description of this approach can be found in [35]. The linear fit exceeds a value of R 2 0.95 for all but four measurements, which were excluded from the further evaluation.
Figure 6b shows the resulting values of compliance c for the three relative tool positions. Box boundaries represent the first and third quartile, while the whiskers extend to the datum furthest from the boxes, but not exceeding 1.5 times the interquartile range. No outliers beyond this range occur in the data. Whereas the first and third quartiles decrease for higher values of z f , no clear trend is observed for the median. Mean values are presented in Table 2 and decrease with increasing z f .
For model (1), compliance c ¯ was determined from the average of all individual compliances c , while for model (2), the coefficients a 0 and a 1 of the function c ˜ ( z f ) were determined by a least-squares fit. All results are presented in Table 3 and visualised in Figure 6b.
While the results indicate a dependency of the effective system compliance on the relative tool position, the influence is comparatively small. Applying the simple model (1), which does not take the relative tool position into account, results in a maximum error of 4.9% at z f = 10   mm compared to model (2). Since other relevant factors, e.g., heat effects, are not yet included in the simulations and will likely induce an error of equal or higher magnitude, model (1) was applied for the simulations presented in this work.

3.2. Prediction of Single Grain Cutting Forces

Some representative force-displacement curves obtained from multiple single grain cutting simulations as described in Section 2.5 are shown in Figure 7. To compare the forces for varying undeformed chip thicknesses h cu s , specific values per theoretical material removal rate Q w s of the single grain were calculated, i.e.,
F ˜ n / t s = F n / t s Q w s  
where the material removal rate is calculated based on unit width b , the undeformed chip thickness and on the relative cutting speed v s for the single grain engagement as
Q w s = v s   b   h cu s  
A pronounced dependency of the specific forces on the rake angle γ s can be observed: Large negative rake angles produce higher values for both normal and tangential forces. However, no significant influence of the undeformed chip thickness on the specific forces was found. Although only some exemplary curves are shown in Figure 7, these trends held true for all simulations conducted.
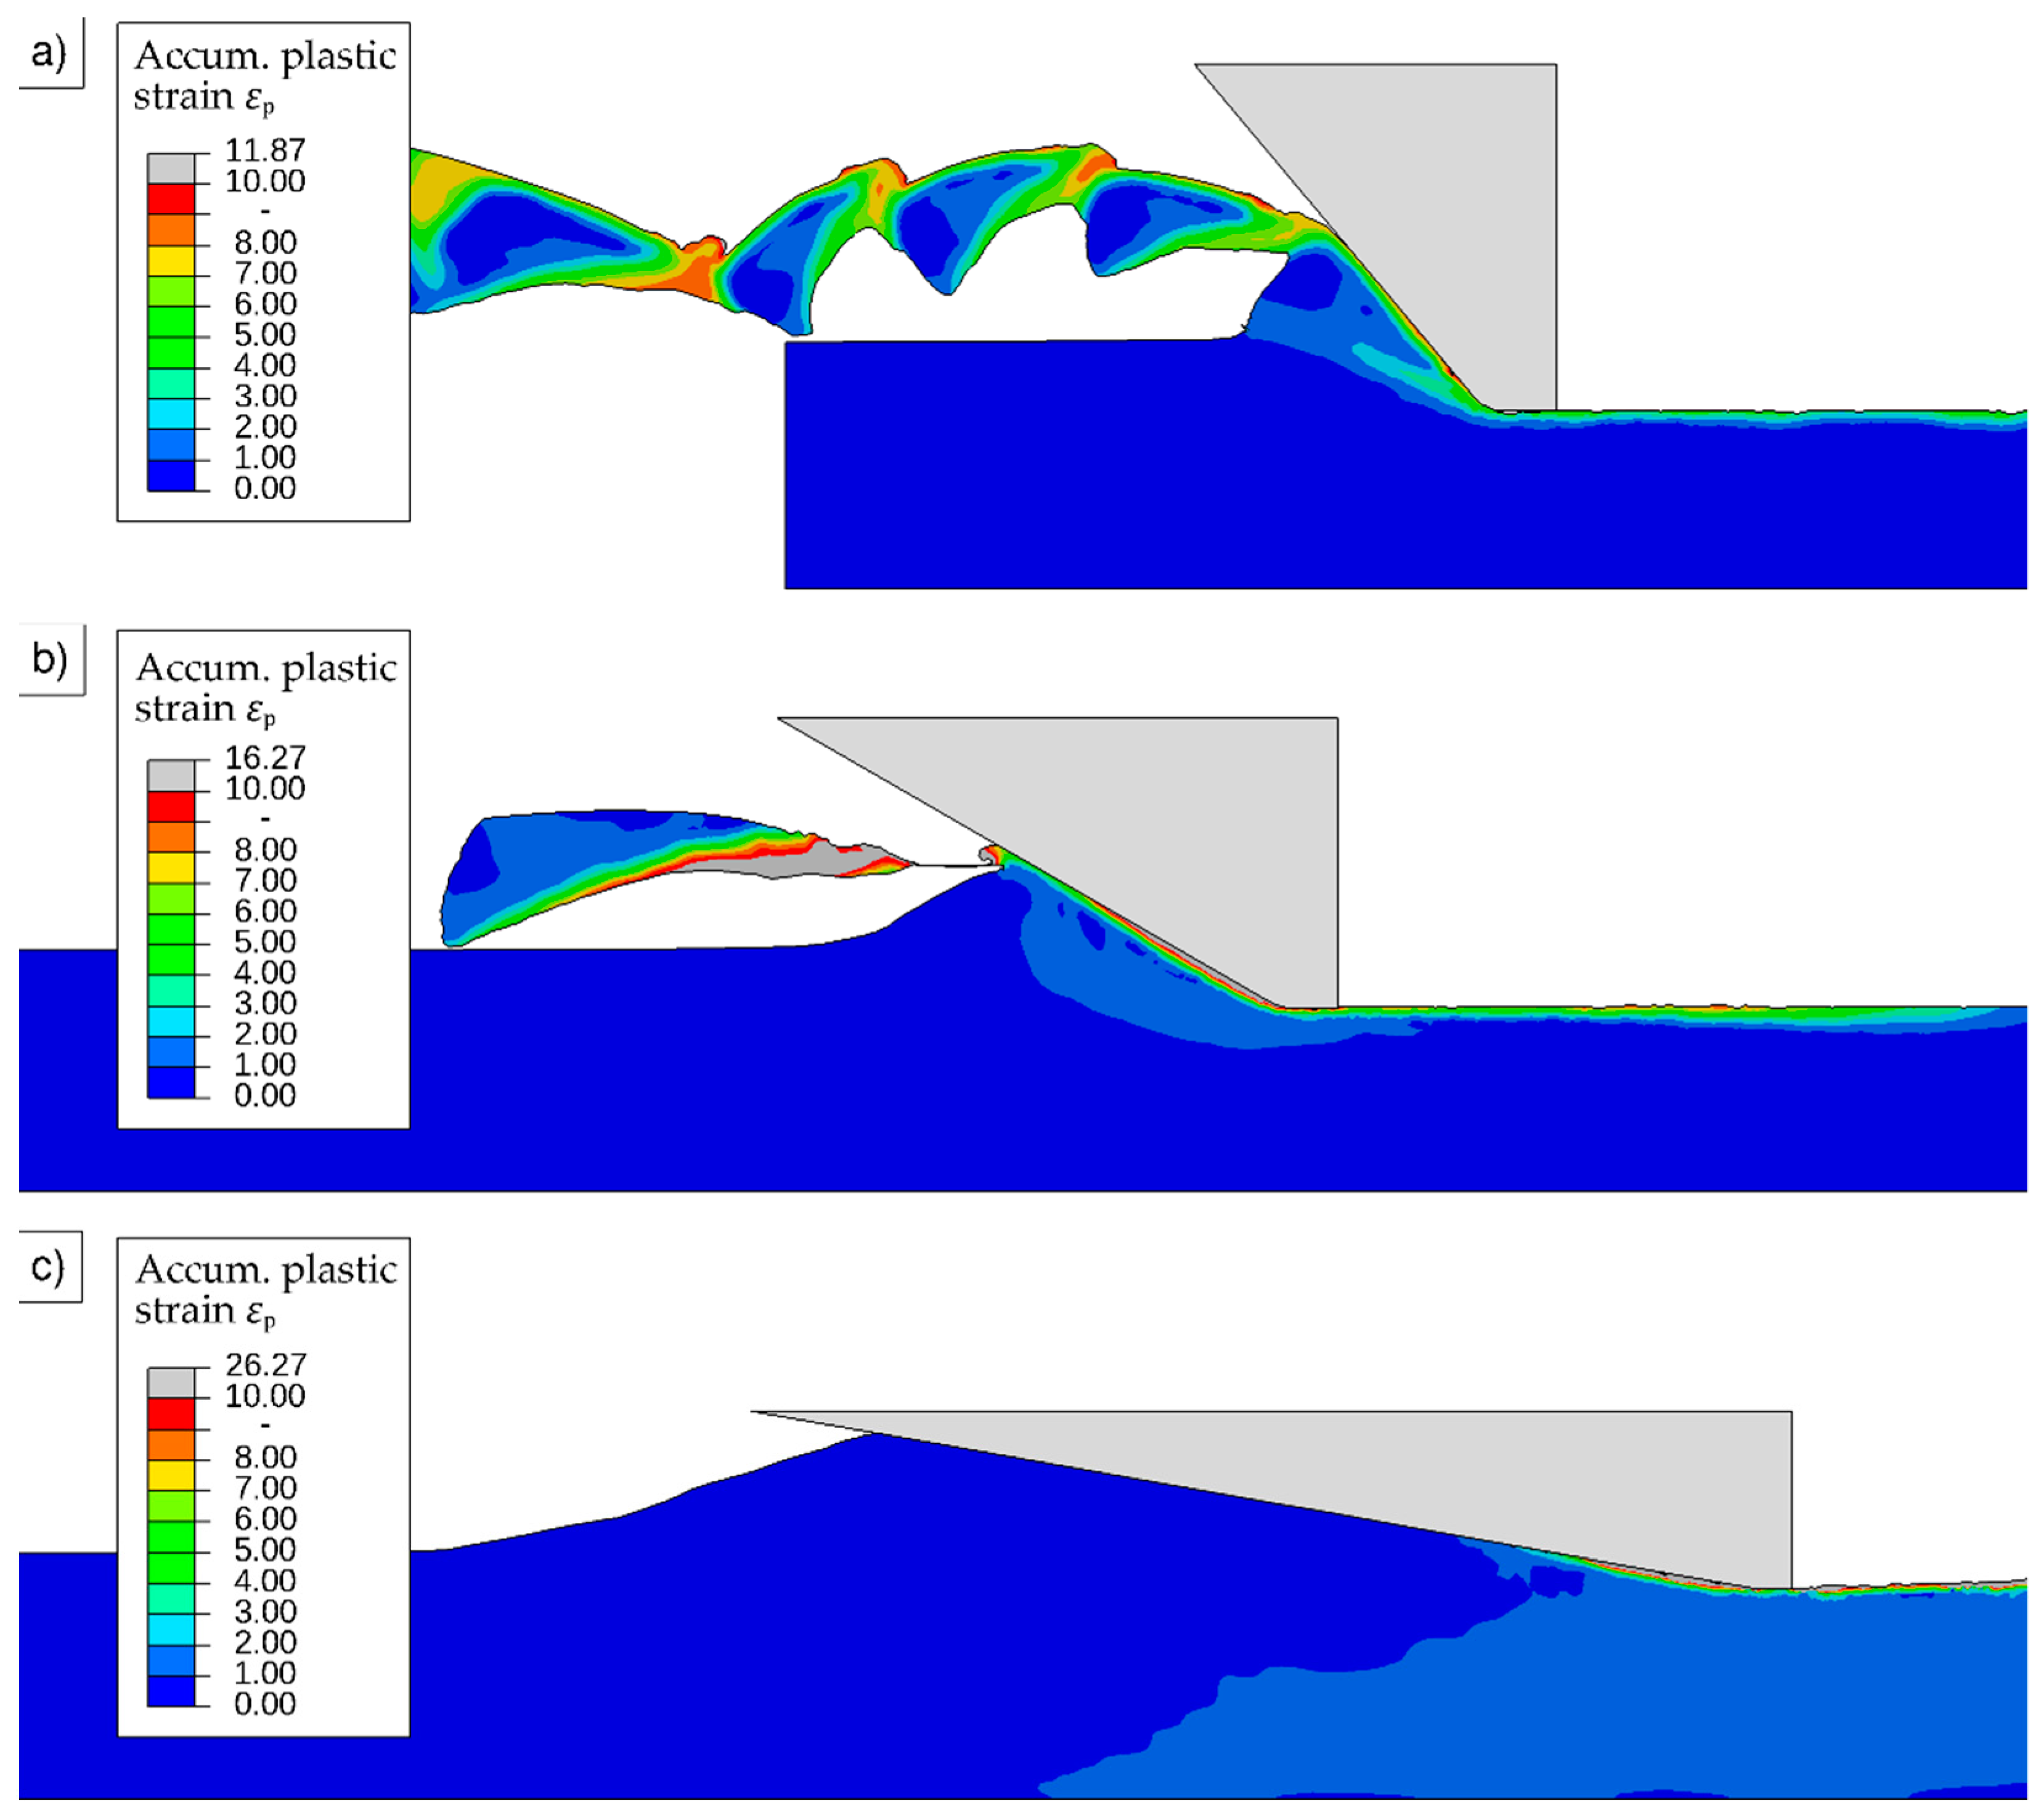
The force curves for rake angles closer to 0° show oscillations around an approximately constant value. Larger negative values of γ s lead to a reduced number of oscillations, and values below a certain threshold do not show any oscillations at all. This observation is linked to the emergence of shear bands in the workpiece material and resulting chip formation. Figure 8 shows exemplary deformed workpiece geometries to demonstrate this effect. The segmented chip obtained for γ s = 40 ° coincides with the oscillations in the corresponding force curves. Only one distinct chip emerged for γ s = 60 ° before the simulation terminated because chip separation was not included in the model. For γ s = 80 ° , no chip formation was observed in the simulations.
Since the undeformed chip thickness h cu s had no significant effect on the specific forces, the force model used in this work is parametrised only in terms of the rake angle γ s . To this end, a parameter study was conducted for a constant value of h cu s = 10   μ m and 20 ° γ s 82 ° . Based on [6], it is assumed that predominantly large negative rake angles occur in the ITG process, and therefore the parameter study was focused on rake angles γ s < 40 ° . The restriction to angles γ s 82 ° is due to numerical instabilities occurring in the single grain simulations past this value.
Force modelling for the GPS is based on a curve fit of the specific forces obtained from the single grain simulations. For the normal forces, the exponential ansatz function
F ˜ n , s exp ( γ s ) = b 0   exp ( b 1   [ γ s b 2 ] ) + b 3
was used, whereas for the tangential forces the functions
F ˜ t , s exp ( γ s ) = c 0   exp ( c 1   [ γ s c 2 ] ) + c 3
and
F ˜ t , s tanh ( γ s ) d 0   tan h ( d 1   [ γ s d 2 ] ) + d 3
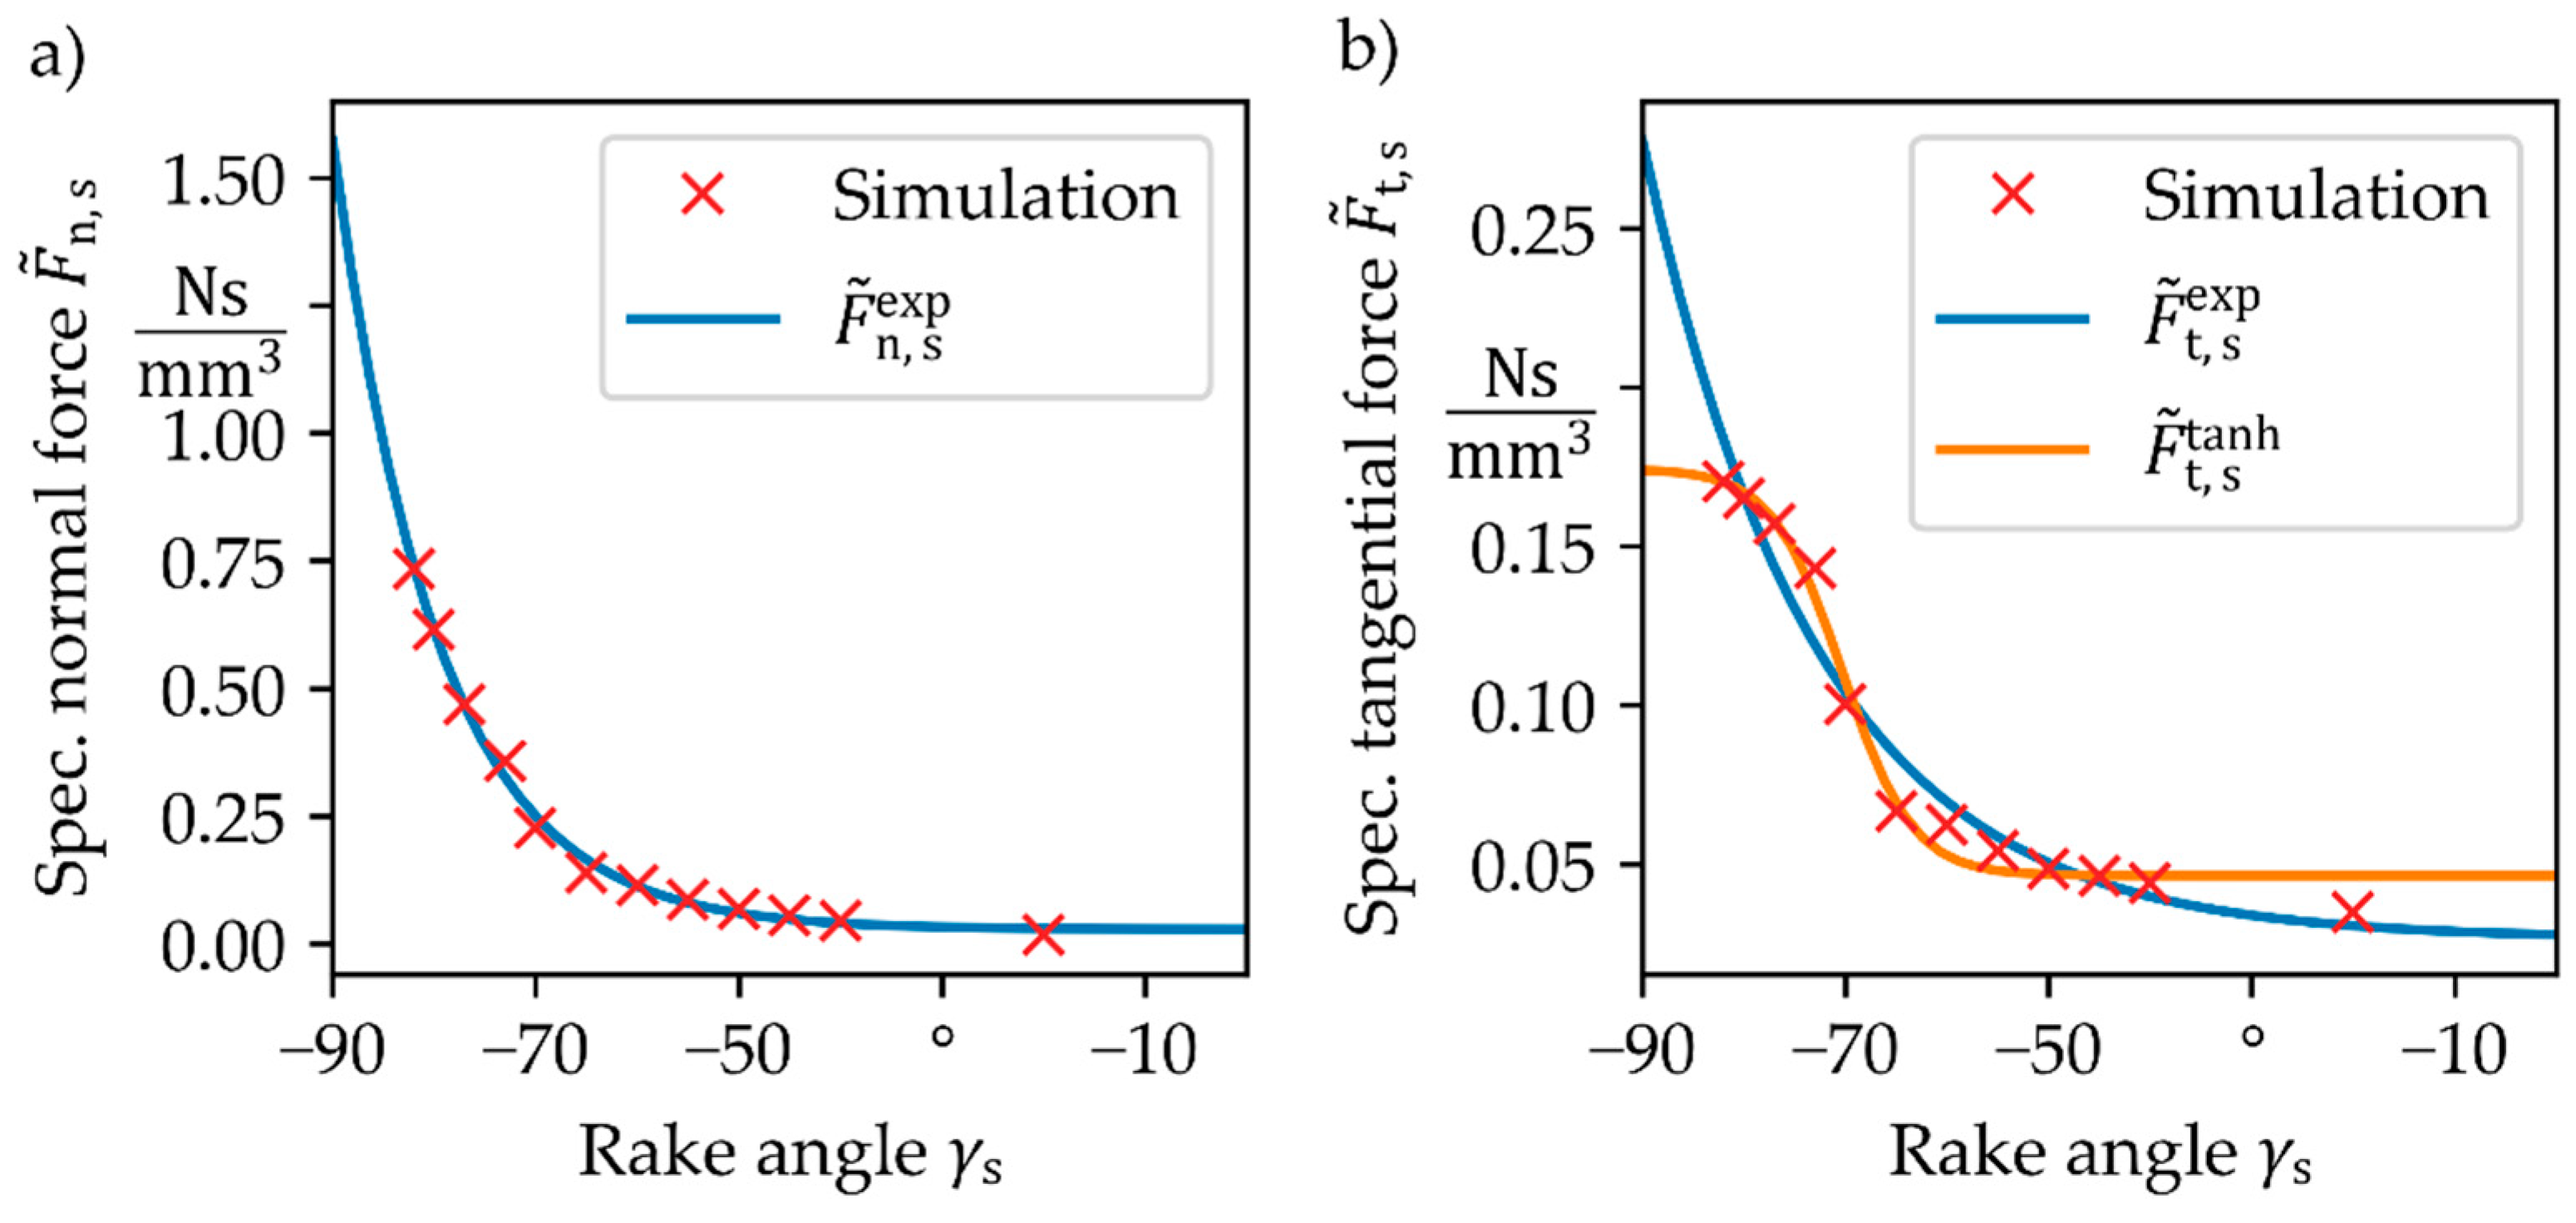
were compared. The results of the parameter study, as well as the force models resulting from the curve fits, are shown in Figure 9, and the coefficients obtained for each ansatz function are presented in Table 4
It should be mentioned that, since the force curves did not saturate for large native rake angles in our simulations, a systematic underestimation of the predicted forces at large negative rake angles is expected. Not all simulations covered the same displacements due to numerical difficulties, e.g., chip separation as shown above. Nonetheless, the normal forces are predicted accurately by the exponential approach with a root-mean-squared error (RMSE) of 0.0150   Ns / mm 3 , while the tangential forces seem to saturate for values of γ s < 70 ° . A possible explanation for this behaviour is the underlying model assumption that only a finite shear stress can occur in the contact zone between grain and workpiece. The saturation of the tangential forces can be modelled through the ansatz based on the hyperbolic tangent function at the cost of a reduced accuracy especially for values of γ s > 40 ° . Since the RMSE of 0.0107   Ns / mm 3 for Equation (12) is lower than the RMSE of 0.0059   Ns / mm 3 for Equations (11) and (12) is implemented in the GPS.

3.3. Geometric Physically-Based Grinding Simulation

A geometric physically-based simulation (GPS) was developed, based on the system presented by Siebrecht for face grinding [44] and on a framework developed at the Institute of Machining Technology. The models and algorithms were replaced, modified and enhanced in various ways, described below.
As the database of grain geometries (GDB) was created based on a new grinding wheel, there are some grains with an exceptional height. Especially at low axial feed rates, such outliers account for the main share of material removal and thus are subject to high wear levels. Another effect is that only a few grains get in contact with the workpiece at all, which leads to interrupted cutting, almost like e.g., in flank milling. Therefore, 15 grains have been excluded from the GDB of originally 417 grains. Paired with the GDB with realistic grains geometries, a suitable distribution of grains is important to create a realistic tool model. Following [44], the grains were placed according to a Poisson disk sampling [46]. Because the grain count of the tool is much higher than the size of the GDB, a uniformly distributed rotation around the surface normal of the grinding wheel at the grain position was applied to the orientation of each grain, therefore increasing variation between grains. The important parameter for the grain distribution is the grain density ρ G . To approximate the grain density of the real grinding wheel, the sum of all grains in the digitised section, cf. Figure 4b, where truncated grains were counted as half, was divided by the surface area.
ρ G = 417 + 78 2 12976   px   ·   3611   px   ·   ( 0.000625 mm px ) 2 24.91 1 mm 2
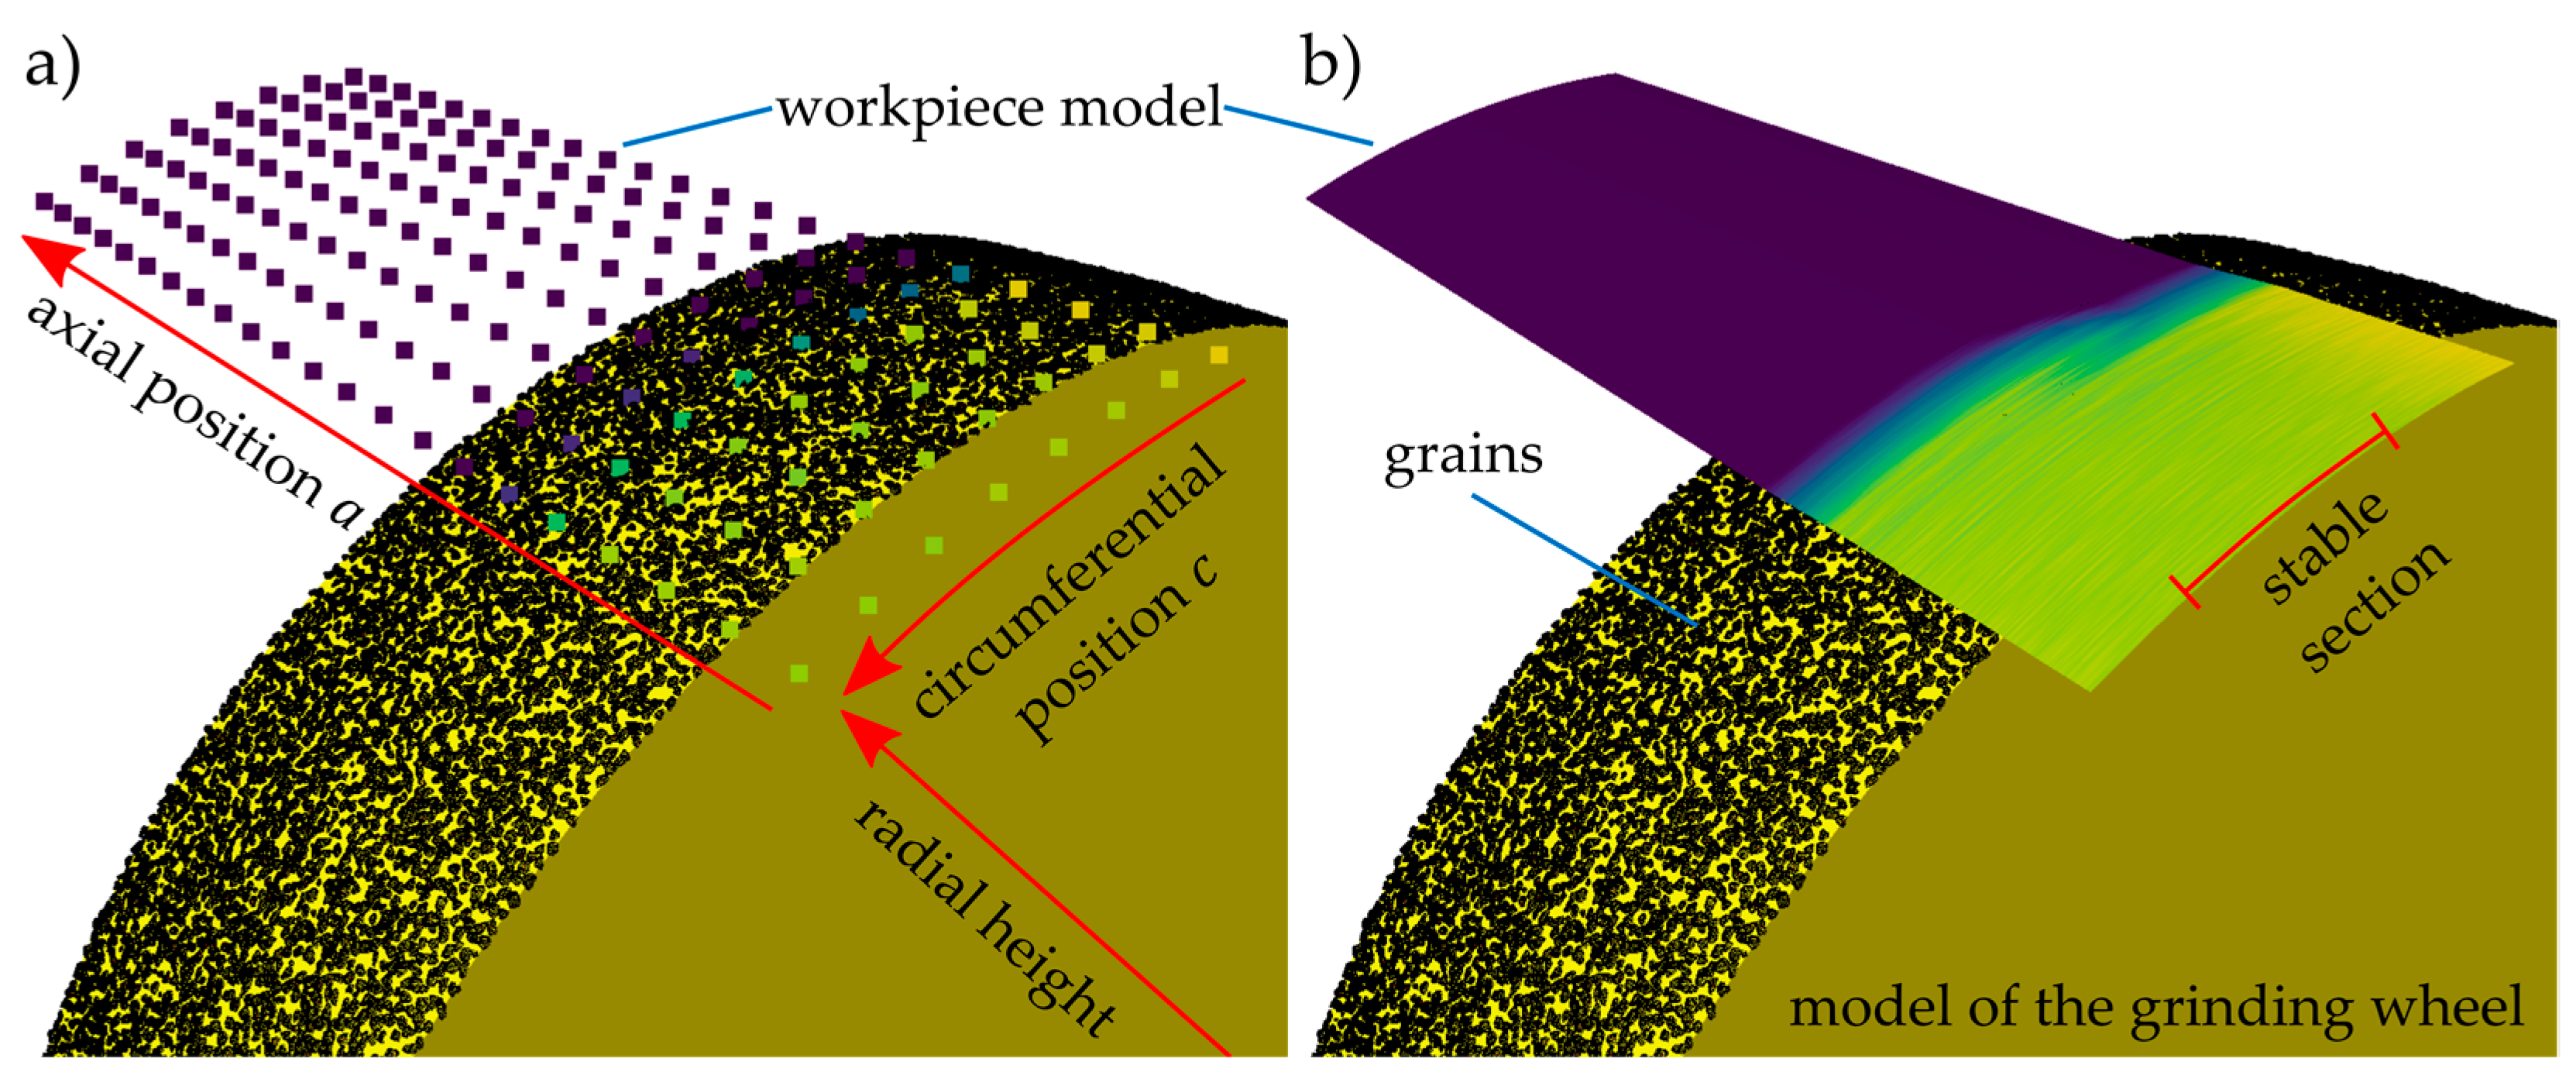
The second important component to be modelled, after describing the tool model above, is the workpiece. Because surfaces machined using ITG are typically roughly cylindrical, the workpiece was modelled as a cylindrical heightfield (cf. Figure 10a). Traditional flat heightfields consist of a discrete grid describing a rectangle and a continuous height value for each position of the grid, i.e., every surface point is described by a point ( x , y ) ℕ in a plane and a height   . In contrast to a traditional heightfield, the grid of a cylindrical heightfield describes the lateral face of a cylinder, defined by an axial and a circumferential position ( a , c ) ℕ, and the height value describes the radial offset from the grid. The axial and circumferential distance Δ a and Δ c between the grid points, was chosen as 0.0071 mm. To shorten the simulation time, the cylindrical heightfield can be reduced to a circumferential section smaller than the full inner workpiece circumference. Because all process effects that are of interest in this study are rotationally symmetric, circumferential sections of less than 90° are sufficient to predict process forces and system deflections in a stable section. However, a short section to stabilise after each workpiece revolution is necessary, and the section of circumferential tool exit is not representative either; compare Figure 10b.
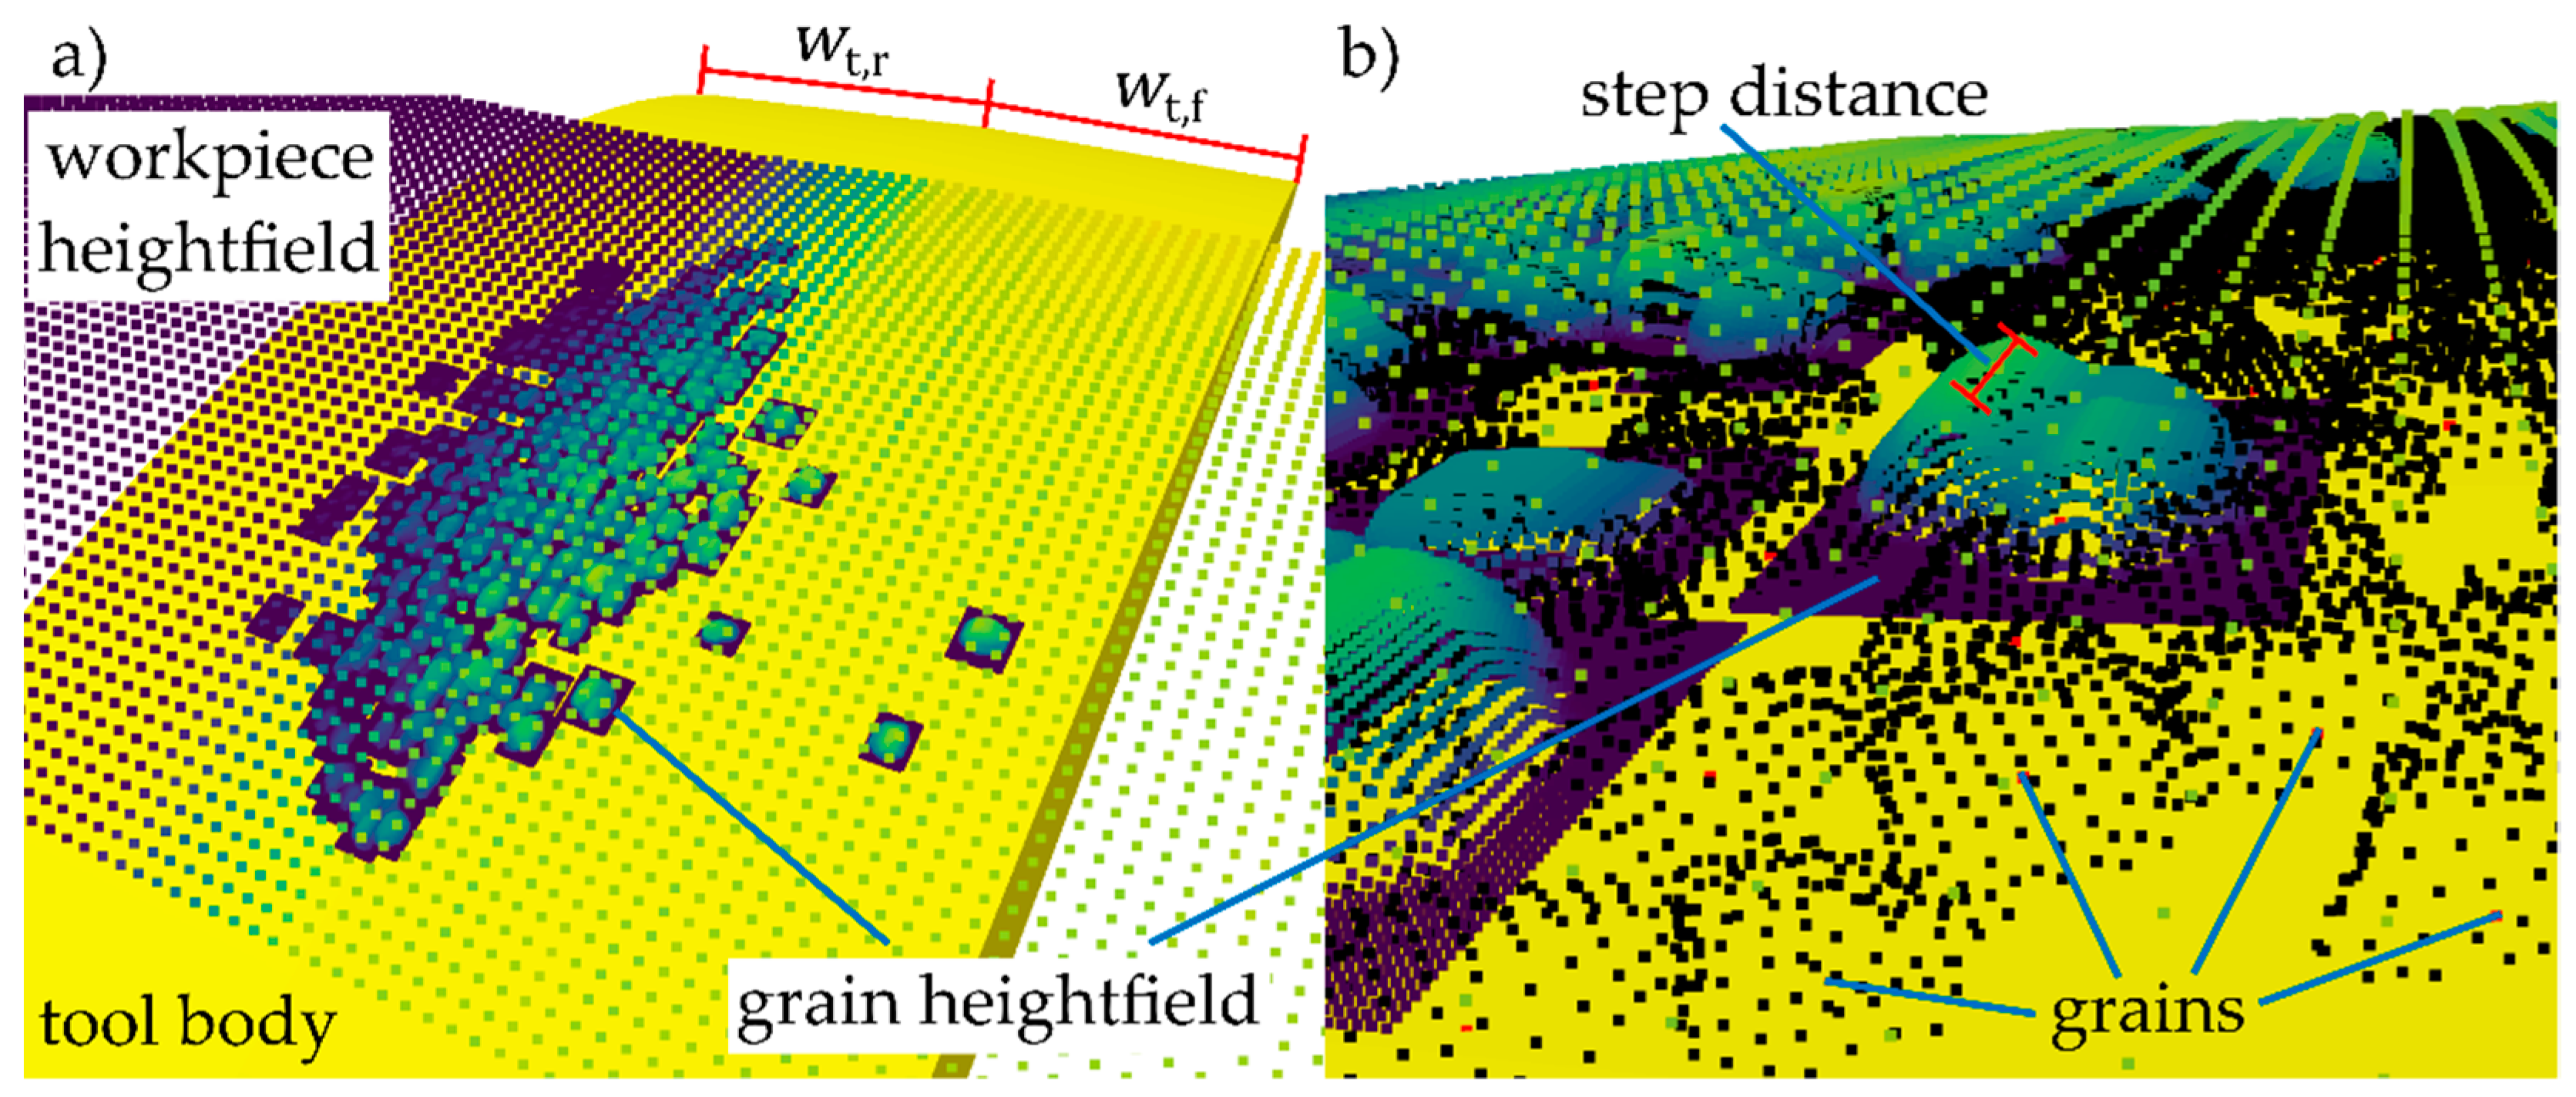
Simulation of the grinding process is performed in a time discrete manner. To reduce the overlap of the sweep volumes, the grains pass in a time step, the step duration Δ t is calculated depending on the distance which each grain travels in a step. The step distance was chosen to be 0.1 mm. The engagement of a grain, i.e., the intersection of the grain and workpiece models is calculated according to the method presented by Siebrecht [44]. The details can be found therein, but some important steps are described below. To approximate the volume a grain sweeps in a time step, a small local cylindrical heightfield is created for each grain that is located in proximity of the workpiece; see Figure 11.
The grain heightfield is initialised with the radius of the workpiece before grinding, and all vertices of the grain mesh are intersected with the grain heightfield. The sweeping is achieved by intersecting the grain not only for the end point of a step, but also for multiple equidistant sub steps. In order to avoid missing any cutting volume at the connection between two steps, it is necessary to also add the end point of the last step again. To recreate the grain volume in the grain heightfield, in the next step, the morphological filters dilate with kernel size 3 and erode with kernel size 2 are applied to the heightfield, followed by a Gauss filter with kernel size 7 and σ = 0.75 . Smoothness of the sweep volume in cutting direction depends on the step length, the heightfield point distance, the parameters of the filtering and on the amount of sub steps. It was found that for the parameters given above, five sub steps are sufficient, so this number was chosen for all simulations.
To calculate material removal, the grain heightfields are subtracted from the workpiece. In detail: if the height of the grain heightfield h i s at grid position i is greater than the height h i w of the corresponding point of the workpiece, the difference is subtracted from the workpiece. The material removal rate Q w s of a grain can directly be derived from the material removal and amounts to the sum of all subtracted heights multiplied by the axial and circumferential point distance, divided by the step duration, i.e.,
Q w s = i I ( h i s h i w )   Δ a Δ c   Δ t   ,   I = { i | h i s >   h i w }  
The undeformed chip thickness h cu s of a grain is approximated as the maximum height removed in a step.
Since the force model for the individual grains is parametrised in terms of the rake angle γ s (cf. Section 3.2), a method to approximate the effective rake angle for each grain, depending on the actual engagement, is required. The approximation scheme is visualised in Figure 12.
The triangles of the grain mesh which are assumed to be engaged for a cutting direction e c are depicted in Figure 12a,b for two different undeformed chip thicknesses h cu s . Triangles are considered only if they face in cutting direction, i.e., the projection of their normal onto the cutting direction e c is positive. The effective normal vector n r of a (virtual) plane rake face, see Figure 12 is approximated by averaging the normals of the engaged triangles. The effective rake angle γ s is then approximated as
γ s   γ ˜ s = cos 1 ( n ˜ r n ˜ r · e c )
based on the projection n ˜ r = n r n r · e a e a of the effective normal vector into the working plane.
To speed up the simulation, γ ˜ s ( h cu s ) is calculated in steps of 0.011 mm the first time a grain is engaged and interpolated linearly for the exact h cu s of each engagement of the grain occurring during the entire grinding process. The cutting forces can now be calculated according to Equations (16) and (17) as
F n , s = F ˜ n , s exp ( γ ˜ s ( h cu s ) ) · Q w s  
F t , s = F ˜ t , s tanh ( γ ˜ s ( h cu s ) ) · Q w s  
and the process forces amount to the sum of the single grain forces.
Using the compliance model described in Section 3.1, the deflection of the system can be calculated for each step as the product of the process normal force multiplied with the compliance. To incorporate the deflection into the simulation, the tool is radially offset by the amount of the deflection. A slight damping of the radial tool movement is ensured, by applying an exponential moving average with weighting factor α = 0.1 to the forces. A detailed visualisation of the resulting workpiece surface which includes all effects discussed above can be found in Figure 10b.

3.4. Validation of the Simulation System

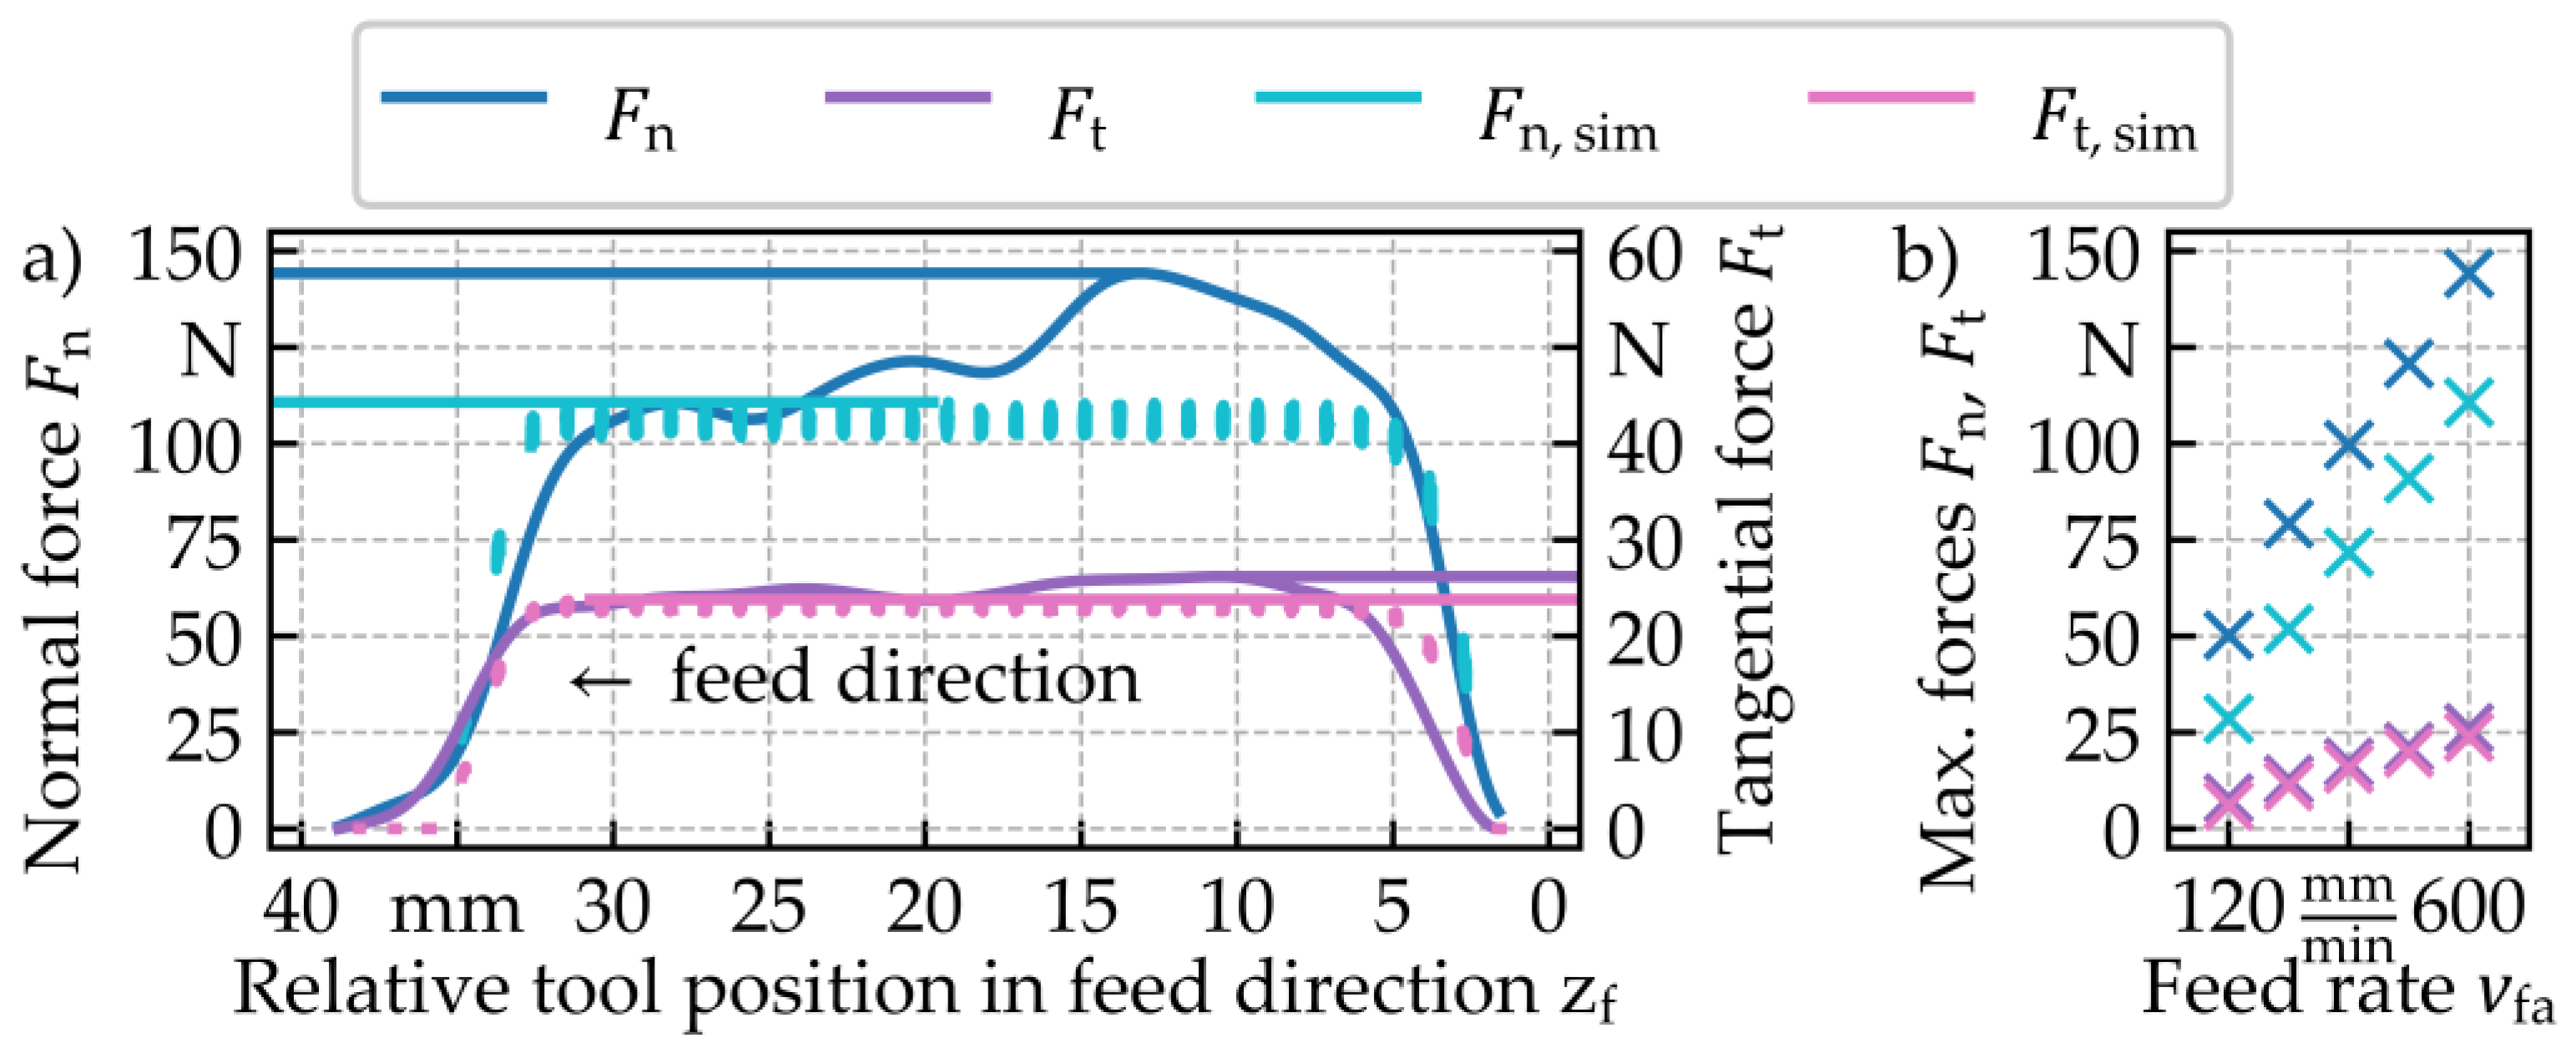
To validate the simulation system, internal traverse grinding experiments were conducted using two machine tools with fundamentally different designs. The details of the experimental set-ups for the laboratory and industry settings are given in Section 2.3 and the parameters are listed in Table 1. The workpieces of the simulations for the laboratory setting were initialised according to the measured inner diameters after clamping (cf. Section 2.3) with linear interpolation between the three measurement positions. A very rough approximation of the inverse workpiece deformation after unclamping was incorporated by subtracting the difference between the clamped and an unclamped workpiece from the simulation result. The workpiece models for the simulations of the industry setting were initialised with the constant diameter of an unclamped workpiece. Figure 13 shows the measured and simulated process forces for an internal traverse grinding process at a feed rate of v fa   = 600 mm/min, as well as the change in process forces over a variation of the feed rate for the industrial setup. The experimental conditions can be obtained from Table 1. A strong increase of the process forces was observed in the simulated as well as the experimentally recorded forces in the tool entry section. Whereas the simulation predicted a subsequent quasi-stationary phase in both normal and tangential forces, the measured normal force decreased in this phase.
The measured and simulated forces showed good agreement at the tool exit, where all forces drop back to zero. The increase and drop of forces at the entry and exit zone are related to the progressive engagement and disengagement of the tool. Figure 13b displays the maximum process forces for all tested feed rates. A linear increase depending on the feed rate was observed. Whereas the normal forces exhibited a difference between 21.7 N and 33.5 N, a good agreement was observed for the maximum tangential forces between simulation and experiment with a difference between 1.6 N and 2.4 N.
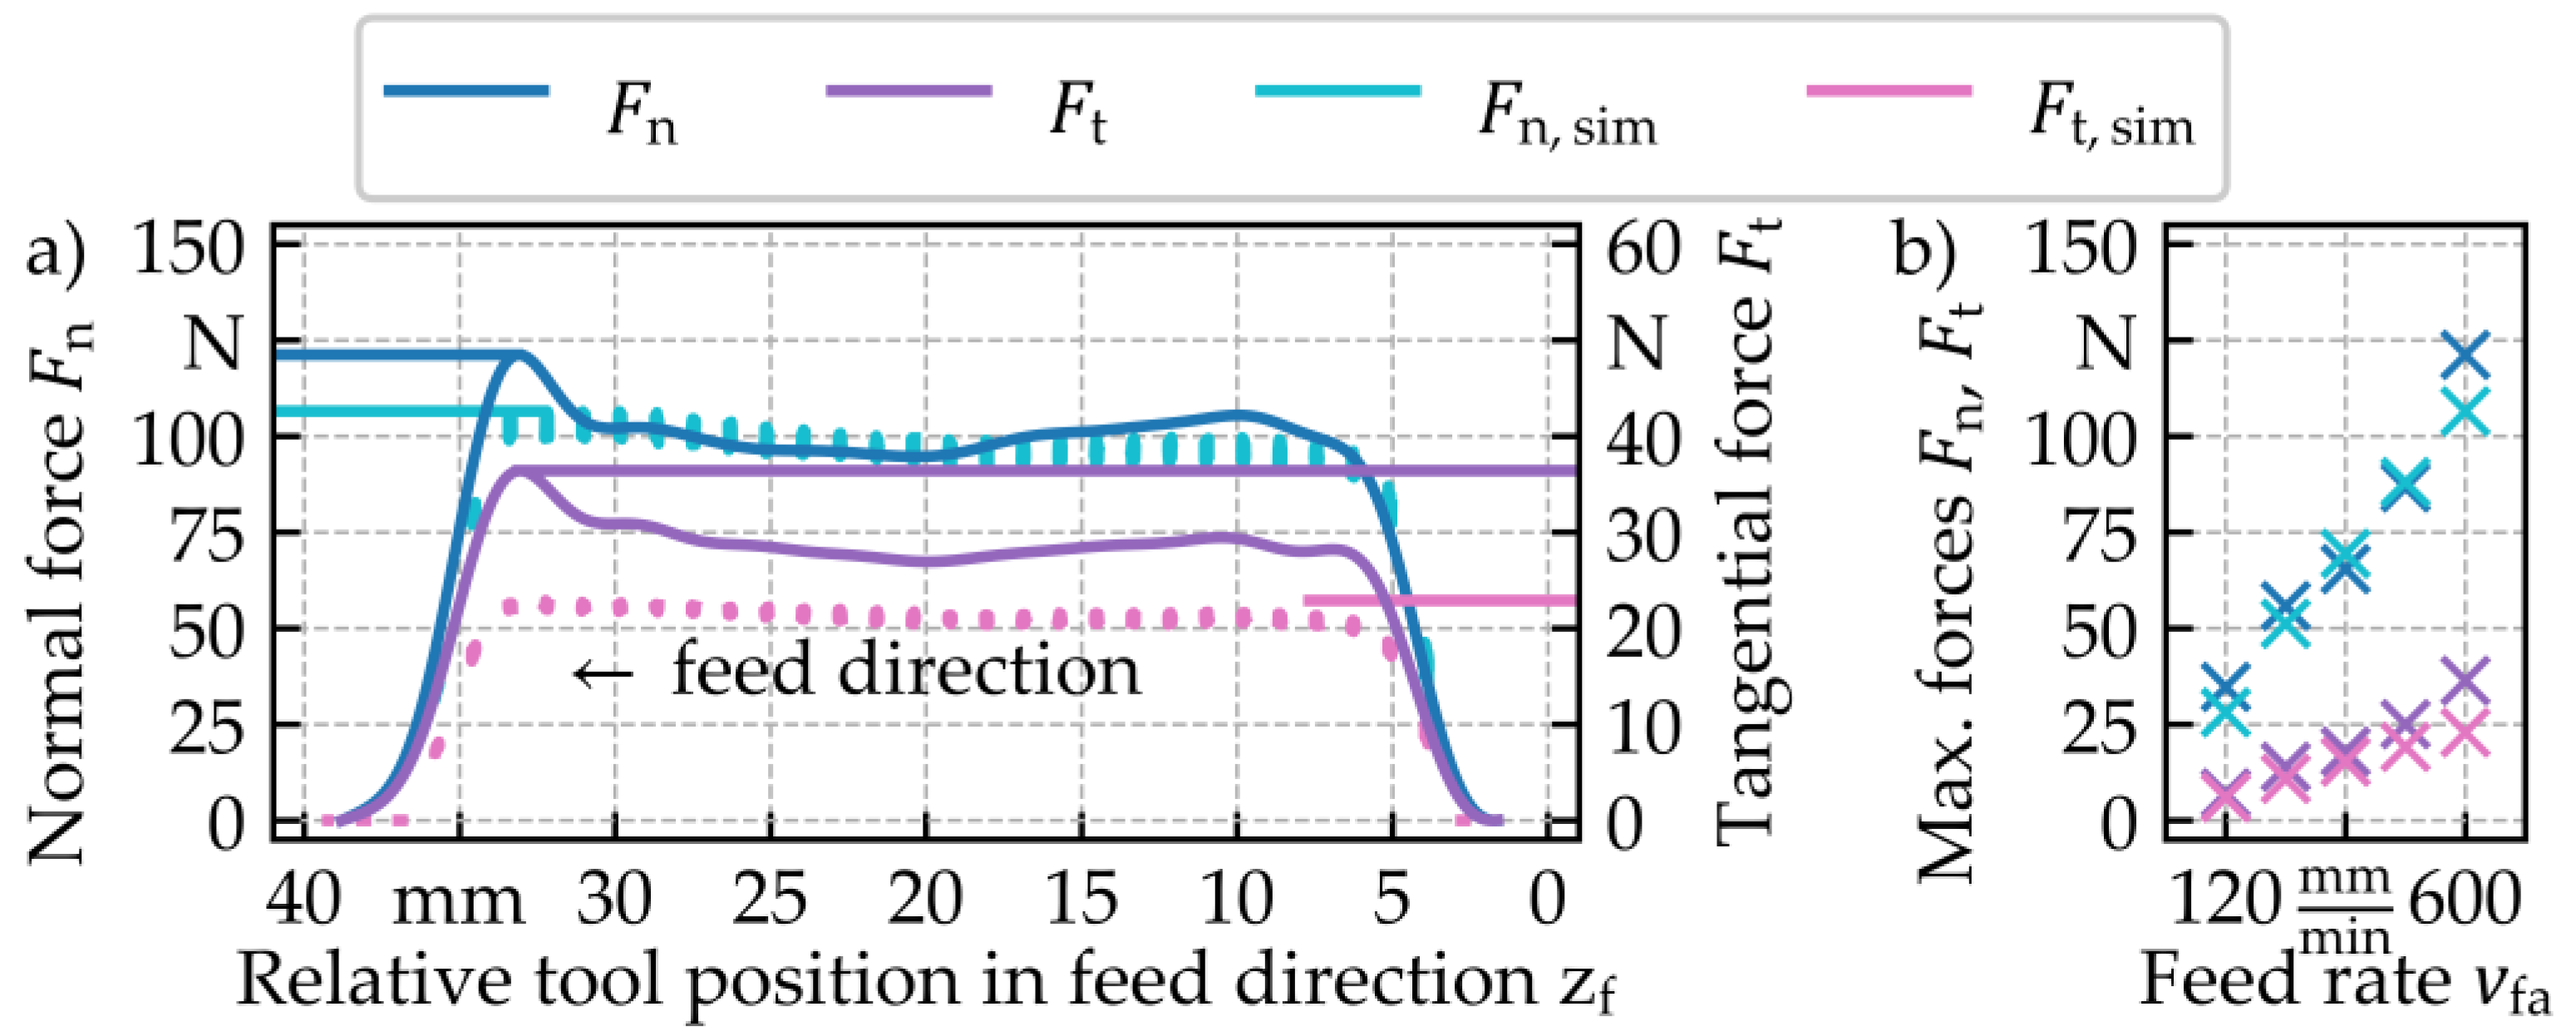
The process forces for the grinding tests in the laboratory setting, which were carried out analogously to the previous investigations, are presented in Figure 14.
Figure 14a shows the force profile for the highest selected feed rate v fa = 600 mm/min. As for the tests in the industrial setting, the characteristic progression of process force, i.e., increase, quasi-stationary phase and process force decrease, was exhibited. In contrast to the results for the industrial setting, the measured process forces in the stationary zone showed a slight decrease in force, followed by a characteristic peak just before the exit zone. Good agreement between simulation and experiment was achieved for the normal forces aside from the peaks in the entry and exit zone, although the measured tangential forces were slightly higher than the simulated ones. A possible explanation for the measured force peaks is the workpiece deformation as a result of the axial clamping, which causes the workpiece wall to bulge in the radial direction against the clamping device. This causes a reduction of the radial stock ae,tot in the middle section of the workpiece and reduces the process forces. By roughly incorporating this effect into the simulation, as described in the beginning of this section, the workpiece deformation and the resulting process forces were partly reproduced. Figure 14b shows the comparison of maximum forces for the laboratory setting. In general, a high correspondence was observed between simulated and measured process normal forces as well as tangential forces with the exception of the parameter combination at the highest feed rate. Although the difference between the measured and simulated normal forces ranges from −5.0 N to +6.6 N for feed rates up to v fa = 480 mm/min, a difference of +14.7 N was observed for v fa = 600 mm/min. The results for the tangential forces exhibit a similar pattern. For the lowest four feed rates the difference ranges from 1.1 N to 5.9 N, whereas the difference at v fa = 600 mm/min amounts to 13.5 N.
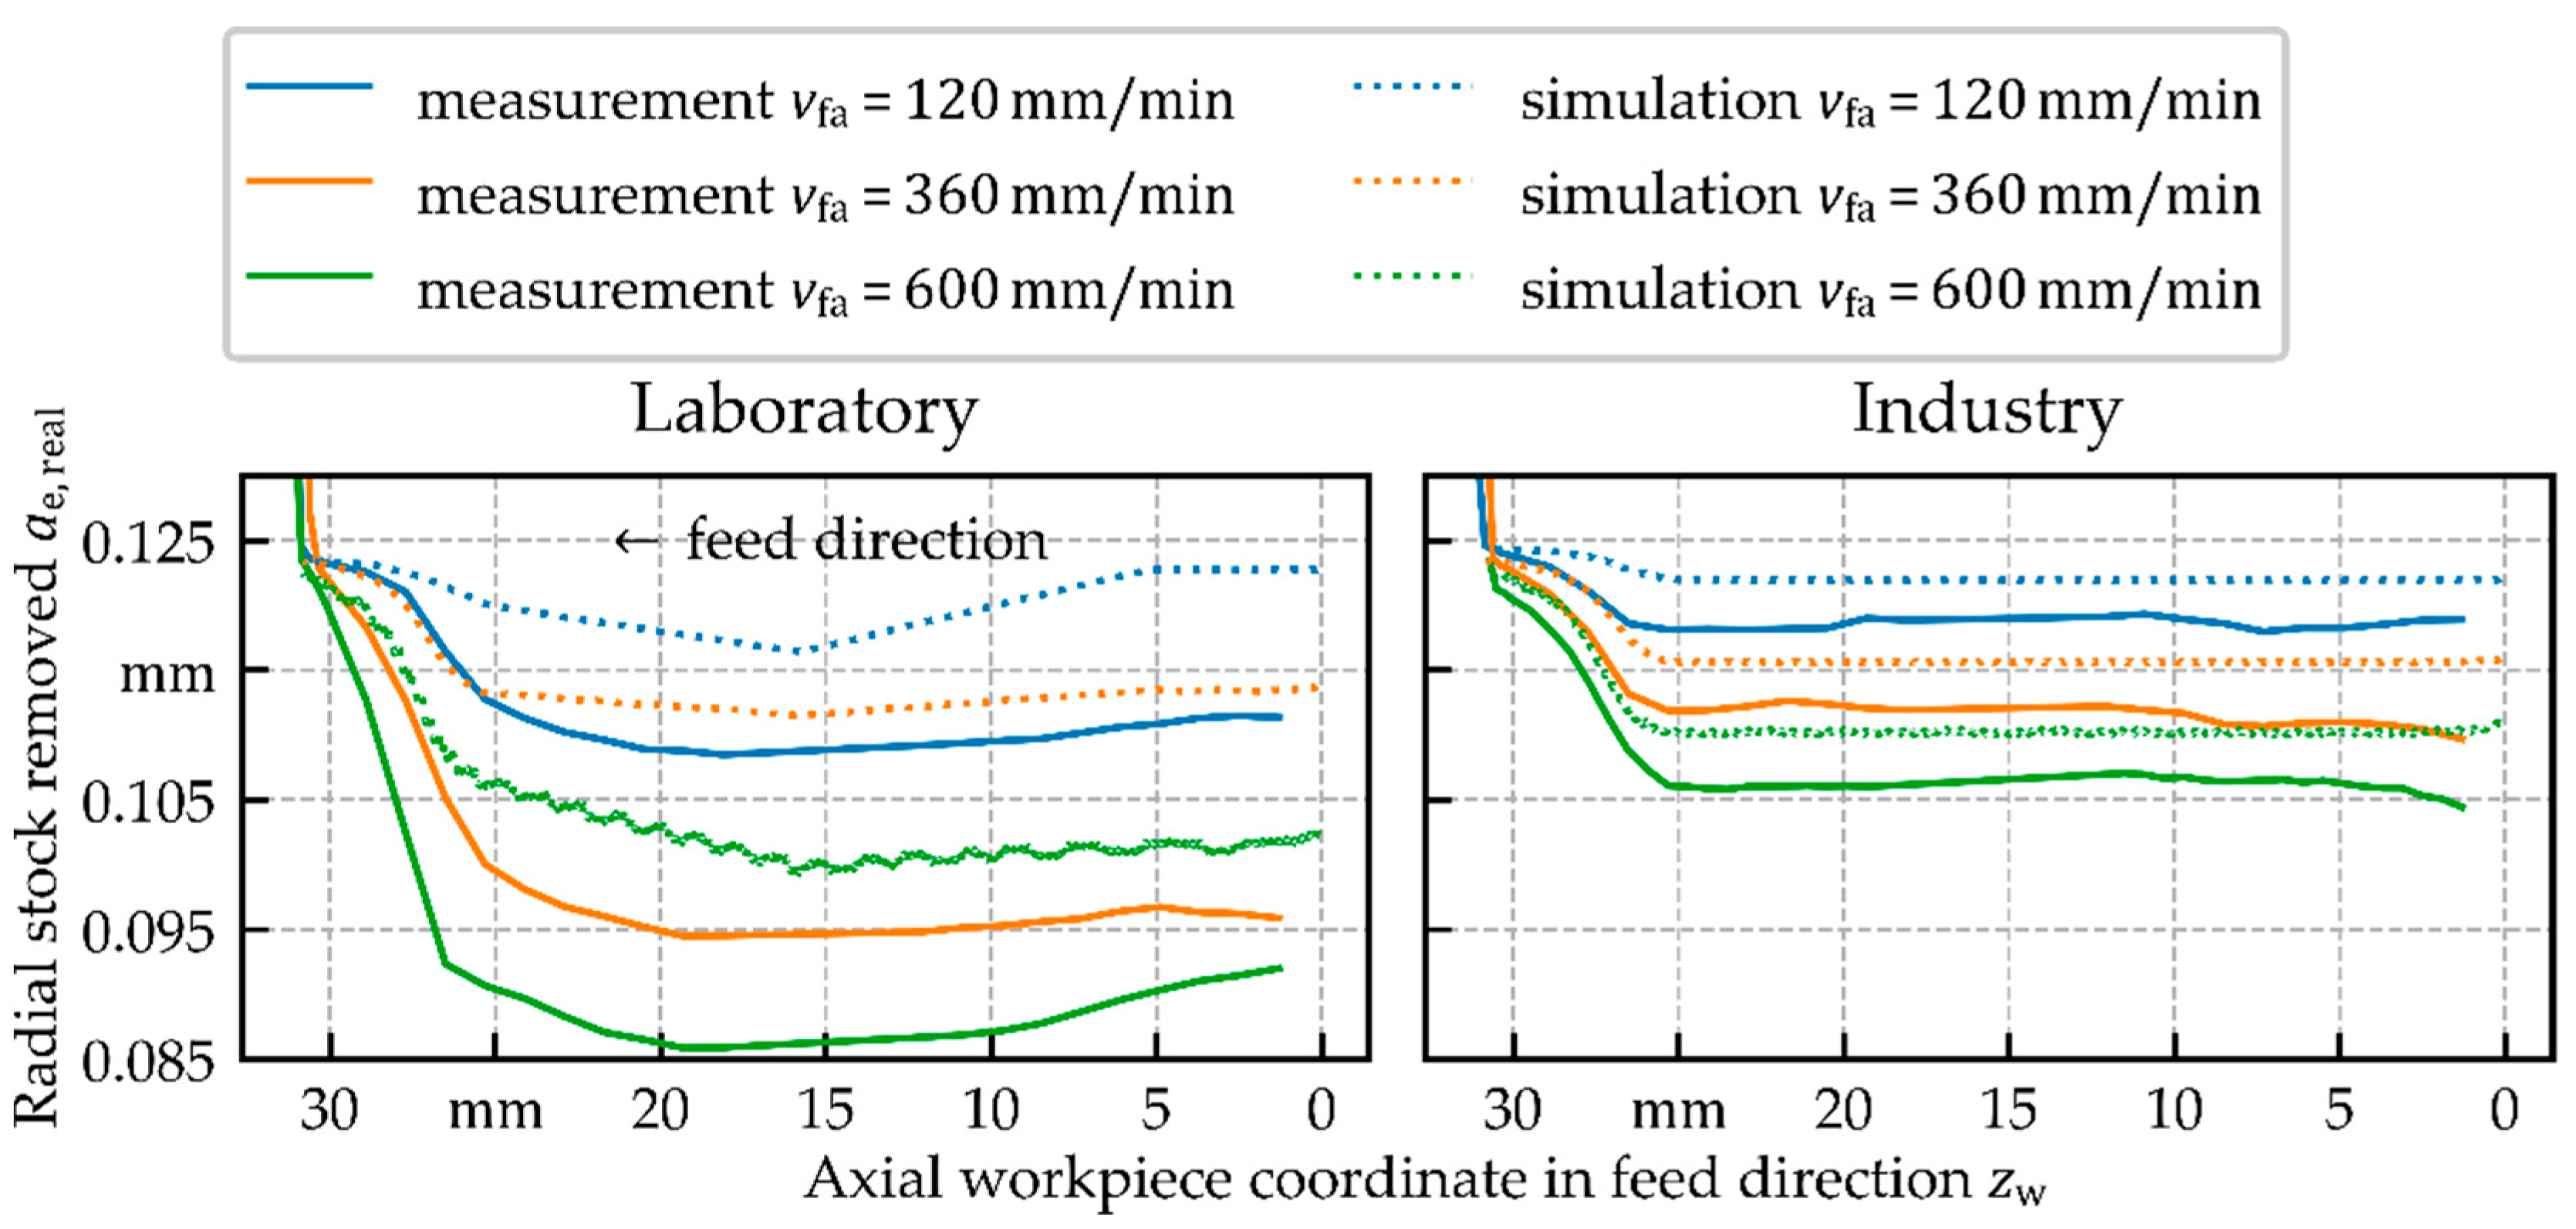
The comparison of workpiece inner contours measured after grinding experiments with the results obtained from the simulation showed a good qualitative accordance; see Figure 15. The characteristic form of the step, generated on tool exit, was especially well reproduced by the simulation. The approximate incorporation of the clamping deformations in the laboratory setting largely influenced the resulting workpiece contour, because the deformation resulting from the clamping was in the same order of magnitude as the deflections resulting from the process normal force. In addition, the linear interpolation between only three points was clearly reproduced. In contrast, the results from the industry setting did not show a clear influence of deformations caused by workpiece clamping. On the other hand, it is worth mentioning that the global minima of the measured contours from the industry setting were located at the tool entry, which is counter intuitive because the lower forces and minima were not found in this section of the simulation results. While the simulation results qualitatively matched the measurements well, a distinct quantitative difference remained. The simulation systematically underestimated the difference between the achieved a e , real and the set a e , tot .

4. Discussion

The quality of the results obtained in the GPS for process forces and shape deviations is tied to the models for the single grain forces and for the machine compliance. Although some discrepancies remained between the forces predicted by the combined FEM/GPS simulation system and the experimental measurements, the overall results were in good agreement. It should be noted that no experimental recalibration of the force model and the underlying FEM model was performed, despite the fact that the cooling lubricant supply differed between the two machine tools under examination and that the original calibration of the FEM model was performed for a different tool and workpiece. However, additional investigations into the material flow behaviour at small single grain cutting depths and large negative rake angles are advisable to further improve the force predictions, as is evident from the FEM results. It is also advisable to examine a possible integration of ploughing effects, such as a small portion of undeformed chip volume that is deformed, but not removed, into the GPS. Another possible area of improvement is the parametrisation of the force model in terms of cutting geometry. For example, a more complex description of the chip cross-section could lead to improvement. Additional investigation is necessary regarding the noticeable discrepancy between the simulated and the measured maximum normal force in the industrial setting. A possible explanation for this discrepancy is an inaccuracy of the custom measuring device [35], depending on the axial contact position between tool and workpiece. This would also explain the unreasonably high change in the system compliance depending on the contact position found for the industrial setting [35].
The reproduction of typical shape deviations in ITG processes, especially towards the entry and exit zones of the workpieces, is made possible by the incorporation of the compliance model in the GPS. While a qualitative prediction of the resulting shape errors was possible, the resulting shape deviations were consistently underestimated. A possible explanation is the determination of the compliances in static tests, indicating the need for further research into the influence of the system dynamics on the effective compliances. A definite issue in the laboratory setting is the elastic deformation of the workpiece due to axial clamping. While Holtermann et al. [16] successfully modelled these deformations for a similar clamping mechanism, the deformations were not well reproducible in the current study. This inhibits direct modelling and requires a manual correction of the set radial stock removal which leads to additional variability. Precise measurement of the workpiece deformations after clamping within the machine tool, could mitigate these issues but is hard to achieve and would require special equipment. The aforementioned potential inaccuracy of the custom force measuring device, used to calibrate the compliance model, could be another possible explanation for the difference found between the measured and the simulated workpiece contours in the industrial setting.
Despite the remaining issues discussed above, which are partly related to potential measuring difficulties and hard to control variability in the laboratory setup, a good qualitative agreement for the predicted contours was achieved, and the process forces could be predicted very well for most of the experiments. It is especially worth noting that the single grain FEM model proved very good in transferability to two setups distinctly different than the process it was calibrated to. It could be shown that the approach for the compliance measurement and modelling is easily transferable between different machines, but further investigations are needed to judge the model quality, especially with respect to dynamic effects. To further enhance the simulation system, incorporating the modelling of thermo-mechanical workpiece deformations is planned. By using a flexible point-based grain geometry model, the simulation system is prepared, and also planned, for an integration of tool wear.
Author Contributions

Conceptualization, T.T.D., N.S. and T.F.; Methodology, T.T.D., N.S. and T.F.; Software, N.S., T.F. and R.H.; Validation, T.T.D., N.S. and T.F.; Formal Analysis, T.T.D., N.S. and T.F.; Investigation, T.T.D.; Data Curation, T.T.D., N.S. and T.F.; Writing—Original Draft Preparation, T.T.D., N.S. and T.F.; Writing—Review & Editing, R.H., A.M. and D.B.; Visualization, T.T.D., N.S. and T.F.; Supervision, A.M. and D.B.; Project Administration, D.B. and A.M.; Funding Acquisition, D.B. and A.M. All authors have read and agreed to the published version of the manuscript.

Funding

Gefördert durch die Deutsche Forschungsgemeinschaft (DFG)-403857741. Funded by German Research Foundation (DFG)-403857741.

Data Availability Statement

Restrictions apply to the availability of these data. Data were obtained from Schaeffler Technologies AG & Co. KG and August Rüggeberg GmbH und Co. KG and are available from the authors with the permission of these companies.

Acknowledgments

The authors thank the German Research Foundation (DFG), which supports the research presented. In addition, the authors thank the companies Schaeffler Technologies AG & Co. KG and August Rüggeberg GmbH und Co. KG. Furthermore, the authors gratefully acknowledge the computing time provided on the Linux HPC cluster at TU Dortmund University (LiDO3), partially funded in the course of the Large-Scale Equipment Initiative by the German Research Foundation (DFG) as project 271512359.

Conflicts of Interest

The authors declare no conflict of interest.

References

  1. Hashimoto, F.; Yamaguchi, H.; Krajnik, P.; Wegener, K.; Chaudhari, R.; Hoffmeister, H.-W.; Kuster, F. Abrasive fine-finishing technology. CIRP Ann. 2016, 65, 597–620. [Google Scholar] [CrossRef]
  2. Wegener, K.; Bleicher, F.; Krajnik, P.; Hoffmeister, H.-W.; Brecher, C. Recent developments in grinding machines. CIRP Ann. 2017, 66, 779–802. [Google Scholar] [CrossRef]
  3. Klocke, F. Fertigungsverfahren: Zerspanung Mit Geometrisch Unbestimmter Schneide, 6. Auflage; Springer Vieweg: Berlin, Germany, 2018; ISBN 978-3-6625-8092-9. [Google Scholar]
  4. Marschalkowski, K. Beitrag zur Prozessentwicklung für das Hochleistungsinnenrund-Schälschleifen Mit Galvanisch Gebundenen CBN-Schleifscheiben. Ph.D. Thesis, TU Dortmund, Dortmund, Germany, 2010. [Google Scholar]
  5. Xiao, G.; Malkin, S. On-Line Optimization for Internal Plunge Grinding. CIRP Ann. 1996, 45, 287–292. [Google Scholar] [CrossRef]
  6. Schumann, S. Mehrskalige Modellierung und Simulation des Hochleistungs-Innenrundschälschleifens. Ph.D. Thesis, TU Dortmund, Dortmund, Germany, 2018. [Google Scholar]
  7. Tawakoli, T.; Rasifard, A.; Rabiey, M. High-efficiency internal cylindrical grinding with a new kinematic. Int. J. Mach. Tools Manuf. 2007, 47, 729–733. [Google Scholar] [CrossRef]
  8. Gao, S.; Yang, C.; Xu, J.; Fu, Y.; Su, H.; Ding, W. Optimization for internal traverse grinding of valves based on wheel deflection. Int. J. Adv. Manuf. Technol. 2017, 92, 1105–1112. [Google Scholar] [CrossRef]
  9. Biermann, D.; Holtermann, R.; Menzel, A.; Schumann, S. Modelling and simulation of thermal effects in internal traverse grinding of hardened bearing steel. CIRP Ann. 2016, 65, 321–324. [Google Scholar] [CrossRef]
  10. Nadolny, K. Small-dimensional sandwich grinding wheels with a centrifugal coolant provision system for traverse internal cylindrical grinding of steel 100Cr6. J. Clean. Prod. 2015, 93, 354–363. [Google Scholar] [CrossRef]
  11. Marschalkowski, K.; Biermann, D.; Weinert, K. On the characteristics of high-performance internal peel grinding using electroplated cbn wheels. Mach. Sci. Technol. 2012, 16, 580–600. [Google Scholar] [CrossRef]
  12. Denkena, B.; Krödel, A.; Wilckens, M. High performance peel grinding of steel shafts using coarse electroplated CBN grinding wheels. Prod. Eng. 2021, 1–8. [Google Scholar] [CrossRef]
  13. Rausch, S.; Biermann, D. High-performance Surface Peel Grinding on Conventional Surface Grinding Machines. Procedia CIRP 2012, 1, 669–670. [Google Scholar] [CrossRef]
  14. Hegener, G. Technologische Grundlagen des Hochleistungs-Außenrund-Formschleifens. Ph.D. Thesis, RWTH Aachen, Aachen, Germany, 1999. [Google Scholar]
  15. Holtermann, R. Computational Multiscale Modelling of Grinding Processes. Ph.D. Thesis, TU Dortmund, Dortmund, Germany, 2016. [Google Scholar]
  16. Holtermann, R.; Schumann, S.; Menzel, A.; Biermann, D. Modelling and Simulation of Internal Traverse Grinding—From Micro-thermo-mechanical Mechanisms to Process Models. In Lecture Notes in Production Engineering; Springer: Cham, Germany, 2017; pp. 369–403. [Google Scholar]
  17. Holtermann, R.; Menzel, A.; Schumann, S.; Biermann, D.; Siebrecht, T.; Kersting, P. Modelling and simulation of Internal Traverse Grinding: Bridging meso- and macro-scale simulations. Prod. Eng. 2015, 9, 451–463. [Google Scholar] [CrossRef]
  18. Holtermann, R.; Schumann, S.; Zabel, A.; Biermann, D.; Menzel, A. Numerical Determination of Process Values Influencing the Surface Integrity in Grinding. Procedia CIRP 2016, 45, 39–42. [Google Scholar] [CrossRef] [Green Version]
  19. Schumann, S.; Siebrecht, T.; Kersting, P.; Biermann, D.; Holtermann, R.; Menzel, A. Determination of the Thermal Load Distribution in Internal Traverse Grinding using a Geometric-Kinematic Simulation. Procedia CIRP 2015, 31, 322–327. [Google Scholar] [CrossRef] [Green Version]
  20. Avevor, Y.; Vincent, J.; Faure, L.; Moufki, A.; Philippon, S. An ALE approach for the chip formation process in high speed machining with transient cutting conditions: Modeling and experimental validation. Int. J. Mech. Sci. 2017, 130, 546–557. [Google Scholar] [CrossRef]
  21. Ducobu, F.; Rivière-Lorphèvre, E.; Filippi, E. Application of the Coupled Eulerian-Lagrangian (CEL) method to the modeling of orthogonal cutting. Eur. J. Mech.-A/Solids 2016, 59, 58–66. [Google Scholar] [CrossRef]
  22. Peng, B.; Bergs, T.; Klocke, F.; Döbbeler, B. An advanced FE-modeling approach to improve the prediction in machining difficult-to-cut material. Int. J. Adv. Manuf. Technol. 2019, 103, 2183–2196. [Google Scholar] [CrossRef]
  23. Bergs, T.; Hardt, M.; Schraknepper, D. Determination of Johnson-Cook material model parameters for AISI 1045 from orthogonal cutting tests using the Downhill-Simplex algorithm. Procedia Manuf. 2020, 48, 541–552. [Google Scholar] [CrossRef]
  24. Vovk, A.; Sölter, J.; Karpuschewski, B. Finite element simulations of the material loads and residual stresses in milling utilizing the CEL method. Procedia CIRP 2020, 87, 539–544. [Google Scholar] [CrossRef]
  25. Sridhar, P.; Prieto, J.M.R.; de Payrebrune, K.M. Discretization approaches to model orthogonal cutting with Lagrangian, Arbitrary Lagrangian Eulerian, Particle Finite Element method and Smooth Particle Hydrodynamics formulations. Procedia CIRP 2020, 93, 1496–1501. [Google Scholar] [CrossRef]
  26. Zheng, Y.; Liu, Y.; Liu, Y.; Shih, A.J. Multigrain Smoothed Particle Hydrodynamics and Hertzian Contact Modeling of the Grinding Force in Atherectomy. J. Manuf. Sci. Eng. 2019, 141, 1–28. [Google Scholar] [CrossRef]
  27. Johnson, G.R.; Cook, W.H. A Constitutive Model and Data for Metals Subjected to Large Strains, High Strain Rates, and High Temperatures. In Proceedings of the 7th International Symposium on Ballistics, The Hague, The Netherlands, 19–21 April 1983; pp. 541–547. [Google Scholar]
  28. Liu, G.; Shah, S.; Özel, T. Material Ductile Failure-Based Finite Element Simulations of Chip Serration in Orthogonal Cutting of Titanium Alloy Ti-6Al-4V. J. Manuf. Sci. Eng. 2019, 141, 1–24. [Google Scholar] [CrossRef]
  29. Storchak, M.; Rupp, P.; Möhring, H.-C.; Stehle, T. Rupp Determination of Johnson–Cook Constitutive Parameters for Cutting Simulations. Metals 2019, 9, 473. [Google Scholar] [CrossRef] [Green Version]
  30. Cheng, C.; Mahnken, R. A multi-mechanism model for cutting simulation: A Ginzburg-Landau type phase gradient and numerical implementations. Int. J. Solids Struct. 2019, 160, 1–17. [Google Scholar] [CrossRef]
  31. Aslan, D.; Budak, E. Semi-analytical Force Model for Grinding Operations. Procedia CIRP 2014, 14, 7–12. [Google Scholar] [CrossRef] [Green Version]
  32. Setti, D.; Kirsch, B.; Aurich, J. An Analytical Method for Prediction of Material Deformation Behavior in Grinding Using Single Grit Analogy. Procedia CIRP 2017, 58, 263–268. [Google Scholar] [CrossRef]
  33. Jamshidi, H.; Budak, E. An analytical grinding force model based on individual grit interaction. J. Mater. Process. Technol. 2020, 283, 116700. [Google Scholar] [CrossRef]
  34. Wöste, F.; Siebrecht, T.; Fast, M.; Wiederkehr, P. Geometric Physically-Based and Numerical Simulation of NC-Grinding Processes for the Calculation of Process Forces. Procedia CIRP 2019, 86, 133–138. [Google Scholar] [CrossRef]
  35. Schmidt, N.; Tsagkir Dereli, T.; Furlan, T.; Holtermann, R.; Biermann, D.; Menzel, A. Towards the Prediction of Compliance Influences on Shape Deviations in Internal Traverse Grinding. In Production at the Leading Edge of Technology; Behrens, B.-A., Brosius, A., Hintze, W., Ihlenfeldt, S., Wulfsberg, J.P., Eds.; Springer: Berlin/Heidelberg, Germany, 2021; pp. 304–314. ISBN 978-3-662-62137-0. [Google Scholar]
  36. Altintas, Y.; Kersting, P.; Biermann, D.; Budak, E.; Denkena, B.; Lazoglu, I. Virtual process systems for part machining operations. CIRP Ann. 2014, 63, 585–605. [Google Scholar] [CrossRef]
  37. Brinksmeier, E.; Aurich, J.C.; Govekar, E.; Heinzel, C.; Hoffmeister, H.-W.; Klocke, F.; Peters, J.; Rentsch, R.; Stephenson, D.; Uhlmann, E.; et al. Advances in Modeling and Simulation of Grinding Processes. CIRP Ann. 2006, 55, 667–696. [Google Scholar] [CrossRef]
  38. Rausch, S. Modellgestützte Endbearbeitung hartstoffbeschichteter Tiefziehwerkzeuge. Ph.D. Thesis, TU Dortmund, Dortmund, Germany, 2016. [Google Scholar]
  39. Aurich, J.C.; Biermann, D.; Blum, H.; Brecher, C.; Carstensen, C.; Denkena, B.; Klocke, F.; Kröger, M.; Steinmann, P.; Weinert, K. Modelling and simulation of process: Machine interaction in grinding. Prod. Eng. 2008, 3, 111–120. [Google Scholar] [CrossRef]
  40. Deichmueller, M.; Denkena, B.; de Payrebrune, K.; Kröger, M.; Wiedemann, S.; Schröder, A.; Carstensen, C. Determination of Static and Dynamic Deflections in Tool Grinding using a Dexel-Based Material Removal Simulation. In Proceedings of the 2nd CIRP International Conference on Process Machine Interactions, Vancouver, BC, Canada, 10–11 June 2010. [Google Scholar]
  41. Aurich, J.; Kirsch, B. Kinematic simulation of high-performance grinding for analysis of chip parameters of single grains. CIRP J. Manuf. Sci. Technol. 2012, 5, 164–174. [Google Scholar] [CrossRef]
  42. Rausch, S.; Odendahl, S.; Kersting, P.; Biermann, D.; Zabel, A. Simulation-Based Prediction of Process Forces for Grinding Free-Formed Surfaces on Machining Centers. Procedia CIRP 2012, 4, 161–165. [Google Scholar] [CrossRef] [Green Version]
  43. Siebrecht, T.; Potthoff, N.; Wiederkehr, P.; Biermann, D. Modeling of process deflections in a point-based grinding simulation system. Procedia Manuf. 2018, 18, 104–111. [Google Scholar] [CrossRef]
  44. Siebrecht, T. Simulation von NC-Formschleifprozessen zur Vorhersage von Oberflächentopographien unter Berücksichtigung des Werkzeugverschleißes. Ph.D. Thesis, TU Dortmund, Dortmund, Germany, 2019. [Google Scholar]
  45. Geuzaine, C.; Remacle, J.-F. Gmsh: A 3-D finite element mesh generator with built-in pre- and post-processing facilities. Int. J. Numer. Methods Eng. 2009, 79, 1309–1331. [Google Scholar] [CrossRef]
  46. Yuksel, C. Sample Elimination for Generating Poisson Disk Sample Sets. Comput. Graph. Forum 2015, 34, 25–32. [Google Scholar] [CrossRef] [Green Version]
  47. Hortig, C.; Svendsen, B. Simulation of chip formation during high-speed cutting. J. Mater. Process. Technol. 2007, 186, 66–76. [Google Scholar] [CrossRef]
  48. Ramesh, A.; Melkote, S.N. Modeling of white layer formation under thermally dominant conditions in orthogonal machining of hardened AISI 52100 steel. Int. J. Mach. Tools Manuf. 2008, 48, 402–414. [Google Scholar] [CrossRef]
Figure 1. (a) Process kinematics of internal traverse grinding and clamping of workpiece; (b) macro-scale engagement section and relevant descriptive variables. The roughing zone angle χ is depicted exaggeratedly and measures χ = 3° for the tool used in this study.
Jmmp 05 00060 g001
Figure 2. (a) Experimental setup to measure the spindle compliance in a laboratory environment with piezoelectric force measurement and eddy current sensors to measure the deflection of spindle systems. (b) Reduction of total radial stock removal a e , tot by Δ a e [35].
Jmmp 05 00060 g002
Figure 3. Experimental setup for internal traverse grinding tests. The telemetry ring has not been used for the experiments presented in this work.
Jmmp 05 00060 g003
Figure 4. (a) Preparation of a grinding wheel topography replica with silicon rubber compound, (b) Manual preparation of masks for grain segmentation, (c) Grain mesh based on the digitalised grinding wheel containing distorted triangles, (d) Remeshing of the grain using the software gmsh yields nearly uniform triangles, (e) Topography of the grinding wheel model (f) Geometric physically-based grinding simulation for ITG.
Jmmp 05 00060 g004
Figure 5. Schematic representation of the boundary value problem for the single grain simulations. The coarse initial mesh is adaptively refined during the simulation. Graphic taken from [15] with permission.
Jmmp 05 00060 g005
Figure 6. Evaluation of the effective machine compliances. (a) Exemplary measurement and compliance determination at relative tool position z f = 10   mm . (b) Overview of all resulting compliances c and comparison of the compliance models (1) and (2).
Jmmp 05 00060 g006
Figure 7. Exemplary specific (a) normal and (b) tangential force curves, for multiple combinations of rake angle γ s and undeformed chip thickness h cu s , obtained from single grain FE simulations. The displacements are normalised by h cu s . Dashed lines indicate average values for each curve.
Jmmp 05 00060 g007
Figure 8. Chip formation for different rake angles γ s : (a) γ s = 40 ° , (b) γ s = 60 ° and (c) γ s = 80 ° . Colour plot indicates the accumulated plastic strain.
Jmmp 05 00060 g008
Figure 9. Specific single grain cutting forces obtained from the parameter study, and approximation by the proposed force models. (a) Normal forces, (b) Tangential forces.
Jmmp 05 00060 g009
Figure 10. Visualisation of the tool and workpiece models. (a) Only every 200th point in every dimension of the grid is visible, (b) Every height value is rendered.
Jmmp 05 00060 g010
Figure 11. Visualisation of the grain heightfields created in every step. While the grain heightfields are rendered in full detail, only every 25th point of the workpiece heightfield is shown. (a) The concentration of engaged grains, typical for ITG, is exhibited in the roughing zone. (b) The detailed view shows that for some grains, which are not in proximity of the workpiece, no heightfield is created.
Jmmp 05 00060 g011
Figure 12. Calculation of the approximated rake angle γ ˜ s for a single grain. (a) Averaging of normal vectors in cutting direction for a higher value of the undeformed chip thickness h cu s . (b) Averaging of normal vectors for a smaller value of h cu s . (c) Schematic projection of the average normal vector n r into the working plane and calculation of the approximated rake angle γ ˜ s .
Jmmp 05 00060 g012
Figure 13. (a) Comparison of metrologically recorded and simulated ITG process forces in the industrial setting at v fa = 600 mm/min. (b) Maxima of tangential and normal forces depending on feed rate. Process conditions are given in Table 1.
Jmmp 05 00060 g013
Figure 14. (a) Comparison of metrologically recorded and simulated ITG process forces in the laboratory setting at v fa = 600 mm/min. (b) Maxima of tangential and normal forces depending on feed rate. Process conditions are given in Table 1.
Jmmp 05 00060 g014
Figure 15. Comparison of measured and simulated workpiece contours after internal traverse grinding for lab and industrial environment.
Jmmp 05 00060 g015
Table 1. Experimental conditions for grinding investigations.
Industrial SetupLaboratory Setup
Tool spindle:HV-P 120-45.000/18HV-P 120-40.000/18
Grinding tool:Electroplated cBN, B181, D = 39 mm, χ = 3°
Workpiece:100Cr6/AISI 52100, 63 ± 1 HRC
Cylindrical: D = 53 mm, d   = 47 mm, w = 31.4 mm
Cooling medium:Grinding oil, v = 5 mm2/s
Grinding tool velocity: v t = 80 m/s v t = 75 m/s
Workpiece velocity: v w = 1.33 m/s v w = 1.25 m/s
Axial feed rate: v fa = 120, 240, 360, 480, 600 mm/min
Total radial stock removal: a e , tot = 0.125 mm
Table 2. Compliance test results for different relative tool positions z f .
z f = 30   mm z f = 20   mm z f = 10   mm Unit
Number of tests242321
Mean0.1670570.1707870.175642μm/N
Standard deviation0.0078690.0066500.009469μm/N
Table 3. Resulting compliance model coefficients and standard deviations.
Model   ( 1 ) :   c c ¯ Model   ( 2 ) :   c c ˜ = a 0 + a 1 z f
Parameter c ¯ a 0 a 1
Value0.170970 ± 0.0085890.179718 ± 0.002618−0.000428 ± 0.000119
Unitμm/Nμm/Nμm/(N mm)
Table 4. Optimal force model coefficients based on results of the parameter study.
ModelParameterValueUnit
F ˜ n , s exp ( γ s ) b 0 0.00469046 Ns / mm 3
b 1 −0.09693784-
b 2 −30.20401038°
b 3 0.02764513 Ns / mm 3
F ˜ t , s exp ( γ s ) c 0 0.00134135 Ns / mm 3
c 1 −0.05878825-
c 2 −1.01463276°
c 3 0.02643151 Ns / mm 3
F ˜ t , s tanh ( γ s ) d 0 0.06397807 Ns / mm 3
d 1 −0.14420348-
d 2 −70.29128112°
d 3 0.11025913 Ns / mm 3
Publisher’s Note: MDPI stays neutral with regard to jurisdictional claims in published maps and institutional affiliations.