Abstract
Tools are of strategic importance for industrial manufacturing processes. Their behaviour has a great influence on the productivity of the process and the quality of the product. A material saving and efficient technique for processing metallic workpieces is cold forging. One major challenge of this production method is the handling of high contact normal stresses in the tool contact, which can lead to severe tool wear. To investigate promising approaches for understanding wear modelling and wear reduction a demonstrator process based on the first stage of a total five-staged cold forging process for the manufacturing of a bolt anchor is considered in the scope of this research. This work aims at the further development of a numerical wear calculation based on an adapted Archard model in order to be able to realistically predict the tool wear in cold forging processes. Therefore, the material characterization of the used workpiece material as well as an investigation of the worn tool dies takes place to validate a numerical wear calculation model. Furthermore, this research addresses a reduction in wear by identifying critical areas and changing the inlet geometry of the investigated demonstrator tool die. This way, conclusions can be drawn about the wear sensitivity during numerical process design, and particularly critical areas can be geometrically modified in terms of the design.
1. Introduction and Motivation
Cold forming is an economical process for manufacturing workpieces with good surface qualities, manufacturing accuracies and material properties in large quantities [1,2]. Compared to other manufacturing processes, cold forming requires less material, fewer manufacturing steps and thus less energy for the production of a finished part [2]. However, the tools used in cold forming are subjected to high mechanical and tribological loads [3]. Cold forging metal creates a high yield stress, which does not decrease significantly even with the increasing temperatures occurring due to the applied forming energy [4]. The stresses in the tool during the process are several times higher than the yield stress of the workpiece material. Thus, the tool materials must have high strengths in order to not suffer plastic deformation under these operating conditions [5]. The plastic deformation of the tools would reduce the dimensional accuracy of the produced workpieces [6] and could lead to total tool failure [7]. The tool life required for an economic production can only be achieved if tool wear is reduced accordingly. The components to be produced should not have any critical corners, in order to avoid premature wear of the forming tools [7]. The tool contour in the area of convex radii is particularly sensitive to wear because large quantities of material slide over the tool surface at high relative speeds under high surface pressures [8]. The design of these areas is therefore of considerable importance. On the one hand, FE-based process designs can be used to locally calculate the heat transfer from the component to the environment and to the tools during the forming process [6], as well as the expected tool wear under the applied tool stresses [7].
The FE calculation method is very well-suited for calculating forming processes and for performing a comprehensive tool-stress analysis [9]. Thus, in addition to determining the required workpiece mass, the entire process chain can be mapped virtually and, for example, the expected tool wear can be calculated. This is a major advantage compared to a purely experimental investigation approach, since no time-consuming and material-intensive tests are necessary. Different models are available for the calculation of abrasive wear and plastic deformation. Abrasive wear models can be classified into mechanical and phenomenological models. Mechanical models are based on material failure mechanisms, whereas phenomenological models use calculated process variables based on the laws of contact mechanics [10]. Approaches to mechanical wear models using material failure mechanisms to calculate material removal were presented by Kapoor [11]. Due to the high number of influencing factors in tool life determination, a characterisation of materials under mechanical wear and failure models is quite complex and thus it is difficult to conceive an accurate representation [12]. Therefore, a variety of phenomenological models for the calculation of tool wear have been proposed and discussed. Holm defined the wear mechanism of two contact bodies as the evacuation of atoms on the material surface and formulated the relationship between material removal, mechanical load, sliding distance and hardness [13]. Based on this, Archard described wear as a failure of the microroughness peaks of bodies in contact and moving relative to each other [14]. Therefore, this approach is often assigned to Archard and will be referred to as the Archard model in the following. The Archard approach is of great importance for the numerical calculation of tool wear and is commonly used for this purpose in the original version or in further developed versions [15].
The Archard wear model is generally applicable for processes in which friction modelling can be described based on the Coulomb friction approach (low contact normal stresses) [16]. Wear prediction is less realistic in processes with high contact normal stresses like cold extrusion, in which the friction shear stresses calculated with the Coulomb model are significantly overestimated. This is due to the proportionality between wear and contact normal stress , which, according to Coulomb’s friction approach, is in turn proportional to the frictional shear stress . Furthermore, is the surface hardness and is the relative velocity in the following equations.
Due to the very high tool load in cold forming, the wear model according to Archard (cf. Equation (1), [17]) was modified in such a way that not the contact normal stress but the frictional shear stress is included in the calculation of the wear for a time step , as in Equation (2). The wear factor is necessary to calibrate the model on the basis of process-specific parameters, such as the material properties.
By using the combined friction model, the frictional shear stress and thus the tool wear is not overestimated at high contact normal stresses. In [18] the first results for the extended friction model according to Archard, based on the frictional shear stress, were shown. Thereby, an improved wear calculation could be achieved with the friction model.
Cold forging is presented in this study using the example of a bolt anchor production of the company Fischer. In order to meet high performance requirements for economical anchoring solutions in cracked and noncracked concrete, as well as under seismic loads, the forming production of bolt anchors is carried out from a cylindrical semifinished product. The entire production of a tapered bolt, which is considered as a template for a demonstrator component, follows the five-stage process sequence shown in Figure 1 [19]. In the first stage, the manufactured semifinished product is tapered at one end of the cylinder with the aid of a cold extrusion. Similarly to the first stage, further tapering of the workpiece takes place in the second stage. In the third stage, material is accumulated by upsetting the balance between the tapered and untapered workpiece areas, creating the first end stop for the expansion clip. In stage four, further upsetting of the tapered area at the end of the workpiece takes place, which as a result causes the second stop to be formed. In the final process stage, a label is applied to the bolt surface by embossing.
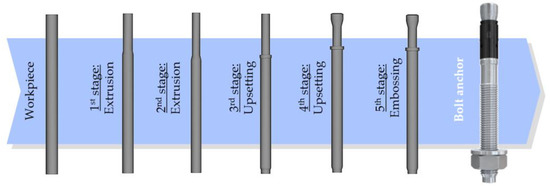
Figure 1.
Process-chain of the bolt anchor [19].
Practical experience has shown that, in the first and second stage, the extrusion process results in increased abrasive wear in the die due to the very high contact normal stresses. The die is made of a carbide steel HM CTM30 and is coated with CVD (Chemical Vapour Deposition) Titanium Nitride (TiN). However, this coating steadily degrades through wear during the manufacturing process and breakouts occur at the corners of the die. By means of wear investigation through numerical calculations, particularly highly stressed die areas can be identified. Current wear models do not provide a good match with practical experience, thus further research in the field of wear calculation is required.
Based on this, the next objectives are defined, which will be addressed within the scope of this publication. In order to be able to realistically predict the tool wear of the first forming stage, the numerical wear calculation from [18] is to be developed further and implemented within the scope of this project. Instead of the contact normal stress, wear modelling is to be carried out by means of the friction law according to Shaw and thus based on frictional shear stress. The intention behind this is to enable more realistic wear modelling than is possible with current modelling. In this research, this modelling will be used to make design modifications for an industrial demonstrator tool die, in order to be able to carry out a reduction in tool wear. This is intended to exceed the current state of the art of wear optimizing design possibilities.
The results from the industrial process will serve to validate the wear model. By means of the wear model modified for cold forming, it is possible to investigate the effectiveness of the design changes. Thus, conclusions can be reached about wear sensitivity during numerical process design, and in particular the design of critical areas can be modified.
2. Development of the Modified Wear Model According to Archard
Within the framework of this study, friction modelling was carried out based on the combined friction model, which is a combination of the friction coefficient model and the friction factor model. The friction coefficient model, Figure 2a is based on the Coulomb-Amontons approach and describes a linear relationship between the frictional shear stress and the contact normal stress with a constant friction coefficient μ (friction coefficient), cf. Equation (3) [20].
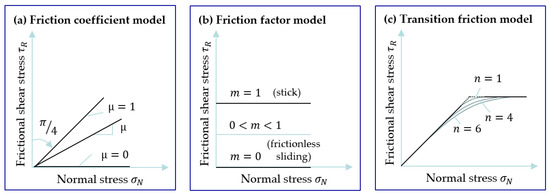
Figure 2.
Overview of typical friction models used for the calculation of different process applications.
The main disadvantage of this model is that the frictional shear stress is overestimated as soon as the material shear strength k is exceeded. Therefore, the friction factor model is used for processes with high contact pressures. This describes the frictional shear stress as a product of the shear yield stress k of the formed material with a constant friction factor m (Equation (4)), where describes the friction-free state and the state of sticking, cf. Figure 2b. [21]
The friction factor model is usually used for high contact normal stresses, because at low contact normal pressures this model may inaccurately represent the frictional resistance. For this reason, the definition of the combined friction model proposes a combination of the friction coefficient model and friction factor model, as shown in Figure 2c. A disadvantage of this model is, however, the existing discontinuity point in the transition between the friction coefficient and the friction factor model.
Shaw proposed a transition model to avoid the discontinuity in the combined friction model. Figure 2c shows the course of this model [22]. The model is based on the relationship of frictional shear stress , the shear yield stress , the normal stress and the constant friction coefficient shown in Equation (5). Here, is a natural number describing the transition from the friction coefficient model to the friction factor model. This improves the friction description in the transition from friction coefficient to friction factor model [22].
In this publication the numerical wear model (cf. Equation (6)) is to be further developed for cold forming. By calculating tool wear based on the frictional shear stress according to Shaw’s law, (cf. Figure 2c), the transition area can also be represented in more detail in addition to the areas of low and high contact normal stresses.
In addition, the influence of the forming temperature occurring during the process on the hardness of the tools is taken into account in the wear calculation. Due to the high pressure in the tool-workpiece contact, in combination with high tribological stresses, the tool surface temperature of the tools increases. Thus, the temperature of the tools has an influence on the forming properties, component quality and tool hardness , influencing the wear behaviour. The further development of the wear model can be illustrated as follows:
This wear model is subsequently implemented in the FE-software simufact. forming 16.0 via a user subroutine. Through this subroutine, tool wear can be numerically calculated using the further developed model, taking into consideration the influencing factors in the software.
3. Material Characterisation and Experimental Wear Analysis
3.1. Characterisiation of Deformation Behaviour
For simulating the forming process, the flow curve is one of the most important input data. For the numerical simulations of cold extrusion, the required strain-rate and temperature-dependent flow curves of the material 1.4062 (UNS S32202) were determined experimentally. For this purpose, cylinder compression tests with a specimen geometry of Ø10 mm × 15 mm are used. The compression tests to characterise the workpiece material were carried out on the Gleeble 3800-GTC testing machine from Dynamic Systems Inc. The flow curves used to model the thermomechanical material behaviour of the steel alloy were determined at relevant temperatures between room temperature (RT), 150 °C and 250 °C with constant strain rates of 0.1, 1, and 10 s−1. Using previous forming simulations of the extrusion process with material data from the database, it was possible to determine the maximum component temperature (<200 °C) due to the dissipated forming energy during forming.
The resulting data from the testing machine were used to calculate the coefficients for the analytical flow curve approach called Hensel-Spittel-10 (see Table 1). For the determination of the material-specific coefficients , , , , , , , and , the algorithm of generalised, nonlinear optimisation with reduced gradient (GRG) was used [23]. Figure 3a shows the calculated temperature and strain rate dependent flow curves between RT and 250 °C. The temperature and strain rate dependent flow curves were validated by numerical simulation of the cylinder compression tests. The force–time curves and the geometry of the workpieces after the cylinder compression test served as validation criteria. As an example, Figure 3b shows a comparison of the experimental and numerical force–time curves for the cylinder compression test at T = 150 °C and a strain rate of 10 s−1 [24]. The force–time curves are in good agreement.

Table 1.
Material-specific coefficients for X2CrNiN22-2 (UNS S32202).
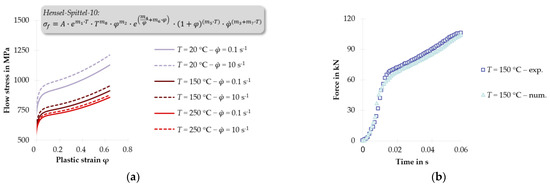
Figure 3.
(a) Calculated temperature and strain-rate dependent flow curves between RT and 250 °C; (b) comparison of the experimental and numerical force–time curves for the cylinder compression test at T = 150 °C and a strain rate of = 10 s−1.
Further mechanical and thermal parameters to be specified are the Young’s modulus , the Poisson’s ratio , the coefficient of thermal expansion , the thermal conductivity and the heat capacity in relation to the volume. The characteristic values for the stainless steel X2CrNiN22-2 shown in Table 2 are the basis for the following simulations.

Table 2.
Material data for X2CrNiN22-2 (UNS S32202) [25].
3.2. Characterisiation of the CVD-TiN Coating
In addition to the flow curves, the friction also has a major influence on the calculated results [26,27]. For this reason, the friction values of the die are also determined for the following simulations. The die is made of a carbide HM CTM30 and is coated with CVD-TiN. The microtribological properties of this coating were investigated using a TriboIndenter TI 950 of Hysitron. In order to determine friction and mechanical surface properties, nanoscratch tests were performed according to [28]. With the help of this method it is possible on the one hand to identify the elastic and plastic deformation of the coating, and on the other to calculate the coefficient of friction. The findings of these tests were published in [24]. Here, a friction value of 0.15 was determined, which is a typical friction coefficient for a cold-forming extrusion process [29].
In addition, the nanohardness of the CVD-TiN layer was determined at elevated temperatures using the TriboIndenter with the heating unit xSol 800. The maximum temperature that occurs has previously been determined by numerical simulation of the extrusion process, taking into account the determined material data. Figure 4a shows the FE model with the resulting die temperature at the end of the forming process, as well as a hardness mapping of the CVD-TiN layer and the carbide HM CTM30 as a 20 × 20 µm array at the numerically determined test temperature of approx. 150 °C. For this purpose, a hardness value was recorded every 1 µm with a test load of 10 mN. The average hardness value of the coating is ~32 ± 2.3 GPa [24].
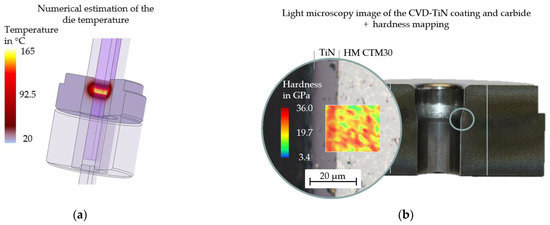
Figure 4.
(a) Numerical estimation of the die temperature (b) light microscopy image to determine the thickness of the CVD TiN coating and hardness mapping of the coating by nanoindentation.
3.3. Experimental Wear Analysis of Industrial Dies
To validate the further developed wear model, worn and unworn demonstrator tools were provided by the Fischer company and analysed comprehensively. Based on the analysis and the numerical mapping of the process, it is possible to determine the wear sensitivity of the tool geometry currently in use and to identify the tool areas susceptible to wear. With this knowledge, design changes can be achieved to reduce tool wear. For this purpose, the analyses are carried out on dies in their initial condition and on worn dies that have been used for a known number of forming strokes. The dies are wire-cut into two halves and subsequently measured using a VR-3200 optical measuring macroscope of Keyence to scan the respective surface profiles in the taper. The measurement data of the surface profiles from the initial state and, in this case, after 189,000 forming strokes are afterwards mapped on top of each other and compared. Using this method, it is possible to identify the wear-related removal and the critical wear areas as shown in Figure 5.
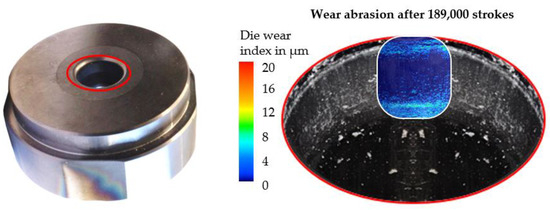
Figure 5.
Measurements of the wear depth on the Fischer demonstrator process die.
A number of 189,000 forming strokes was selected to ensure an examination of the dies at a point at which significant wear unequivocally occurs, but not total tool failure. After 189,000 forming strokes, a maximum wear removal in the area of the shoulder runout radius of approx. 12 µm was determined.
4. Numerical Wear Analysis and Design Improvements for Wear Reduction
4.1. Numerical Wear Analysis of Industrial Dies
The semifinished product and tool geometry are axially symmetrical, the simulation was performed in 2D (element type Quad10). The semifinished product and the dies were modelled with about 24,000 elements (semifinished product) and 26,000 elements (the different dies). The number of nodes was 25,500. For die design, an automatic time step value was used to record the forming results for every 0.5 mm forming stroke, resulting in 1979 increments. The total forming stroke was 30 mm.
With the help of the number of forming strokes until the beginning of detectable wear and the material data determined in Section 3.2, it is possible to validate the extended wear model. The calibration of the wear factor k was performed using the extended wear model. To demonstrate the advantages of the modified wear model, the wear factor k described above was also used for the conventional wear model according to Archard. The respective simulation results are shown in Figure 6.
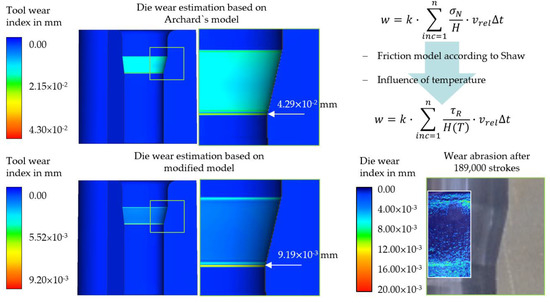
Figure 6.
Numerical die wear estimation based on Archard’s model and based on modified model.
The conventional Archard model predicts much more pronounced tool wear than the modified wear model. Furthermore, the wear-critical tool areas cannot clearly be identified using the conventional wear model, see Figure 6. This can be explained by the fact that high contact stresses occur during the entire forming process and the shear component of the combined friction law becomes a more important factor. The results of the modified wear model agree with the real die wear with respect to the wear-critical areas. Thus, the contact normal stress is no longer related to the shear friction stress, which allows better wear prediction in cold forming. Thus, the wear model is valid and can be used in the following to investigate the effectiveness of design changes for wear reduction in the established process.
In addition, with the developed wear implementation, it is possible to model not only the calculation of tool wear, but also improve the modelling of the transition from the friction coefficient model to the friction factor model, see Figure 7. Thus, it is possible to clearly assign the instable region between low and high contact normal stresses. For this visualisation, the natural number was used for the Shaw transition modelling to assume the lowest transition zone.

Figure 7.
Modelling the transition area with the help of the Shaw model.
4.2. Design Improvements in the Die Geometry for Wear Reduction
Die geometries can be fully described by the shoulder-opening angle, cross-section decrease, and shoulder inlet and outlet radii. Figure 8 shows the geometric dimensions of the rotationally symmetrical extrusion die currently in use.
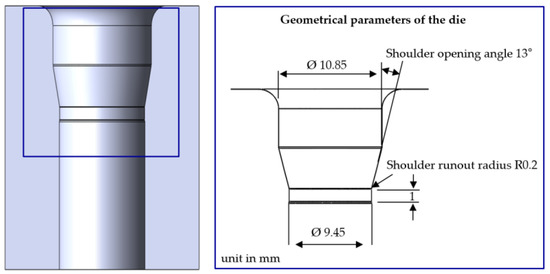
Figure 8.
CAD model of the die and its geometric parameters.
The highest wear was determined after 189,000 forming strokes in the area of the shoulder-runout radius. This shoulder-runout radius is set as for the current die. It is known from [30] that an increase in the shoulder runout radius can lead to a reduction in the tool load and thus to a reduction in wear. Therefore, in this study, the shoulder runout radius should be iteratively increased after each simulation until almost no reduction in wear can be observed. This parameter will be investigated in combination with different shoulder-opening angles. Due to the dependency within the process chain for the manufacturing of the bolt anchor, the dimension of the cross-section decrease cannot be changed. To analyse the influence of the shoulder angle, it was increased and decreased by 3° from the initial value of 13° for the simulation.
Table 3 shows the numerical test plan for the numerical identification of the optimum shoulder-opening angle and shoulder-runout radius. A similar step size for determining the optimal shoulder runout radius was also used in [30]. Based on this, a full-factorial test plan results in 15 forming simulations. The impact of the design changes is subsequently evaluated using the validated modified wear model compared with the conventional wear model according to Archard and the resulting tool loads. The FE-models differ only in the die geometry used. All previous boundary conditions were used for numerical identification. The shaft length after rejuvenation is 33 mm for all parameter combinations.

Table 3.
The numerical experimental test plan for the numerical identification of the optimum shoulder-opening angle and shoulder-runout radius.
The following Figures show the influence of the design die changes with respect to the different shoulder-runout radii and shoulder-opening angles. The following Figure shows the influences of the design die changes regarding the resulting die wear. Figure 9a shows the wear predictions of the conventional wear model and Figure 9b the wear predictions of the modified wear model.

Figure 9.
(a) Prediction of the wear removal according to Archard; (b) prediction of the wear removal of the modified wear model.
The respective maximum values of the simulations were determined analogously to Figure 6 and are shown as a bar chart in Figure 9. Regarding the initial geometry of the die, the conventional wear model according to Archard predicted the lowest wear at the currently used shoulder-opening angle of 13°. Using the modified wear model, this shoulder-opening angle shows the highest wear. Examining the influences for the further variations, both models show a similar trend. With increasing shoulder-runout radii, the predicted wear removal decreases. For the shoulder-runout radius R2 mm, wear can be halved with the Archard wear model. Taking into account the modified wear model, a reduction of 70% in wear removal is to be expected.
5. Results and Discussion
By calculating the tool wear based on the frictional shear stress according to Shaw’s law, it was possible to model the transition area in more detail, as well as the areas of low and high contact normal stresses, cf. Figure 7. This allows the assignment of exact stress values to the area of the shoulder-runout, creating a more stable wear calculation. For this visualisation, the natural number was used for the modelling of the Shaw transition to assume the lowest transition area. However, according to Figure 2c, this transition zone has the lowest influence. The reason for the good mapping of this transition area is due to the very low friction value of 0.15 in the process. It is assumed that in the area of closed-die forging, where significantly higher and also different friction values are present within the die, for example caused by lower lubrication, the advantages of the Shaw model are more effective.
Furthermore, the influence of the forming temperature on the hardness of the tools was taken into account in the wear calculation. The newly developed wear model was validated using the experimental results from the Fischer demonstrator process. The resulting tool wear after 189,000 forming strokes was significantly more accurately modelled through further development of the wear model. Both the wear-critical areas as well as the absolute wear were better predicted.
Using the validated wear model, it was possible to verify the effectiveness of the design changes to the die in reducing die wear, based on the numerical wear calculation. By increasing the shoulder radius by a factor of 10, the expected die wear can be reduced by 70%. In addition to the considered abrasive wear, crack formation is to be regarded as a major cause of failure, limiting the service life of the die. Following the fatigue/crack models of Basquin [31] or Goodman [32], the main influencing factors for crack initiation are to be found in the cyclic strain and mean stress loading.
Figure 10 shows the resulting die stresses of the initial die (13° with R0.2 mm) compared to the die with the lowest expected wear removal (13° with R2 mm). The stress states shows the time at the maximum forming force required during extrusion. The results show that the differences between the forming forces are negligible (1%). It can be seen that the peak stresses at the shoulder-runout radius were reduced by increasing the shoulder-runout radius.
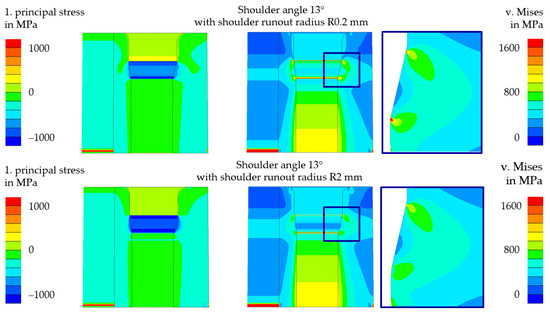
Figure 10.
Results of die stress analysis of the forging process for the upper die with different shoulder runout radii.
To compare the numerical results, a worn die after a tool change is shown in Figure 11. In addition to the known wear pattern, delamination of the coating at the shoulder outlet radius can be observed, which is due to the high stress peaks at the shoulder outlet radius.

Figure 11.
Photographic analysis of a worn die after a tool change.
6. Conclusions
In the process used by the Fischer company, very high contact normal stresses lead to high tool wear and thus also to high failure rates due to tool changes. To investigate this kind of wear, a demonstrator process based on the Fischer process was considered in this research. In order to be able to realistically predict tool wear in cold forming, the wear model according to Archard was further developed for numerical wear calculation within the scope of this work. Instead of the contact normal stress, the wear modelling was performed by means of Shaw’s friction law and thus on the basis of the frictional shear stress. In comparison to the conventional wear model according to Archard, the wear-critical tool area can be predicted more accurately. Subsequently, the effectiveness of design changes was investigated with the aid of the validated wear model. A wear reduction of about 70% was predicted by the die adjustment. The results of this research show that, based on the optimised wear simulation, it is possible to make design modifications to wear-critical tool areas in such a way that wear can be reduced efficiently. Therefore, this wear simulation can be applied to other processes for future investigations in order to design tools in a more targeted way and thus increase their operating lifetime. An evaluation of the model for other applications, including a comparison with an experimental wear investigation, could be the object of future investigations.
Author Contributions
Conceptualization, T.M. and P.M.; methodology, T.M.; software, T.M. and F.M.; validation, T.M., J.W., P.M.; formal analysis, T.M.; investigation, T.M.; resources, B.-A.B.; data curation, T.M.; writing—original draft preparation, T.M. and P.M.; writing—review and editing, T.M., P.M., F.M., S.H., H.W., J.W., K.B., B.-A.B.; visualization, T.M.; supervision, S.H., J.W. and H.W.; project administration, B.-A.B.; funding acquisition, S.H. and B.-A.B. All authors have read and agreed to the published version of the manuscript.
Funding
The authors gratefully acknowledge the financial support of the German Research Foundation (DFG) within the transregional collaborative research center TCRC73 “Manufacturing of complex functional components with variants by using a new sheet metal forming process—Sheet Bulk Metal Forming” project T06-417860413.
Institutional Review Board Statement
Not applicable.
Informed Consent Statement
Not applicable.
Data Availability Statement
Not applicable.
Conflicts of Interest
The authors declare no conflict of interest.
References
- Hancock, G.J.; Murray, T.M.; Ellifritt, D.S. Cold-Formed Steel Structures to the AISI Specification; M. Dekker: New York, NY, USA, 2001. [Google Scholar]
- DeGarmo, E.P.; Black, J.T.; Kohser, R.A. Materials and Processes in Manufacturing, 9th ed.; John Wiley & Sons Ltd.: Chichester, UK, 2003. [Google Scholar]
- Kuzman, K. Problems of accuracy control in cold forming. J. Mater. Process. Technol. 2001, 113, 10–15. [Google Scholar] [CrossRef]
- Sieber, K. Erfahrungen beim Fließpressen von Hohlkörpern, Kalt, halbwarm und warm. Draht 1978, 29, 4. [Google Scholar]
- Dieter, G.E. Mechanical Metallurgy; Mc Graw-Hili Book Company: London, UK, 1988; p. 4. [Google Scholar]
- Long, H. Quantitative evaluation of dimensional errors of formed components in cold backward cup extrusion. J. Mater. Proces. Technol. 2006, 177, 591–595. [Google Scholar] [CrossRef]
- Lange, K.; Cser, L.M.; Geiger, M.; Kals, J.A.G. Tool Life and Tool Quality in Bulk Metal Forming. Ann. CIRP 1992, 41, 667–675. [Google Scholar] [CrossRef]
- Groche, P.; Moeller, N.; Hoffmann, H.; Suh, J. Influence of Gliding Speed and Contact Pressure on the Wear of Forming Tools. Wear 2011, 271, 2570–2578. [Google Scholar] [CrossRef]
- Pilz, F.; Merklein, M. Comparison of extrusion processes in sheet-bulk metal forming for production of filigree functional elements. CIRP J. Manuf. Sci. Technol. 2019, 26, 41–49. [Google Scholar] [CrossRef]
- Blau, P. Fifty Years of Research on Wear of Metals. Tribol. Int. 1997, 30, 321–331. [Google Scholar] [CrossRef]
- Kapoor, A. Wear by plastic ratchetting. Wear 1997, 212, 119–130. [Google Scholar] [CrossRef]
- Abachi, S.; Akkök, M.; Gökler, M.I. Wear Analysis of Hot Forging Dies. Tribol. Int. 2010, 43, 467–473. [Google Scholar] [CrossRef]
- Holm, R. Electrical Contacts; Hugo Gebers Förlag: Stockholm, Sweden, 1946. [Google Scholar]
- Archard, J.F. Contact and Rubbing of Flat Surfaces. J. Appl. Phys. 1953, 24, 981–988. [Google Scholar] [CrossRef]
- Andersson, S. Wear Simulation. Adv. Knowl. Appl. Pract. 2010, 15–36. [Google Scholar] [CrossRef]
- Cull, S.J.; Tucker, R.W. On the modelling of Coulomb friction. J. Phys. A Math. Gen. 1999, 32, 11. [Google Scholar] [CrossRef]
- Behrens, B.-A. New Developments in the FE Simulation of Closed Die Forging Processes. In Proceedings of the 40th North American Manufacturing Research Institution of the Society of Manufacturing Engineers, Notre Dame, IN, USA, 4–8 June 2012; pp. 1–10. [Google Scholar]
- Behrens, B.-A.; Bouguecha, A.; Vucetic, M.; Chugreev, A.; Rosenbusch, D. Advanced Finite Element Analysis of Die Wear in Sheet-Bulk Metal Forming Processes. In AIP Conference Proceedings; AIP Publishing LLC: Melville, NY, USA, 2016; Volume 1769, p. 130010. [Google Scholar]
- Behrens, B.-A.; Wester, H.; Matthias, T.; Hübner, S.; Wälder, J.; Müller, P. Investigation of the Influence of an Oscillation Superposition on the Wear Behaviour in an Industrial-like Process. In Proceedings of the 23rd International Conference on Material Forming (ESAFORM), Cottbus, Germany, 4–6 May 2020. [Google Scholar]
- Schey, J. Metal Deformation Processes Friction and Lubrication; Dekker: New York, NY, USA, 1970. [Google Scholar]
- Bouguecha, A.; Hadifi, T.; Mielke, J.; Behrens, B.-A. Increase of the computational accuracy of hot bulk forming process simulations with improved friction modeling. Materialwissenschaft und Werkstofftechnik 2012, 43, 839–850. [Google Scholar] [CrossRef]
- Shaw, M.C. The Role of Friction in Deformation Processing. Wear 1963, 6, 140–158. [Google Scholar] [CrossRef]
- Henke, T.; Bambach, M.; Hirt, G. Experimental Uncertainties affecting the Accuracy of Stress-Strain Equations by the Example of a Hensel-Spittel Approach. In AIP Conference Proceedings; AIP Publishing LLC: Melville, NY, USA, 2011; Volume 1353, pp. 71–76. [Google Scholar]
- Behrens, B.-A.; Wester, H.; Matthias, T.; Hübner, S.; Müller, P.; Wälder, J. Numerical Calculation of Tool Wear in Industrial Cold Forming Processes Using the Further Development of Wear Modelling. In Sheet Bulk Metal Forming. TCRC73 2020. Lecture Notes in Production Engineering; Merklein, M., Tekkaya, A.E., Behrens, B.A., Eds.; Springer: Berlin/Heidelberg, Germany, 2020. [Google Scholar]
- Simufact Engineering GmbH. Datenbank simufact.forming 16.0. Available online: https://www.simufact.de (accessed on 12 March 2021).
- Altan, T.; Vasquez, V. Status of process simulation using 2D and 3D finite element method. What is practical today? What can we expect in the future? J. Mater. Process. Technol. 1997, 71, 49–63. [Google Scholar] [CrossRef]
- Childs, T.H. Material Property Needs in Modelling Metal Machining. Mach. Sci. Technol. 1998, 2, 303–316. [Google Scholar] [CrossRef]
- Pape, F. Mikrotribologische Untersuchungen an Wälzlagern mit Polymeraddivierter Fettschmierung. Ph.D. Thesis, Leibniz University Hannover, Hannover, Germany, 2011. [Google Scholar]
- Buschhausen, A.; Weinmann, K.; Lee, J.Y.; Altan, T. Evaluation of lubrication and friction in cold forging using a double backward-extrusion process. J. Mater. Process. Technol. 1992, 33, 95–108. [Google Scholar] [CrossRef]
- Wißmeier, H.-J. Beitrag zur Beurteilung des Bruchverhaltens von Hartmetall-Fließpreßmatrizen. Ph.D. Thesis, University of Erlangen-Nuremberg, Erlangen, Germany, 1989. [Google Scholar]
- Basquin, O.H. The Exponential Law of Endurance Tests. Am. Soc. Test. Mater. Proc. 1910, 10, 625–630. [Google Scholar]
- Goodman, J. Mechanics Applied to Engineering; Longmans, Green, and Co.: London, UK, 1899. [Google Scholar]
Publisher’s Note: MDPI stays neutral with regard to jurisdictional claims in published maps and institutional affiliations. |
© 2021 by the authors. Licensee MDPI, Basel, Switzerland. This article is an open access article distributed under the terms and conditions of the Creative Commons Attribution (CC BY) license (https://creativecommons.org/licenses/by/4.0/).