Article

Strain Induced Surface Change in Sheet Metal Forming: Numerical Prediction, Influence on Friction and Tool Wear

Institute for Production Engineering and Forming Machines, Technische Universität Darmstadt, Otto-Berndt-Str. 2, 64287 Darmstadt, Germany
*
Author to whom correspondence should be addressed.
J. Manuf. Mater. Process. 2021, 5(2), 29; https://doi.org/10.3390/jmmp5020029
Submission received: 26 February 2021 / Revised: 25 March 2021 / Accepted: 26 March 2021 / Published: 30 March 2021
(This article belongs to the Special Issue Metal Forming and Joining)

Abstract

:
In sheet metal forming, free deformation of the sheet takes place frequently without contact with forming tools. The pre-straining resulting from the free deformation leads to a surface roughening of the sheet metal. It is assumed that the roughening has an influence on friction and wear behavior of the following forming process as well as the painting quality after the manufacturing. In this paper, a numerical prediction based on a polycrystalline model is first proposed to predict the effect of surface roughing based on the material data of the as-received state of the sheet metal. Different states of strain are analyzed and the numerical result is validated through experimental evaluation. Besides the numerical prediction, the friction behavior after pre-straining is evaluated in strip drawing tests and the coefficient of friction (COF) is calculated. For interpretation of the measured COF, the surface roughness after the friction test and the surface image are evaluated by a transparent toolset. It is shown that the surface transformation as a result of pre-straining has a negative influence on the lubricating effect of the sheet metal and degrades the friction behavior. Finally, the influence of the strain-induced surface roughening on wear is discussed based on wear testing in strip drawing test with draw bead geometry.

1. Introduction

Deep drawing is one of the most important production processes in sheet metal forming and is essential in the automobile industry for the manufacturing of the car body parts drawing, which is are often formed through a combination of deep and stretch drawing, is essential to automobile industry [1]. The manufactured sheet metal parts often have a complex geometry with high optical demands and low geometric tolerances. With the sequential painting process, functional-qualitative high-grade car bodies can be realized [1]. High competence in manufacturing engineering can be used to perform the sheet metal processing operations at the limits of the technical feasibility [2]. According to the basics of deep drawing processes, the effectiveness of the drawing process depends not only on the material characteristics of the sheet metals, but also on the friction conditions in the flange and the die radius area [3]. High loads in the contact areas lead to an increasing wear rate of forming tools during the forming process [4]. The resulting friction and wear conditions have an essential impact on the quality of the forming parts and the effectiveness of manufacturing. As a result, the surface characteristic of the die and the sheet metal plays an important role in sheet metal forming [5].
In sheet metal forming processes such as car body drawing, in addition to contact forming, free deformation also exists. This leads to roughening of the sheet metal surface [6,7] According to Raabe et al., the surface roughening is caused by the elastic-plastic deformations which differ locally in the microstructure of the sheet material due to point defects and dislocations [8]. Such surface roughening not only influences tribological conditions such as friction and wear in the subsequent forming processes, but also has a significant influence on the quality of the paint finishing on the car body [9].
Of all the roughening effects, two effects, ridging and orange peel, should be emphasized, due to their great economic significance, since millions of pounds every year are spent alone in Great Britain by automotive manufacturers to eliminate the consequences of roughening effects such as orange peel [10]. Generally speaking, both the grain orientation [11] and the grain size [12] have a significant influence on the roughening of the material surface. The determination of the roughening effect under different states of stress is currently only investigated by the Marciniak stretch test [13,14,15,16]. In this paper, a new numerical approach is proposed to predict the surface roughening of the sheet metal in forming processes by different states of stress in Section 2.
Besides the prediction of the surface roughening, this paper also discusses the influence of the pre-straining and the resulting surface roughening on tribological conditions during subsequent forming processes. Most of the studies on the friction condition of sheet metal focus on the frictional condition in the as-received state through strip drawing tests [17]. Azushima und Kudo observed the sheet surface through a specified installed transparent tool in the strip drawing test and concluded that the coefficient of friction decreases with increasing contact stress as a result of the flattening effect on the surface asperities [18]. This flattening helps to build up the lubrication reservoir and prevent the lubricant from escaping from the tribological system [19]. However, information about the friction conditions after pre-straining of the sheet metal is missing. The approach of Staeves and Schmoeckel showed that the coefficient of friction increases with increasing pre-elongation of the sheet metal in the strip drawing test due to strain-induced roughening [20]. In this approach, only the coefficient of friction is evaluated, but the modification of the surface characteristics is not quantified. Trzepieciński et al. proposed an approach to investigate the variation of the surface roughness through optical measurement in strip drawing tests for rolling friction and found that the surface parameters Rp, Rv and Rt are suitable to evaluate the flattening effect of the surface asperities [21]. In this paper, the friction condition of the pre-strained sheet metal and the variation of surface roughness are discussed in Section 3.
Besides the frictional behavior, wear also of high interest especially due to the increasing use of the high-strength-steels in sheet metal forming. In a study carried out by the authors of this paper, the influence of the surface finishing and the hardness of the forming tools on the wear development as well as the tool life is investigated [22]. The characteristic value, the specific wear force F V ˜ , is used for the prediction of the life span [22,23] (see Equation (1)),
F V ˜ = σ N 2 z H T ( H S H T ) 4
with σ N the contact stress, z the penetration of the roughness asperities, H S the sheet metal hardness and the H T the tool hardness [22]. The parameter z is determined by the surface roughness of the tools and workpiece used in the sheet metal forming process [24]. However, the influence of sheet surface roughness on the wear behavior has not been sufficiently investigated. In particular, the effect of strain-induced roughening of the sheet metal on the wear development is vastly unknown. In this paper, the influence of the stain-induced roughening of the sheet metal on the tool wear will be identified in Section 4.

2. Numerical Prediction of Strain-Induced Roughening

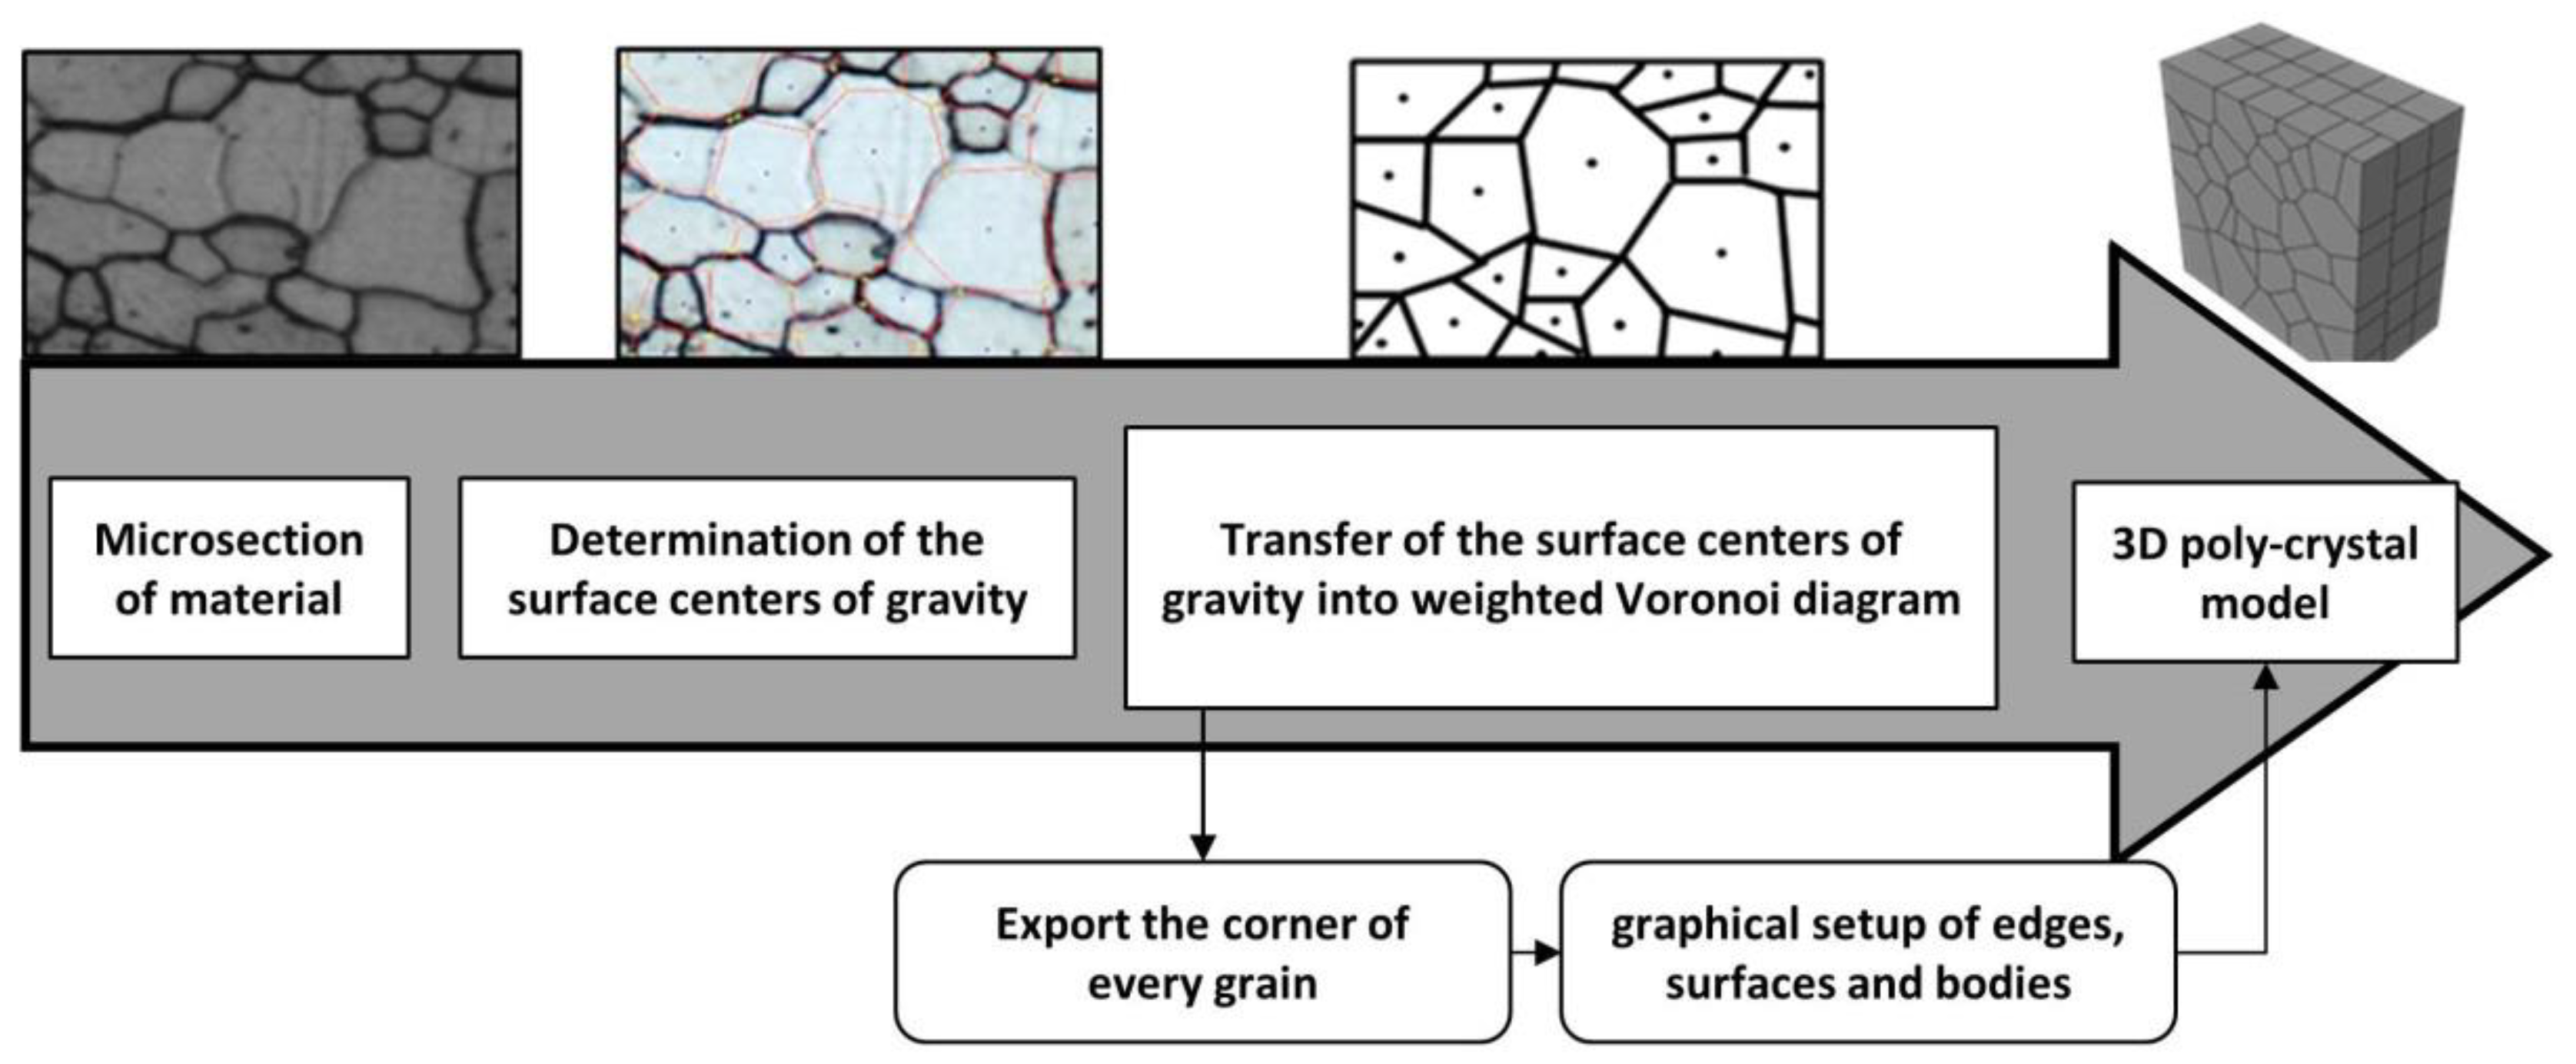
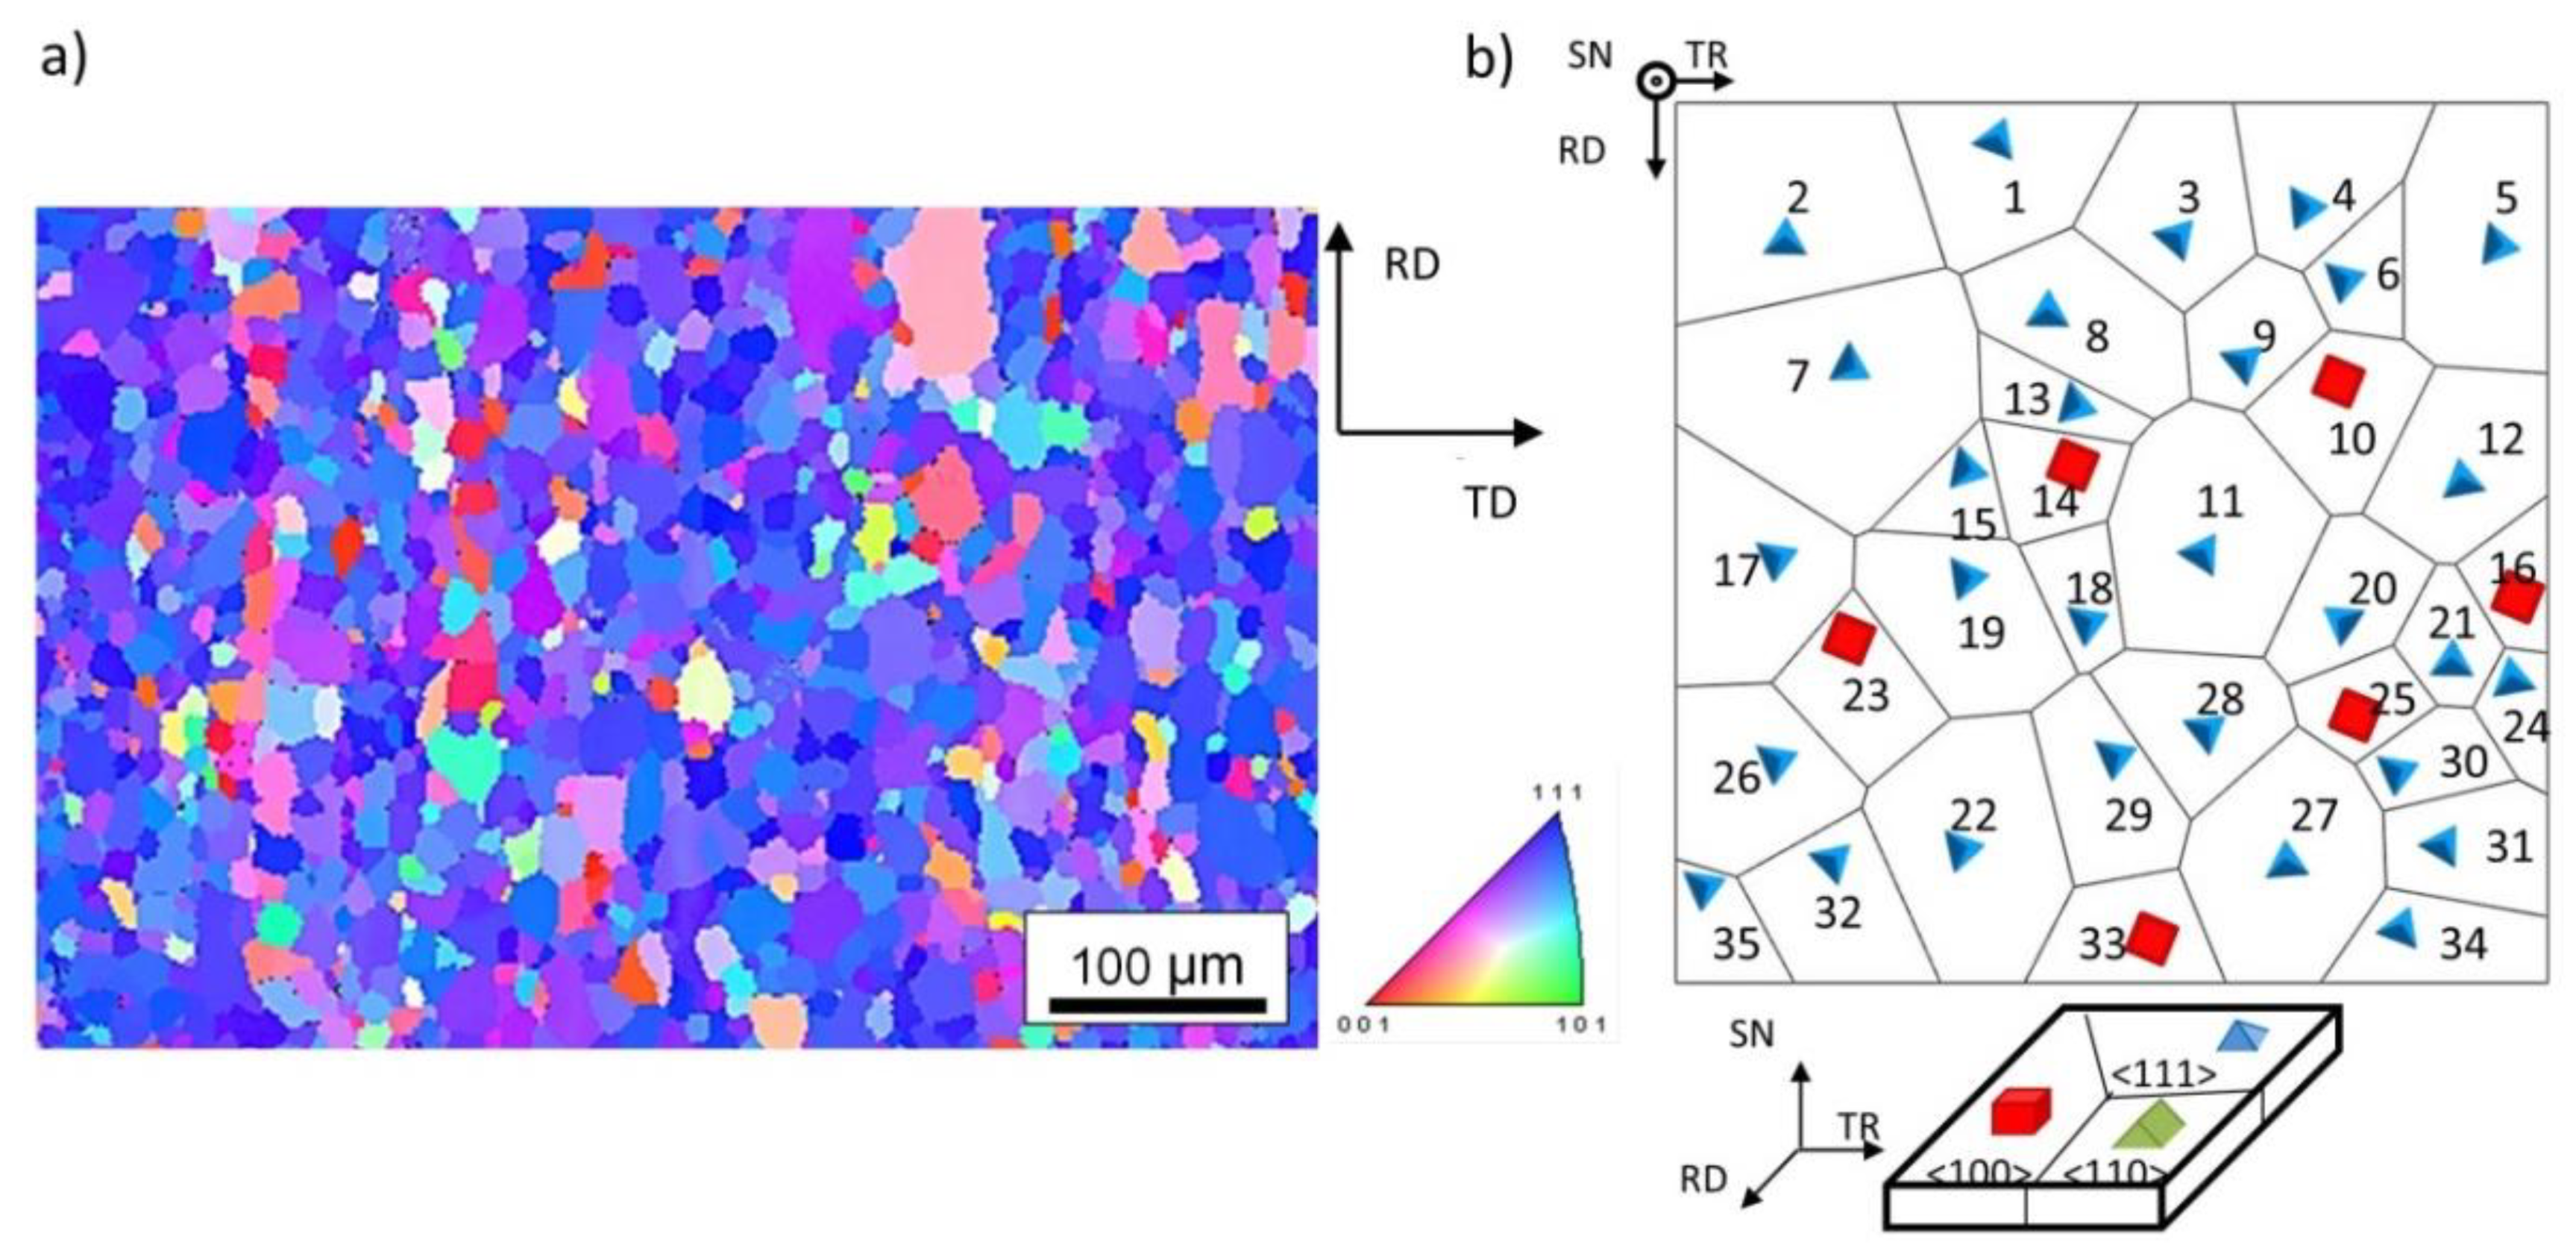
2.1. The Approach of Numerical Prediction of Strain-Induced Roughening for Uncoated Polished Sheet Metal

In this section, a three-dimensional numerical model for strain-induced roughening is introduced. The procedure of the modelling is shown in Figure 1.
This numerical model is based on the metallographic investigation of a microsection made of DX56. The separated samples are firstly embedded in epoxy solution. After polishing to a maximal profile height of Rz = 0.1 µm, the samples are etched by nitrene for contrasting the grain boundary. Subsequently, the microsection of the material with a size of 60 µm × 60 µm is recorded as an image through a microscope. By means of the software Matlab, every grain is defined as a region (Region of interest = ROI) and the centers of gravity of each region are determined. In this approach, the Voronoi algorithm is used to study the microstructure. This algorithm is widely used in building polycrystalline models for numerical simulations [25,26]. The centers of gravity from the obtained microsection serve as the input value (nuclei) of the Voronoi algorithm. The Voronoi algorithm defines that any point inside a Voronoi cell is closer to the nucleus than to any other nucleus. With this algorithm, the boundary lines of each cell are defined [25]. To build a three-dimensional model of the grain structure, the solid bodies are constructed through the extrusion of two-dimensional microsection with a depth of 10 µm, which corresponds to the average grain size in the normal direction of the sheet metal. For appropriate numerical accuracy, a Finite Element model with minimal three layers is used, which is also proposed by Zinovieva et al. [27]. Panin et al. identified that the first layer which is closest positioned to the surface has the main influence on the surface roughening [28]. Therefore, in this approach, a model with three layers is applied, in which only the first layer uses the grain structure form the optical measurements and the three-dimensional model has a size of 60 µm × 60 µm × 30 µm.
The numerical calculation is deployed in the FE Software ABAQUS Standard. After the modeling, the definition of material characteristics is essential. For an accurate calculation, the polycrystalline material model based on the stress induced activation of slip motion by exceeding the critical shear stress is used. In this approach, the material model of Huang is to be applied [29]. Besides the activation of the slip motion through exceeding the critical shear stress, the slip-system-dependent hardening behavior is also taken into account [29]. Regarding the determination of material parameters such as Young‘s modulus, exponents of shear stress and the hardenings modulus, the authors take these parameters from the study of Raabe et al. who implemented a number of experimental and numerical investigations for low carbon steels [30]. The implementation of such a material model is carried out through a user-defined subroutine in conjunction with ABAQUS. The parameters of the material model are summarized in Table 1 and the detailed procedure of the subroutine can be obtained in the approach of Huang et al. [29].
Besides the definition of the material model for the individual grains, the orientation of each grain has to be defined. Figure 2a shows the electron backscatter diffraction (EBSD) scanning from the surface of the material DX56. It can be found that the <1 1 1> orientation dominates and several single “islands” of <1 0 0> orientated grains are also existent. This orientation <1 0 0> has a significant influence on the surface roughening of the soft deep drawing steel according to the investigation of Cao et al. [12]. For a better illustration of the heterogeneity and the real structure in the model, the slip plane of each grain is manually assigned through two linear independent vectors. Figure 2b shows the manually specified grain orientations for the surface layer of the model with regard to the surface normal (SN), which approximates the orientation of the EBSD scanning results. In this model, the grains numbered 10, 14, 16, 23, 25, 33 are given the orientation <1 0 0>, while the other grains are given the orientation <1 1 1>. Quadratic tetrahedral elements (ABAQUS element type C3D10) with a length of 1 µm are selected for a fine meshing. The whole model consists of about 155,000 elements and 250,000 nodes.
According to the boundary conditions of the numerical model, three symmetry axes are assigned, while the constant major strain φ 1 of 5% is imposed in x-axis (u in ABAQUS) and the variable minor strain φ 2 in y-axis (v in ABAQUS), see Figure 3a. Several numerical calculations with different strain states are also used, covering the states of strain of typical forming processes (see Figure 3b). The boundary conditions and interactions are summarized in Table 2.
As an example, Figure 4 shows the plot of deformation in x-axis at 6% strain. Due to the limiting dimensions of the model (60 µm × 60 µm × 30 µm), surface texturing like Electrical Discharge Texturing (EDT) is not considered in this paper, because the minimal size of EDT texture is about 100 µm. Therefore, this study concentrates merely on the change in surface roughness of smooth surfaces due to induced strains. From the obtained numerical simulation, the distance between the highest peak and the deepest valley in the z-direction of the model is the strain-induced surface roughness, which corresponds to the parameter St in surface roughness evaluations.
The simulated strain-induced surface roughening of five different states of strain (Figure 3b) is shown Figure 5. It can be seen that the state of strain has a significant influence on the surface roughening. With increasing minor strain, the effect of roughening is more pronounced. In particular, after the transition from the strain state of tension-compression (negative minor strain) to that of tension forming (positive minor strain), the effect of roughening increases noticeably. The surface roughening provoked by a strain state φ 1 = φ 2 is about a factor of 3 larger than the one at strain state φ 1 = φ 2 . Even uniaxial drawing causes a factor of 2 larger surface roughening compared to the strain state φ 1 = φ 2 .
The result of uniaxial drawing is selected for validation of the numerical calculated results. Validation is performed experimentally using a tension test stand Zwick Roell 100. The samples for the tension test are polished before testing and the surface is scanned through a Confocal Microscope µSurf of Nanofocus after a tension of 5% strain at five positions on the sample. The result of the validation is shown in Figure 6. It is shown that the simulated result corresponds to the median of the measured surface roughness. The scatter of the roughness measurement is high because the microscopic grooves cannot be eliminated completely through polishing.

2.2. Verification of Galvanized Coating on the Surface Roughening

The above discussed numerical method discussed above is based on a polished sample without coating. However, real sheet metal forming processes commonly use galvanized coatings in real sheet forming processes. Sheet metal with galvanized coating is usually used. It is therefore worth discussing whether the coating has a recognizable effect on the surface roughening during free deformation. This verification helps to examine whether the proposed numerical prediction is useful for the sheet metal samples with galvanized coatings.
Two types of sheet metals, widely used in forming of car body parts are used for verification considering different amounts of coating. The test matrix is summarized in Table 3.
In a first step, tensile specimens are prepared according to DIN 50125 whereby some of the specimens are decoated. The specimens are strained to three different strain levels (5%, 10% and 20%). The surfaces of the specimens are measured by the confocal microscope µSurf of Nanofocus after pre-straining due to the tensile load. The surface roughness is evaluated by Mountainsmap analysis software. The coated and uncoated surface roughness results are summarized in Figure 7.
From the two diagrams in Figure 7, it can be seen that the coatings of both materials have an effect on the strain-induced surface roughening for all three levels of pre-straining. The influence of the thicker coating of the sheet metal HX340LAD is more significant than the thinner coating of the DC06 sheet metal. More precisely, it is observed that the increase in surface roughening between coated and uncoated specimens is proportional to the amount of coating for both materials. This interrelation can be quantified by the ratio between the roughness of the coated and the uncoated surface (Equation (2)). The calculated factors for both materials are plotted in Figure 8.
Calculated   factor   = S z c o a t e d S z u n c o a t e d
From the diagram of Figure 8, it is obvious that the calculated factors of sheet metal HX340LAD (approximately 1.2) are higher than those of DC06 (approximately 1.02). In addition, the calculated factors are constant with increasing pre-straining and thus independent of the amount of pre-straining. In summary, it can be concluded that the amount of the galvanized coating is proportional to the calculated factor and the strain-induced roughening of coated sheet metal surfaces can be estimated from the uncoated sheet, as long as the calculated factors are known for different types and amounts of coatings.
In this section, a numerical approach for predicting strain-induced surface roughening is presented based on polycrystalline modeling and determination of grain orientation from the real grain structure of the sheet metal. From the validated results, it is found that the method is useful for the strain-induced surface roughening and the influence of the galvanized coating on the strain-induced roughening is also discussed. Due to the independence of the calculated factors of the pre-straining, the strain-induced surface roughening can also be predicted by multiplying the calculated factors by the described numerical model.
After introducing the numerical prediction methods, the influence of the strain-induced surface roughening of galvanized sheet metals on the tribological behavior will be discussed in the following sections of the paper.

3. Influence of the Pre-Staining of Galvanized Sheet Metal on Friction

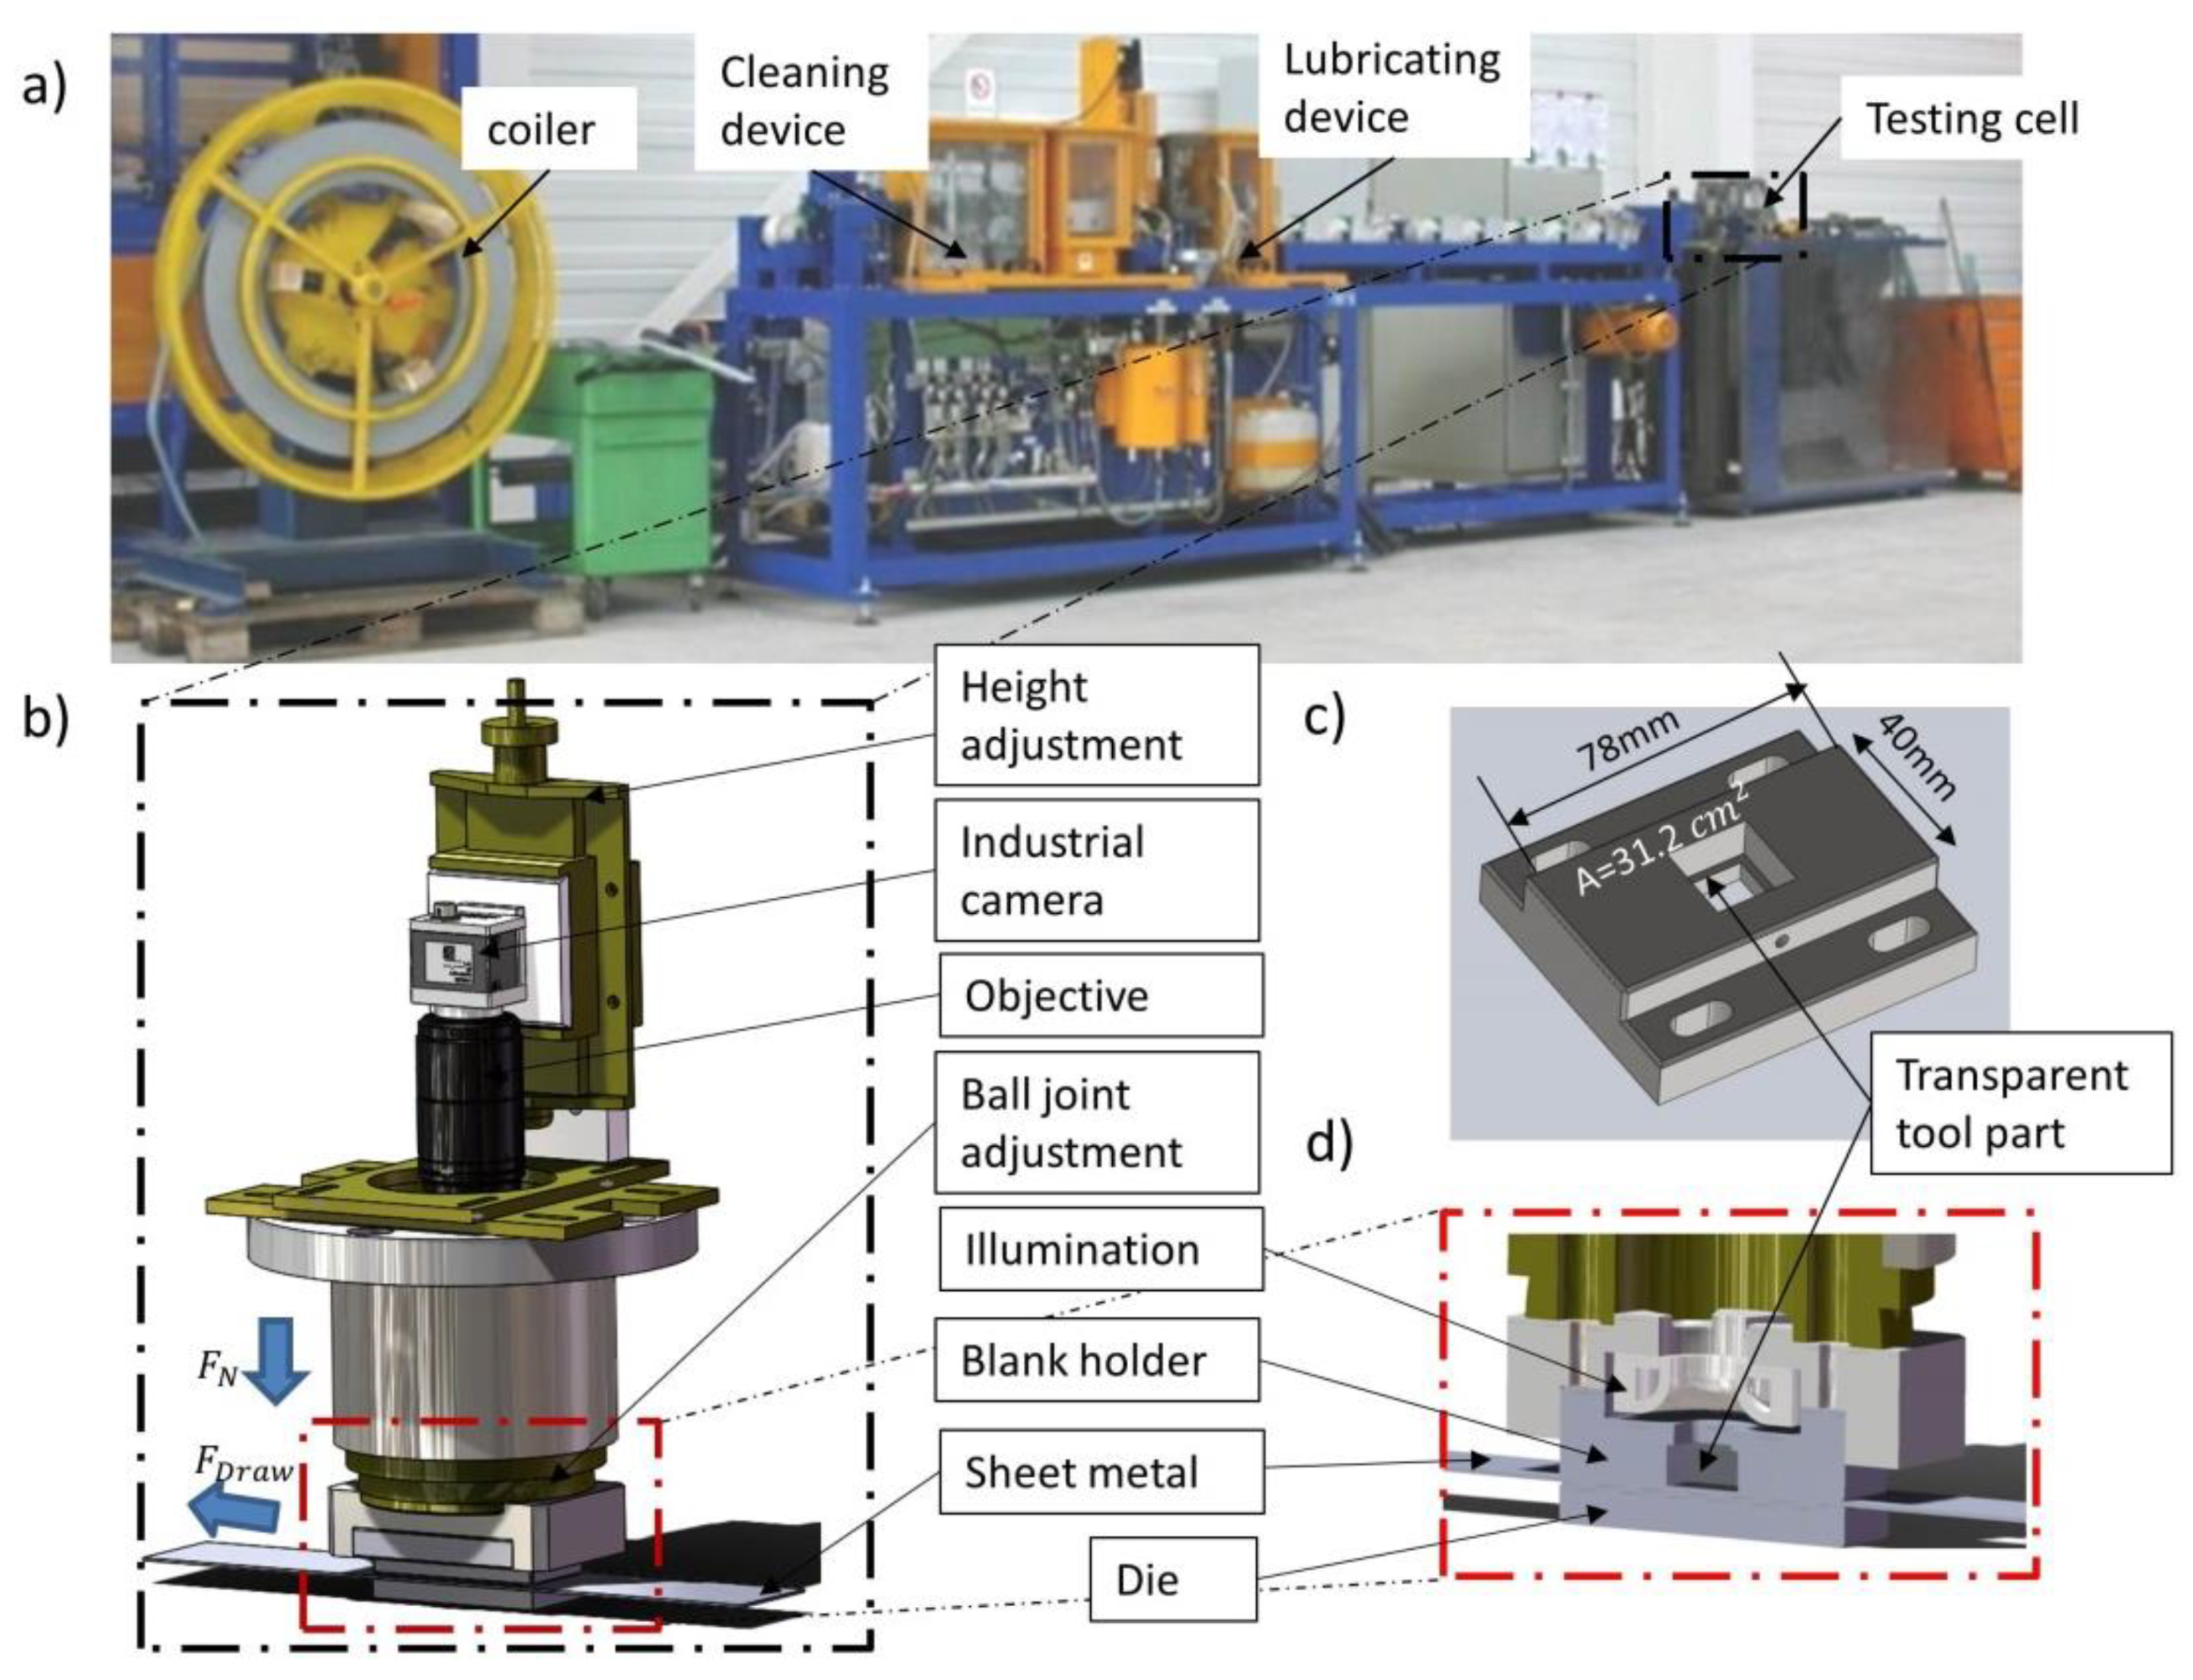
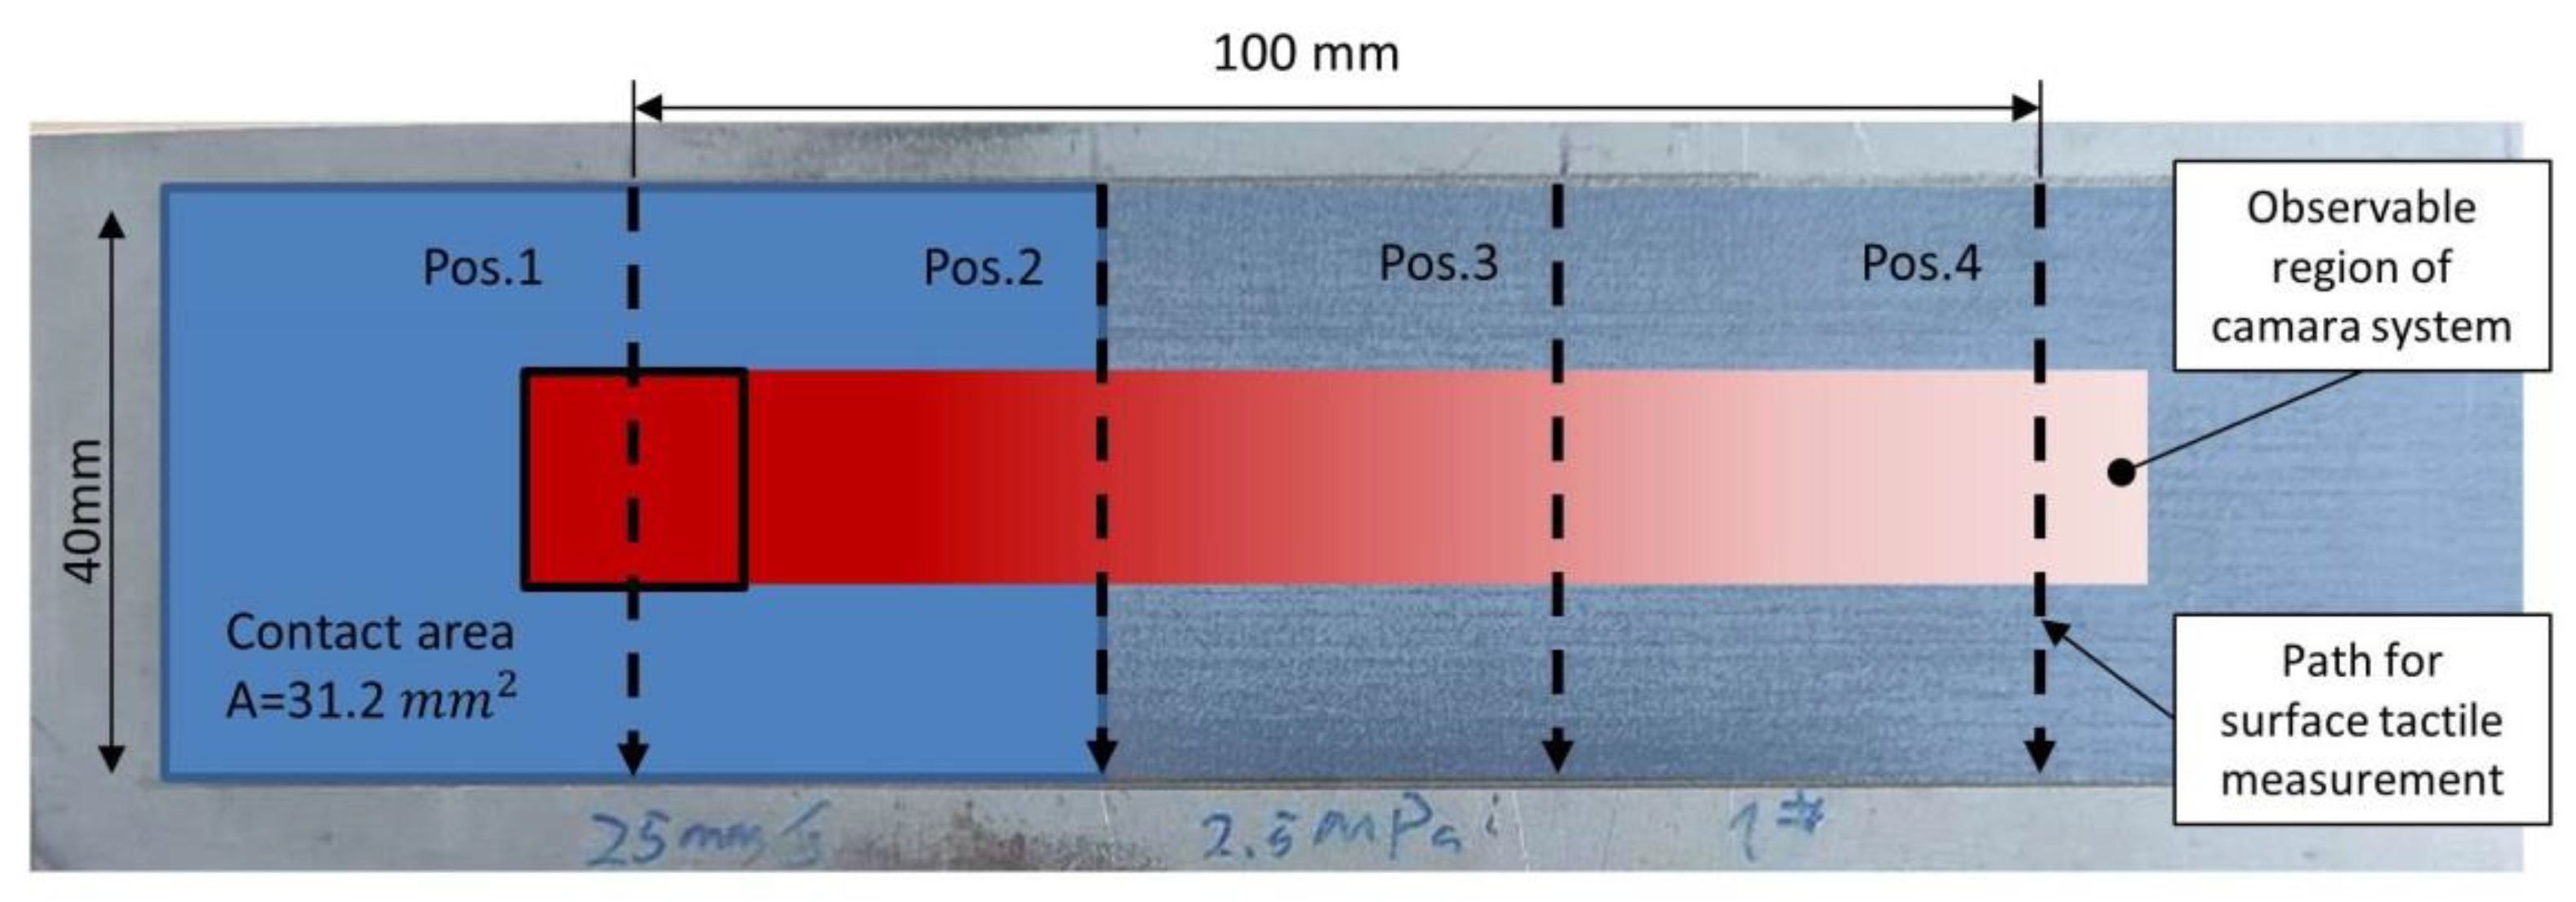
3.1. Introduction of The Experimental Setup

In this part of the paper, the friction behavior of the sheet metal with two different surface treatments, before and after pre-straining, is discussed. The pre-straining was realized by uniaxial tensile load of a combined tensile compression test machine Zwick Roell 100 with a strain of 5% and 10%. Besides the coefficient of friction (COF) measurement, the evolution of the sheet metal surface is also discussed to interpret the behavior of the measured coefficient of friction.
The experimental COF measurement was carried out by a combined strip drawing test stand, which allowed us to characterize the friction and wear behavior for sheet metal forming processes (Figure 9a). The COF measurement was based on Coulomb’s law. In the test stand, the sheet metal was clamped by a blank holder and a die with a geometry of 78 mm × 40 mm (Contact area A = 31.2   cm 2 ) and drawn by a gripper for 100 mm per stroke (Figure 9b,d). The drawing force F d r a w and the normal force F N were acquired with a frequency of 100 Hz (Figure 9b) and the coefficient of friction was calculated by the following equation:
μ = F d r a w 2 · F N
In this paper, three different velocities (25, 50 and 75 mm/s) and three levels of contact stress (2.5, 5 and 7.5 MPa) were selected under three pre-straining conditions. The normal force of the combined strip drawing test of the Institute for Production Engineering and Forming Machines was supplied by four hydraulic cylinders, whose normal force ranged from 7.8 kN to 150 kN. For a contact area of 31.2 cm 2 , a contact stress over 8 MPa (about 25 kN) caused a plastic deformation of the sheet metal. Therefore, three levels of contact stress (2.5, 5 and 7.5 MPa) were selected for the friction test. Two common types of sheet material, DC06 and HX340LAD were selected for the evaluation of pre-staining influence on friction behavior. Besides the difference in mechanical properties, the main difference of both materials was the amount of galvanized coating. The amount of galvanized coating on the surface of DC06 was 75 g/ m 2 on both sides, for HX340LA it was 150 g/ m 2 . Experimental parameters are summarized in Table 4.
The surface evolution characterization was realized by both inline and offline evaluation. Azushima and Kudo have realized surface observation in a strip drawing test through a microscope with a sapphire tool set [18]. In this approach, a special device was designed for the inline surface observation with an industrial camera. Figure 9b illustrates the design of the tool setup. The camera set (industrial camera: Basler acA4112-20um with a resolution of 4096 px × 3000 px (12 Megapixel) and objective: KOWA LM50FC) was mounted on a height-adjustable mechanism to allow the focus adjustment. In the middle of the blank holder, a pocket with the size 10 mm × 10 mm was milled for the insertion of the transparent tool part, which was made of sapphire glass. To realize a high photo quality, a dark field illumination was used for a better illustration of the surface texture [31]. In this toolset, the compact LED illuminator DF198-050WHIIC supplied by Advanced Illumination with white light was used for an easier integration in the compact toolset.
Besides the inline observation, the surfaces of the sheet metals were measured after the strip drawing test. Four positions of every stroke were selected for offline evaluation. Positions 1 and 4 corresponded to the start and the end of the sliding, while positions 2 and 3 corresponded to positions in the middle of the sliding track. At each position, a two-dimensional profile with a length of 40 mm was measured by the tactile roughness tester HOMMEL TESTER T8000. The measured positions on the sheet metal are illustrated in Figure 10. The obtained profiles were evaluated in the Software Mountainsmap 7.4 of Digitalsurf. According to the approach of Trzepieciński et al., the surface parameters Rv, and Rp are suitable for characterizing the surface topography in friction analysis, since Rp and Rv can be used to analyze the surface change in the peak and valley region separately [21]. In this research, the parameters Rv, Rp and Rz were evaluated to describe the surface evolution after the friction tests.

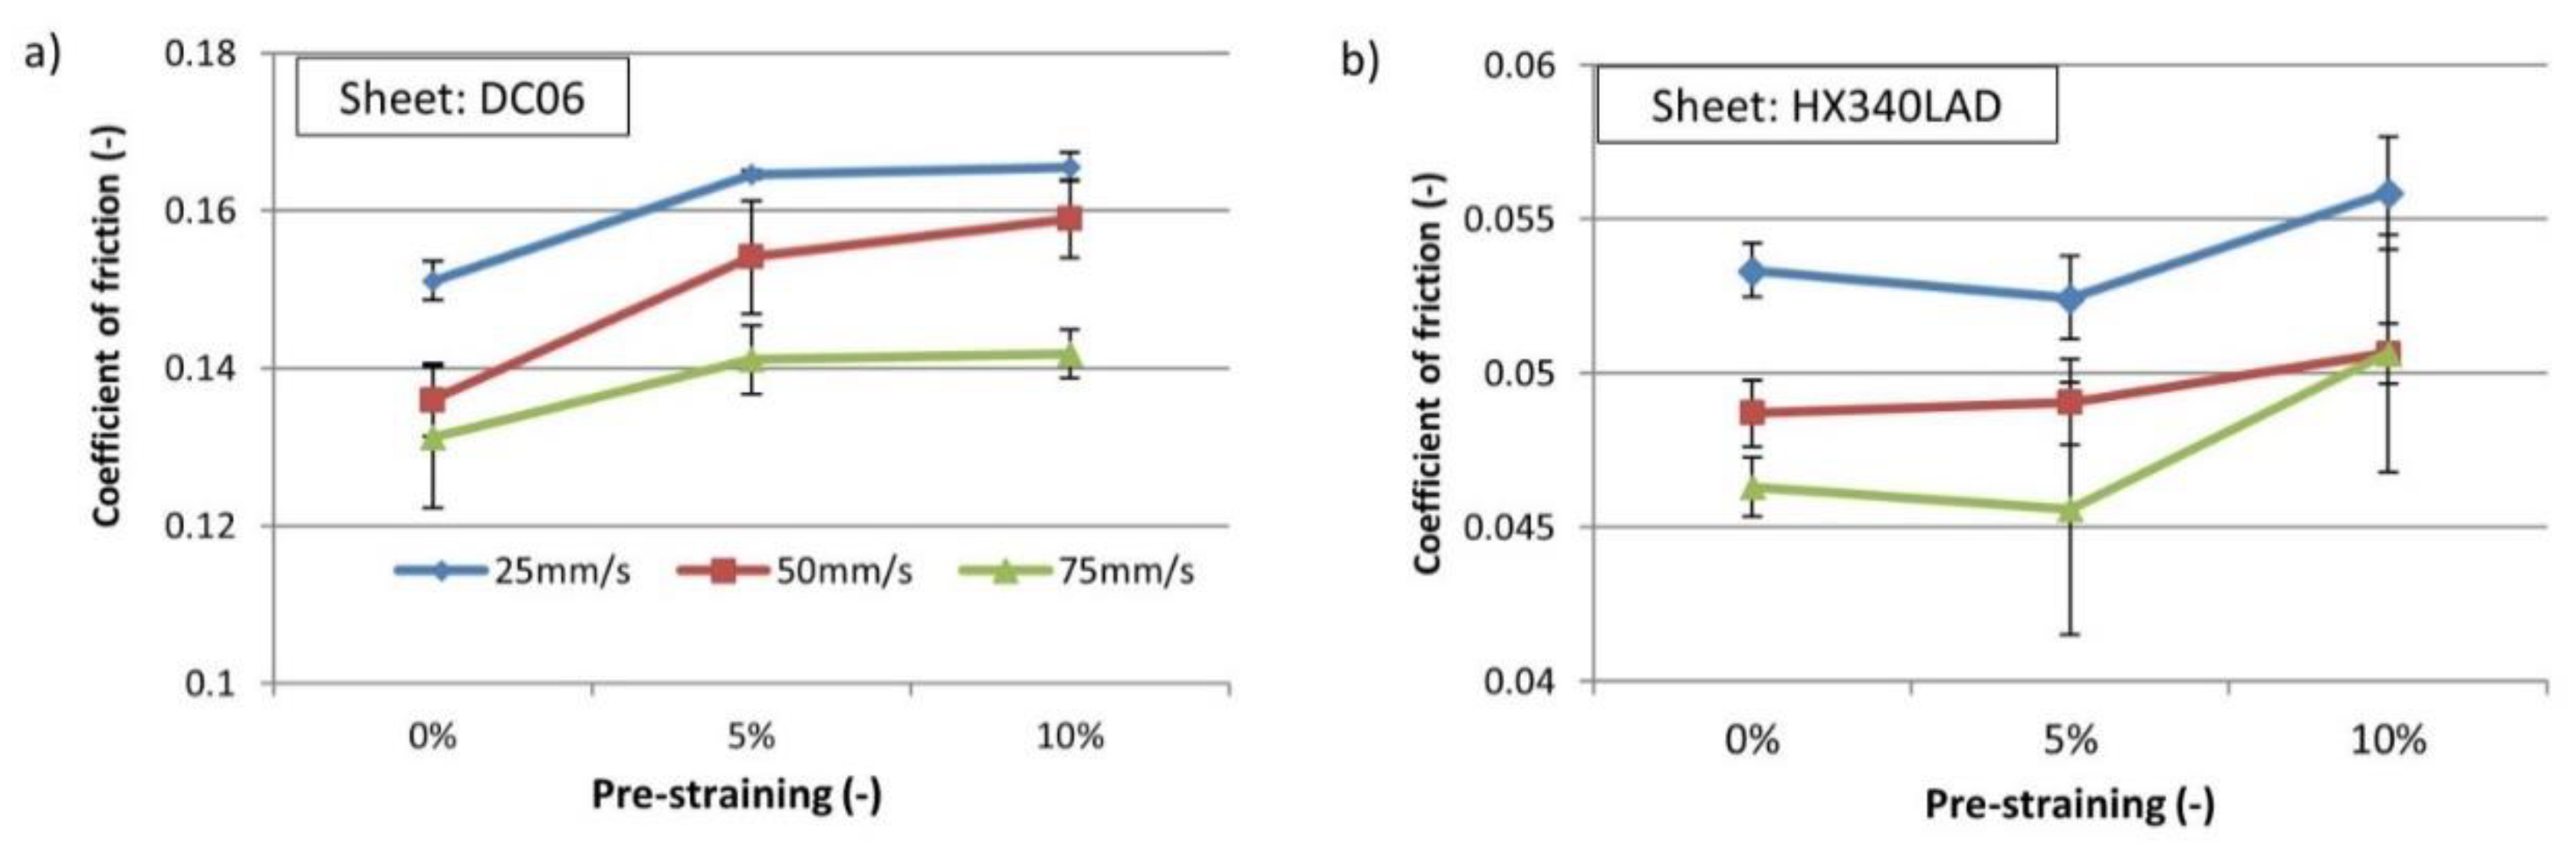
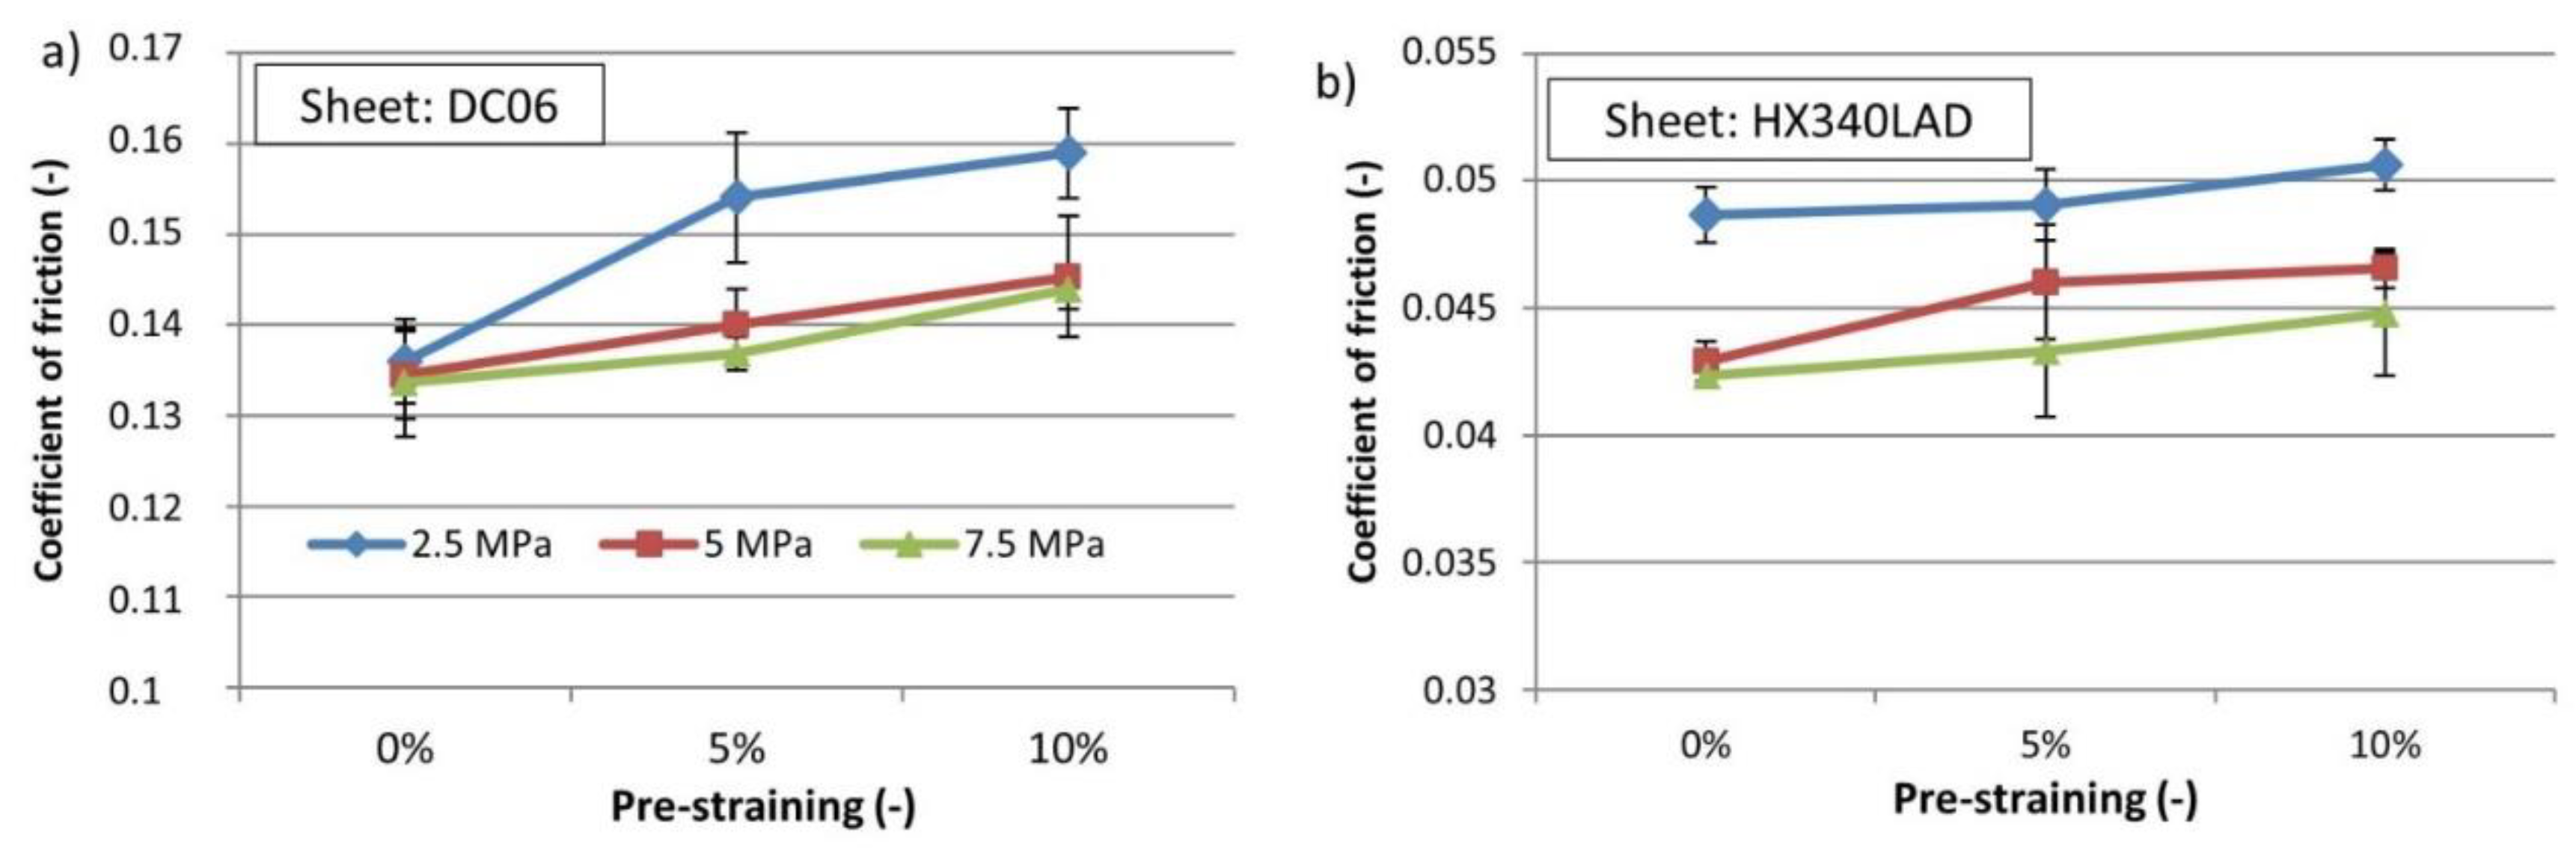
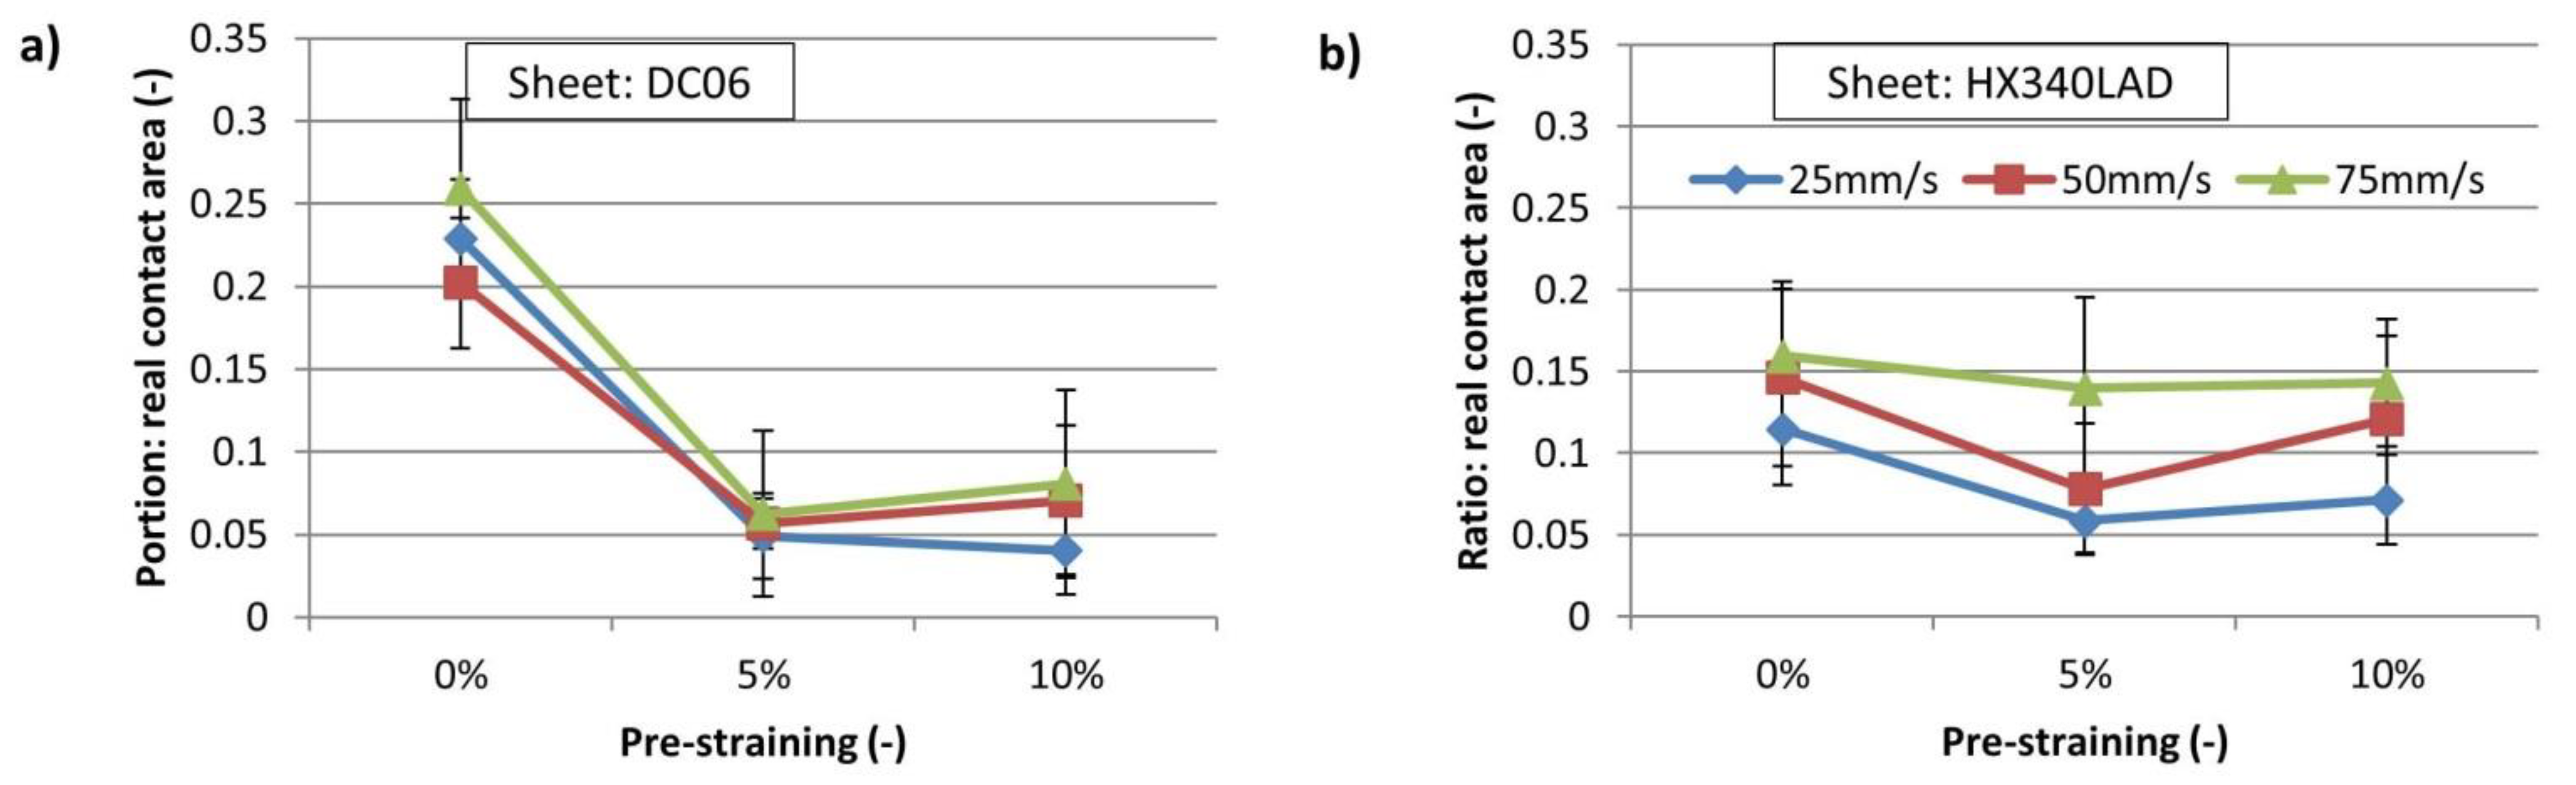
3.2. Evaluation of Coefficient of Friction (COF)

To evaluate the influence of pre-straining of materials on the COF, two test series were performed. First of all, the COFs were evaluated for different sliding velocities considering a constant contact stress of 2.5 MPa. The sheets were lubricated with an amount of 2 g/ m 2 after the pre-straining. After lubrication, the strip drawing tests were carried out three times with a sliding length of 100 mm and the COF was calculated by the measured drawing force based on Equation (3). Figure 11a,b show the COFs for a constant contact stress of 2.5 MPa with different sliding velocities for sheet metals DC06 and HX340LAD. It can be found that the COF rose with increasing pre-straining. A higher pre-straining led to an increased scatter of the measured COF accordingly. In addition, a higher sliding velocity led to a lower COF.
By comparing the different materials, it is obvious that the COF of the material DC06 with an electrogalvanized coating was about three times higher than the COF of the material HX340LAD with a galvanized coating. An increase of the COF for DC06 between 0% and 5% pre-straining could be observed, while the COF remained constant from 5% to 10%. In contrast, the measured COF of HX340LAD showed a more significant increase between 5% and 10% pre-straining, while there was only a slight change between 0% and 5%. In general, the COF rise for the HX340LAD was less significant than the change of the DC06 as a result of the rising pre-straining.
Secondly, the COFs under consideration of the contact stresses 2.5 MPa, 5 MPa and 7.5 MPa at a constant sliding velocity of 50 mm/s are evaluated in Figure 12. At least for 5 MPa and 7.5 MPa, the relation between the COF and the pre-straining appeared to be linear. Contact pressures of 2.5 MPa showed a more significant increase in the COF between 0% and 5% (Figure 12a). In general, the COFs decreased with increasing contact pressures regardless the change of pre-straining. Considering the COFs in every pre-straining, the COFs decreased with increasing contact stress, which was consistent in line with the studies of Azushima and Kudo [18]. Similar to the results of Figure 11 the COF increase of HX340LAD was less significant than that of DC06.
Based on these results, it can be concluded that an increased pre-straining of the sheet metal resulted in an increased COF. The question therefore is, whether the surface change resulting from pre-straining was the main factor causing the COF increase. In the following sections, the surface changes of the test sheets were analyzed by roughness measurements and surface observations to interpret the measured COF evolutions.

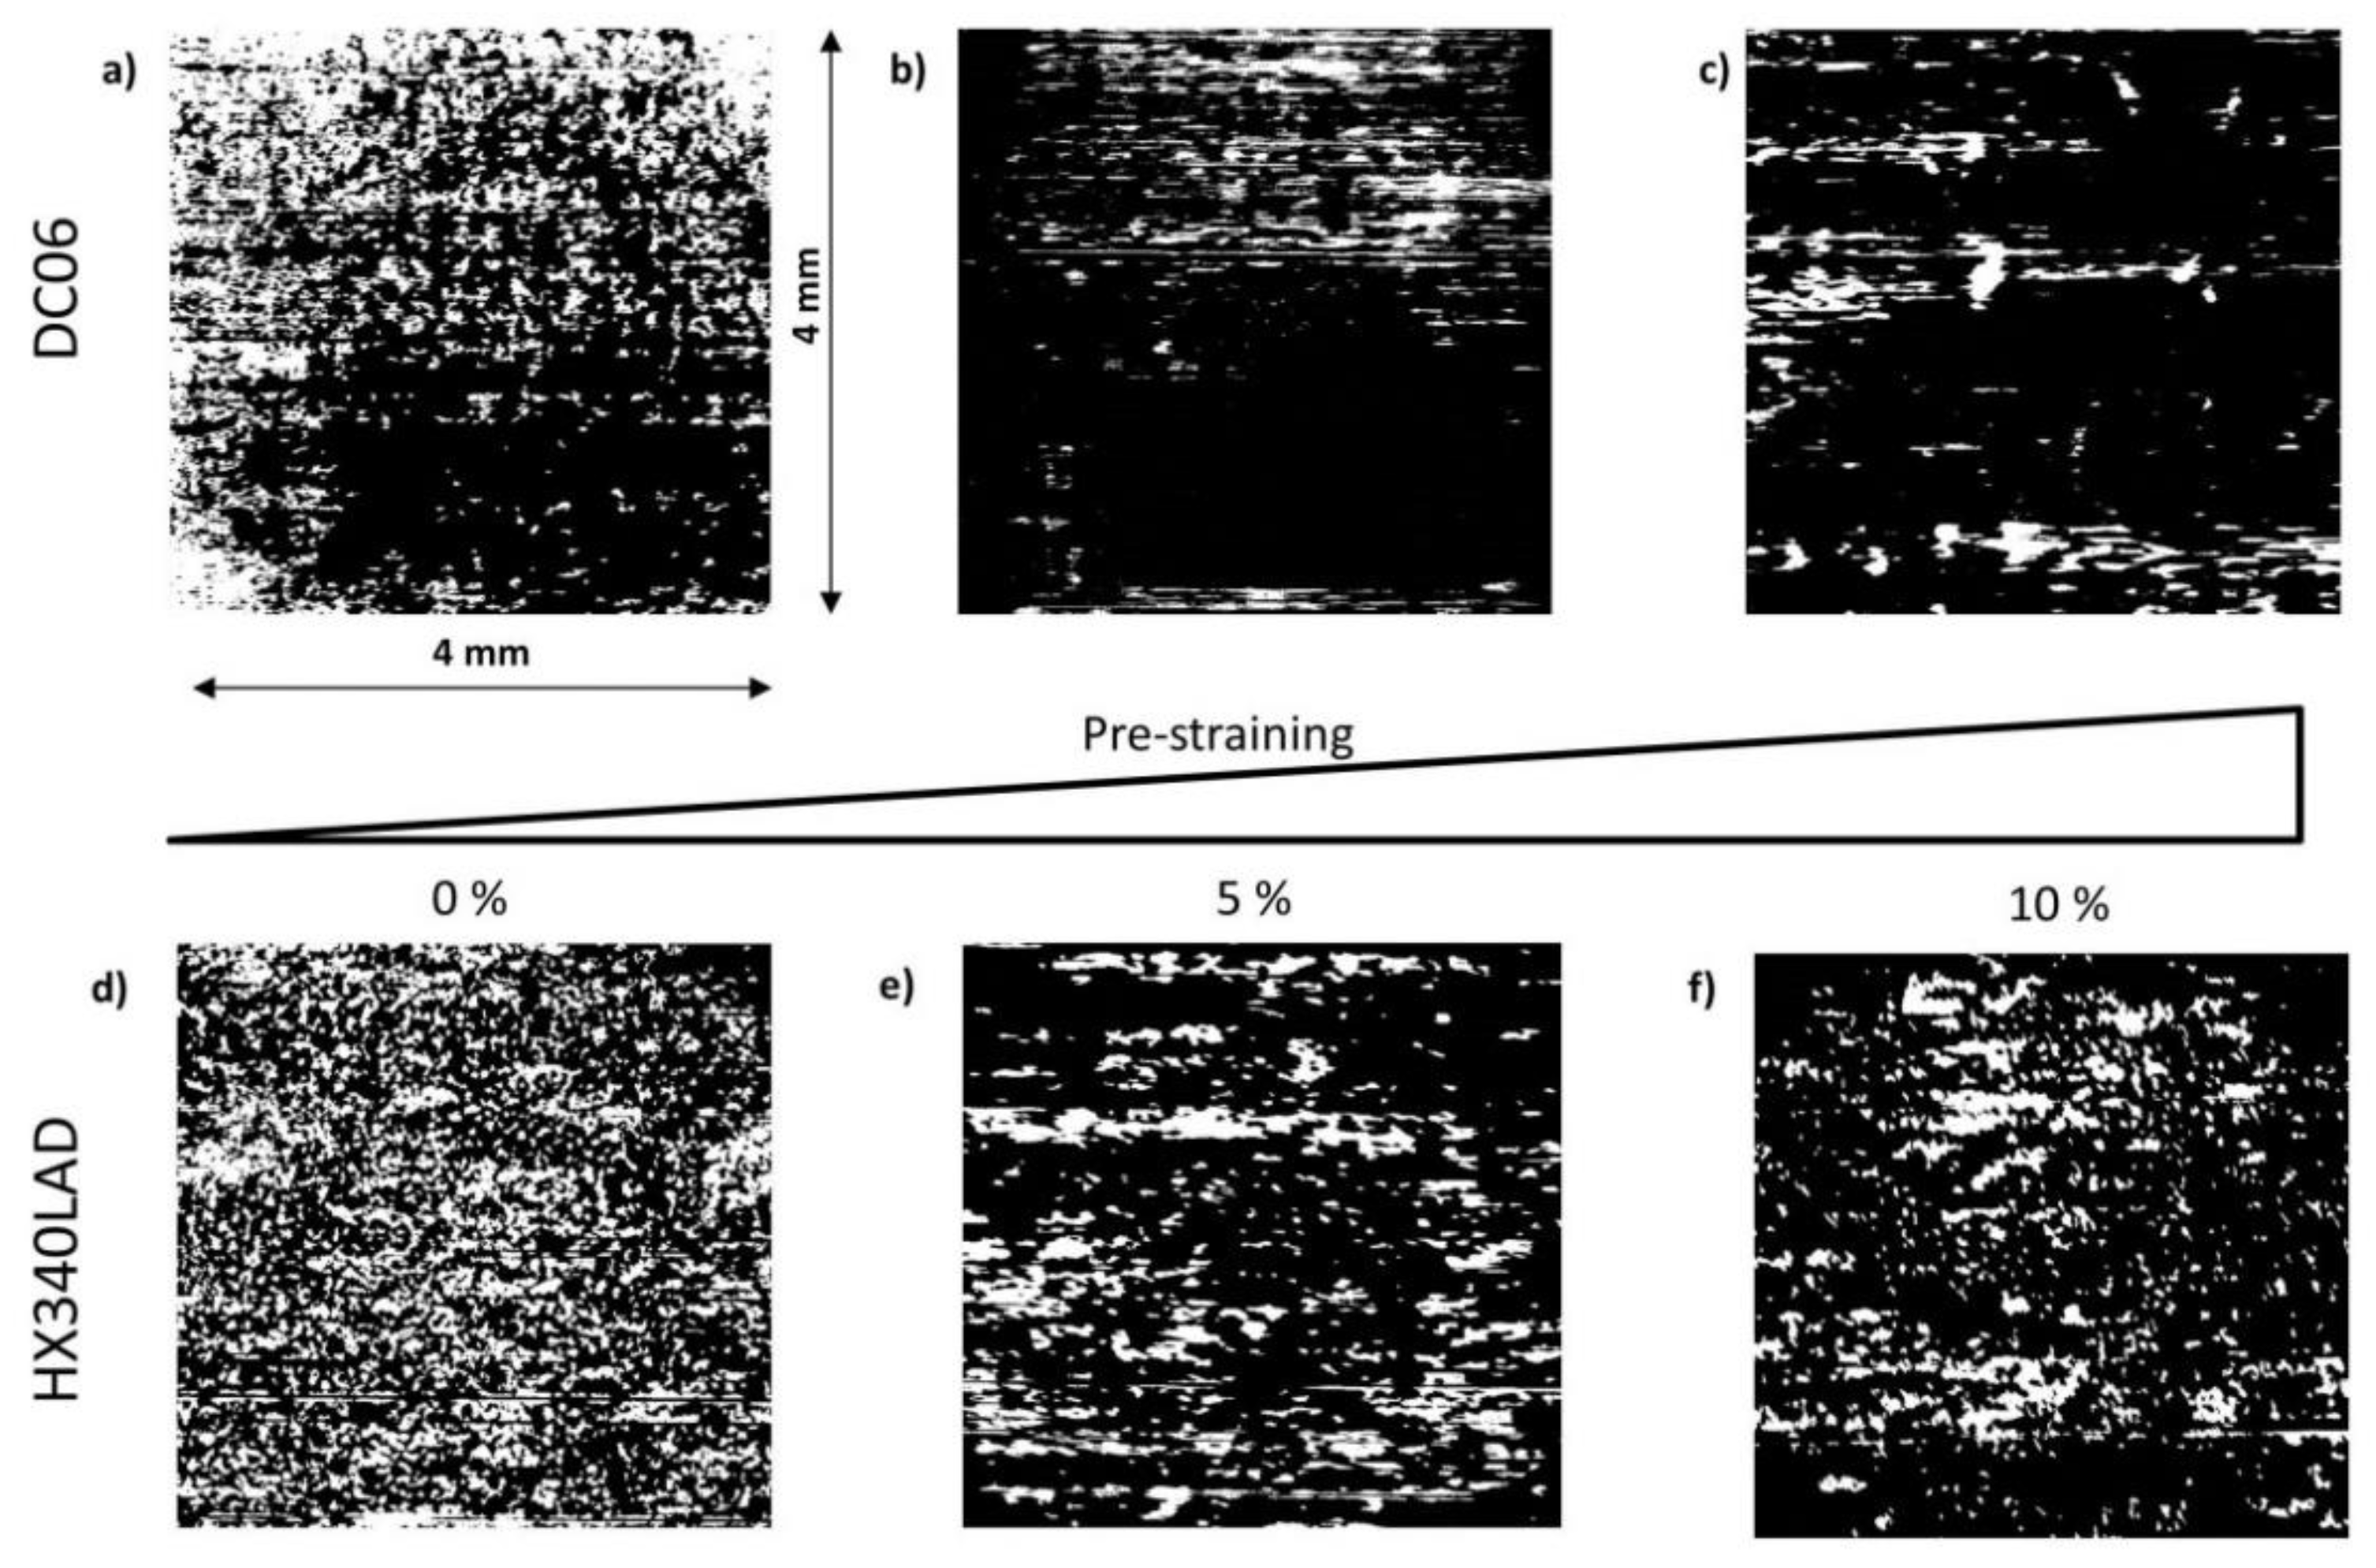
3.3. Evaluation of the Measured Surface Roughness

For the analysis of surface roughness, the roughness parameters Rz, Rp and Rv of the drawn sheet metal were evaluated after the drawing tests. According to DIN EN ISO 4287, Rp describes the peak height of the asperities, while Rv represents the maximum valley depth. The sum of Rp and Rv is equal to Rz [32]. With the help of these three parameters, it is possible to evaluate the surface change of the peak (Rp) and the valley (Rv) separately as well as their influence on the peak to valley height Rz.
First, 2d profiles with a length of 40 mm were measured on four positions of the sheet metal surface and the average value of the surface roughness was calculated to describe the surface change during each stroke of the test. Since every test was repeated three times, an additional average value of the roughness of the three strokes was calculated to describe the surface change of every test. Together with the initial surface roughness after the pre-straining, the surface roughness Rz, Rp and Rv of the sheet metals after the strip drawing test with different sliding speeds and constant contact stress of 2.5 MPa are illustrated in Figure 13. As the pre-straining increased, it was evident that all roughness parameters Rv, Rp and Rz increased by considering the initial roughness curve, indicating that the pre-straining resulted in a roughening of both the peak height Rp and the valley depth Rv.
As for the surface parameters Rp and Rv of DC06, the Rp curves of all sliding speeds were mainly lower than the initial surface roughness Rp, indicating a flattening effect of surface asperities on the peak. In contrast, the measured surface roughness Rv after the friction test did not show any significant differences, indicating a limited flattening effect. Combining the result of Rz, it can be concluded that the change of Rz was mainly influenced by the flattening effect of the peak height Rp, while the change in valley depth Rv led only to limited contribution to the change in the total roughness height Rz. This was in contrast to the friction model of Hol et al., who argued that the flattening of the peak height leads to an increase in the valley height [33]. This can be explained by the galvanized coating on the sheet metal. Due to the lower hardness, the flattening of the peak had an insignificant effect on the rise of the valley depth.
As a result, the higher COF of the increasing pre-straining of the sheets could be explained by the behavior of Rv and Rp in Figure 13b,c. Under the condition of unchanged lubricant quantity, the strain-induced rise of valley depth Rv led to an increasing space for lubricant storage in the valleys, which decreased the lubrication level in the tribological system. Since the contact between the specimens was mainly in the peak area, the lower lubrication amount caused a starvation of lubricant in peak area as pre-straining, which degraded the friction condition. By observing Figure 13c, the valley depth Rv hardly changed due to the flattening of the peak asperities, which did not contribute to an improvement of the friction condition in the investigated tribological system.
As for the evolution of Rp and Rv of the material HX340LAD, the flattening effect on the peak area was more dominant (see Figure 13e), while the effect of flattening on the peak was also insignificant on the valley depth Rv (see Figure 13f). This observation can be explained by the higher proportion of galvanized coating of HX340LAD compared to DC06. Due to the higher amount of galvanized coating, it can be seen from the sectional view of Figure 14 that the thickness of the galvanized layer was about 2.7 times greater for HX340LAD than for DC06.
Moreover, the galvanized coating on the sheet metal had a lower hardness than the basic material of the sheet. Therefore, the flattening effect occurred mainly on the coating area without affecting the basic material and the sliding on the surface of zinc coating has a lower resistance, resulting in a lower COF. This also shows the reason why the COF increase of HX340LAD was not as significant as that of DC06.
At different sliding speeds, it can be seen that the surface roughness remained constant. This indicates that the sliding speed had only a minor influence on the surface change during sliding.
Figure 15 shows the surface roughness parameters Rz, Rp and Rv of the sheet metals after strip drawing tests with different contact stresses and a constant sliding velocity of 50 mm/s. Similar to Figure 13, the initial peak height Rp and valley depth Rv increased simultaneously before the friction test as a result of the pre-straining (see Figure 12). With respect to the test results with DC06, the effect of flattening on the peak and the resulting reduction of valley depth under a higher contact stress can be seen in Figure 15b,c. This observation helped interpret the comparatively lower COF under a higher contact stress shown in Figure 12a.
Similarly, it was obvious that the flattening effect of the peak of the asperities (Figure 15e) dominated in the tests with HX340LAD, while the flattening also had an insignificant effect on the reduction of the valley depth Rv (Figure 15f). Due to the higher proportion of galvanized coating on HX340LAD, the flattening effect mainly affected the softer coating. The observation also indicated the insignificant increase of COF despite the increasing pre-straining, see Figure 12b.
As a summary of the results of the roughness measurements, it can be concluded that the flattening of the asperities was the main reason for surface flattening due to friction for both types of sheet metal, while the valley depth of the measured surface was hardly changed. With increased pre-straining, the peak height and valley depth increased simultaneously. The increasing depth of the valleys on the surface offered more space for lubricant storage, leading to a drying-up of lubricant in the peak area. The higher friction resulting from the smaller lubrication quantity was the main reason for the COF increase due to the pre-straining. For a closer look at the contact characteristics of the sheet surface, the results of the optical surface observation are discussed in the following section.

3.4. Optical Surface Observation of Sheet Metal Through Transparent Tool Set

According to the camera system setup shown in Figure 9b, dark field illumination was used, since there was less diffuse light reflection from the smooth surface and less light was detected by the camera sensor [31]. Consequently, a smooth surface appeared darker in the captured images. The real contact area was smoother than the uncontacted region under the transparent tool set. Therefore, the real contact area under the camera was detected as dark. The procedure of image processing is illustrated in Figure 16. After image acquisition, the images were processed in the NI Vision Assistant image processing software. First, an inversion filter was applied, that rendered the dark field of the original image as bright and the bright field as dark to highlight the real contact area as bright. Second, a square filter was applied to highlight the bright field corresponding to the real contact area. A threshold value was then defined to separate the real contact area from the rest of the image area. This image processing used a threshold value of 75 and the real contact area was displayed in white in the binary images. After image processing, a sample field with a size of 4 mm × 4 mm was selected for subsequent evaluation (see Figure 16).
In the strip drawing test, the frame rate of the camera was set to 8 pictures per second and about 10 pictures could be taken during a stroke at sliding speed 75 mm/s (maximal speed of the friction test). Figure 17 shows the true contact area on the sheet metal DC06 ((a), (b) and (c)) and HX340LAD ((d), (e) and (f)). In general, the real contact area of sheet metal without pre-straining was homogenous (Figure 17a,d), while the real contact area with pre-straining decreased after pre-straining and the contact was more local compared to that without pre-straining (Figure 17b,c,e,f). This change of the contact condition can be attributed to the stain-induced surface roughening, where both the average asperity height (initial value of Figure 13 and Figure 15) and the scatter of the asperity height increased. This surface change led to a inhomogeneous distribution of contact in the peak region of surface asperities, which degraded the lubrication effect and increased the COF [18]. Comparing the surface image of Figure 17b,c as well as Figure 17e,f, the portion of the real contact area appeared to rise with increasing pre-straining.
By comparing the behavior of the two types of materials after identical pre-straining (Figure 17b,e) it can be found that the distribution of the real contact was more homogenous for HX340LAD than for DC06 and the real contact area was also higher. To quantify the processed images in Figure 17, the portion of real contact area was calculated by analyzing the portion of “bright” pixels relative to the total number of pixels of the images. The parameter “portion: real contact area” is calculated in MATLAB with the following equation:
Portion : real   contact   area = Sum : bright   pixel overall   amount   of   pixel
Figure 18 and Figure 19 show the portion of the real contact area of the friction test after different sheet metal pre-straining. For the DC06, it can be seen that the contact on the sheet metal without pre-straining had the highest proportion of real contact. After pre-straining from 0% to 5%, the peak height Rp increased as shown in the results of Section 3.3. As a consequence, the distribution of real contact areas became more inhomogeneous (see Figure 17b). From 5% pre-straining to 10%, the portion of real contact area was at the same level, which explains the insignificant increase of the COF shown in Figure 11a. On the other hand, the real contact area of HX340LAD did not decrease as much as that of DC06 after pre-straining, which corresponded to the image evaluation of Figure 17. For different sliding speeds, no significant difference in the real contact area could be detected when the same level of pre-straining was used.
Figure 19 shows the portion of real contact area at different pre-straining levels with variable contact stress. The behavior is similar to that in Figure 18. Combining the portion of real contact area (Figure 18 and Figure 19), the surface image (Figure 17) and the evaluated roughness parameter in Section 3.2, a great impact of the pre-straining on the sheet metal surface change could be observed. This surface change led to a change in the frictional behavior. For different contact stresses, the portion of real contact area did not change significantly except for the contact stress 7.5 MPa of HX340LAD, which corresponded to the peak height Rp result in Figure 15e, indicating a detectable effect of flattening under a contact stress of 7.5 MPa.
Combining the results of the measured COFs, surface roughness and surface image, it was concluded that the strain-induced surface roughness change was the main influencing factor for the change in the frictional behavior. This change in roughness thus caused a change of the contact stress distribution. For sheet metal without pre-straining, the distribution of the real contact area was homogenous for both kinds of investigated sheets. Nevertheless, an abrupt change of the real contact area was obvious after pre-straining, which reduced the proportion of the real contact area. Besides the changing real contact area, the increase in the valley depth of asperities of the sheet surface due to pre-straining offers more space for lubricant storage in the valley, which led to a starvation of lubricants in the peak of the asperities and affects the friction condition. Summarizing the results of this study, it is obvious that the strain-induced pre-straining had a negative impact on the frictional behavior in sheet metal forming. In the following section, the influence of the strain-induced surface roughening on the wear behavior is discussed.

4. Influence of the Strain of Galvanized Sheet Metal on Tool Wear

The influence of strain induced surface changes on wear was investigated in strip drawing tests with draw bead geometry. The tool set consisted of two blank holders with a rounding of 3 mm (BH1 and BH2), two dies (Die 1 and Die 2) and a draw bead (DB) with a radius of 5 mm. Sketches of the draw bead geometry and the drawing direction of the sheet metal are shown in Figure 20. The penetration of the draw bead in this illustration is 3 mm.
Throughout the process of draw bead testing, the sheet metal was bent three times at the rounding of the BH1, BH2 and the top of DB. According to the simulation results of Groche and Christiany, the contact stresses are locally concentrated and three critical positions with dominant contact stress can be defined [34]. The positions of local stress are located on the rounding of the blank holders at both entrance and exit side (BH1 and BH2) as well as on the top surface of the die at the exit side (Die 1). In Figure 20, the three analyzed positions are marked red, where the contact stress at Pos. 1 is 694 MPa, at Pos. 2 810 MPa and at Pos. 3 794 MPa [34] for tests with the sheet metal DP980. It shows that the contact stresses on the exit side (BH1 and Die 1) are the highest and wear is most likely to occur at the Pos. 2 according to the Archard wear model [35]. In the following part of this section, the method for evaluating the strain-induced surface roughening of sheet metal under wear using the model of specific wear force (Equation (1)) is presented.
In this investigation, the dual-phase-high-strength-steel DP600 with galvanized coating Z140 (galvanizing amount 140 g/ m 2 on both sides) was selected. Two different material types were used to characterize the strain-induced surface roughening on tool wear: the cold working steel 1.2379 (X155CrVMo12-1) with a hardness of HRC 58 and nodular iron EN-GJS-700-2 (DIN EN 16482) with two different hardness levels (HRC 58 and 48). The summary of the experimental parameters is shown in Table 5.

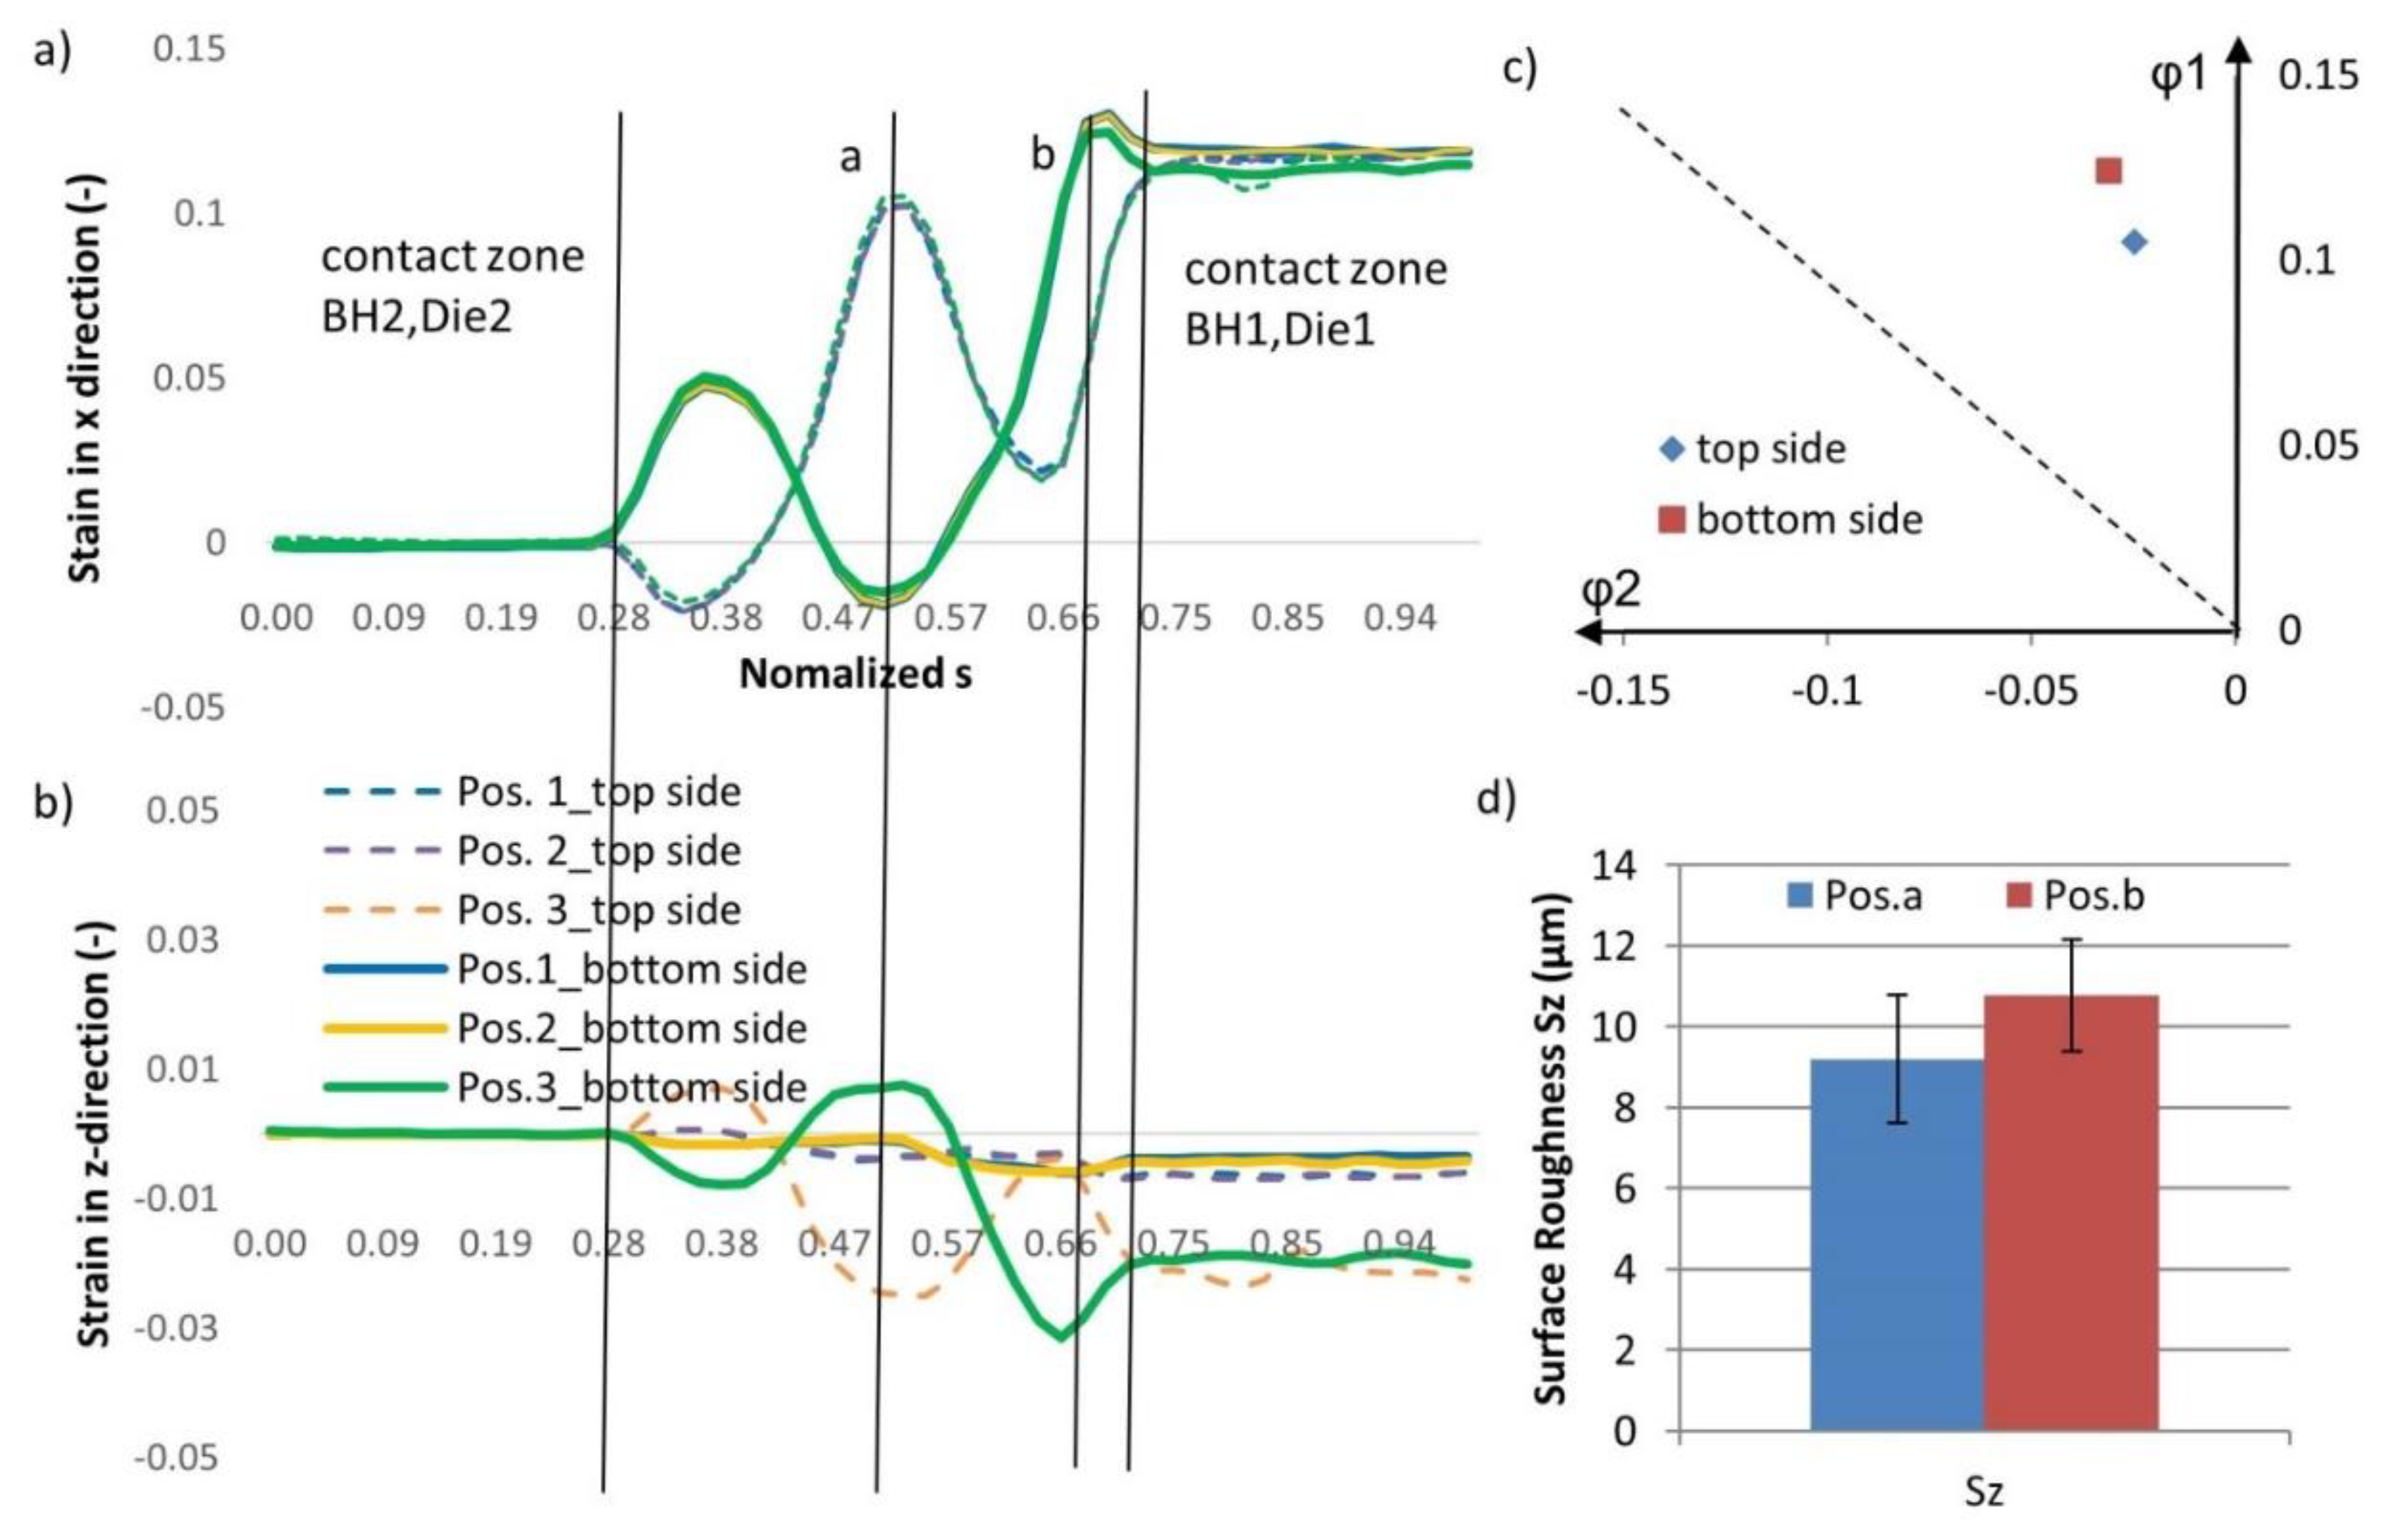
4.1. Process Simulation of the Strip Drawing Test with Draw Bead Geometry
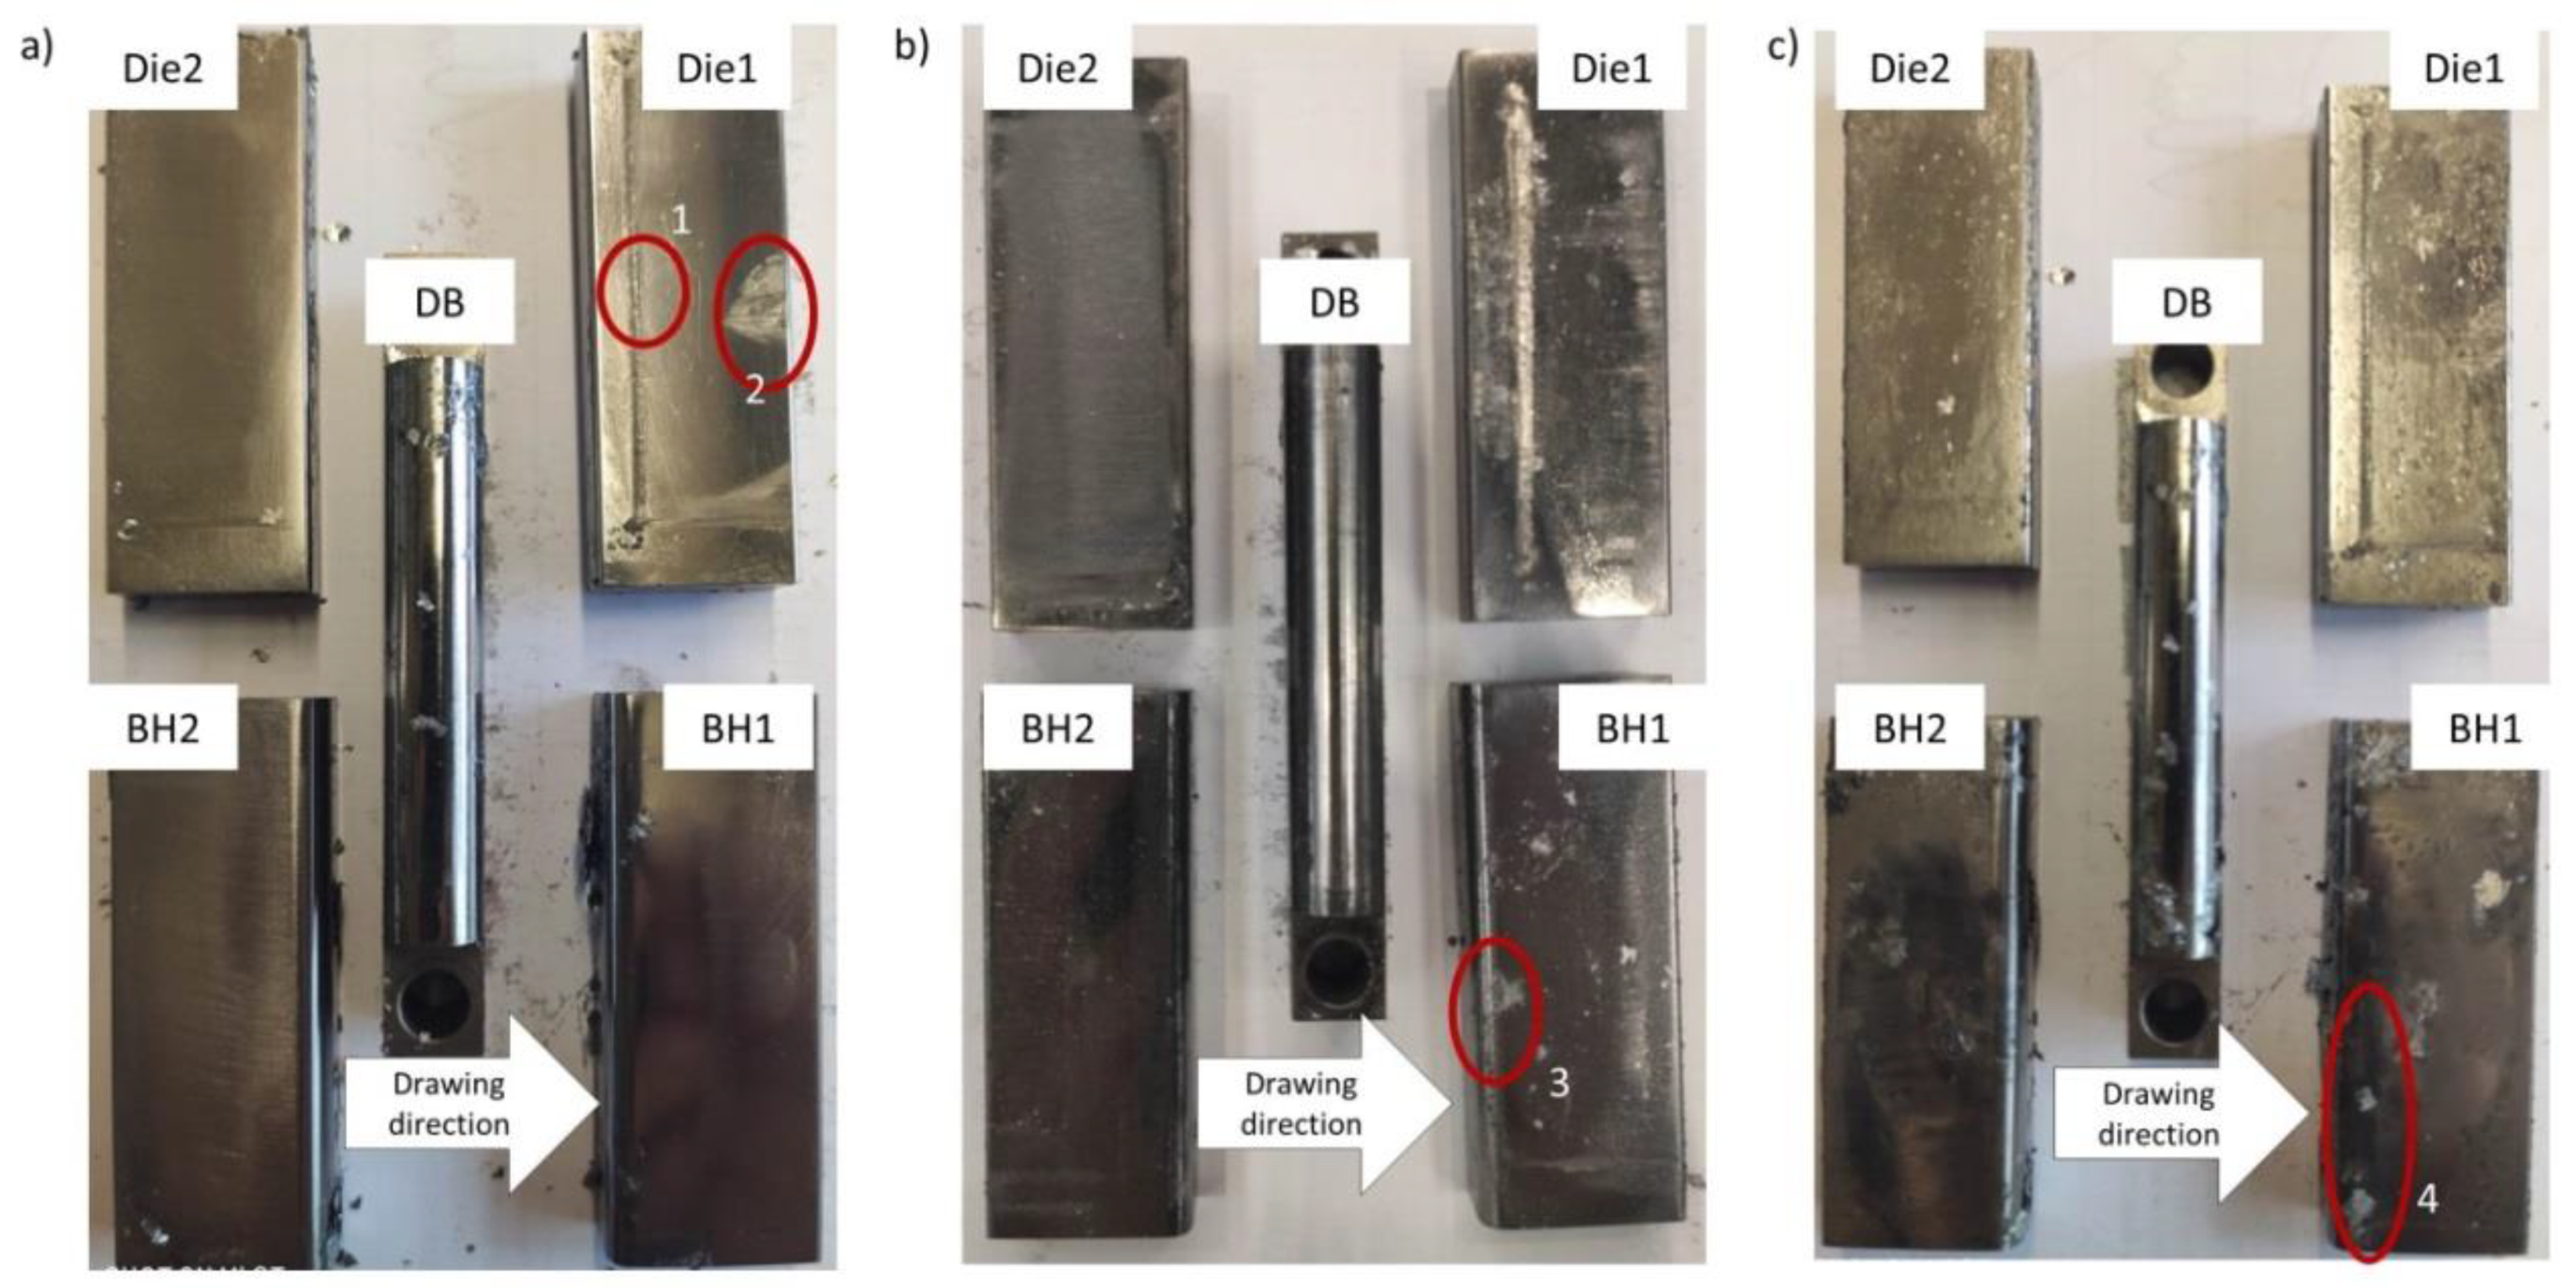
First, the strain on the top and bottom side of the sheet was calculated by numerical simulations for the complete drawing process. For a better illustration of the strain distribution on the sheet metal, a three-dimensional numerical model was built up in the FE-Software ABAQUS, illustrated in Figure 21. The model consisted of the bodies blank holder (BH1 and BH2), dies (Die 1 and Die 2) draw bead (DB) and the sheet metal. The penetration of the draw bead was set to 3 mm in this model. To evaluate the strain on the sheet, a coordinate system s was created with its origin at the beginning of the contact between BH2, Die 2 and sheet metal (see Figure 21a). Along the coordinate system s, a path was created in ABAQUS on both sides of the sheet metal and the strains were evaluated in the x-direction (PE11) and in the z-direction (PE33). The normal force of 30 kN was applied at the top of the blank holder body and the boundary conditions of the model are illustrated in Figure 21. In this simulation, the tools were modelled as elastic with a Young’s module of 210 GPa, and a Poission’s ratio of 0.3, while an isotropic elastro-plastic material model was used for sheet metal DP600. The flow stress of the DP600 in the drawing direction at room temperature is shown in Figure 21b. The normal interaction between tool and sheet metal material was defined as “hard contact” with linear penalty contact condition (value = 1) and the tangential contact was defined as penalty with a constant coefficient of friction of µ = 0.1 for all contact surfaces according to the Coulomb’s friction law.
In this approach, linear 8-node brick elements with reduced integration and hourglass control (C3D8R) were used for meshing the tools and the sheet metals. The global element size of the tools was 1 mm, while the element size was refined with 3 elements on the curve of the tool radius on blank holder (BH1 and BH2). For meshing the sheet metal, four elements were set along the thickness of the sheet, while the global size in the length and breadth direction is 1mm. To characterize the strain distribution, three positions along the width of the sheet metal are selected for strain evaluation and a path is created for each position on each side of the sheet metal. The strain in the center of the contact area (25 mm from the edge) was characterized by path 1 and the strain at the edge by path 3. Path 2 characterized the strain distribution in the middle between paths 1 and 3 (12.5 mm from edge). The evaluated paths are shown in Figure 22.
Figure 23a,b show the strains at different positions on the top and bottom sides regarding the normalized coordinate system s. Between s = 0–0.28, the contact zone between BH2 and Die 2 was located, while the contact zone of BH1 and Die 1 was positioned between s = 0.72–1. In the area between s = 0.28 and 0.72, the sheet metal was bent three times. Since the surface roughening resulted from the non-contact free-deformation, only the maximal strain outside the contact area on both sides was evaluated. In general, the strain in x-direction is dominant. On the top side, the maximum strain in x-direction at the edge (s = 0.52 (Pos. a in Figure 23a,b)) was 0.105, while the maximum strain on the bottom side in the center of the sheet metal (s = 0.66 (Pos. b in Figure 23a,b)) was 0.122. The corresponding strains in z-direction of Pos. a and b were negative and the maximum strain states on the top and bottom sides are summarized in Figure 23c. From the results, it can be seen that the maximum strain on the bottom side was higher than on the top side according to the simulation. With the sliding motion, the resulting surface roughening on both sides influenced the tribological condition of the critical contact point on BH1 (Pos.2 of Figure 20) and on Die 1 (Pos.3 of Figure 20). The measured surface roughness Sz by the confocal microscope µSurf in Figure 23d shows that the roughening in Pos. b (average value 10.4 µm) was more severe than in Pos. a (average value 9.2 µm), which correlates with the simulated maximum strain of Figure 23c. From this result, it can be concluded that the sheet surface roughness after contact with the tools on Pos. 2 and 3 was different, as shown in Figure 23. Since the contact stresses at Pos. 2 and 3 were comparable, the influence of the surface roughness difference could be evaluated by means of a draw bead test.

4.2. Wear Test

The severity of wear was recorded by the method of thermoelectric measurement based on the Seebeck effect of materials. Previous studies by the authors discussed the feasibility, the reproducibility and the effectiveness of this inline measurement in strip drawing tests with cylindrical and draw bead geometry [22,36]. The test setup in this approach was identical to [22] and the thermoelectric current was measured with at a frequency of 100 Hz. The sheet metal was drawn until a noticeable strong wear mark appeared on the sheet metal. The measured thermoelectric current with regard to the sliding length is illustrated in Figure 24.
Regarding the measured thermoelectric current of the test with cold working steel, it increased from 0 µA to about 10 µA in the first 100 strokes. This was caused by the increasing temperature of the test tools as a result of sliding. Between the 100th and the 702nd stroke, the thermoelectric current was stable with only slight fluctuations. This implied that both temperature and wear conditions stepped into a steady state. From the 702nd stroke onwards, the thermoelectric current started to fluctuate in negative direction. In the previous study of the authors, it is concluded that the sign of the measured thermoelectric current indicates the location of the severe wear [36]. Regarding the sign of the signal fluctuation, it implies a severe wear occurs in the die (Die1 according to [22]). As the sliding length increases, the amplitude of the fluctuation also increases, which is caused by the increasing severity of the tool wear on the die. In Figure 25a, adhesive wear marks (1 and 2) could clearly be defined on Die1, which corresponded to the measured thermoelectric current. This adhesion was mainly caused by the accumulation of the zinc coating on the test tool. Wear mark 1 was located in the critical contact area (Pos. 2 of Figure 20), but the larger wear mark 2 was observed at the exit of the Die1. This observation can be explained by the particle abrasion from the galvanized sheet in the draw bead test. The study by Moghadam and Nielsen on the draw bead tests of ultra-high-strength-steel DP980 with electrogalvanized coating also showed that the severe wear was mainly caused by the accumulation of loose particle due to the strain-induced coating abrasion from the sheet metal surface [37]. This effect of strain-induced coating loss has been named “strain-induced powdering” by Rangarajan et al., which is caused by bending and unbending strains in combination with the influence of contact stress and friction shear stress [38]. Figure 23a shows that the sheet metal was bent three times before entering the critical contact area (Pos. 2 and 3), which met the demand of the strain-induced powdering effect. Under these circumstances it is possible that the strain-induced particles may have penetrated into the tribological system of the critical contact area between BH1 and Die1 and the resulting three-body contact may have led to great effects on the wear mechanism of the test tools. As the sliding length increased, an increasing number of particles penetrated the tribological system, possibly changing the distribution of contact stress in the tribological system and forming a new critical position prone to local wear. Pos. 2 in Figure 25a is such a new critical position, where large amounts of particles accumulated and a higher local contact stress occurred in this position.
Compared to the signal derived with the cold working steel, the behavior of nodular iron was different. In the test of nodular iron, two tool sets with different hardness (HRC 58 and HRC 48) were tested. Firstly, the measured thermoelectric current decreased to about an average value of −3 µA within 50 strokes and moved on to a steady state. After 1800th stroke of both tests, the wear test was interrupted because of the coil changing, which led to a slight change of the thermoelectric current because of the cooling of the test tools. Nevertheless, the tendency of the thermoelectric current remained stable and the tool wear kept in steady-state. The steady state lasted until 2875 strokes for the tools with higher hardness (HRC 58) and 2744 strokes for the tools with lower hardness (HRC 48). After the steady state process, the signals of thermoelectric current for both tool systems started to increase abruptly. This indicates the occurrence of severe wear on the blank holders of both tests as a result of the positive increase of thermoelectric current. The adhesive wear marks could also be detected visually on the rounding of tool BH 1 (Pos. 3 and 4) of both tests, which is shown in Figure 25b,c. This observation also corresponds to the evolution of the measured thermoelectric current. The reason for a lower detected thermoelectric current in the test of nodular iron can be explained by the different Seebeck coefficients of different tool materials [39], which led to different amounts of thermoelectric current.

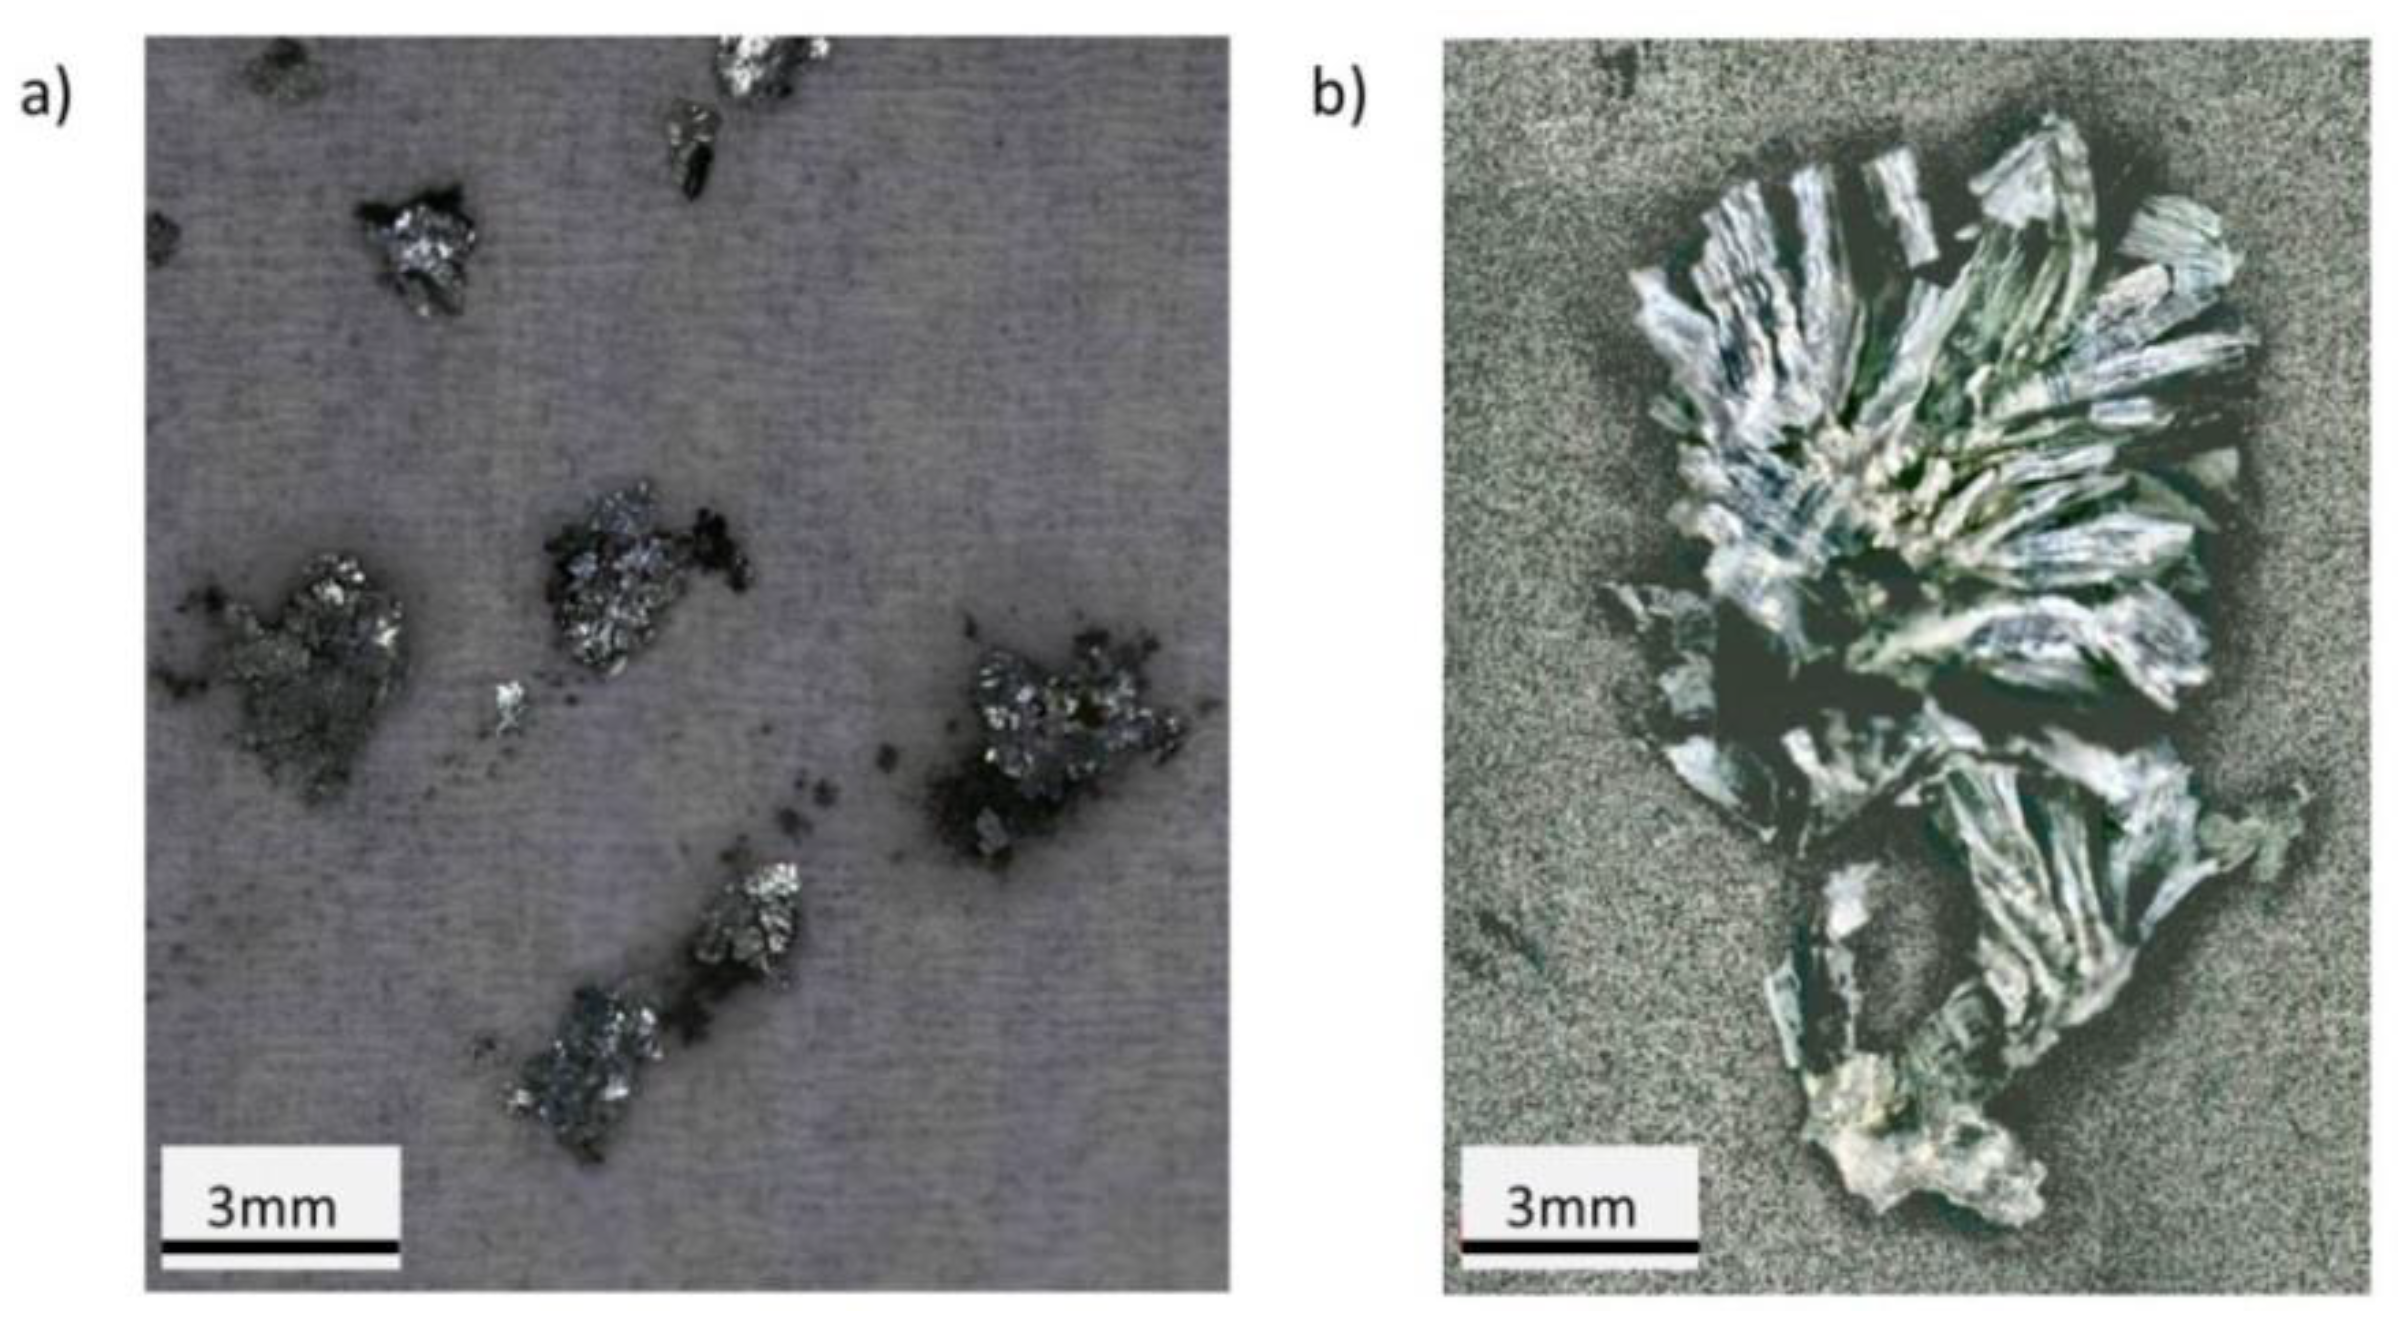
4.3. Characterizing the Wear Resistance of Different Experiments

After determining tool life spans, the predicted wear resistances of the three tested tools were characterized by the parameter specific wear force F V ˜ , which is described in Equation (1). The calculated parameters and the specific wear force are summarized in Table 6. The “Contact Stress” in the table was determined by the numerical results of the maximal contact stress of BH1 (Pos.2 in Figure 20) and Die1 (Pos. 3 in Figure 20) based on the three-dimensional model shown in Figure 21. The penetration z depended on mechanical properties such as hardness and surface roughness of tool and sheet metal and was determined according to the procedure described in [22,23]. This procedure was based on the statistical method for determining the overlap height of surface asperities [24]. The calculated specific wear force of the failed tools in Table 6 and its life span are illustrated in the wear resistance characteristic curve, shown in Figure 26. In this research, the reproducibility of the wear resistance analysis was not investigated.
According to Figure 23d, the strain-induced surface roughening of the sheet at Die 1 (Pos. b) is higher than that on NH1 (Pos. a). However, from the result of the calculated penetration z, the difference of the strain-induced roughening did not lead to a significant difference in the penetration depth z, which neither led to a significant difference in the specific wear force. This can be explained by the hardness difference between the tool and the sheet metal. Based on this similarity, it can be concluded that strain-induced roughening had a minor effect on wear resistance.
Regarding Figure 26, it can be seen that for similar tool materials with different hardness like EN-GJS-700-2 (HRC 58) and EN-GJS-700-2 (HRC 48), the higher specific wear force resulted in a lower wear resistance. Although the different types of tools 1.2379 (HRC 58) and EN-GJS-700-2 (HRC 58) had a similar specific wear force, the life span was significantly different.
For the explanation of this observation, the powdering effect mentioned in Section 4.2 is seen as the main reason. Due to the strain as a result of bending, the particles were formed. Figure 27 shows the size of abraded particle size from the experiment of nodular iron EN-GJS-700-2 and cold working steel 1.2379. It is obvious that the diameter of the particles from the experiment with the cold working steel was about six times larger than that form the experiment with the nodular iron. Bayer states that the small particles in combination with the lubricant built a so-called tribo-film, which was beneficial to friction behavior and wear resistance of the tribological system [40]. On the contrary, the penetration of the large particles into the tribological system led to a change in the contact stress distribution. In addition, it was difficult for the big particles to escape from the tribological system which led to an accumulation of particles inside the contact area. That explains why the tool of nodular iron showed a higher wear resistance than that of cold working steel at similar specific wear force. Moreover, the changing of contact stress distribution as a result of particle accumulation could explain the emergency of severer wear mark on the exit side (Pos. 2) compared to the critical contact area on Pos. 1 of Die 1 (see Figure 25a).
For interpreting the reason of different size of particles, the surface topographies of wear mark on positions where severe adhesive wear occured (Pos. 2 on nodular iron and Pos. 3 on cold working steel according to Figure 20) are illustrated in Figure 28. It is obvious that a pitting was formed as a result of the extreme stress on both kinds of tools. From the 2d profile of the pitting (see Figure 28c,f), it can be found that a bulge was formed before the pitting with a height of about 6µm, which corresponded to micro ploughing of the tool surface. The bulge led to a cutting on the sheet metal with galvanized coating and a formation of particles with large size. On the contrary, small particles were formed, since no such bulge was formed according to the surface topography of nodular iron. Moreover, the depth of pitting on cold working steel was higher than on nodular iron. These different types of 2d profile and the depth of pitting can be explained by plasticity theory of Gahr, who shows that the section of wear groove is composed of three parts, the groove and two bulges. The area of the bulge is determined by the plasticity of the material. For brittle material, the size of the bulge is small, while for ductile material the bulge size is higher [41]. According to this theory, a bulge is formed on the surface of tool made by ductile cold working steel, which cuts the galvanized coating of the sheet metal and forms the particle with larger size.
Summarizing all the evidence revealed in this section, it can be concluded that strain-induced surface roughening had little effect on the wear resistance of the tribological system. On the contrary, the abrasion particles caused by strain, especially bending and unbending, were the main influence on the wear resistance of the tool. Moreover, the plasticity of the tool material also played an important role in determining the size of the particle from the sheet metal.

5. Conclusions

In this paper, several new approaches to characterize the strain-induced surface roughening on the tribological behavior are discussed. First, a method to predict the strain-induced surface roughening on sheet metal by FEM simulation is proposed and different states of strain on roughening are calculated. The simulative results of roughness after uniaxial drawing show a good agreement with the validated results after uniaxial drawing.
After introducing the prediction of surface roughening, the influence of strain-induced surface roughening on the frictional behavior is discussed. In addition to COF measurements, the surface changes as a result of friction are evaluated by roughness measurement and surface images by a transparent toolset. The strain-induced surface changes generally cause a COF increase, which is mainly caused by the simultaneous increase of peak height Rp and valley depth Rv due to the pre-straining according to the roughness measurement. The increase of valley depth Rv provides more space for lubricant deposition, which leads to a lack of lubricant in the peak area and worsens the friction condition. Through the optical measurement, a change in the surface distribution and the reduced portion of the real contact area is observed, which explains the deterioration of the friction behavior.
In the last section, the influence of pre-straining on wear is also discussed using strip drawing tests with draw bead geometry, where a strain difference between the both sides of the sheet is observed according to the numerical simulation. It can be concluded that this strain difference has a minor effect on the wear behavior, while the strain-induced particle detachment entering the tribological system is the main influencing factor on the wear resistance after powder accumulation.
The results of this research provide information on the factors influencing friction and wear. To minimize the influence, various measures such as inline monitoring of the lubricant quantity as well as the removal of galvanized particles from sheet metal during the manufacturing process help to minimize the negative effects of strain-induced surface changes. With the application of such measures, the efficiency of manufacturing can be optimized to increase the life span of forming tools.

Author Contributions

V.R. developed the numerical methodology, deployed and supervised the experiments of Section 2. Y.W. designed the transparent toolset and deployed the friction test of Section 3. Y.W. was responsible for the result evaluation through roughness measurement and image processing of Section 3. Y.W. was responsible for the numerical computing of the strain distribution of draw bead toolsets. Y.W. designed and evaluated the wear test with draw bead geometry. Y.W. wrote the paper. Y.W., P.G. and V.R. were responsible for reviewing and revising the paper. P.G. contributed the experimental facilities and tools. All authors have read and agreed to the published version of the manuscript.

Funding

This research was funded by LOEWE—“Landes-Offensive zur Entwicklung Wissenschaftlich-ökonomischer Exzellenz, Förderlinie 3: KMU-Verbundvorhaben” (State Offensive for the Development of Scientific and Economic Excellence) in the framework of “Hessen Modell Projekte”, grant number 652/18-75.

Data Availability Statement

The data presented in this study are available on request from the corresponding author.

Acknowledgments

The authors wish to thank the project partners Filzek TRIBOtech and Opel Automobile GmbH for supporting the project. In additional, the thank goes to Marcel Moghadam of Technical University of Denmark, who offered valuable technical and academic support in wear test with draw bead geometry.

Conflicts of Interest

The authors declare no conflict of interest.

References

  1. Birkert, A.R.; Haage, S.; Straub, M. Umformtechnische Herstellung Komplexer Karosserieteile: Auslegung von Ziehanlagen; Springer: Berlin/Heidelberg, Germany, 2013; ISBN 978-3-642-34670-5. [Google Scholar]
  2. Grabner, J.; Nothhaft, R. Konstruieren von Pkw-Karosserien: Grundlagen, Elemente und Baugruppen, Vorschriftenübersicht, Beispiele mit CATIA V4 und V5, 3., erw. Aufl.; Springer: Berlin, Germany, 2006; ISBN 978-3-540-32955-8. [Google Scholar]
  3. Tschätsch, H. Metal Forming Practise: Processes, Machines, Tools; Springer: Berlin, Germany, 2006; ISBN 9783540332169. [Google Scholar]
  4. Christiany, M.; Groche, P. Reproducibility of wear tests and the effect of load on tool life in sheet metal forming. Adv. Mater. Res. 2014, 1018, 293–300. [Google Scholar] [CrossRef]
  5. Popov, V.L. Contact Mechanics and Friction; Springer: Berlin/Heidelberg, Germany, 2010; ISBN 1282836994. [Google Scholar]
  6. Thomson, P.F.; Nayak, P.U. The effect of plastic deformation on the roughening of free surfaces of sheet metal. Int. J. Mach. Tool Des. Res. 1980, 20, 73–86. [Google Scholar] [CrossRef]
  7. Ludwig, M. Advanced friction model for cold forging processes. In Metal Forming; Wiley-VCH Verlag GmbH & Co.: Weinheim, Germany, 2012; pp. 1003–1006. [Google Scholar]
  8. Raabe, D.; Sachtleber, M.; Weiland, H.; Scheele, G.; Zhao, Z. Grain-scale micromechanics of polycrystal surfaces during plastic straining. Acta Mater. 2003, 51, 1539–1560. [Google Scholar] [CrossRef]
  9. Walner, E. Gläzende Perspektiven ThyssenKrupp Steel Europe Präsentiert Innovative Oberflächen für Beste Lackierung. 2013. Available online: https://www.pressebox.de/inaktiv/thyssenkrupp-steel-europe-ag/Glaenzende-Perspektiven/boxid/637671 (accessed on 1 March 2021).
  10. Love, J.C.; Smith, G.F.; Pharaoh, M.; Coates, R. Orange peel: Who cares? Proc. Inst. Mech. Eng. Part D J. Automob. Eng. 2001, 215, 1241–1244. [Google Scholar] [CrossRef]
  11. Schäfer, R. Kontaktgebundene Oberflächenwandlung Polykristalliner Blechoberflächen; Shaker: Aachen, Germany, 2008; ISBN 3832278907. [Google Scholar]
  12. Cao, S.Q.; Zhang, J.X.; Wu, J.S.; Chen, J.G. Effect of local texture on the orange peel defect in St14 steel sheet. In Materials Science Forum; Trans Tech Publications Ltd.: Freienbach, Switzerland, 2015; pp. 167–172. ISBN 087849975X. [Google Scholar]
  13. Guangnan, C.; Huan, S.; Shiguang, H.; Baudelet, B. Roughening of the free surfaces of metallic sheets during stretch forming. Mater. Sci. Eng. A 1990, 128, 33–38. [Google Scholar] [CrossRef]
  14. Kubo, M.; Nakazawa, Y.; Hama, T.; Takuda, H. Effect of Microstructure on Surface Roughening in Stretch Forming of Steel Sheets. ISIJ Int. 2017, 57, 2185–2193. [Google Scholar] [CrossRef] [Green Version]
  15. Banovic, S.W.; Foecke, T. The Effect of Microstructural Variables on the Surface Roughening of 5XXX Series Aluminum Sheet in Biaxial Tension. SAE Trans. 2002, 111, 181–188. [Google Scholar]
  16. Furushima, T.; Hirose, Y.; Tada, K.; Manabe, K.-I. Development of Compact Marchiniak Testing Apparatus for In-situ Microscopic Observation of Surface Roughening. Procedia Eng. 2017, 207, 1946–1951. [Google Scholar] [CrossRef]
  17. Filzek, J. Kombinierte Prüfmethode Für Das Reib-, Verschleiß-Und Abriebverhalten Beim Tief-Und Streckziehen; Zugl.: Darmstadt, Germany; Shaker: Aachen, Germany, 2004; ISBN 383223523X. [Google Scholar]
  18. Azushima, A.; Kudo, H. Direct Observation of Contact Behaviour to Interpret the Pressure Dependence of the Coefficient of Friction in Sheet Metal Forming. CIRP Ann. 1995, 44, 209–212. [Google Scholar] [CrossRef]
  19. Bech, J.; Bay, N.; Eriksen, M. Entrapment and escape of liquid lubricant in metal forming. Wear 1999, 232, 134–139. [Google Scholar] [CrossRef]
  20. Staeves, J.; Schmoeckel, D. Topography of sheet metal and its relationship to the tribological behaviour during the forming process. In Proceedings of the 1st International Conference on Tribology in Manufacturing Process, Gifu, Japan, 19–23 October 1997; pp. 19–23. [Google Scholar]
  21. Trzepieciński, T.; Bochnowski, W.; Witek, L. Variation of surface roughness, micro-hardness and friction behaviour during sheet-metal forming. Int. J. Surf. Sci. Eng. 2018, 12, 119–136. [Google Scholar] [CrossRef]
  22. Wu, Y.; Groche, P. Influence of Tool Finishing on the Wear Development in Strip Drawing Tests with High Strength Steels. Tribol. Online 2020, 15, 170–180. [Google Scholar] [CrossRef]
  23. Groche, P.; Christiany, M.; Wu, Y. Load-dependent wear in sheet metal forming. Wear 2019, 422–423, 252–260. [Google Scholar] [CrossRef]
  24. Tsukizoe, T.; Hisakado, T. On the mechanism of contact between metal surfaces—The penetrating depth and the average clearance. J. Basic Eng. 1965, 87, 666–672. [Google Scholar] [CrossRef]
  25. Ghoshal, G.; Turner, J.A. Numerical model of longitudinal wave scattering in polycrystals. IEEE Trans. Ultrason. Ferroelectr. Freq. Control. 2009, 56, 1419–1428. [Google Scholar] [CrossRef] [PubMed]
  26. Zhang, K.S.; Wu, M.S.; Feng, R. Simulation of microplasticity-induced deformation in uniaxially strained ceramics by 3-D Voronoi polycrystal modeling. Int. J. Plast. 2005, 21, 801–834. [Google Scholar] [CrossRef]
  27. Zinovieva, O.; Romanova, V.; Balokhonov, R.; Zinoviev, A.; Kovalevskaya, Z. Numerical study of the influence of grain size and loading conditions on the deformation of a polycrystalline aluminum alloy. J. Appl. Math. Phys. 2014, 2, 425–430. [Google Scholar] [CrossRef] [Green Version]
  28. Panin, A.V.; Romanova, V.A.; Balokhonov, R.R.; Perevalova, O.B.; Sinyakova, E.A.; Emelyanova, O.S.; Leontieva-Smirnova, M.V.; Karpenko, N.I. Mesoscopic surface folding in EK-181 steel polycrystals under uniaxial tension. Phys. Mesomech. 2012, 15, 94–103. [Google Scholar] [CrossRef]
  29. Huang, Y. A User-Material Subroutine Incroporating Single Crystal Plasticity in the ABAQUS Finite Element Program; Harvard University: Cambridge, MA, USA, 1991. [Google Scholar]
  30. Raabe, D.; Roters, F.; Wang, Y.W. Simulation of Earing during Deep Drawing of bcc Steel by Use of a Texture Component Crystal Plasticity Finite Element Method. Mater. Sci. Forum 2005, 495–497, 1529–1534. [Google Scholar] [CrossRef]
  31. Demant, C.; Streicher-Abel, B.; Garnica, C. Industrial Image Processing: Visual Quality Control in Manufacturing, 2nd ed.; Springer: Berlin, Germany, 2013; ISBN 9783642339042. [Google Scholar]
  32. DIN German Institute for Standardization. Geometrical Product Specifications (GPS)—Surface Texture: Profile Method—Terms, Definitions and Surface Texture Parameters; Beuth Verlag GmbH: Berlin, Germany, 1998. [Google Scholar]
  33. Hol, J.; Alfaro, M.C.; de Rooij, M.B.; Meinders, T. Advanced friction modeling for sheet metal forming. Wear 2012, 286, 66–78. [Google Scholar] [CrossRef] [Green Version]
  34. Groche, P.; Christiany, M. Evaluation of the potential of tool materials for the cold forming of advanced high strength steels. Wear 2013, 302, 1279–1285. [Google Scholar] [CrossRef]
  35. Archard, J. Contact and rubbing of flat surfaces. J. Appl. Phys. 1953, 24, 981–988. [Google Scholar] [CrossRef]
  36. Groche, P.; Wu, Y. Inline observation of tool wear in deep drawing with thermoelectric and optical measurements. CIRP Ann. 2019, 68, 567–570. [Google Scholar] [CrossRef]
  37. Moghadam, M.; Nielsen, C.V. Limits of Lubrication in Severe Stamping Operations; Technical University of Denmark: Copenhagen, Denmark, 2019. [Google Scholar]
  38. Rangarajan, V.; Jagannathan, V.; Raghavan, K.S. Influence of strain state on powdering of galvannealed sheet steel. SAE Trans. 1996, 68–75. [Google Scholar] [CrossRef]
  39. Tröber, P.; Demmel, P.; Hoffmann, H.; Golle, R.; Volk, W. On the influence of Seebeck coefficients on adhesive tool wear during sheet metal processing. CIRP Ann. 2017, 66, 293–296. [Google Scholar] [CrossRef]
  40. Bayer, R.J. Mechanical Wear Fundamentals and Testing, Revised and Expanded; CRC Press: Boca Raton, FL, USA, 2004; ISBN 0203021797. [Google Scholar]
  41. Gahr, K.H.Z. Modelling of two-body abrasive wear. Wear 1988, 124, 87–103. [Google Scholar] [CrossRef]
Figure 1. Procedure for three-dimensional polycrystalline modeling.
Jmmp 05 00029 g001
Figure 2. (a) Grain structure of polycrystalline material (DX56) with grain orientation determined through electron backscatter diffraction (EBSD); (b) specified grain orientation of numerical model in the surface layer with schematic illustration of the orientations with regard to the surface normal (SN) (RD: rolling direction; TD: transverse direction).
Jmmp 05 00029 g002
Figure 3. (a) Boundary conditions of the numerical model; (b) evaluated states of strain.
Jmmp 05 00029 g003
Figure 4. Illustration of the displacement in x-axis at 6% strain in x-direction.
Jmmp 05 00029 g004
Figure 5. Surface roughening by 5% strain of five different states of strain.
Jmmp 05 00029 g005
Figure 6. Comparison between the experimentally obtained surface roughening and the numerically predicted results (evaluation at 5% strain).
Jmmp 05 00029 g006
Figure 7. (a) Strain-induced surface roughening of coated and uncoated DC06 sheet; (b) strain-induced surface roughening of coated and uncoated HX340LAD sheet.
Jmmp 05 00029 g007
Figure 8. Derived calculated factors for both materials by three different pre-straining.
Jmmp 05 00029 g008
Figure 9. (a) Overview: combined strip drawing test; (b) schematic illustration of the camera system for the surface observation; (c) cross section of tools; (d) investigated test surface and tool geometry.
Jmmp 05 00029 g009
Figure 10. Positions of tactile roughness measurements of the sheet metal after a strip drawing test.
Jmmp 05 00029 g010
Figure 11. Coefficient of friction with variation of sliding velocity and pre-straining by contact stress of 2.5 MPa; (a) material DC06 with electrolyte galvanized coating; (b) material HX340LAD with galvanized coating.
Jmmp 05 00029 g011
Figure 12. Coefficient of friction for different contact pressures and pre-straining considering a constant sliding velocity of 50 mm/s (a) Material DC06 with electrolyte galvanized coating (b) Material HX340LAD with galvanized coating.
Jmmp 05 00029 g012
Figure 13. Surface roughness of different pre-straining with variable sliding speed under a pressure of 2.5 MPa (a) Rz, (b) Rp, (c) Rv of the surface DC06; surface roughness (d) Rz, (e) Rp, (f) Rv of the surface HX340LAD.
Jmmp 05 00029 g013
Figure 14. Visualization of the thickness measurement of galvanized layer of (a) DC06; (b) HX340LAD; (c) evaluation in diagram.
Jmmp 05 00029 g014
Figure 15. Surface roughness of different pre-straining with variable contact pressure under sliding speed 50 mm/s (a) Rz, (b) Rp, (c) Rv of the surface DC06; Surface roughness (d) Rz, (e) Rp, (f) Rv of the surface HX340LAD.
Jmmp 05 00029 g015
Figure 16. Procedure of the image processing of surface characteristic.
Jmmp 05 00029 g016
Figure 17. Real contact area (white) in a region of 4 mm × 4 mm of the test with 7.5 MPa contact stress and 50 mm/s sliding speed; (a) DC06 with 0% pre-straining; (b) DC06 with 5% pre-straining; (c) DC06 with 10% pre-straining; (d) HX340LAD with 0% pre-straining; (e) HX340LAD with 5% pre-straining; (f) HX340LAD with 100% pre-straining.
Jmmp 05 00029 g017
Figure 18. Portion of real contact area with variable sliding speed under the pressure 2.5MPa: (a) DC06; (b) HX340LAD.
Jmmp 05 00029 g018
Figure 19. Portion of real contact area with variable contact stress under the sliding speed 25mm/s: (a) DC06; (b) HX340LAD.
Jmmp 05 00029 g019
Figure 20. Draw bead geometry for strip drawing tests (BH = blank holder; DB = Draw bead).
Jmmp 05 00029 g020
Figure 21. (a) Three-dimensional model for calculating the strain distribution in the wear test with draw bead geometry with boundary conditions (after drawing the sheet 40 mm in drawing direction); (b) flow stress of DP600 at room temperature.
Jmmp 05 00029 g021
Figure 22. The evaluated paths for strain distribution on the sheet metal.
Jmmp 05 00029 g022
Figure 23. (a) Numerical calculated strain in x-direction regarding normalized s; (b) numerical calculated strain in z-direction regarding normalized s; (c) maximal strain states on top and bottom side (top side: Pos.a; bottom side: Pos.b; (d) surface roughness Sz at Pos.a and b according to 3d surface scanning through µSurf.
Jmmp 05 00029 g023
Figure 24. Evolution of thermoelectric current with the stroke number in strip drawing test.
Jmmp 05 00029 g024
Figure 25. Wear marks on test tools after severe wear occurrence: (a) 1.2379 with hardness HRC 58; (b) EN-GJS-700-2 with hardness HRC 58; (c) EN-GJS-700-2 with hardness HRC 48.
Jmmp 05 00029 g025
Figure 26. Wear resistance characteristic diagram of the test.
Jmmp 05 00029 g026
Figure 27. Illustration of abraded particle size of the galvanized DP600 under Zeiss microscope Smartzoom 5 (a) particles in experiment with nodular iron EN-GJS-700-2; (b) particle in experiment with cold working steel 1.2379.
Jmmp 05 00029 g027
Figure 28. (a) Surface topography; (b) Surface photo; (c) 2d profile of the wear mark on Die1 of cold working steel; (d) Surface topography; (e) Surface photo; (f) 2d profile of the wear mark on BH1 of nodular tool.
Jmmp 05 00029 g028
Table 1. Parameters of material models according to Huang et al. [29] and Raabe [30].
SymbolNomination [Unit]Value
C 11 Components of elasticity tensor [GPa]230.1
C 12 Components of elasticity tensor [GPa]134.6
C 44 Components of elasticity tensor [GPa]116.6
h 0 Initial system hardening module [MPa]180
τ s saturation shear stress [MPa]148
τ 0 Initial shear stress [MPa]16
a ˙ Reference   strain   rate   [ s 1 ]0.05
n a Stress sensibility exponent [-]10
q v k Coplanar hardening ratio [-]1
q v n k Non-coplanar hardening ratio [-]1.4
Table 2. Boundary and contact conditions of the model.
Boundary ConditionsDescription
x = 0 For minimizing the boundary effect, three symmetry conditions are applied
y = 0
z = 0
Displacement u in x-axisAssigning the uniaxial and biaxial strain from 0% to 5% (see Figure 3b)
Displacement v in y-axis
Normal contact“Hard contact” with linear penalty contact condition (value = 1)
Tangential contactPenalty with µ = 0.1
Table 3. Test matrix for verification of the influence of sheet coating on strain-induced roughening.
Experimental Parameters
Sheet metal typeDC06HX340LAD
Pre-straining (-)5%; 10%; 20%
Galvanized   coating   amount   ( g / m 2 )75150
Table 4. Experimental parameters for strip drawing tests.
Experimental Parameters
Sheet metal typeDC06; HX340LAD
Sliding velocity (mm/s)25; 50; 75
Tool material1.2379 (X155CrVMo12-1) 58 HRC
Lubricant   amount   ( g / m 2 )2
LubricantZeller Gmelin PL61
Contact stress (MPa)2.5; 5; 7.5
Pre-straining (-)0%; 5%; 10%
Slinding length (mm)100
Table 5. Experimental parameters for the wear test.
Experimental Parameters
Sheet metal typeDP600, 50 mm width, 1.2 mm thick
Drawing Velocity (mm/s)100
Tool material1.2379 (X155CrVMo12-1) 58 HRC;
EN-GJS-700-2 (DIN EN 16482) 58 HRC;
EN-GJS-700-2 (DIN EN 16482) 48 HRC
Lubricant   amount   ( g / m 2 )2
LubricantZeller Gmelin PL61
Blank holder force (kN)30
Sliding length per stroke (mm)100
Table 6. Calculated parameters and specific wear force for wear resistance characterizing.
Description of ToolMax. Contact StressPenetration zTool HardnessSheet HardnessSpecific Wear Force
[ N / m m 2 ] [µm][HV][ N / m m 2 ] [HV][ N / m m 2 ] [ N · µ m / m m 2 ]
Pos.2 of 1.2379 with hardness HRC 584864.617562510340109582.4
Pos.3 of 1.2379 with hardness HRC 584774.8667562510340109583.95
Pos.2 of EN-GJS-700-2 with hardness HRC 584864.587562510340109582.04
Pos.3 of EN-GJS-700-2 with hardness HRC 584774.767562510340109582.12
Pos.2 of EN-GJS-700-2 with hardness HRC 484864.6865521903401095127.53
Pos.3 of EN-GJS-700-2 with hardness HRC 484774.9565521903401095128.55
Publisher’s Note: MDPI stays neutral with regard to jurisdictional claims in published maps and institutional affiliations.

