1. Introduction
In Additive Manufacturing (AM) using Directed Energy Deposition (DED) process like Laser Metal Deposition (LMD) it is necessary to keep the process stable in terms of the deposition rate, layer height, and powder efficiency, to avoid imperfections and accumulation of deposited material in certain areas, so it is necessary to adjust process parameters, the drives and the kinematic itself, as well as the powder feeding/delivery system. Optimizing the process for small laser spot and thin walls is a challenge. In this adjustment process, the use of the recorded data via OPC-UA and its interpretation are of utmost importance to achieve the stability of the deposition process and to correct potential defects.
According to ISO/ASTM 52900 standard [
1], DED is the AM process in which focused thermal energy is used to fuse materials by melting as they are being deposited. “Focused thermal energy” means that an energy source (for example: laser, electron beam, or plasma arc) is focused to melt the materials being deposited. Under this definition, LMD is considered a laser-based DED process (LB-DED) that use a laser beam as a thermal energy source to melt the material. More in detail, the ASTM F3187 standard [
2] details the composition of DED systems, which are made up of four fundamental subcomponents: heat source, positioner (motion), feedstock feed mechanism, and a computer control system. In the case of LMD system, the motion is achieved either by moving the heat source relative to a stationary component, or moving the component relative to a stationary heat source, or a combination of these methods. Motion is typically provided in at least three orthogonal axes. Integrated motion of auxiliary axes (rotary, tilt axes), working with the main motion control axis (Cartesian gantry or 6-axis robotic arm), are typically used. In LMD systems the laser beam is conducted from the laser source to the optic head through optical fiber, and the material to be supplied is delivered by a nozzle, which can be coaxial to the beam (assembled to the optic head) or deliver the material laterally. Feedstock material can be used in this process in the form of wire or powder.
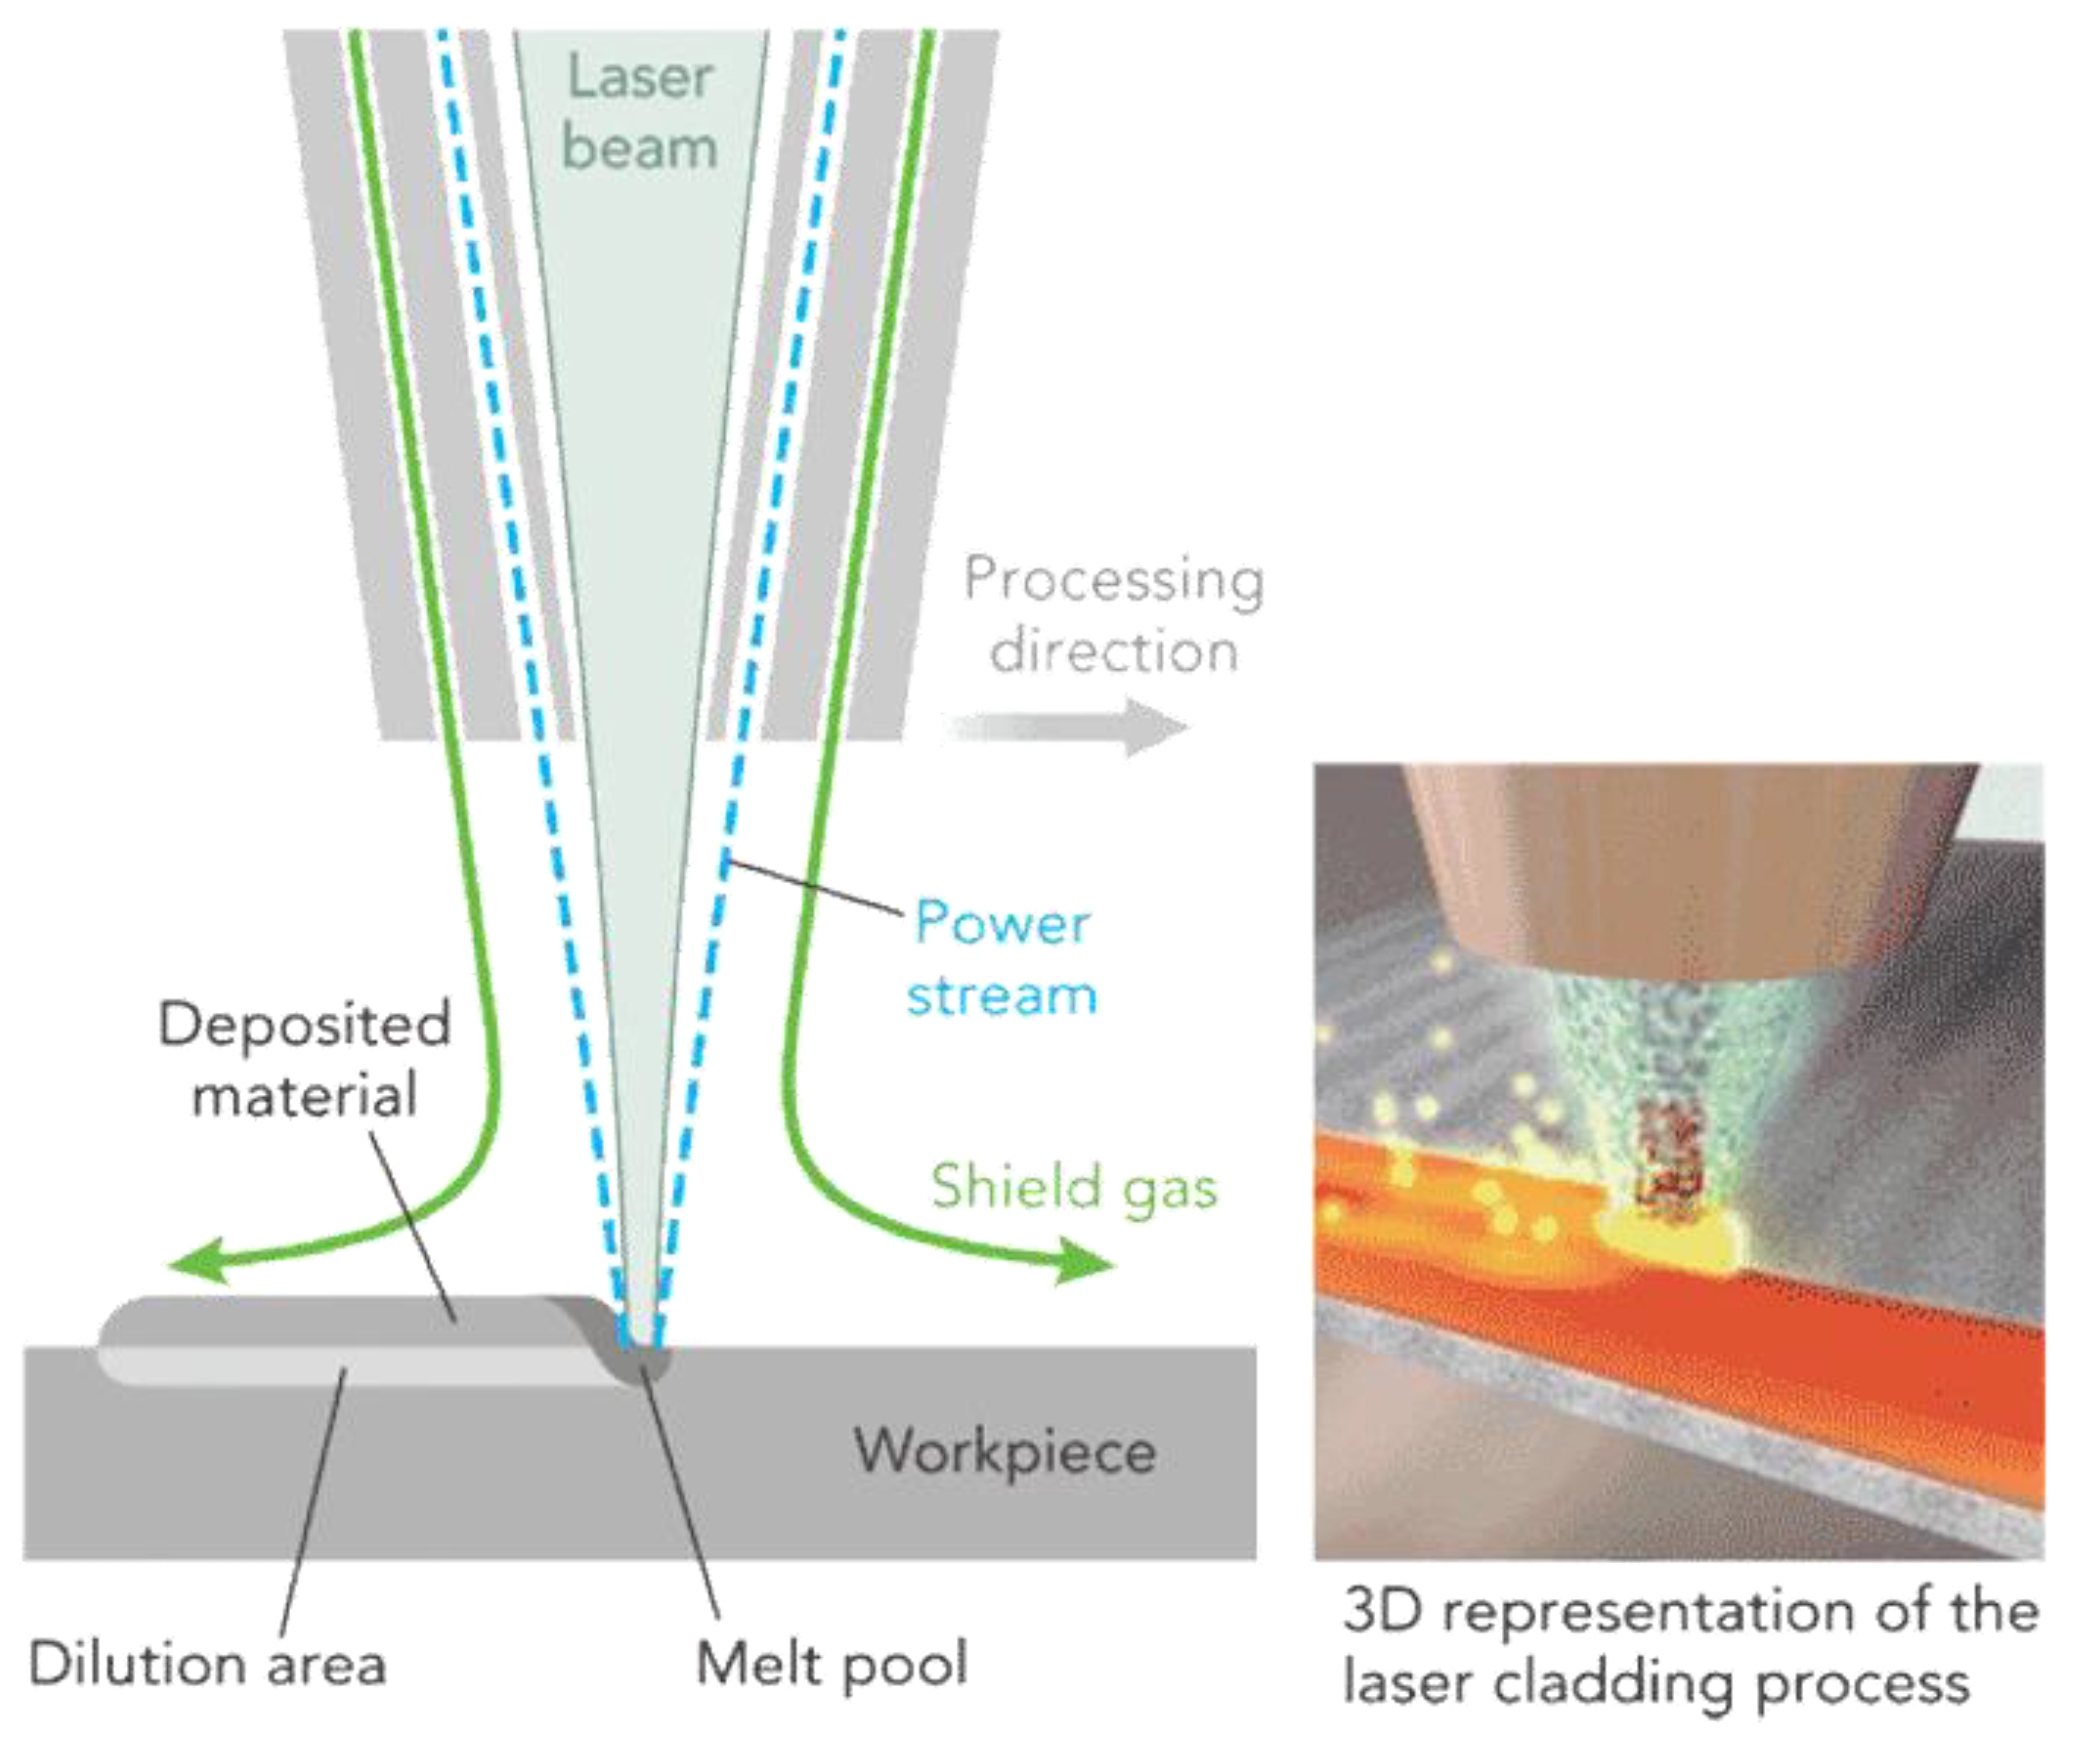
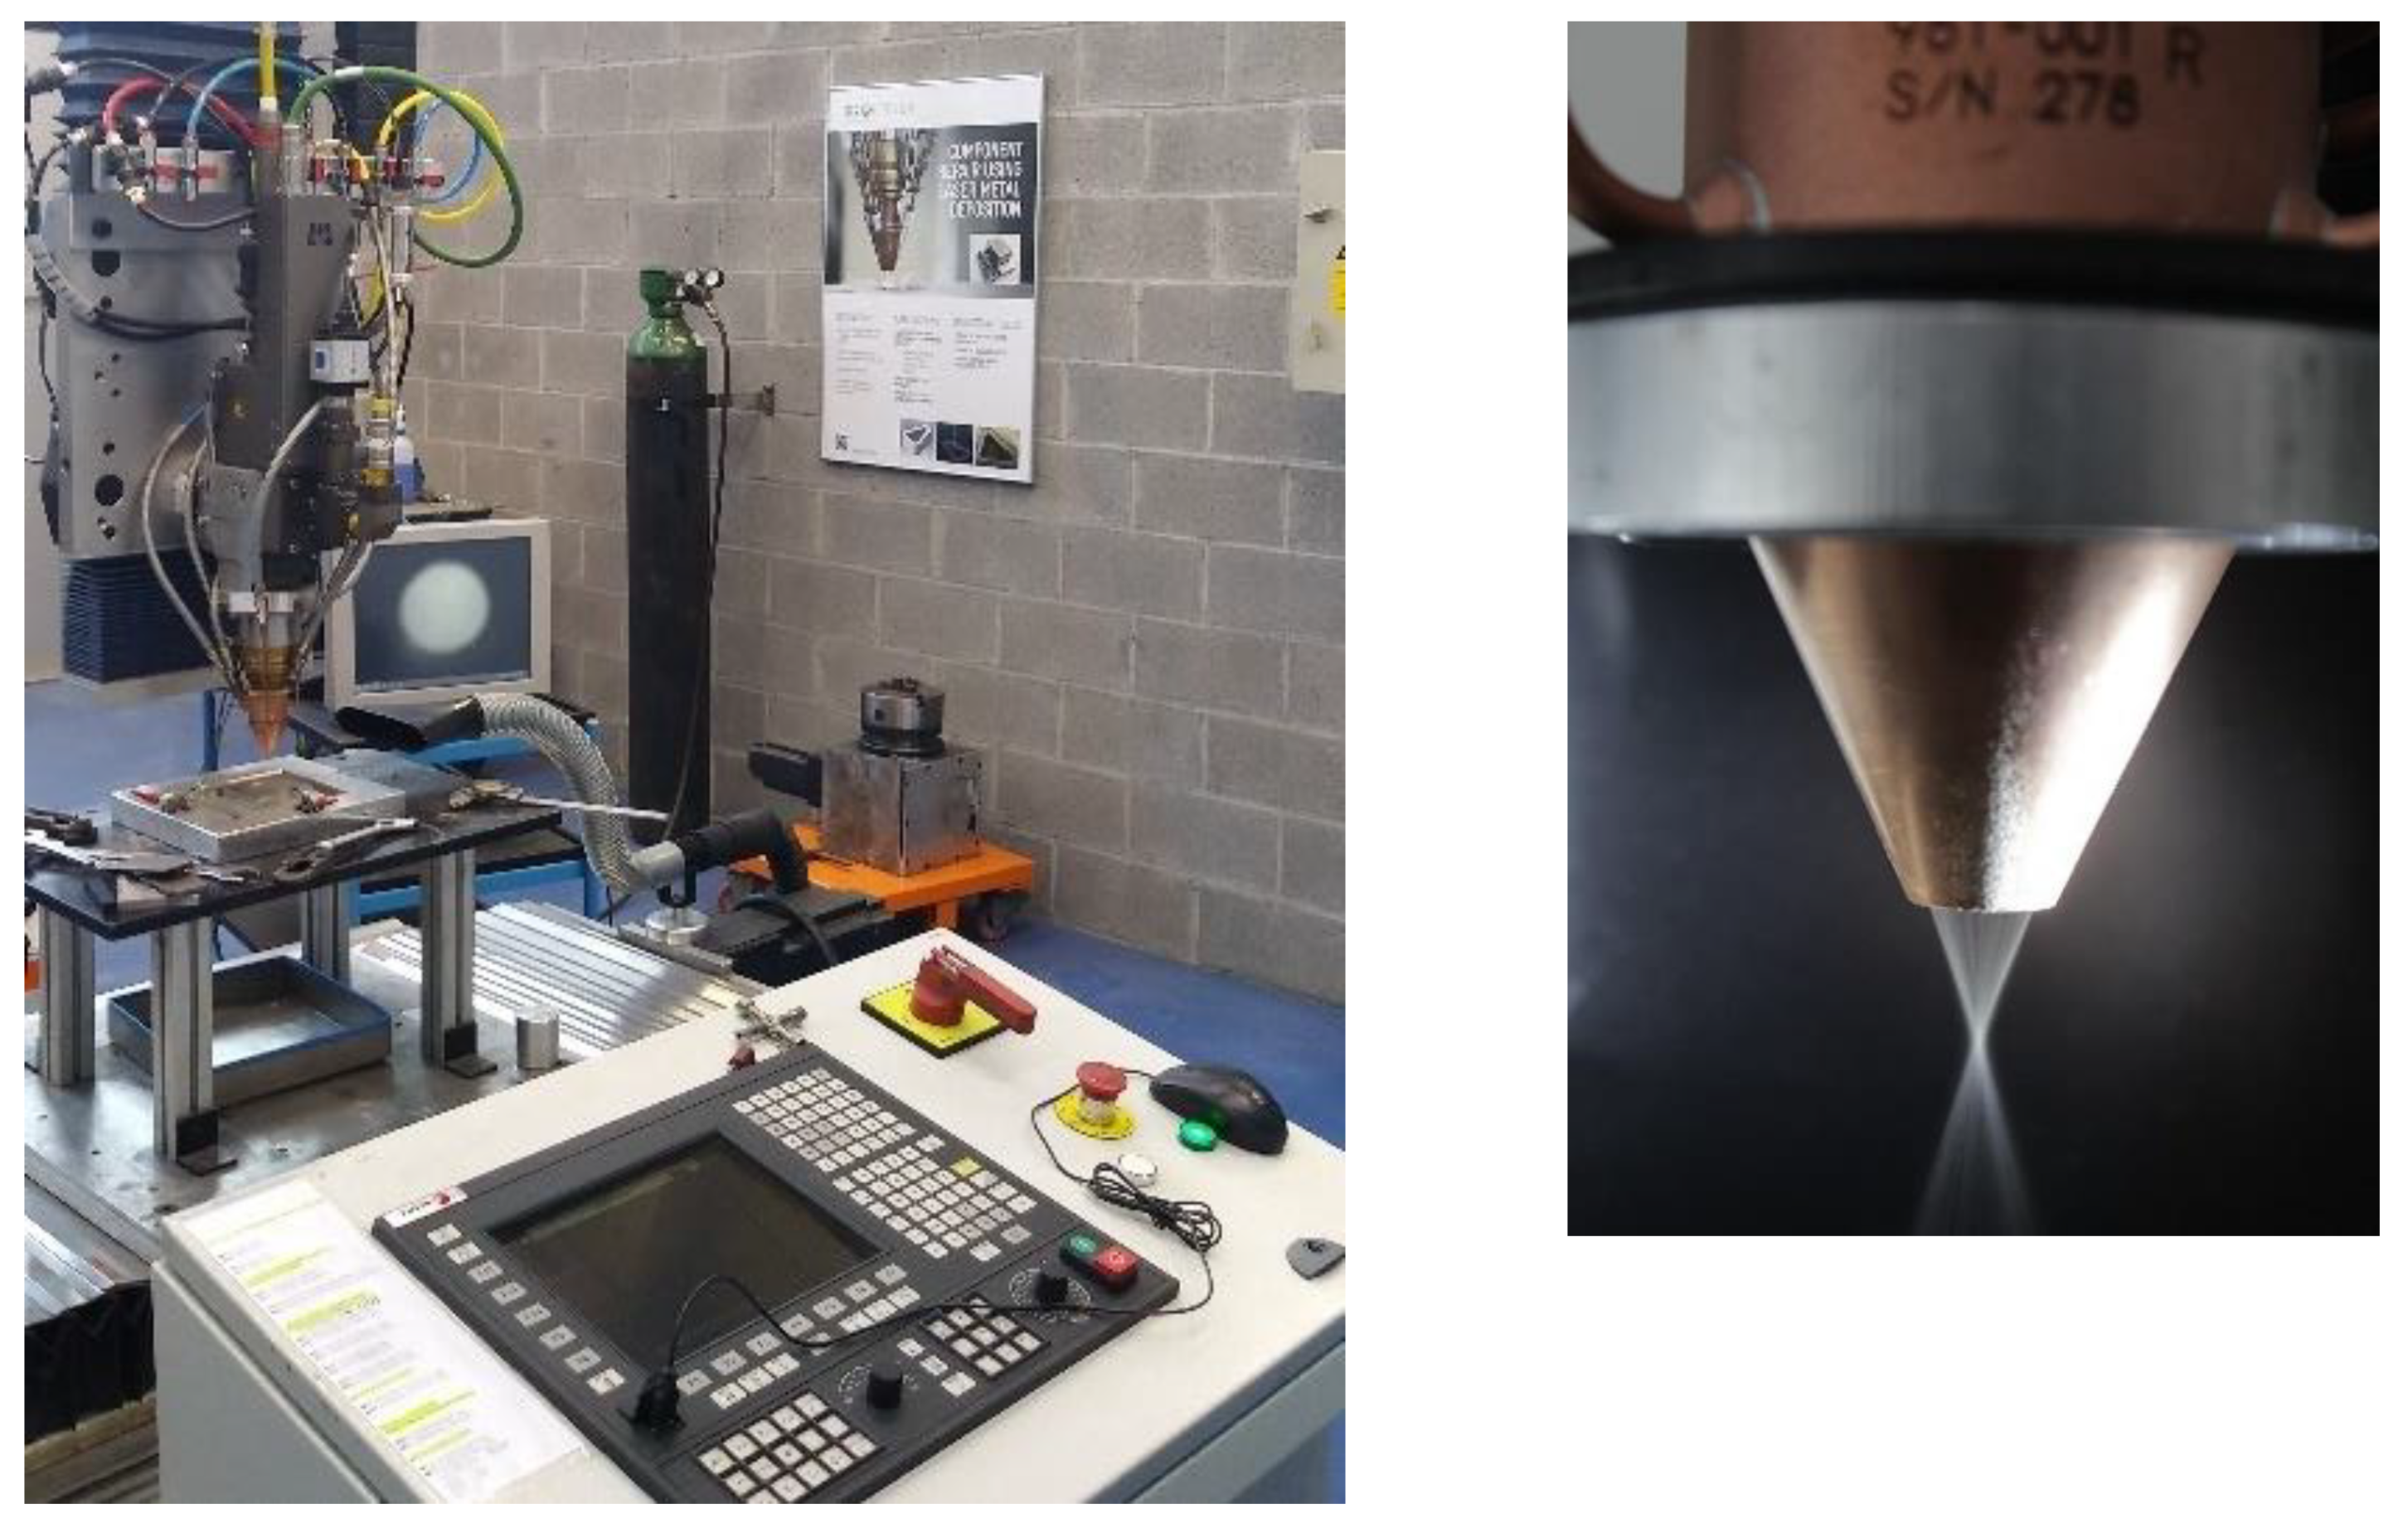
Figure 1 shows the coaxial LMD-powder process with powder as used in this work, where the nozzle, laser beam, powder stream and melt pool formation can be observed.
In the Laser Metal Deposition (LMD) process, the adjustment of the kinematics is of utmost importance in order to manufacture thin walls with abrupt changes in trajectories, as occurs in thin walls with straight corners. For the kinematic adjustment and the parameters of the deposition process it is of utmost importance to be able to monitor data from variables such as axis velocity, axis acceleration, nozzle position, size of the melt-pool, layer height, etc., and analyze them in depth to develop LMD process new optimization strategies or to apply machine learning.
Previous studies investigated the effect of the process parameters like laser power, spot diameter, scanning speed (velocity) and powder feed rate on the DED process. The influence of the main LMD process parameters on the bead geometry is well known and extensively reported for different metallic materials. The parameters window for LMD process with nickel based superalloys were studied by Zhang et al. [
4] and Davim et al. [
5], the correlations of main parameters like laser power, scanning velocity, and mass flow rate with geometrical dimensions of the bead is evident. Both authors refers that an increase of track height occurs when more laser power or more flow rate is added, on the contrary when the scanning speed is increased, the height is reduced. Moreover, the dilution zone with the substrate or remelt of precedent layer is increased with the laser power and mass flow rate. The cladding width increases with the powder mass flow rate. In particular for the deposition of IN718 alloy, Zhong et al. [
6] revealed in his studies, the particularities in the microstructure originated by LMD processing, such as small internal porosities by gas trapped in the solidified material, as well as the crystallographic texture influenced by the growth orientation of the grains and also segregations and phase precipitations highly dependent on the cooling rates. Confirming the complexity of laser processing for this material and the necessity of post-processing like hot isostatic pressing (HIP) and a solution stage plus double aging heat treatment to improve the mechanical properties.
Typical scan paths or trajectories in computer numerically controlled (CNC) Cartesian kinematics are primarily composed of linear motion segments originated by corresponding drives. The velocity is decreased in the proximity of the corner or in the change direction point in the trajectory, with a significant variation in their magnitude. This variations cause some problems in terms of precision in positioning and also in the deposition rate in this zones, the common defect is the over deposition of material and subsequent variation of layer height and track width, affecting the tolerance and can cause loss of geometric tolerances requiring additional post-processing or re-work to achieve a good geometric accuracy on the part. Some authors published interesting results developing algorithms to control the scanning-speed to generate smooth and equal-height deposition, in geometries with walls and corners [
7]. Therefore, the control method enabling the DED fabrication of an equal-height rectangular acting over bead geometry measured or predicted but only take into consideration the layer height and not the precision of the wall thickness or internal/external radii in the wall’s corner.
Others author tried to solve this problem of material accumulation during the deposition with the implementation of a closed-loop control acting on the laser power [
8] but the time response of this strategy is too high to correct the problem in corners of thin walls in real time [
9,
10]. And also the measuring of layer height and control procedure based on structured light scanning has been set up in an LMD robotic cell. The benefit of measuring and controlling the build height during the process was proved [
11], showing a more accurate reproduction of the generated geometry in solid parts when corrections are applied, but this approach need to stop the deposition process to scan and generate a three-dimensional point cloud, that requires to be processed by previously developed algorithms, which is time-consuming process and add extra time to the additive manufacturing stage.
In Cartesian kinematics, one option is to adjust the deposition rate and the acceleration/deceleration on the axes, which has a large influence on the deposition rate but also on the positioning [
12,
13,
14]. This tuning of the algorithm has been optimized thanks to FAGOR Datalogger which can register valuable data on a millisecond scale time basis. It is also capable of executing real-time data filtering in order to avoid false positives by sampling signals and applying digital IIR filters. Results obtained with this tool are useful to improve the movement of the axes while material deposition is executed. The performance of the machine can be monitored remotely by using OPC-UA, an industrial communication protocol which delivers data from machine to end user on a classic client-server architecture [
15]. This technology is widely used on industrial environments all over the world due to its openness, in-built security, scalability and information modelling. It can be considered the standard of industry 4.0 and has been the underlying technology to retrieve data from the CNC.
In this work, we have studied how to use the monitored and recorded data in a 4-axis Cartesian kinematic station with a CNC FAGOR 8070 arranged for LMD process in LORTEK. In particular, the velocity and acceleration in each axis to generate deposition strategies in 2.5D that correct the problems that currently arise when the deposition trajectory is discontinuous using constant process parameters, that is, where there are abrupt changes of direction or in sharp corners for example. The discontinuous deposition in these trajectories causes uneven deposition, leading to problems of material accumulation, variation in layer height and in some cases defects like lack of fusion and porosity in singular points/zones.
2. Materials and Methods
In this work two different alloys were used, an austenitic stainless steel (316 L) and a Nickel-based alloy (IN718). The gas atomized powders manufactured by TLS Technik GmbH & Co. Spezialpulver KG (Bitterfeld-Wolfen, Germany) have the same particles size in terms of granulometry, 45–90 μm according their specifications. The chemical composition reported by the manufacturer is showed in
Table 1.
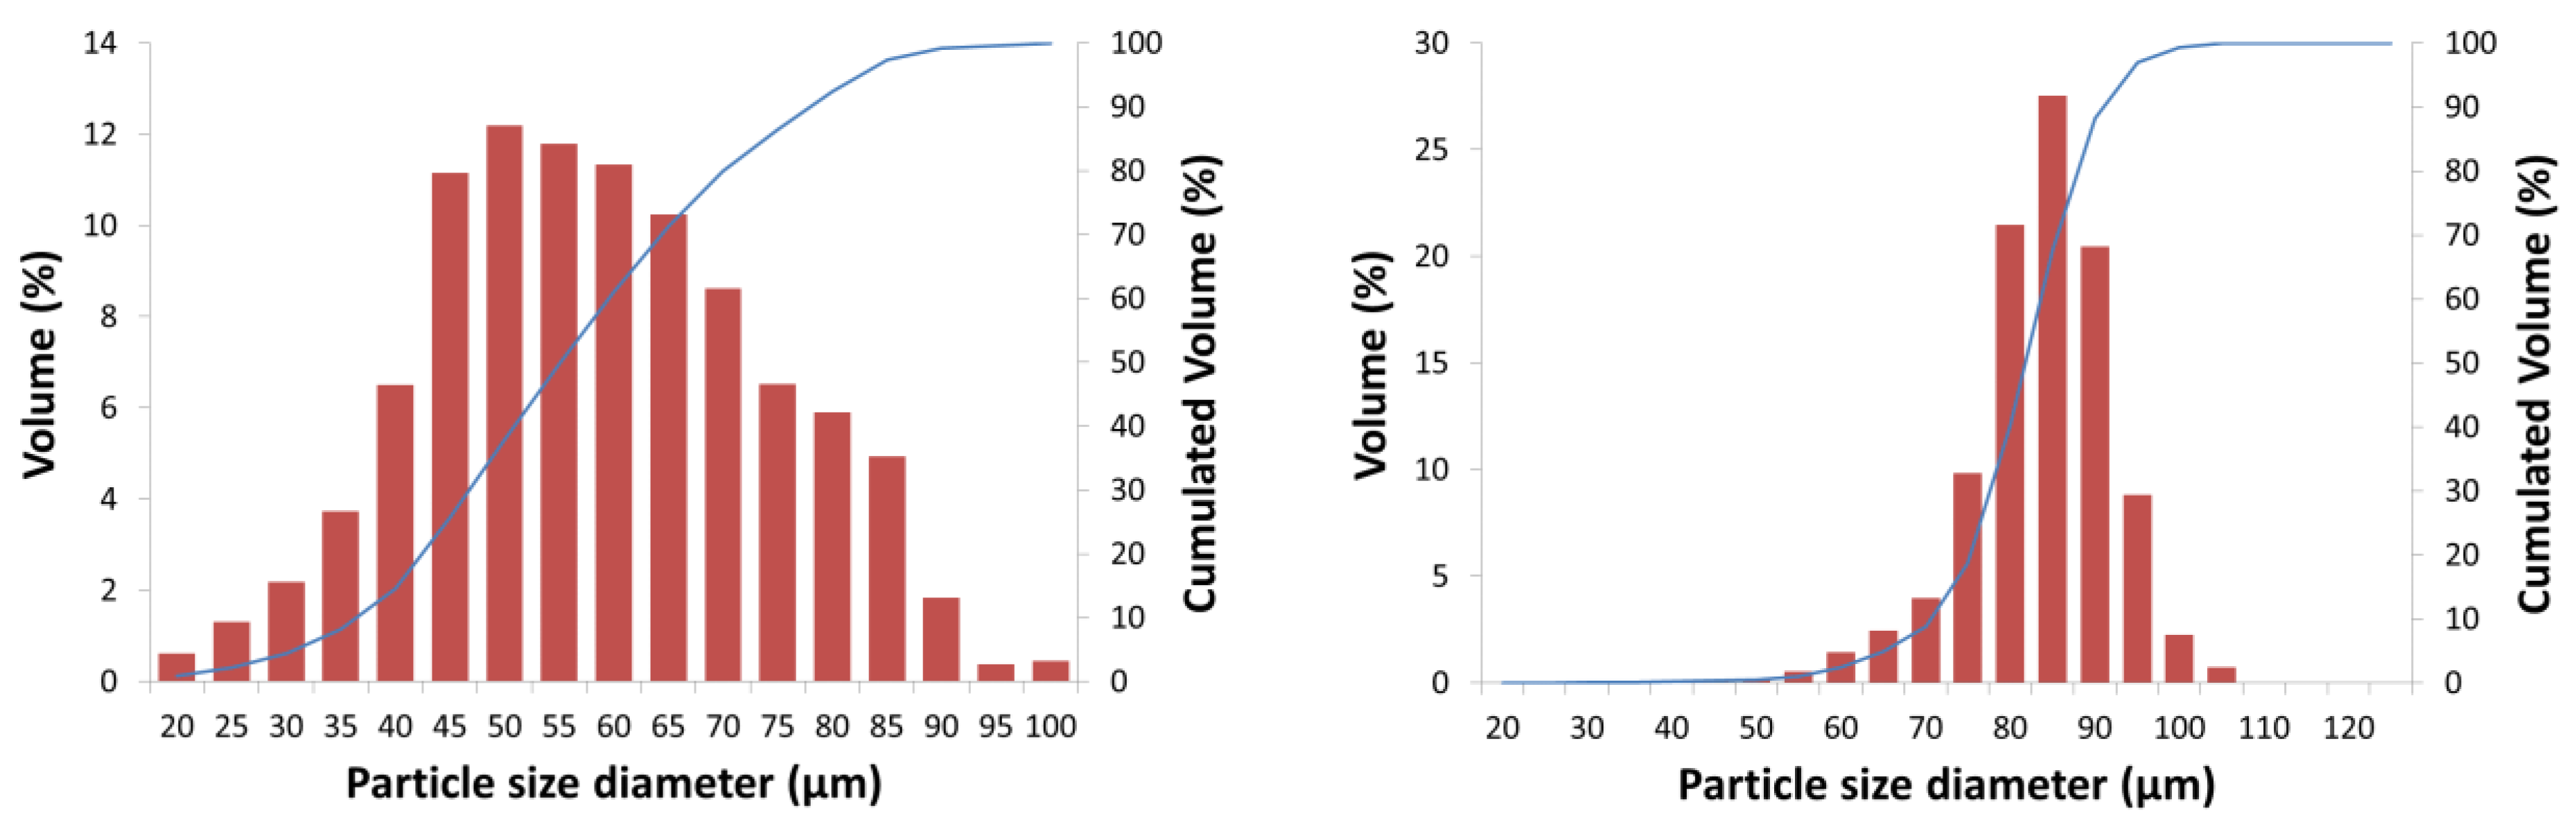
The pre-alloyed powders used as raw materials in the manufactured walls were analyzed using the SEM. The particles showed a spherical shape (
Figure 2 left), this morphology is typical of the atomization procedure in their manufacturing. After the image analysis of the particles, the results revealed that the size of the 10% in volume of the particles had a size less than 36.5 and 70.6 μm in the diameter for SS316L and IN718 powders respectively; 50% of the particles had a diameter of less than 51.1 and 81.8 μm; and a cumulative 90% volume of the powder particles had a diameter of less than 79.9 and 91.1 μm respectively. The analysis of particle shape and size distribution (diameter) in the powder shown in
Figure 2 (right) is very important for the LMD process. As can be seen, the particle size distribution for IN718 is more closed and with less range of variability than those of SS316L, a greater quantity of fine or smaller diameter particles is observed in the SS316L powder. Due to the typical powder feeder system used in directed energy deposition (DED) process, a fine-medium granulometry and regular sizes and shapes are required, and an adequate flowability of the powder determines the best powder stream in the coaxial nozzle for laser melting and deposition of the raw material.
The LB-DED system used for the LMD process was a 3-axis Cartesian kinematic station equipped with classical CNC (FAGOR 8070, Spain), see
Figure 3 (left), and a solid state laser source Nd-YAG of 3 kW (Trumpf HL-3006D, Germany) in CW mode and wavelength 1.06 μm with a spot diameter of 1.2 mm. The configuration of the LMD station include an optic head (Trumpf BEO D70, Germany) with two on-axis camera/sensor ports. For powder delivery, the LMD station has a powder feeder with two 1.5 L heated hoppers (Sulzer-Metco Twin-10C, Switzerland) and a coaxial nozzle (Coax40, manufactured by FhG ILT, Germany) was used (
Figure 3 right). Argon (8 L/min) was used as protective and carrier gas (flow at 1 bar).
The CNC gcode was obtained after post-processing of the deposition path defined in a CAM software. The program used was SKM DCAM (Germany) with an adequate post-processor for FAGOR 8070 numerical control, the thin walls were manufactured with a single track in each layer, with the same track width (and laser spot diameter). The optimized LMD process parameters for each material are compiled in
Table 2.
For microstructural evaluation, the samples were cut from walls manufactured over SS304 stainless steel plates of 10 mm thickness, and conventional metallographic preparations were made. The location for hardness indentations and microstructural evaluation was the cross section located at 15 mm before the corner on the side of the longer “L” in the thin walls. The metallographic preparation procedure followed the guidelines of ASTM E3 standard [
16]. This begins with the setting of the samples in conductive resin, and then roughing it with abrasive papers of different grit sizes, and ending with a fine polishing using polycrystalline diamond particles in an aqueous suspension. To reveal the microstructure, a chemical etch has been carried out, using a chemical reagent recommended for this type of materials according to the ASTM E407 standard [
17]. The macro and microstructural analysis was carried out using an optical microscope (OM) with an Olympus GX51 optical microscope with an image acquisition system via digital camera. Manual chemical etching was carried out with Nital at 5% for 12 s. Metallographic analysis was performed by light optical microscopy at different magnifications (from 100× to 1000×). For more advanced studies in the microstructure, a field emission scanning electron microscope (FESEM) brand Zeiss Ultra Plus model has been used, equipped with an X-ray detector from Oxford instruments (X-Max), which has allowed semi-quantitative analysis of the chemical composition of the material using the energy dispersion spectroscopy (EDS) technique. Microhardness Vickers measurements were made in an EmcoTest DuraScan durometer, using a load of 500 g (HV0.5 scale).
3. Results and Their Analysis
The initial work has been to analyze the data acquired through the platform previously developed by FAGOR Aotek and LORTEK for data acquisition and remote connectivity of the LMD station. We have started with the definition of a series of experimental tests to evaluate the influence of trajectory programming and speed/acceleration control on the quality of deposition on a straight trajectory but with a 90° corner.
Taking advantage of the algorithms integrated in FAGOR CNC systems, it is possible to tune the movements of the axes in the machine to avoid problems related to material accumulation in corners and achieve accurate geometries in an effective way. FAGOR provides by default several subroutines, so end users can configure dynamically the motion of the machine. G502 is an example of these in-built subroutines. One of the inputs to this procedure is parameter “e”, which stands for tolerance in millimeters between the points defined in part programs and the real trajectory performed by the axes. FAGOR CNC system commands the axes, so the distance between programmed position and real trajectory never exceeds the configured tolerance. Theoretically, higher tolerances make the dynamic of the machine more fluid and smooth, achieving more homogeneous material deposition in corners.
Datalogger can filter and register data on a millisecond scale time basis. Several variables are recorded simultaneously, such as axes trajectory, speed, acceleration, nominal laser power, etc. All of them can be real-time filtered individually, so unnecessary data can be removed from results. This data can be exploited remotely thanks to an industrial communication protocol compatible with FAGOR systems: OPC-UA. This technology enables a secure delivery of data between remote servers and clients, stablishing a bidirectional communication between them. While the state of the machine and its components can be monitored remotely on HTML5 webpages, data is also recorded on files, so historical statistics can be obtained through deep offline analysis of these files. As a result of these exhaustive calculations, the movement of the axes is optimized to get the correct deposition rate in every circumstance.
Using the data acquired from the CNC 3D plots of real coordinates and speed variation can be elaborated. Such approach allows an operator to monitor the process parameters and detect possible failures with 4 ms time resolution. Apart from that, the deep data analysis in both time and layer/distance domains is extremely valuable. Moreover, 3D analysis, acquisition and synchronization of the CNC kinematics data is a part of a platform for “digital twin” which will include data from both CNC and external process sensors.
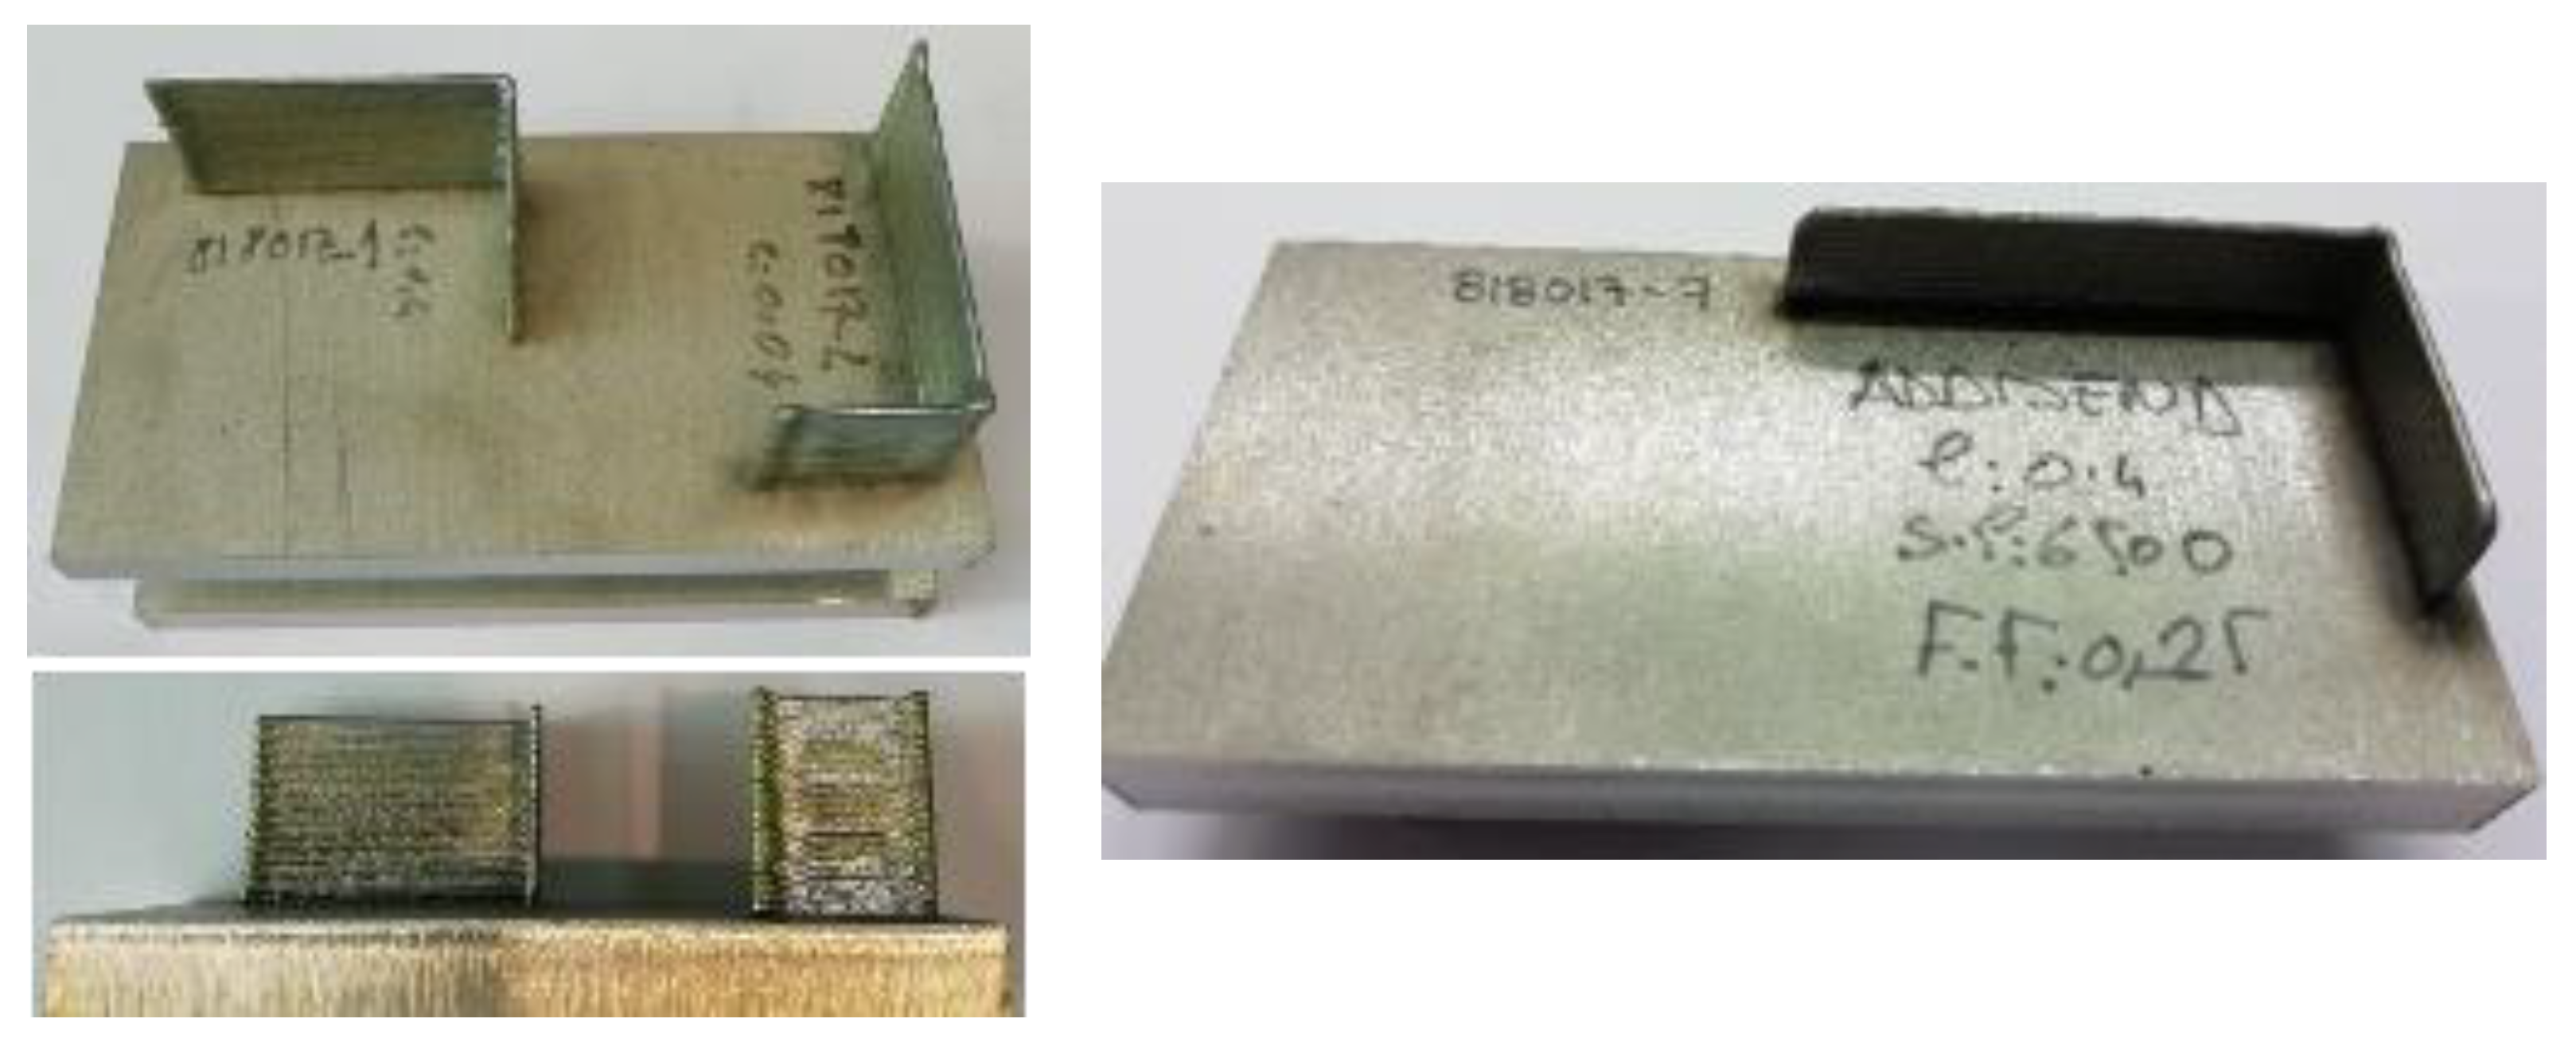
To demonstrate the analysis methodology, thin corner walls have been manufactured as semi-complex geometry demonstrators, in AISI 316L stainless steel and IN718 nickel base alloy. The thin walls are approximately 1.20 mm thick and have 50 layers for a total height of 25 mm (see
Figure 4).
3.1. Kinematic Precision Analysis
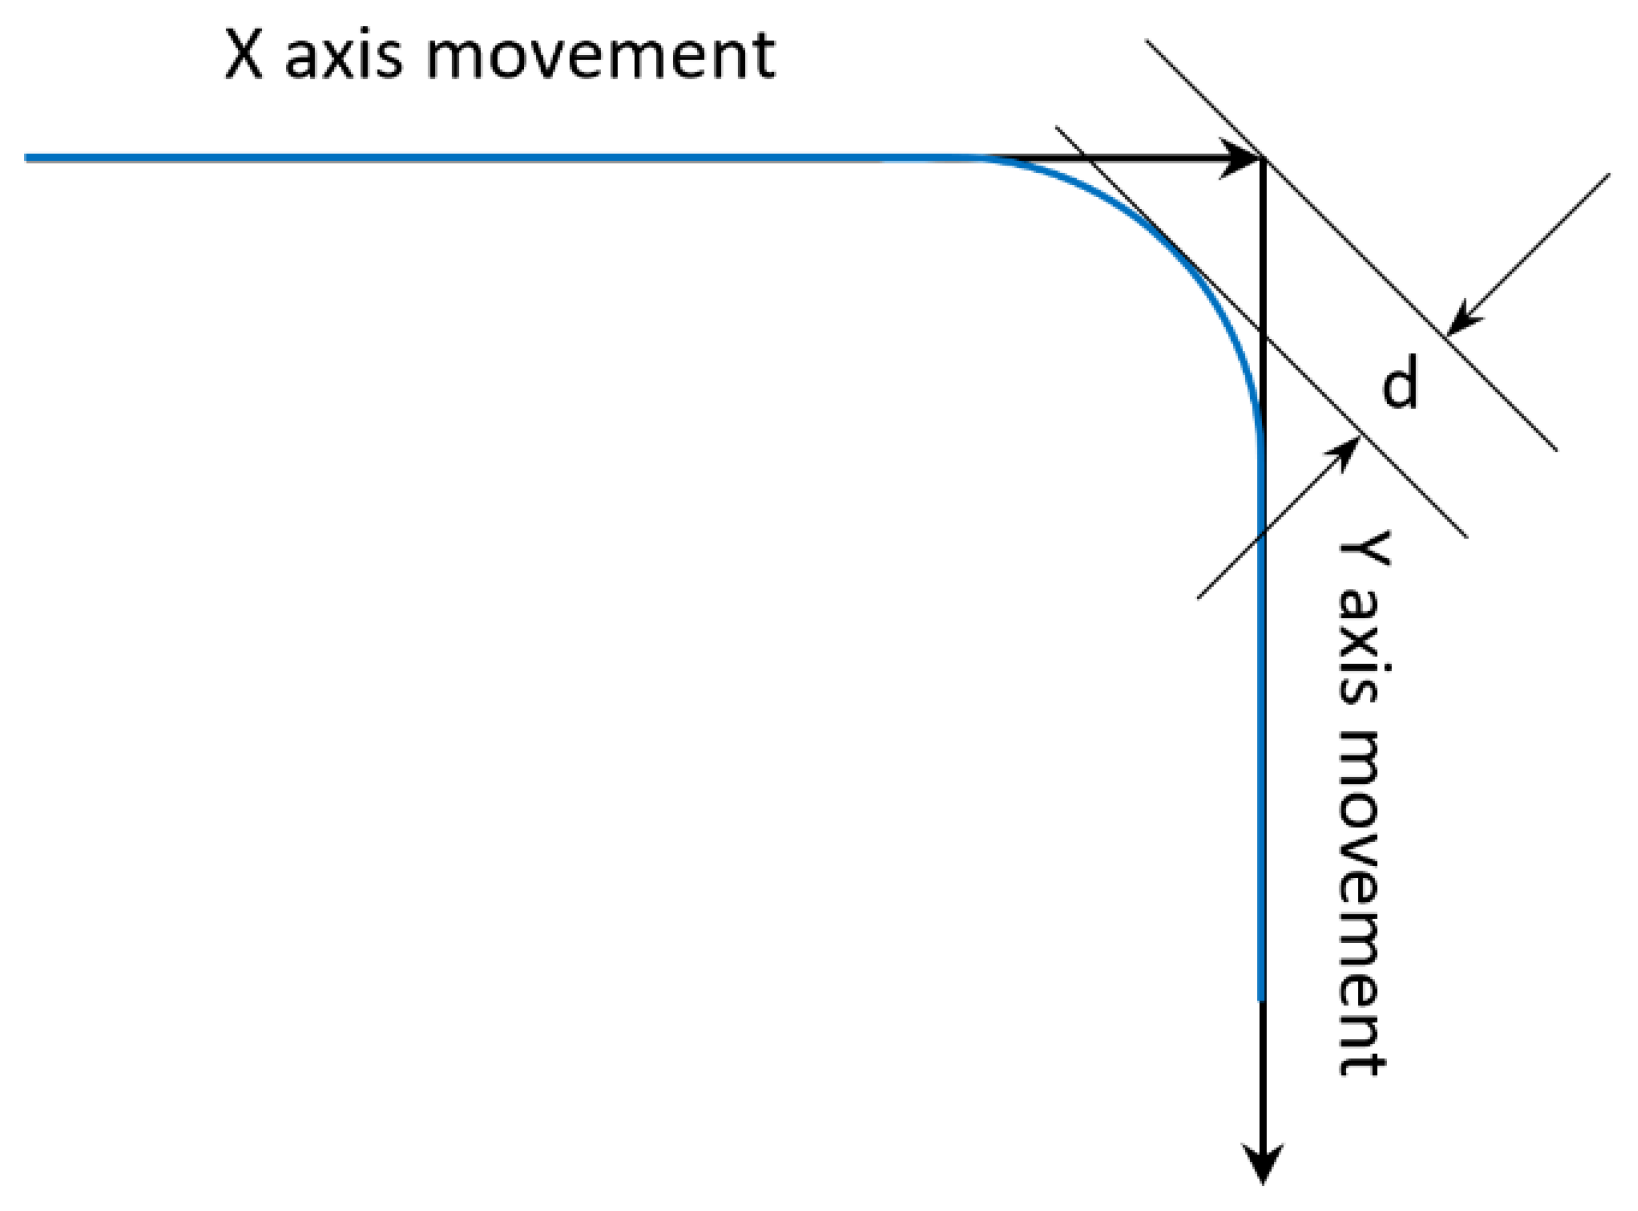
The objective here has been to analyze how the corner point is reached with the highest possible accuracy (lower d in
Figure 5), keeping the deposition rate with the least possible variation (lower %Vred). In the Cartesian CNC station, the programming parameter G502 e:X.XX related to the positioning accuracy must be adjusted, according to models or initially according to the experimental analysis. In this case its influence has been analyzed for two different programmed speeds without deposition (only kinematic movement) and recording the position, real speed and real acceleration data in each axis.
Different variables have been recorded at the LMD station through the datalogger developed by FAGOR. Three variables are of interest for this study: the speed (Speed parameter measured, Vreal) and the position in each axis (Coordinates parameters measured: PosX and PosY) as a function of time for each combination of precision in positioning. The data acquisition parameters have been following:
Measurement step (s): 8 ms
Programmed speed (v): 20 and 40 mm/s
Precision (e): 0.04, 0.1, 0.4 y 0.6 (programmed through FAGOR in-position code G502 e:X.XX)
The programmed speeds used for the motions study were selected to have a higher resolution in the acquired data and their subsequently analysis.
Figure 6 shows the registration of the positioning in the two axes (X and Y) in the proximity of the corner (programmed path for a wall in L) for the two speeds studied, using point to point programming through a linear interpolation (G01) between them. It is verified as the increase in the accuracy of the reach of the point defined as corner, the greater the distance of the path to it and therefore greater rounding will present the path at the corner.
On the other hand the speed also decreases with respect to the programmed or theoretical for greater accuracy, and it is possible to determine how much this variation is in percentage terms and also know for high speeds when the speed control begins to act (kinematic correction) and in what proximity to the corner it does. This allows, taking the considerations intrinsic to the process of DML define and adjust the accuracy for a given geometry involving changes in direction or sharp corners without circular interpolation. The speed control on the motors that move the table in the X and Y axes in FAGOR stations is considered adequate, the registration of actual speed has little variation. After graphical analysis of the speed behavior, it has been calculated the percentage reduction of speed for each accuracy and compared the results for the two speeds under study, also determining the reaction time during speed correction for each accuracy. In
Figure 7 more detail on how the speed variation occurs in the proximity of the corner is shown. The velocity variation in linear and away from the corner or start/end of the trajectory is stable with no appreciable variation.
By performing the corresponding calculations to obtain the parameter “d” defined as the distance of the curvature from the programmed corner point (or change of direction, see
Figure 5), and by calculating the speed drop in percentage terms as well as the reaction time during the speed adjustment, it is possible to analyze the kinematics accuracy.
Table 3 shows the calculated values for the FAGOR LMD station on LORTEK.
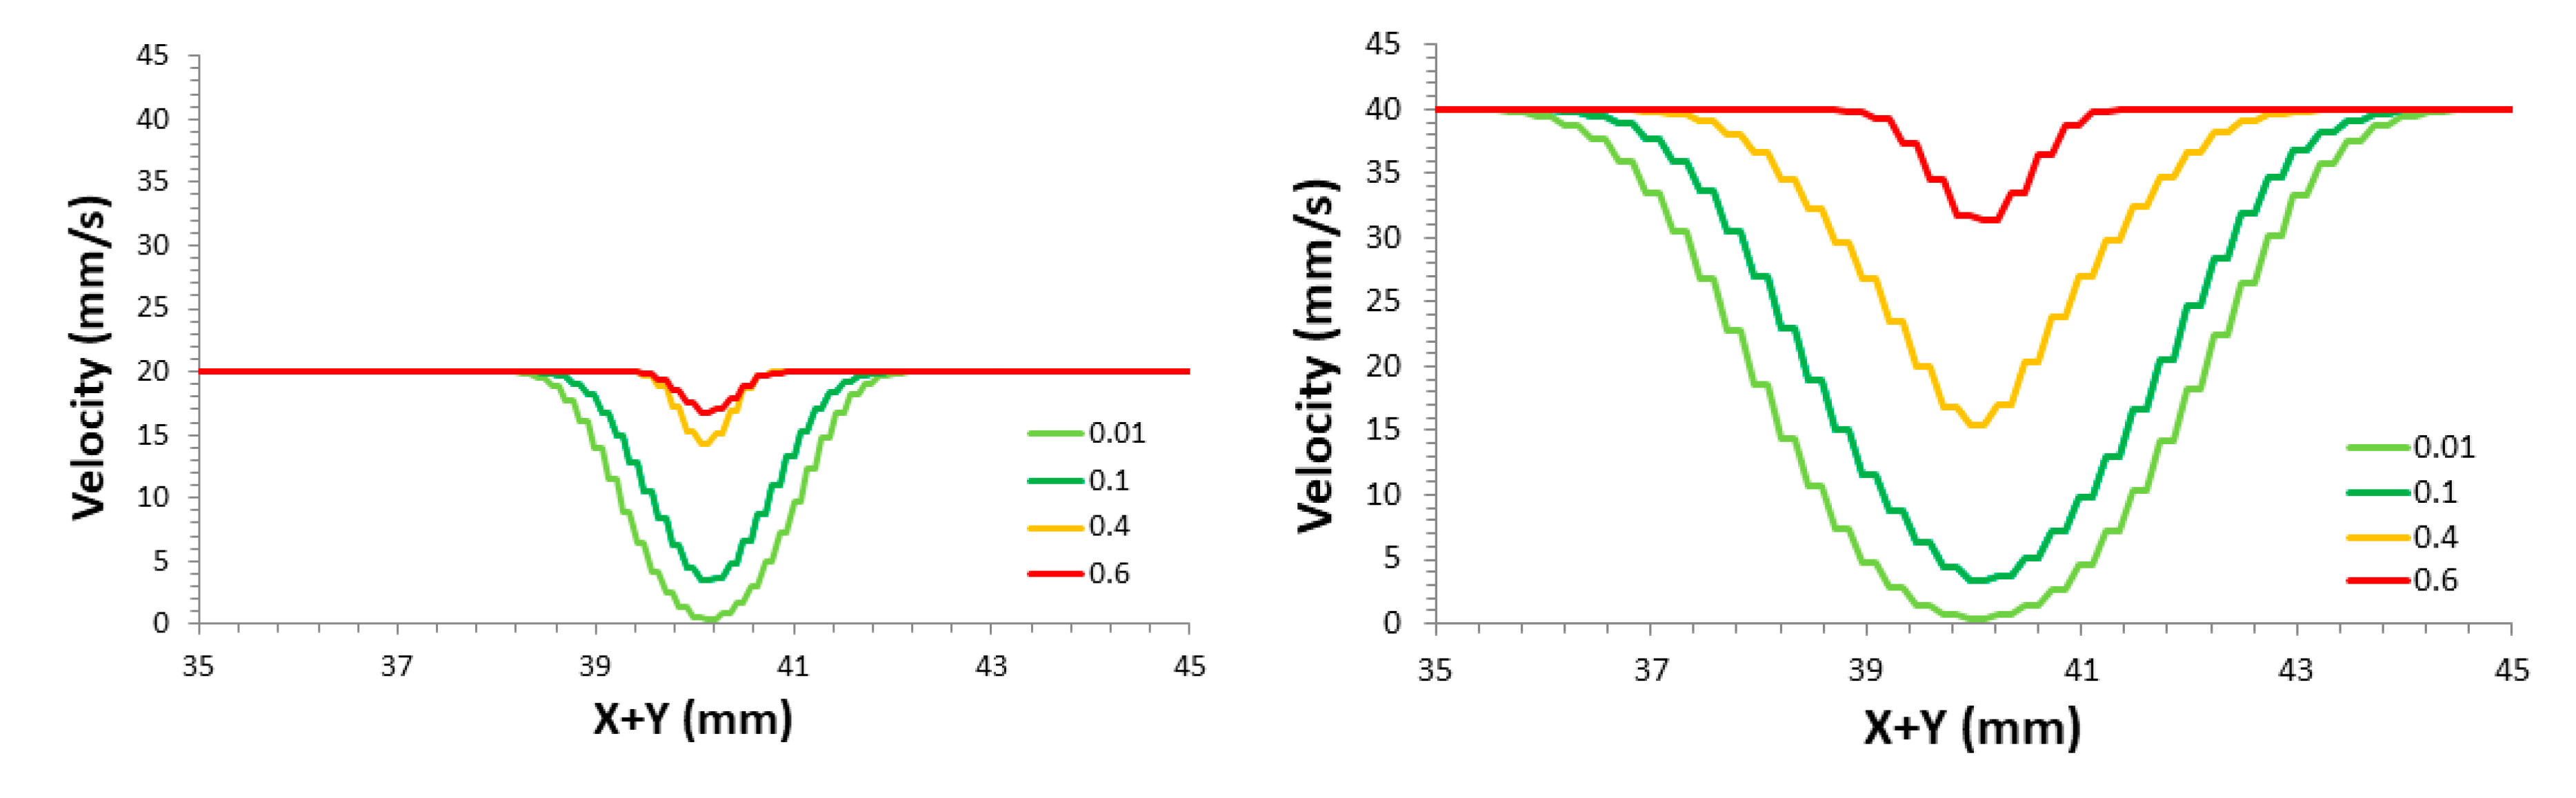
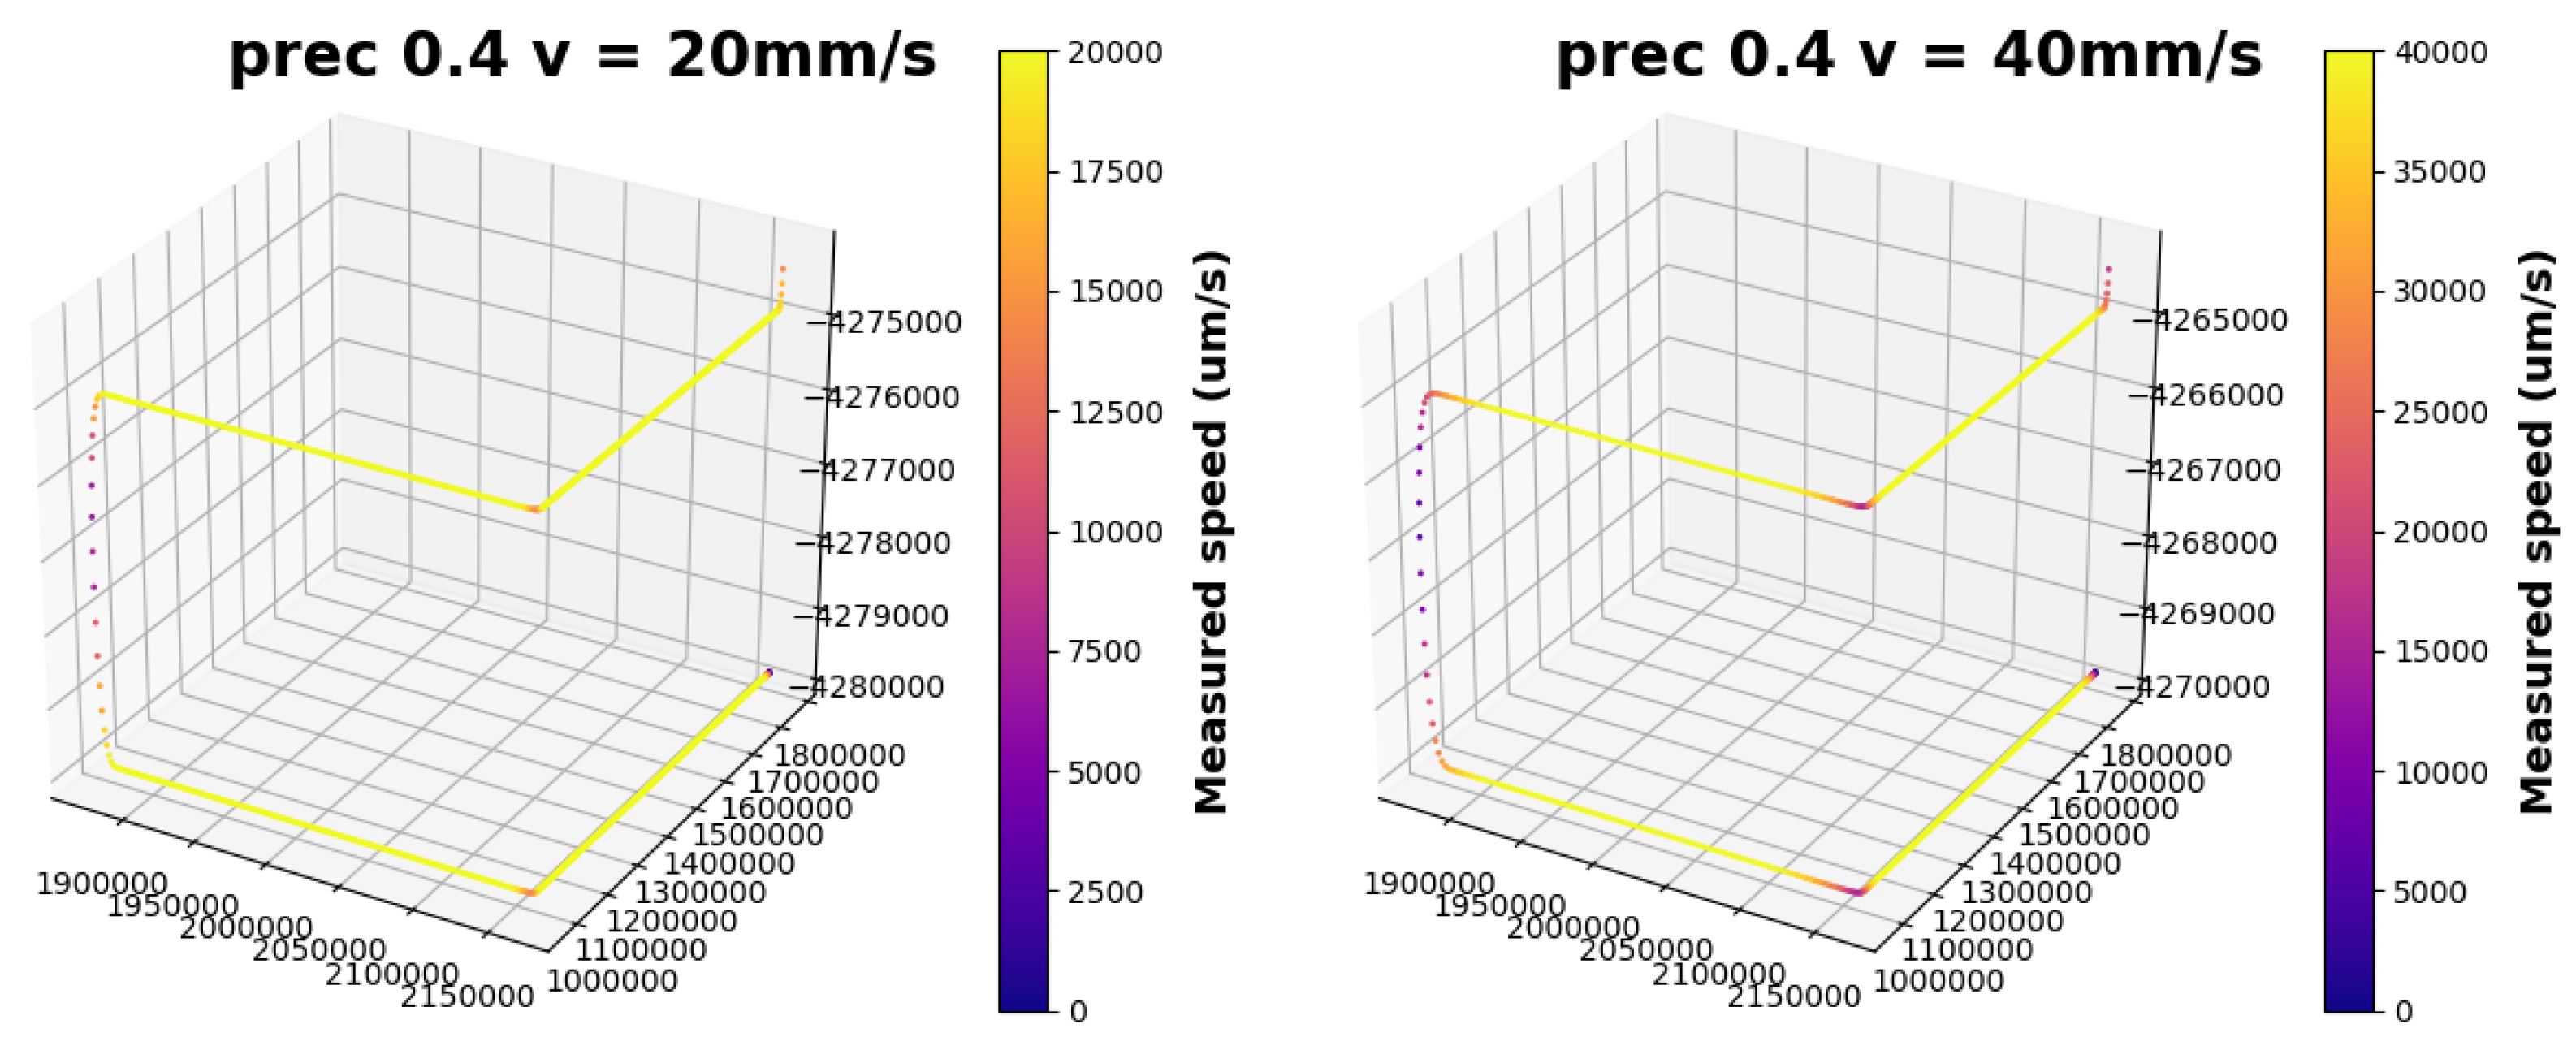
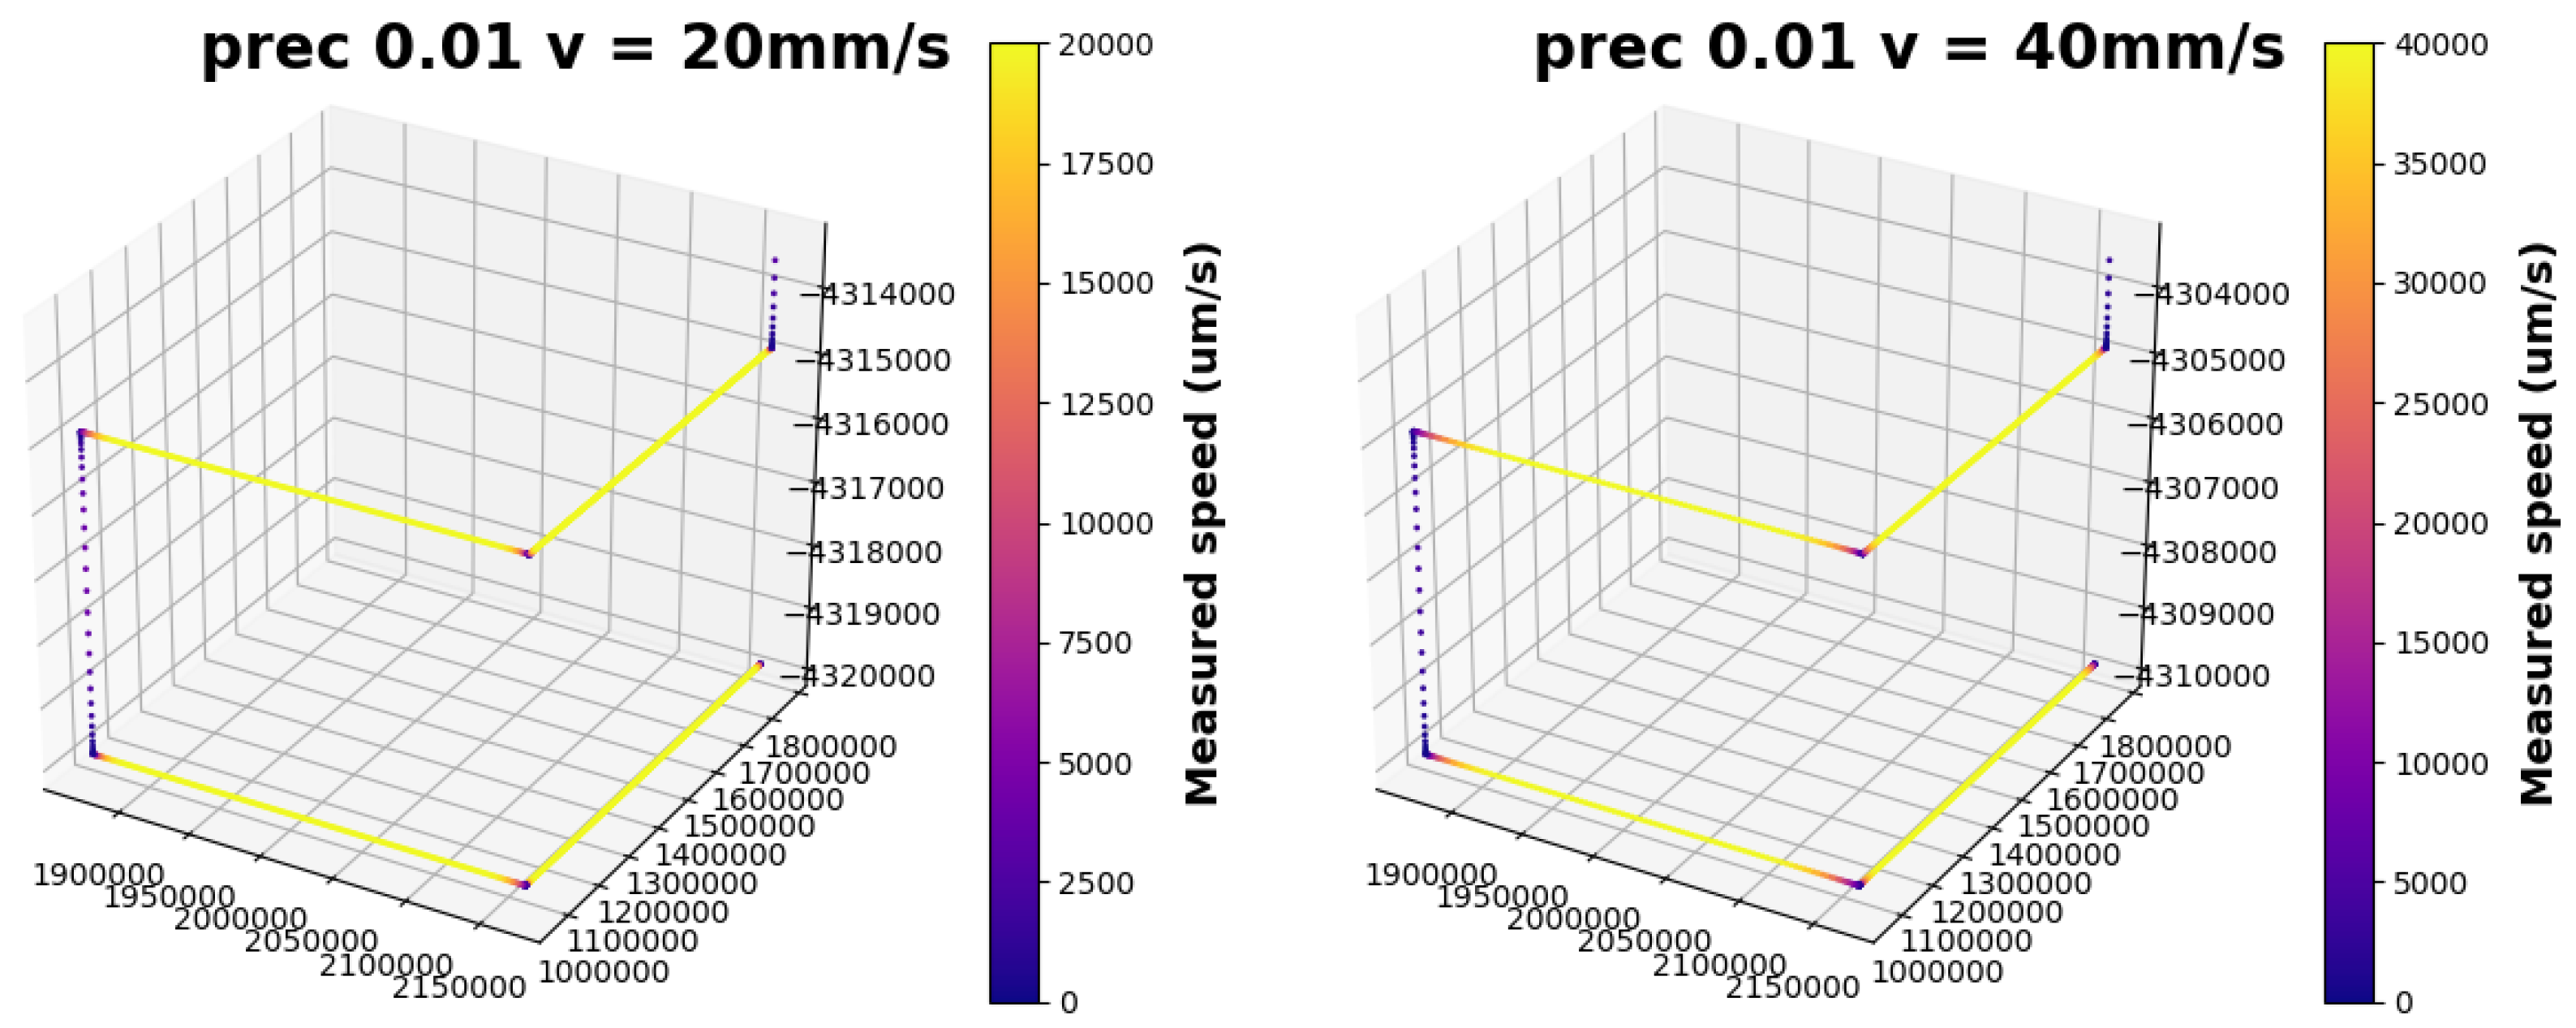
Finally, it has been analyzed through 3D plots the speed variation in two successive layers (Z1 and Z1 + 0.5 mm), programming linear trajectories (G01) for trajectories of a wall that would be manufactured with a single cord. As commented before, the speed variation is the same in each layer, the variation of the Z coordinate has not been registered, and the deceleration at the end of linear paths is also observed, similar to what happens in the vicinity of a corner or in a sudden change of direction. The results are shown below in the graphs in
Figure 8 and
Figure 9 for both speeds and two of the accuracies studied (e:0.01 and e:0.40).
3.2. Geometric Precision of Thin Walls with Sharp Corners
In order to evaluate the influence of the e:X.XX parameter and the use or not of the laser power control system during the deposition process, thin walls (thickness 1.20 mm and one bead/track per layer) have been manufactured with different materials, then we have proceeded to analyze through optical microscopy and micrograph processing by image analysis the curvature (internal and external radius) and quality of the material. The process control system used is a closed-loop laser power control (PID control) that is based on the measurement of the melt-pool size as an input variable to feed the laser power through a closed loop, the set-point of the melt-pool size is set by the user. This process control was only used on the wall made with IN718 once the analysis and optimization of the kinematics adjustment was done with the SS316L thin walls and adequate “e” parameter selected afterward. For demonstration purposes, the walls have been manufactured with lower speeds than those used in kinematics analysis. The process parameters are compiled in
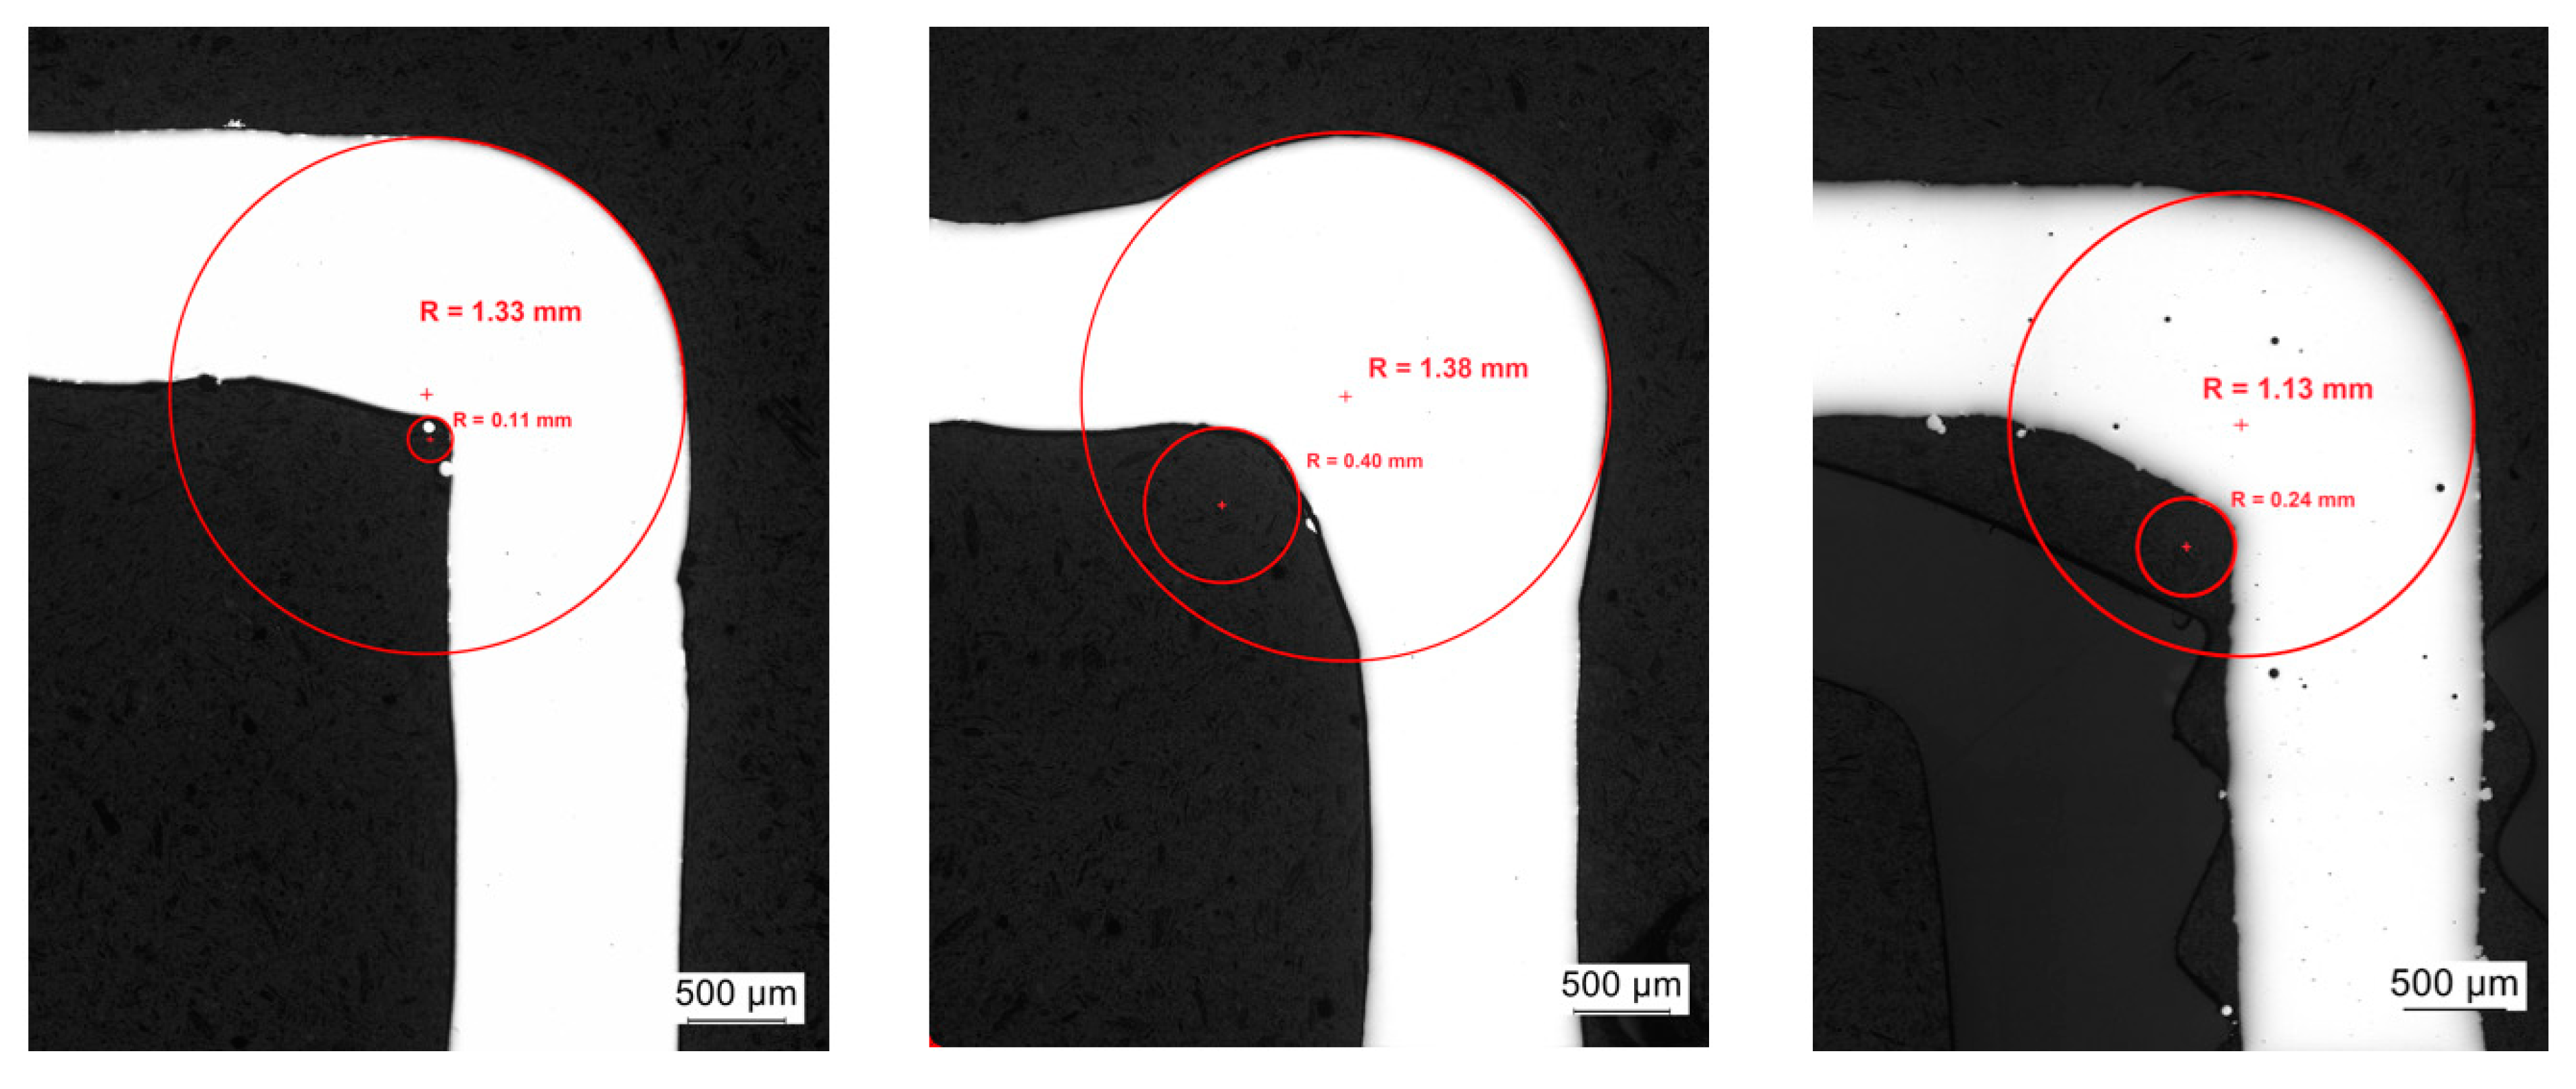
Table 2. It can be seen in
Figure 10 that the best results are achieved with e = 0.40 for a speed of 500 mm/min with or without power control, since the phenomenon of material build-up that occurs when the kinematics are adjusted with greater positioning accuracy (e = 0.04 and 500 mm/min) is minimized. The measured values of the radius of curvature both internally and externally at the corner of the manufactured walls are compiled in
Table 4.
This tendency to accumulate material right in the corner, and the reduction of wall thickness before and after the corner, is more evident in sample 2 manufactured with SS316L, where the power control system has not been worked with and where the lowest value for the kinematics precision parameter has been used, in turn in this sample the greatest speed reduction has been registered in the vicinity of the corner.
3.3. Microstructure and Mechanical Properties
In this section, the microstructure and mechanical properties in the walls obtained with both study materials obtained through direct deposition processes (LB-DED) and with the geometries specified above have been evaluated. It has been cut the cross section of the walls manufactured in the area near the corner, and it has been studied from the anchorage of the filler material with the substrate material, as well as the wall at two different heights, towards 5 mm in height and towards 10 mm in height.
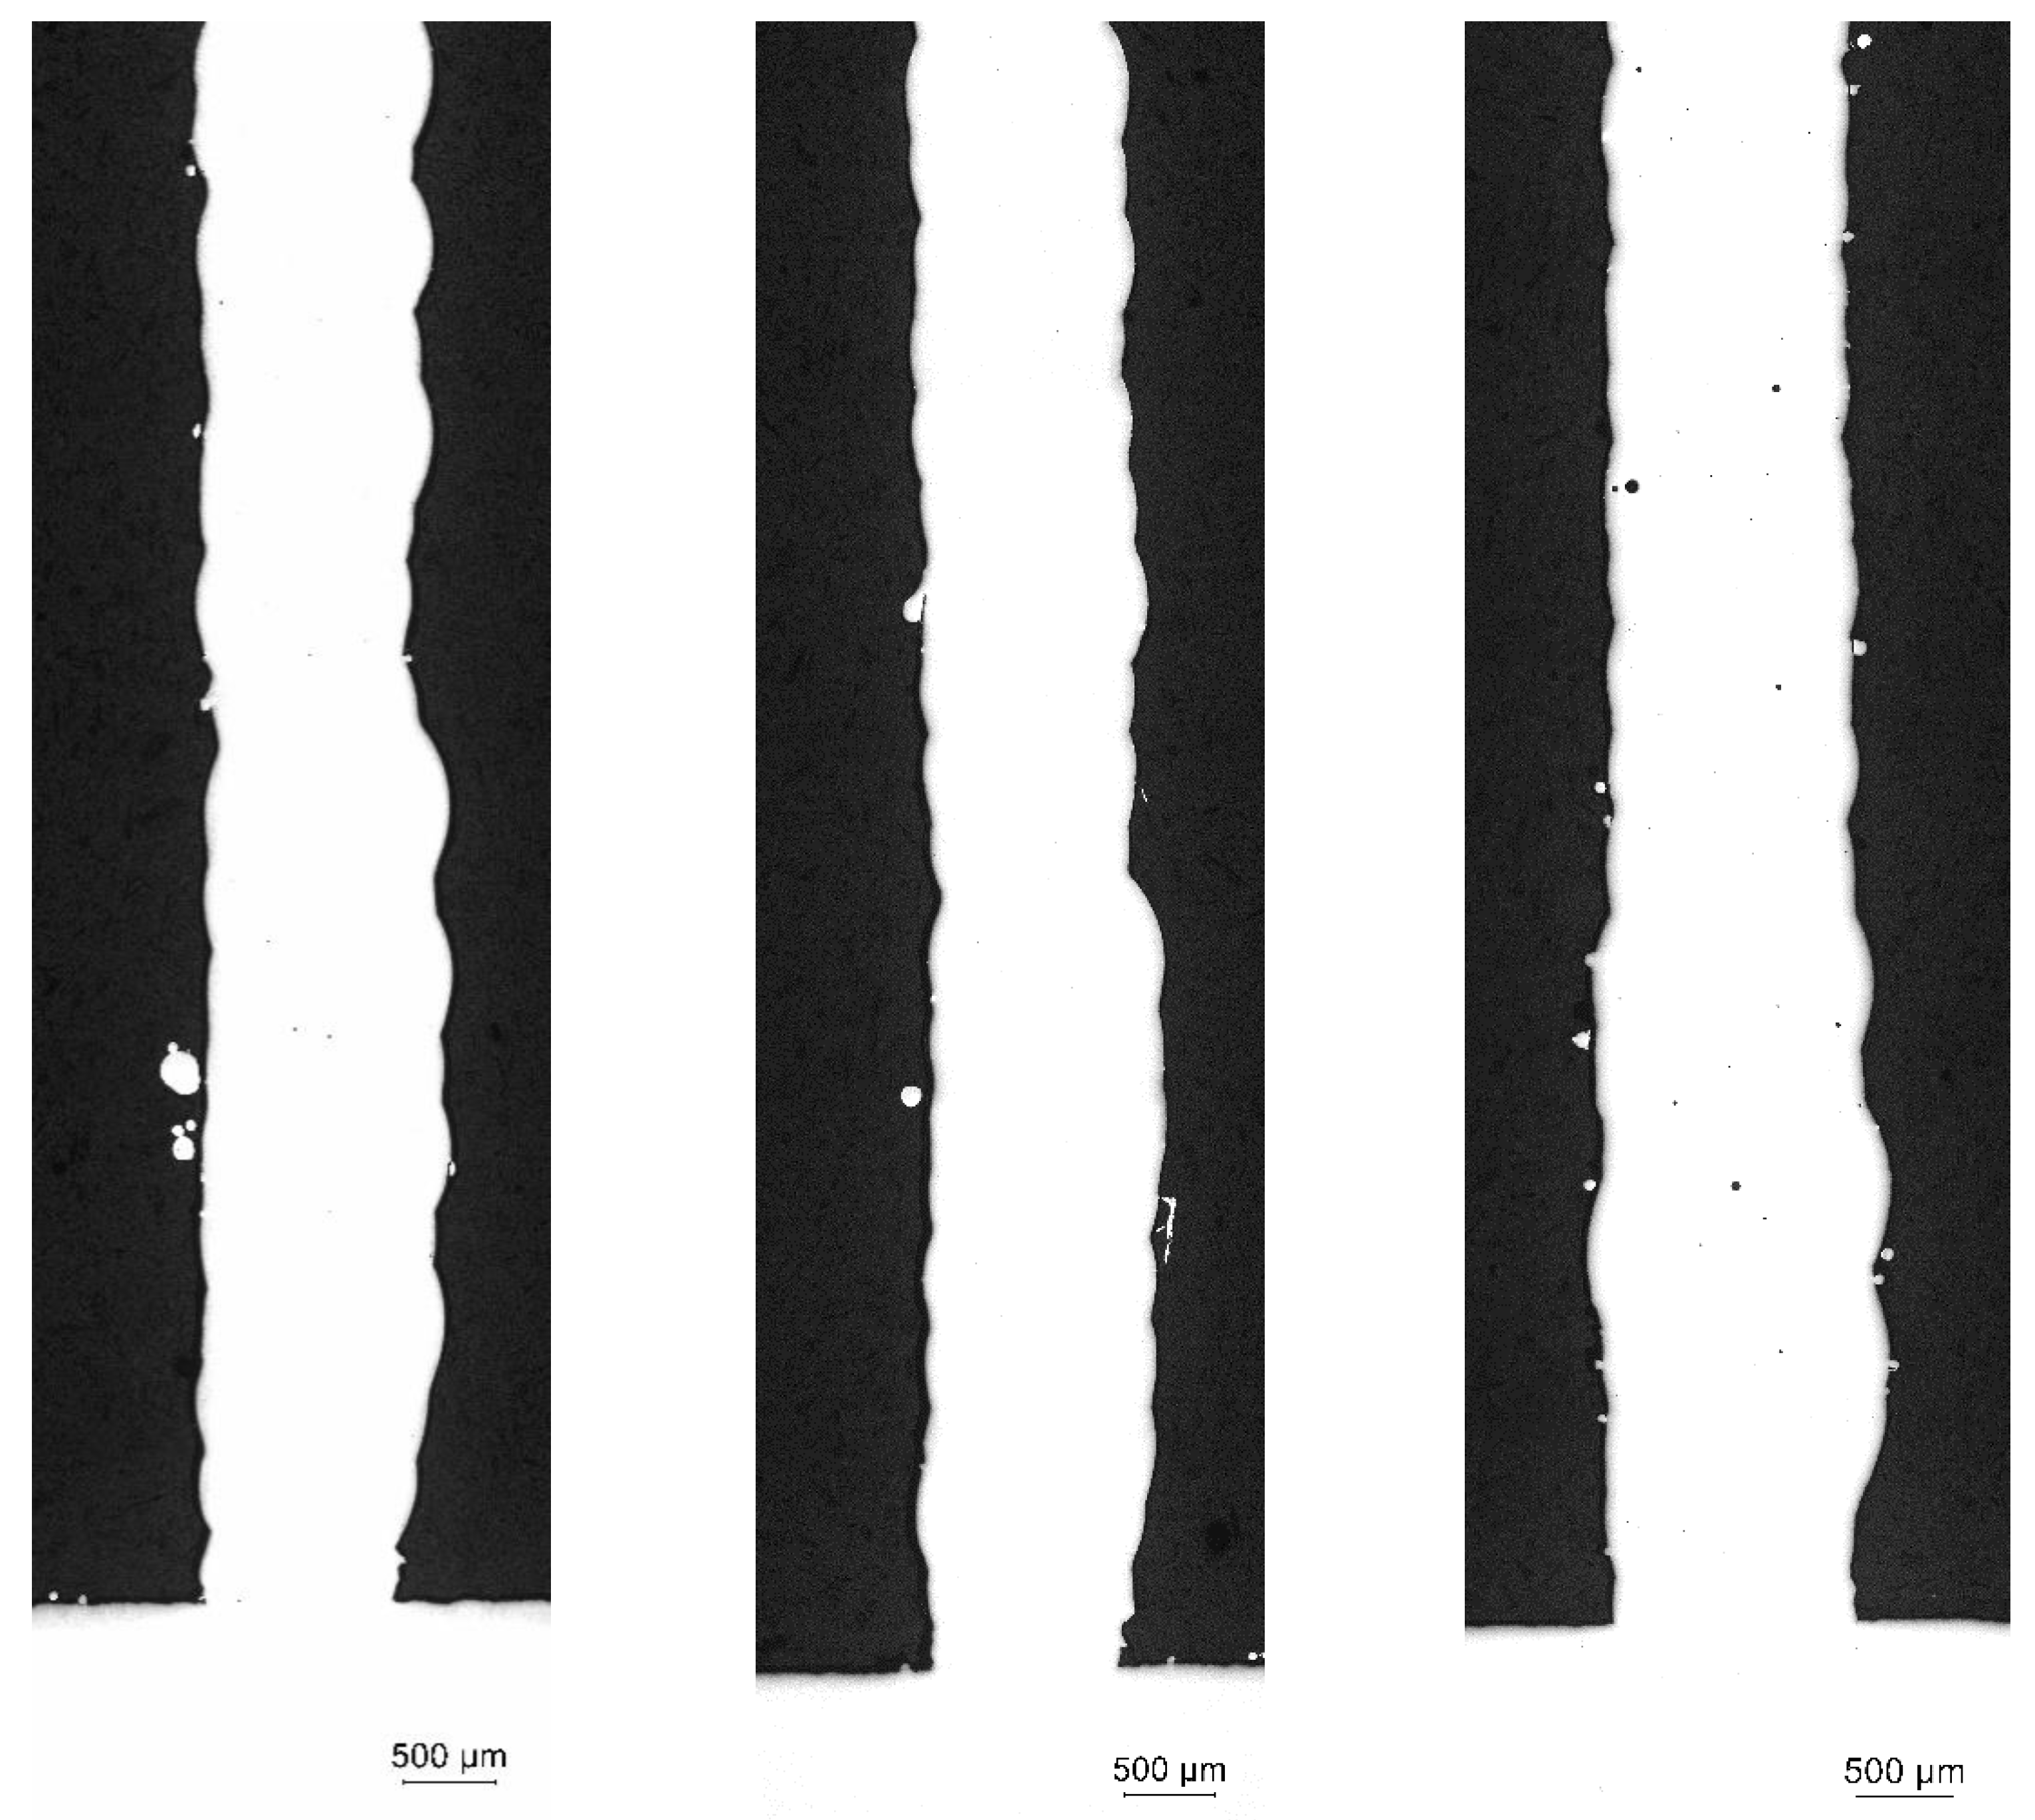
A first analysis of possible defects present in the cross section of the wall has been carried out for the different samples in a polished condition without attack. In
Figure 11, it can be seen that the walls made of SS 316 L (samples 1 and 2) do not show any lack of fusion or porosity, so it can be stated that the process parameters and energy density (40 J/mm
2) used in these stainless steel samples are adequate. In the case of sample 3 manufactured in IN718, no lack of fusion are observed, but small circular pores are observed, perhaps due to trapped gas from the used powder (gas atomized) or due to the use of excessive laser energy density (40 J/mm
2) since this material has a lower fusion temperature (1336 °C) than 316 L stainless steel (1400 °C) and may require less energy for melt in LMD process. This leads to the conclusion that the process parameters need to be further optimized specifically for this material.
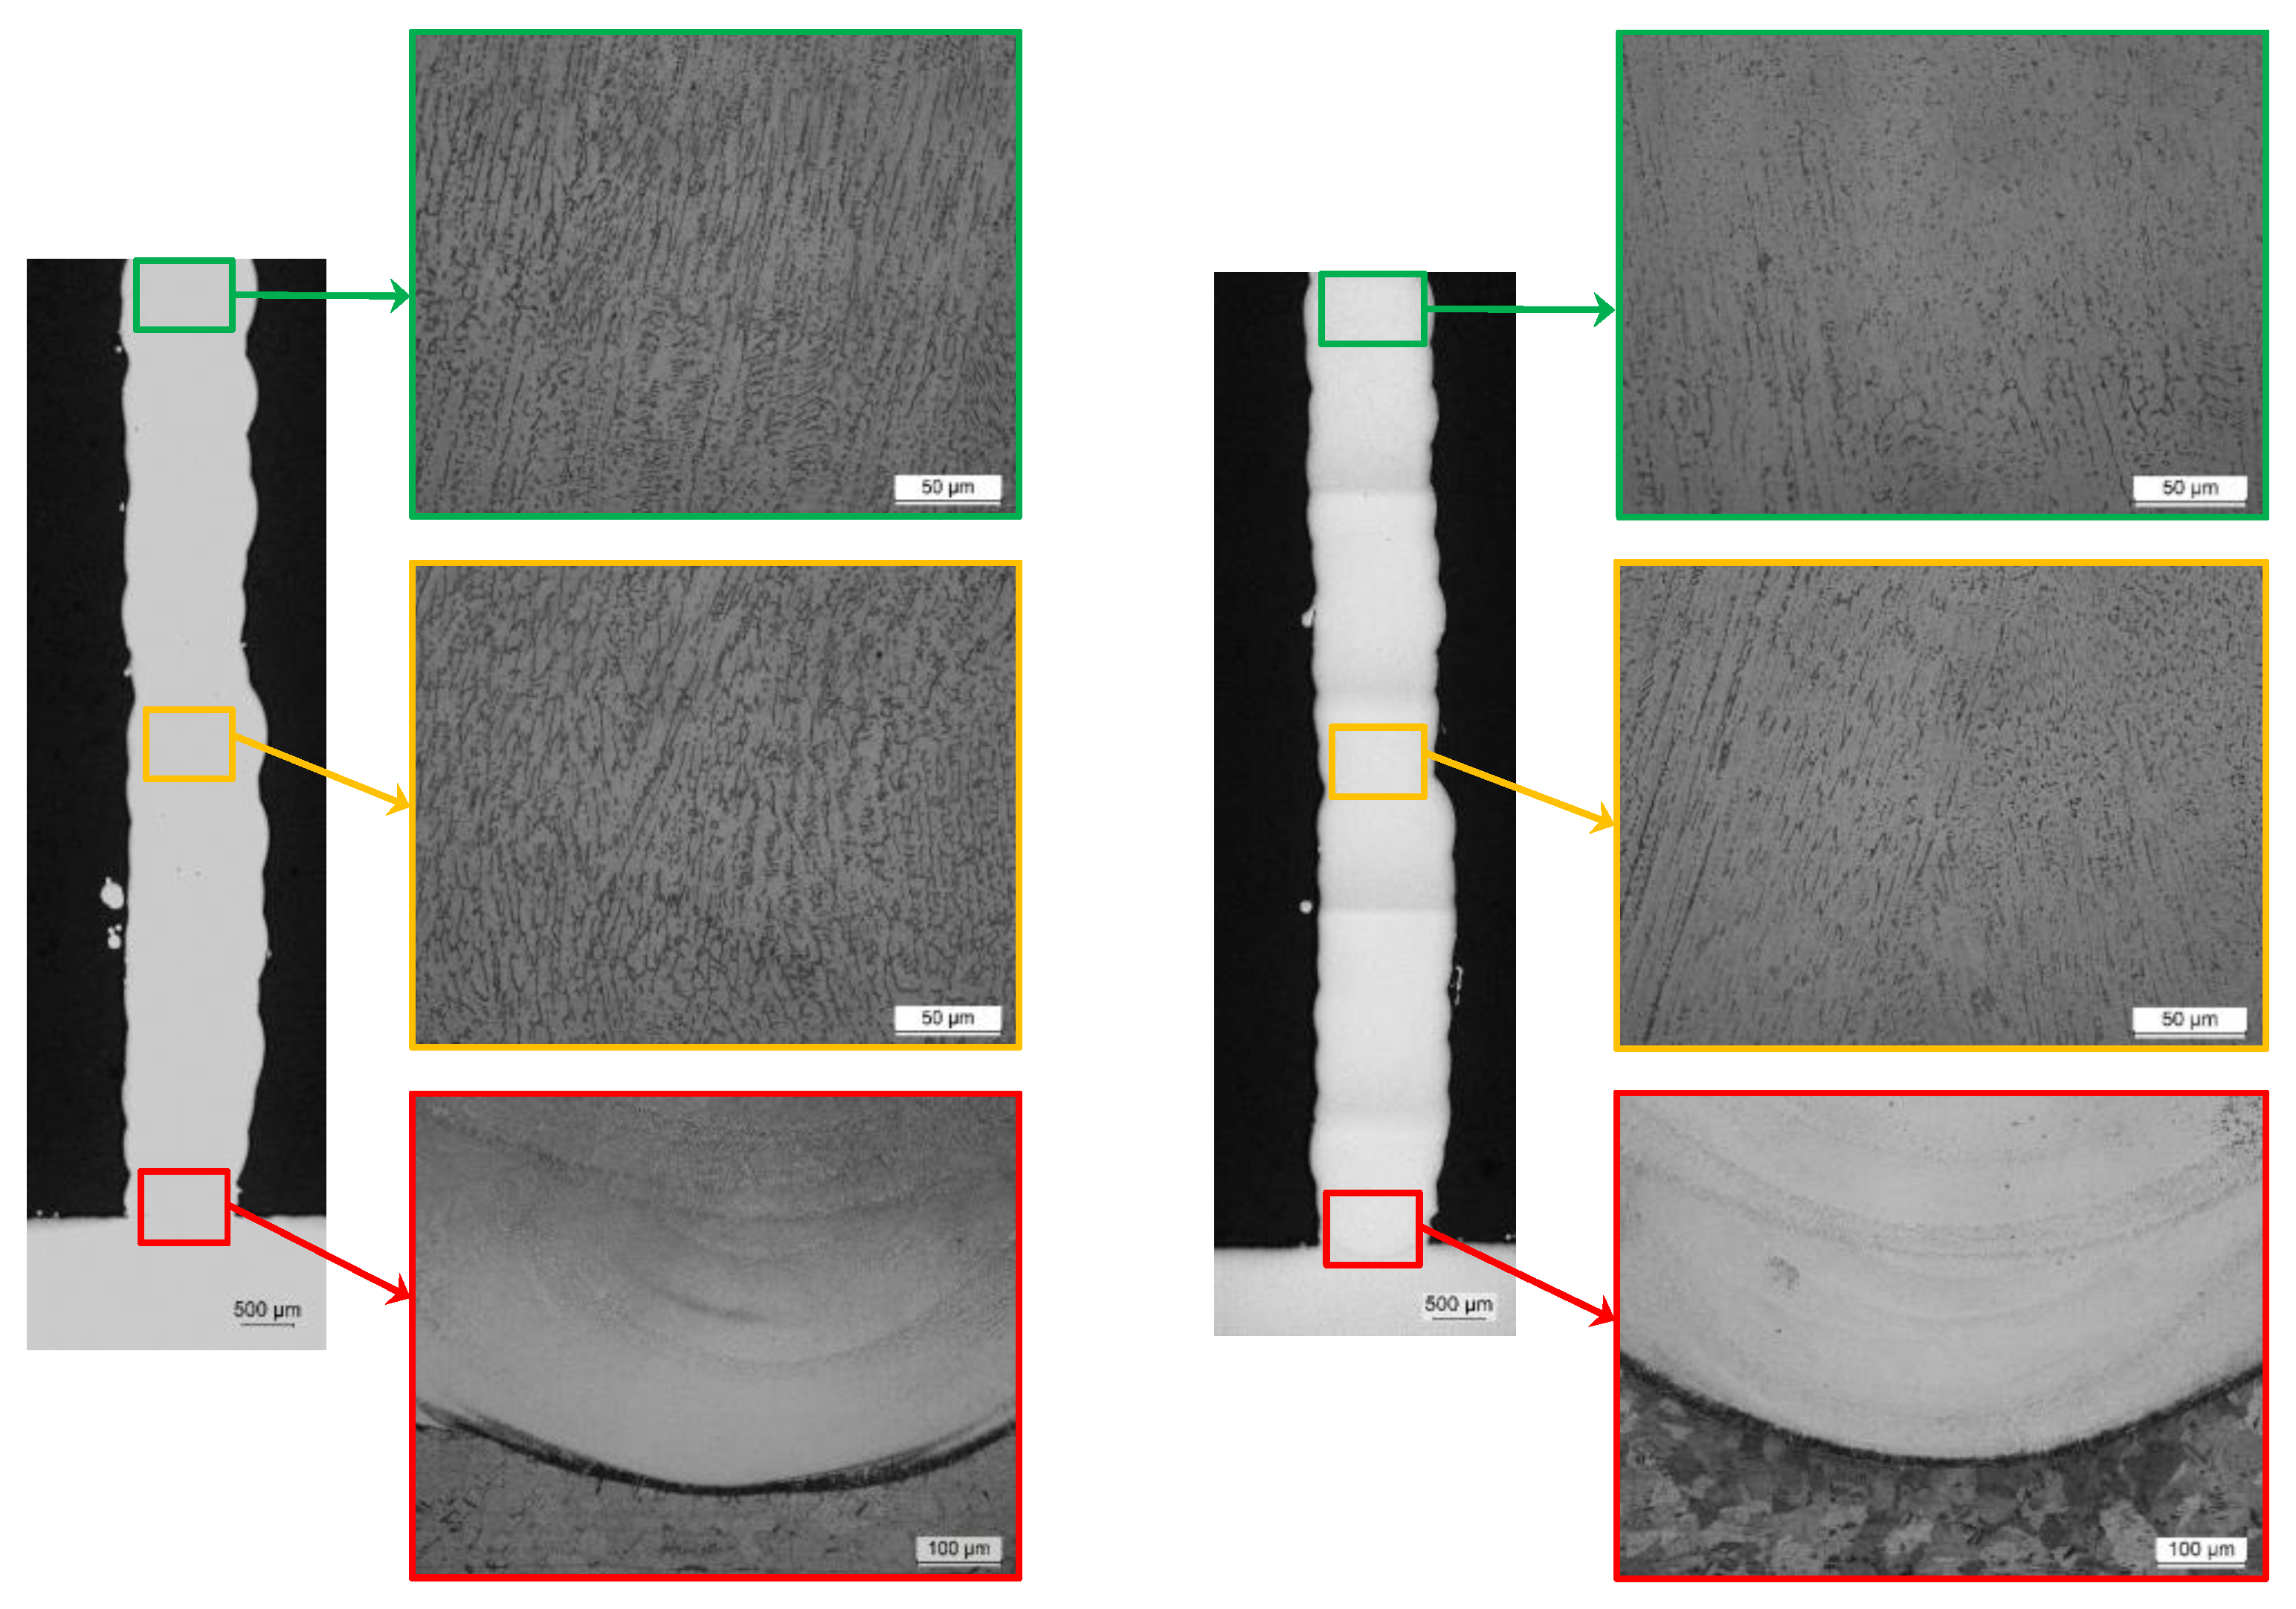
Once the samples have been chemical etched, it is now possible to analyze the microstructure of each sample and material used.
Figure 12 (left) shows three different zones on the wall of the sample 1. At the interface with the substrate, the dilution zone with the base material (SS AISI 304) and the good metallurgical bond between both can be clearly seen. Moreover, in this zone the mechanism of solidification of the first deposited bead is evident, where the microstructure is a very fine cellular dendritic structure. In the micrograph of the middle zone of the wall, it is already observed a columnar dendritic microstructure with epitaxial growth where changes in the direction of growth of the dendrites in the interface between cords are evidenced. In this middle zone the composition looks uniform without an apparent segregation. This microstructure is similar to that reported by other authors [
18]. Furthermore, it can be deduced that the microstructure is composed of a matrix of γ austenite (light phase) and possible formation of ferrite in the cells (dark phase). The ferrite content is much lower than that of austenite as observed.
In sample 2 the microstructures of the three zones under study (
Figure 12 right) is similar to that observed in sample 1, perhaps a smaller size of the dendrites is observed so that a smaller amount of ferrite (dark phase) is presumed, however, it may also be influenced by a less severe chemical etch than for the other sample.
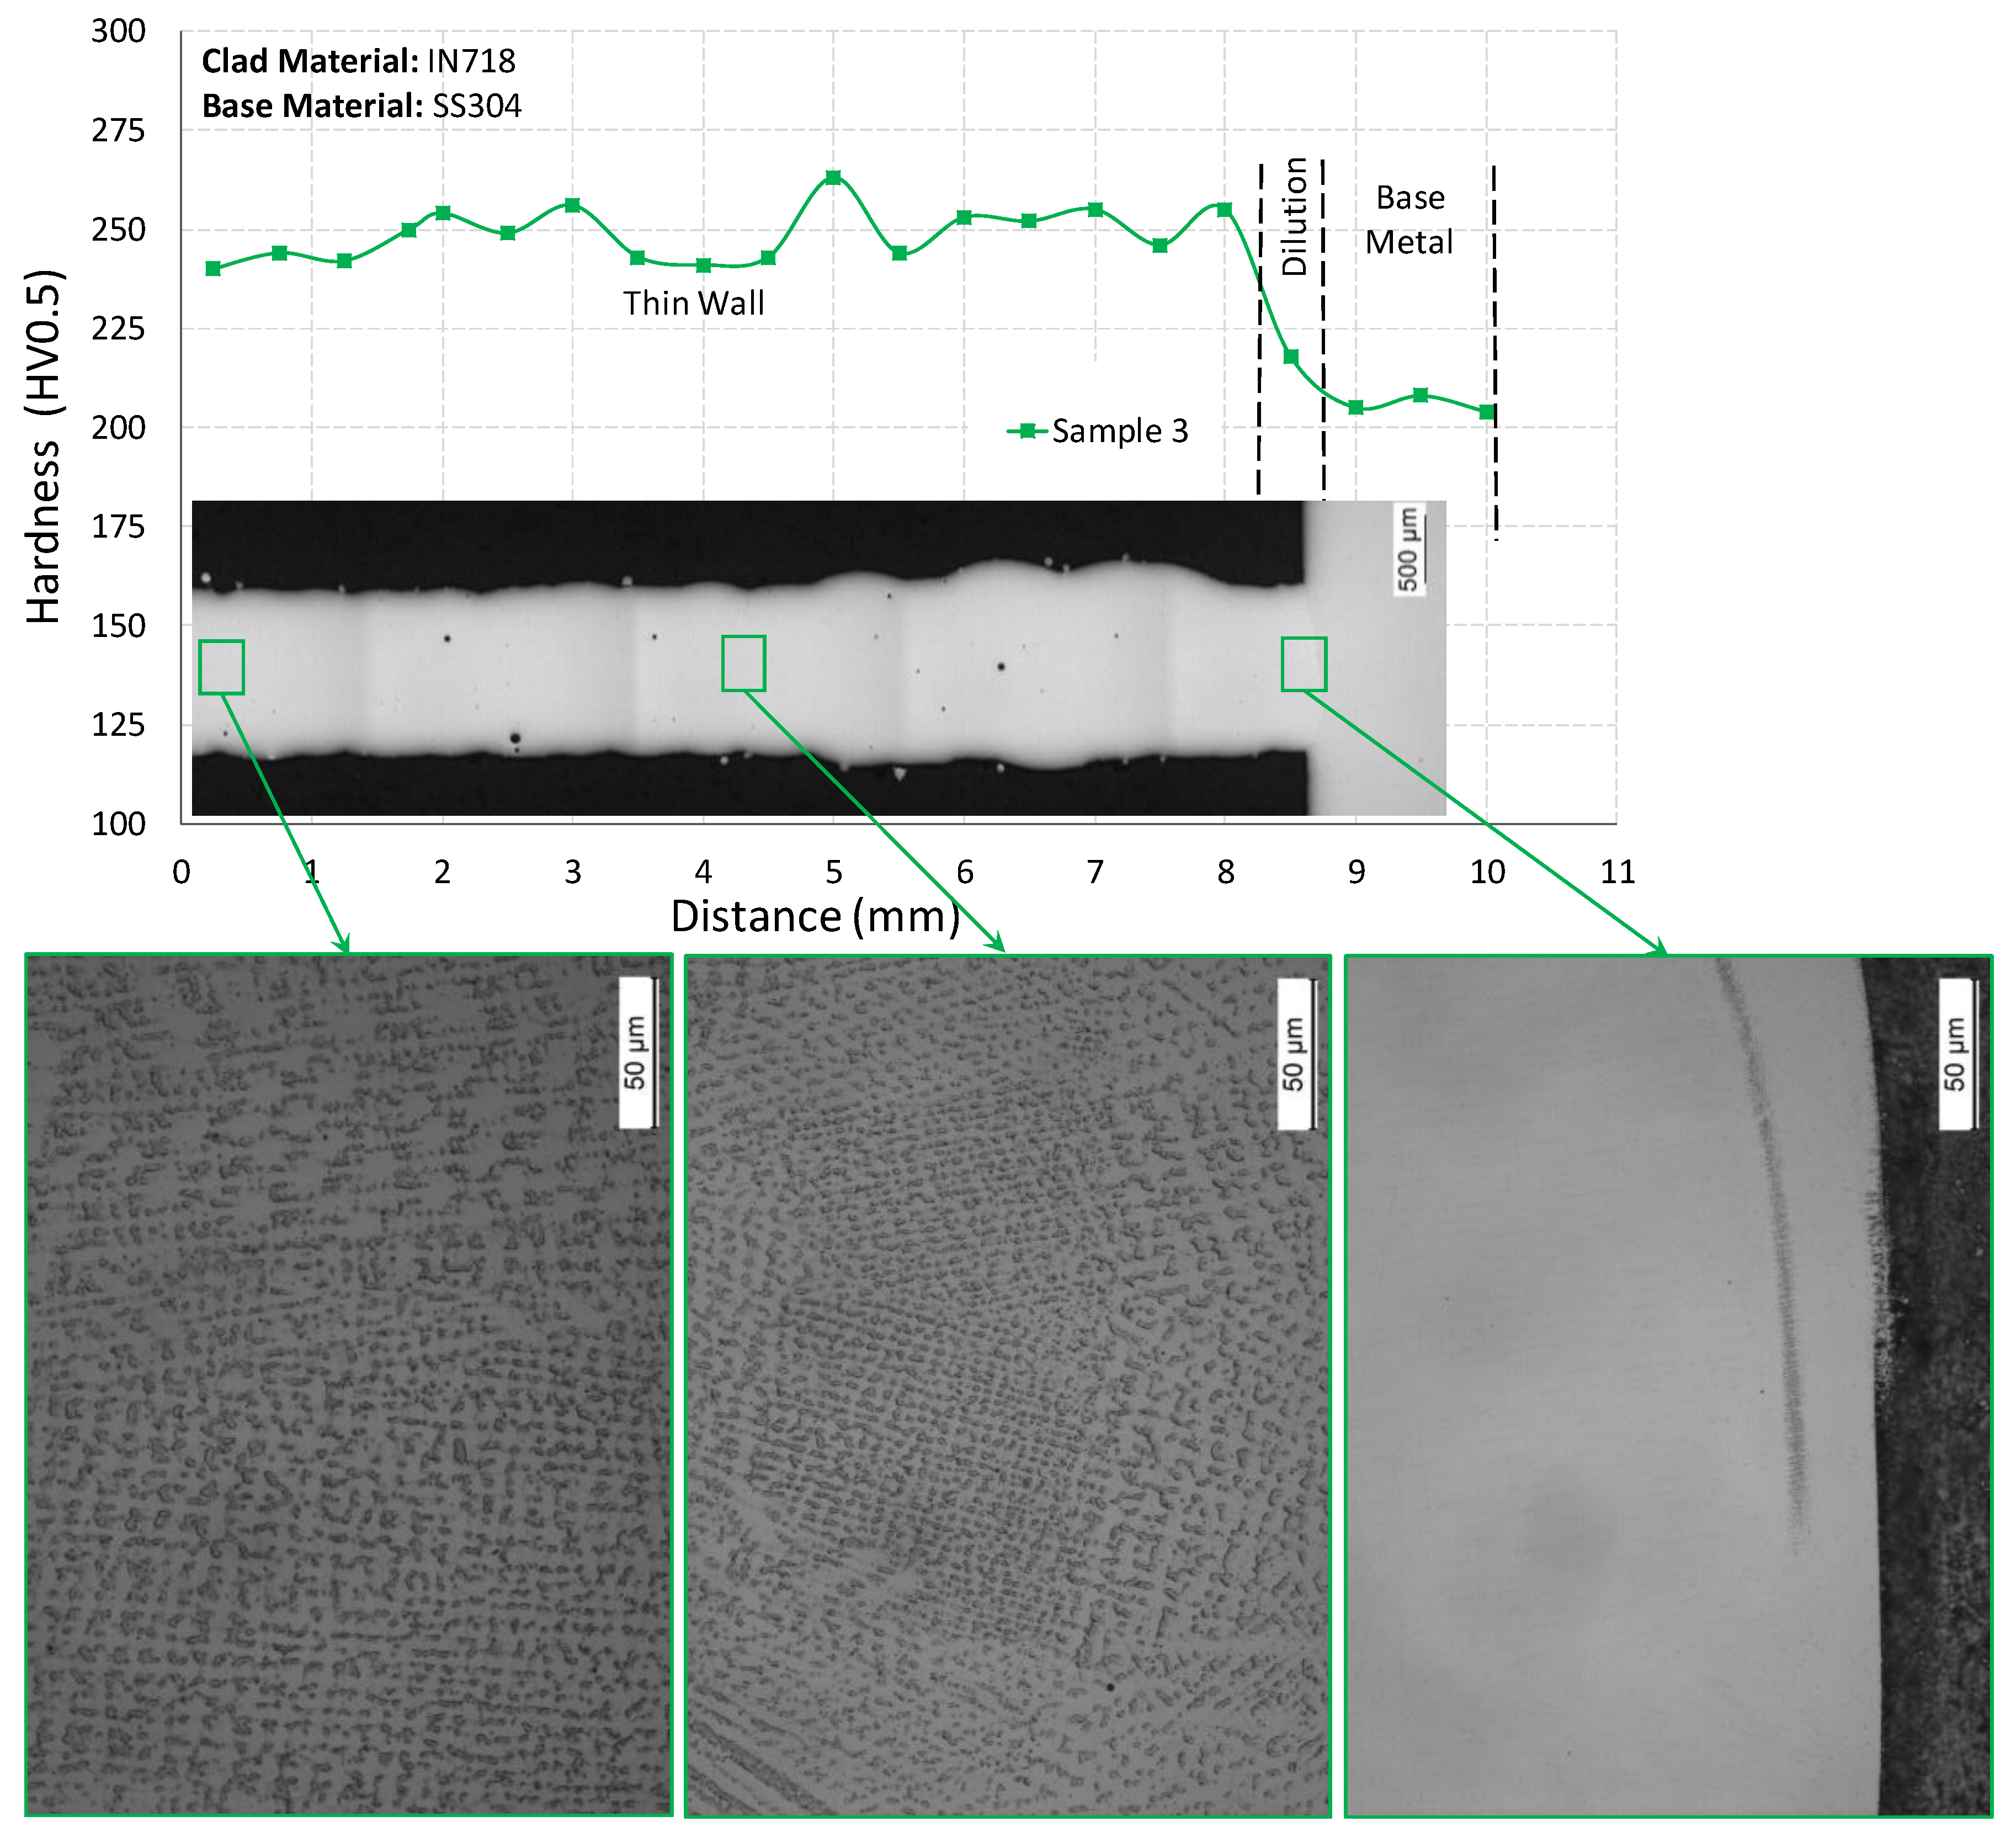
For sample 3, the microstructures of the three areas under study (
Figure 13) are different from those observed in the previous samples, since this material is a nickel-based and not an iron-based alloy. Three different zones are observed on the wall of sample 3. At the interface with the substrate, the dilution zone with the base material (AISI 304) and the good metallurgical bond between both can be clearly seen. In the micrograph of the middle zone of the wall, a columnar dendritic microstructure with epitaxial growth is already observed where changes in the direction of growth of the dendrites at the interface between strands are evident. In this middle zone the composition looks uniform without an apparent segregation. In this case, and according to literature [
19,
20], the microstructure is composed of a matrix of γ-Ni (light phase) and forming dendrites, small dark particles can be seen in globular and irregular forms that have precipitated along the interdendritic limits. An electron microscopy analysis at higher magnifications is necessary to visualize possible precipitation of hard phases such as the Laves phase and/or some other MC and TiN-type phases that are segregated during the rapid solidification process in this type of alloy.
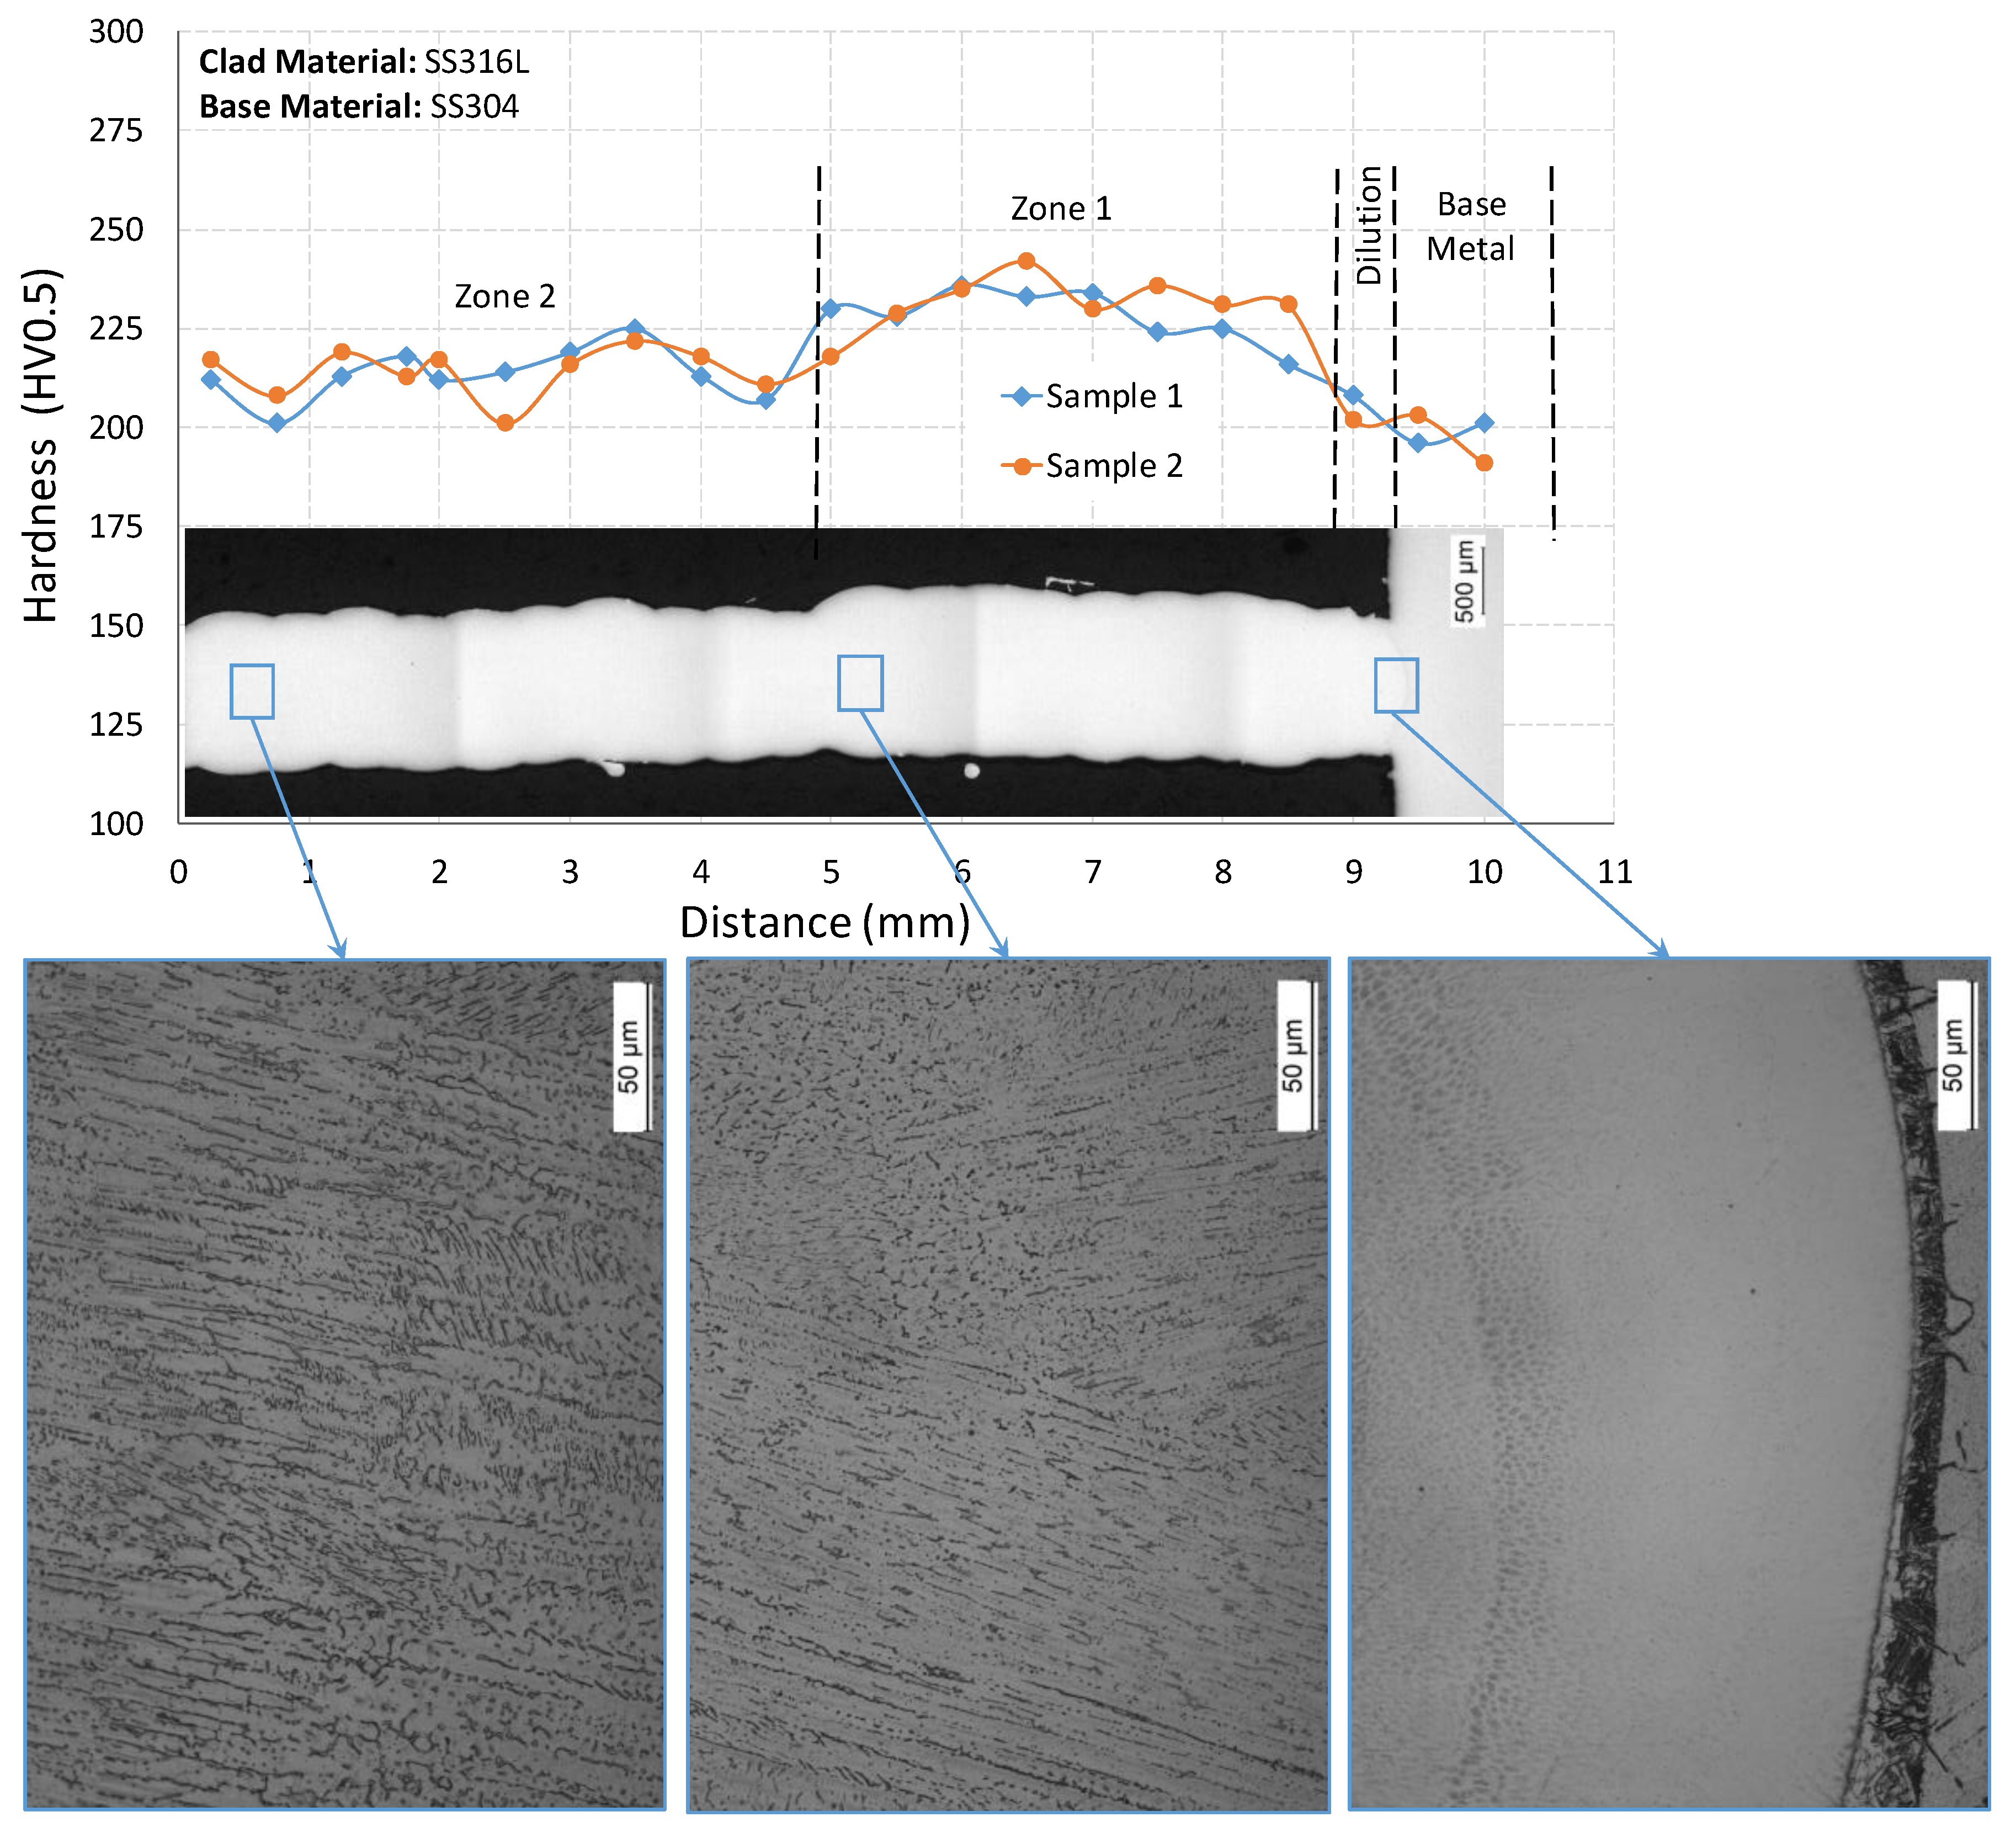
It has been measured the microhardness (HV0.5 scale) of the deposited material, the dilution zone and the base metal. The graph in
Figure 14 shows the microhardness profile obtained in samples 1 and 2 manufactured in SS316L. As can be seen, there is a slight difference in the hardness along the wall. In the base metal (AISI 304) the hardness is about 198 HV, while in the dilution zone, there is a slight difference in chemical composition, since the substrate has a little less Cr but higher contents of Ni, C and Mo than the filler material. This makes that the resulting chemical composition in the first layer is a mixture of both, with a higher content of C and with the Mo as an alpha elements stabilizing the ferrite. The result is a slight increase in hardness. Additionally, the deposited material has a very fine dendritic microstructure, not at all comparable with the microstructure of a laminated material such as the base material. These walls were manufactured with variations in manufacturing process parameters every 10 layers (5 mm), decreasing the laser power by 50 W, in order to achieve stability in the growth of the wall and evaluate how these parameters influence the geometry, microstructure and hardness.
It is observed that in the first stretch of wall manufactured (Zone 1) for both walls a higher hardness value is obtained (230 HV) than in the second stretch manufactured with different parameters (214 HV). This behavior of the hardness is closely related to the microstructure and quantity of phases in each zone. As shown in
Figure 14, in zone 1 the microstructure is finer than in zone 2 and perhaps the delta ferrite content in this zone is higher in zone 2.
In the case of the wall made with IN718 (sample 3), a laser power control system was used. This is a PID control system that acts by means of analogical signals in the laser beam source maintaining a set point of the size of the melt-pool and varying the laser power during the process. In this system the measurement of the size of the melt-pool is made by processing the image of the same obtained with a CCD camera installed in the optical head. In this case the wall thickness and the hardness of the material (see
Figure 15) are more uniform than what was observed in samples 1 and 2.
The hardness values obtained and their hardness are compiled in
Table 5. The improvement of the mechanical properties of the material in the wall manufactured by LMD is possible due to the adequate combination of process parameters and to the particular microstructure obtained in this type of process, as it has been shown here with the study of microstructure and its relationship with chemical composition and hardness.

 ,
, 


