Article

An Investigation of the Influence of a Micro-Textured Ball End Cutter’s Different Parameters on the Surface Residual Stress of a Titanium Alloy Workpiece

Key Laboratory of Advanced Manufacturing and Intelligent Technology, Ministry of Education, College of Mechanical and Power Engineering, Harbin University of Science and Technology, Harbin 150080, China
*
Author to whom correspondence should be addressed.
J. Manuf. Mater. Process. 2019, 3(4), 94; https://doi.org/10.3390/jmmp3040094
Submission received: 29 October 2019 / Revised: 22 November 2019 / Accepted: 24 November 2019 / Published: 27 November 2019
(This article belongs to the Special Issue High-Speed Machining)

Abstract

:
When machining titanium alloy parts, aside from accuracy, the other key concern when evaluating their quality is the integrity of the machined surface. Residual stress can have a significant impact upon this. A certain amount of residual stress can help to strengthen the workpiece, but excessive residual stress can lead to its deformation. In this paper, we report on an experimental study of the surface integrity of titanium alloy after milling with a microtextured ball-end cutter. Tests were conducted to assess the residual stresses on the surface of titanium alloy workpieces according to the direction of feed and milling. The impact of different micro-texture parameters was also assessed; namely, the diameter, depth, spacing and distance from the cutting edge of the individual pits. Range analysis, which is an orthogonal test, was used to analyze the results of the experiments and a prediction model of surface residual stress was established for the milling of titanium alloy with micro-textured ball-end cutters. This model can provide theoretical support for the optimization of the parameters involved in future milling processes.

1. Introduction

Titanium alloy components are widely used in aerospace, medical and other fields because of their high specific strength and exceptional resistance to heat and corrosion, with Ti-6Al-4V being the most commonly used kind of titanium alloy. Despite its many advantages, the high chemical activity, low thermal elasticity and limited modulus of elasticity of titanium alloy make it notoriously difficult to machine [1].
During metal-cutting processes, the surface of a workpiece can be damaged in a number of ways, including microcracks, chip nodules, plastic deformation and tensile stress. This surface damage reduces the material’s resistance to fatigue and stress corrosion and abbreviates its life. Residual stress is an important index for evaluating the surface integrity of parts. Its properties and magnitude have a major impact on hardening deformation and fatigue strength [2]. Residual stress is actually made up of both residual tensile stress and residual compressive stress. Residual tensile stress can reduce the fatigue strength of parts and cause microcracks on their surfaces, while residual compressive stress can actually sometimes improve their fatigue strength. An uneven distribution of residual stress in various parts of the surface can cause workpiece deformation, affecting its shape and dimensional accuracy. Because the residual stress has an important influence on the surface of parts, reducing surface residual stress can improve surface quality of parts. It is necessary to study the residual stress in order to obtain a better polished surface.
Lyubenova [3,4] studied the residual stress of single-track, deep-rolling specimens, and tested the distribution of surface residual stress with two different measuring devices to analyze the influence of different measuring conditions on the distribution of residual stress, and obtained the measurement conditions of residual stress. Niu et al. [5,6] combined the longitudinal, torsional ultrasonic vibration and milling processes to carry out the experimental research on titanium alloy Ti-6Al-4V. The results show that the longitudinal torsional ultrasonic milling can effectively reduce the cutting force and cutting temperature, improve the residual stress value of machining and further increase the surface stress value by selecting appropriate process parameters and lubricating cooling conditions. Maqbool [7,8] studied the relationship the geometric accuracy and the residual stress of the parts under single point incremental forming (SPIF), and established the mathematical model of different parameters under the SPIF. Through the research results, they found that the change of process parameters had a significant effect on the stress state.
Yang et al. [9] established a finite element model of the machined surface residual stress for Ti-6Al-4V. They began by examining the effects of cutting speed, cutting depth, feed per tooth and other cutting parameters on the residual stress at the machined surface. They then established a regression model for residual stress and used a hybrid genetic algorithm to optimize the cutting parameters and their combination. Their results showed that residual stress at the surface of titanium alloy increases with cutting speed, whilst the influence of cutting depth is limited and the residual stress actually decreases with an increase in the rate of feed per tooth. Liu et al. [10] established a finite element model using Deform 3D software to simulate the machining of Ti-6Al-4V alloy under conditions of dry cutting, ordinary cooling and high pressure cooling and analyzed the influence of each of these environments upon the machined surface. The results showed residual tensile stress (d2 = 0) for dry cutting, with an increase in hydraulic pressure gradually transforming the residual stress from tensile stress to compressive stress. When the hydraulic pressure reached 200 bars, the residual stress was fully compressive and its maximum. As the depth of measurement increased, the residual stress value increased as well. In all of their cutting tests, the maximum residual compressive stress value was reached at the same distance from the machined surface. The reliability of these simulated results was further verified through physical experiments. Virginia et al. [11] studied the influence of cutting speed, feed rate and the radius of the tool tip on surface residual stress when turning AISI 4340 steel. They determined a residual stress variation rule for each parameter and the principal direction of the residual stress. It was found that, if the direction of the maximum residual stress was consistent with the direction of the nominal load, the service life of a workpiece could be improved. Hemmesi [12] discussed the relaxation and redistribution of welding residual stresses in a bead on tube weld under multiaxial mechanical loading by ABAQUS. The predefined field of residual stress was initially calculated through a welding simulation in software SYSWELD (Framatome, France). Li et al. [13] found the quenching residual stress distributions of 7085 aluminum alloy plates. The effect of dimensional variation on the quenching residual stress distributions was studied and discussed by using models with different dimensions (length, width, and thickness).
The study on the effect of surface residual stress is mostly based on the finite element simulation, and mostly about cutting parameters. The micro-texture placed in the front of the tool can effectively improve the cutting state of the tool. The accurate selection of structure parameters is good for the micro texture to play a role in reducing friction and improving quality of machined surface. Therefore, in this paper, we present a study where we measured and observed the surface residual stress, according to feed and milling direction, for Ti-6Al-4V titanium alloy samples. An X-ray diffractometer was used during the experiments and the high-speed precision milling of the titanium alloy samples was undertaken using a micro-textured ball-end cutter. The influence of the micro-texture on the surface residual stresses was analyzed according to different texture parameters and a residual stress prediction model was established. This paper can provide a theoretical reference to choose reasonable structure parameters and a theoretical basis for the realization of efficient processing of titanium alloy. Through the influence of tool structure change (micro texture) on the residual stress of machined surface of titanium alloy, the quality and service life of titanium alloy parts can be effectively improved.

2. High-Speed Milling of Titanium Alloy with a Micro-Textured Ball-End Milling Tool
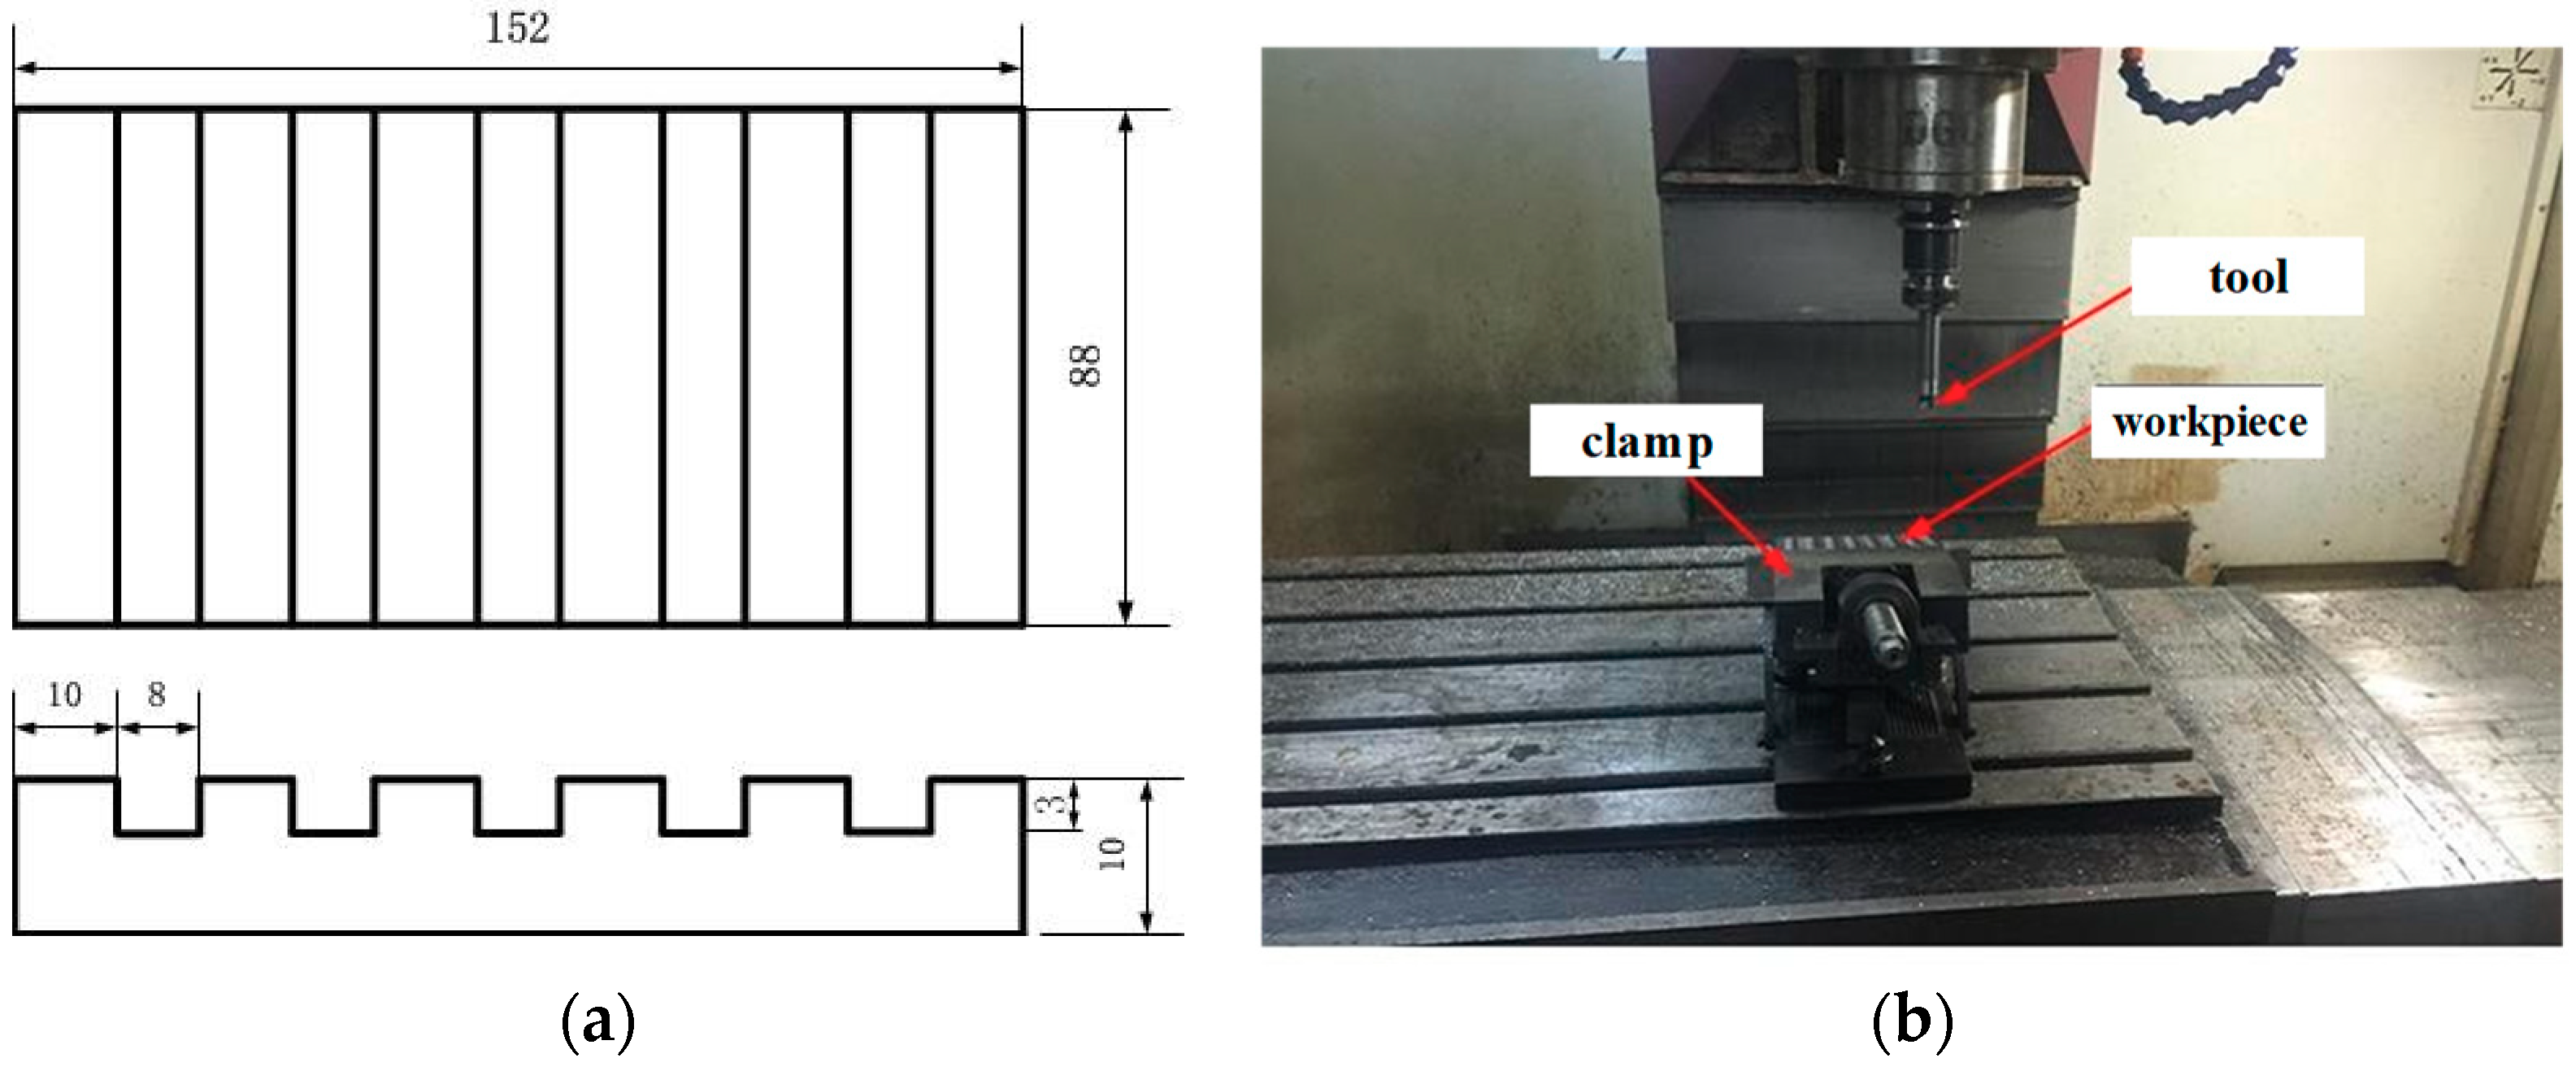
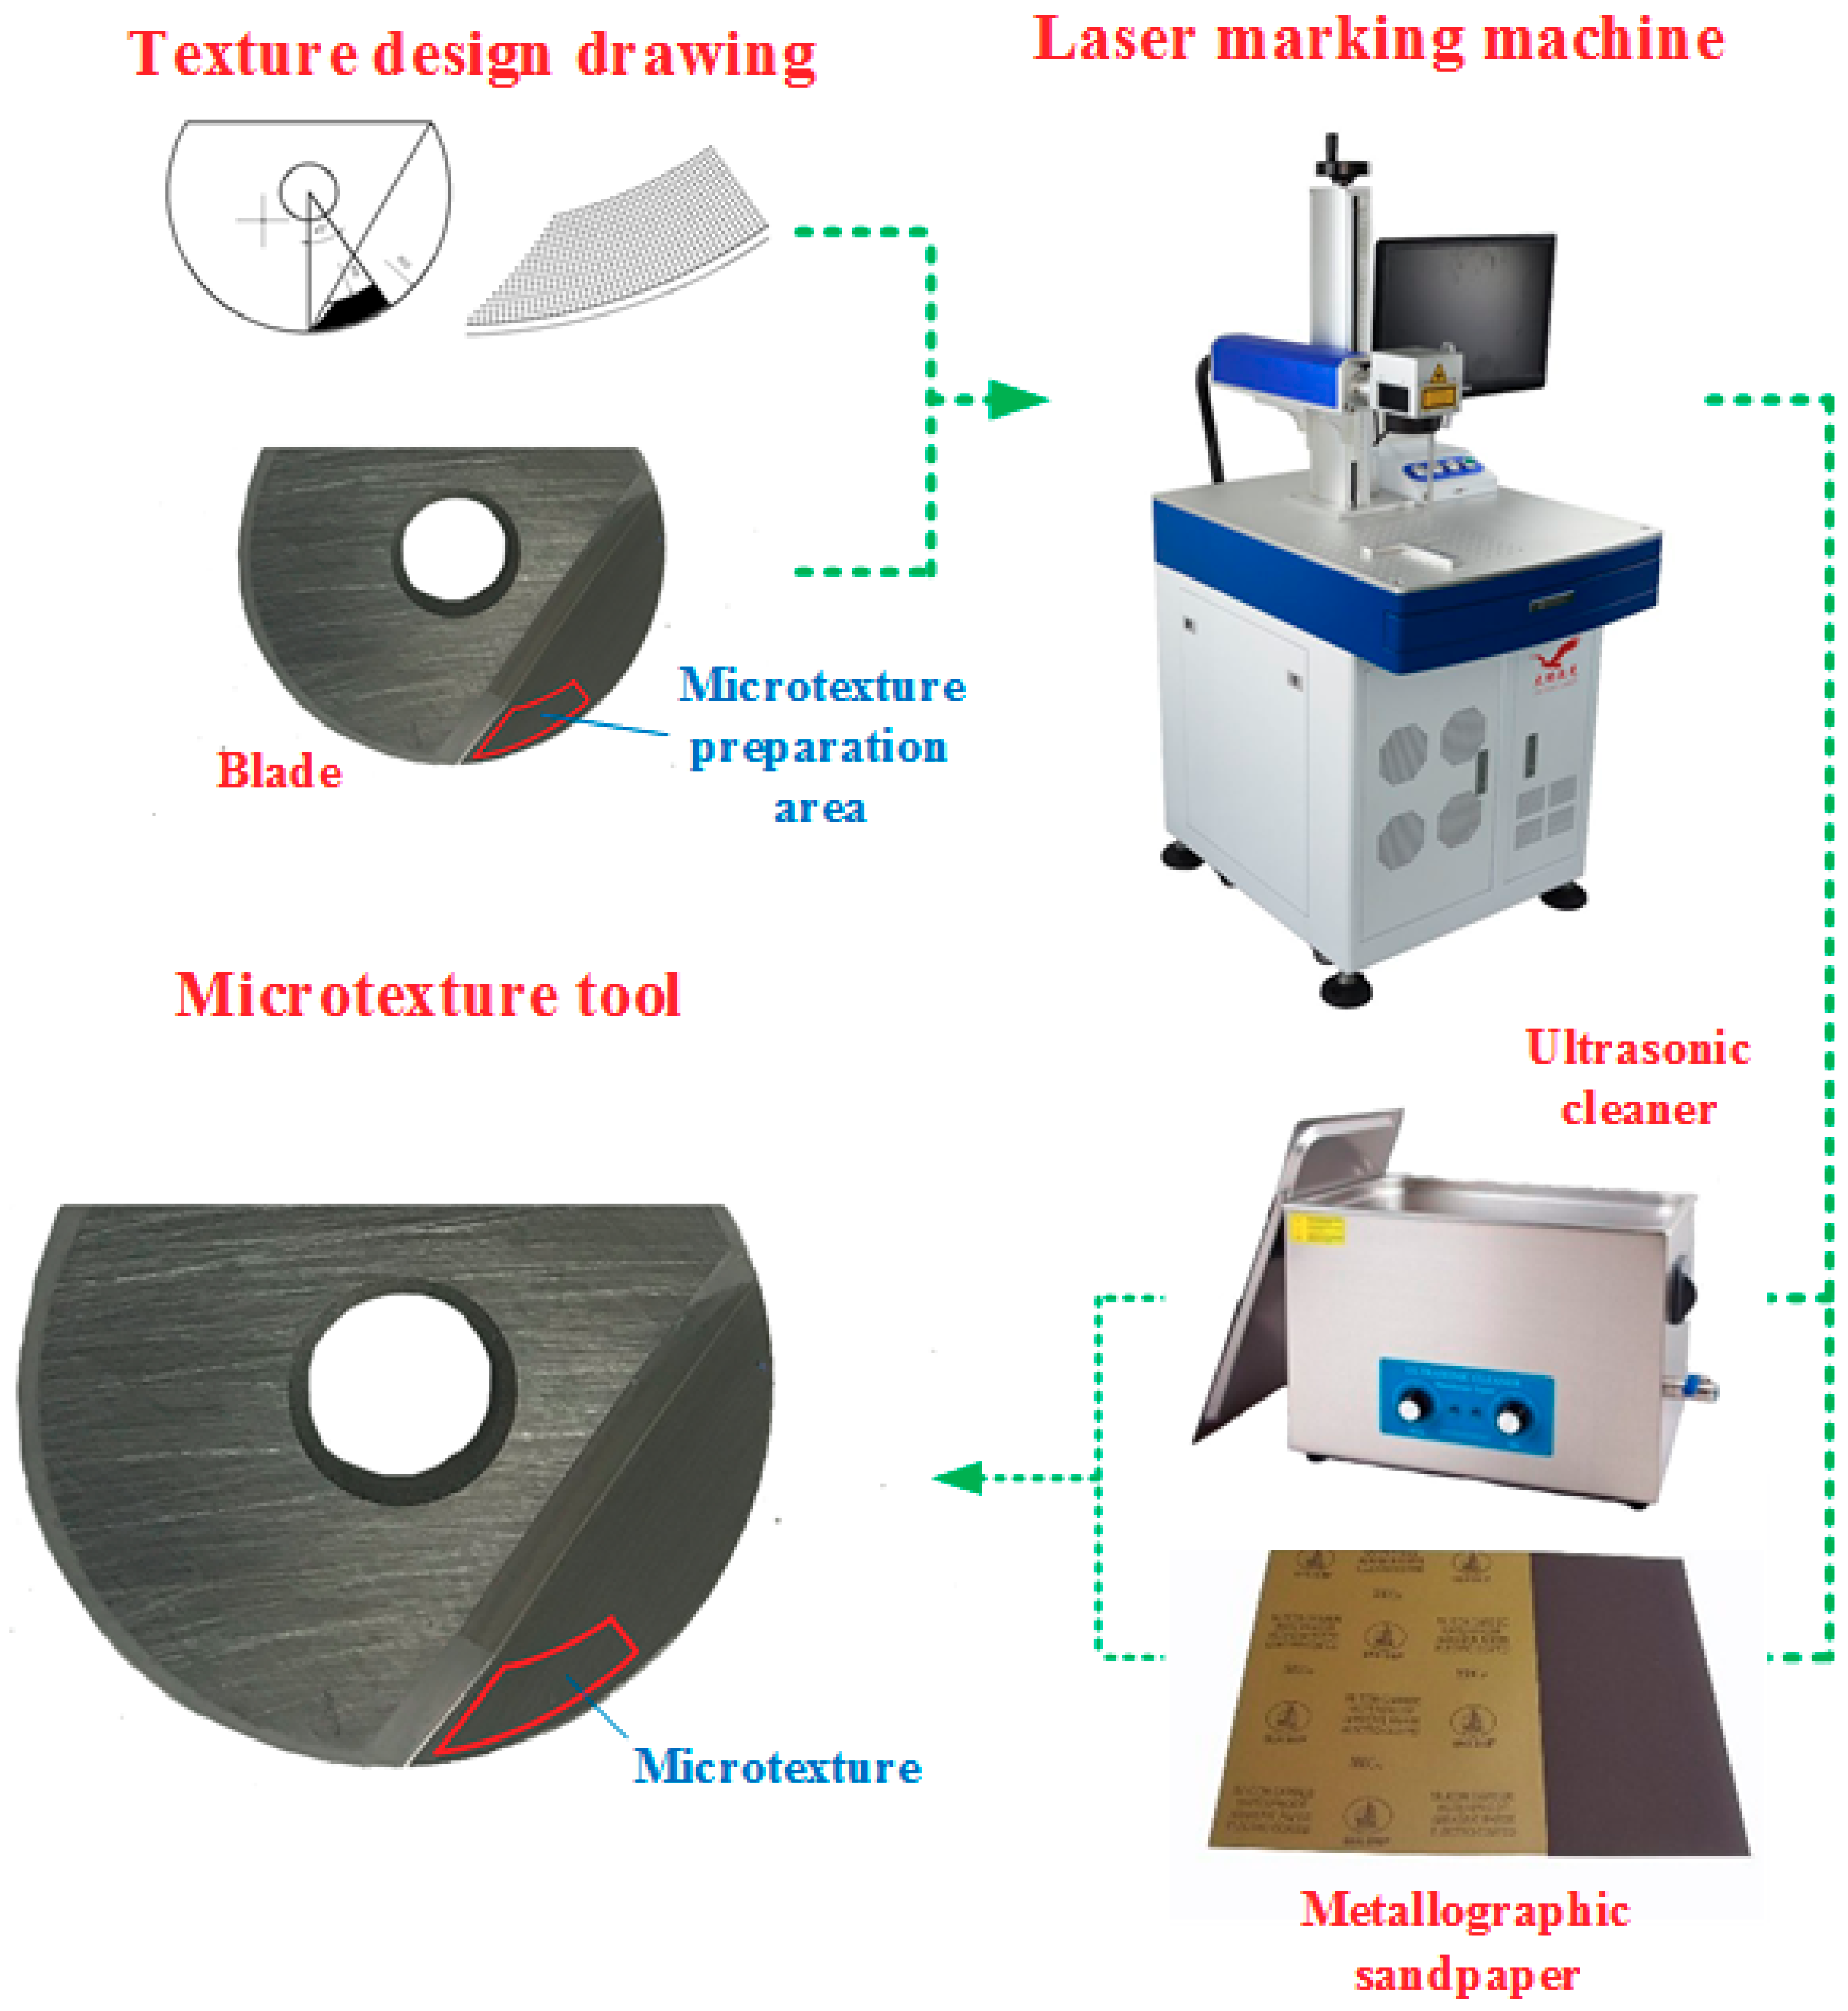
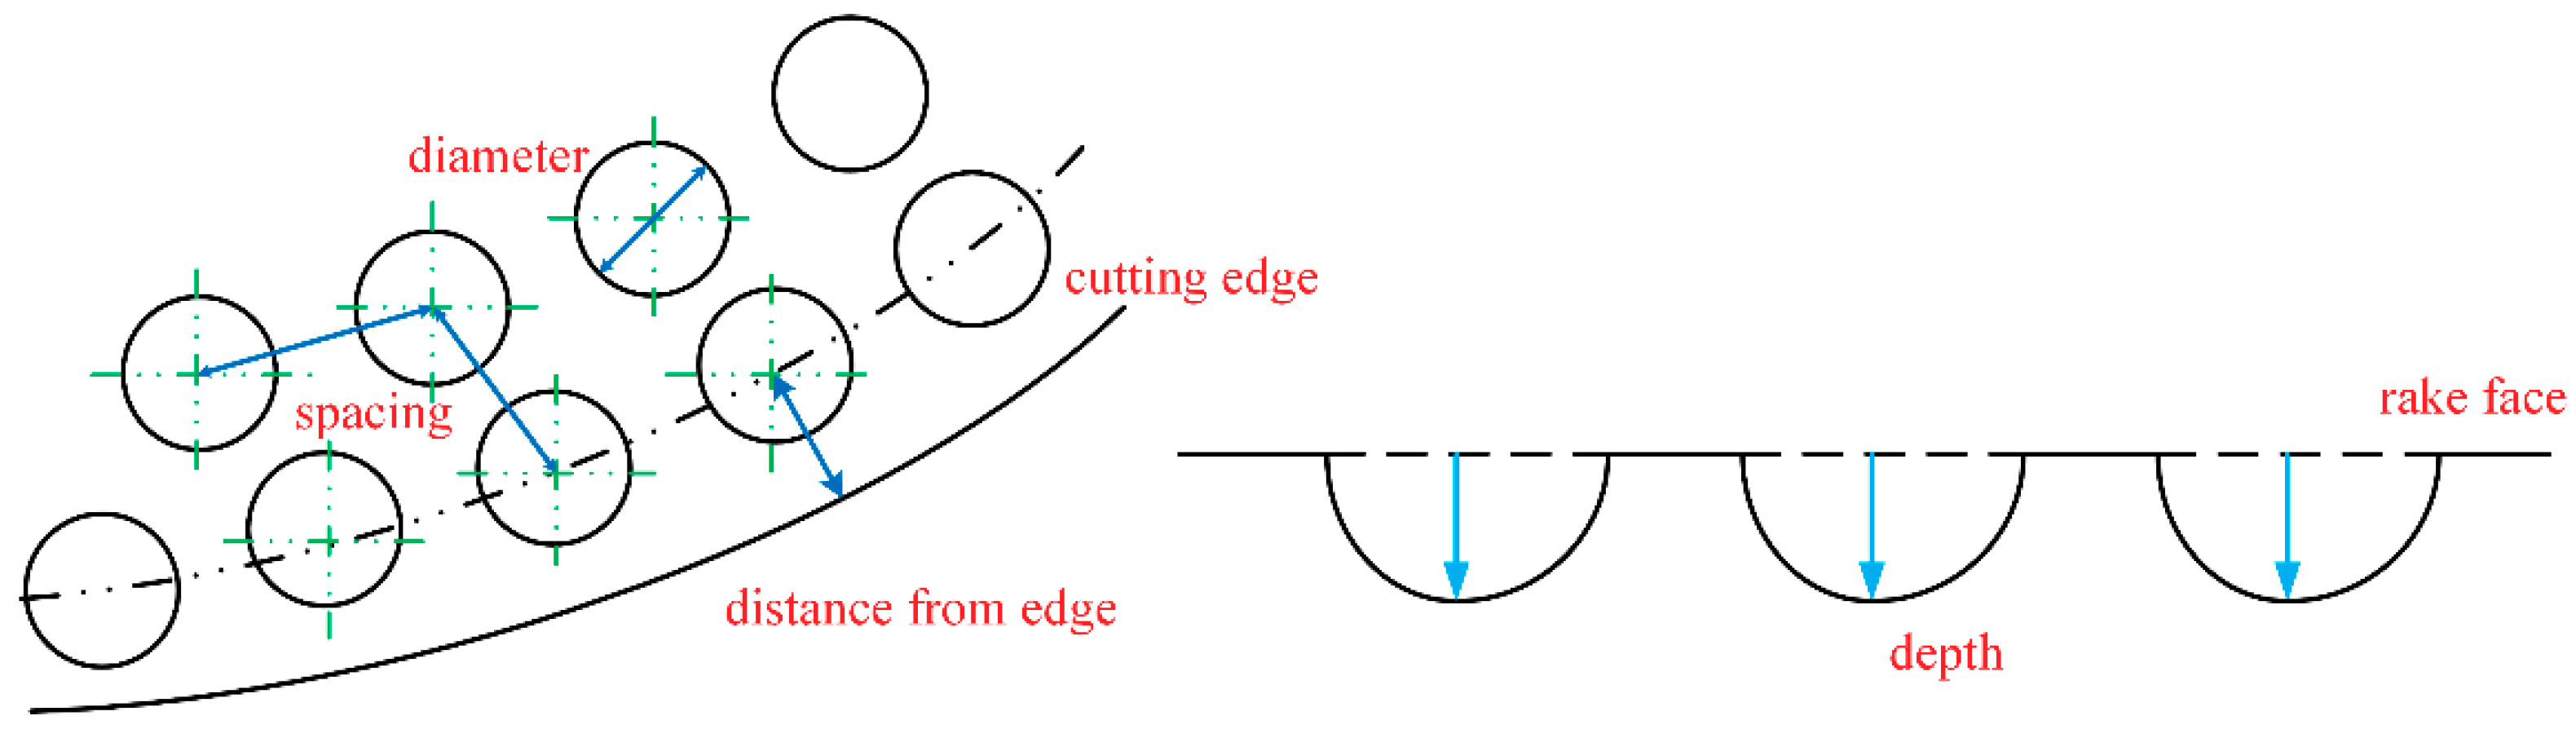
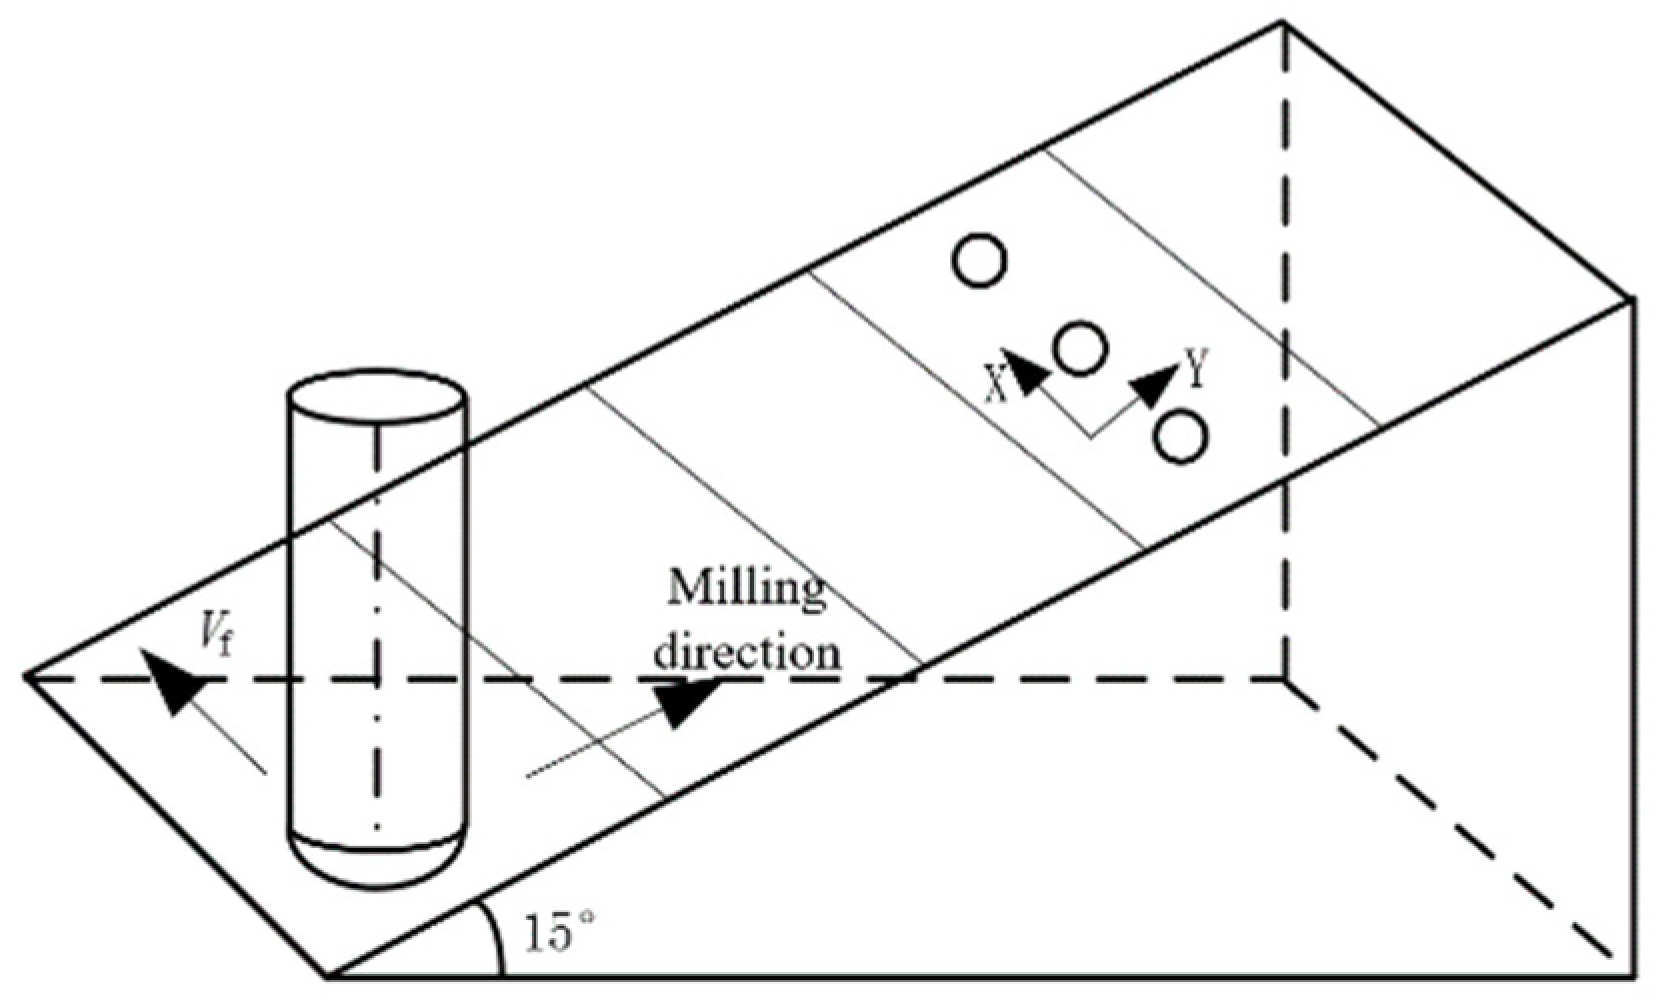
2.1. Milling Test

The workpiece material used in the test was α + β type titanium alloy Ti-6Al-4V. Its physical properties and chemical composition are shown in Table 1. The workpiece samples were 152 × 10 × 88 mm rectangular plates. They were clamped into a fixture with a 15° inclined plane. The workpiece and assembly are shown in Figure 1. YG8 cemented carbide BNM-20 indexable ball-end milling cutter with a BNML-200105S-S20C rod were used for the machining. The cutter rod and blade are shown in Figure 2.
The micro-texture was fabricated using a fiber laser, whose parameters were as follows: a wavelength of 1064 nm; a maximum output power of 70 W; a frequency of 3.14 kHz; a scanning speed of 500 mm/s; and the number of scans—2. After preparation of the micro-texture, 2000# metallographic sandpaper and ultrasonic cleaning machine were used to grind the rake face and remove burrs and an acetone solvent was used to clean the tool for 15–20 min. The processing flow is shown in Figure 3.
An inappropriate selection of micro-texture parameters can accelerate the wear on the rake face and the likelihood of the cutting edge breaking. In this study, drawing upon prior research [15], the micro-pit diameter ranged between 30 and 60 µm, the depth was between 40 and 70 µm, the spacing was between 125 and 200 µm, and the distance from the cutting edge was between 90 and 120 µm. The representative meaning of each parameter is shown in Figure 4. The ultra depth of the field microscope was used to detect the micro texture after laser processing. After testing, it was determined that the parameters of the micro texture met the design requirements and would ensure the accuracy of the test; Figure 5 shows the micro texture under the superfield microscope.
A VDL-1000E three-axis NC milling machine was used for the actual testing. The milling methods were direct milling, unidirectional cutting and line cutting. The cutting parameters are shown in Table 2.
The influence of the different texture parameters on the machined surface’s residual stress were studied and analyzed. A four factor, four level orthogonal test was, therefore, designed to assess the surface hardening impact of the diameter, depth, spacing and distance from the cutting edge of the micro-pit texture. The factor levels are shown in Table 3.

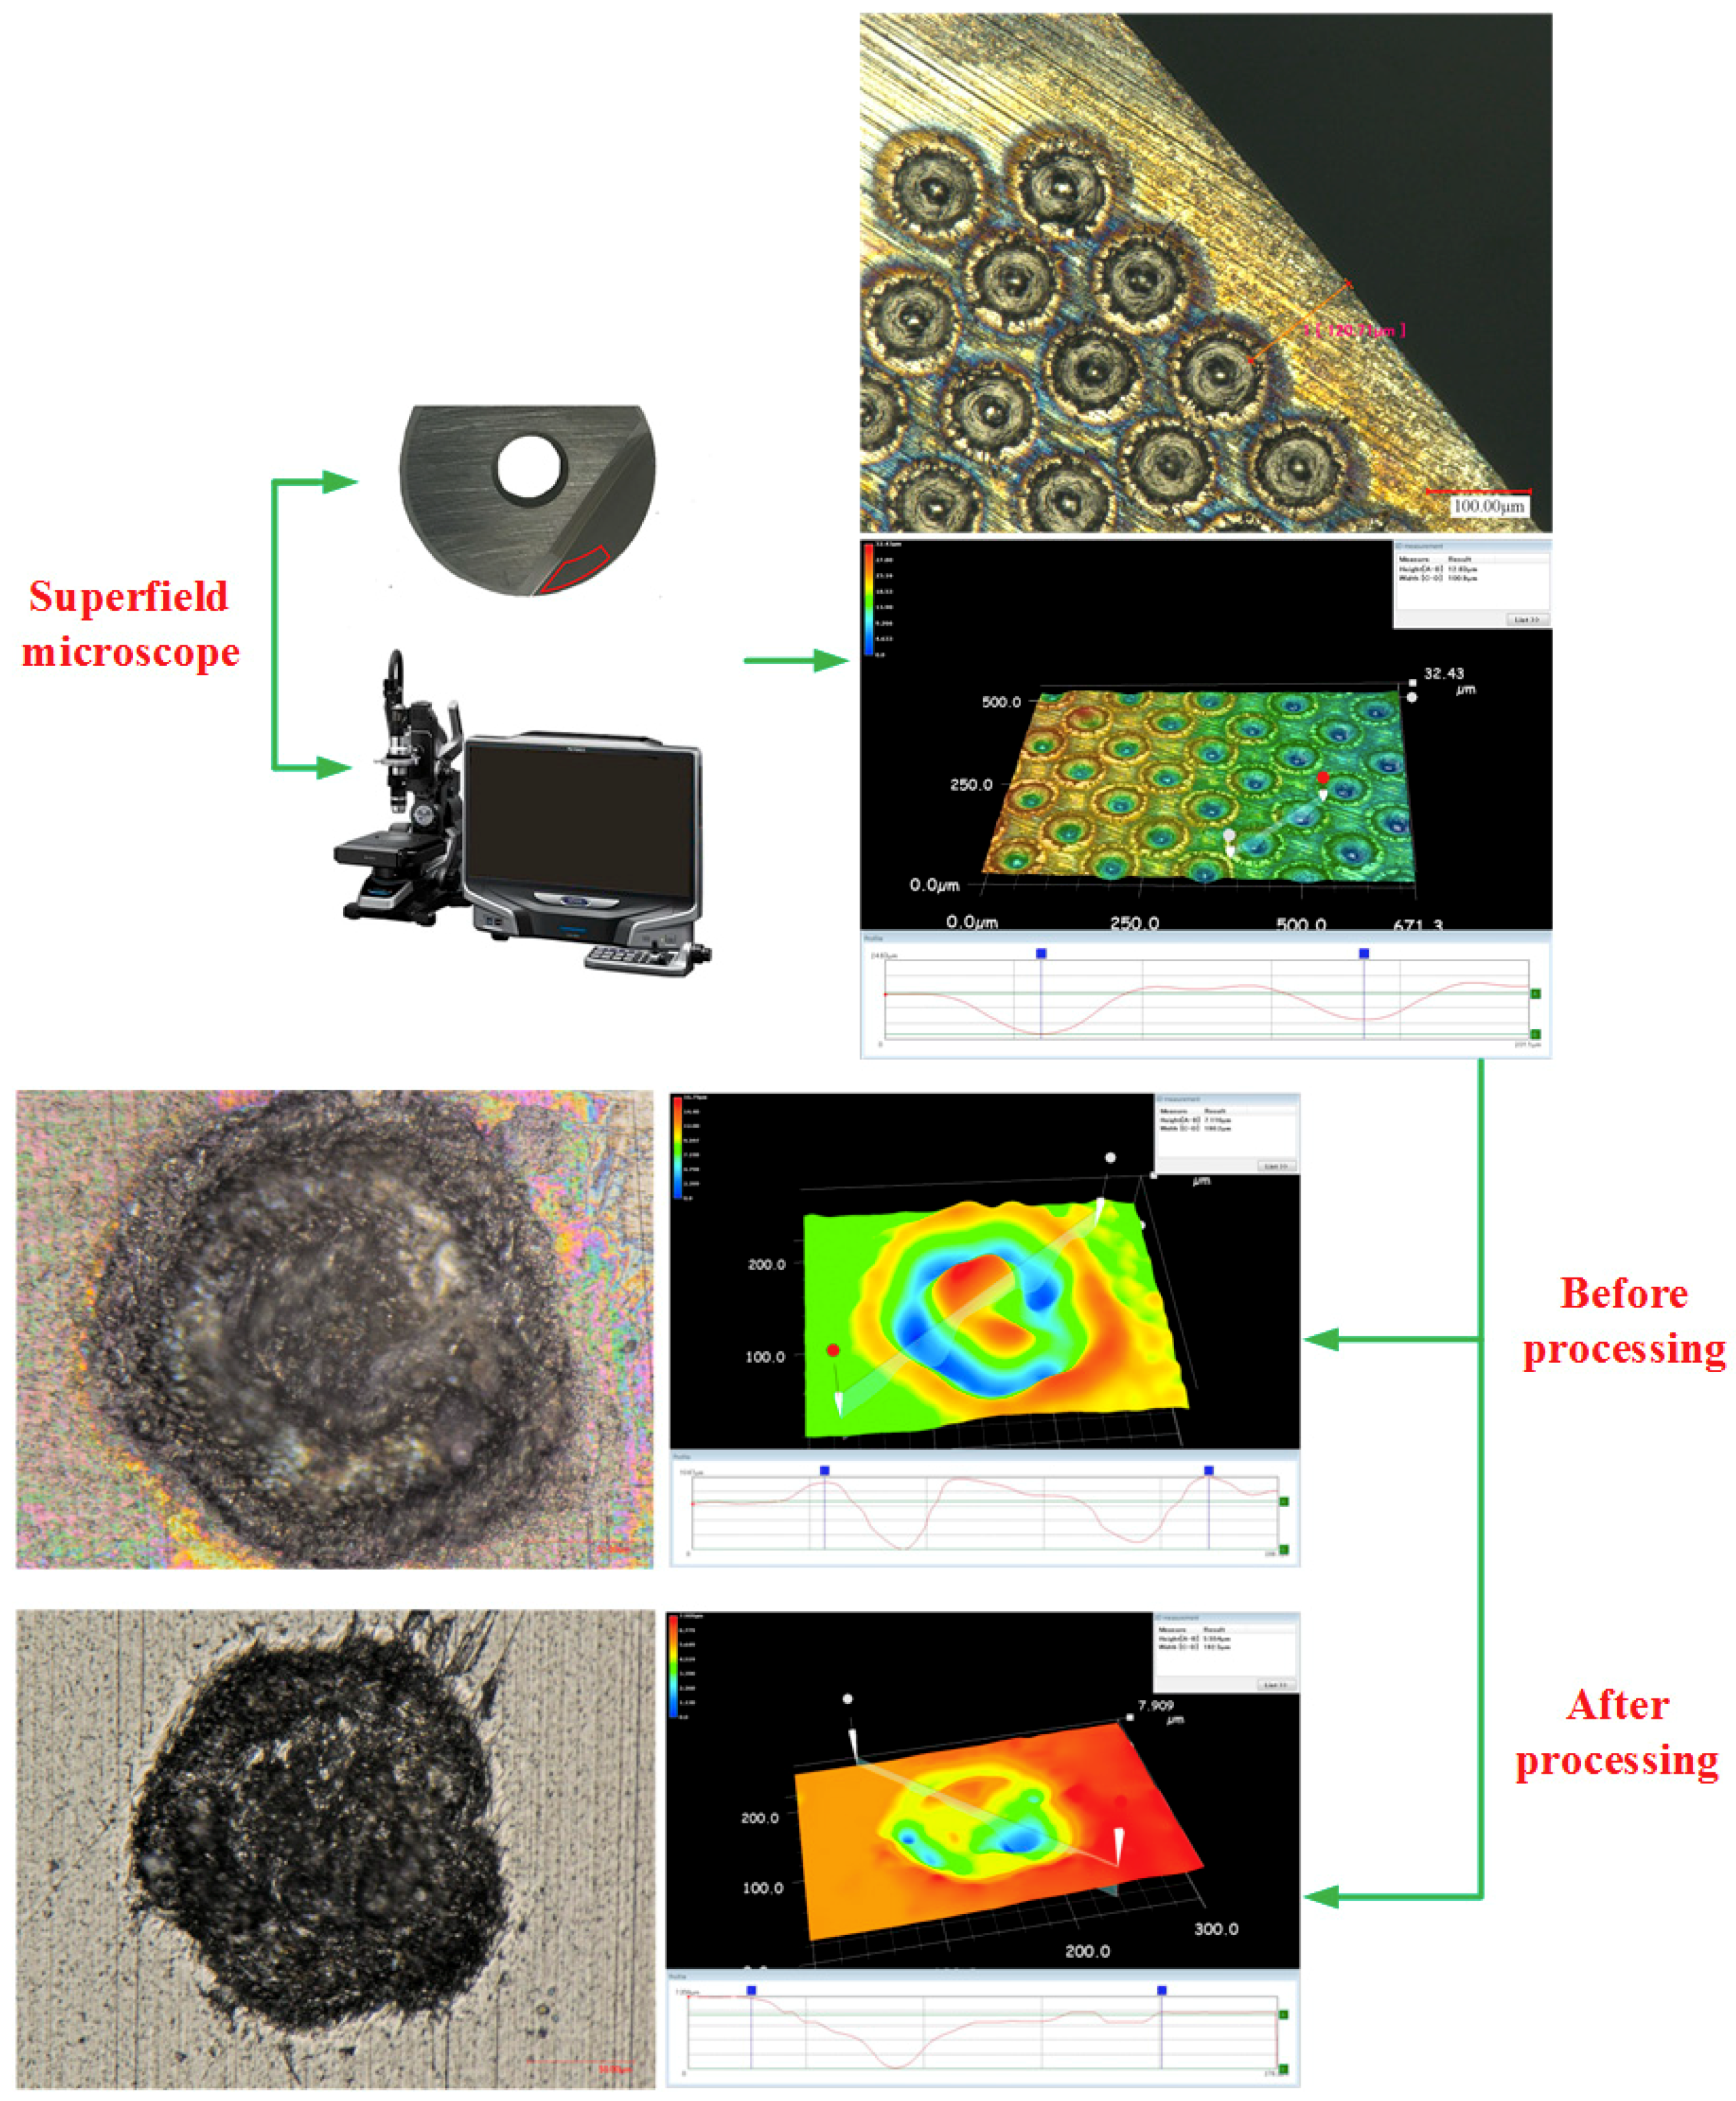
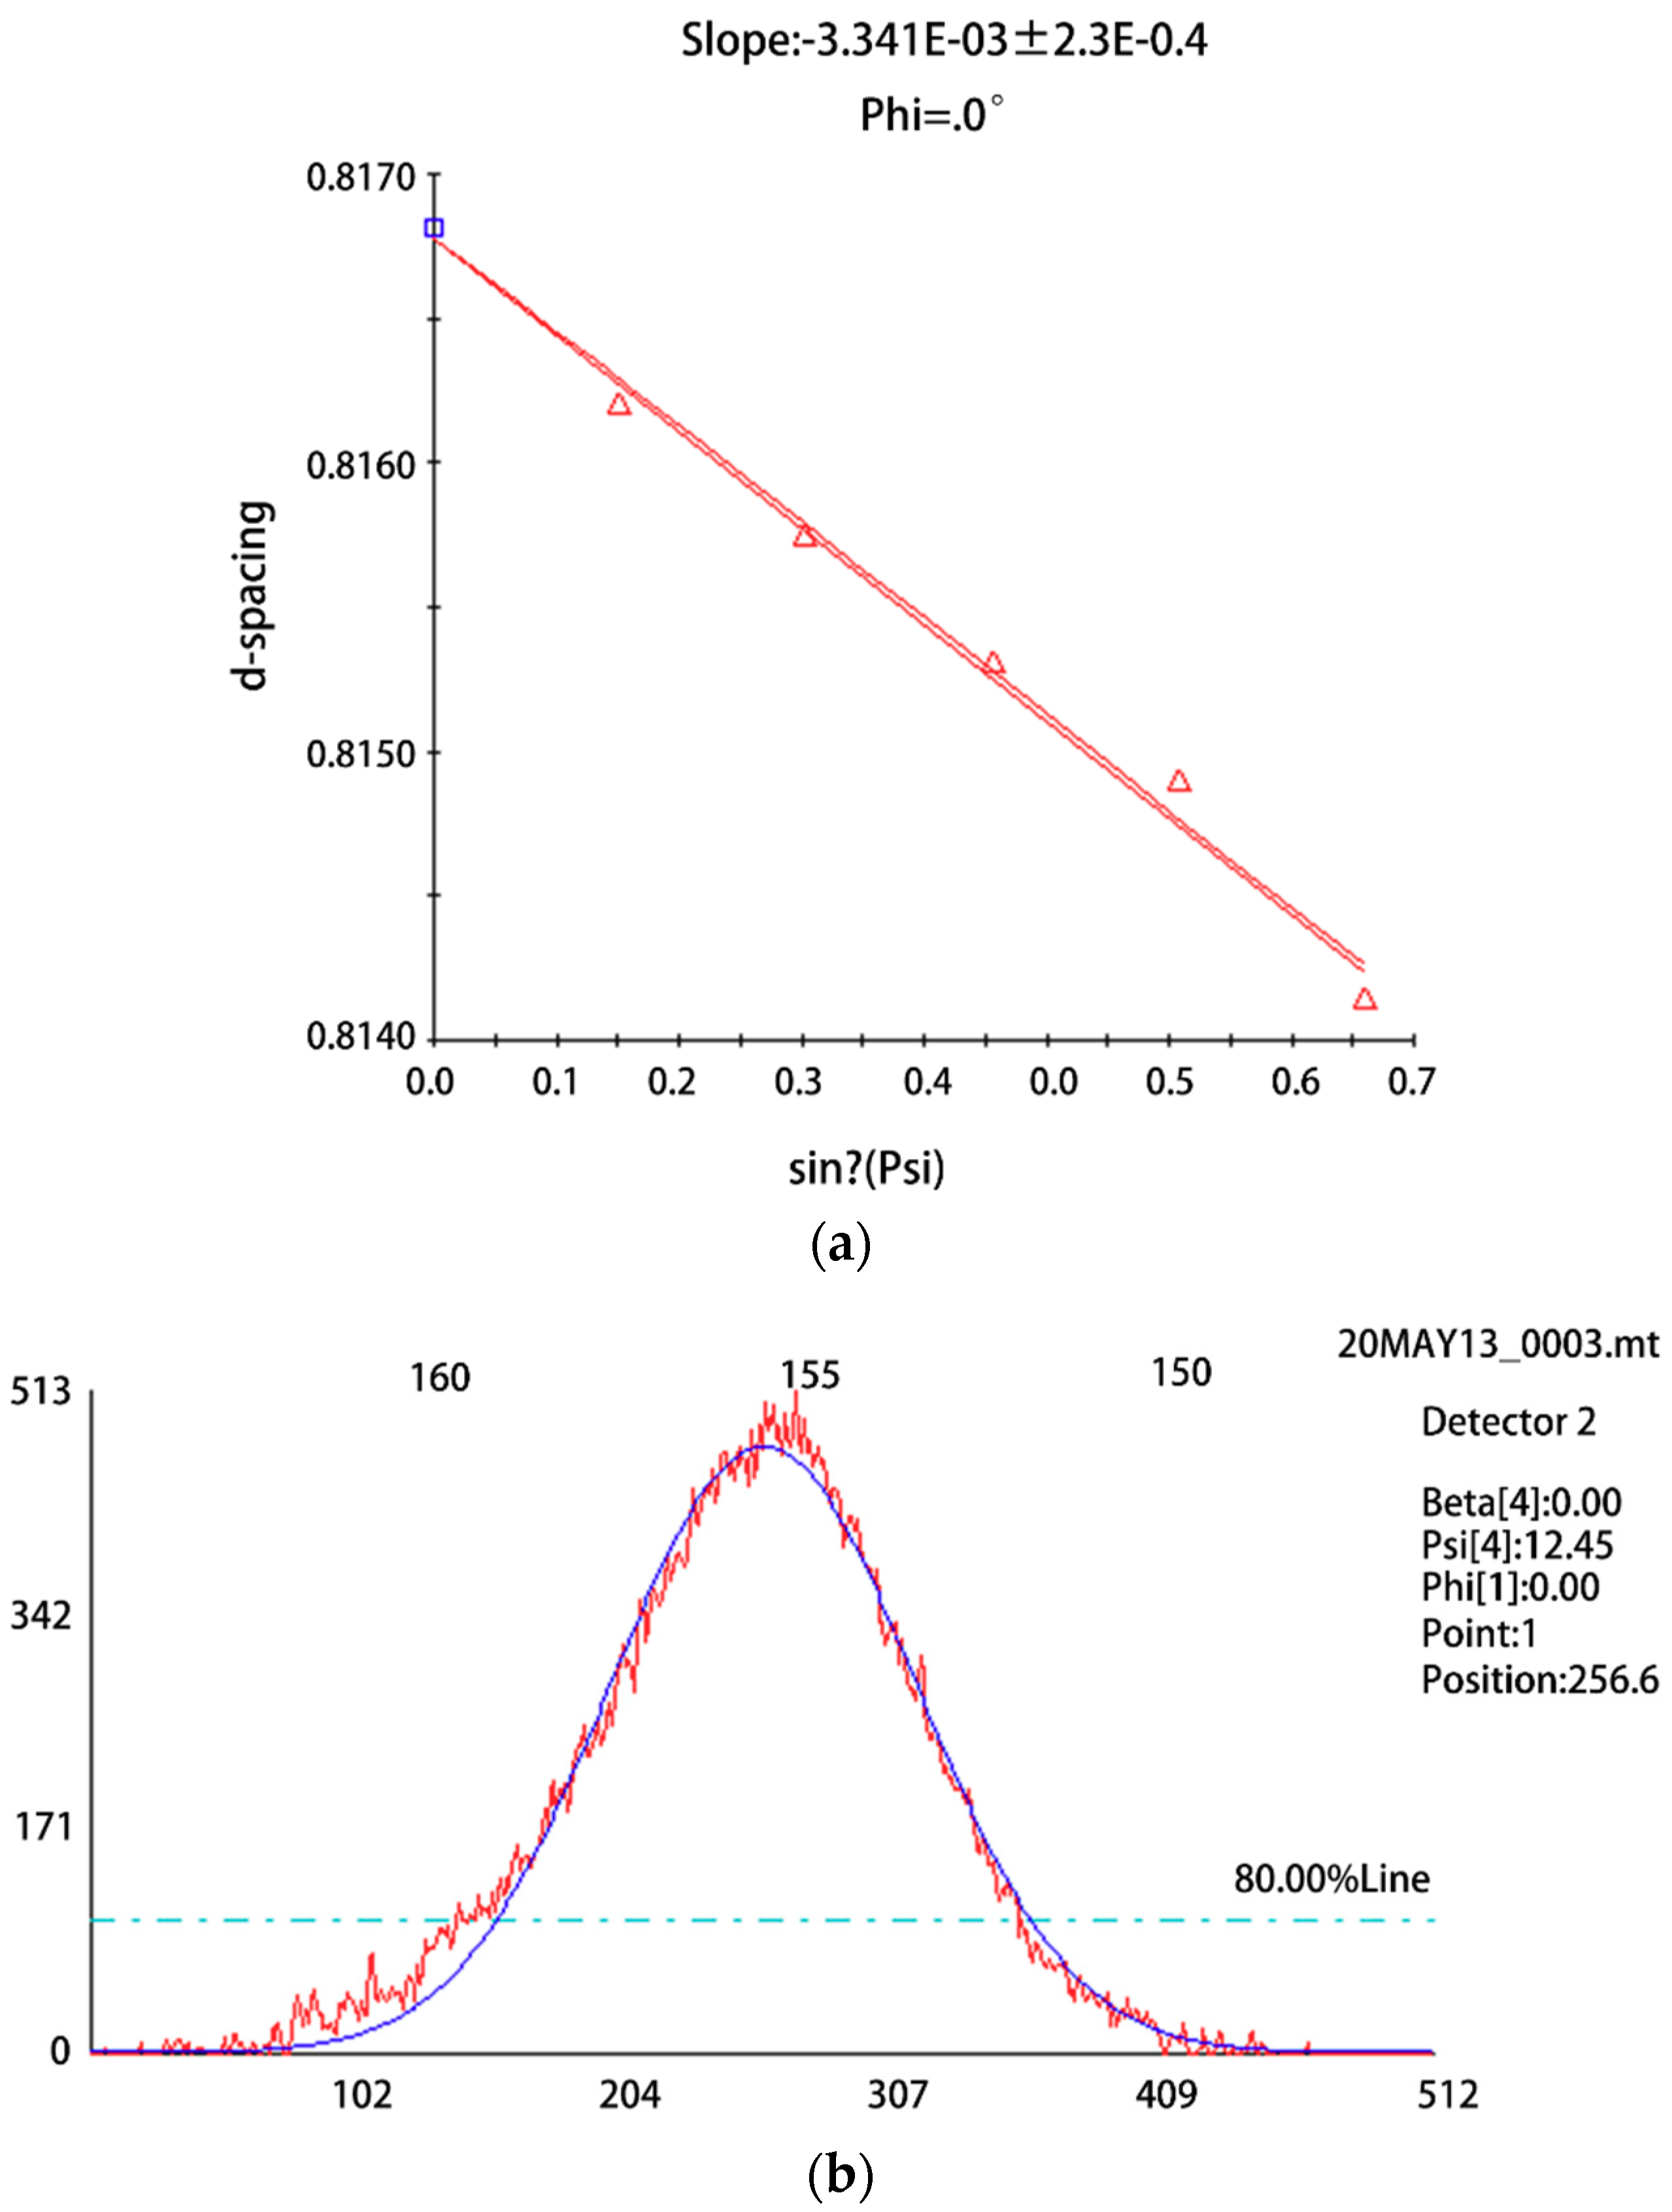
2.2. Residual Stress Measurement

The X-ray diffraction stress of the titanium alloy specimens was measured using an XRD diffractometer [16]. The basic parameters of the diffractometer were set as follows: 25 kV voltage; 5.5 mA current; 2 mm radius for the X-ray collimator; and 15 s illumination time. Before measuring the residual stress, the diffractometer needed to be calibrated using standard silicon powder. The optimum distance from the ortho-ray collimator to the surface of the titanium alloy workpiece was determined to be 15.78 mm.
When measuring residual stress with an XRD diffractometer, the accuracy of the results depends on the location of the diffraction peaks. Parabola, correlation and gravity center methods are the three most common approaches to determining the peaks. However, any distortion resulting in irregular peak shapes renders these methods ineffective [17,18]. We, therefore, used a Gaussian function to fit the peaks linearly instead. The fitting coefficient R, slope fitting and diffraction peak fitting are shown in Figure 6.
Before measuring the residual stress on the machined surface, the surface needed to be cleaned with an ethanol solvent and the sample had to be placed on a measuring platform to ensure it was parallel to the direction of the stress tester in the direction of the milling feed. Figure 7 illustrates the stress measurement diagrammatically. Three test points were selected in the direction of the feed on a 15-degree inclined plane and the residual stress values for the feed direction and milling direction were obtained at each test point. The average residual stress for the three points was used as the final value.

3. Test Results and Discussion

3.1. Test Results and Data Processing

To study the influence of the micro-textural parameters on the surface residual stress, including the diameter, depth, separation distance and distance from the cutting edge of the micro-pits, an orthogonal test was adopted. The results were analyzed using range analysis. The outcomes of the residual stress tests and range analysis are shown in Table 4 and Table 5.
The maximum difference value of the four factors was obtained using extreme difference analysis. The order of influence on the surface residual stress in direction X for the texture parameters was: separation distance > distance from cutting edge > diameter > depth.
The order of the influence on the surface residual stress in direction Y for texture parameters was: diameter > distance from cutting edge > separation distance > depth.

3.2. Discussion

During the cutting process, the generation of residual stress has a strong relationship with the cutting force, the thermal load and the internal microstructure of the material. Whether the kind of stress located on the processed surface is tensile or compressive stress depends on the material’s performance and the cutting conditions [19]. The cutting force causes uneven plastic deformation of the surface layer of the workpiece. This is manifested in two ways: a “plastic protrusion” effect in the front area of the tool contact point; a “squeezing effect” caused by the tool flank [20]. The former causes residual tensile stress on the machined surface; the latter produces residual compressive stress. The influence of the micro-textural parameters on the surface residual stress is shown in Figure 8.
When a micro-textured ball-end cutter is used to mill titanium alloy, the actual contact area between the knife and the outflowing chip is reduced by the micro-texture. This also reduces the friction between the contact surface of the cutter and the chip, thereby diminishing the cutting force and cutting temperature. The degree of plastic deformation on the metal’s surface is reduced in turn; thus, limiting the residual stress.
As the diameter of the micro-pits increases, the absolute value of the stress in the milling direction decreases. The thermoplastic effect caused by the increase in cutting temperature causes an absolute increase in the residual compressive stress. Thus, there is an intermediated relationship between cutting temperature and residual compressive stress. At the same time, the cutting force in the feed direction will continuously increase and the residual compressive stress produced by the mechanical stress will work to partly offset the residual compressive stress. However, the effect of the cutting temperature on the residual stress is more significant because the cutting heat on the front of the cutter accumulates. The combined effect of these two kinds of stress reduces the absolute value of the feed stress. Over time, the cutting temperature increases rapidly. As the cutting stroke is completed, the cutting temperature slowly increases. Therefore, the absolute value of the feed stress decreases gradually after its initial increase.
As the depth of the micro-pits increases, the stress curve in the milling direction reaches an inflection point where the absolute stress value, having initially increased, begins to decrease. During this process, the thermoplastic effect caused by the cutting temperature is still dominant. In the direction of the feed, there is no obvious change in the residual stress on the surface of the workpiece. So, the depth of the micro-pits has no obvious effect on the residual stress in the direction of the feed.
With an increase in the distance between the micro-pits, the cutting temperature becomes too great to easily dissipate because of the decrease in the available heat dissipation area. Thus, the residual compressive stress caused by the thermoplastic effect is larger than the compressive stress produced by the mechanical effect. The combined outcome of these two effects is that the absolute value of the residual stress in the milling direction initially decreases, but then increases. The absolute value of the surface residual stress in the direction of the feed, contrariwise, increases at first, then decreases, and then starts to increase again.
As the distance between the micro-pits and the cutting-edge increases, the absolute value of the surface residual stress in the milling direction increases as well. This is because, when the distance from the cutting edge is greater, the texture is not able to play a full role in the cutting process. The cutting temperature, thus, increases and continues to dominate, leading to an increase in the absolute value of the surface residual stress in the milling direction. In the direction of the feed, the surface residual stress initially decreases, and then increases. This is a result of the texture being positioned too near to the cutting edge, undermining the tool’s strength.

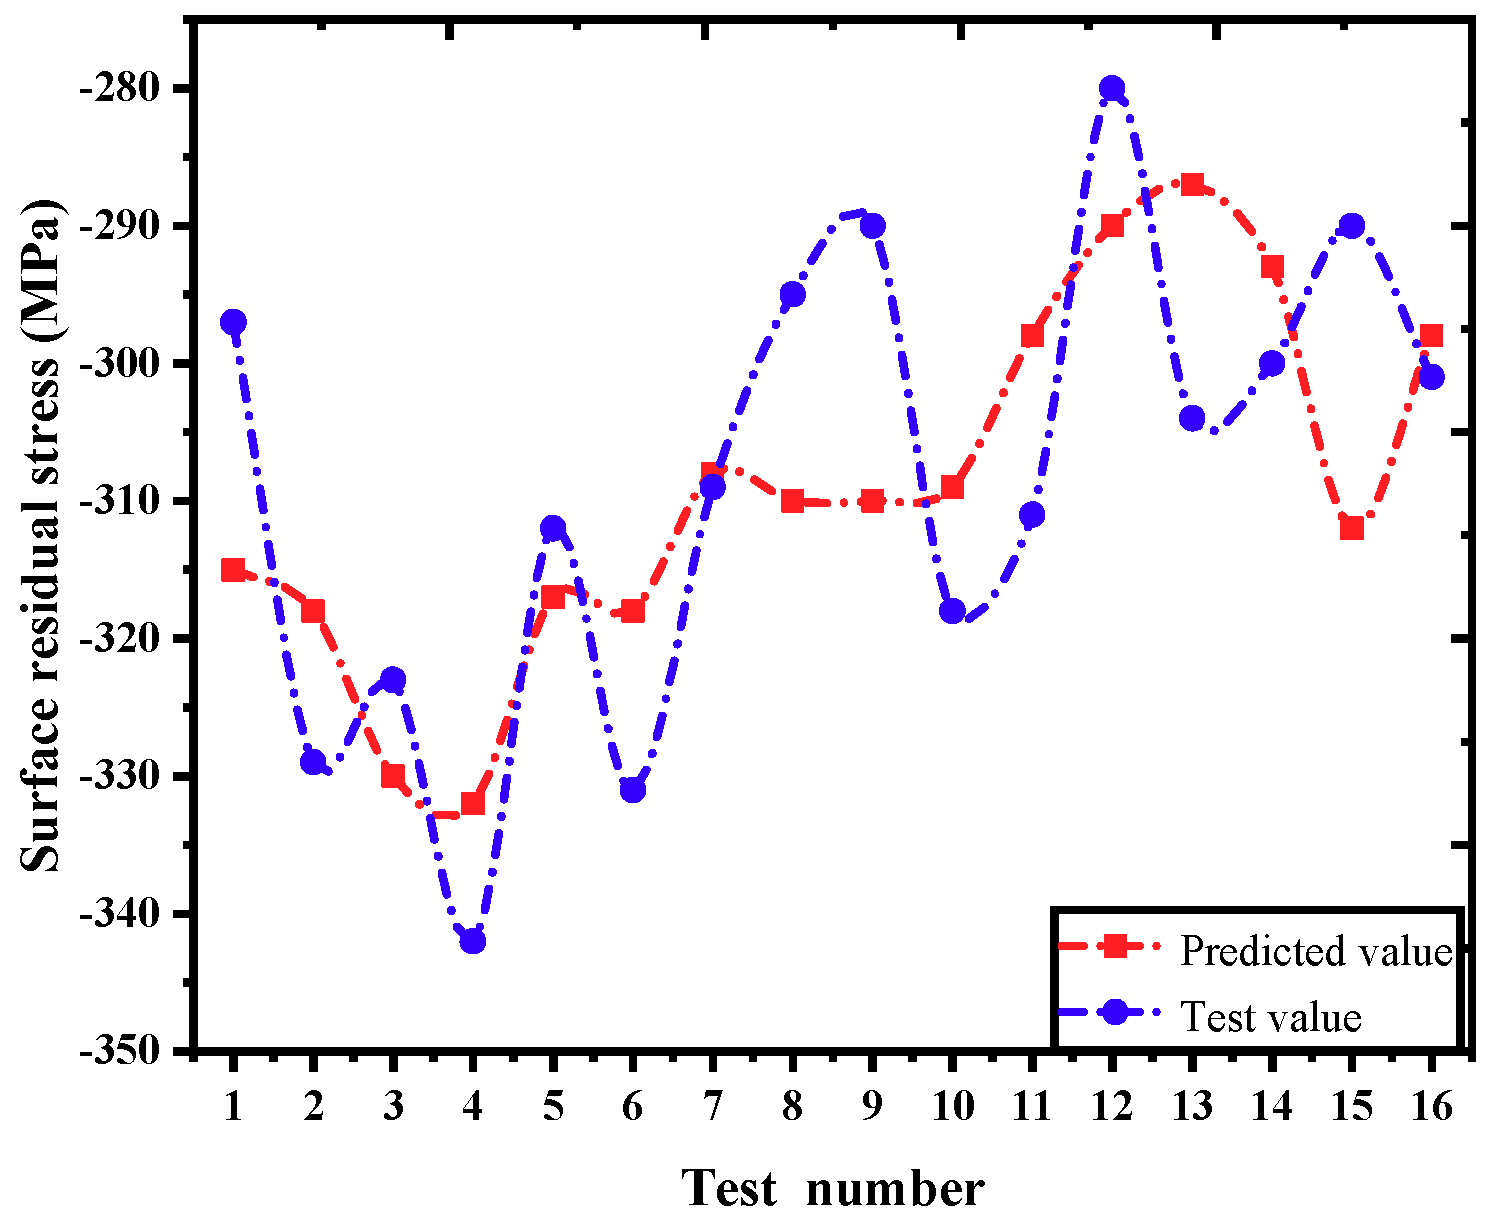
4. Prediction Model and Test of Its Significance Based on a Support Vector Machine

Establishing regression analysis models with data optimized by a support vector machine has high precision. The most important part of the support vector regression model is the loss function. The functions is
Ω = { f ( x , ϑ ) | ϑ Λ } ,
where ϑ is a positive coefficient.
The insensitive loss function balances the function of the smoothing degree and the error items, and increases the degree of application of the function. Two insensitive functions used in this thesis can be expressed as
L ε m ( y , f ( x , ϑ ) ) = { 0 | y f ( x , ϑ ) | 2 ε m | y f ( x , ϑ ) | ε m e l s e
In this paper, the method of data optimization is nonlinear regression analysis. In the high-dimensional characteristic space, the calculation process of a nonlinear regression model is the inner product among the parameters. The kernel function k ( x , y ) is used to replace ϕ 1 ( x ) ϕ 1 ( y ) , and the optimization model of the nonlinear regression is solved under the following conditions.
min ϑ ( * ) R 2 k n 1 2 i , j = 1 k n ( ϑ i * ϑ i ) ( ϑ j * ϑ j ) k ( x j x j ) + ε m i = 1 k n ( ϑ i * + ϑ i ) i = 1 k n y i ( ϑ i * ϑ i ) i = 1 k n ( ϑ i * ϑ ) = 0 0 ϑ i , ϑ i * C z , i = 1 , , k n
In the sample capacity, the sample data is the support vector ϑ ( * ) . The function f(x) is expressed as
f ( x ) = i = 1 k n ( ϑ i * ϑ i ) k ( x i , x ) + b z ;
bz in the formula is expressed as:
b z = y j i = 1 l ( ϑ i ( * ) ϑ i ) k ( x j , x i ) ± ε m ϑ j ( 0 , C z ) .
The kernel function is the core function of the SVM algorithm. Defining the characteristic space F 1 mapped to space X 1 is φ 1 , which can be expressed as
x X 1 ϕ 1 ( x ) F 1 .
Set ( x , z ) X 1 , the kernel function can be represented as
k ( x , z ) = ϕ 1 ( x ) ϕ 1 ( z ) .
The kernel function is solved. k ( x , z ) R 2 is a symmetric function, and if g 2 ( x ) d x < and g 0 , expand the kernel function according to the positive coefficient ϑ . The expansion of the kernel function can be obtained as follows.
k ( x , z ) = i = 1 ϑ i ϕ i ( x ) ϕ i ( z ) .
The function g ( x ) is
k ( x , z ) g ( x ) g ( z ) d x d z 0 .
The function that satisfies Equations (8) and (9) is called the kernel function of the inner product k ( x , x i ) . In this thesis, the Gaussian kernel function is first chosen when using SVM regression to optimize data. The kernel function of the Gaussian radial is expressed as
k ( x , x i ) = exp { x x i 2 2 σ 1 2 } ,
where xi is the center of the kernel function, and the σ1 is the parameter of the width.
The data were optimized by using a support vector regression machine with MATLAB. The type of SVM was selected as SVR and the type of kernel function was Gauss kernel function. The gamma function in the kernel function was 0, the penalty coefficient was 106, the parameter of v-SVR was 0.5, the loss function in e-SVR was 0.1, the memory size was 100 MB and the allowable termination error was 0.001.
The research content of this paper is the influence of the surface micro-textural parameters of a ball-end milling cutter on the residual stress of milling a titanium alloy surface, so we established a regression model of residual stress as follows:
σ = C d α 1 h α 2 L 1 α 3 L 2 α 4 .
According to the residual stress data measured by the test, the prediction model is solved by multiple linear regression equation based on the principle of least square method. Through data processing with Excel software, the model is as follows:
σ = 10 4.4943 d 0.2430 h 0.2047 L 1 0.1103 L 2 0.4606 .
After the establishment of the prediction model, the significance of the model was tested by variance analysis to ensure the linear relationship, Table 6 presents the results of the variance analysis. Variance test results show that the significance F is less than 0.05: F(m,n − m + 1) = F0.95(4,11) = 3.527269 > 3.36. Therefore, the prediction model is significant.
Figure 9 is the comparison between the predicted value of the surface residual stress and the test value. In general, the relative error range is within 10%, which validates the reliability of the model. The establishment of the prediction model can make a good choice between the micro-textural parameters and the residual stress of the machined surface.

5. Conclusions

In this paper, the results have been presented for an experiment relating to the milling of titanium alloy with a micro-textured ball-end cutter. From the experiment we can make the following conclusions:
(1)
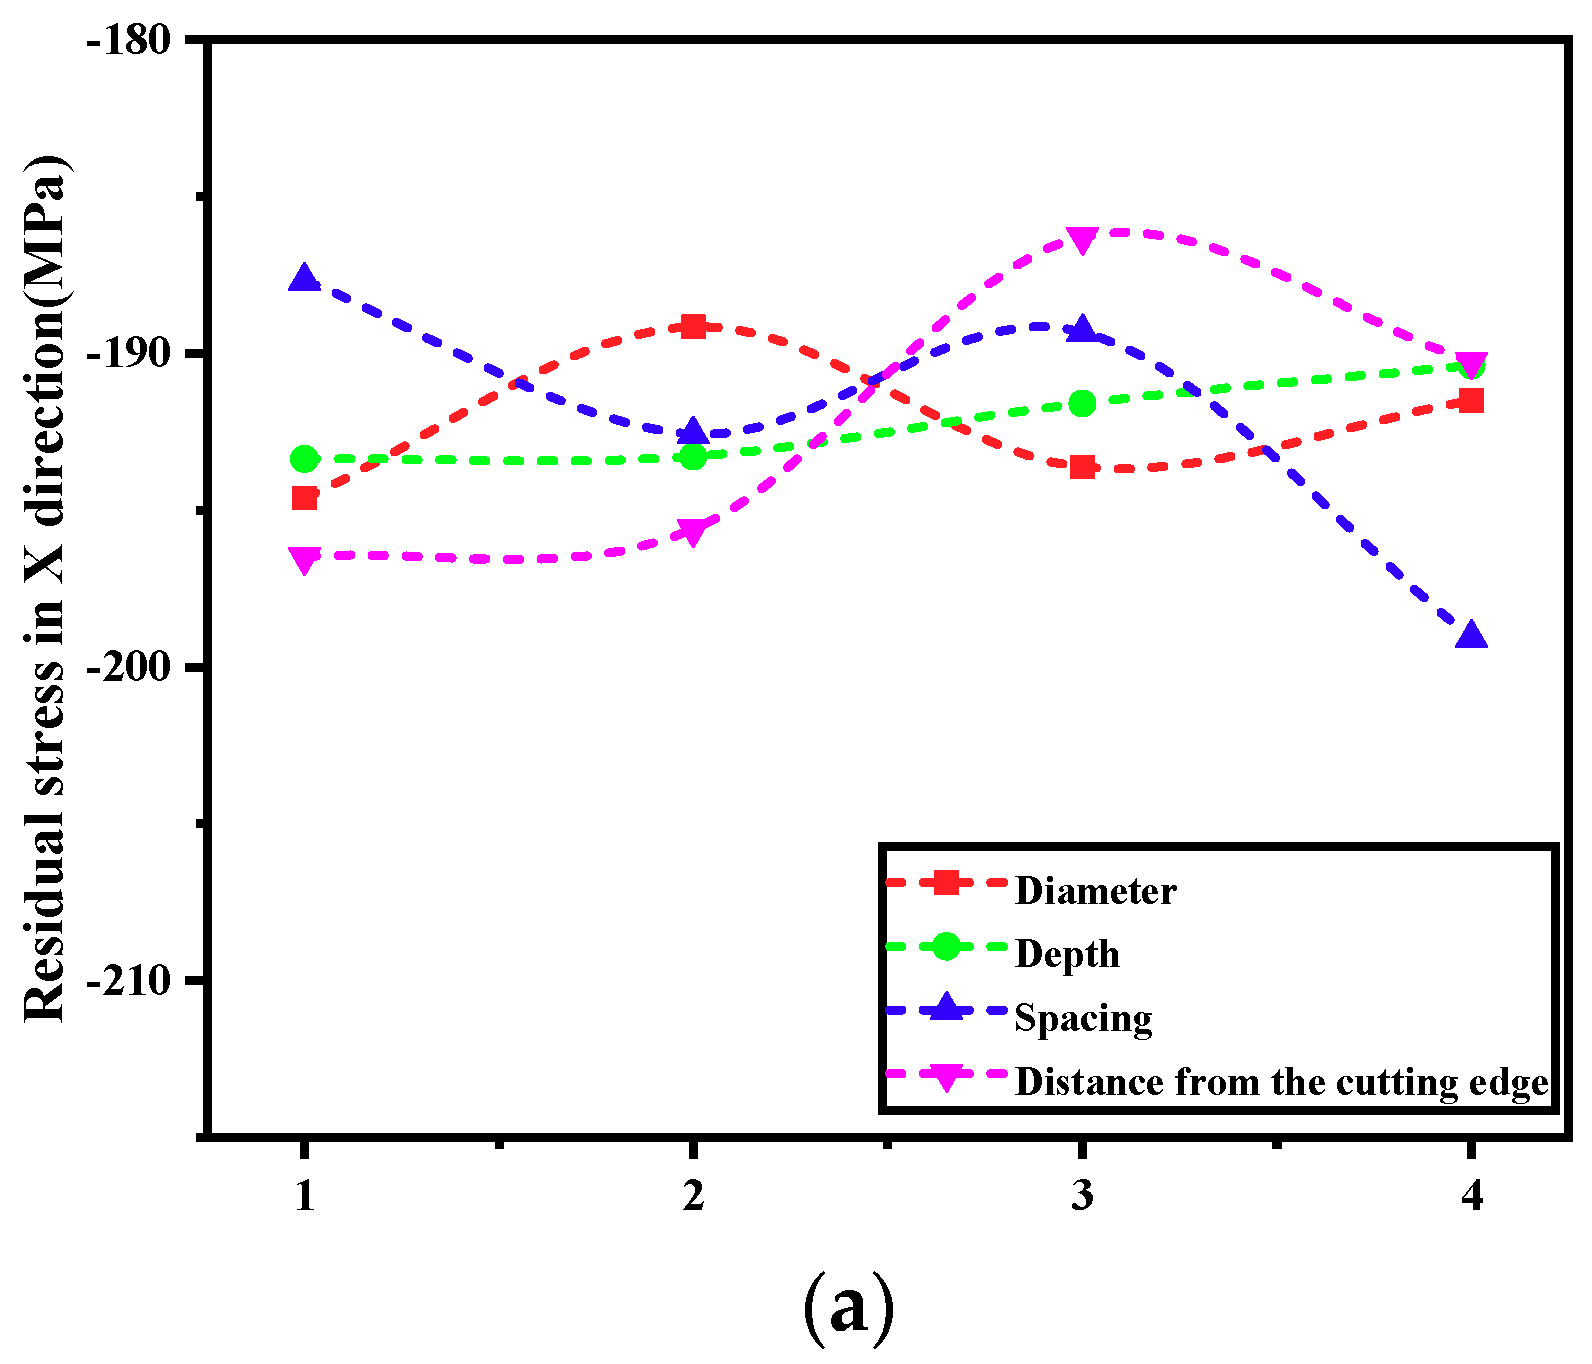
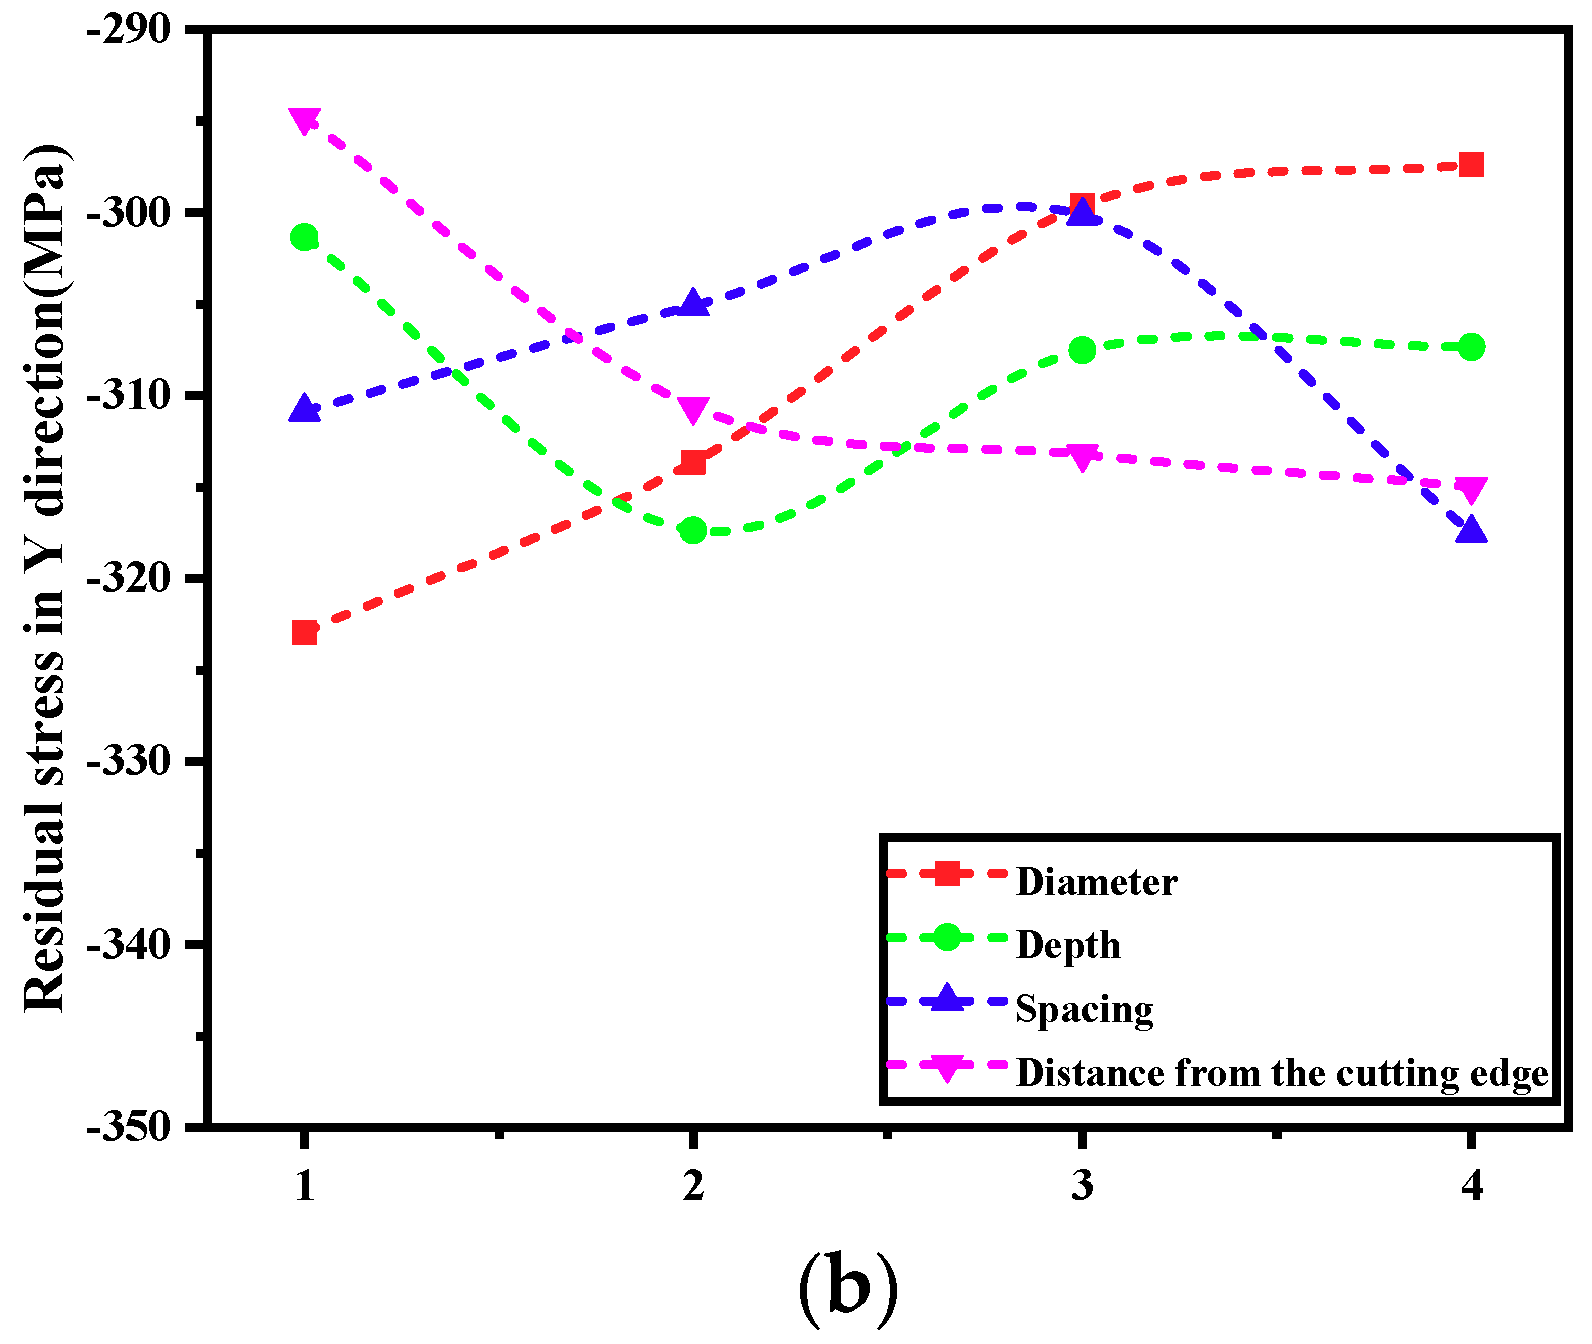
The order of influence of different micro-pit texture parameters on surface residual stress in the milling direction is: the diameter > the distance from cutting edge > the separation distance > the depth. The order of the influence of the texture parameters on the surface residual stress in the feed direction is: the separation distance > the distance from cutting edge > the diameter > the depth.
(2)
As the micro-pit diameter increases, the absolute value of the surface residual stress in the milling direction decreases. Under the combined action of cutting temperature and cutting force, the absolute value of the feed stress increases, and then decreases. As the depth of the micro-pits increases, the absolute value of the milling stress initially increases, and then decreases. However, in the feed direction, the depth makes no obvious difference to the surface residual stress. As the spacing between the micro-pits increases, the absolute value of the stress in the milling direction decreases at first, and then increases. In the feed direction, it starts to increase, decreases, and then increases again. An increase in the distance between the micro-pits and the cutting-edge results in an increase in the absolute value of the stress in the milling direction. In the feed direction, the surface residual stress starts off by decreasing; then it increases.
(3)
The principal surface stress produced by milling titanium alloy with a micro-textured ball-end cutter is residual compressive stress. This has a value in the range of −320 to −185 MPa, with the stress in the milling direction being notably greater than in the feed direction. The surface residual stress in the feed direction is between −200 and −185 MPa. In the milling direction it is between −320 and −295 MPa. Regression analysis was conducted on the orthogonal test results and a residual stress prediction model was established. The reliability of the model was confirmed by comparing the experimental values with the values predicted by the model.
After milling, the residual stress value of workpiece surface is too large, which seriously affects the service life of workpiece, and the surface quality and service life of titanium alloy parts can be improved by machining micro-texture on the tool. The research content of this paper provides design ideas and theoretical support for the design of new cutting tools.

Author Contributions

Conceptualization, S.Y. (Song Yu); methodology, S.Y. (Song Yu); software, Y.Z.; validation, S.S.; formal analysis, Y.Z.; writing—original draft preparation, S.Y. (Song Yu); writing—review and editing, S.Y. (Song Yu); visualization, S.Y.; supervision, X.L.; project administration, S.Y. (Shucai Yang); funding acquisition, S.Y (Shucai Yang).

Funding

National Natural Science Foundation of China: 51875144.

Conflicts of Interest

The authors declare no conflict of interest.

References

  1. Yang, S.C.; Zhang, Y.H.; Wan, Q.; Chen, J.J.; Feng, C. Study on the Tool Wear of Coated Carbide Tool in High Speed Milling Titanium Alloy. Mater. Sci. Forum 2014, 800, 526–530. [Google Scholar] [CrossRef]
  2. Chen, T.; Qiu, C.; Liu, X. Study on 3D topography of machined surface in high-speed hard cutting with PCBN tool. Int. J. Adv. Manuf. Technol. 2016, 91, 2125–2133. [Google Scholar] [CrossRef]
  3. Lyubenova, N.; Bähre, D.; Krupp, L.; Fouquet, J.; Cronier, T.; Patel, J.; Hoffmann, J.E. Impact of the Process Parameters, the Measurement Conditions and the Pre-Machining on the Residual Stress State of Deep Rolled Specimens. J. Manuf. Mater. Process. 2019, 3, 56. [Google Scholar] [CrossRef]
  4. Brünnet, H.; Lyubenova, N.; Müller, M.; Hoffmann, J.E.; Bähre, D. Verification and Application of a New 3D Finite Element Approach to Model the Residual Stress Depth Profile after Autofrettage and Consecutive Reaming. Procedia CIRP 2014, 13, 72–77. [Google Scholar] [CrossRef]
  5. Jiao, F.; Niu, Y.; Zhao, B. Research Progress of Residual Stress in Milling of Difficult-to-machine Materials. Surf. Technol. 2017, 46, 267–273. [Google Scholar]
  6. Niu, Y.; Jiao, F.; Zhao, B.; Tong, J.L. Experiment of Machining Induced Residual Stress in Longitudinal Torsional Ultrasonic Assisted Milling of Ti-6Al-4V. Surf. Technol. 2019, 48, 41–51. [Google Scholar]
  7. Maqbool, F.; Bambach, M. Experimental and Numerical Investigation of the Influence of Process Parameters in Incremental Sheet Metal Forming on Residual Stresses. J. Manuf. Mater. Process. 2019, 3, 31. [Google Scholar] [CrossRef]
  8. Maqbool, F.; Bambach, M. Dominant deformation mechanisms in single point incremental forming (SPIF) and their effect on geometrical accuracy. Int. J. Mech. Sci. 2018, 136, 279–292. [Google Scholar] [CrossRef]
  9. Yang, C.Y.; Dong, C.S. Influencing Factors and Parameter Optimization of Residual Stress in Titanium Alloy Cutting Surface. Foundry Technol. 2017, 38, 34–38. [Google Scholar]
  10. Liu, W.T.; Liu, Z.Q. Finite element analysis of turning Ti-6Al-4V under high-pressure coolant. Mod. Manuf. Eng. 2018, 10, 44–50. [Google Scholar]
  11. Navas, V.G.; Gonzalo, O.; Bengoetxea, I. Effect of cutting parameters in the surface residual stresses generated by turning in AISI 4340 steel. Int. J. Mach. Tools Manuf. 2012, 61, 48–57. [Google Scholar] [CrossRef]
  12. Hemmesi, K.; Mallet, P.; Farajian, M. Numerical evaluation of surface welding residual stress behavior under multiaxial mechanical loading and experimental validations. Int. J. Mech. Sci. 2020, 168, 105127. [Google Scholar] [CrossRef]
  13. Li, Y.; Zhang, Y.; Li, X.; Li, Z.; Wang, G.; Jin, L.; Huang, S.; Xiong, B. Quenching residual stress distributions in aluminum alloy plates with different dimensions. Rare Met. 2019, 38, 1051–1061. [Google Scholar] [CrossRef]
  14. Yang, S.; Yu, S.; He, C. The Surface Integrity of Titanium Alloy When Using Micro-Textured Ball-End Milling Cutters. Micromachines 2018, 10, 21. [Google Scholar] [CrossRef]
  15. Li, Q.; Yang, S.; Zhang, Y.; Zhou, Y.; Cui, J. Evaluation of the machinability of titanium alloy using a micro-textured ball end milling cutter. Int. J. Adv. Manuf. Technol. 2018, 98, 2083–2092. [Google Scholar] [CrossRef]
  16. Cao, X.; Xu, Z.; Peng, Y.; Zhu, J.; Nie, Z. Current Development of Residual Stress Measurement and Research Methods. Low Temperature Architecture Technology. Low Temp. Archit. Technol. 2016, 38, 76–79. [Google Scholar]
  17. Han, Y.L.; Qi, J.F.; Cai, Q.; Yang, G.H.; Yang, B. Research on Measurement of Residual Stress of Welded 5A06 Aluminum Alloy Based on Synchrotron Radiation Diffraction Technology. Rare Met. Mater. Eng. 2019, 48, 205–212. [Google Scholar]
  18. Masmiati, N.; Sarhan, A.A.; Hassan, M.A.N.; Hamdi, M. Optimization of cutting conditions for minimum residual stress, cutting force and surface roughness in end milling of S50C medium carbon steel. Measurement 2016, 86, 253–265. [Google Scholar] [CrossRef]
  19. Patyk, R.; Bohdal, Ł.; Kułakowska, A. Study the Possibility of Controlling the Magnitude and Distribution of Residual Stress in the Surface Layer of the Product after the Process Double Duplex Burnishing. Mater. Sci. Forum 2016, 862, 262–269. [Google Scholar] [CrossRef]
  20. Burba, M.E.; Buchanan, D.J.; Caton, M.J.; John, R.; Brockman, R.A. Microstructure-Sensitive Model for Predicting Surface Residual Stress Relaxation and Redistribution in a P/M Nickel-Base Superalloy. In Proceedings of the 13th Intenational Symposium of Superalloys, Hoboken, NJ, USA, 31 August 2016; John Wiley & Sons, Inc.: Hoboken, NJ, USA, 2016. [Google Scholar]
Figure 1. Workpiece and assembly picture. (a) Workpiece dimension drawing; (b) assembly picture.
Jmmp 03 00094 g001
Figure 2. Tool rod and blade. (a) Physical map; (b) dimensional drawings. [14]
Jmmp 03 00094 g002
Figure 3. Micro-texture preparation process.
Jmmp 03 00094 g003
Figure 4. Schematic diagram of micro-texture parameters.
Jmmp 03 00094 g004
Figure 5. Micro-texture measurement after processing.
Jmmp 03 00094 g005
Figure 6. Slope and diffraction peak fitting results. (a) Slope fitting; (b) diffraction peak fitting.
Jmmp 03 00094 g006
Figure 7. Schematic diagram of the stress measurement platform.
Jmmp 03 00094 g007
Figure 8. The influence of the micro-textural parameters on the surface residual stress. (a) Residual stress values in the X direction. (b) Residual stress values in the Y direction.
Jmmp 03 00094 g008aJmmp 03 00094 g008b
Figure 9. Comparison of the predicted value and the test value of the surface residual stress.
Jmmp 03 00094 g009
Table 1. Physical and chemical properties of titanium alloy Ti-6Al-4V [14].
Hardness HRCDensity kg/m3Melting Point °CSpecific Heat J/kgKHeat Transfer Coefficient W/m·KPoisson’s Ratio vYield Strength MPaModulus of Elasticity GPa
364428160510127.9550.41825110
ElementAlVFeCNOTi
Content5.5~6.83.5~4.5≤0.30≤0.10≤0.05≤0.20allowance
Table 2. Cutting parameters.
Cutting Speed vcFeed Rate fzCutting Depth apCutting Width ae
120 m/min0.08 mm0.4 mm0.3 mm
Table 3. Factor level table.
FactorDiameter D (μm)Depth H (μm)Distance L1 (μm)Distance from Cutting Edge L2 (μm)
Level
1304012590
24050150100
35060175110
46070200120
Table 4. Surface residual stress results and range analysis in direction X.
Test NumberDiameter (μm)Depth (μm)Separation Distance (μm)Distance from Cutting Edge (μm)σx Average Value (MPa)
1304012590−183.6
23050150100−190.4
33060175110−195.467
43070200120−209
54040150110−199.133
64050125120−190.933
7406020090−185.767
84070175100−180.767
95040175120−192.467
105050200110−203.233
115060125100−191.6
12507015090−187.2
136040200100−198.267
14605017590−188.6
156060150120−193.567
166070125110−184.6
Test parametersfx1fx2fx3fx4
kx1−194.61675−193.36675−187.68325−196.49175
kx2−189.15−193.2915−192.575−195.60825
kx3−193.625−191.60025−189.32525−186.29175
kx4−191.5085−190.39175−199.06675−190.2585
Rx5.466752.97511.383510.2
Table 5. Surface residual stress results and range analysis in direction Y.
Test NumberDiameter (μm)Depth (μm)Separation Distance (μm)Distance from Cutting Edge (μm)σy Average Value (MPa)
1304012590−297.867
23050150100−326.433
33060175110−324.267
43070200120−343.233
54040150110−313.833
64050125120−337.267
7406020090−303.9
84070175100−299.667
95040175120−286.533
105050200110−315.6
115060125100−309.1
12507015090−287.3
136040200100−307.233
14605017590−290.2
156060150120−292.9
166070125110−299.2
Test parametersfy1fy2fy3fy4
ky1−322.95−301.3665−310.8585−294.81675
ky2−313.66675−317.375−305.1165−310.60825
ky3−299.63325−307.54175−300.16675−313.225
ky4−297.38325−307.35−317.4915−314.98325
Ry25.5667516.008517.3247520.1665
Table 6. Variance analysis of residual stress.
Source of VarianceSSDFMSFSignificance F
Ra0.00487440.0012183.5272690.043689
Residual0.0038110.000345
Total0.00867315

