Abstract
To solve the problems of low efficiency, poor surface quality, and short tool life in the milling of titanium alloys, this study took the micro-textured ball-end milling tool as a starting point and established a platform for friction and wear tests. Based on a new method of external friction theory, the anti-friction and anti-wear mechanisms of the micro-textured tool were analyzed. According to these mechanisms, the optimal area proportion of the micro textures in the contact area between the chip and tool was theoretically investigated considering the milling force, and the proportion was verified experimentally. This work provides a reference for improving the cutting performance of hard metal tools.
1. Introduction
Recent studies have demonstrated that micro textures can effectively reduce friction force, so micro textures with a regular arrangement can be prepared on the friction pair surface of tools. This method can significantly reduce the friction of the contact surface of friction pairs [1]. Numerous authors have conducted a substantial amount of related research in recent years.
Wojciechowski S, Chwalczuk T, Twardowski P, et al. [2] concentrated on the modeling of a cutter’s displacements during ball-end milling with various surface inclinations. The cutter’s displacements (vibrations) model was proposed. Subsequently, this model was validated empirically during the milling tests with various feed per tooth (fz), depth of cut (ap) and surface inclination angle (a) values. Experiments were carried out with the application of a laser displacement sensor and force dynamometer. The research revealed that the cutter’s displacements are strongly affected by the cutter’s run out and surface inclination. This observation is also confirmed by the developed model. A new approach to surface roughness parameters estimation during finish cylindrical end milling was presented by Wojciechowski S, Chwalczuk T, Twardowski P, et al. [3] In the first stage, tool working part instantaneous displacements was estimated. The height of the tool’s displacement envelope obtained was then applied in the second stage to the calculation of surface roughness parameters. These calculations assumed that in the cylindrical milling process two different mechanisms of surface profile formation exist. Which mechanism was present was dependent on the feed per tooth and the maximum height of the tool’s displacement envelope. The developed model was validated during the cylindrical milling of hardened hot-work tool steel 55NiCrMov6 using a stylus profiler and scanning laser. Vazquez Martinez J, Irene D S I, Iglesias Victoria P, et al. [4] investigated the effect of laser-textured surfaces on the tribological behavior of titanium Ti6Al4V. Multiple texture types were created by varying the energy density of the pulse and scanning speed of the laser. Tribological performance of textured surfaces was found to strongly depend on the laser patterning parameters. Replacing conventional surfaces with textured surfaces reduced friction up to 62% and wear up to two orders of magnitude. Wear mechanisms were discussed from optical microscopy and scanning electron microscopy/energy-dispersive spectroscopy (SEM/EDS) observation of wear tracks on titanium disks and ceramic balls. Wojciechowski S, Maruda R W, Nieslony P [5] focused on the analysis of the edge forces generated in ball-end milling of hardened alloy 55NiCrMoV6 steel. In order to obtain the edge forces values, the extrapolation of forces in the tool coordinates to the zero uncut chip thickness was made. The investigations revealed that edge forces were strongly affected by surface inclination angle and progressing tool wear. It was also shown that cutting force estimation with the consideration of the variable edge forces was characterized by a higher accuracy than one based on constant edge forces. Milling force, part and tool deflection, form error and stability models were presented by Budak E [6]. These methods can be used to check the process constraints as well as optimal selection of the cutting conditions for high performance milling. The use of the models in optimizing the process variables such as feed, depth of cut and spindle speed were demonstrated by simulations and experiments. The effect of various factors on this dimensional error was investigated by Lacalle L N L D, Lamikiz A, Sánchez J A, et al. [7] Account was taken of the workpiece material and the slope of surfaces. The workpiece materials were of 30 and 50 HRC hardness, with slopes of 15°, 30°, and 45°. The selected tools were solid ball-end mills of sintered tungsten carbide, coated with TiAlN. These were of various diameters and lengths, and accordingly exhibited various degrees of slenderness. A great value for this latter parameter is a restraint on the potential application of the high-speed milling technique. Salguero J, Del Sol I, Vazquez-Martinez J M, et al. [8] studied the effect of laser-textured surfaces on the tribological behavior of titanium alloy Ti6Al4V. First, the characterization of dimensional and geometrical features of the texturized tracks was carried out. Later, their influence on the wetting behavior was also evaluated through contact angle measurements using water as a contact fluid. Then, the tribological performance of these surfaces was analyzed using a ball-on-flat reciprocating tribometer under wet and dry conditions. Finally, wear mechanisms were identified employing electronic and optical microscopy techniques capable of evaluating the wear tracks on Ti surfaces and WC-Co spheres. Wear friction effects were reduced by up to a 70% replacement of conventional untreated surfaces of Ti6Al4V alloy with laser-textured surfaces. To analyze the cutting performance of micro-textured cutting tools, Zhang et al. [9] prepared micro textures on a surface with a titanium aluminum nitride coating. Furthermore, cutting experiments were carried out on AISI1045 hardened steel under the conditions of overall lubrication and micro-lubrication. The results demonstrated that the micro-textured cutting tools were superior, and the cutting performance was enhanced by means of overall lubrication. Jianxin’s team [10,11,12,13] at Shandong University combined the micro-textured and self-lubrication technologies to develop micro-textured self-lubrication cutting tools, and then studied the lubrication characteristics experimentally. The micro-textured self-lubricating tool was filled with solid lubricant in the micro textures. The solid lubricant formed a film on the tool surface to achieve the self-lubrication function, so that the average friction coefficient, cutting temperature, and cutting force on the rake face were correspondingly reduced. Subsequently, ceramic tools and 45# steel were used to establish an orthogonal cutting model, and a two-dimensional simulation of the orthogonal cutting process of the 45# steel was performed using Abaqus. The simulation results revealed that different micro texture widths had varying anti-friction effects. When the micro texture widths were small, the anti-friction effect was obvious. Lei and Devarajan of Kansas State University [14], USA, analyzed a laser-machined surface by means of numerical simulation, determined the effects of micro-pit textures on the tool mechanical properties, and found that the placement of the micro textures had no significant negative effect on the structural strength of the cemented carbide tool.
In summary, micro textures have mostly been placed on the turning tool surface, and no research exists on the anti-wear and anti-friction mechanisms of the micro-textured ball-end milling tool and the optimal area proportion on the rake face. Therefore, this study reveals the anti-friction mechanism considering external friction, which simultaneously demonstrates the anti-wear mechanism. On this basis, the contact area between the tool and chip can be determined, and the optimal area proportion of the micro textures in the contact area can be obtained. This research provides a reference for optimizing the cutting performance of micro-textured ball-end milling tools.
2. Analysis of Anti-Friction and Anti-Wear Mechanisms of Micro Textures Based on External Friction Theory
2.1. Construction of Friction and Wear-Test Platform
The materials used in the experiment were YG8 hard metal and Ti6Al4V titanium alloy. The properties of the above materials are shown in Table 1 and Table 2. The hard metal was shaped into a cylinder with a diameter of 16 mm and height of 12 mm, using cutting equipment. Micro textures on cemented carbide surface were fabricated by the fiber laser. In this experiment, the fiber laser produced by the Zhengtian laser company was used. The output center wavelength of the fiber laser is 1064 nm. It has the advantages of good beam quality, strong material adaptability, flexible processing mode and high processing accuracy. It is widely used in the surface micro processing of various materials. The laser parameters of optical fiber laser equipment is shown in Table 3. During the preparation process, the activated discharge produced by the cutting had a certain influence on the material surface, so the surface was firstly lapped and then polished to achieve the goal of no burrs.

Table 1.
Physical properties of Ti6Al4V.

Table 2.
Physical properties of YG8 hard metal.

Table 3.
Laser parameters.
A high-speed friction and wear-testing machine (MMG-500) (see Figure 1) was used. Four independent variables were considered in the friction and wear experiments, namely the micro-textured diameter, distance between two adjacent micro textures l1, loads, and rotation. Therefore, the experiment was designed as an orthogonal experiment with four factors and five levels. The factor level table of the orthogonal experiment is presented as Table 4. The studies demonstrated that the fabrication accuracy of the micro-pit textures was the highest when the laser power was 35 W, the scanning speed was 1700 mm/s, and the scanning times were 7 [15]. In the process of grinding the micro textures, grinding powder would enter the inner part of the micro textures and influence their effects. The grinding time of different tests is the same, that is 30 s. Therefore, following grinding, the micro textures were soaked in an acetone solution, and the grinding powder was cleaned by an ultrasonic wave.
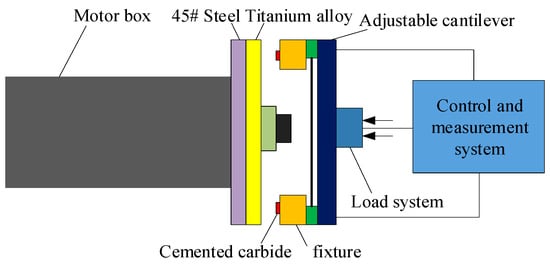
Figure 1.
High-speed friction and wear testing machine.

Table 4.
Orthogonal horizontal factors in friction and wear tests.
2.2. Design of Friction and Wear Tests and Analysis of Results
2.2.1. Analysis of Wear Test Results
Based on the friction and wear test results, the wear depths of two specimens from each sample were measured using a three-coordinate measuring instrument, mainly to measure the wear area. Five points were measured in the wear area and the average wear value for the two specimens was obtained. A comparison of the wear values is presented in Table 5.

Table 5.
Comparison of wear values.
It can be observed from Figure 2 that the larger part the micro-textured surface exhibited less wear than the smooth surface. However, several groups were close to the amount of wear on the smooth surface, which was caused by the laser machining process and errors in the friction and wear experiments, although the error was within the allowable range. In general, the fatigue performance of the smooth-surfaced hard metal material was inferior to that of the micro-textured surface. The minimum wear rate for sample No. 10 was 12.5 μm, and the maximum surface fatigue resistance for the micro-textured surface was 38.4% higher than the average wear rate for the smooth surface.
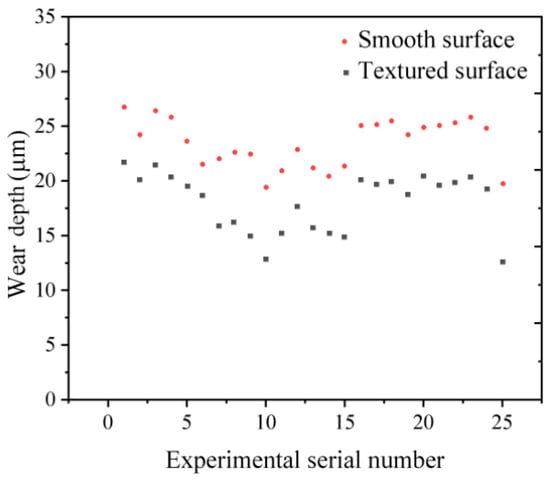
Figure 2.
Comparative analysis of wear under two conditions.
2.2.2. Analysis of Friction Test Results
The experimental results are presented in Table 6. The average friction force of the micro-textured surface was 25% lower than that of the smooth surface, while the average friction coefficient was 22% lower than that of the smooth surface. Figure 3 presents a diagram of the comparative analysis of the friction force and coefficient of the micro-textured surface. It can be observed that the micro texture preparation on the material surface could effectively reduce the friction force and friction coefficient.

Table 6.
Test values of friction force and friction coefficient.
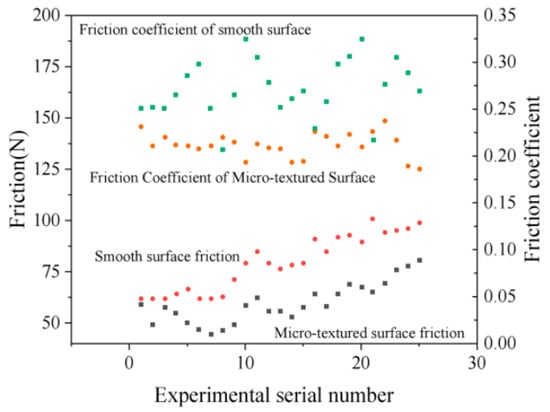
Figure 3.
Diagram of comparative analysis of friction force and friction coefficient.
2.3. Analysis of Micro-Textured Effects
Under experimental conditions, the friction between the hard metal and titanium alloy was purely sliding friction. Under highly compressive contact stress, small fragments were produced in the local areas of the two contact surfaces, eventually leading to the formation of pits. Moreover, owing the viscous properties of the titanium alloy material, the hard metal surface left a sticky mark. Following a lengthy period, the friction on the hard metal surface resulted in surface fatigue wear. The wear morphology is illustrated in Figure 4.
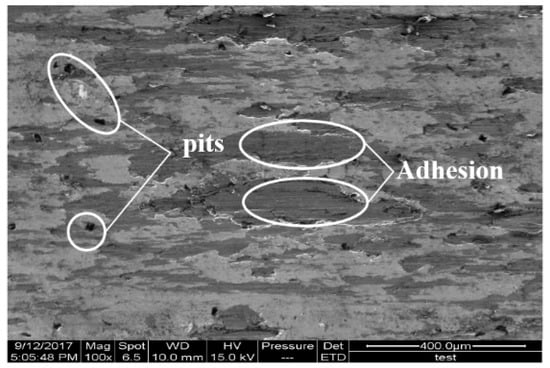
Figure 4.
Smooth surface friction.
To provide an improved analysis of the impurities on the hard metal surface, which could arise from the titanium alloy or hard metal, energy spectrum analysis of the worn sample surface was performed using a scanning electron microscope (see Figure 5). The analysis results demonstrated that most of the elements in the viscous impurities were titanium. Thus, we can conclude that the adhesive impurities mainly originated from the adhesive wear of the titanium alloy.
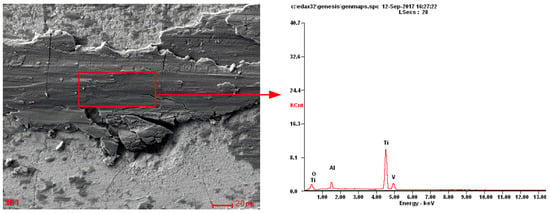
Figure 5.
Energy spectrum analysis.
2.3.1. Analysis of Anti-Wear Mechanism of Micro Textures
Based on the scanning electron microscopy observation, the friction and wear mechanisms of the micro-pit textures were analyzed. As illustrated in Figure 6, the friction and wear processes of the micro-textured surface were divided into three stages. In stage I, a small amount of debris was squeezed into the micro-pit textures under the action of surface pressure, and a small number of cracks were produced on the friction pair surface. In stage II, cracks on the friction pair surface were gradually oriented under the action of contact stress. At a certain depth from the surface, when the shear stress reached its maximum, serious plastic deformation occurred on the surface. Under the action of alternating loads, the material around the micro-cracks weakened, and a large number of abrasive particles were produced on the surface. Simultaneously, the abrasive particles and debris produced were extruded under the action of surface pressure, and thus, the micro-pit textures were gradually filled. In stage III, the abrasive debris filled into the micro-pit textures was bonded and separated from them by the debris outside under high pressure and temperature.
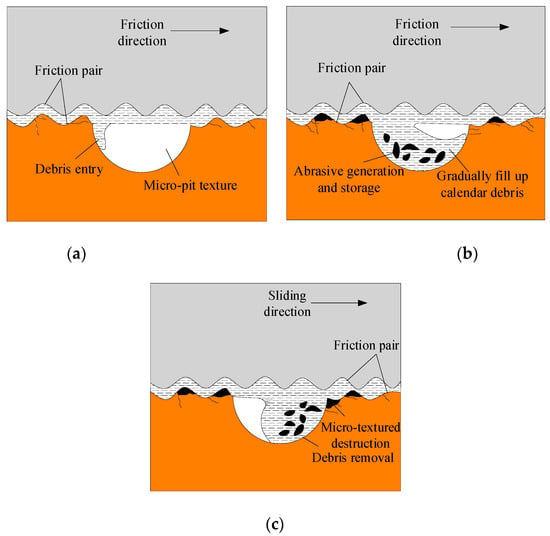
Figure 6.
Wear mechanism analysis of micro-textured surfaces. (a) Friction and wear on micro-textured surface I. (b) Friction and wear on micro-textured surface II. (c) Friction and wear on micro-textured surface III.
The micro-pit textures could store abrasive impurities at different stages of the friction and wear process, and after processing the micro textures with the laser, increased hardness was exhibited in the surroundings of the micro-textured materials owing to the grain refinement under the influence of the laser. Therefore, this played a role in the anti-friction and anti-wear functions, which improved the hard metal strength.
2.3.2. Analysis of Anti-Friction Mechanism of Micro Textures
Relevant research has demonstrated that the use of micro-textured tools can effectively reduce the milling force during the cutting process [16,17]. The milling force has an effect on the contact stress between the tool and chip. The interface between the tool and chip exhibits characteristics of severe friction, high temperature, high pressure, high chemical activity, and high strain rates, which directly affect the chip formation and workpiece processing quality. To analyze the influence of the micro textures on the friction coefficient of the contact area, a stress characteristic model of the interface was established, as illustrated in Figure 7. The shear stress of the interface can be divided into two regions: the friction force of the interface is equal to the shear yield stress of the material in the bonding area, while the ratio of the interface friction force to the normal stress is constant in the slip area. Moreover, the stress τ generated by the fiction can be expressed as follows:
where τs represents the shear yield limits of the material (MPa); μ denotes the friction coefficient in the slip zone; lp is the bonding area length; lf is the distance between the tool and chip; σ(x) represents the normal stress in the slip area; and x denotes the distance from any point in the slip area to the tool tip.
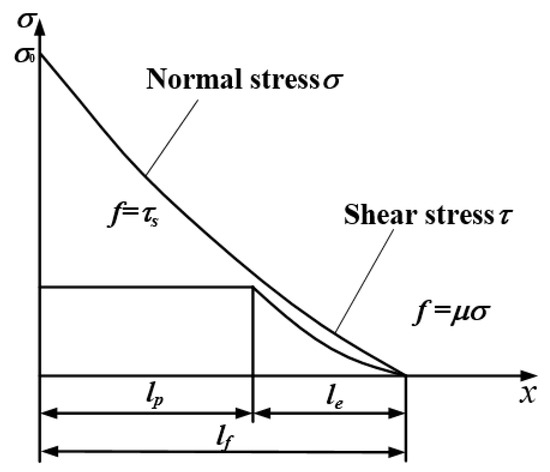
Figure 7.
Stress model of the contact interface.
The normal stress of the interface is distributed exponentially; it is highest at the cutting edge, and 0 at the separation between the tool and chip.
where ξ represents the stress distribution coefficient of the tool, and 2 or 3 is selected according to the processing conditions.
To analyze the interface characteristics more accurately, it was assumed that only bonding and slip areas existed at the interface. At the end of the bonding area and beginning of the slip area, the stress generated by the fiction was exactly equal to the material shear yield limit. From Equations (1) and (2), it can be concluded that:
Equation (3) indicates that the relationship between the length lp of the bonding area and friction coefficient of the slip area can be determined as follows:
The normal force FN and shear force Fφ on the tool surface can be obtained by integrating the normal stress and shear stress:
where ae represents the cutting width and σs represents the extrusion yield limit of the two contact materials.
According to Equations (5) and (6), the overall friction coefficient of the interface can be obtained as follows:
The insertion of the micro textures reduces the contact area between the tool and chip, resulting in the normal stress of the micro-textured tool being greater than that of the non-textured tool. Figure 8 presents a schematic of the micro texture influence on the distribution of the bonding and slipping areas, based on the milling experiment results and the interface stress characteristic model. The micro textures caused the stress to concentrate at the tool edge, so the normal stress σ0 at the tool edge increased, and the ratio of lp/lf increased obviously compared to that of the non-textured tool [18]. It can be concluded from Equation (7) that the increases in lp/lf and σ0 decreased the overall friction coefficient μa of the contact area, which is consistent with the conclusion obtained from the friction and wear experiments. As the friction of the rake face decreased, the tool wear decreased.
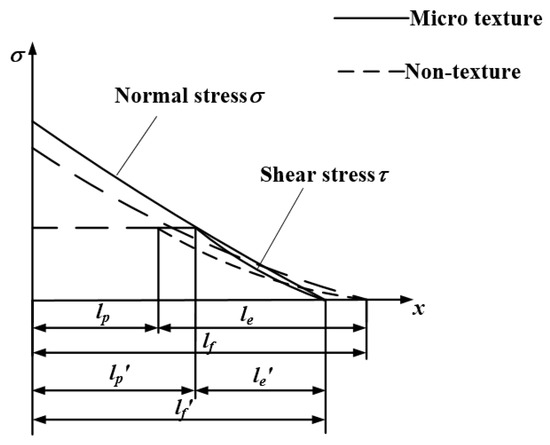
Figure 8.
Effect of micro textures on distribution of bonding and slip zones.
3. Analysis of the Contact Area between the Tool and Chip
The friction between the tool and the chip acts on the rake face of the tool when milling titanium alloys. The friction thus affects the formation of the chip, the mechanical-thermal characteristics, tool wear, and the quality of the machined workpiece surface. Therefore, the addition of micro textures to the contact area can play an important role in promoting anti-friction and anti-wear, and can be very important in improving the cutting performance of the tool.
In order to determine the contact range between the rake face and the chip, the tool and workpiece coordinate system should first be established. As shown in Figure 9, the workpiece coordinate system was represented by XwYwZw, so the position of the workpiece could be determined in accordance with this coordinate system. The tool coordinate system was represented by XcYcZc, and the coordinate origin was taken as the tool tip. The transformation relationship between the workpiece coordinate system and the tool coordinate system can be described as follows [19]:
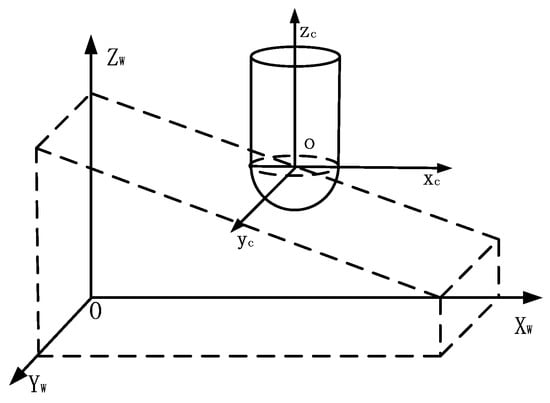
Figure 9.
Workpiece and tool coordinate system [20].
In Equation (1), the point (xc, yc, zc) is any point within the tool coordinate system and the point (xw, yw, zw) is any point within the workpiece coordinate system. The origin of the tool coordinate system was taken as (x0, y0, z0) and the diameter of the tool was represented by R.
In order to simplify the geometrical model, the surface formed by the former tool path should be regarded as part of a cylindrical surface, and the cycloid trajectory of the point on the tool edge should be regarded as a circular trajectory [21]. The angle of inclination of the workpiece was represented by angle a, while the feed rate of each tooth was much smaller than the radius R of the tool. The contact surface between the ball-end milling tool and the workpiece could thus be simplified as part of a spherical surface. Figure 12 shows the contact area between the tool and the workpiece, and each of the related surfaces can be expressed as follows:
(1) The surface generated by the former tool path:
(2) The surface formed by the pass of the previous tool tooth:
(3) The contact area between tool and workpiece:
(4) The un-machined surface:
(5) The surface generated by the current tool path:
The contact relationship between the ball-end milling tool and the workpiece during the milling process is shown in Figure 10. The contact area is defined by three arcs: arc AD, arc DB, and arc BA. These three curves correspond to the intersection of two surfaces. Three simultaneous expressions corresponding to these curves are as follows:
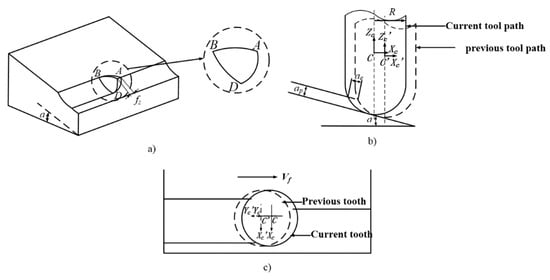
Figure 10.
Milling process of a ball-end milling tool [20].
(1) Arc AD
(2) Arc DB
(3) Arc BA
Figure 10b shows the contact area in the plane Xc-Z. The coordinate system of one of the tool’s teeth is described as C’Xc’Yc’Zc’, and the coordinate system of the other tooth is described as CXcYcZc. The projection of any two adjacent tracks onto the plane of Xc-Yc is shown in Figure 10c. In the figure, ap represents the cutting depth. According to a geometric analysis of the contact area between the tool and the workpiece, the area enclosed by the functions representing the boundary curves (the simplified cutting area) is area ABD as shown in Figure 10a.
The area of the micro-textured design can be obtained by considering the chip deformation and the spatial relationship between the chip, the cut-in, and the cut-out of the cutting tool. In this study, we needed to determine the farthest distance between the tool edge and the tool tip at the contact area, so that we could more accurately get the position of the contact area between the rake face of the ball-end milling tool and the chip. As shown in Figure 11, the intersection point A between the maximum effective cutting radius AD and the tool edge is the point of interest. When the tool is milling up an incline of a specific angle, the tool edge of the ball-end milling tool in the cutting area is the segment AB and the maximum effective cutting radius AD is associated with the angle , where can be expressed as:
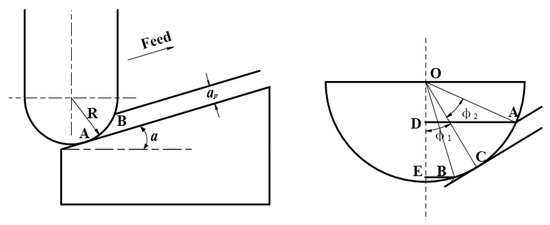
Figure 11.
Effective cutting radius when milling an inclined plane [20].
The maximum effective cutting radius AD of the ball-end milling tool can be expressed as [22]:
We know that in the process of milling titanium alloys with a ball-end milling tool, if contact between the chip and the rake face is incomplete, the chip will curl at a specific angle. If the area of action between the tool and the workpiece is projected onto the rake face, the maximum cutting radius can be approximated as the boundary of the cutting area. The distribution of the micro-textured area designed in this research is roughly fan-shaped, as shown in Figure 12.
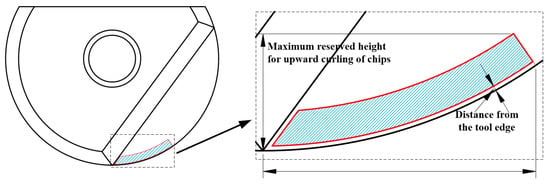
Figure 12.
Contact area between the tool and the chip.
4. Optimal Area Ratio of Micro Textures in Contact Area between Tool and Chip
As can be observed in Figure 13a,b, in the micro-textured tools with blunt and chamfer tool edges, the length and width of the severe abrasion area were approximately 1.7 mm and 0.745 mm. The total abrasion area was a curved sector surrounded by micro textures. To simplify the calculation, the curved sector was equivalent to a parallelogram. Therefore, the ratio of the micro textures in the severe wear area could be determined as follows:
where l is the distance between the first row of the micro textures and tool edge, and r is the micro-textured radius. Equation (19) indicates that the area occupancy decreases with an increase in l1, increases with an increase in r, and decreases with an increase in l.
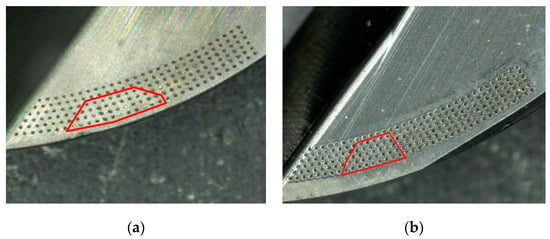
Figure 13.
Wear areas of micro-textured tools. (a) Wear area of micro-textured tool with blunt tool edge. (b) Wear area of micro-textured tool with chamfer tool edge.
From the above, it can be concluded that, under the effects of the micro textures, lp increases, lf decreases, the proportion of lp increases gradually, the proportion of lf decreases gradually, and the cutting force in this region is calculated from Equation (6). Moreover, when r increases and l1 decreases, the length lp increases gradually. Let lp = k × lf (0 < k < 1); then, according to Equation (6), we can obtain:
where aw, σs, and τs, ζ are related to the material properties. Therefore, the resultant force is mainly affected by the value of k. From the resultant force of fh, the increase in k causes fjm to decrease and ffd to increase. It is not difficult to observe that, with the increase in k, the decrease in the resultant force of fh is greater than the increase, so the resultant force of fh decreases with the increase in k.
Relevant studies have demonstrated that the sizes of micro textures vary from tens to hundreds of microns. Following optimization, the micro-textured diameters ranged from 30 to 70 μm, the distance between two adjacent micro textures ranged from 125 to 225 μm, and the distance between the micro textures and tool edge ranged from 90 to 130 μm [23]. The range of pz could be solved by Equation (19). When l1 and l were the maximum values and r was the minimum value, pz was minimal, and its value was 1.72%. When l1 and l were the minimum values and r was the maximum value, pz was maximal and its value was 25.4%.
To study the relationship between pz and one of the parameters l1, r, and l, the other two parameters were regarded as fixed values.
where a, b, c, d, e, f, g, and h are constant.
When l1 decreases, r increases and l decreases, while k increases. Because l1 decreases, r increases, and l decreases, pz also increases. Therefore, suppose that a functional relationship exists between pz and k. Because the influence of pz on k is affected by r, l1, and l, the relationship between pz and k is a quadratic function:
where a1, b1, and c1 are constant.
Equation (21) indicates that a1 is related to l1, b1 is related to r, and c1 is related to l. When pz increases, k first increases and then decreases; when pz = b1, k takes the maximum value of c1, which indicates that when pz increases, fh first decreases and then increases, the minimum value of fh exists, and r exhibits the maximum value. The range of pz varies from 8.95% to 21.3% when introducing the variables into Equations (21) and (22).
5. Experimental Verification
5.1. Construction of Experimental Platform
In this experiment, the VDL-1000E three-axis vertical milling machine was used for processing. A Kistler 9257 dynamometer was used to measure the milling force. The material used was Ti6Al4V titanium alloy. The workpiece dimensions were 160 mm × 22 mm × 85 mm. It has been found that the tool can achieve superior cutting performance when the inclination angle is 15° and the milling mode is down milling [24], as indicated in Figure 14. The orthogonal test was employed, and the effects of various factors, such as the micro-textured diameters, the distance between the micro textures and tool edge, and the distance between two adjacent micro textures, on the cutting force and cutting temperature of the ball-end milling tool during the processing of the titanium alloys were considered. The micro texture of YG8 carbide ball-end milling cutter with diameter of 20 mm, rake angle of 0° and relief angle of 11° is prepared by using fiber laser. The cutter size is shown in Figure 15. The cutting parameters are shown in Table 7. A total of 25 experimental groups were designed.
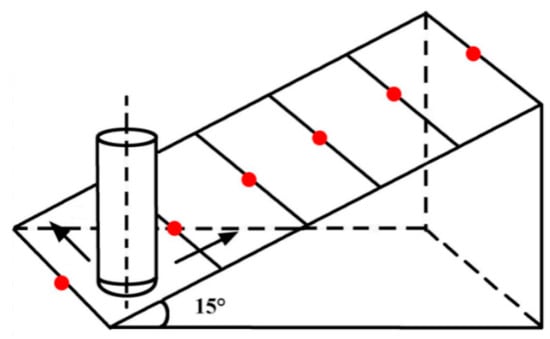
Figure 14.
Titanium alloy processing method.
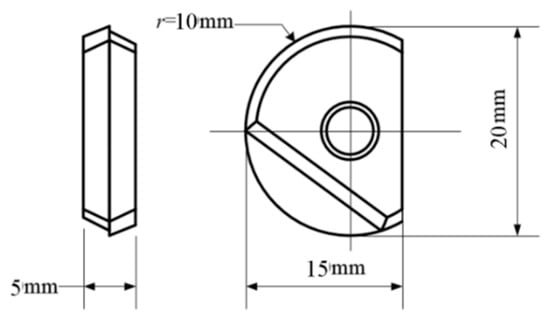
Figure 15.
Size of ball-end milling insert.

Table 7.
Cutting parameters.
5.2. Analysis of Experimental Results
When the diameter and distance between two adjacent micro textures change, the proportion of micro textures in the contact area between the tool and chip differs. Table 8 displays the proportions of the micro-textured area in the contact area. Taking the milling force as an evaluation criterion, the role of the micro textures under different proportions was studied, and the proportion of the micro-textured areas, which can improve the cutting performance of the tools, was obtained. As illustrated in Figure 16, when the proportion of the micro textures under the action of the blunt tool edge was 2% to 7% in the contact area, the milling force was greater than that of the non-textured tool. This is because the micro-textured diameters were excessively small, the anti-friction and anti-wear effects were small, and the surface roughness of the tool was relatively increased, resulting in an increase in the milling force. When the proportion of the micro textures was between 14% and 21%, the secondary cutting phenomenon was serious owing to the dense micro textures, the tool surface roughness was excessive, and the milling force was also greater than that of the non-textured tool. Therefore, the optimal proportion of the micro textures of the blunt edge in the contact area was approximately 7% to 14%. As illustrated in Figure 17, when the proportion of the micro textures under the action of the chamfer tool edge in the contact area was 2% to 9%, the milling force was mostly greater than that of the non-textured tool, and when the proportion of the micro textures was between 11% and 21%, the milling force was greater than that of the non-textured tool. Thus, the optimal proportion of the micro textures under the action of the chamfer tool edge in the contact area was approximately 9% to 11%. The reasons for the above phenomena are the same as those of the micro-textured ball-end milling tool with the blunt tool edge. As the experimental results are basically consistent with the theoretical analysis, it is proven that the area occupancy of the micro textures in the contact area will affect the bonding and slip area lengths, thereby influencing the milling force when micro textures are placed on the rake face of the ball-end milling tool.

Table 8.
Experimental data of milling force of micro-textured ball-end milling tools under actions of different tool edges.
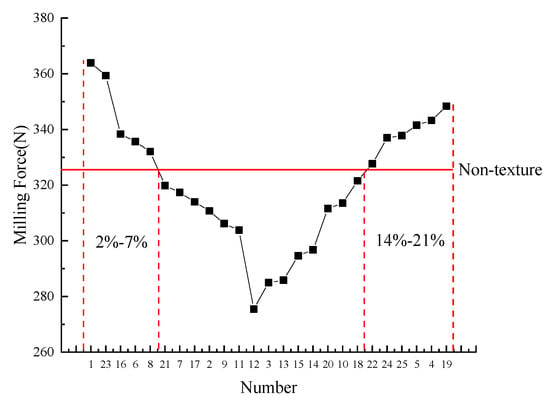
Figure 16.
Proportion of micro-textured area in contact area of ball-end milling tool with blunt tool edge.
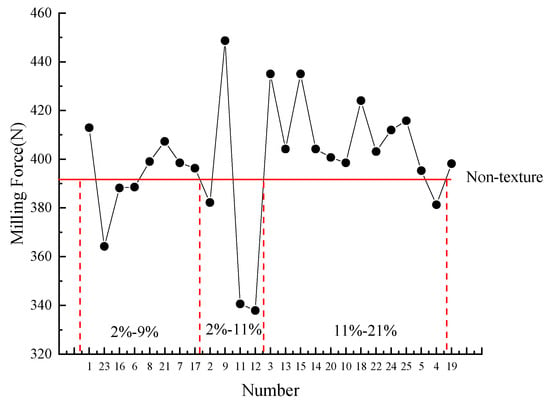
Figure 17.
Proportion of micro-textured area in contact area of ball-end milling tool with chamfer tool edge.
6. Conclusions
(1) A platform was established for friction and wear tests. The anti-wear mechanism of the micro-pit textures was obtained. Abrasive impurities could be stored at different stages of the test, and grain refinement occurred in the surroundings of the micro textures under the influence of laser energy, thereby increasing the hardness of the materials. The anti-friction mechanism of the micro-pit textures was that the insertion of the micro-pit textures increased the normal stress of the tool edge, increased the ratio of the bonding area length to the total length of the contact area, decreased the friction coefficient of the contact area, and decreased the friction of the rake face. This method accurately reveals the anti-wear and anti friction mechanism of micro texture from the view of external friction theory and microcosmic theory.
(2) Based on the milling force, the optimal proportion of the micro textures on tool rake face was determined to be 8.95% to 21.3%. The accuracy of this proportion was verified experimentally, thereby providing a reference for design of micro- textured tool and improving the cutting performance of hard metal tools.
(3) In follow-up work, the optimal proportion of micro textures can also be considered from the perspectives of milling force, workpiece integrity quality and tool wear, in order to make the research more comprehensive.
Author Contributions
Conceptualization, X.T. and S.Y.; methodology, X.T.; software, S.Y.; validation, X.T., S.Y. and X.L.; formal analysis, S.Y.; investigation, S.Y.; resources, X.L.; data curation, S.Y.; writing—original draft preparation, X.T.; writing—review and editing, X.T.; visualization, X.T.; supervision, X.L.; project administration, X.T.; funding acquisition, X.T.
Funding
This research was funded by National Natural Science Foundation of China, grant number 51875144.
Conflicts of Interest
The authors declare no conflict of interest.
References
- Wu, Z.; Deng, J.; Lian, Y. Development and Perspective of Surface Textured Cutting Tool. Aeronaut. Manuf. Technol. 2012, 406, 32–37. [Google Scholar]
- Wojciechowski, S.; Chwalczuk, T.; Twardowski, P.; Krolczyk, G.M. Modeling of cutter displacements during ball end milling of inclined surfaces. Arch. Civ. Mech. Eng. 2015, 15, 798–805. [Google Scholar] [CrossRef]
- Wojciechowski, S.; Twardowski, P.; Pelic, M.; Maruda, R.W.; Barrans, S.; Krolczyk, G.M. Precision surface characterization for finish cylindrical milling with dynamic tool displacements model. Precis. Eng. 2016, 46, 158–165. [Google Scholar] [CrossRef]
- Vazquez Martinez, J.; Irene, D.S.I.; Iglesias Victoria, P.; Salguero, J. Assessment the Sliding Wear Behavior of Laser Microtexturing Ti6Al4V under Wet Conditions. Coatings 2019, 9, 67. [Google Scholar] [CrossRef]
- Wojciechowski, S.; Maruda, R.W.; Nieslony, P.; Krolczyk, G.M. Investigation on the edge forces in ball end milling of inclined surfaces. Int. J. Mech. Sci. 2016, 119, 360–369. [Google Scholar] [CrossRef]
- Budak, E. Analytical models for high performance milling. Part I: Cutting forces, structural deformations and tolerance integrity. Int. J. Mach. Tools Manuf. 2006, 46, 1478–1488. [Google Scholar] [CrossRef]
- Lacalle, L.N.L.D.; Lamikiz, A.; Sánchez, J.A.; Salgado, M.A. Effects of tool deflection in the high-speed milling of inclined surfaces. Int. J. Adv. Manuf. Technol. 2004, 24, 621–631. [Google Scholar] [CrossRef]
- Salguero, J.; Del Sol, I.; Vazquez-Martinez, J.M.; Schertzer, M.J.; Iglesias, P. Effect of laser parameters on the tribological behavior of Ti6Al4V titanium microtextures under lubricated conditions. Wear 2019, 426-427, 1272–1279. [Google Scholar] [CrossRef]
- Zhang, K.; Deng, J.; Xing, Y.; Li, S.; Gao, H. Effect of microscale texture on cutting performance of WC/Co-based TiAlN coated tools under different lubrication conditions. Appl. Surf. Sci. 2015, 326, 107–118. [Google Scholar] [CrossRef]
- Song, W. Study on Micro-Pool Self-Lubricating Cutting Tools. Master’s Thesis, Shan Dong University, Jinan, China, 2010. [Google Scholar]
- Qi, T. Study on the Structure Design of Micro-Textured Self-Lubricating Tools. Master’s Thesis, Shan Dong University, Jinan, China, 2012. [Google Scholar]
- Song, W.; Deng, J.; Wu, Z.; Zhang, H.; Pei, Y.; Zhao, J.; Ai, X. Cutting Temperature of Cemented Carbides Base Self-lubricated Tool Embedded with Solid Lubricants. Trans. Chin. Soc. Agric. Mach. 2010, 41, 205–210. [Google Scholar]
- Feng, X.; Deng, J.; Xing, Y.; Wang, F. Finite Element Analysis of Properties of Micro-textured Ceramic Tools. Tool Eng. 2013, 47, 23–28. [Google Scholar]
- Lei, S.; Devarajan, S.; Chang, Z. A study of micropool lubricated cutting tool in machining of mild steel. J. Mater. Process. Technol. 2009, 209, 1612–1620. [Google Scholar] [CrossRef]
- Liu, W. Preparation of Micro Textured Laser and Its Effect on Fatigue Wear of Cemented Carbide Surface. Master’s Thesis, Harbin University of Science and Technology, Harbin, China, 2018. [Google Scholar]
- Li, Q.; Yang, S.; Zhang, Y.; Zhou, Y.; Cui, J. Evaluation of the machinability of titanium alloy using a micro-textured ball end milling cutter. Int. J. Adv. Manuf. Technol. 2018, 98, 2083–2092. [Google Scholar] [CrossRef]
- Yang, S.; Yu, S.; He, C. The Surface Integrity of Titanium Alloy When Using Micro-Textured Ball-End Milling Cutters. Micromachines 2019, 10, 21. [Google Scholar] [CrossRef] [PubMed]
- Ozlu, E.; Budak, E.; Molinari, A. Analytical and experimental investigation of rake contact and friction behavior in metal cutting. Int. J. Mach. Tools Manuf. 2009, 49, 865–875. [Google Scholar] [CrossRef]
- Burak, O. Chip Load, Calibration Analysis and Dynamics of Ball-End Milling for Free-Formsurface Machining. Master’s Thesis, Koc University, Istanbul, Turkey, 2005; pp. 20–26. [Google Scholar]
- Tong, X. Accurate Distribution Design and Parameter Optimization of Micro Texture of Ball End Milling Cutter. Ph.D Thesis, Harbin University of Science and Technology, Harbin, China, 2019. [Google Scholar]
- Yang, S.; Wang, H.; Zhang, Y.; Zhang, L. Cutting Performance Evaluation of Surface Micro-texture Ball End Milling Based on Multi-objective Decision Making. J. Harbin Univ. Sci. Technol. 2016, 21, 1–5. [Google Scholar]
- Feng, C. Research on the Tool Wear Mechanism of Cemented Carbide Ball End Mill Machining Titanium Alloy. Master’s Thesis, Harbin University of Science and Technology, Harbin, China, 2015. [Google Scholar]
- Wang, Z. Microtexture Optimization of Cemented Carbide Ball-End Milling Cutter Based on Surface Friction Properties. Master’s Thesis, Harbin University of Science and Technology, Harbin, China, 2016. [Google Scholar]
- Cui, X. Study on the Surface Quality of Titanium Alloy Milled by Microstructure Ball End Milling Cutter. Master’s Thesis, Harbin University of Science and Technology, Harbin, China, 2016. [Google Scholar]
© 2019 by the authors. Licensee MDPI, Basel, Switzerland. This article is an open access article distributed under the terms and conditions of the Creative Commons Attribution (CC BY) license (http://creativecommons.org/licenses/by/4.0/).