Article

Electropolishing of Laser Powder Bed-Fused IN625 Components in an Ionic Electrolyte

by
Neda Mohammadian
1,
Sylvain Turenne
2 and
Vladimir Brailovski
1,*
1
Department of Mechanical Engineering, École de technologie supérieure, 1100, Notre-Dame Street West, Montreal, QC H3C1K3, Canada
2
Department of Mechanical Engineering, Polytechnique Montréal, 2900 Edouard Montpetit Blvd, Montreal, QC H3T 1J4, Canada
*
Author to whom correspondence should be addressed.
J. Manuf. Mater. Process. 2019, 3(4), 86; https://doi.org/10.3390/jmmp3040086
Submission received: 9 August 2019 / Revised: 27 September 2019 / Accepted: 30 September 2019 / Published: 3 October 2019

Abstract

:
This work presents the first practical application of ionic electrolytes for electropolishing of nickel-based superalloys. It contains the results of an experiment-driven optimization of the applied potential and electrolyte temperature during electropolishing of laser powder bed-fused IN625 components containing surfaces oriented to the building platform under angles varying from 0 to 135°. For comparative purposes, the roughness profilometry and confocal microscopy techniques were used to characterize the surface finish topographies and the material removal rates of IN625 components subjected to electropolishing in ionic and acidic (reference) electrolytes. After 4 h of electropolishing in both electrolytes, a roughness of Ra ≤ 6.3 µm (ISO N9 grade number of roughness) was obtained for all the build orientations. To elaborate, both electrolytes manifested identical roughness evolutions with time on the 45° (75% Ra reduction) and 90°-oriented (65% Ra reduction) surfaces. Although the roughness reduction on the 135°-oriented surface in the ionic electrolyte was 17% less than in the acidic electrolyte, the former provided a more uniform roughness profile on the 0°-oriented surface (30% Ra reduction) and 44% higher current efficiency than the acidic electrolyte. This work proves that ionic electrolytes constitute a greener alternative to industrial acidic mixtures for electropolishing of three-dimensional (3D)-printed parts from nickel-based superalloys.

1. Introduction

Almost all three-dimensional (3D)-printed metal parts require surface finishing to meet performance standards. Efforts to develop surface finish techniques for parts that are manufactured by metal laser powder bed fusion (LPBF) technology are increasing exponentially. Examples of such techniques include mechanical and vibratory grinding, sand blasting, chemical treatment, chemical-mechanical and electrochemical polishing. Conventional mechanical polishing techniques are limited in terms of access to internal cavities and channels of complex parts. Chemical polishing of nickel alloys requires the use of strong and toxic acids, such as HF for example [1]. Furthermore, chemical polishing is characterized by a low material removal rate and inability to eliminate all LPBF-induced surface features. On the other hand, a successful removal of the LPBF surface features using electropolishing (EP) with HClO4–CH3COOH mixed acidic electrolytes has been demonstrated on Ni-based superalloys IN718 [2] and IN625 [3]. However, the main drawbacks of conventional electropolishing are the use of highly corrosive liquids, which may cause workplace-related health issues and negative environmental impacts, and extensive gassing, which leads to poor current efficiency [4].
Ionic liquids (ILs) constitute a greener alternative to acidic electrolytes. The interest in ILs for metal finishing and deposition applications has significantly developed since 1980 [5]. The beneficial characteristics of green electrolytes are defined as follows [6]: in-flammability, low volatility, high-ionic conductivity, low-vapor pressure, good thermal and electrochemical stability, ecological soundness, and long aging time.
Imidazolium and pyridinium cations are the most studied salts in this context, but these salts have not yet found industrial application because of their sensitivity to water and high cost [7]. The use of ILs composed of Sn, Zn and Fe metal ions mixed with quaternary ammonium salts is proposed for large-scale metal finishing applications, such as metal deposition, since they are composed of abundant chemical elements and manifest high air and atmospheric stability. Such electrolytes, containing ethylene glycol as a hydrogen bond donor and choline chloride system, allow polishing 316 stainless-steel parts with high current efficiency [4,7].
Furthermore, it was demonstrated that a concentration of metal complexes in the ILs has a limited adverse effect on the surface finish quality. For instance, in EP of 316 stainless-steel in an ionic electrolyte [4], the electrodissolution of the surface metal elements results in the formation of metal complexes, soluble in ionic electrolytes. When the concentration of these complexes exceeds the saturation level, a solid residue is deposited at the EP cell. After that, the electrolyte solution can be easily strained and refreshed for further EP cycles. During EP in acidic electrolytes however, it is normally required to control the composition of an electrolyte solution during the process to obtain the desired surface finish improvement. Examples are an addition of iron residues to the acidic electrolyte solution for EP of 316 stainless-steel [4], or increasing the proportion of HF in the acidic electrolyte composed of HF and H2SO4 for EP of niobium [8].
Another beneficial use of ILs instead of acidic solutions for EP of metals and alloys is the limited adverse effect of water content on the surface finish quality. Researchers ran the polishing process in an open atmosphere at 40 °C and up to 5 wt.% moisture absorption and did not observe any deleterious effect of the electrolyte history on the surface finish [4]. On the contrary, adding up to 10 wt.% of water reduces the metal complex solubility in the electrolyte, and consequently promotes the film precipitation at the anode surface. In addition, water in the ionic electrolyte decreases its viscosity, while increasing its electrical conductivity [9].
Researchers studied various EP processes such as magneto-electropolishing using an externally applied magnetic field [10], high-current density EP (EP 1000 and EP 2000) [11], and high-voltage EP (up to 450 V) [12], showing improvements on the metal surface properties for special applications. One study [13] showed that the composition of nano-coatings formed on alloys varies for different EP processes, and hence, impacts their characteristics such as corrosion resistance and fatigue properties. However, in the present work, a standard electropolishing process has been carried out using low voltage EP (3–15 V) to compare the performances of an ionic electrolyte with that of an acidic electrolyte used previously by Urlea and Brailovski [3].
It is known that optimizing the electropolishing conditions, such as the electrolyte composition and temperature, current density and process time, can improve the micro-profile smoothing efficiency, but to date, only a few reports on EP in ionic liquids have been made available to the public. As an example, Rotty et al. studied electropolishing of laser powder fusion processed 316L stainless-steel in an ionic mixture of choline chloride-ethylene glycol [14]. However, in this work, the effect of build orientation on the EP efficiency was not studied. EP of aluminum, chromium and zinc alloys using eutectic-based ionic liquids were also performed successfully [15], but to the best of the authors’ knowledge, electropolishing of nickel alloys in ILs has not yet been investigated.
To start filling the gaps discussed above, this work aims to optimize the EP of laser powder bed-fused IN625 alloy in an ionic electrolyte. Furthermore, the present work also aims to provide an example of EP allowances for 3D-printed IN625 parts.

2. Experimental Setup

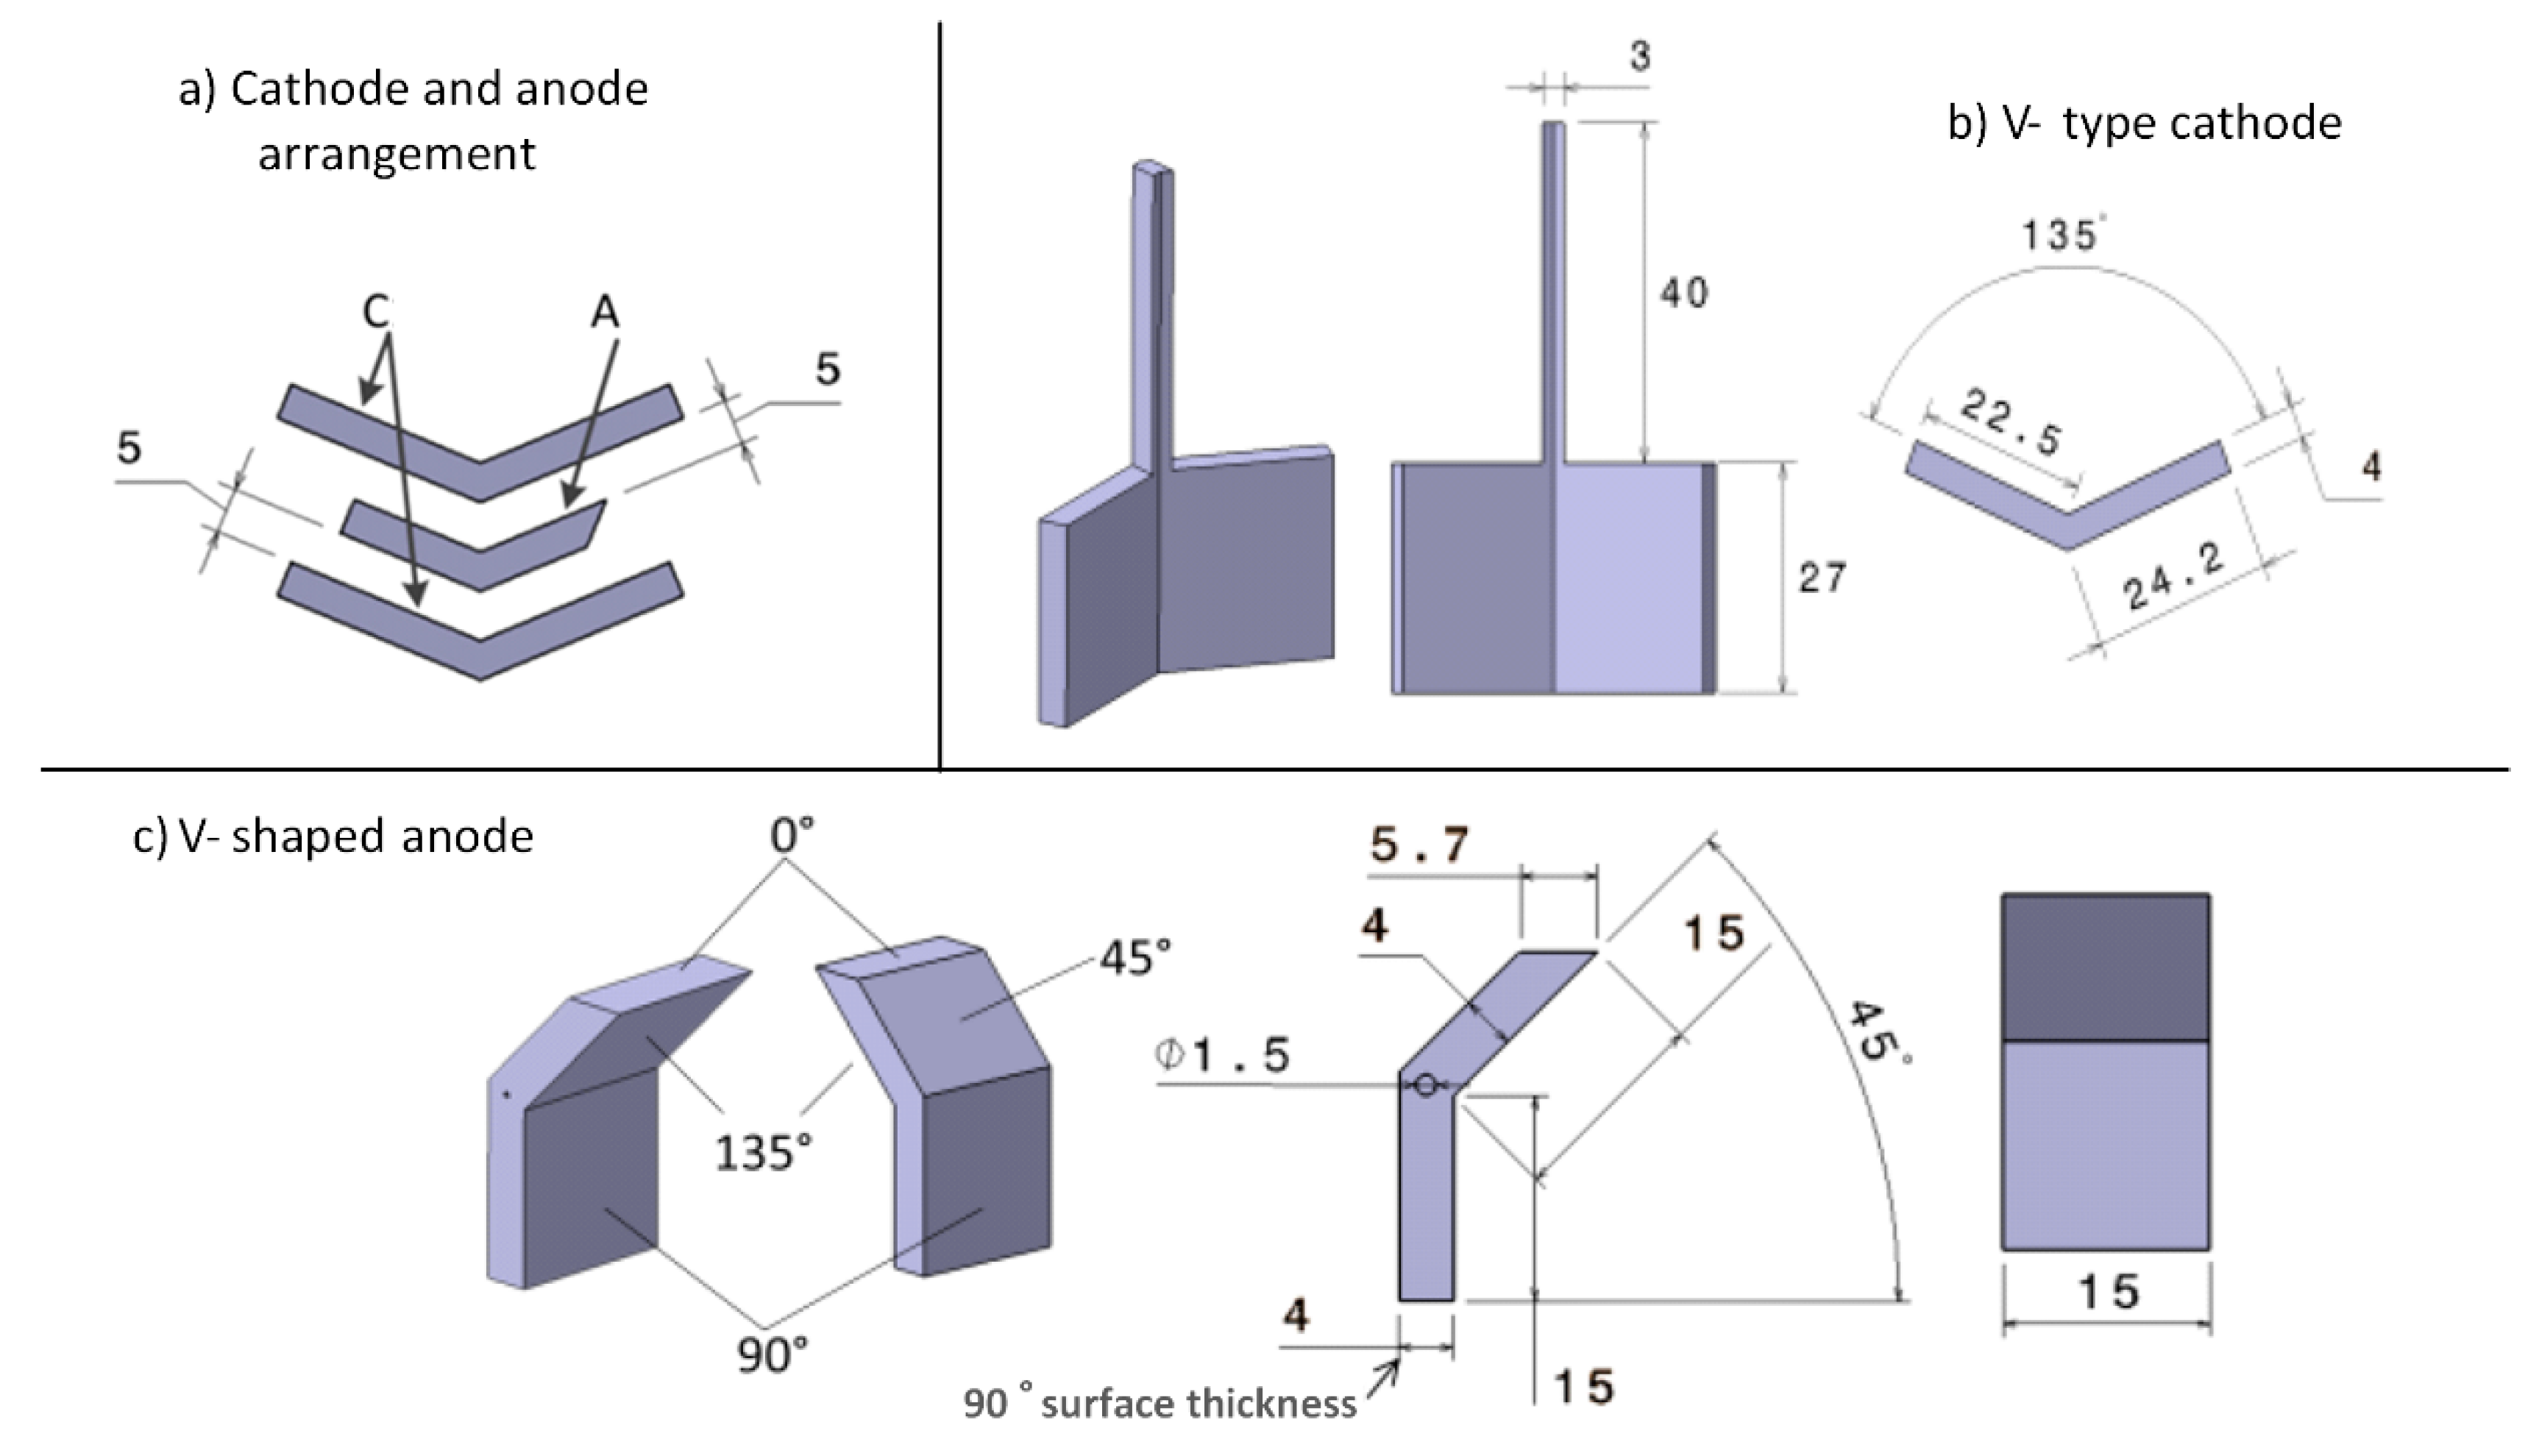
2.1. Materials EP Cell Setup and Design of Electrodes

All the experiments were carried out in a 1000 mL PYREX beaker. The EP setup was mounted to carry out the current density (i) versus applied potential (Va) measurements. The operation temperature was regulated using a PC-420D Corning stirring hot plate, with a Teflon temperature controller. 500 mL of electrolyte (see Section 2.2 for electrolyte composition) was constantly agitated at a speed of 160 rpm using a magnetic stirrer bar. A LabVEIW interface was used to adjust and record the applied potential and the resulting electrical current using a Sorensen DLM 40-15 DC power supply. The EP setup design provided a repeatable constant cathode-anode distance of 5 mm and a surface ratio of 2:1 throughout this work.
The V-shaped cathode-anode arrangement, which had been proposed for EP of Ti-6Al-4V alloy parts [16] (Figure 1), was used in this study. The electrodes were printed using an EOSINT M290 400 W laser powder bed fusion system (EOS GmbH, Munich, Germany), IN625 powder (EOS) and the EOS “IN718 Performance” parameter set (40 μm layer thickness, PSW version 3.6). Post-processing stress relief annealing of printed components was carried out for 1 h at 870 °C in argon atmosphere.

2.2. Green Electrolyte Preparation and Measurements of the Viscosity-Temperature Dependence

Ethylene glycol and choline chloride ionic liquid (HOC2H4N(CH3) z 3 + Cl) was chosen for the EP experiments. In this work, the ionic liquid was produced according to the instructions provided in a research for EP of 316 stainless-steel [4]. The eutectic mixture of choline chloride (ChCl) (Aldrich 99%) and ethylene glycol (EG) (Aldrich 99%) was prepared by agitating the two solutions in a 1:2 volume ratio at 75 °C until achieving a colorless 1ChCl:2EG mixture, after which the mixture was cooled down at a rate of 1 °C min−1.
Research [17] showed that low viscosity, and consequently, low current resistance, are required for the best EP effect. In other words, increasing the electrolyte temperature will decrease viscosity and, therefore, promote the fresh electrolyte supply, and encourage the selective dissolution of oxide films, formed in lower valleys of the surface, thus resulting in enhanced EP performances.
The study of the temperature dependence of the 1ChCl:2EG electrolyte viscosity and electrical conductivity in the 10 to 50 °C temperature range shows that the higher the temperature, the lower the viscosity, and the higher the electrical conductivity of the electrolyte [4]. Following this guidance, in order to study the i-Va behavior of printed IN625 in the 1ChCl:2EG system, four temperatures (25, 30, 40 and 50 °C) were selected for this work. The viscosity-temperature graph shown in Figure 2 was obtained using a Brookfield DV-II+ Pro viscometer fitted with a thermostat jacket and a stainless-steel # 66 spindle rotating at 20 rpm. The temperature of the 1ChCl:2EG mixture was regulated using a PC-420D Corning hotplate with a Cat # 6795PR Corning Teflon temperature controller.

3. Experimental Procedure

3.1. i-Va Measurements and Optimization of the EP Working Conditions

The EP working conditions were determined by measuring the i-Va dependence in the ionic electrolyte. They were then compared with the EP working conditions in an acidic solution used by Urlea and Brailovski [3]. During the i-Va measurements, a constant cathode-anode potential was applied, starting from 1 V and increasing every 5 min. The 5 min interval was selected on the base of preliminary testing, where the current density evolution with time showed a peak at the first 20 s, followed by a decrease in the current density value to reach a steady level after ~5 min of exposure. The anodic current density response (i) at a given operation temperature was plotted as a function of the applied potential (Va), and the resulting diagrams are shown in Figure 3. The experiments were carried out at four temperatures (25, 30, 40 and 50 °C) to study the correlation between the polishing temperature and the EP working conditions. In should be noted that in this case, ohmic losses are included in the Va data, given the absence of a reference electrode in the system. It should also be noted that Urlea and Brailovski worked on the EP of LPBF IN625 parts using an acidic electrolyte, and they showed that the best surface finish quality was obtained when a given constant potential was applied instantly and not gradually at the beginning of the process [3]. The same EP starting conditions were applied in the present work.
The following information can be obtained from Figure 3:
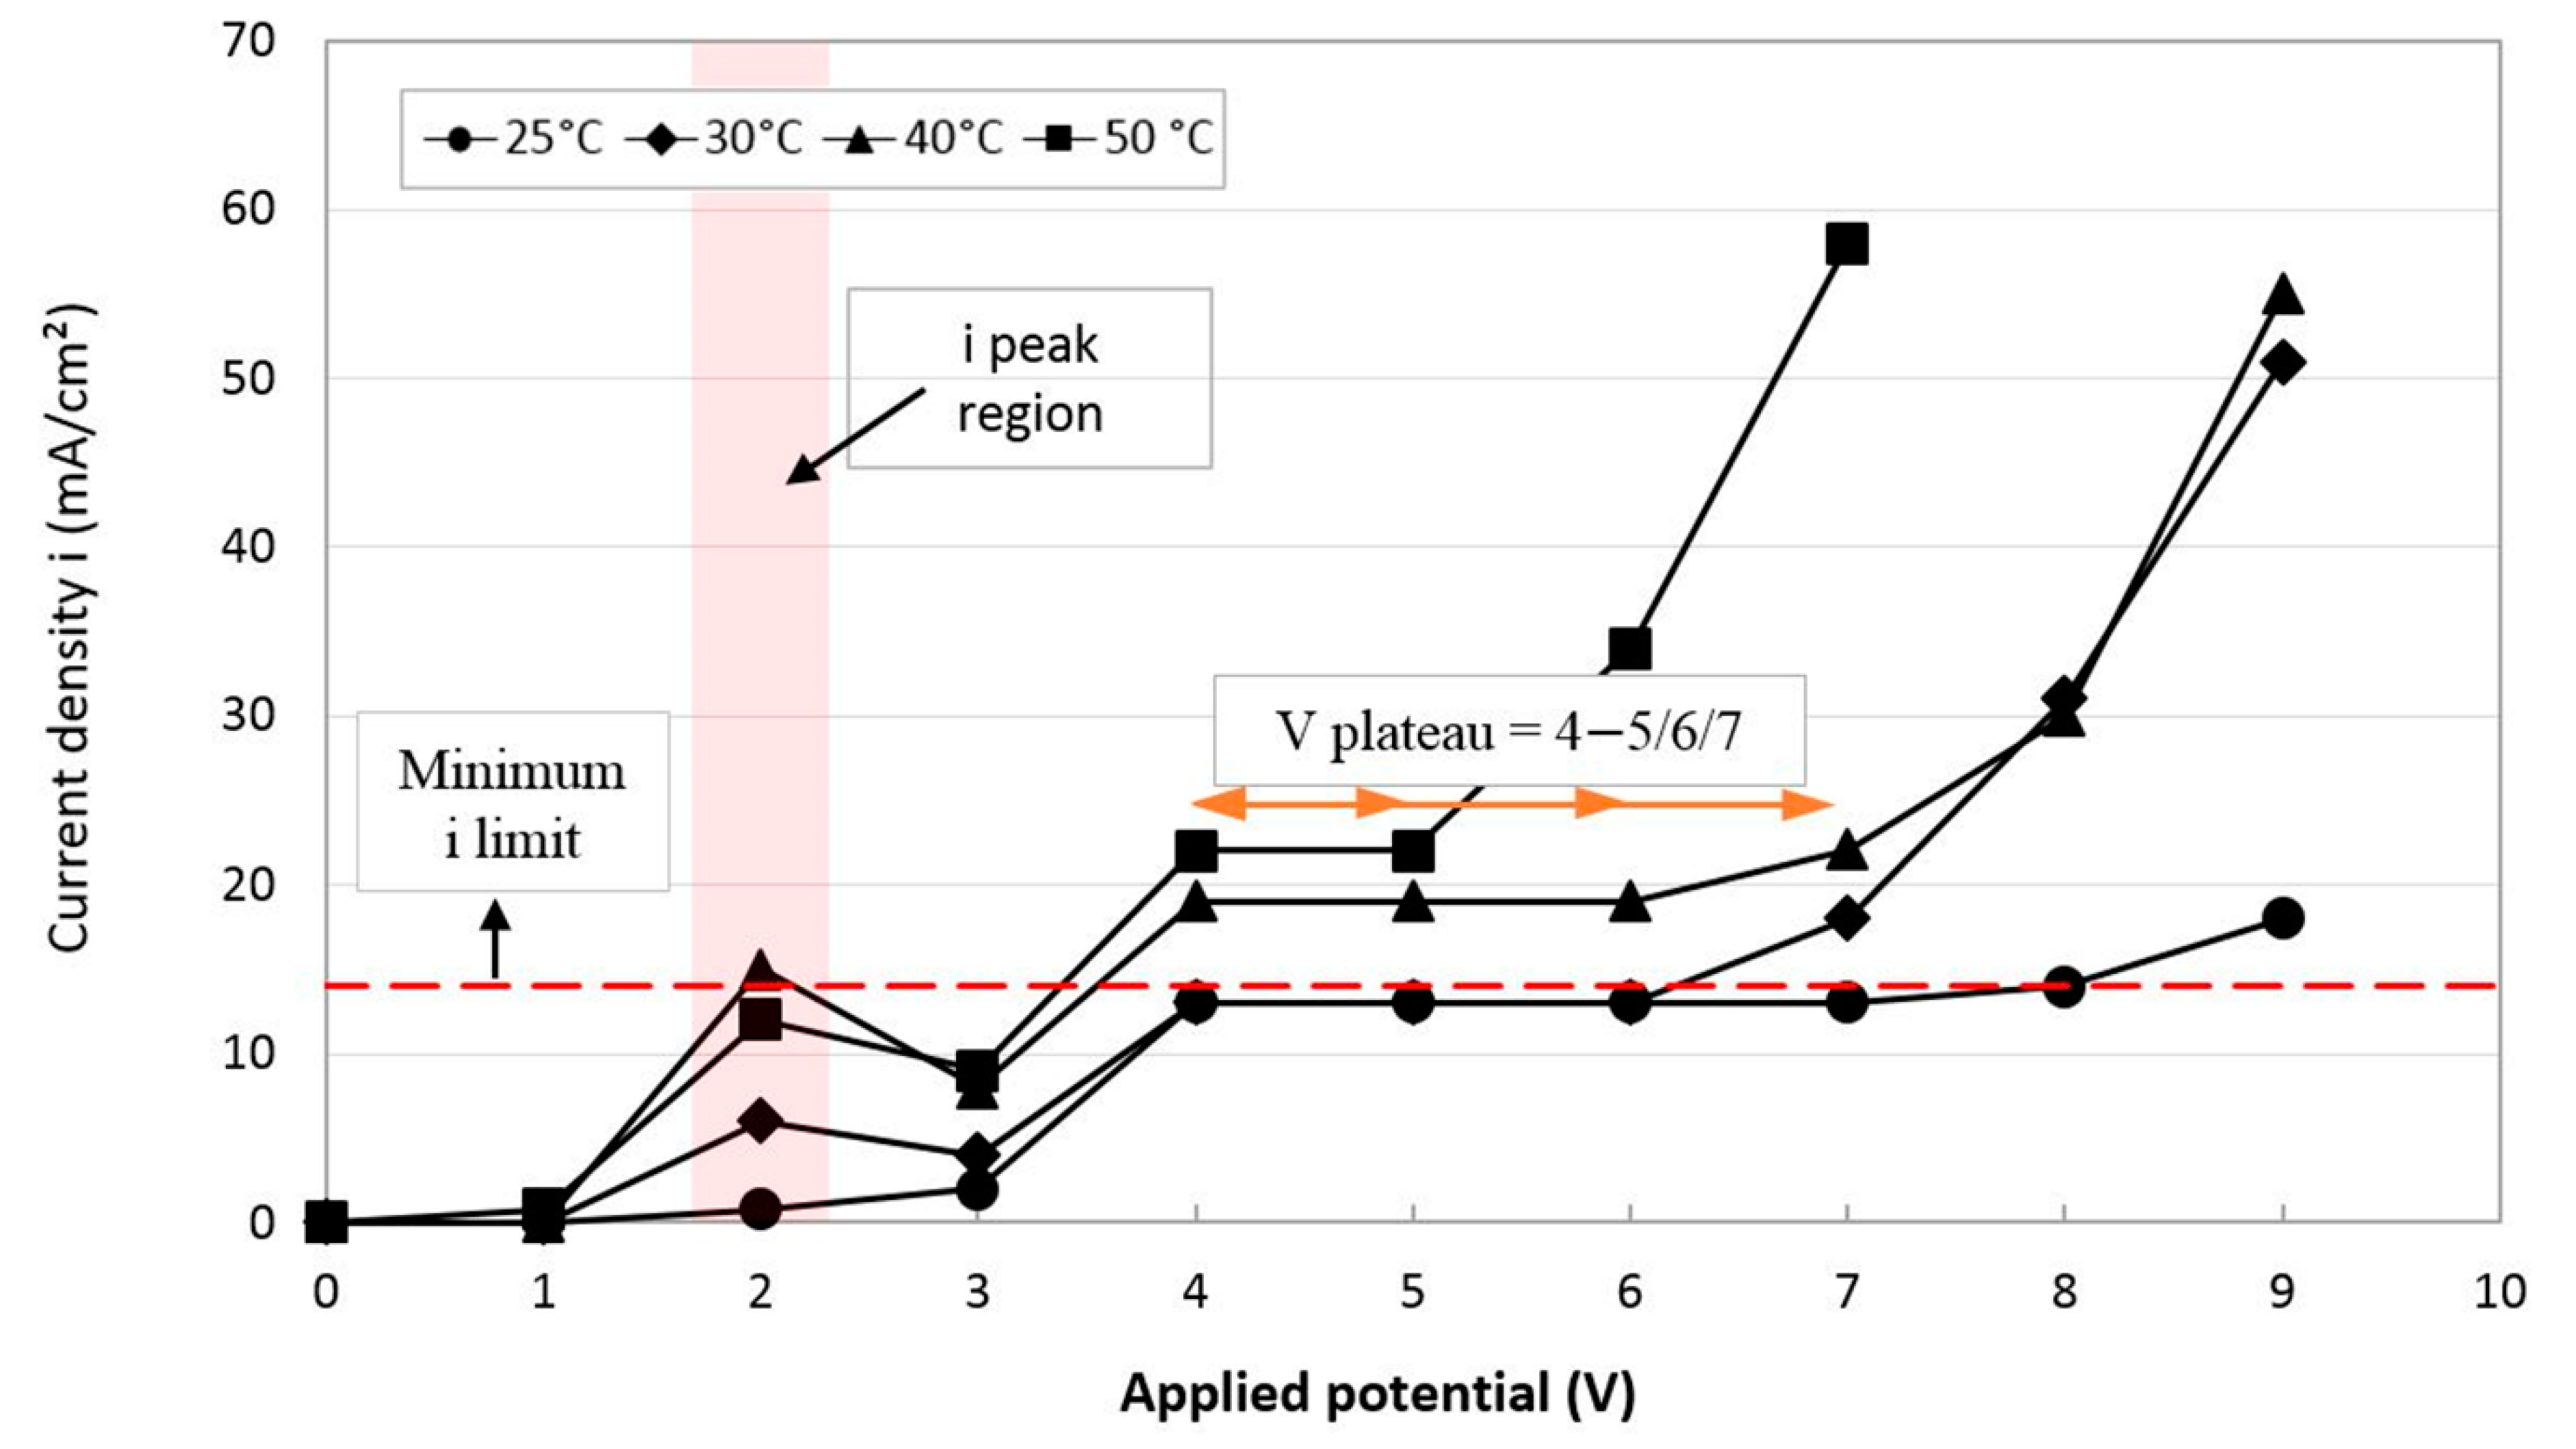
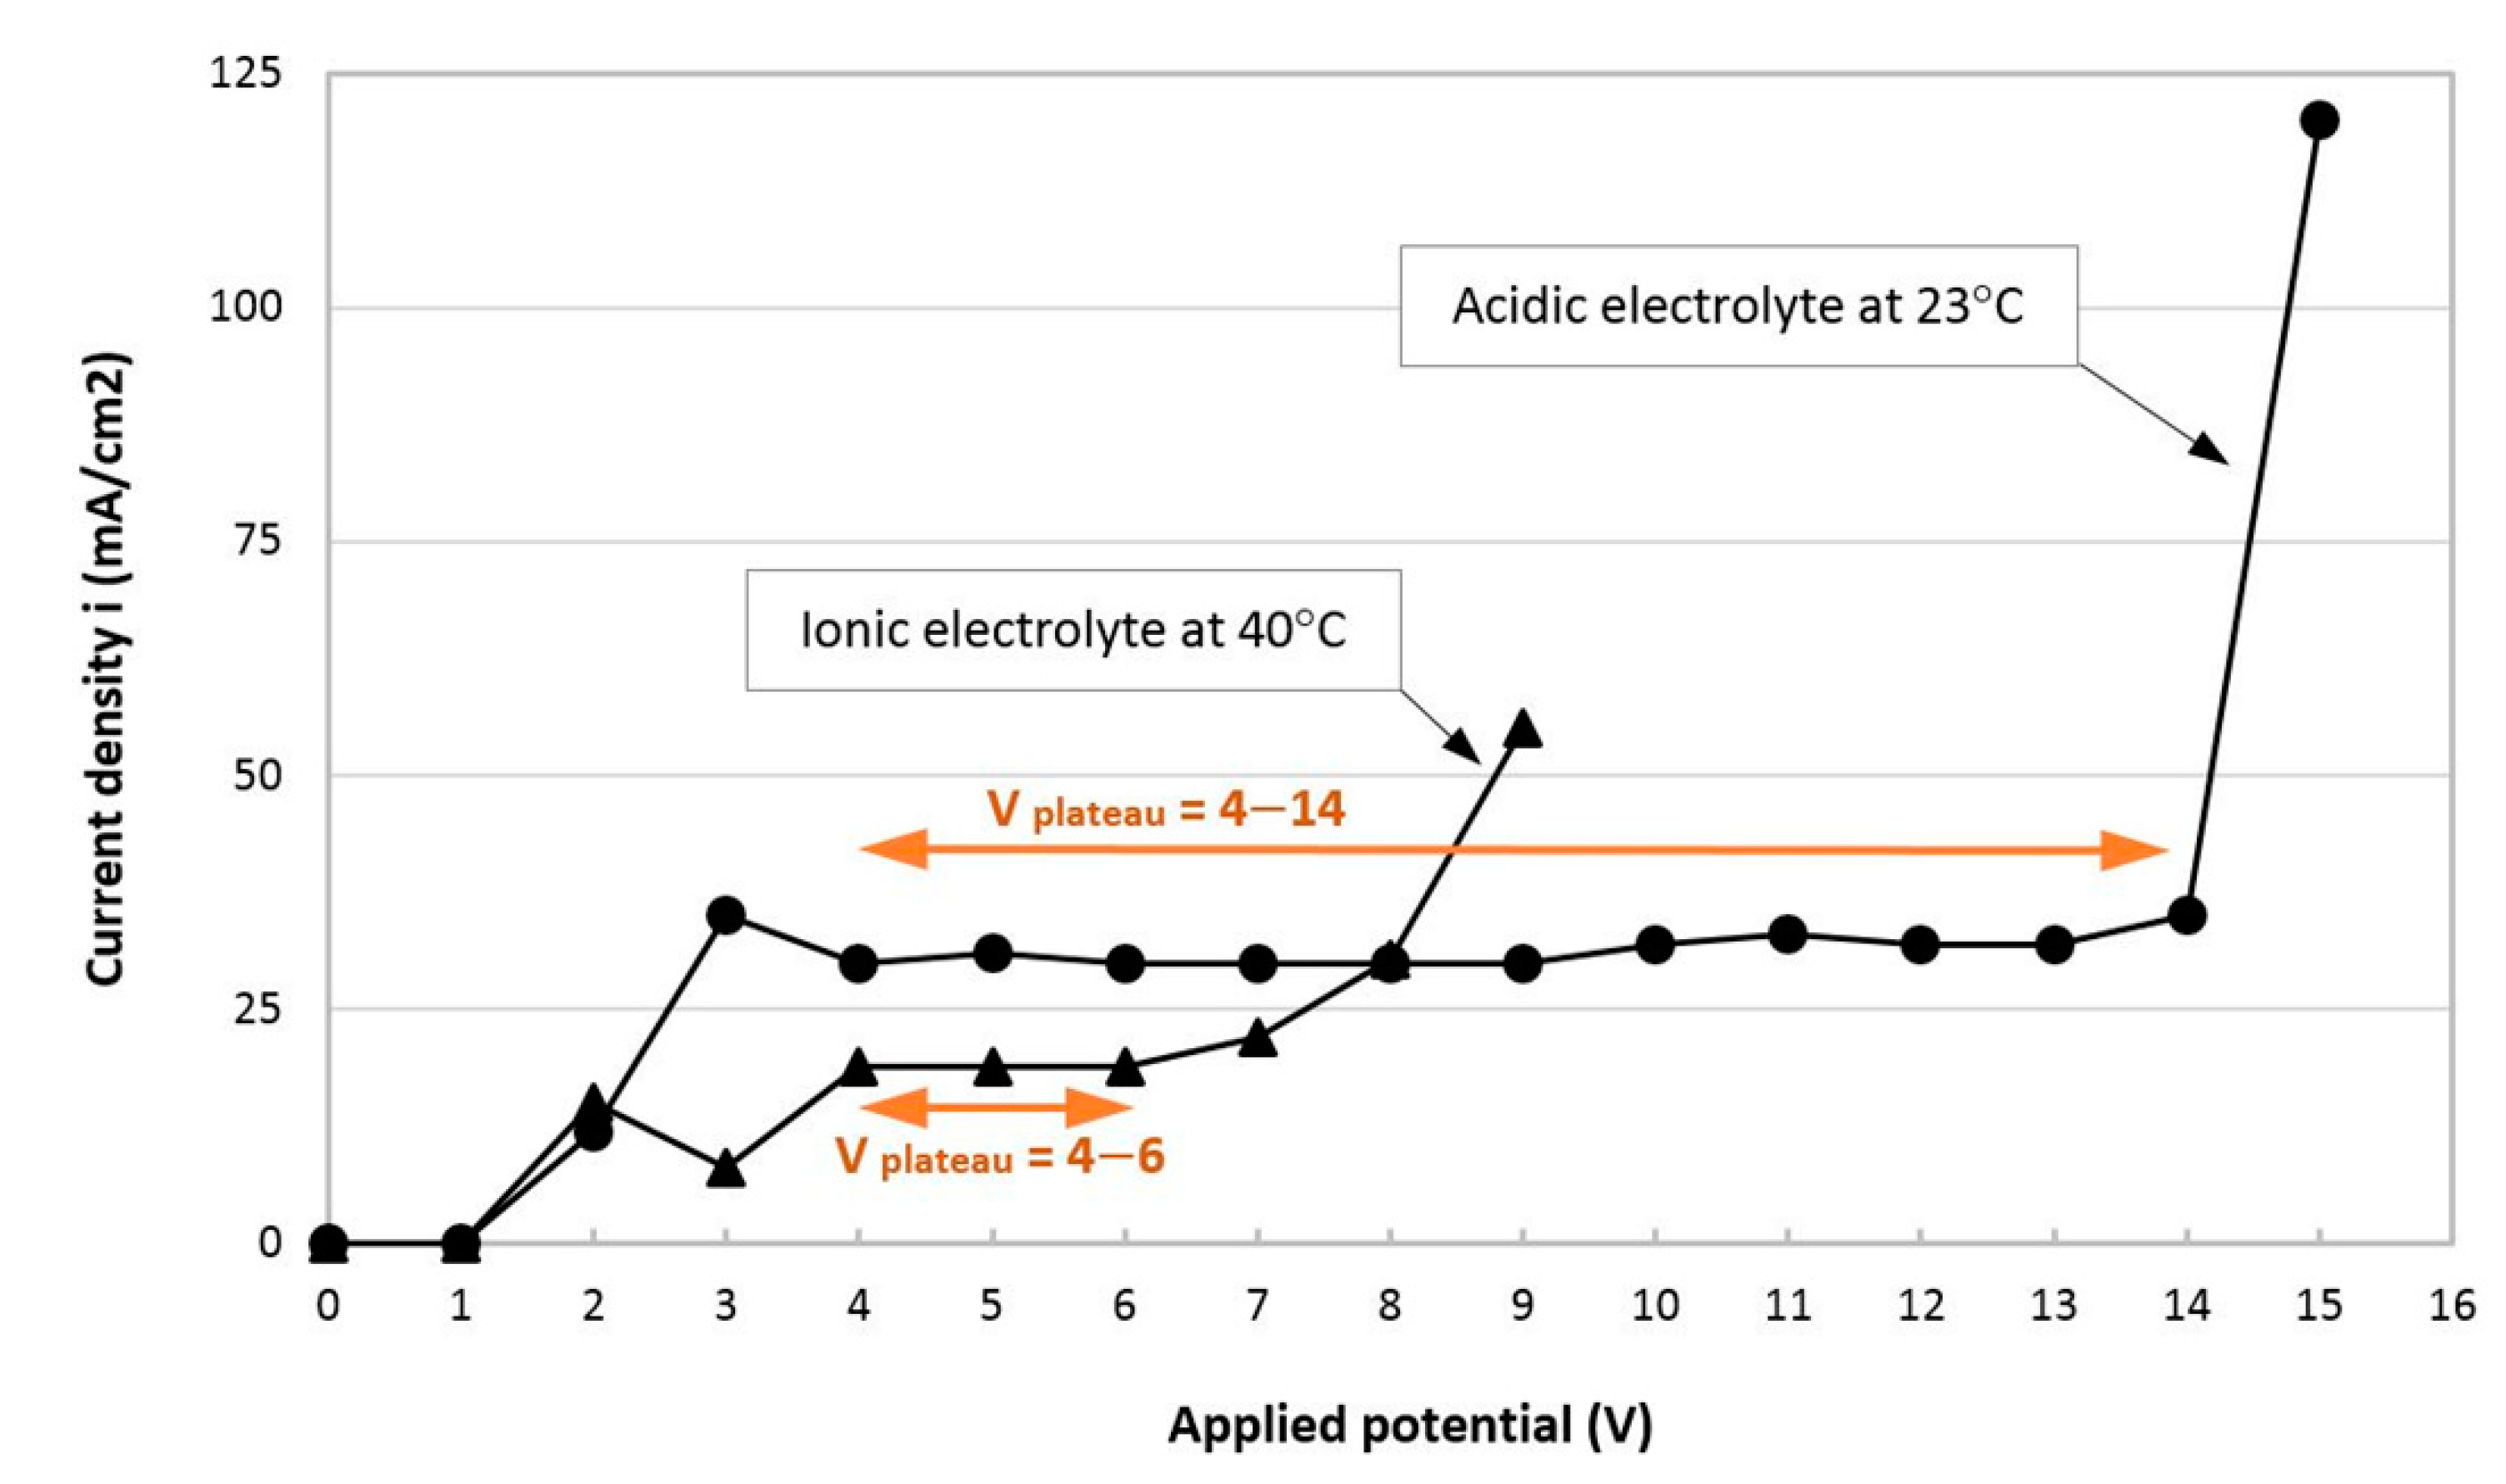
  • V plateau range: As the temperature increases from 25 to 50 °C, a stable part of the i plateau, or the polishing region, shortens from 4–7 V to 4–5 V. The characteristic constant current density of the V plateau is controlled by the mass transport phenomenon and is independent of the applied voltage.
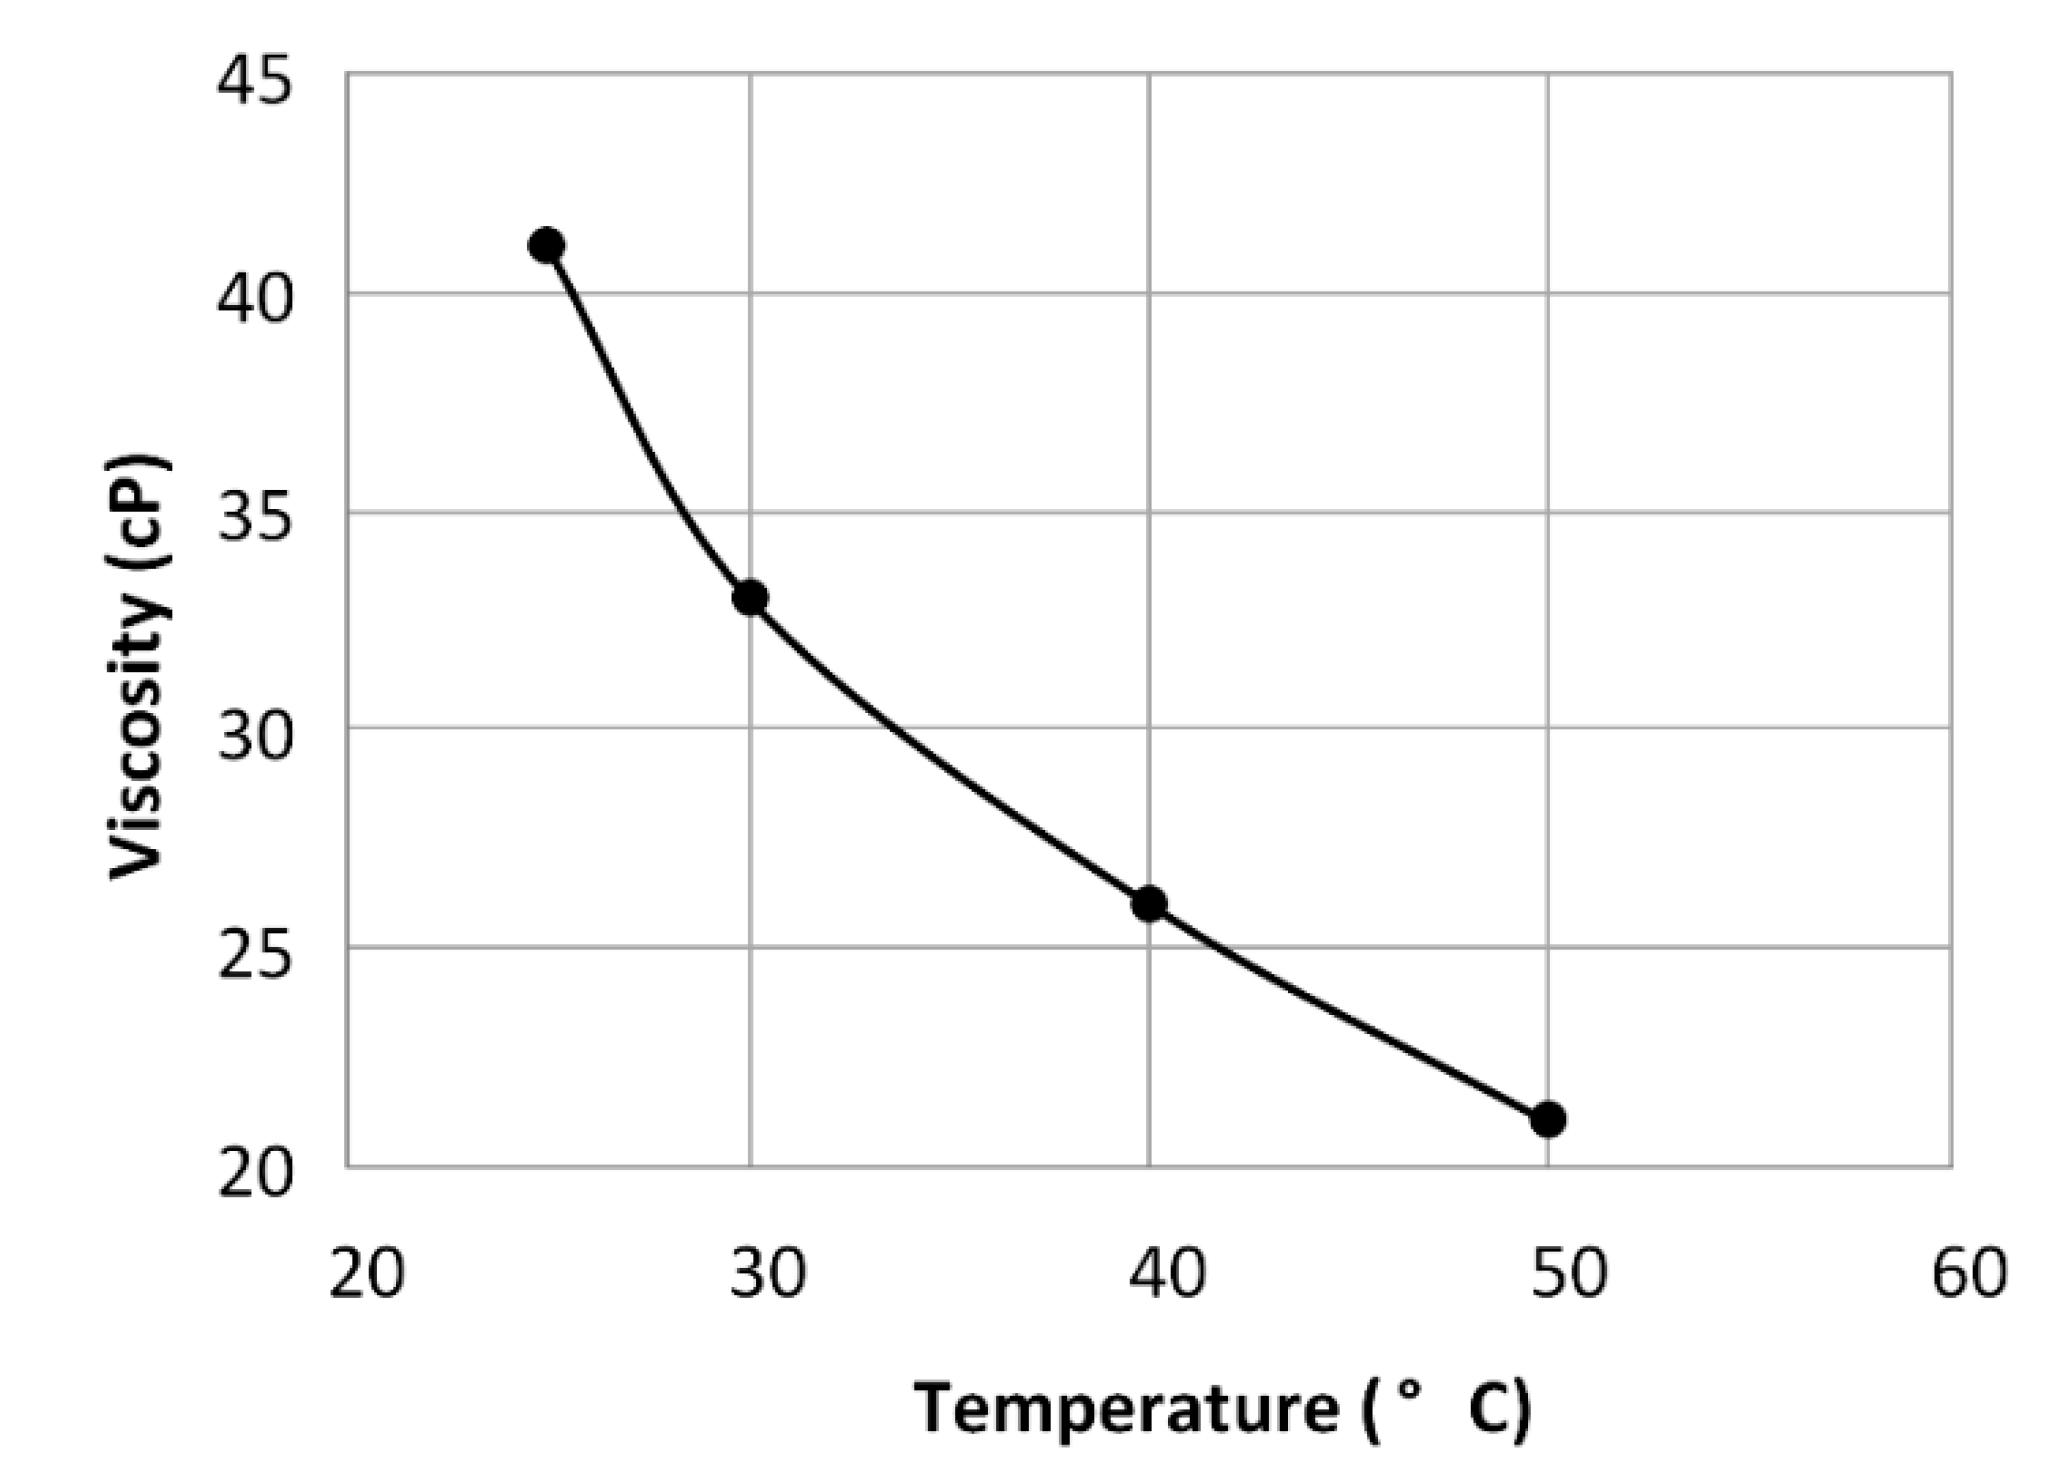
  • Current density: As the temperature increases from 25 to 50 °C, the current density corresponding to the i plateau increases from 13 to 22 mA/cm2. This is attributable to a decrease in viscosity due to the increasing temperature, which leads to a higher current efficiency and current density of the electrolyte, as discussed in Section 2.2.
  • Minimum allowable current density: According to the results of preliminary testing carried out at temperatures of 25 and 30 °C in the applied potential range of 4, 5 and 6 V (i ≈ 14 mA/cm2), no surface roughness improvements were observed. The reason could be that in these cases, anode surface dissolution led to etching instead of surface polishing. To explain, electropolishing is able to dissolve asperities (peaks) of the surface layer much faster than the surface of the micro-valleys, resulting in overall improvement of the surface roughness. In contrast, electroetching does not have such a selective capacity, ending up with no change or more roughness [2]. Therefore, the current density of i ≈ 14 mA/cm2 was defined as a minimum allowable current density for the selection of adequate EP conditions.
  • i peak region: On the i-V graphs in Figure 3, an i peak was observed at 2 V, and the higher the electrolyte temperature, the greater the peak. The nature of the current density peak before the Vplateau region depends on the EP mechanism for the electrolyte system. In an ionic electrolyte with the salt film mechanism, the i peak is related to the super-saturation of the forming salt on the surface. In an acidic electrolyte with the passivation mechanism, the i peak is the characteristic passivation response [18].
  • Negative i-Va relationship after i peak region: There exists a window of negative current density-voltage relationship after the i peak, whereas there is no such behavior for EP in acidic electrolytes. This can also be explained by the salt precipitation mechanism in the ionic electrolyte. During EP, the salt film is formed at the bottom of surface pits. As the temperature rises, the i peak value increases, which is an indication of the super-saturation of the salt forming with the dissolved metal ions. There could be easier ion transport through the salt layer because of the higher electrical field across this layer. The concentration gradient of the metal ions across the salt layer decreases after passing the voltage of the i peak region, resulting in a drop in the current density value [19]. Afterwards, the concentration gradient of metal ions increases to the V-plateau current density level and becomes saturated and constant through the plateau region. The transition from the electrical current peak corresponding to the super-saturation of the salt layer to the current density of the V plateau (equilibrium state) is discussed in detail in Reference [20].
Based on these observations, two EP temperatures were selected, 40 °C and 50 °C, since their i plateaus of 19 mA/cm2 and 22 mA/cm2 are above the minimum pre-established current density of i ≈ 14 mA/cm2. For these temperatures and current densities, the applied potentials correspond to Va = 4 V for 50 °C and Va = 5 V, for 40 °C. Next, preliminary validation EP tests were carried out at 40 and 50 °C on a selected IN625 sample with a surface roughness of Ra ≤ 6 µm. When optimum applied potentials (Vopt) were applied (4 V for 50 °C and 5 V, for 40 °C), mirror surface finishes were obtained at both temperatures. When Va < Vopt, a purple-blue oxide layer appeared on the surface (invariable Ra value), whereas when Va > Vopt, milky surfaces containing several pits of over 150 µm in diameter were observed (increased Ra value), as can be seen on the samples polished under optimal and suboptimal operation potentials (Figure 4). These results confirm the validity of the optimization protocol used in this study.

3.2. Roughness and Material Removal Measurements

First, all the electrodes were degreased with distilled water and put into an ultrasonic cleaner with acetone for 20 min. After each test, the electrodes were cleaned with distilled water, then with ethanol, and finally, air-dried. The roughness measurements, including the linear roughness average (Ra), the root mean square (Rq) and the maximum profile height (Rz), were carried out using a Mitutoyo SJ-402 surface roughness tester and a 12AAB403 standard stylus (tip radius 5 μm). The ISO 1997 standard with λc = 0.8 mm and λs = 2.5 μm was applied for roughness calculations, having three measurements over a length of 4 mm on each surface, with an additional 0.4 mm of pre- and post-travel. The measurements were performed across the layers pile-up, except for the 0°-oriented surfaces, thereby resulting in all the surface features being captured, as shown in Figure 5. The exposure time was 20 min for each test. The initial and final height profilometry observations were carried out using an Olympus OLS4100 confocal microscope, over an area of 2500 × 2500 μm2 (MPLFLN 5X objective). The mass measurements were performed using an Acculab L-Series LA-60 microbalance, with a 0.001 g accuracy.
For the material removal measurements, a Mitutoyo Crysta Apex C S-series Coordinate Measuring Machine (CMM) with a compact PH6 vertical head and a TP2-5W 40 × 3 mm stylus from Renishaw was used (Figure 6a). A screw was attached to the V-shaped samples, as shown in Figure 6b, and its cylindrical surface was used as a reference for the coordinate system in the PolyWorks software. Twenty-five points on the selected area of the 45°-, 90°- and 135°-oriented surfaces and 16 points on the 0°-oriented surface (yellow rectangles in Figure 5) were selected and probed after each hour of polishing. Then, the best-fit planes were generated from the point cloud of each surface, and the distances between the planes were calculated, always keeping the as-built surface as a reference for the thickness measurements after the EP process. The measurements were repeated three times, and their mean values and standard deviations (SD) were noted.
Roughness, surface topography, mass loss and material removal measurements were carried out from one to four hours of EP, until reaching Ra ≤ 6.3 µm. An Ra value of 6.3 µm is known as the ISO N9 grade number. Preliminary tests showed that at these values of Ra roughness, all semi-welded particles and most of the surface features of the LPBF process were removed, resulting in an improved surface finish as compared to the as-built state. Since, after 20 min of EP, a 2 mm-thick foam appeared on the electrolyte surface, decreasing the current density, the process was stopped every 20 min to remove the foam. The Ra, Rq and Rz surface roughness parameters, and the material removal values of the 0-, 45-, 90- and 135°-oriented surfaces were compared for the ionic electrolyte (current work) and for the reference acidic electrolyte [3].

4. Results

4.1. Roughness Measurements

The evolution of roughness as a function of time of polishing was evaluated on all the surfaces of the V-shaped sample (0, 45, 90, and 135°) using the following testing conditions: electrolyte temperatures of 40 and 50 °C, constant- and instantly-applied potential, exposure time of 20 min, and polishing time of 1, 2, 3, and 4 h. As shown in Figure 7a for T = 50 °C, Va = 4 V conditions, after the first hour of EP, Ra did not manifest any notable evolution in time for all the build orientations. After 4 h of polishing, Ra values of the 0-, 45- and 90°-oriented surfaces decreased below a target value of Ra = 6.3 µm, while that of the 135°-oriented surface reached Ra = 10.3 µm, thus indicating that only semi-welded particles have been removed before EP was stopped. It can therefore be concluded that at T = 50 °C, the selected green electrolyte does not perform efficiently for the EP of LPBF IN625 components.
As shown in Figure 7b for the T = 40 °C, Va = 5 V conditions, surface roughness was improving for all the build orientations during the entire polishing time range. For the 0-, 45- and 90°-oriented surfaces, Ra ≈ 3 µm was obtained after 2 h of polishing, while for the 135°-oriented surface, Ra = 5.9 µm was obtained after 4 h of polishing. Note that the surface roughness is the highest for the down-facing unsupported 135°-oriented surface. Therefore, the minimum polishing time needed to obtain the Ra ≤ 6.3 µm on all the surfaces was 4 h. After this time of EP, all partially bonded particles were removed, and the surface finish quality was improved up to a level acceptable for multiple applications, such as aircraft ducting or jet engine exhaust systems. The polishing process was then continued to up to 6 h of EP, which resulted in a further reduction of the 135°-oriented surface roughness to Ra ≈ 4 µm (not shown in Figure 7), thus indicating that no saturation of the polishing process occurred during this polishing time range.
In Figure 8, the roughness parameters Ra, Rq and Rz before and after 4 h of EP in the ionic and acidic electrolytes are compared as functions of the build orientation. The latter data are taken from Urlea et al. [3]. It can be observed that both electrolytes provided similar Ra, Rq and Rz reductions for the 45- and 90°-oriented surfaces. However, in the case of the 135°-oriented surface, the ionic electrolyte showed 17% less roughness reduction as compared to the acidic one. In should be noted that for the 0°-oriented surface, the surface roughness after EP in the acidic electrolyte either did not change or became even slightly worse than before EP, whereas in the ionic electrolyte, the surface roughness showed ~30% improvement after polishing.
In should be noted that a relatively weaker performance of EP on the 0°-oriented surfaces, as compared to their 45-, 90- and 135°-oriented counterparts, may be attributable to two mains factors: a relatively small polishing area and a suboptimal cathode-anode arrangement. The current distribution on the anode surface is a function of the ohmic resistance and geometrical profile of the anode, the anode-cathode distance and the anode surface area [18]. Research on anodizing AA1050 alloy showed that the larger the anode surface area, the faster the local current density minimum is reached, and the more efficient the process [21]. Another study showed that for buffered electropolishing of Nb, the more conformal the anode-cathode arrangement, the higher the surface finish quality [22]. It can therefore be suggested that to improve the EP efficiency on the 0°-oriented surface of this study, the cathode-anode arrangement must be optimized.

4.2. Surface Topography Characterization and Material Removal Measurements

Figure 9a–d compare the surface topographies for four surface orientations before and after their EP. For each build orientation, the visual representation and the 3D height distribution (taken with scanning laser confocal microscopy) are accompanied by their respective roughness traces (obtained using roughness profilometry), for the initial and final surfaces. The Ra values of the as-built and polished surfaces are given to provide a better visualization of the surface finish improvements, which were measured using a contact stylus. The confocal microscopic images on the 0°-oriented surface show that parallel stripes formed during the LPBF process are eliminated. Moreover, the semi-welded particles are totally removed from the surface, they are shown as red dots on the height profilometry representations. Evidently, the roughness trace profiles become more homogenized, and the surface waviness is reduced.
As a common EP defect, pitting is present on the polished surfaces irrespective of their build orientations. The maximum pit diameter is 50 µm on the 45-, 90- and 135°-oriented surfaces, which is equivalent to the pit diameter obtained by EP in an acidic solution carried out for IN625 [3]. Considerably larger pits appeared on the 0°-oriented surface with a diameter of about 150 µm. As stated earlier, this may be due to a small area of the 0°-oriented surface and suboptimal arrangement of the V-shaped electrodes, which result in a delayed and less uniform primary current distribution on this surface.
Results of the mass loss measurements during 4 h of EP at 40 °C under an applied potential of 5 V are presented in Figure 10. For the V-shaped sample, the total mass loss evolution over time is linear, resulting in almost 6% of mass reduction after 4 h of EP. The inserts in Figure 10 illustrate the surface aspect of the V-shaped sample before and after 4 h of EP under the aforementioned conditions. It can be seen that EP removed semi-welded particles and decreased the staircase effect on the sample surface. Furthermore, a homogeneous dissolution and even material removal from all points of the surface prevented the edge rounding effect and confirmed an adequate level of process optimization.
The results of the thickness reduction (TR) measurements (40 °C, 5 V) are presented in Figure 11 for all the differently oriented surfaces. The TR evolves almost linearly from 0 to 2 h and then from 2 to 4 h of EP, presenting a higher TR slope for the first 2 h. Higher thickness reductions correspond to rougher surfaces. In addition, the steepest TR slope is obtained for the roughest 135° surface with the greatest number of semi-welded particles attached to it, as shown in Figure 9, while the smallest TR slope is obtained for the smoothest 0°-oriented surface.
In summary, after 4 h of EP, TR = 55 μm for the 0°-oriented surface with initial Ra = 1.37 μm, TR = 146 μm for the 45°-oriented surface with initial Ra = 9.27 μm, TR = 129 μm for the 90°-oriented surface with initial Ra = 5.92 μm, and TR = 258 μm, for the 135°-oriented surface with initial Ra = 17.04 μm.

5. Discussion

5.1. EP Optimization, Polishing Mechanism and Viscosity of 1 Choline Chloride:2 Ethylene Glycol (1ChCl:2EG) Electrolyte

5.1.1. EP Optimization and Polishing Mechanisms

The EP mechanisms differ significantly in ionic versus acidic mixtures. A study on the 316 stainless-steel EP mechanisms in ChCl:EG and aqueous acid electrolytes showed that the ionic system is more potential-dependent and that polishing occurs at lower potentials as compared to the case with acidic mixtures [9]. Comparably, in this work, the EP of IN625 in ChCl:EG solution occurred at a lower and more narrow range of potential (optimum 4 V, range 4–6 V) than in an acidic mixture composed of 60% perchloric acid and glacial acetic acid in a 3:7 volume ratio used by Urlea and Brailovski [3] (optimum 9 V, range 4–11 V), Figure 12.
The temperature increase results in an exponential increase of current density and affects the electrochemical reactions [19]. A study on EP of re-melted LPBF 316L stainless-steel using ILs [23] showed that at very high electrolyte temperatures, the material dissolution and surface roughness increase due to an increased current density, which may result in a non-homogeneous material dissolution. As shown in Figure 3, the current density plateau increases as the temperature increases from 25 to 50 °C. In addition, the temperature increase also intensifies the chemical reactions related to the super-saturation of the salt film in the i-peak region by increasing the value of the current density peak. Furthermore, as the temperature rises, the viscosity of the electrolyte decreases (Figure 2), which makes it difficult to maintain the viscous salt film on the surface [19]. As shown in Figure 7, EP at 50 °C is only able to remove semi-welded particles from the surface within the first hour of polishing, and no surface roughness reduction (no polishing) is observed after this time. It is worth noting that there was a continuous mass loss reduction during EP for 4 h at 50 °C, showing that the material dissolution did not lead to surface polishing.
Based on the above observations, an optimum temperature of 40 °C was selected to reach the desired electropolishing effect in this system. At this temperature, an optimum current density between 14 and 20 mA/cm2 at a constant temperature 40 °C results in a continuous surface roughness reduction. Accordingly, a homogeneous material dissolution was obtained, thus preventing the edge rounding effect (Figure 10).
Depending on the diffusion-limited species, two different polishing mechanisms are involved in the EP of IN625 alloy in the ionic and acidic electrolyte systems:
I. Passivation mechanism in acidic electrolyte
The passivation mechanism is limited by the diffusion of acceptor anions to the dissolving metal ions of the surface. During the passivation process, a viscous layer is produced on the surface as a result of the formation of a complex between the acceptor and surface metal ions. The concentration of the diffusion-limited anions reaches to zero on the metal surface, after being consumed. Urlea and Brailovski [3] showed that a passive layer was formed on the surface of the anode during EP of IN625 in an acidic solution. Abbott et al. [4] also observed the characteristic passivation response in the polishing potential region of 316 stainless-steel in an acidic electrolyte. In this work, the current density of the ionic electrolyte was i   14 mA/cm2, whereas it was about i = 30 mA/cm2 in the acidic electrolyte used by Urlea and Brailovski [3].
The voltage drop caused by the presence of the passive layer might be the explanation of the higher EP current density at acidic electrolytes compared to the ionic liquids with no passive layer formation. Moreover, the presence of a passive layer on electrodes increases the ohmic loss of acidic systems, and consequently, decreases the current efficiency in EP systems with a passivation mechanism. Decrement of the current efficiency describes the reduction of the efficiency of charge transfer for accelerating the electrochemical reactions of the EP system. A similar discussion was provided on the correlation between the current efficiency and operating conditions such as the applied current, voltage drop and cathode-anode distance for the removal of the green dye from the aqueous solutions by electrocoagulation [24]. The polishing process took longer in the ionic system for 135° surface with the worst case of roughness, which might be due to a longer process of oxide layer removal from the anode surface in the 1ChCl:2EG mixture as described in more detail in the next section. Note that the oxide layer on the IN625 alloy is a strong protective film made of oxides such as Cr2O3 and NiCrO2, formed on the surface due to a high percentage of chromium in the alloy composition [25].
II. Salt precipitation mechanism in Ionic electrolyte
In this mechanism, diffusion-limited species are the dissolving metal ions. The reaction of the dissolving metal ions with the electrolyte ions results in the precipitation of a salt film on the metal surface. This salt film guarantees that there will be a constant concentration gradient of metal ions through the diffusion layer, from the anode surface with a fixed saturation concentration of metal ions to the electrolyte interface. Consequently, a constant current density is provided in the ionic electrolyte system. The correlation between the V plateau current density (i) and the salt layer characteristics can be found in Reference [18].
The metal oxide layer of the anode surface significantly impacts the main EP mechanism of the ChCl:EG system [9]. The primary surface charging of electrodes initiates the reaction of a chemical dissolution of the metal oxide on the surface, which takes more time in ionic solutions than in acidic solutions, especially for the 135°-oriented surface with a considerably high initial roughness. In ionic solutions, the diffusion-limited mechanism of metal dissolution starts during the oxide dissolution by dissolving base metal through the holes formed in the oxide layer.
It is known that in aqueous electrolytes, the best polishing quality is obtained at higher potentials within the V-plateau [18]. However, in this work, a mirror-like surface finish was observed at lower potentials of the V-plateau, which can be explained by the contribution of the oxide layer to the EP mechanism. The dissolution of the oxide layer occurs at lower potentials, while the diffusion-limited process is observed at higher potentials [9]. Evidently, the oxide dissolution process affects the polishing mechanism by decreasing the optimum applied potential, since it is a slow process. In this work, it took about 5 min to remove the entire oxide layer and precipitation of the salt on the polishing surface. The non-viscous salt layer had about 1 mm of constant thickness and was green in color.
As mentioned in Section 4, the EP process was stopped every 20 min to remove the foam from the surface. This action resulted in the production of a new oxide layer on the surface. Therefore, it can be suggested that EP with an electrolyte flow produced by a pumping system would increase the optimum applied potential and the efficiency of the EP system by avoiding the reformation of the oxide layer. There could not be a tendency of forming the surface oxide layer while the anode sample is submerged in the electrolyte solution, because of the constant formation and presence of the salt film on the surface. This might have beneficial effects in terms of increasing the polishing rate and quality.

5.1.2. Viscosity

Figure 2 provides the viscosity versus temperature graph of the 1ChCl:2EG solution. According to a study on the EP of stainless-steel in an 1ChCl:2EG system, the mixture of ethylene glycol with choline chloride leads to noticeably higher conductivity and lower viscosity versus the eutectic solvents of amide or carboxylic acid with ChCl [4]. Most commercial acid-based EP solutions have a viscosity of about 20 cP at room temperature. At 40 °C, the viscosity of the 1ChCl:2EG electrolyte used in this study was about 26 cP, which is only slightly higher than that of the acidic solutions.
Yang et al. showed that during the EP of LPBF IN718 parts, the driving force of the electric field releases the Ni2+ ions from the anode surface. Afterwards, the Ni2+ species are carried away from the anode via electrolyte circulation. Accordingly, the mass transportation of Ni2+ ions could be increased by decreasing the electrolyte viscosity [26]. It is known that the viscosity of aqueous EP mixtures can be decreased by adding fluidity enhancers, such as alcohols, which, however, may result in passivation of the metal surface. In the ChCl:EG electrolyte used in this study, with no oxidizing agent, the metal dissolution process is fully controlled by electrochemical reactions, which eliminates the risk of surface passivation.

5.2. Roughness Evolution Time in Ionic Electrolyte as Compared to Acidic Electrolyte

Similar EP times of polishing needed to reach the same roughness improvements on the 0-, 45- and 90°-oriented surfaces were required in both ionic and acidic electrolytes. There are several factors responsible for the EP efficiency accompanying the material removal during the EP process, which compensate the effect of each other. On the one hand, at the optimized working temperature, the green electrolyte has a higher viscosity (26 cP) than the acidic electrolyte (20 cP) and, therefore, lower electrical conductivity. On the other hand, the green electrolyte requires lower current density (14 mA/cm2) than the acidic electrolyte (30 mA/cm2).
Notwithstanding the fact that the use of both electrolyte systems resulted in the same roughness values for the 0-, 45- and 90°-oriented surfaces, the EP performance for polishing the roughest 135°-oriented surface in the ionic electrolyte is shown to be lower than that in the acidic solution. This can be explained by the different metal dissolution mechanisms in ionic and acidic electrolytes. The slow oxide layer breakdown affects the overall polishing mechanism in the ionic electrolyte due to the absence of a passivating layer (discussed in Section 5.1). The difference in the surface roughness reduction efficiencies and polishing times on the 135° surface for the two electrolytes can be decreased by carrying out the EP process in the presence of fluid flow, which should be verified by further studies.

5.3. Mass Loss and Current Efficiency

The current efficiency is the ratio of the actual mass loss of the IN625 V-shaped anode to the theoretical mass liberated according to Faraday’s law (Equations (1) and (2)) [24]:
Current   efficiency   =   actual   mass   loss theoretical   mass   loss × 100 ,
where, theoretical mass loss m (g) can be calculated as:
m =   M × i × S × T N × F ,
where, M is the molecular weight of the IN625 alloy (g/mol), I is the current density (A/cm2), S is the total wet surface of the anode (cm2), T is the time (s), N is the oxidation state and F is Faraday’s constant (Coulombs/mol).
For the 1ChCl:2EG electrolyte system, M = 60.58 g/mol (calculated according to the chemical composition of IN625 powder), i = 0.019 A/cm2 (current density of the V-plateau at 40 °C), S = 12.5 cm2 (V-shaped anode), T = 14,400 s (4 h), N = 2 (assuming NiO is supposed to be the major formed oxide in early oxidation of IN625 [27]) and F = 96,487 Coulombs/mol. Using these data and Equation (2), the theoretical mass loss of IN625 anode corresponds to 1.071 g, which gives, using an actual mass loss of 0.961 g, a current efficiency of 90% (Equation (1)).
According to the results of the EP of IN625 samples in an acidic solution (3HClO4:7glacial acetic acid) [3], M = 60.58 g/mol, i = 0.030 A/cm2 (current density of the V-plateau at 25 °C), S = 4.8 cm2 (stave-shaped anode), T = 14,400 s, N = 2 and F = 96,487 Coulombs/mol. Using these data and Equation (2), the theoretical mass loss corresponds to 0.650 g, which gives, using an actual mass loss of 0.300 g, a current efficiency of 46%.
It can therefore be seen that in the case of 3D-printed IN625, the ionic electrolyte of this study provides 44% higher current efficiency than does the acidic one. The obtained values for the current are comparable with the results of the EP of 316 stainless-steel with a current efficiency of 92% for the 1ChCl:2EG electrolyte and 30% for the acidic electrolyte [4].

5.4. Thickness Loss and the Determination of EP Allowances (Dimensions of an as-Built Part before EP)

By combining in Figure 13 the surface roughness (Ra) and thickness reduction (TR) diagrams of Figure 7b and 11, it becomes possible to establish polishing allowances and to find the time needed to obtain a needed roughness (Ra) on a specifically oriented surface of an arbitrary IN625 LPBF part.
For example, Figure 13 indicates that to reduce the overall surface roughness of a part containing 0-, 45-, 90- and 135°-oriented surfaces to Ra 6 µm, 4 h of EP is required, considering the 135° orientation as critical. Furthermore, the thickness reductions (EP allowances) resulting from 4 h of polishing correspond to 0.05 mm for the 0°-oriented surface, (0.13–0.15) mm for 45°- and 90°-oriented surfaces, and 0.26 mm, for the 135°-oriented surface.
One interesting fact is that according to the results of EP for the acidic electrolyte [3], the thickness reduction needed to reduce the surface roughness of the whole part to Ra 6 µm corresponds to 0.14 mm for the 0°-oriented surface, 0.15 mm for the 22.5–112.5°-oriented surfaces, and 0.18 mm, for the 135°-oriented surface, where the 135° surface is the limiting orientation for roughness. The thickness reductions for the differently oriented surfaces in the acidic and ionic electrolytes needed to reach the overall roughness of Ra 6 µm are compared in Figure 14.
Comparing the TRs in the ionic and acidic solutions from differently oriented surfaces shows that the material is removed with different rates, the rate depending on the initial surface roughness and the type of the electrolyte. The ionic electrolyte system removes less material from initially smoother surfaces: TR of the 0° surface (smoothest case) is four times lower than that of the 135° surface (roughest case). In contrast, for the acidic electrolyte, the surface build orientation does not have a considerable effect on thickness reduction. This means that in the ionic electrolyte, material is removed selectively, which constitutes yet another positive feature of this electrolyte.

Future Work

It is suggested that high-current density, high-voltage or magnetic field EP processes may be of interest for future research. However, the high-current density and high-voltage EP processes might not be applicable for EP of IN625 in ionic electrolytes. Generally, the ionic electrolytes, particularly in the case of viscous solutions, have limited current densities due to the lower mobility of the charge carriers and hence lower ionic conductivity [28]. Therefore, the high-current density EP is mostly performed using a mixture of concentrated acidic electrolytes [10]. High concentrated acids are also used as electrolytes for the high-voltage EP processes [12], also known as plasma electrolytic oxidation.
Furthermore, it was shown that an externally applied magnetic field affects the mass loss in two ways: either enhancing or retarding the rate of dissolution [13]. To explain, it was shown that the influence of magnetic field depends on the oxygen evolution regime parameter. For SS 316L steel for example, if the EP is carried out above the V-plateau, the magnetic field gives a rotating movement to the electrolyte and results in the thickness reduction of the viscous layer and in an increase in mass loss. However, if the process is carried out below the oxygen regime (on the plateau), the rate of material removal decreases as the strength of the magnetic field increases. The opposite was observed for the EP of IN625, where the best results were obtained in the V-plateau regime, while severe pitting occurred above this range. Therefore, it is recommended to examine the magnetic field effect within the V-plateau regime for the ionic and acidic electrolytes.

6. Conclusions

  • For the first time, the EP of a laser powder bed fusion-processed IN625 nickel-based superalloy was successfully conducted in an ionic liquid (1ChCl:2EG).
  • Narrower V-plateaus at lower applied potentials and current densities were obtained for the ionic electrolyte in the 25 to 50 °C temperature range, as compared to the acidic electrolyte at room temperature. As the temperature of the ionic electrolyte increased, the V-plateau range became narrower and the current density increased.
  • No passive layer was created on the anode surface and no aggressive gassing on the cathodes was observed in the ionic electrolyte. On the anode surface, oxide layer removal was followed by the salt EP precipitation mechanism, allowing a complete electrochemical control of the polishing process.
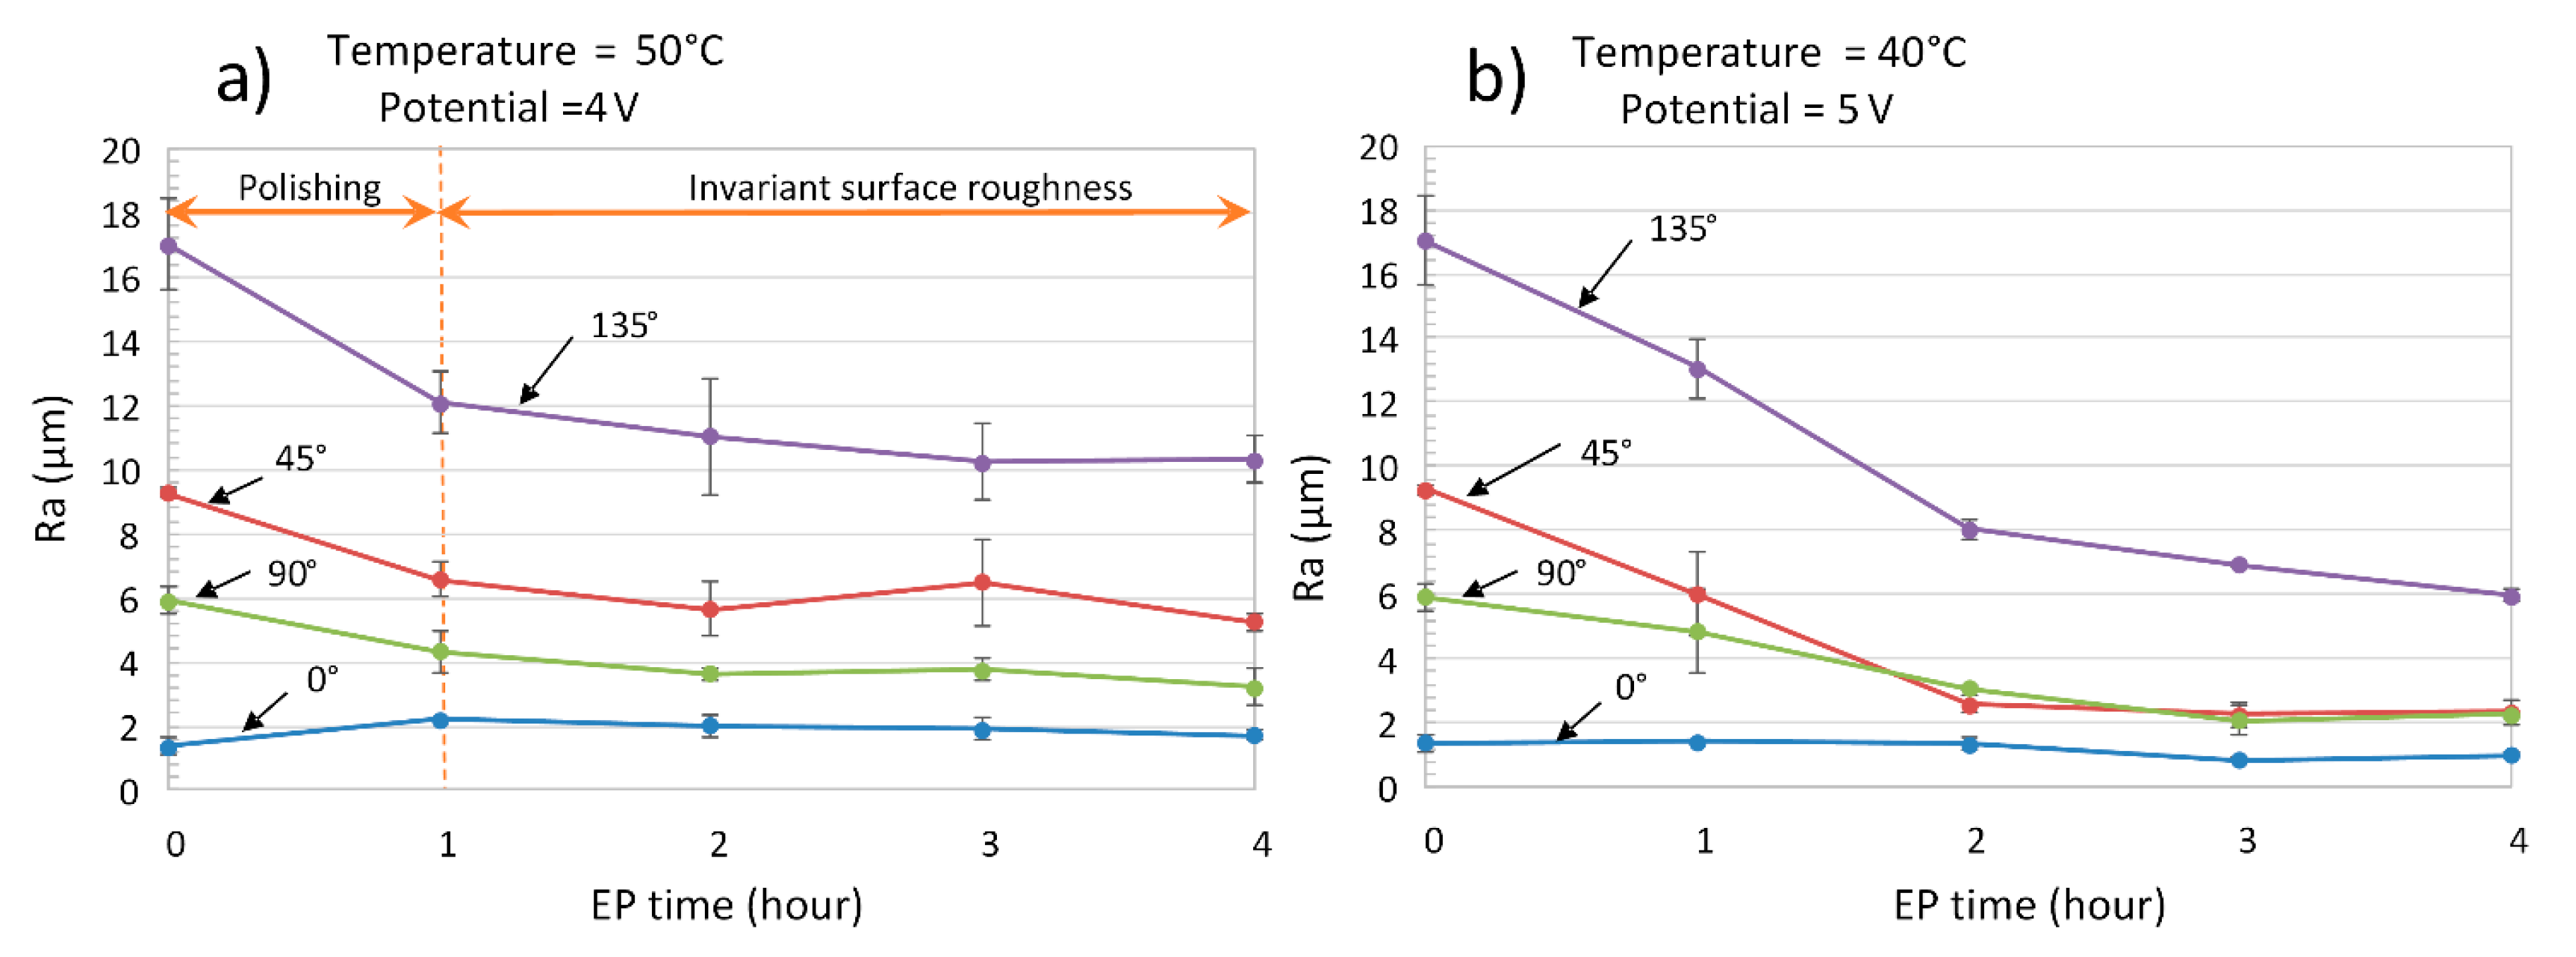
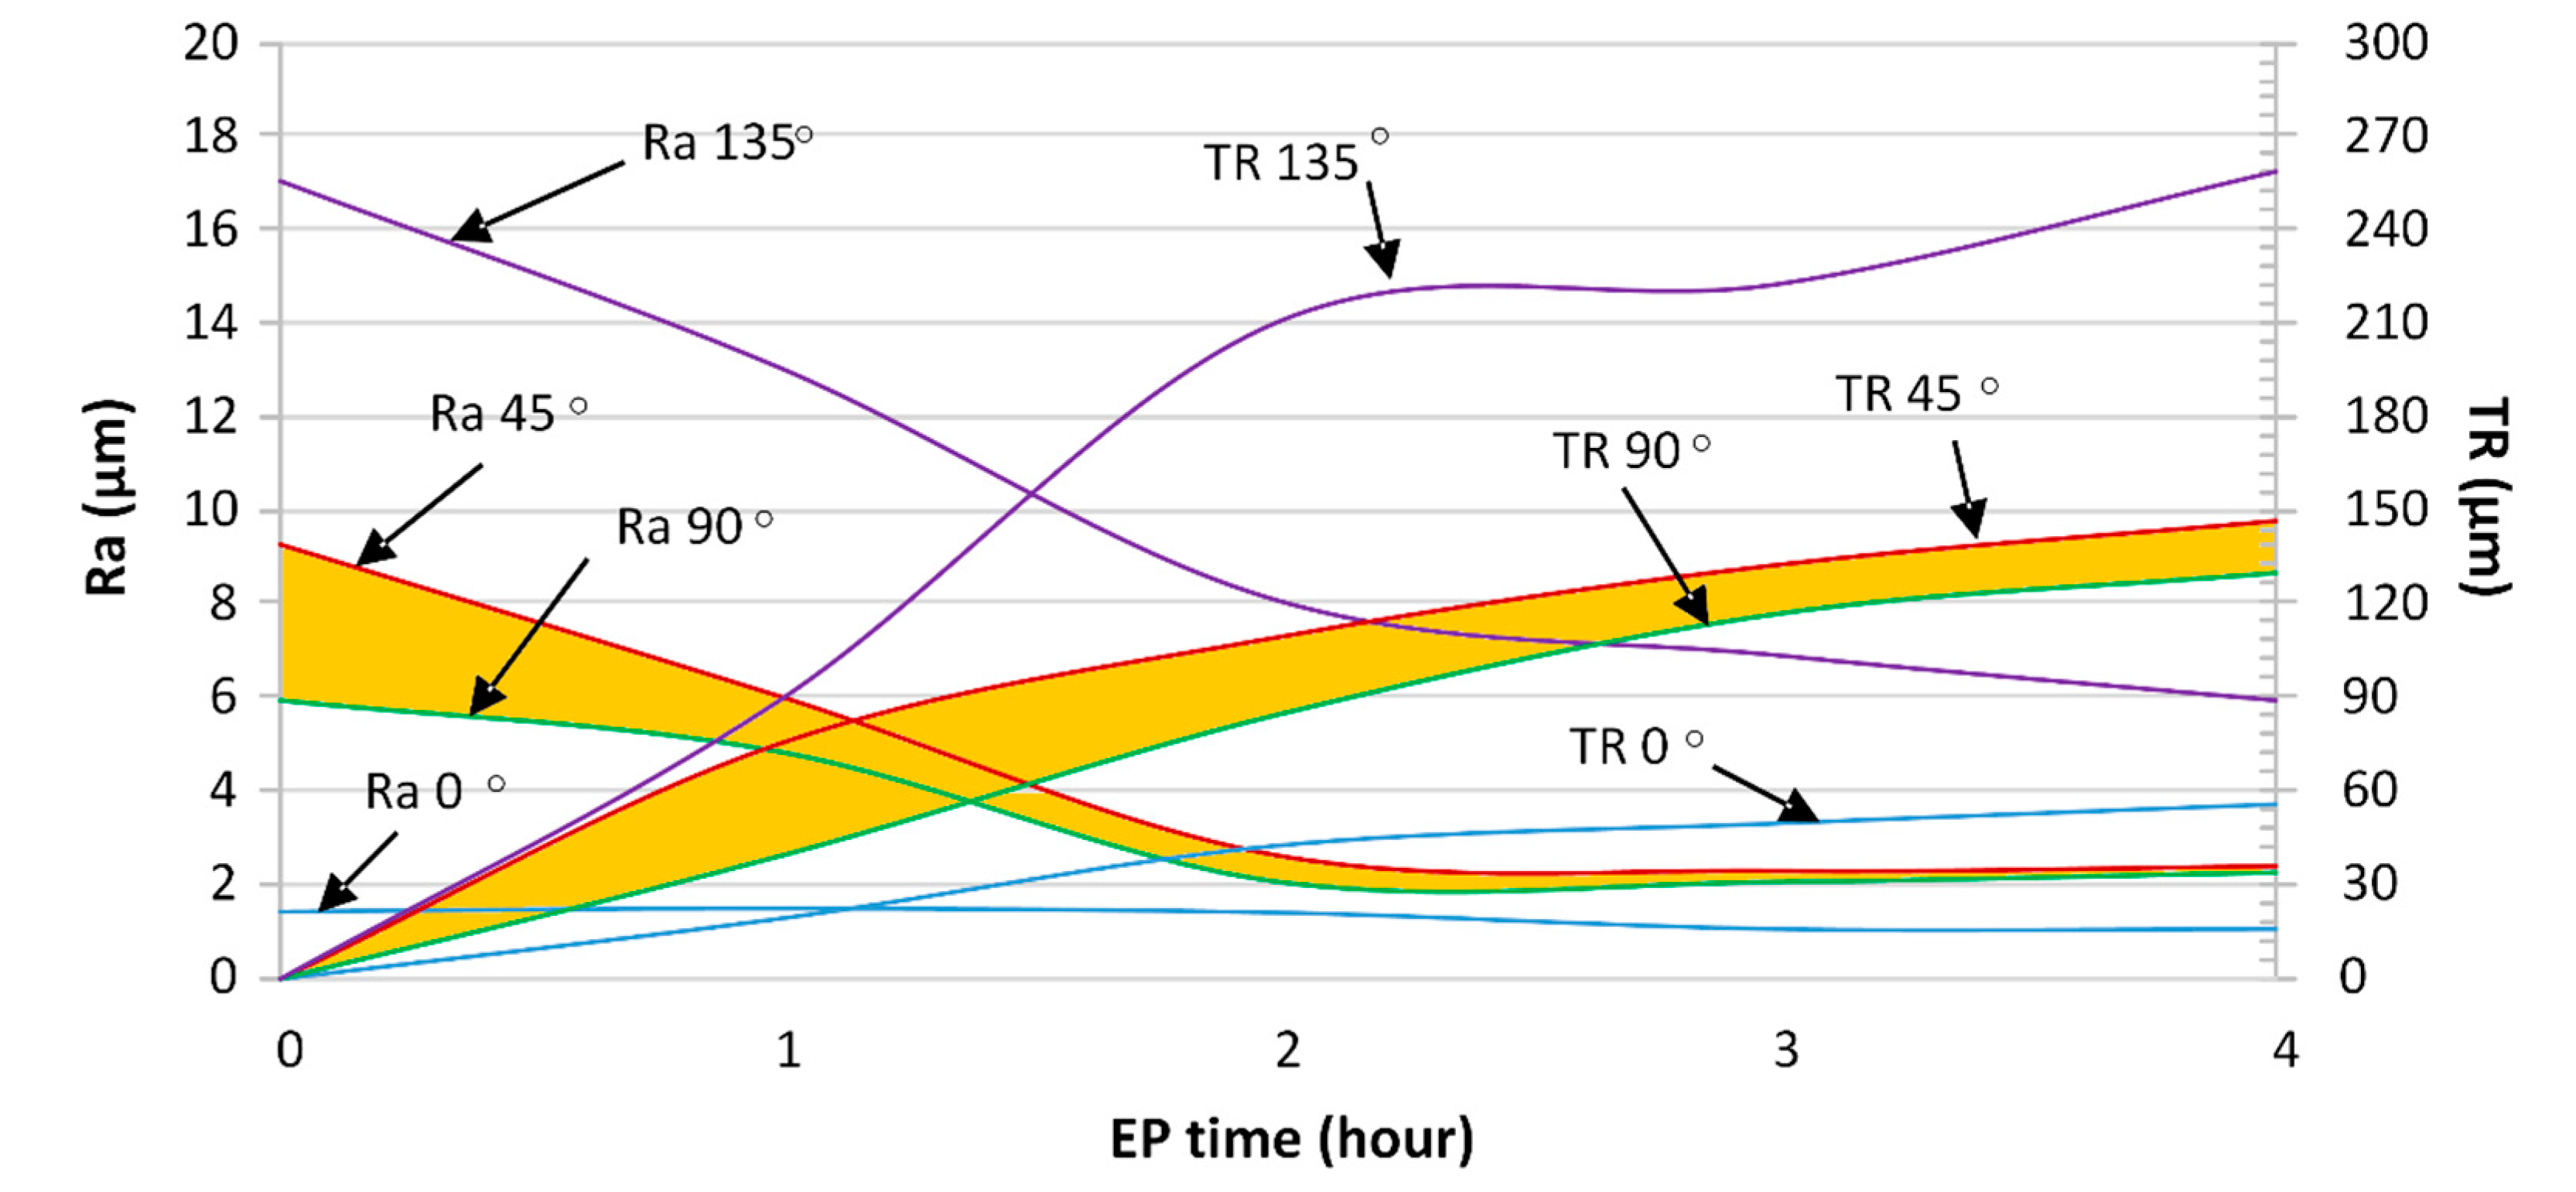
  • A continuous roughness reduction over time was observed for EP in the 1ChCl:2EG solution by regulating the electrolyte temperature at 40 °C with a viscosity of 26 cP. Uniform distribution of peaks and valleys and a homogeneous dissolution were obtained by EP in the ionic electrolyte, eliminating the edge rounding effect.
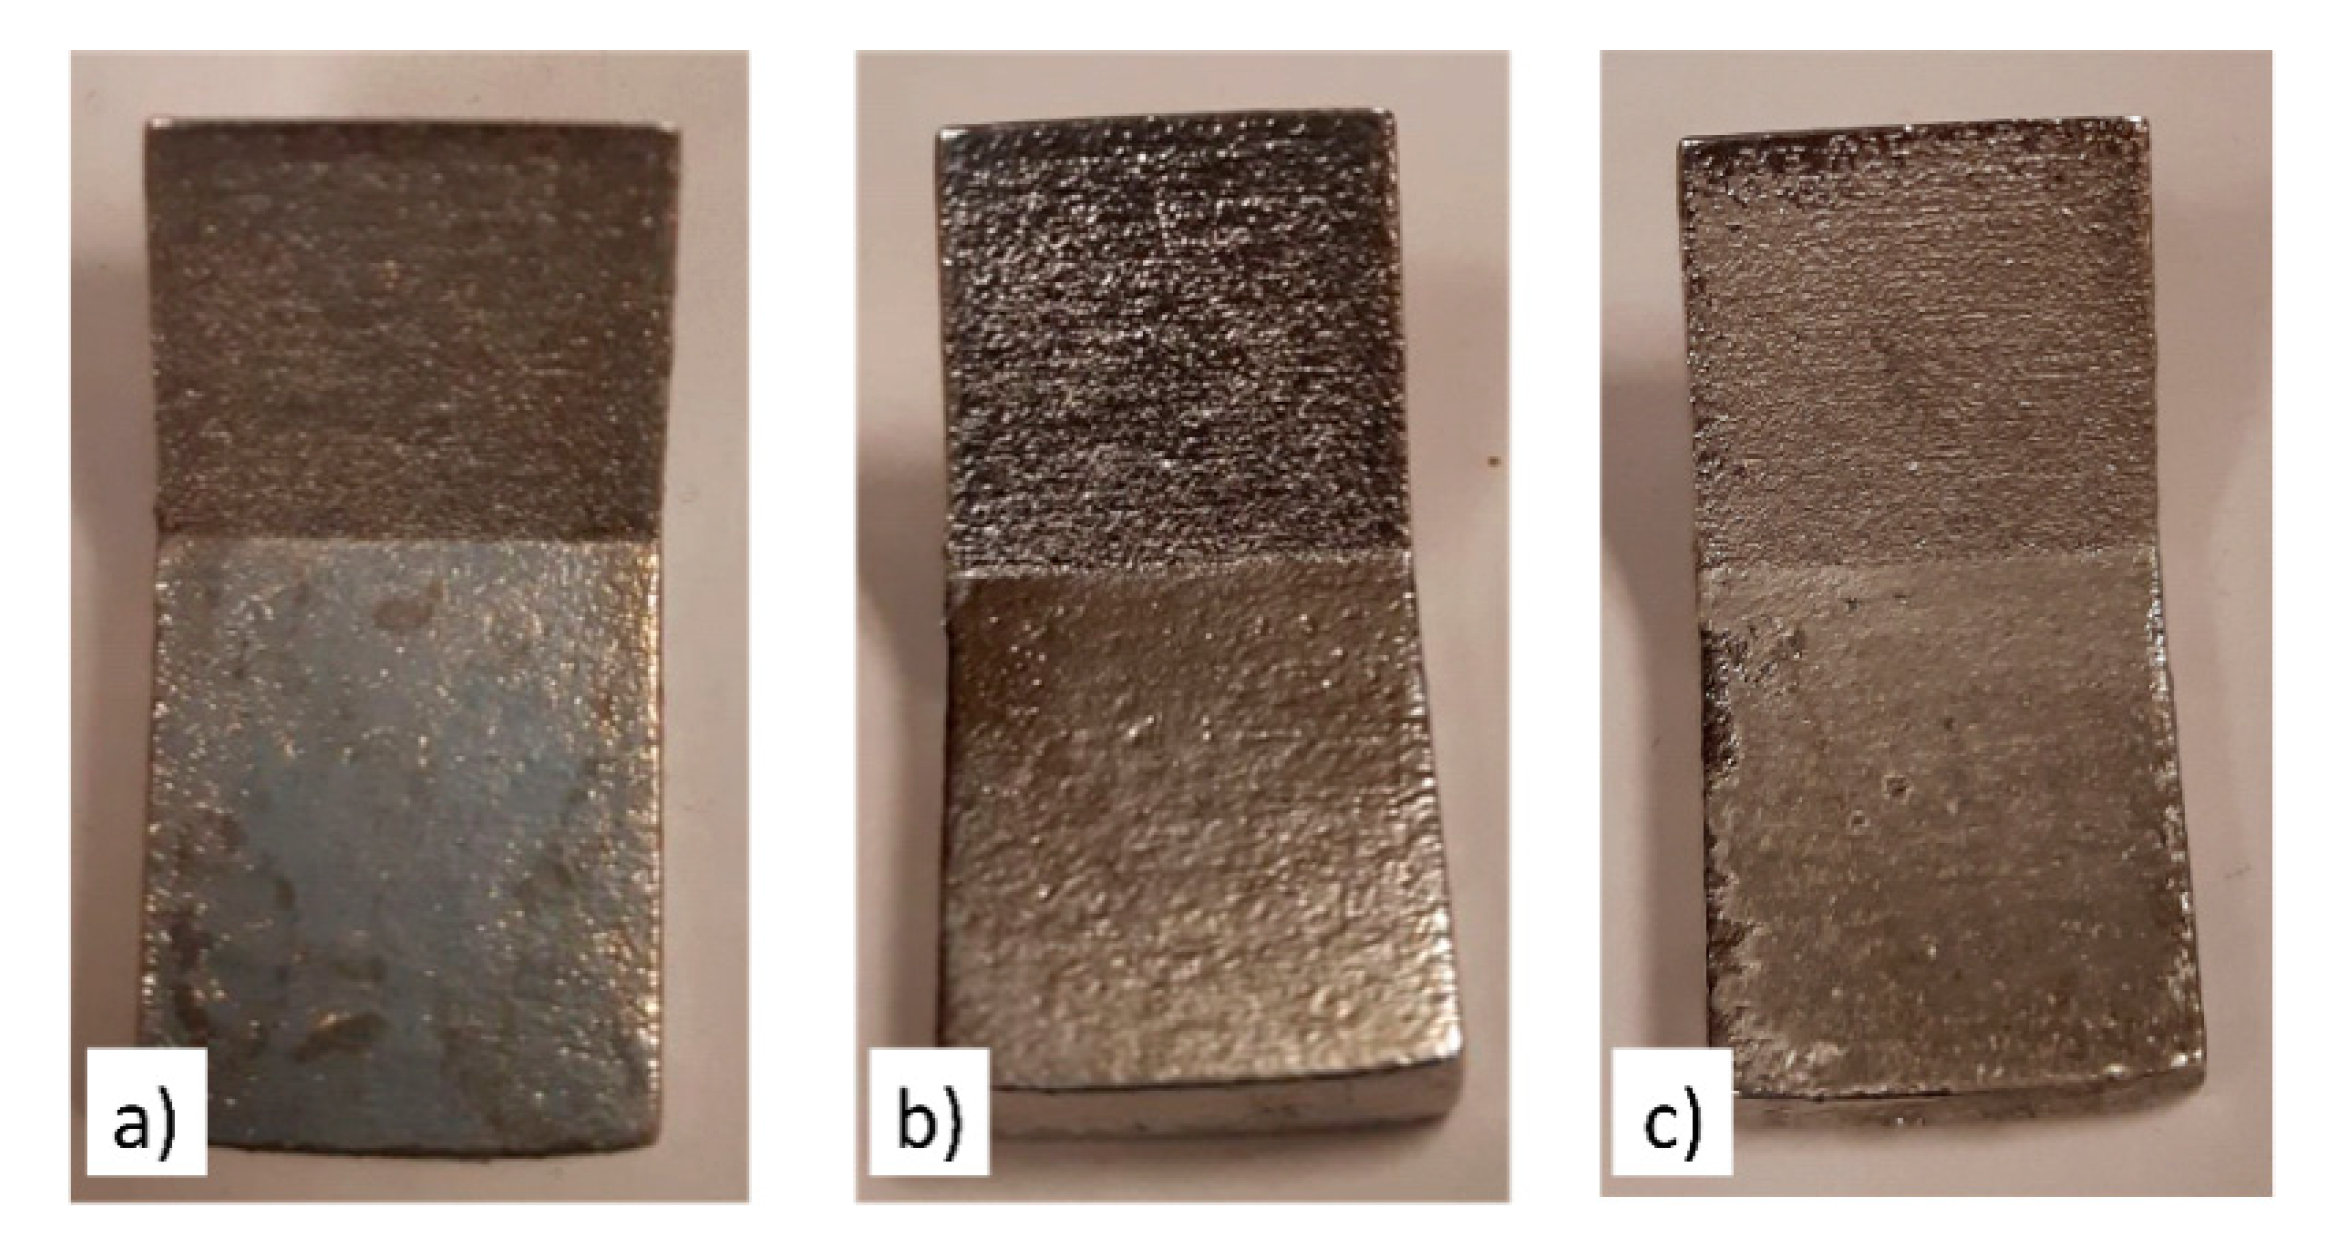
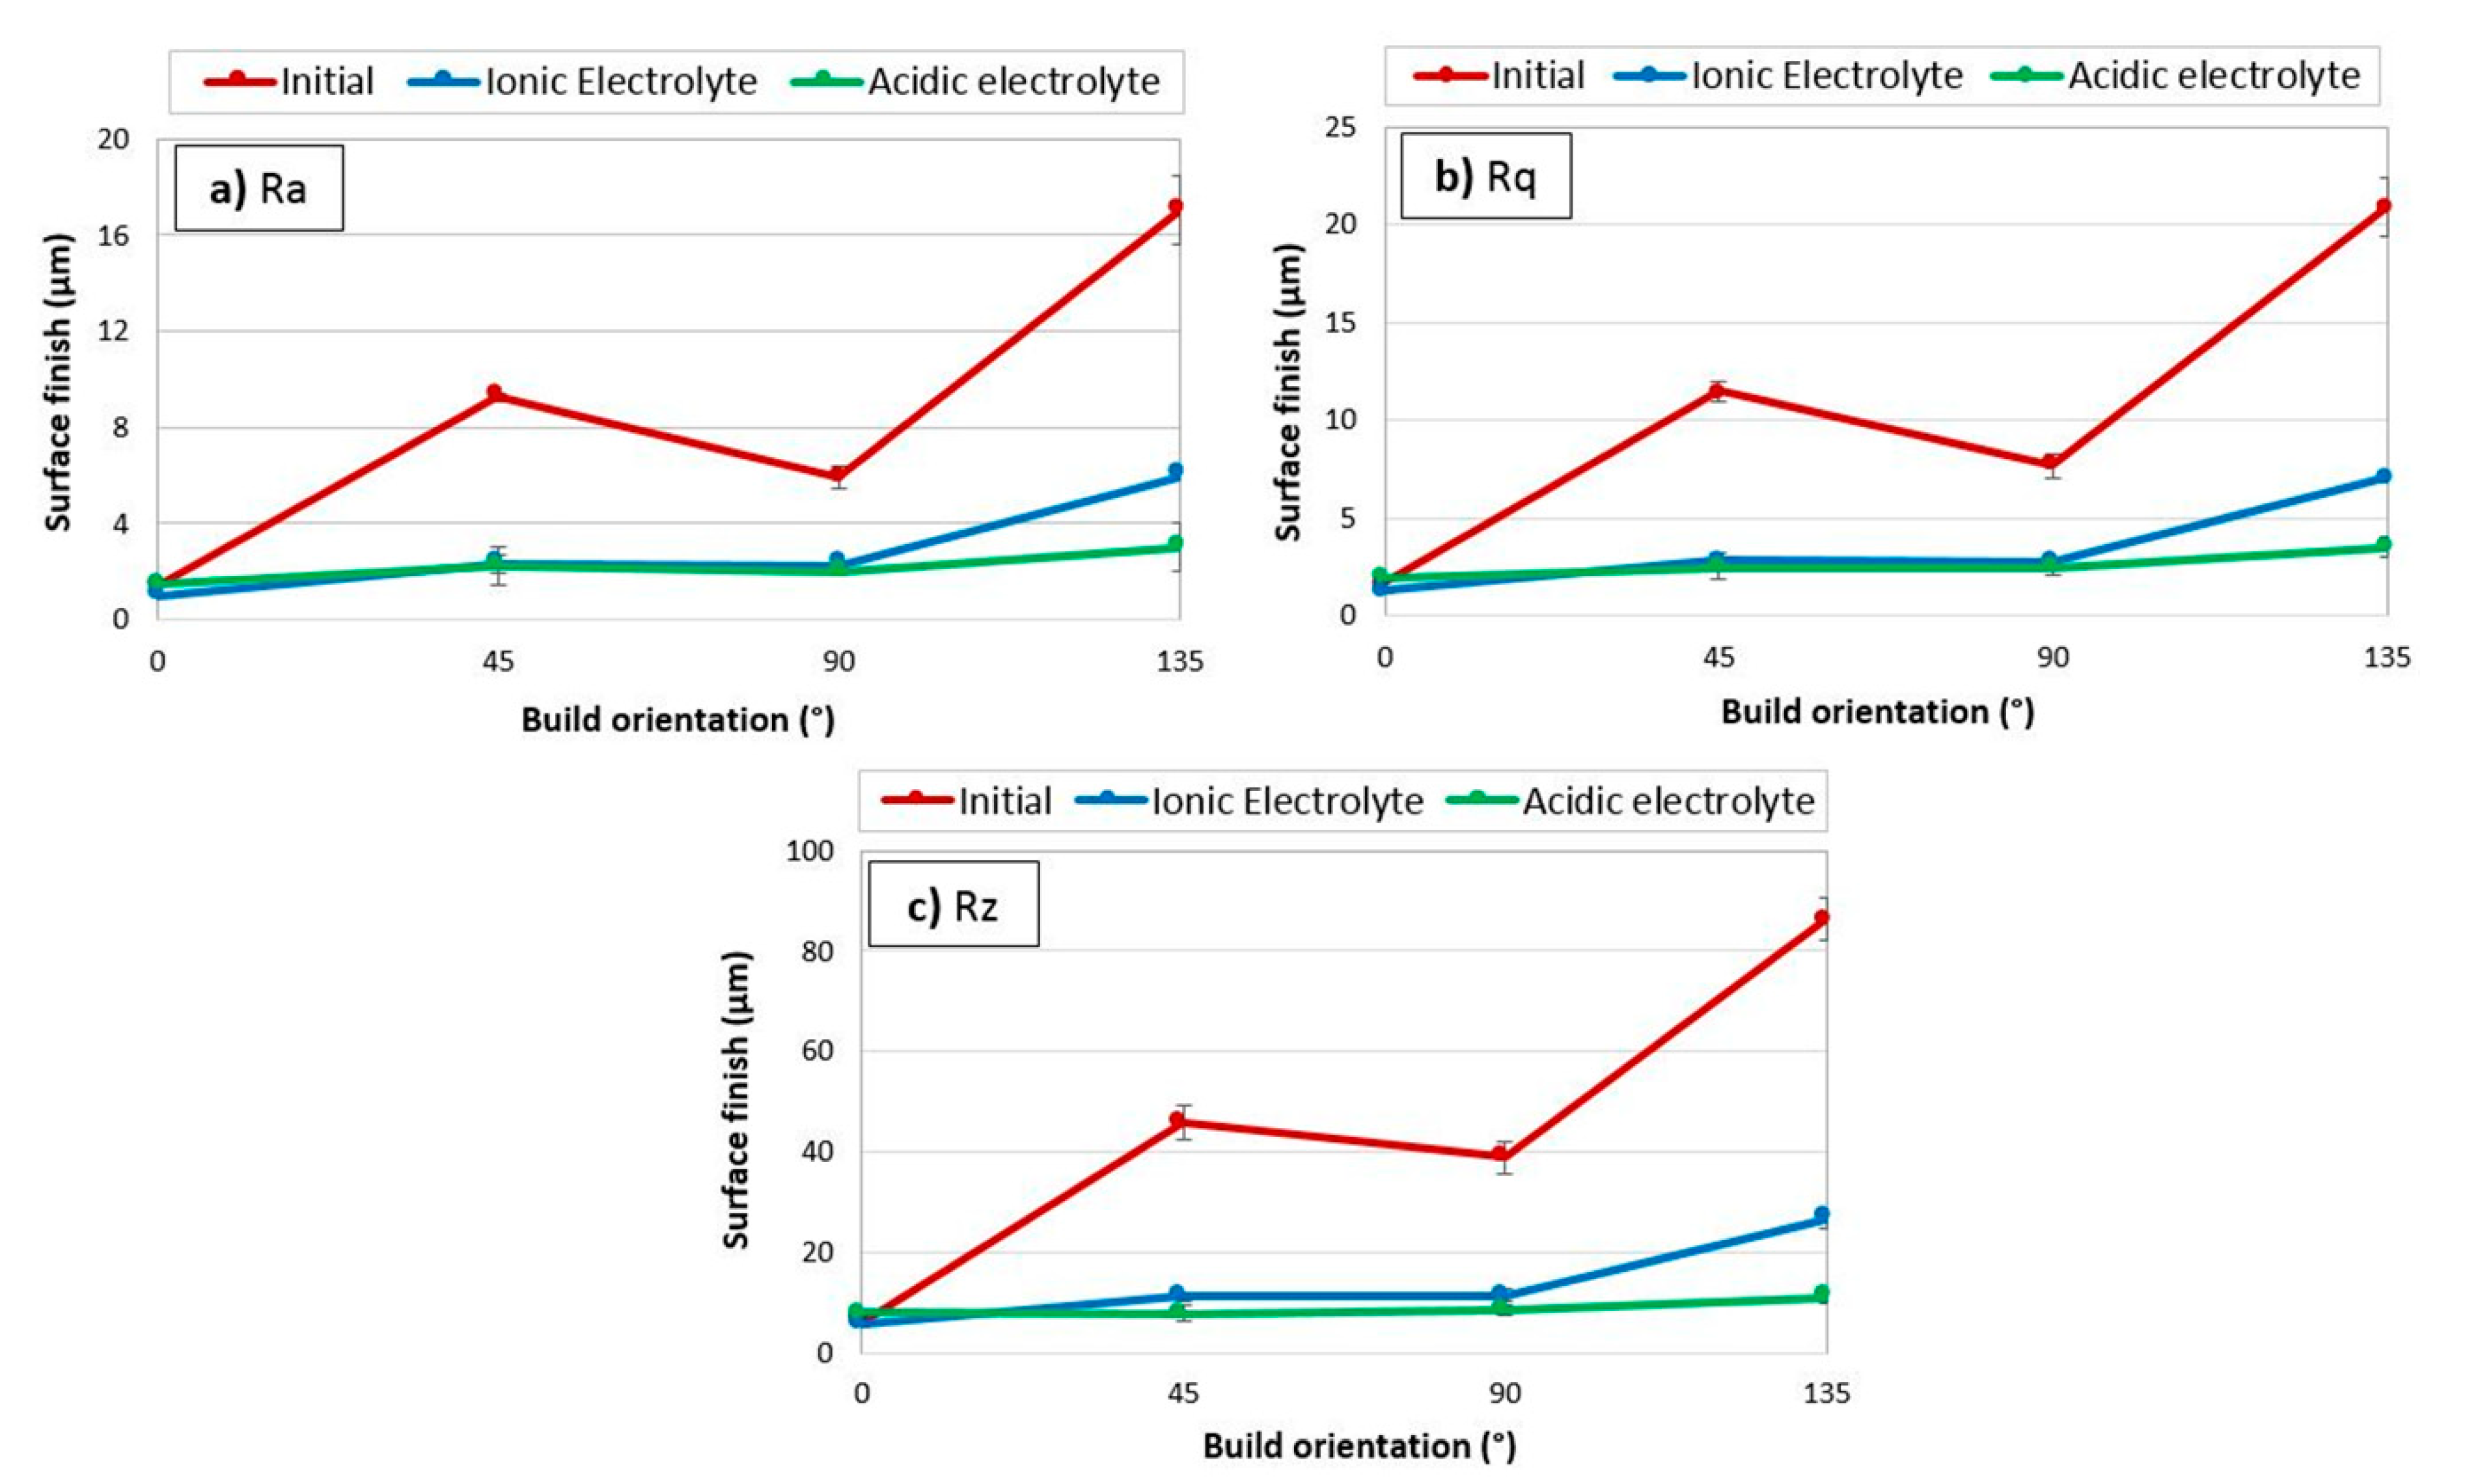
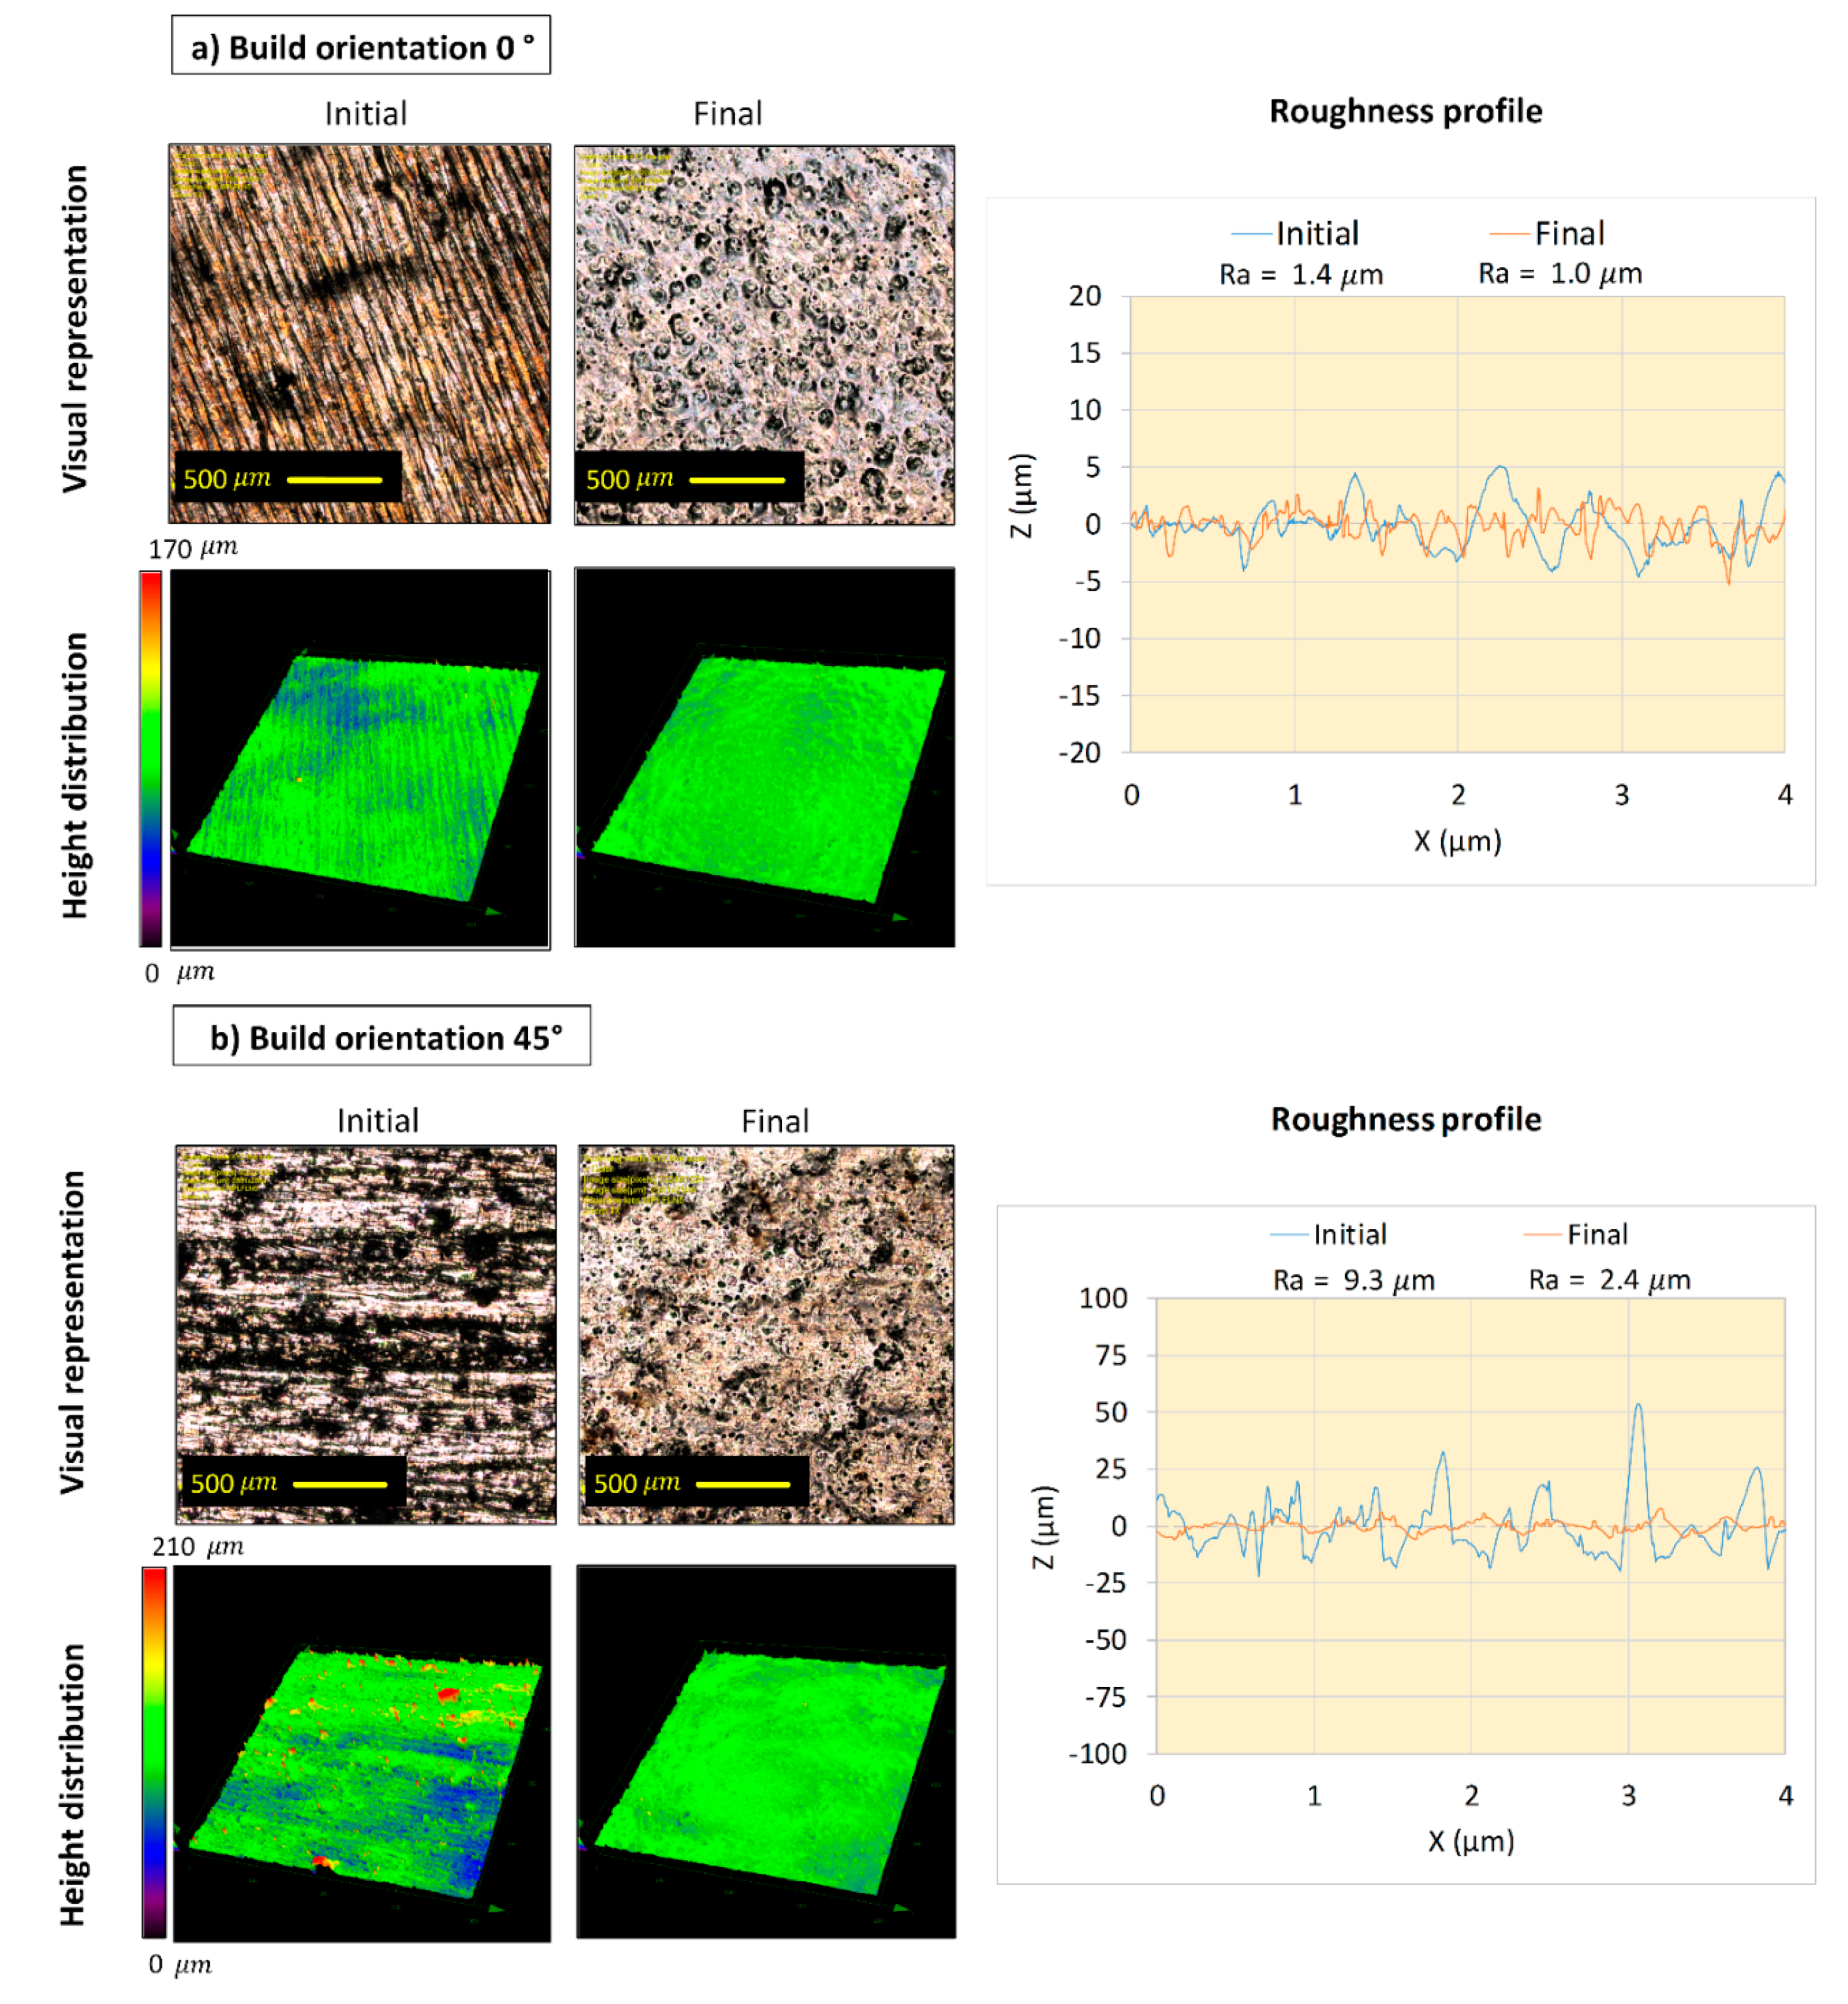
  • After 4 h of EP in both the ionic and acidic electrolytes, the Ra roughness on all surfaces reached Ra 6.3 µm (ISO N9 grade number for roughness). By comparing the ionic and acidic electrolytes, after 4 h of EP, the same surface roughness reductions of 75% and 65% were obtained for the 45°- and 90°-oriented surfaces, respectively. While the ionic liquid showed a 30% roughness reduction with some pitting on the surface for the 0°-oriented surface, the acidic electrolyte had an unstable roughness evolution profile over time on this surface.
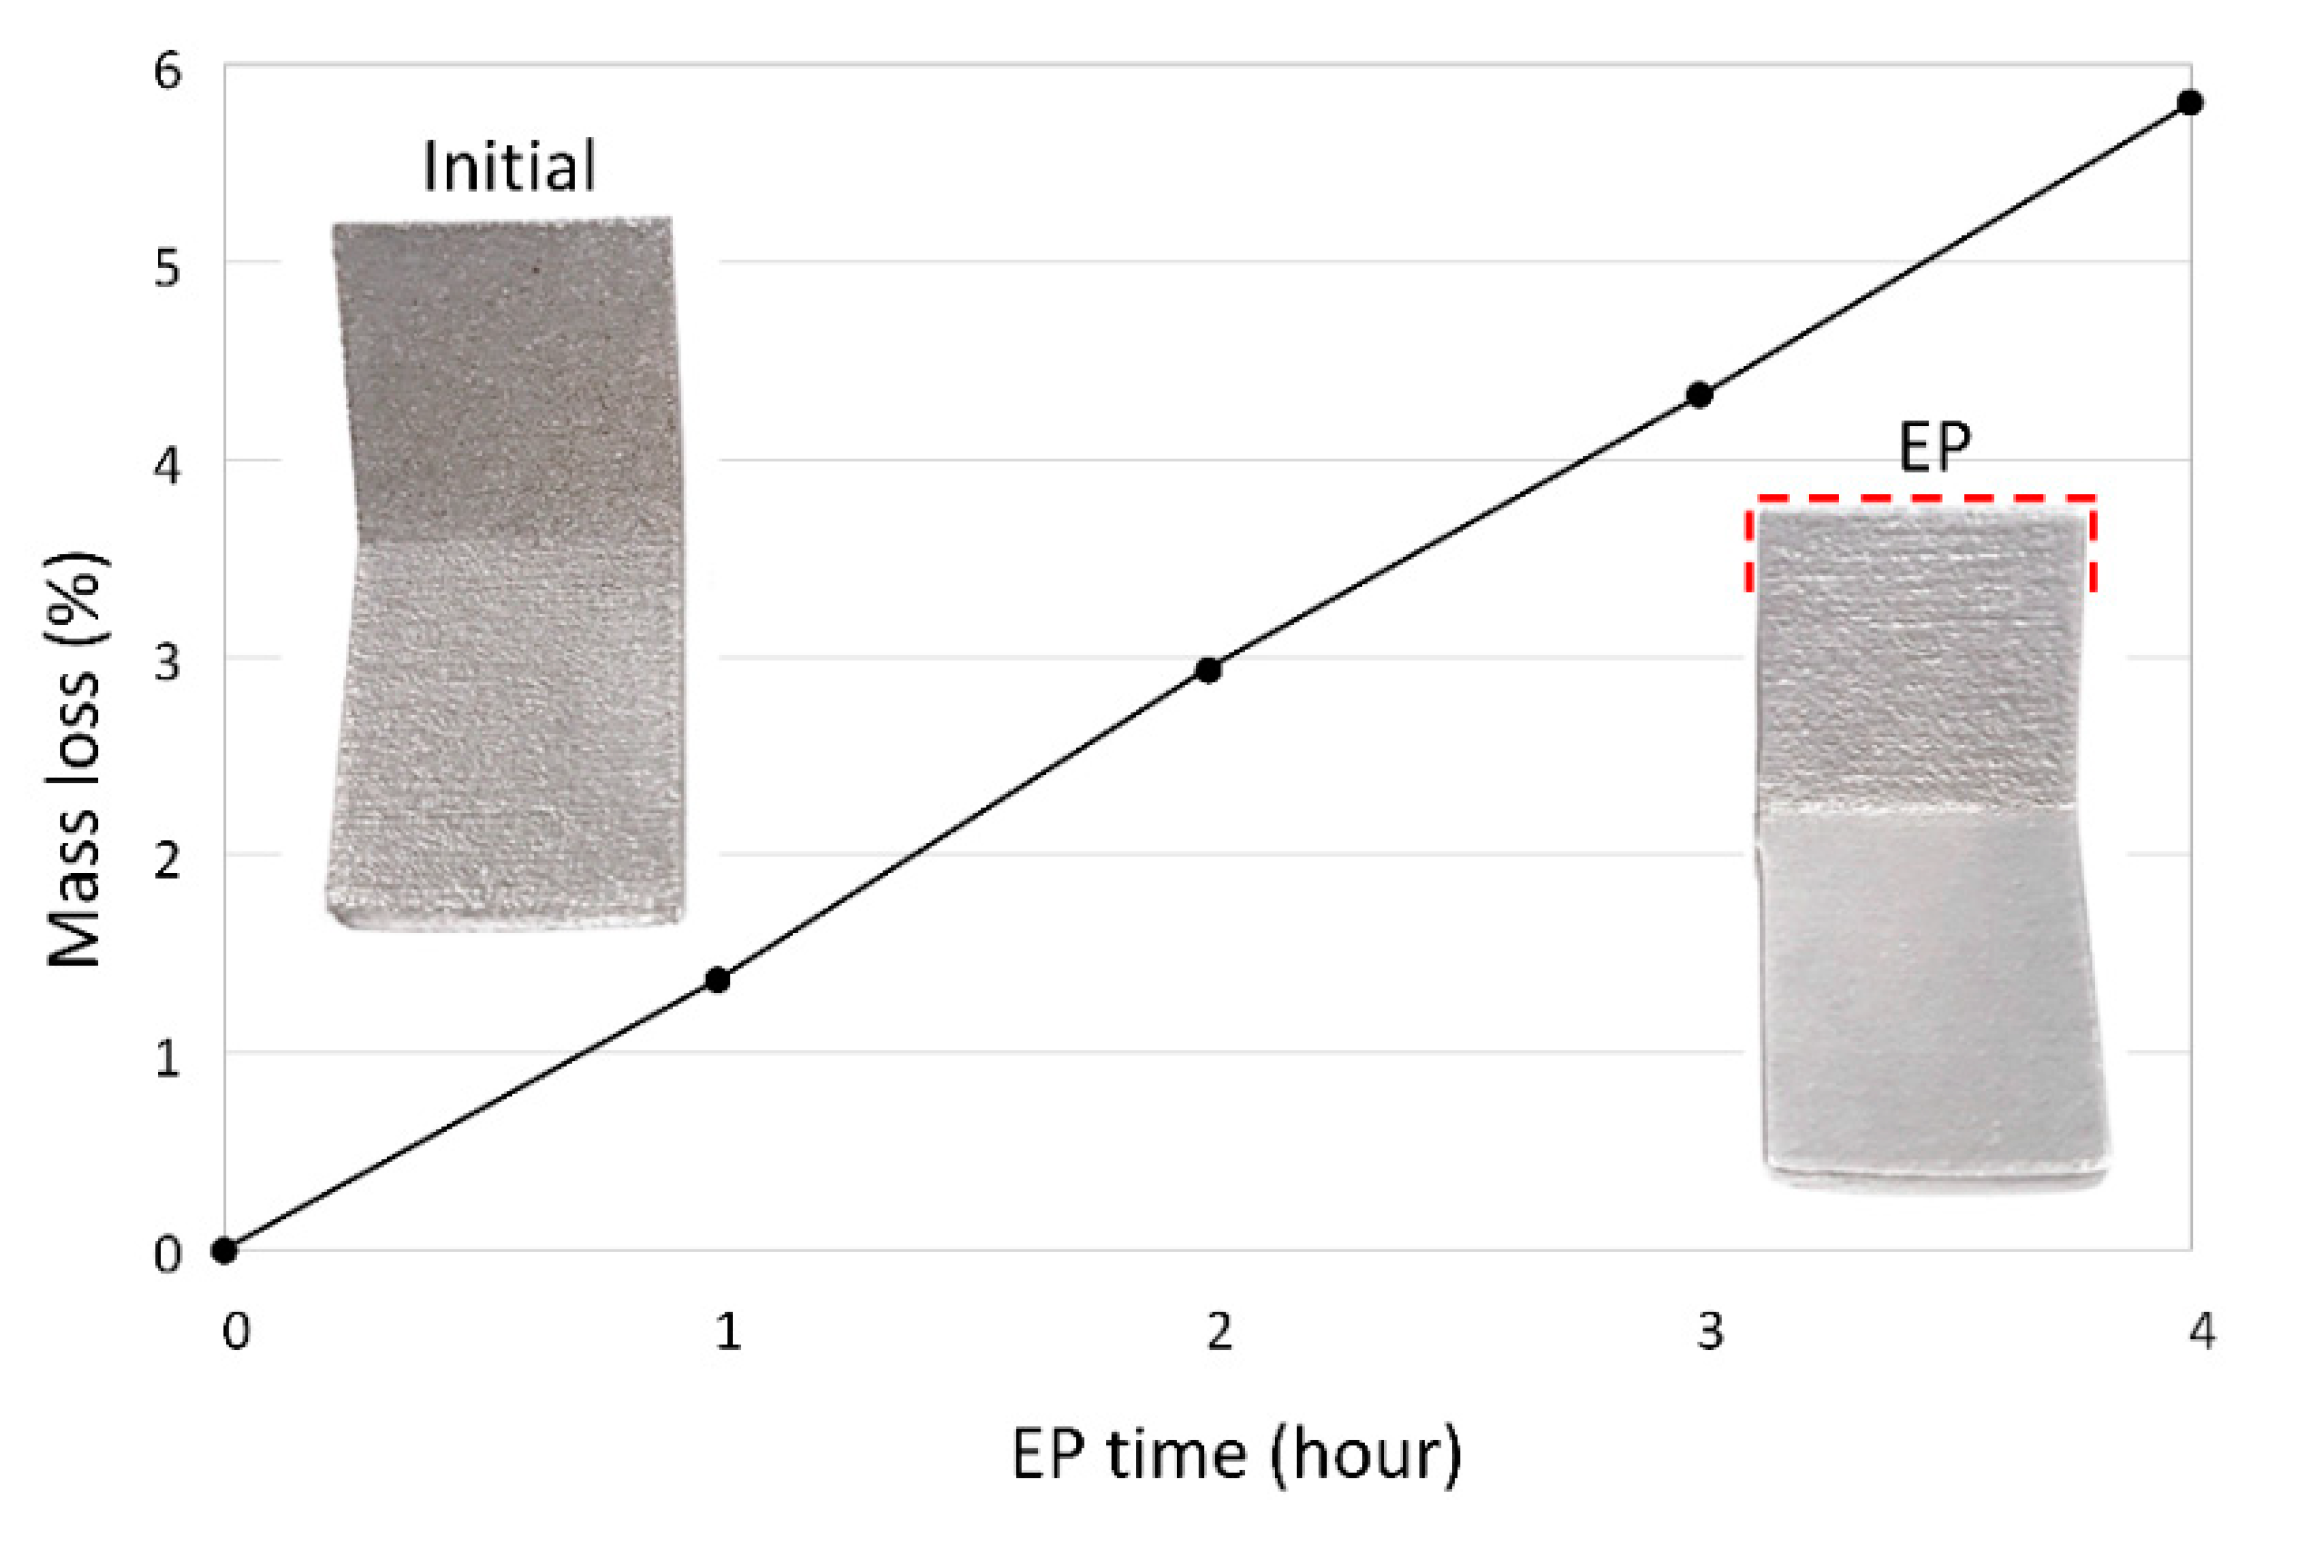
  • EP of IN625 in the ionic electrolyte had a current efficiency of 90%, whereas this value was only 46% for the acidic electrolyte.
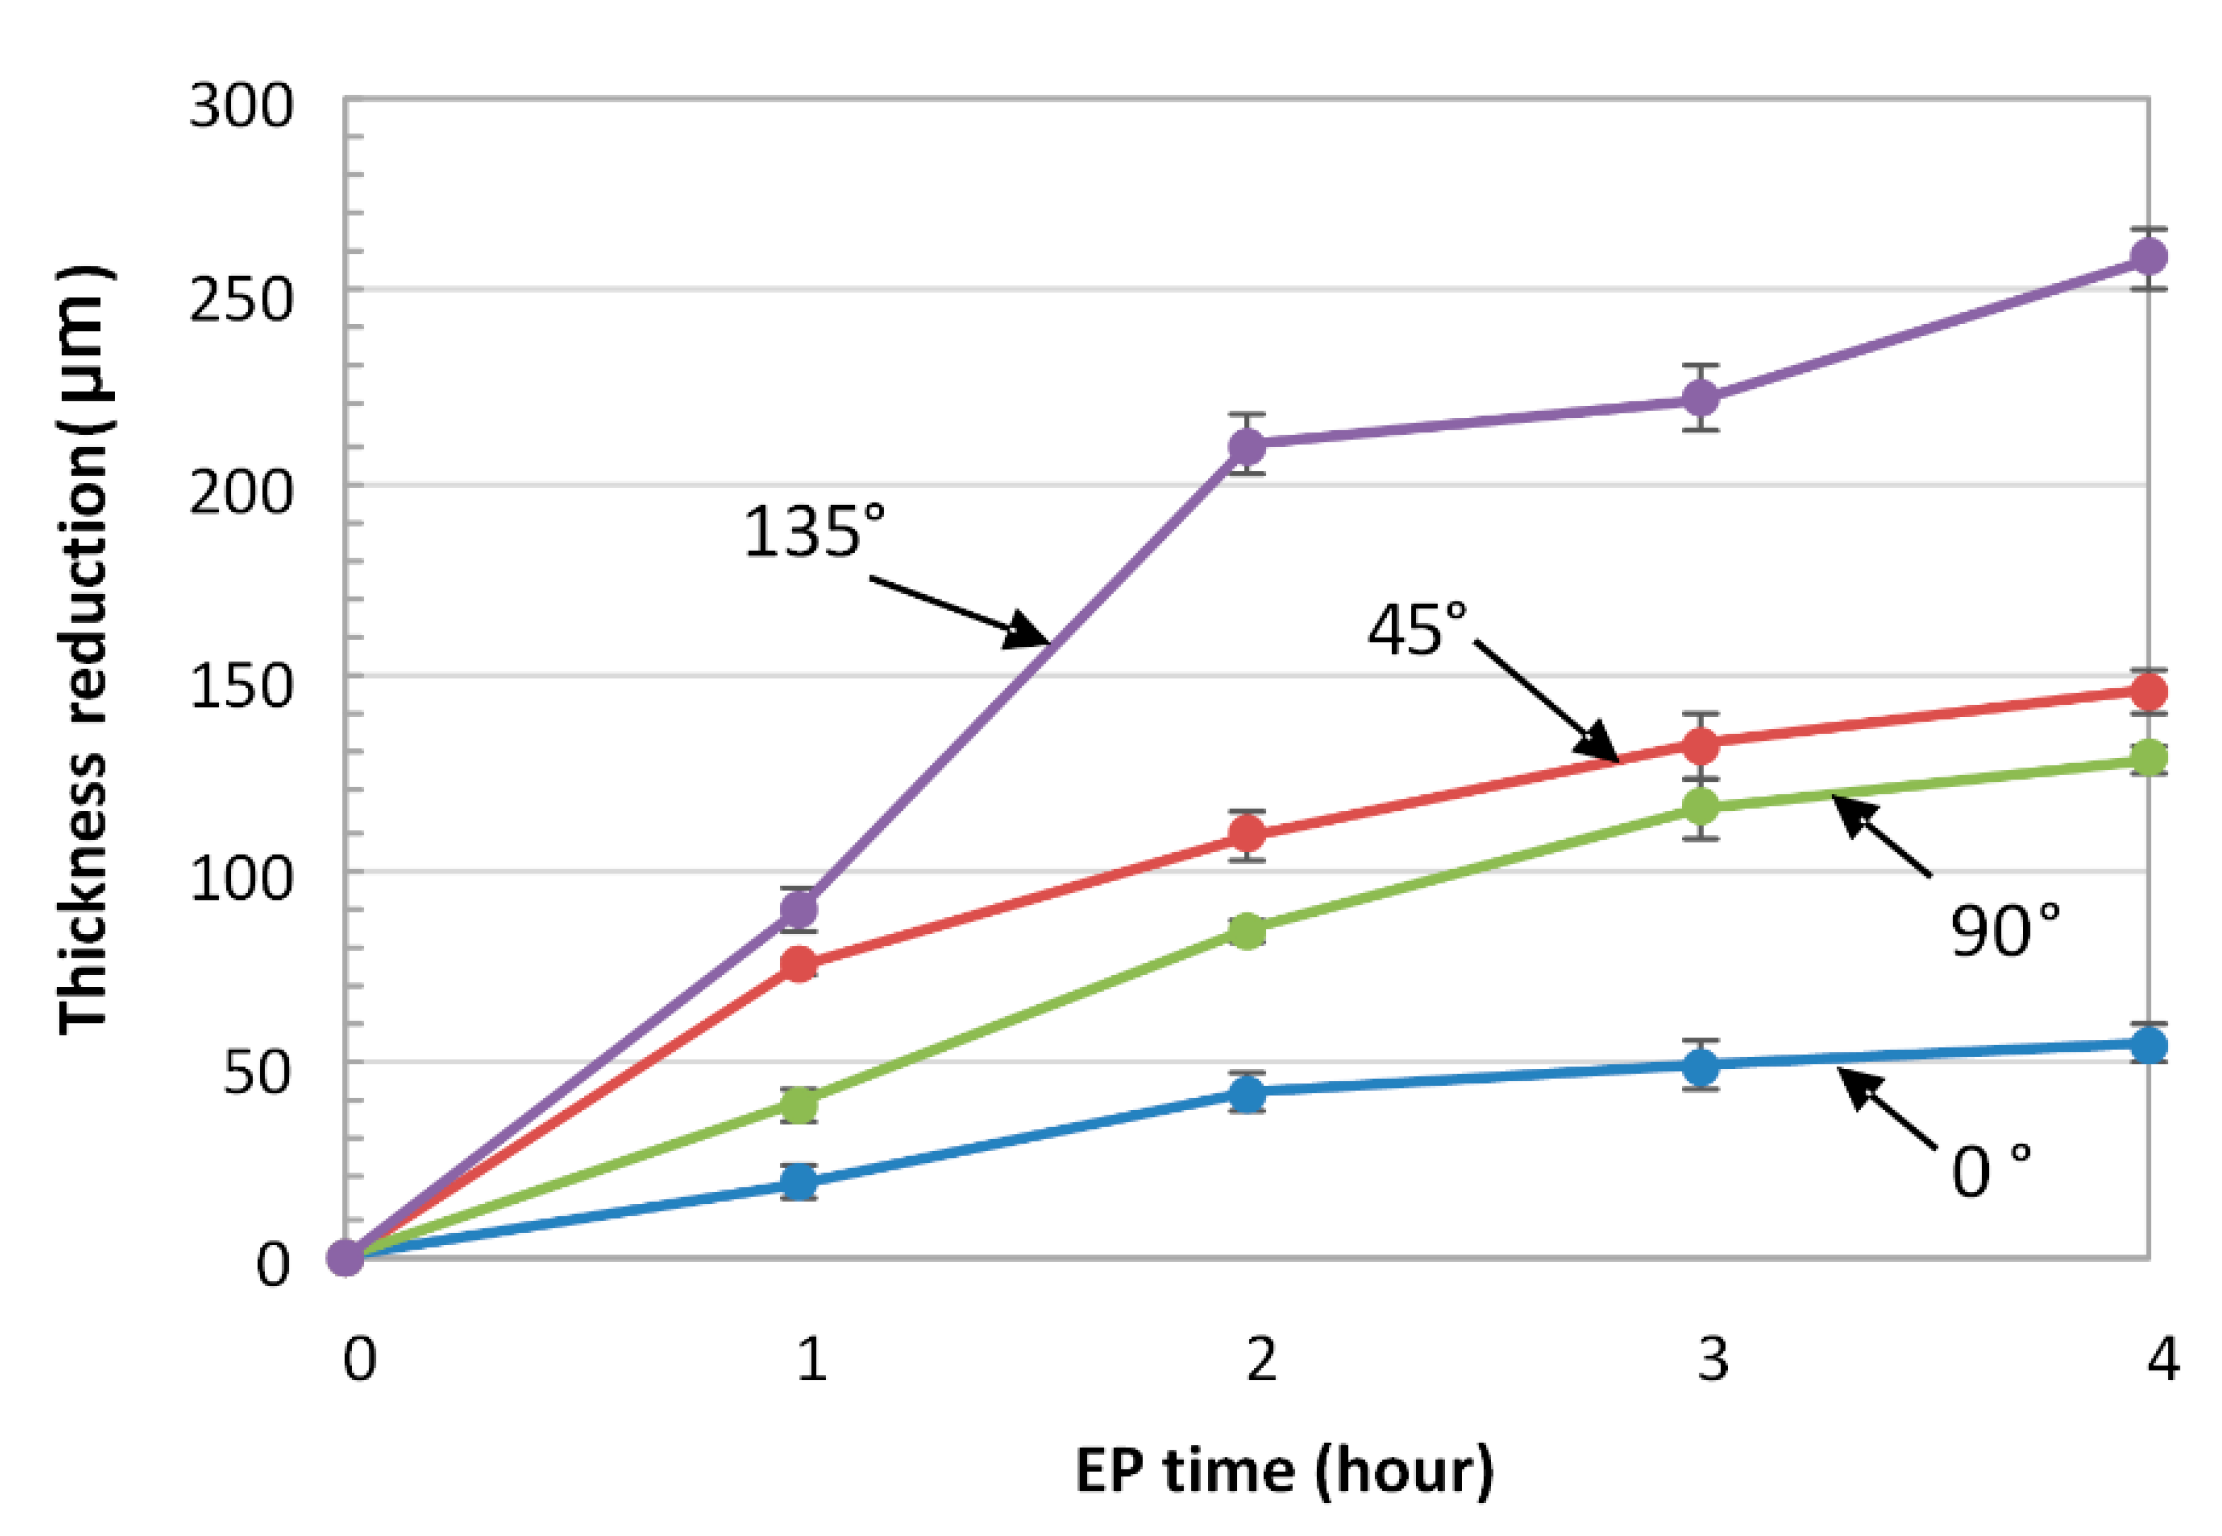
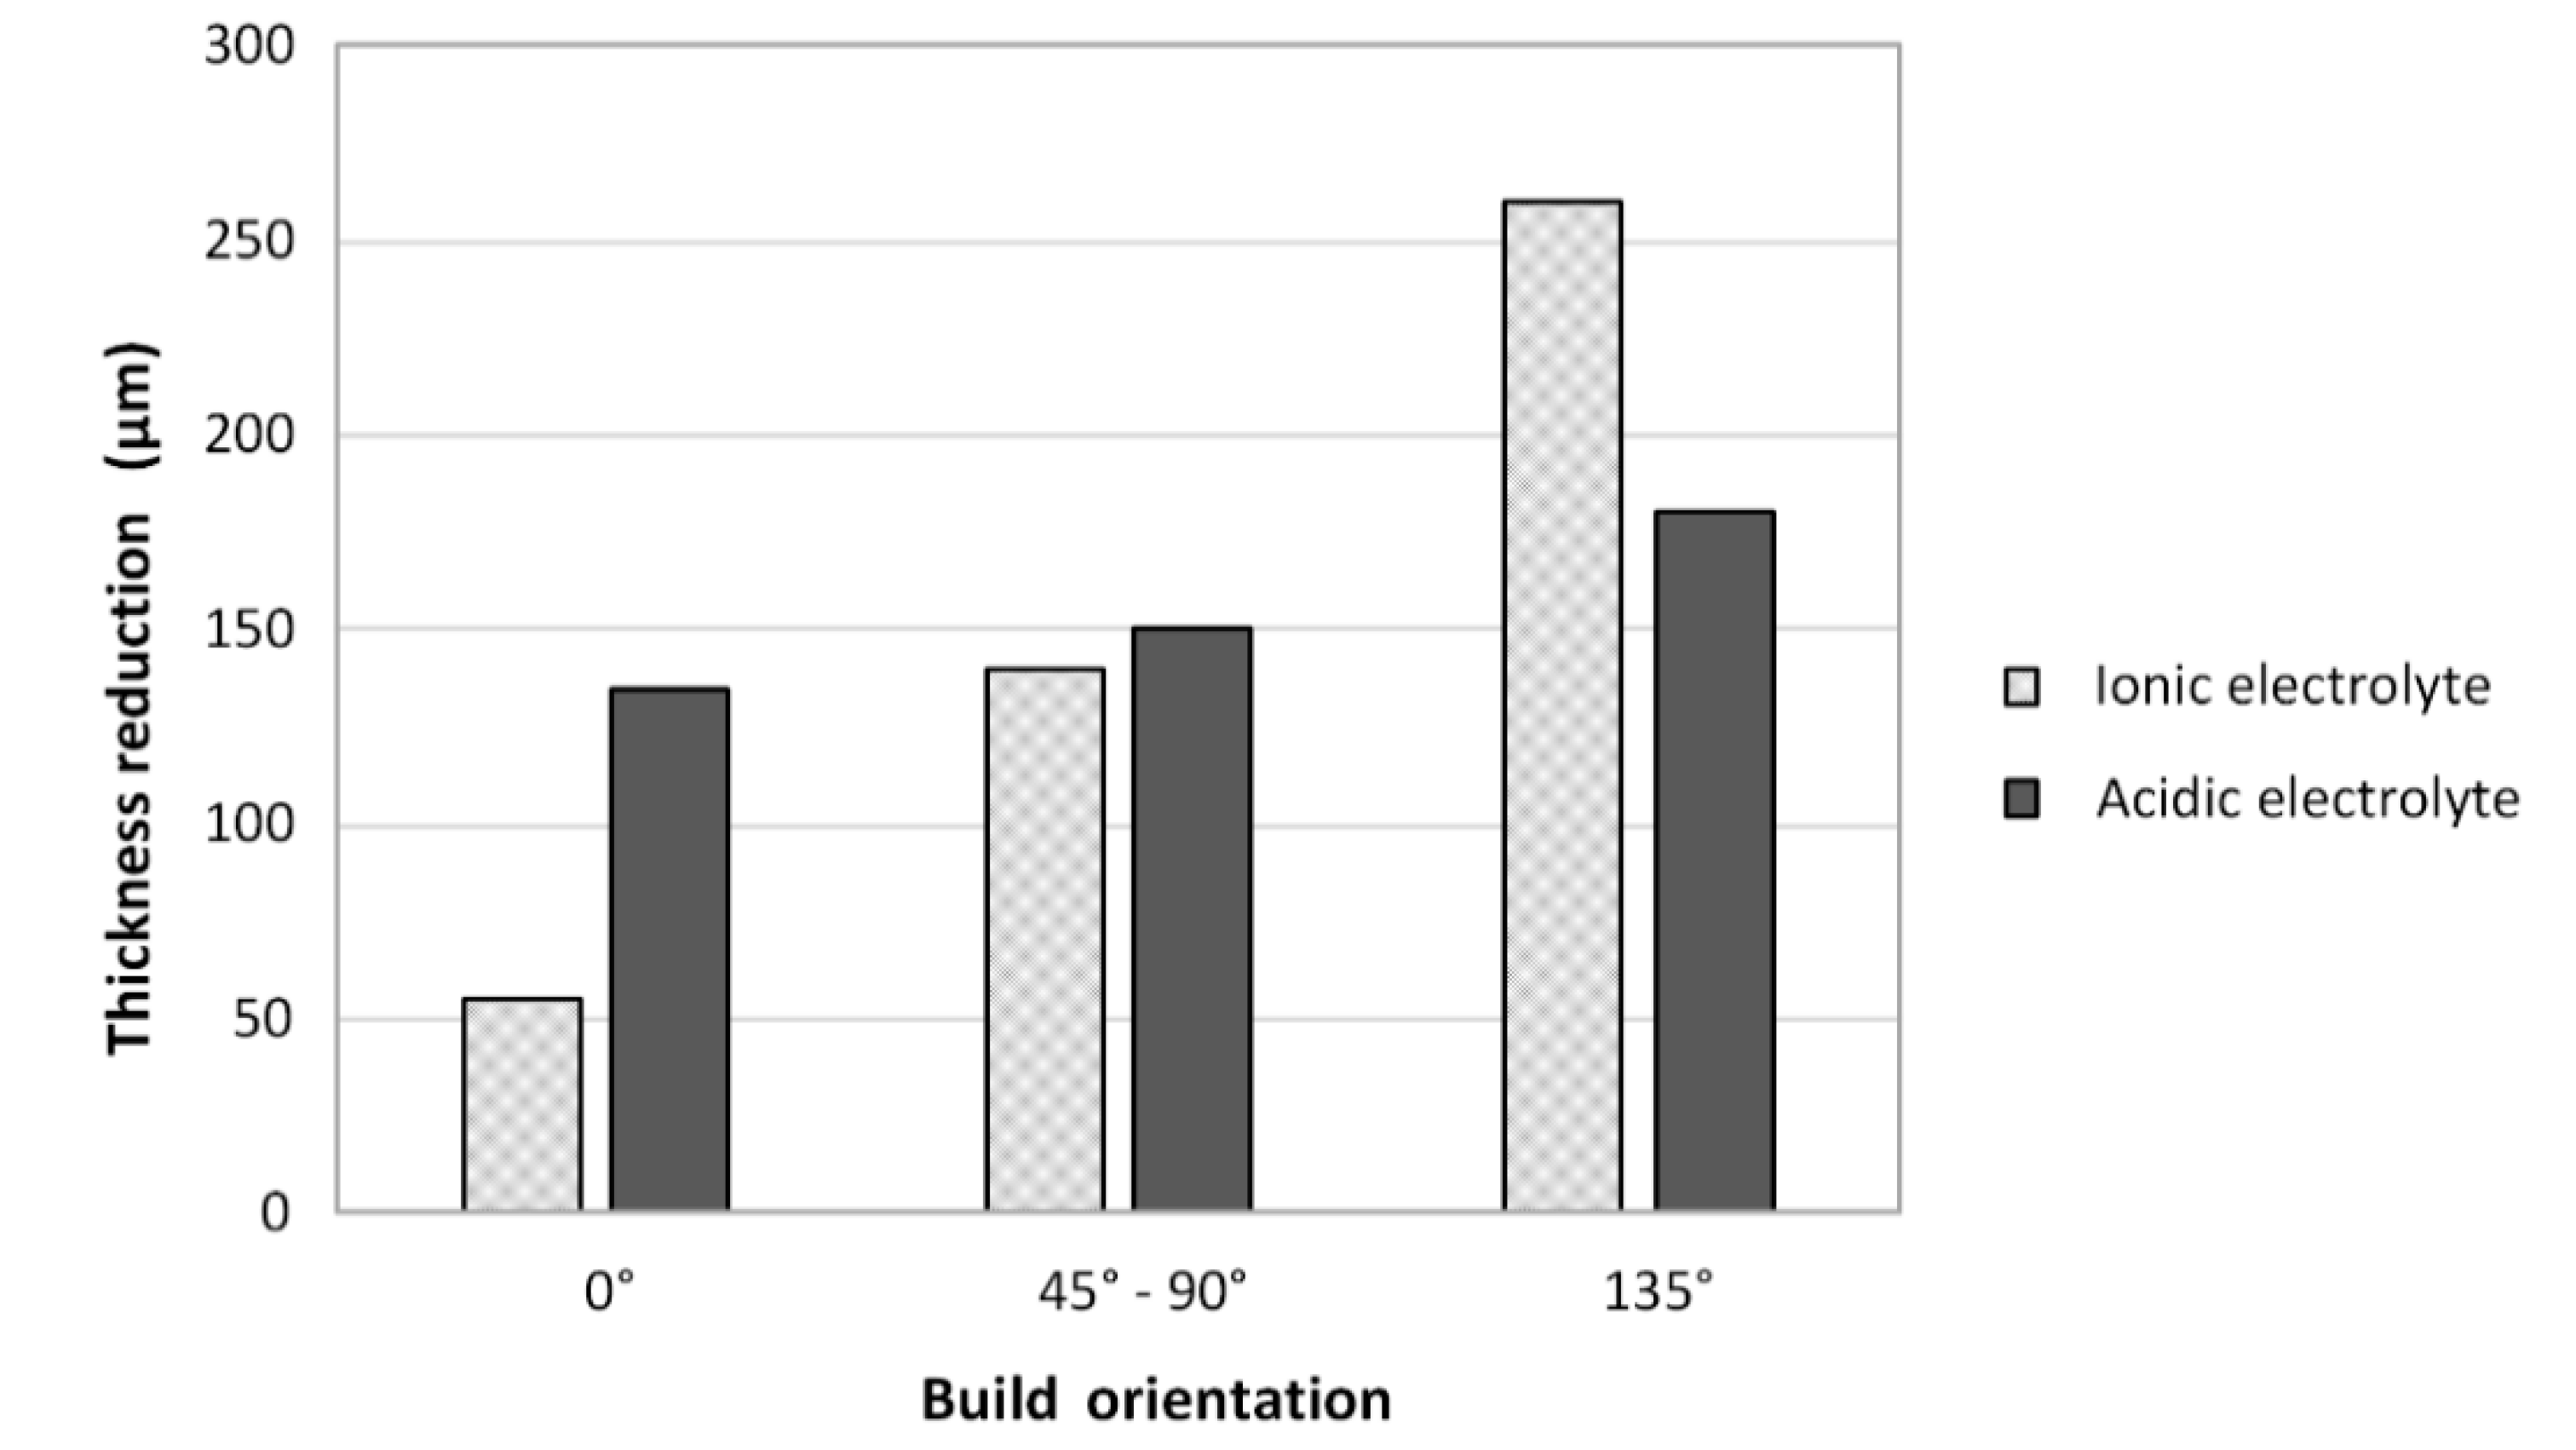
  • For the ionic electrolyte, the higher the initial surface roughness, the higher the thickness reduction during EP. The ionic electrolyte polishes the surface selectively, avoiding unnecessary material removal from the already smooth surfaces. In the acidic electrolyte however, the surface orientation, and thus the initial surface roughness, does not affect the amount of material dissolved during EP.
Although the ionic electrolyte manifests slightly lower performances than its acidic counterpart for EP of the roughest 135°-oriented surface, it represents more durable, less hazardous and greener solution for the polishing of LPBF parts. To deal with build orientation-dependent surface features of LPBF-processed parts, the results obtained could be improved further by combining electropolishing with other finishing techniques using fluid or gas media, such as chemical-mechanical polishing, abrasive flow machining or abrasive-jet polishing. Further improvements will be aimed at designing appropriate sequences of the polishing processes to obtain lower mass losses and higher roughness reduction rates as compared to their separate applications.

Author Contributions

The contributions of each author can be described as follows: Study design and conceptualization, N.M., S.T. and V.B.; study initiation, V.B.; methodology, investigation and data collection, N.M.; validation, N.M., S.T. and V.B.; analysis and interpretation of experimental data, N.M., S.T., V.B.; writing—original draft preparation, N.M.; writing—review and editing, S.T., V.B.; experiments supervision, S.T. and V.B.

Funding

This research has been supported by funds of NSERC (Natural Sciences and Engineering Research Council) of Canada) and CRIAQ (Consortium de Recherche et d’Innovation en Aérospatiale du Québec (MANU1625)).

Acknowledgments

The authors would like to express their gratitude to NSERC and CRIAQ (MANU1625) for their financial support. Our industrial partners (Pratt and Whitney Canada, Fusia, Thermetco and FZ Engineering) are gratefully acknowledged for their financial support and fruitful discussions.

Conflicts of Interest

The authors declare no conflict of interest.

References

  1. ASM. Chemical and Electrolytic Polishing—Metallography and Microstructures—Vol. 9: ASM Handbook; Vander, V., George, F., Eds.; ASM Intermnational: Novelty, OH, USA, 2004; pp. 281–293. ISBN 978-0-87170-706-2. [Google Scholar]
  2. Huang, C.A.; Chen, Y.C.; Chang, J.H. The Electrochemical Polishing Behavior of the Inconel 718 Alloy in Perchloric–Acetic Mixed Acids. Corros. Sci. 2008, 50, 480–489. [Google Scholar] [CrossRef]
  3. Urlea, V.; Brailovski, V. Electropolishing and Electropolishing-Related Allowances for In625 Alloy Components Fabricated by Laser Powder-Bed Fusion. Int. J. Adv. Manuf. Technol. 2017, 92, 4487–4499. [Google Scholar] [CrossRef]
  4. Abbott, A.P.; Capper, G.; Swain, B.G.; Wheeler, D.A. Electropolishing of Stainless Steel in an Ionic Liquid. Trans. IMF 2005, 83, 51–53. [Google Scholar] [CrossRef]
  5. Zhao, Y.; VanderNoot, T.J. Electrodeposition of Aluminium from Room Temperature Alcl3-Tmpac Molten Salts. Electrochim. Acta 1997, 42, 1639–1643. [Google Scholar] [CrossRef]
  6. Lebedeva, O.; Jungurova, G.; Kultin, D.; Kustov, L.; Zakharov, A.; Kalmikov, K.; Chernikovab, E.; Krasovskiyb, V. Ionic Liquids Based on the Imidazolium Cation in Platinum and Titanium Electropolishing. Green Chemistr. 2011, 13, 1004–1008. [Google Scholar] [CrossRef]
  7. Mallakpour, S.; Dinari, M. Ionic Liquids as Green Solvents: Progress and Prospects; Mohammad, A., Inamuddin, Eds.; Springer: Dordrecht, The Netherlands, 2012; pp. 1–32. ISBN 978-94-007-2890-5. [Google Scholar]
  8. Eozénou, F.; Antoine, C.; Aspart, A.; Berry, S.; Denis, J.F.; Brahim, M. Efficiency of Electropolishing Vs Bath Composition and Aging: First Results. In Proceedings of the CARE Conference-05-025-SRF, Contribution to the SRF, Ithaca, NY, USA, 10–15 July 2017. [Google Scholar]
  9. Abbott, A.P.; Capper, G.; McKenzie, K.J.; Ryder, K.S. Voltammetric and Impedance Studies of the Electropolishing of Type 316 Stainless Steel in a Choline Chloride Based Ionic Liquid. Electrochim. Acta 2006, 51, 4420–4425. [Google Scholar] [CrossRef]
  10. Hryniewicz, T. Electropolishing Processes for Better Implants’ Performance. Biomed. J. Sci. Tech. Res. 2018, 5, 1–5. [Google Scholar] [CrossRef]
  11. Rokosz, K. High-Current-Density Electropolishing (HDEP) of AISI 316L (EN 1.4404) Stainless Steel. Teh. Vjesn. 2015, 22, 415–424. [Google Scholar] [CrossRef]
  12. Rokosz, K.; Hryniewicz, T.; Raaen, S.; Chapon, P.; Prima, F. Development of Copper-Enriched Porous Coatings on Ternary Ti-Nb-Zr Alloy by Plasma Electrolytic Oxidation. Int. J. Adv. Manuf. Tech. 2017, 89, 2953–2965. [Google Scholar] [CrossRef]
  13. Hryniewicz, T.; Rokicki, R.; Rokosz, K. Magnetoelectropolishing for Metal Surface Modification. Trans. IMF 2007, 85, 325–332. [Google Scholar] [CrossRef]
  14. Rotty, C.; Doche, M.L.; Mandroyan, A.; Hihn, J.Y. Electropolishing Behavior of Additive Layer Manufacturing 316l Stainless Steel in Deep Eutectic Solvents. ECS Trans. 2017, 77, 1199–1207. [Google Scholar] [CrossRef]
  15. Abbott, A.P.; Ryder, K.S.; König, U. Electrofinishing of Metals Using Eutectic Based Ionic Liquids. Trans. IMF 2008, 86, 196–204. [Google Scholar] [CrossRef]
  16. Urlea, V.; Brailovski, V. Electropolishing and Electropolishing-Related Allowances for Powder Bed Selectively Laser-Melted Ti-6Al-4V Alloy Components. J. Mater. Process. Technol. 2017, 242, 1–11. [Google Scholar] [CrossRef]
  17. Lee, E.S. Machining Characteristics of the Electropolishing of Stainless Steel (STS316L). Int. J. Adv. Manuf. Technol. 2000, 16, 591–599. [Google Scholar] [CrossRef]
  18. Chandra, A.; Sumption, M.; Frankel, G.S. On the Mechanism of Niobium Electropolishing. J. Electrochem. Soc. 2012, 159, C485–C491. [Google Scholar] [CrossRef]
  19. Yang, G.; Wang, B.; Tawfiq, K.; Wei, H.; Zhou, S.; Chen, G. Electropolishing of Surfaces: Theory and Applications. Surf. Eng. 2017, 33, 149–166. [Google Scholar] [CrossRef]
  20. Frankel, G. MSE 735 Kinetics II; Fontana Corrosion Center: Columbus, OH, USA, 2010. [Google Scholar]
  21. Leszek, Z.; Kurowska, E.; Sulka, G.D.; Senyk, I.; Jaskula, M. The Effect of Anode Surface Area on Nanoporous Oxide Formation During Anodizing of Low Purity Aluminum (Aa1050 Alloy). J. Solid State Electrochem. 2014, 18, 361–368. [Google Scholar] [CrossRef]
  22. Wu, A.T.; Mammosser, J.; Phillips, L.; Delayen, J.; Reece, C.; Wilkerson, A.; Smith, D.; Ike, R. Smooth Nb Surfaces Fabricated by Buffered Electropolishing. Appl. Surf. Sci. 2007, 253, 3041–3052. [Google Scholar] [CrossRef]
  23. Alrbaey, K.; Wimpenny, D.I.; Al-Barzinjy, A.A.; Moroz, A. Electropolishing of Re-Melted Slm Stainless Steel 316l Parts Using Deep Eutectic Solvents: 3 × 3 Full Factorial Design. J. Mater. Eng. Perform. 2016, 25, 2836–2846. [Google Scholar] [CrossRef]
  24. Nandi, B.K.; Patel, S. Effects of Operational Parameters on the Removal of Brilliant Green Dye from Aqueous Solutions by Electrocoagulation. Arab. J. Chem. 2017, 10, S2961–S2968. [Google Scholar] [CrossRef]
  25. Yun, J.Y.; Park, D.; Wang, J.P. A Study on the Oxidation Behavior of Nickel Alloys at Elevated Temperatures. In IOP Conference Series: Materials Science and Engineering, Proceedings of the 2nd International Conference on Mining, Material and Metallurgical Engineering, Bangkok, Thailand, 17–19 March 2017; IOP Publishing: Bristol, UK, 2017; Volume 191, p. 012039. [Google Scholar] [CrossRef]
  26. Yang, L.; O’Neil, C.; Wu, Y. The Use of Electropolishing Surface Treatment on In718 Parts Fabricated by Laser Powder Bed Fusion Process. In Proceedings of the Solid Freeform Fabrication 2017: Proceedings of the 28th Annual International, Austin, TX, USA, 7–9 August 2017. [Google Scholar]
  27. Tachikawa, N.; Park, J.; Yoshida, K.; Tamura, T.; Dokko, K.; Watanabe, M. Limiting Current Density in Ionic Liquid Electrolyte for Lithium Batteries. Electroch 2010, 5, 349–352. [Google Scholar] [CrossRef]
  28. Khorsand, S.; Sheikhi, A.; Raeissi, K.; Golozar, M. Hot Corrosion Behavior of Inconel 625 Superalloy in Eutectic Molten Nitrate Salts. Oxid. Met. 2018, 90, 169–186. [Google Scholar] [CrossRef]
Figure 1. (a) Electrodes arrangement (bottom view), (b) V-type cathode, (c) V-shaped anode (dimensions in mm), adapted from Reference [3].
Jmmp 03 00086 g001
Figure 2. Viscosity-temperature graph of the 1 choline chloride:2 ethylene glycol (1ChCl:2EG) ionic electrolyte.
Jmmp 03 00086 g002
Figure 3. Diagrams of the anodic current density as a function of applied potential at four EP operation temperatures. The dashed line represents the minimum required anodic current density for this study.
Jmmp 03 00086 g003
Figure 4. V-shaped samples polished at 40 °C: (a) Va < Vopt – purple-blue oxide layer on the surface, (b) Va = Vopt – mirror surface finish, (c) Va > Vopt – milky surface.
Jmmp 03 00086 g004
Figure 5. Topography characterization positioning for stylus measurements (black arrows), confocal microscope (orange rectangle), Coordinate Measuring Machine (CMM) (yellow rectangle). The surface build orientations (BO) are indicated in the side view of the V-shape specimen, dimensions are in mm.
Jmmp 03 00086 g005
Figure 6. (a) V-shaped sample installation for the CMM measurement, (b) V-shaped sample with a reference screw for the coordinate system in the PolyWorks software.
Jmmp 03 00086 g006
Figure 7. Ra roughness evolution as a function of time for four build orientations of 0, 45, 90 and 135°: (a) temperature 50 °C, applied potential 4 V, (b) temperature 40 °C, applied potential 5 V.
Jmmp 03 00086 g007
Figure 8. Surface finish parameters of (a) Ra, (b) Rq and (c) Rz as functions of the build orientations are shown for initial surface roughness (in red) and after 4 h of EP in ionic (in blue) and acidic (in green) electrolytes. The results of EP in an acidic solution are taken from the work of Urlea and Brailovski [3].
Jmmp 03 00086 g008
Figure 9. Visual representation, height distribution and roughness profile are shown for (a) 0°, (b) 45°, (c) 90°, and (d) 135° build orientations before and after 4 h EP (40 °C, 5 V). The surface topography images were taken by Confocal microscope on 2500 × 2500 µm2 at 5× magnification. Roughness profiles, obtained by stylus profilometry, are shown for linear measurements on each build orientation, as illustrated in Figure 5.
Jmmp 03 00086 g009aJmmp 03 00086 g009b
Figure 10. Mass loss as a function of time (40 °C, 5 V). Left insert: specimen before EP, Right insert: specimen after 4 h of EP, where a red dashed line illustrates the absence of the edge rounding effect.
Jmmp 03 00086 g010
Figure 11. Thickness reduction as a function of EP time (40 °C, 5 V) for differently oriented surfaces.
Jmmp 03 00086 g011
Figure 12. Current density as a function of time for the ionic and acidic electrolytes, the latter is taken from [3].
Jmmp 03 00086 g012
Figure 13. Ra and thickness reduction (TR) evolutions as functions of build orientations and EP time.
Jmmp 03 00086 g013
Figure 14. Thickness reductions of the V-shaped sample in ionic and acidic electrolytes to reach Ra 6 µm, the results of EP in an acidic solution are taken from the work of Urlea and Brailovski [3].
Jmmp 03 00086 g014

