1. Introduction
Surface transformation hardening processes are designed to produce wear-, corrosion-, and fatigue-resistant surfaces with increased lifetime for various industrial applications by hardening the superficial critical areas using localized heat gains. Among these processes, laser surface transformation hardening process (LSTH) is considered as an interesting alternative process to the traditional methods due to several advantages such as high-power density, rapidity, flexibility, full process control, minimized total energy, reduced distortion, and reduced thermal affected zone.
LSTH of steels is a potentially promising industrial application considering the broad employment of steels in a variety of industries. Many different types of alloy steel mechanical components such as bearing, cams, gears, shafts, pistons, and rings, that need to have a very hard surface, can be hardened using LSTH [
1,
2,
3]. The ability to deliver a controlled rate of heat energy to the expected surface area of the part is one of the most significant advantages of using laser as a heating source. The absorbed energy is dependent on the absorptivity of the part surface, which depends on the wavelength of the laser beam. For steels, the absorptivity increases when the wavelength is short. The Nd:YAG laser system with short wavelength at 1064 nm is suggested for surface hardening of steel [
4]. In LSTH, the laser sources provide a controllable heat in the selected area to produce thin hardened surface layers. When a region of the part surface is exposed to the laser beam, the temperature increases rapidly, resulting in a thin layer converted into austenite, while the temperature of the rest of part remains unaffected. When the laser beam moves with respect to the part, the part areas in the beam track are rapidly heated and cooled because the self-quenching caused conduction into the relatively cool bulk of the material. In LSTH, the control of rapid heating and cooling is the basic ingredient to transform the austenite into hard martensite structure at the surface [
5,
6,
7,
8,
9,
10,
11].
To exploit appropriately the benefits presented by LSTH, it is necessary to develop a comprehensive strategy to control the heating process in order to produce the appropriate martensite structure, and then the desired hardened surface characteristics without being forced to use the traditional and fastidious trial and error procedures. In this process, the thermo-physical properties of the material and the heating system parameters have significant effects [
12]. To address this problem, several researchers proposed various experimental and modeling approaches as attempts to establish the relationships between laser processing parameters and hardness profile. In the majority of the proposed approaches, laser power, scanning speed, beam spot size, focal length, and rotation speed are considered as process parameters to evaluate hardness profile attributes, such as hardened depth, hardened width, or hardened area. In the LSTH process, the key objective is to achieve a hardened surface with minimum hardened depth and maximum hardened width. The traditional procedure used to select the appropriate combination of parameters to reach these objectives consists of setting the parameters by conducting a number of experiments by varying one parameter at a time in order to evaluate the parameter’s effects. As the process parameters are interrelated by nonlinear relationships, this procedure cannot lead to convincing results despite the prohibitive number of experiments, which leads to more time and costs. These problems can be avoided if appropriate prediction models are designed. These models can not only predict the most suitable process parameters for the desired hardness profiles but also help to a better understanding of their relative influence on the treated material properties.
Several modeling approaches to LSTH are available [
11,
12,
13,
14,
15,
16]. In LSTH, two modeling approaches can be proposed: Numerical modeling and empirical modeling. The first case refers essentially to the combination of material non-linear properties, laser sport form and motion and heat-flow equation solved using the finite element method (FEM) in order to define the temperature distribution during the heating process [
15,
16,
17]. The hardness is then approximated by the equations of Ashby and Easterling [
18]. The obtained model can be validated using experimental data and then used for simulation, prediction, and optimization. In the second case, data collected using a structured design of experiments are processed using analysis techniques such as analysis of variance, regression analysis and response surface methodology to establish the relationships between the process parameters and the hardness profile attributes [
19,
20]. Other modeling approaches use expert system [
21] and neural networks [
22,
23].
Interesting results are established using different modeling approaches on several types of materials and different part geometries. However, some laser surface hardening issues are far from complete and many research works are needed. When LSTH is applied to relatively complex surfaces, such as gears and spline shafts, particular attention must be focused on the desired hardness profile for different regions of the gear tooth. Indeed, gears are often surface hardened to increase their resistance to wear and fatigue. The thickness of the hardened layer must be deep enough to endure the maximum stress on the gear without affecting the rest of the tooth. However, an excessive hardened depth leaves the tooth too brittle to withstand tensile stresses.
The type of gear, tooth geometry, and hardness profile, as well as the operating load conditions to be tolerated, are important factors to consider when looking for the ideal thickness of the hardened layer [
24,
25]. Usually, a uniform hardened layer is considered to be the best profile for hardening gear. This is not necessarily always the case. In many applications, some variety of non-uniform profiles can provide gears with better performance. Uniform hardness profile is popular for medium-size gears. As the gear teeth are not completely hardened, a relatively ductile core (35 to 45 HRC) combined with a hard surface (55 to 65 HRC) offer very remarkable gear properties, such as excellent wear resistance, toughness, and bending strength, and allows greater gear durability. However, it is essential to harden all parts of the gear surface, including flanks and roots zones. An uninterrupted hardened pattern on all contact areas of the tooth indicates good wear properties of the gear and ensures a relatively continuous distribution of desirable compressive stresses at the gear surface.
An ideal hardness pattern consists of uniform thickness along the flank of the tooth and between the fillets. This implies that the energy must be applied in a non-uniform manner to generate a uniform hardened depth, which is not easy to achieve in practice. However, it is possible to approach it by judiciously controlling the process parameters that have an influence on heat transfer and energy absorption [
25]. Laser power, scanning speed and rotation speed can then play a major role in the case depth control.
The objective of this work is to conduct an experimental investigation of the process parameter effects on the hardness profile of 4340 steel spur gears. The used methodology is based on three steps. First, a preliminary exploration is conducted to determine the appropriate range of the process parameters and evaluate their main effects on the hardness profile in order to develop a structured strategy for an efficient design of experiments. The second step consists of developing and performing a systematic experimental investigation using Taguchi method. Finally, the third step consists of analyzing the experimental data in order to evaluate direct and interactions effects of the process parameters on the hardened depth. The experimentations are performed on a commercial 3 kW Nd:YAG laser system using laser power, scanning speed, and rotation speed as principal factors.
2. Experimental Investigation
The base material used is the AISI 4340 alloy steel. Due to its high tensile strength, AISI 4340 alloy steel is very frequently used in the aerospace and automotive industries and largely used in power transmission gears and shafts, aircraft landing gears, and other structural parts. When heat-treated, this nickel-chromium-molybdenum alloy steel is known to reach great tenacity and high strengths.
Table 1 and
Table 2 present AISI 4340 alloy steel chemical composition and properties respectively. Relevant information about the dimensional characteristics of the gear design is presented in
Table 3.
2.1. Process Parameters Identification
The variables that have a significant influence on the hardness profile are clearly identified in the literature [
26]. Several studies on LSTH of various grades of steel identified laser power (P), scanning speed (SS) and rotational speed (RS) as the factors that most affect the hardness profile and produce important effects on the hardened depth [
25,
26,
27]. Therefore, these three parameters are selected for the present study.
2.2. Experimental Setup
An overview of the laser cell used as an experimental setup for the gear’s laser hardening is presented in
Figure 1. The laser cell consisted of an articulated robot with six degrees of freedom, an Nd:YAG high-power laser system, a mini lathe, an infrared imaging device, a data acquisition system, and safety systems. The Fanuc M-710iC robot was used to handle the Highyag Bimo laser processing head.
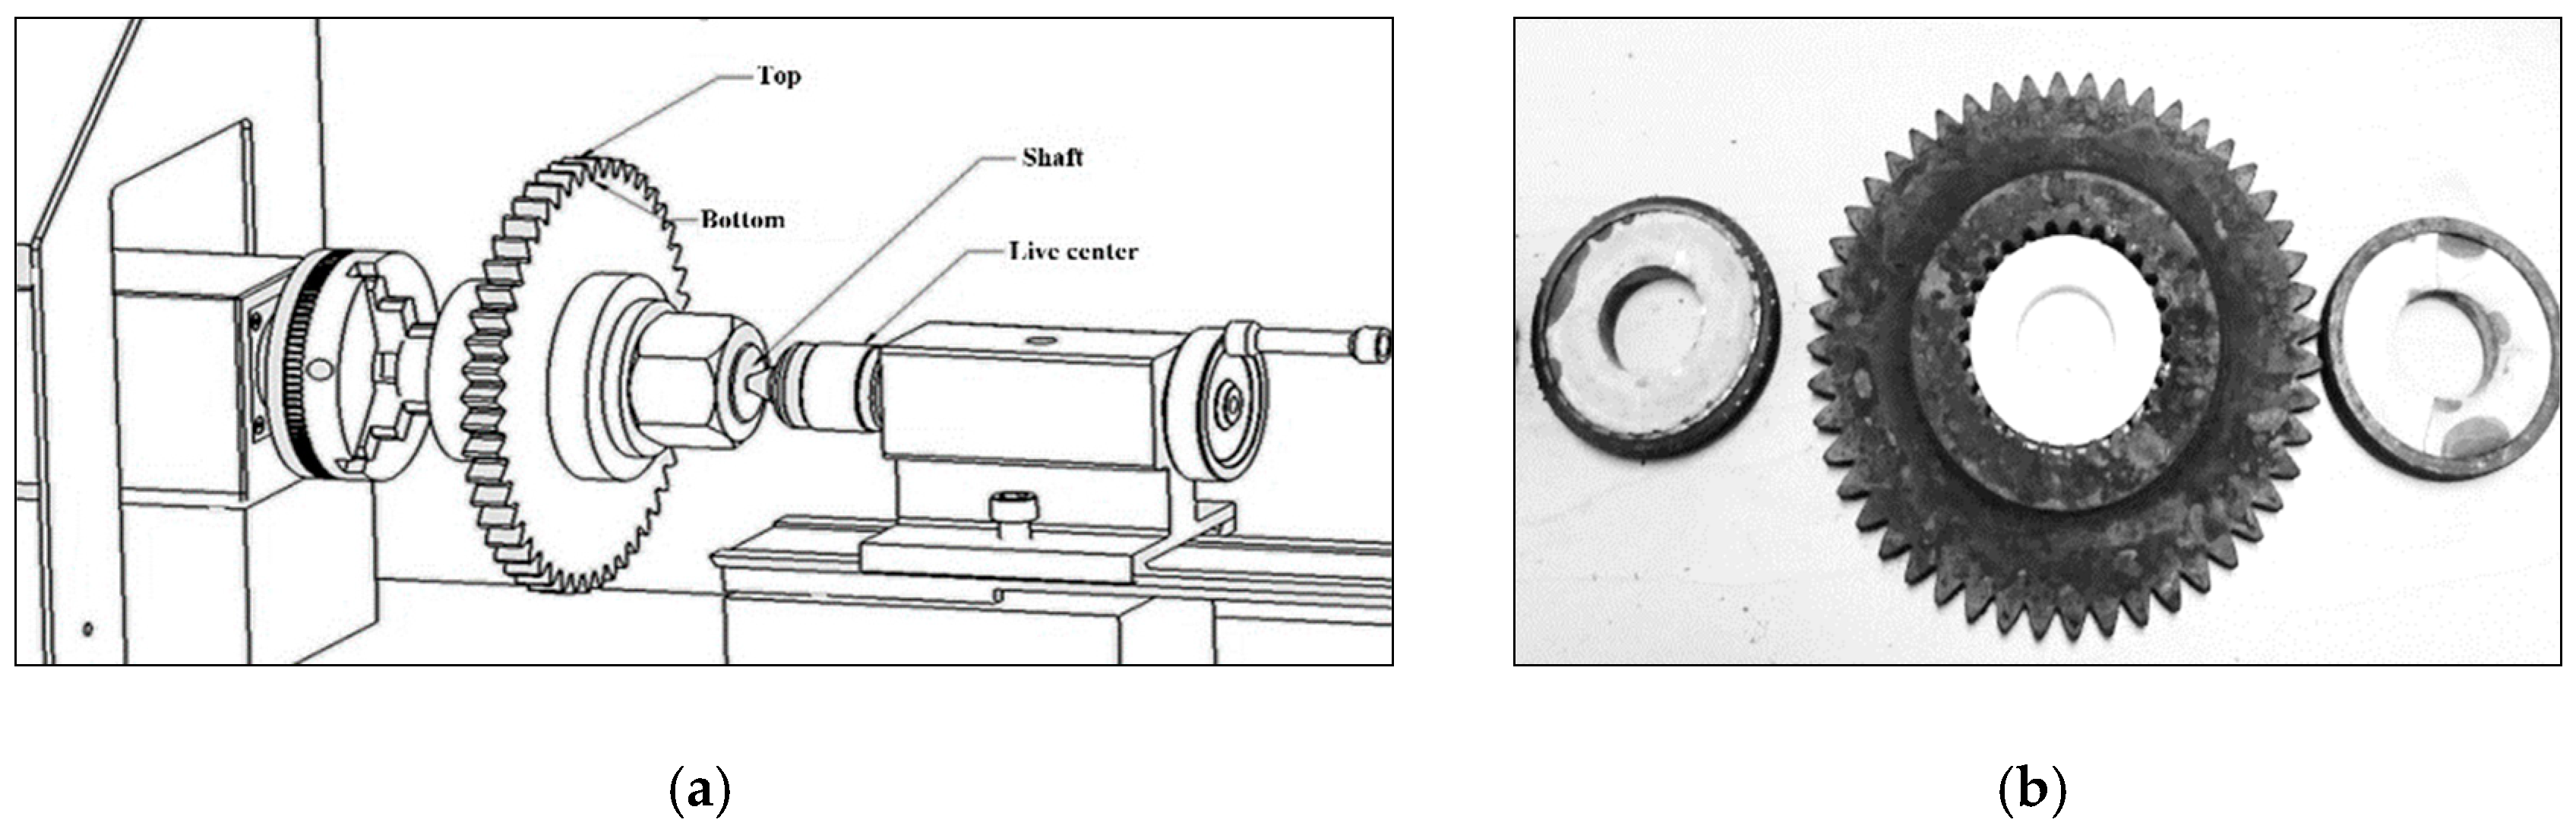
The laser heat source was an IPG YLS-3000-ST2 generating a power output up to 3.2 kW at 1064 nm wavelength. The mini lathe was equipped with a variable-speed drive capable of speeds up to 9500 rpm. The mini lathe was fixed to ensure that the spot could translate along the axis of the rotating part. An accurate thermographic imaging method using a FLIR A325 infrared camera was adopted for the surface temperature measurements. The FLIR was located close to the part at the adequate focal distance for better spatial resolution needed to understand the physical phenomena and later to control the process parameters. To protect the mini-lathe components, it was necessary to avoid the thermal transfer from the gear assembly to the mini-lathe components (live center, chucks...). To do so, alumina ceramic rings were inserted between the shaft and the gear as illustrated in
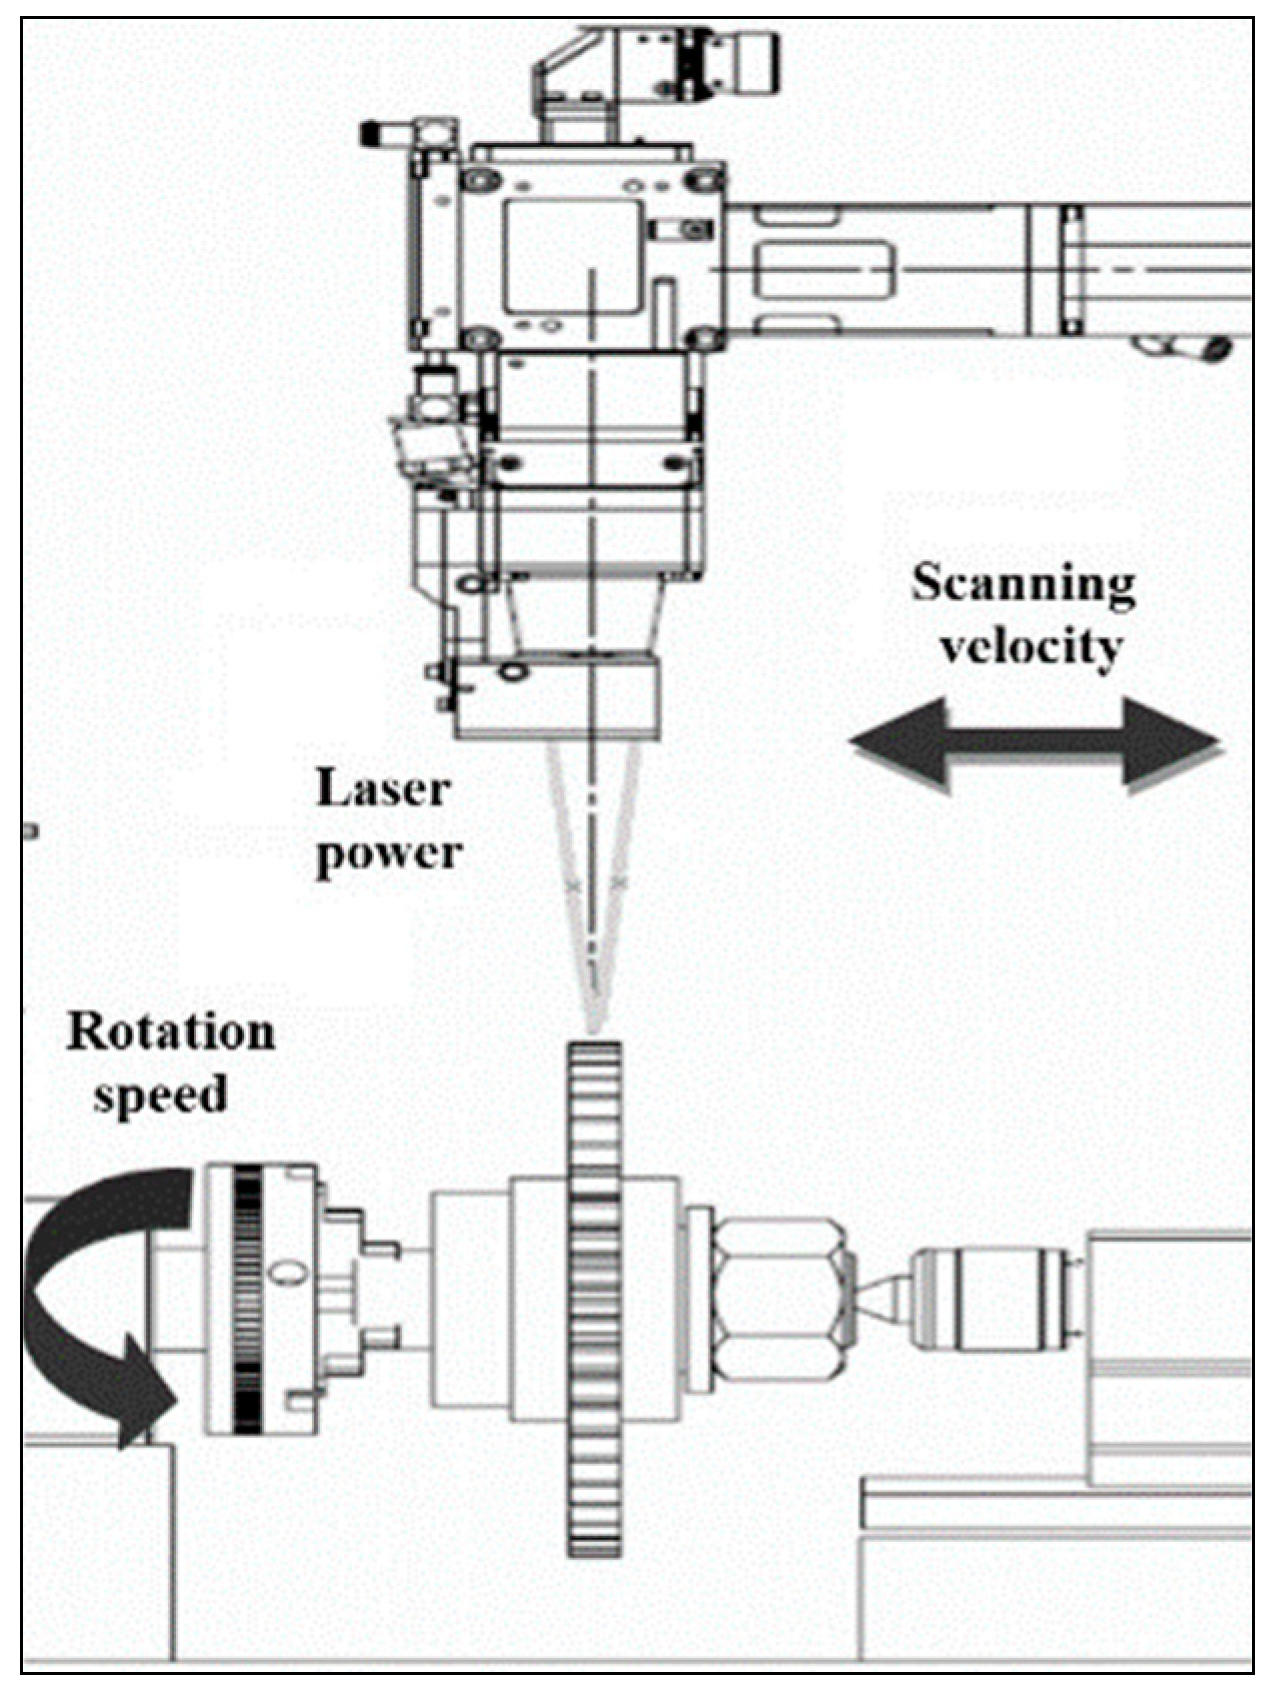
Figure 2. The laser setup configuration is illustrated in
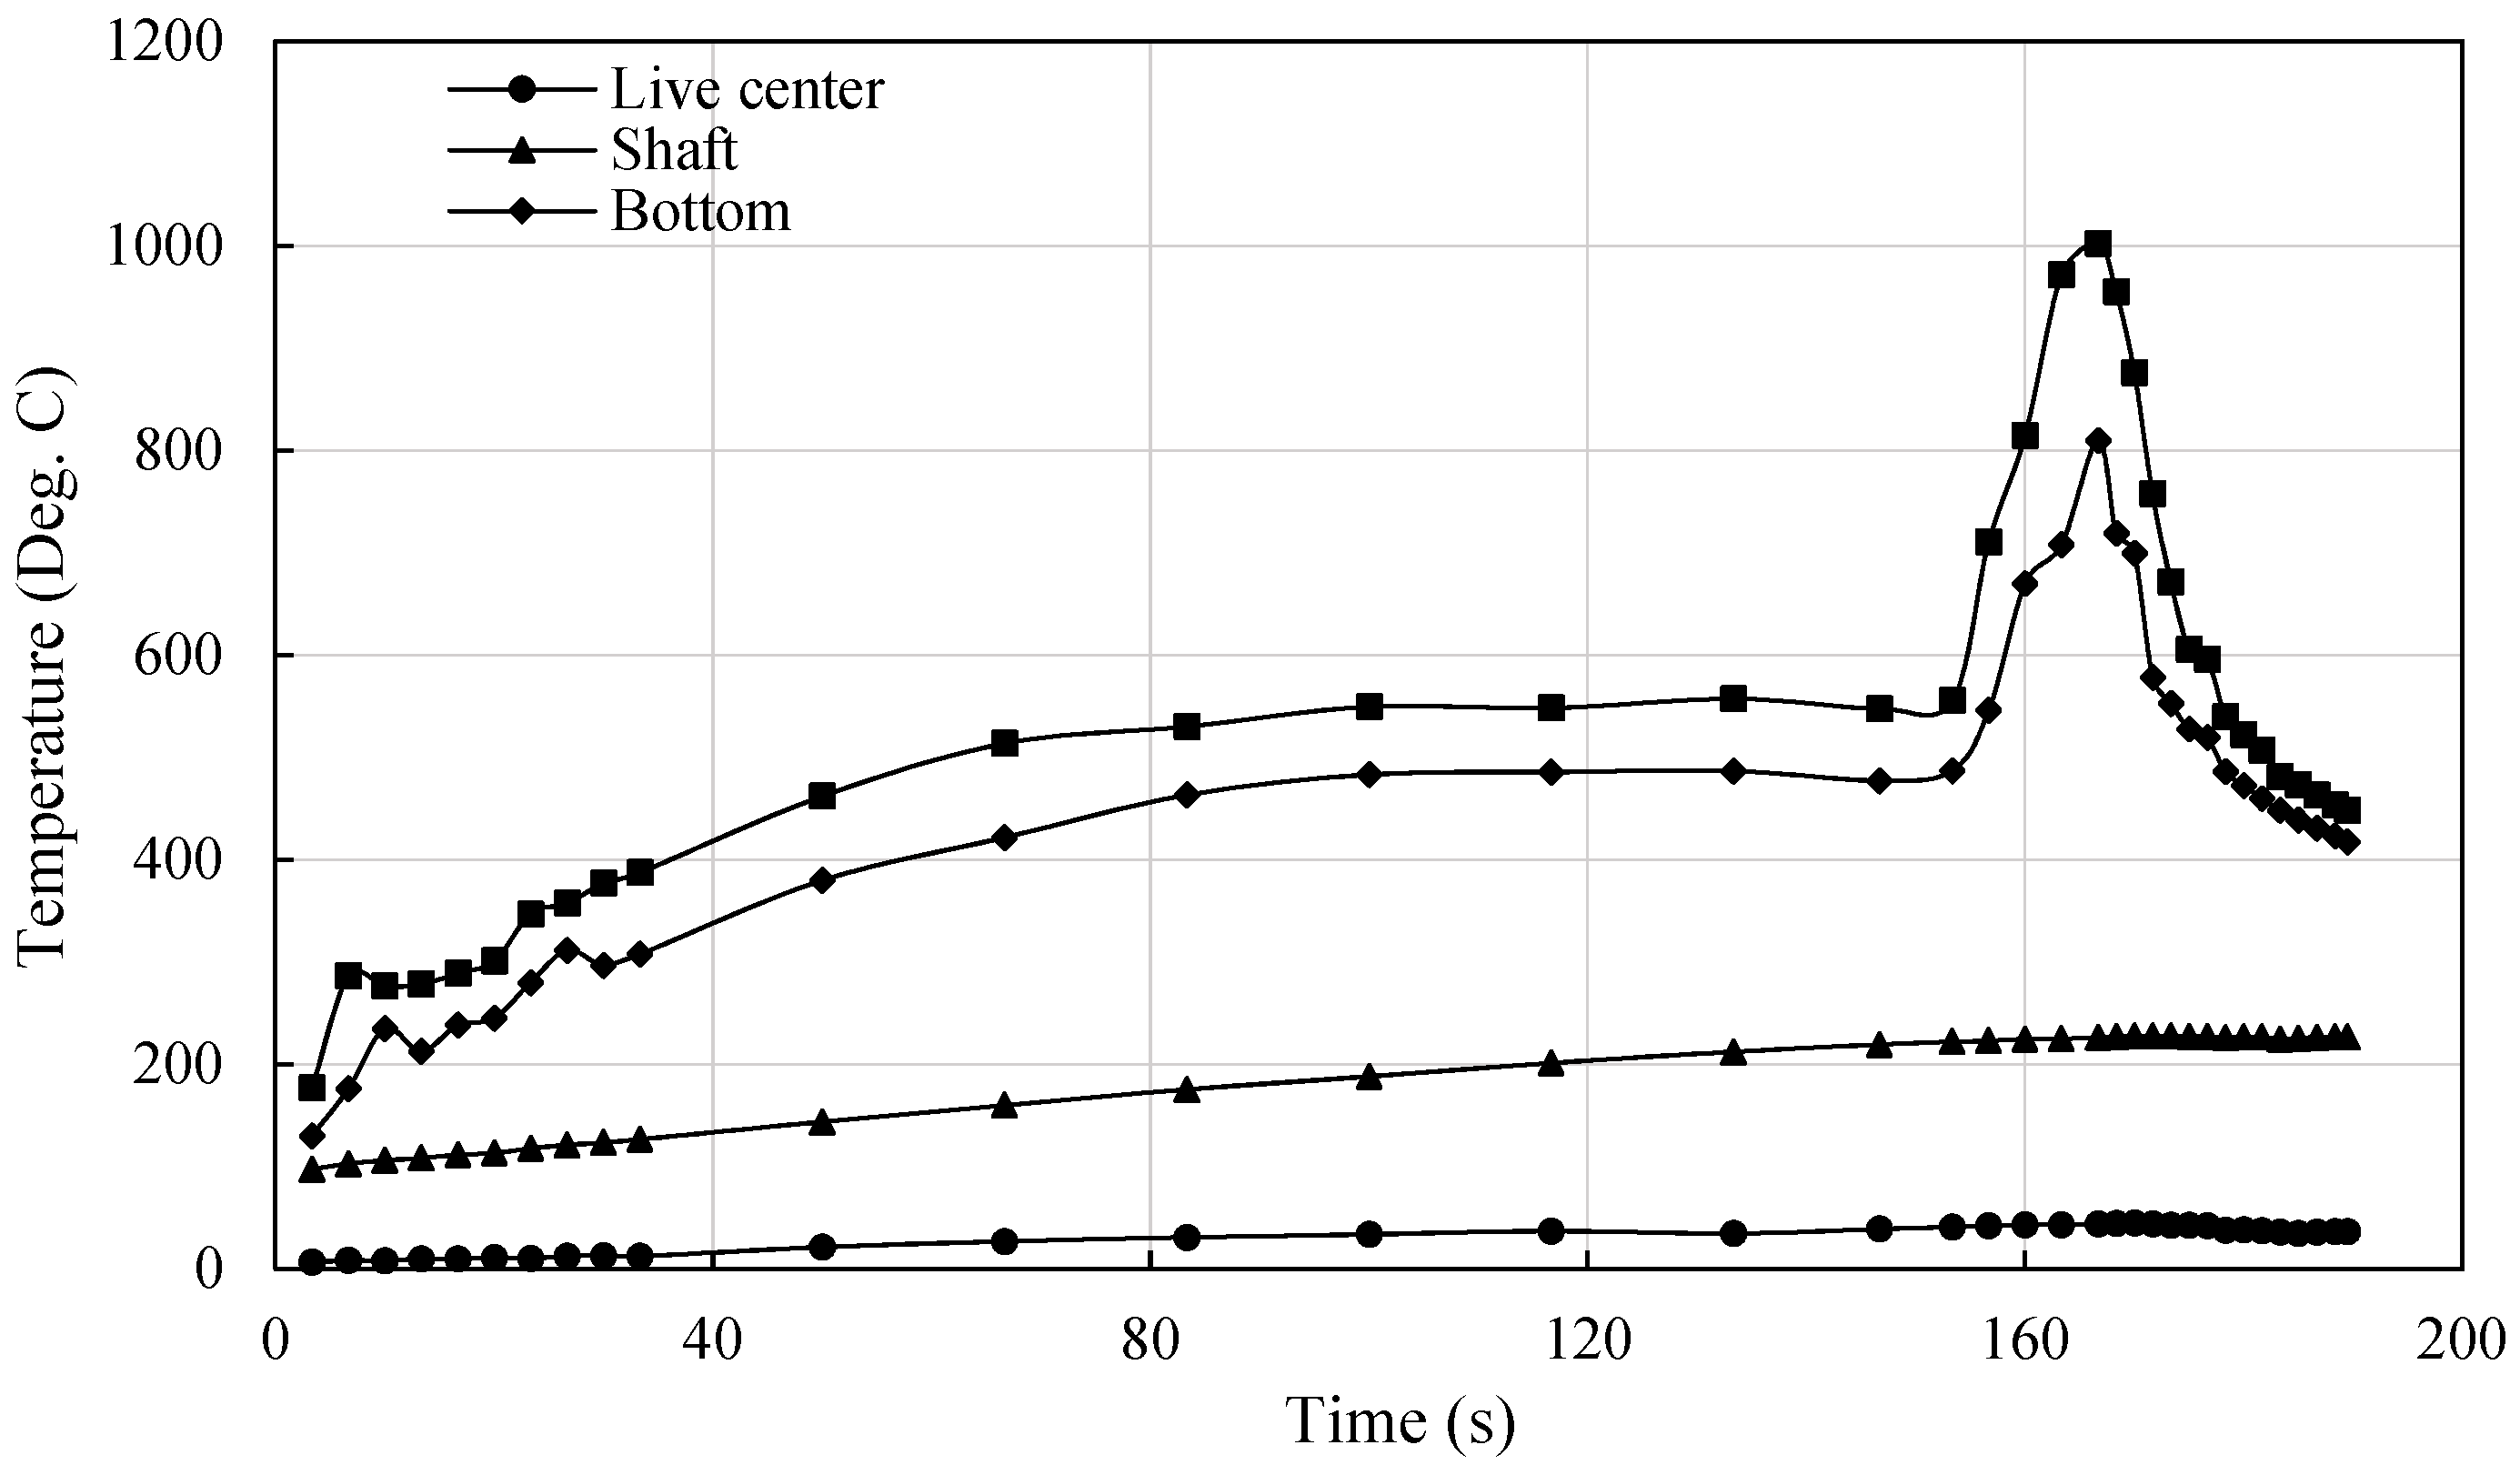
Figure 3. The temperatures in selected points of the assembly were constantly monitored, as shown in
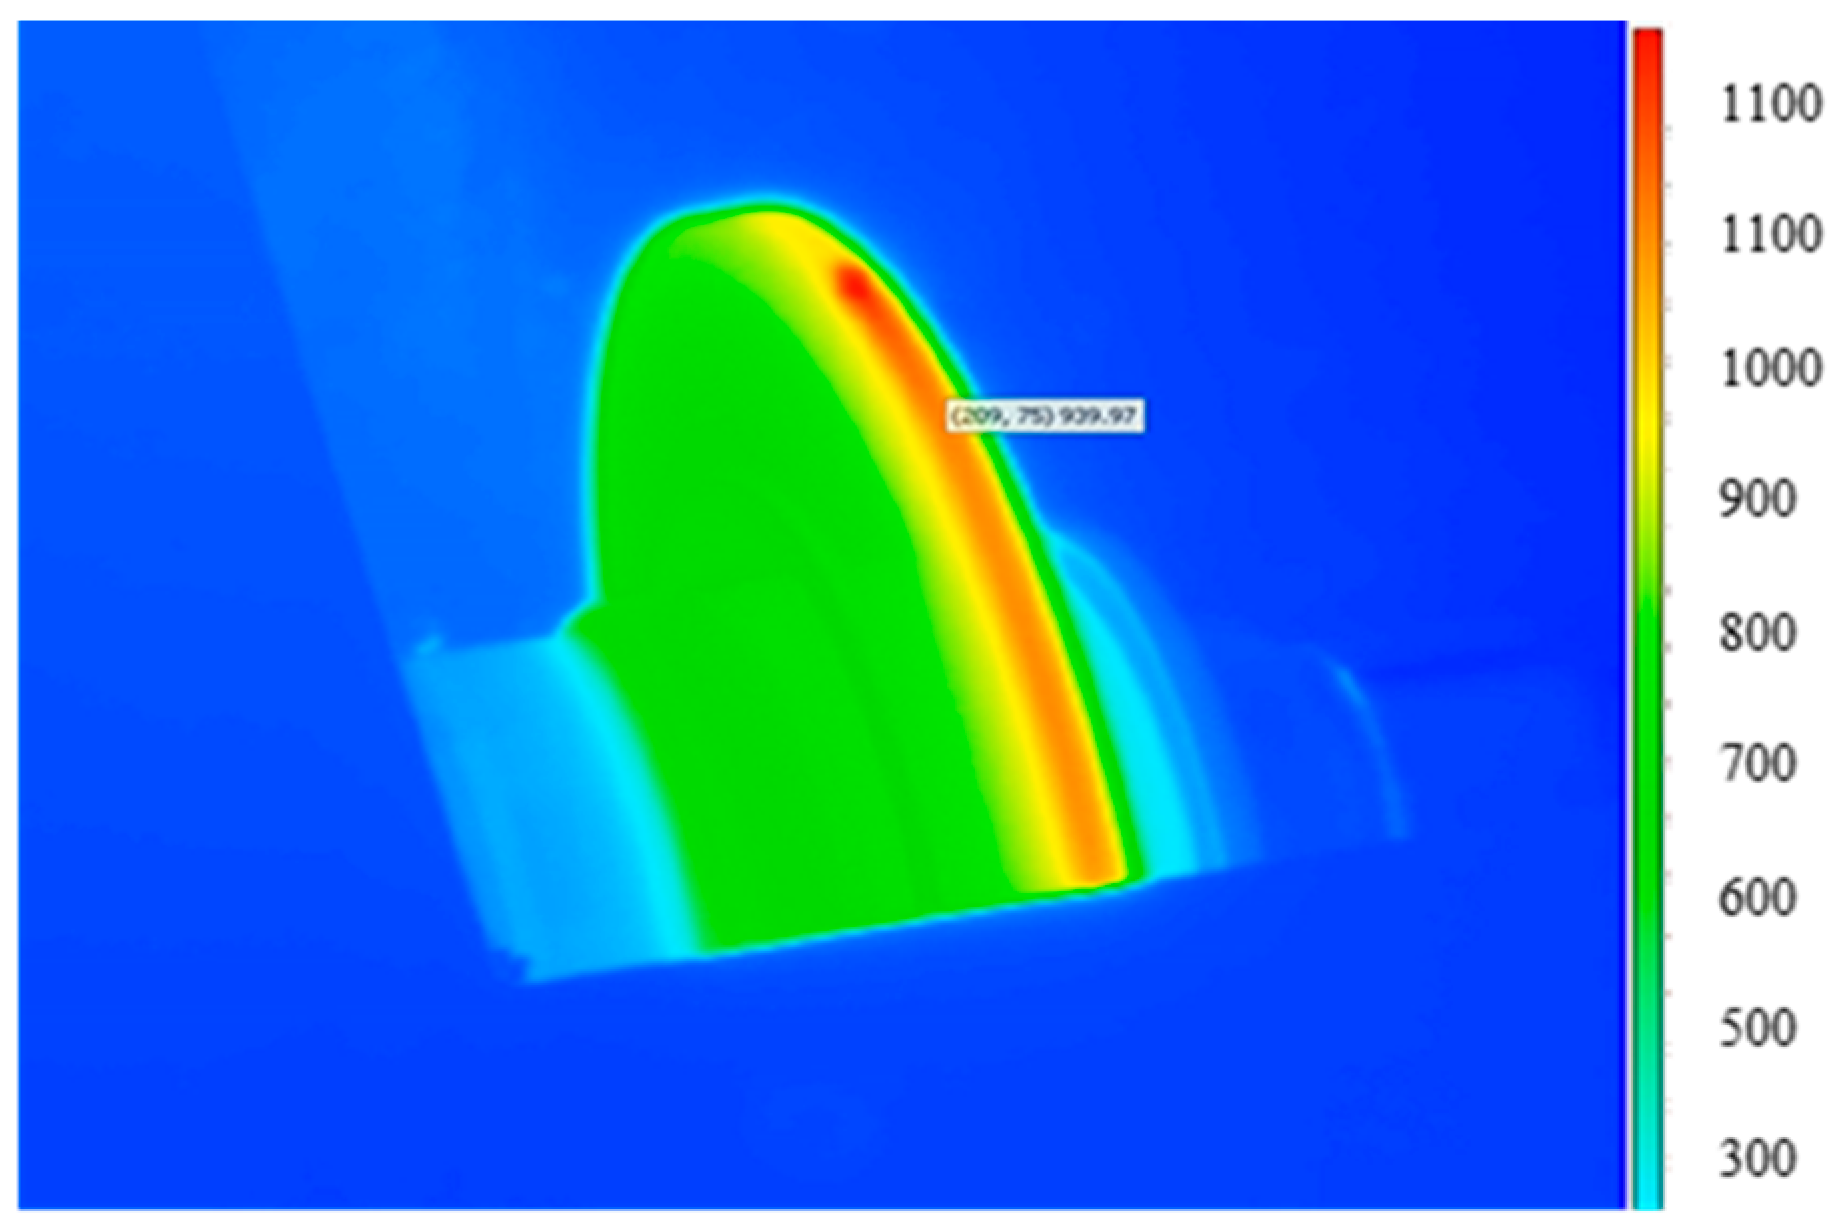
Figure 4.
Figure 5 presents an illustration of typical temperature distribution during the heating process. Note that the temperature was not uniform throughout the gear. However, since the gear was rotating, it was possible to assume that different portions of the exposed surface would receive the same quality of heat.
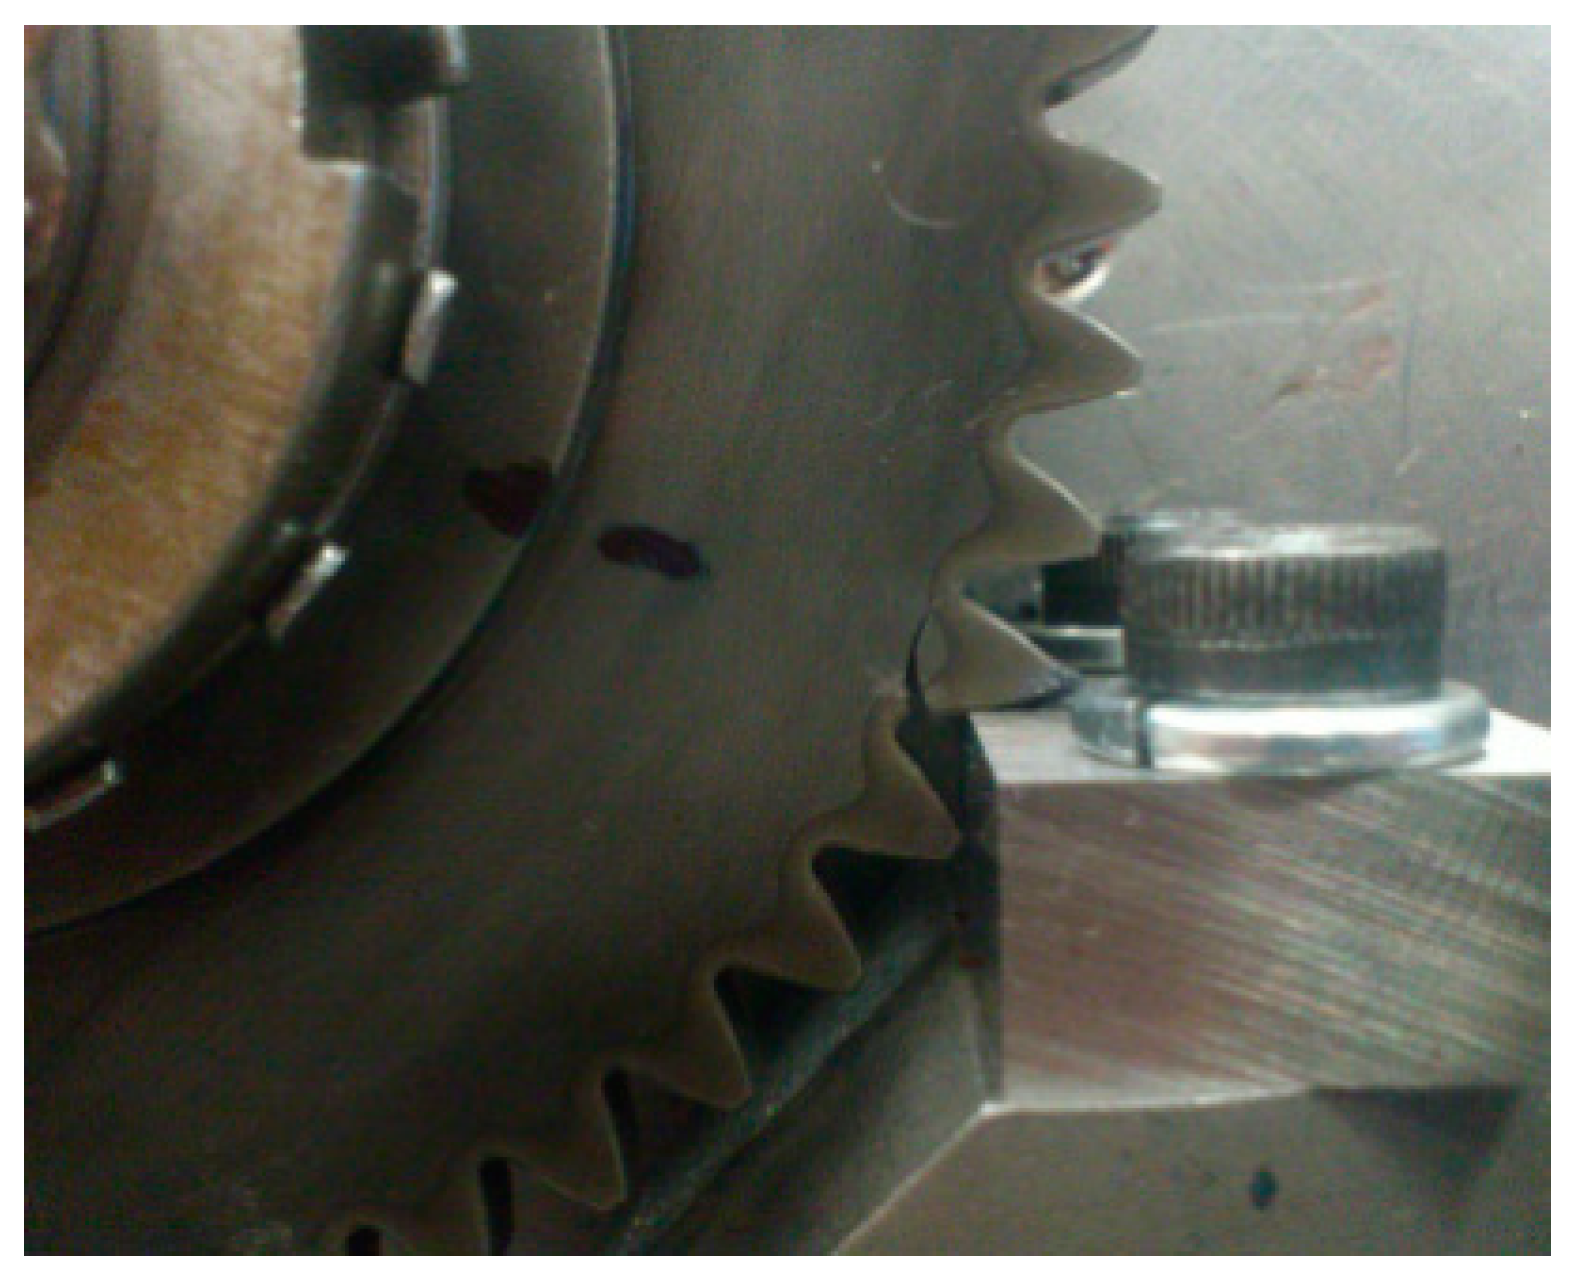
Before the laser surface transformation hardening, the parts were machined, hardened, and tempered to reach an initial core hardness of about 45 HRC. Following the heat treatment, the specimens were cautiously prepared, polished, and etched using Nital chemical solution (95% of ethanol and 5% of nitric acid). The hardness profiles construction was based on programmed micro-hardness measurements using a Clemex machine. The temperature of the preheating was set at 480 °C in the gear bottom. Particular attention was paid when measuring the micro-hardness at the bottom of the spur gear teeth where there is normally less hardening. As illustrated in
Figure 6, a visible crack appeared in the hardened gear bottom, suggesting that the bottom is the most fragile location.
2.3. Preliminary Tests and Results
In order to determine the appropriate range of the process parameters and to approximate their main effects on the hardness profile, a preliminary experimental exploration was performed. The experimentation tests were done on spur gears made of AISI 4340 steel using laser P, SS, and RS as experimental factors. During this stage, these factors were varied in specific ranges. The hardness profile evaluation started by examining visually the cross-section of the specimen, and then by measuring the micro-hardness as a function of the depth from the surface to the end of the transformed zone. The case depth was defined by the depth depicting the hardened area. The hardness was measured on the hardened gear cross-section at 18 points at a separation distance of 250 µm along two parallel lines passing through the middle of the tooth tip and the middle of the tooth root. When one factor was varied, the others were set to their average values. P is varied from 1800 W to 2500 W, SS from 0.15 to 0.45 mm/s and RS from 3000 to 4000 rpm. The hardened depth and the smoothness of the transition between hardened zone and base material with negligible heat-affected zone were the major criteria used for the identification of the working ranges.
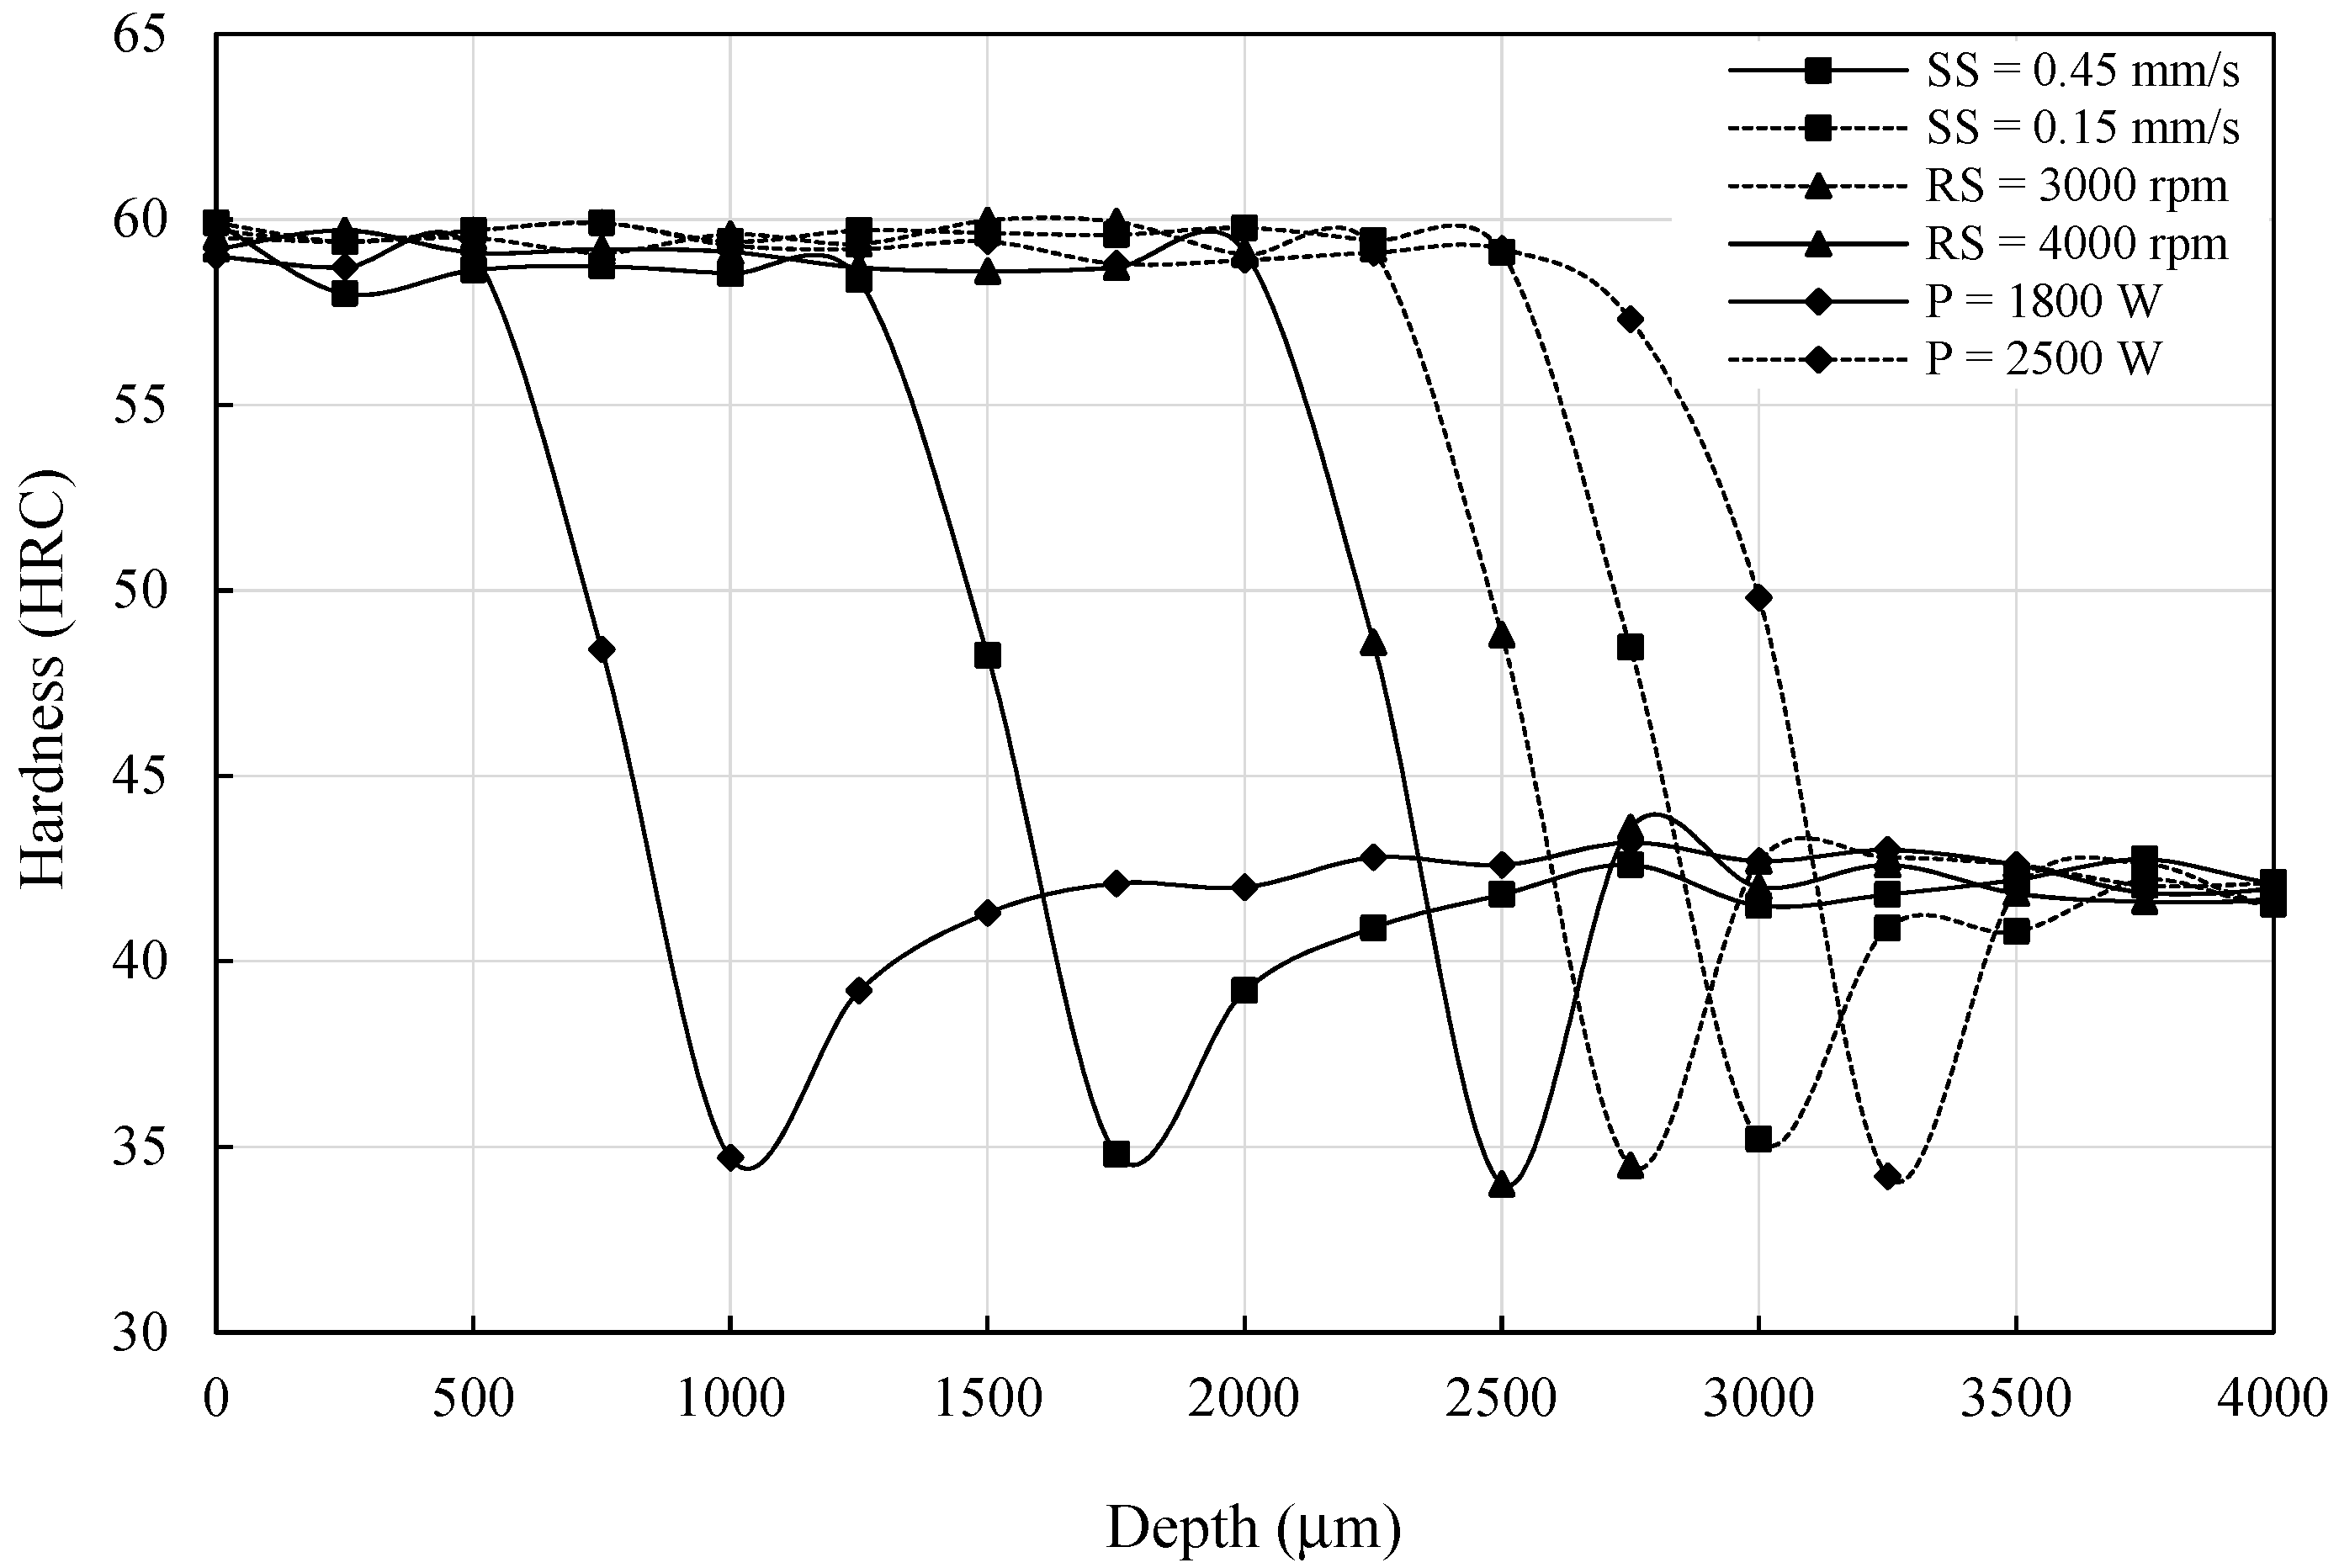
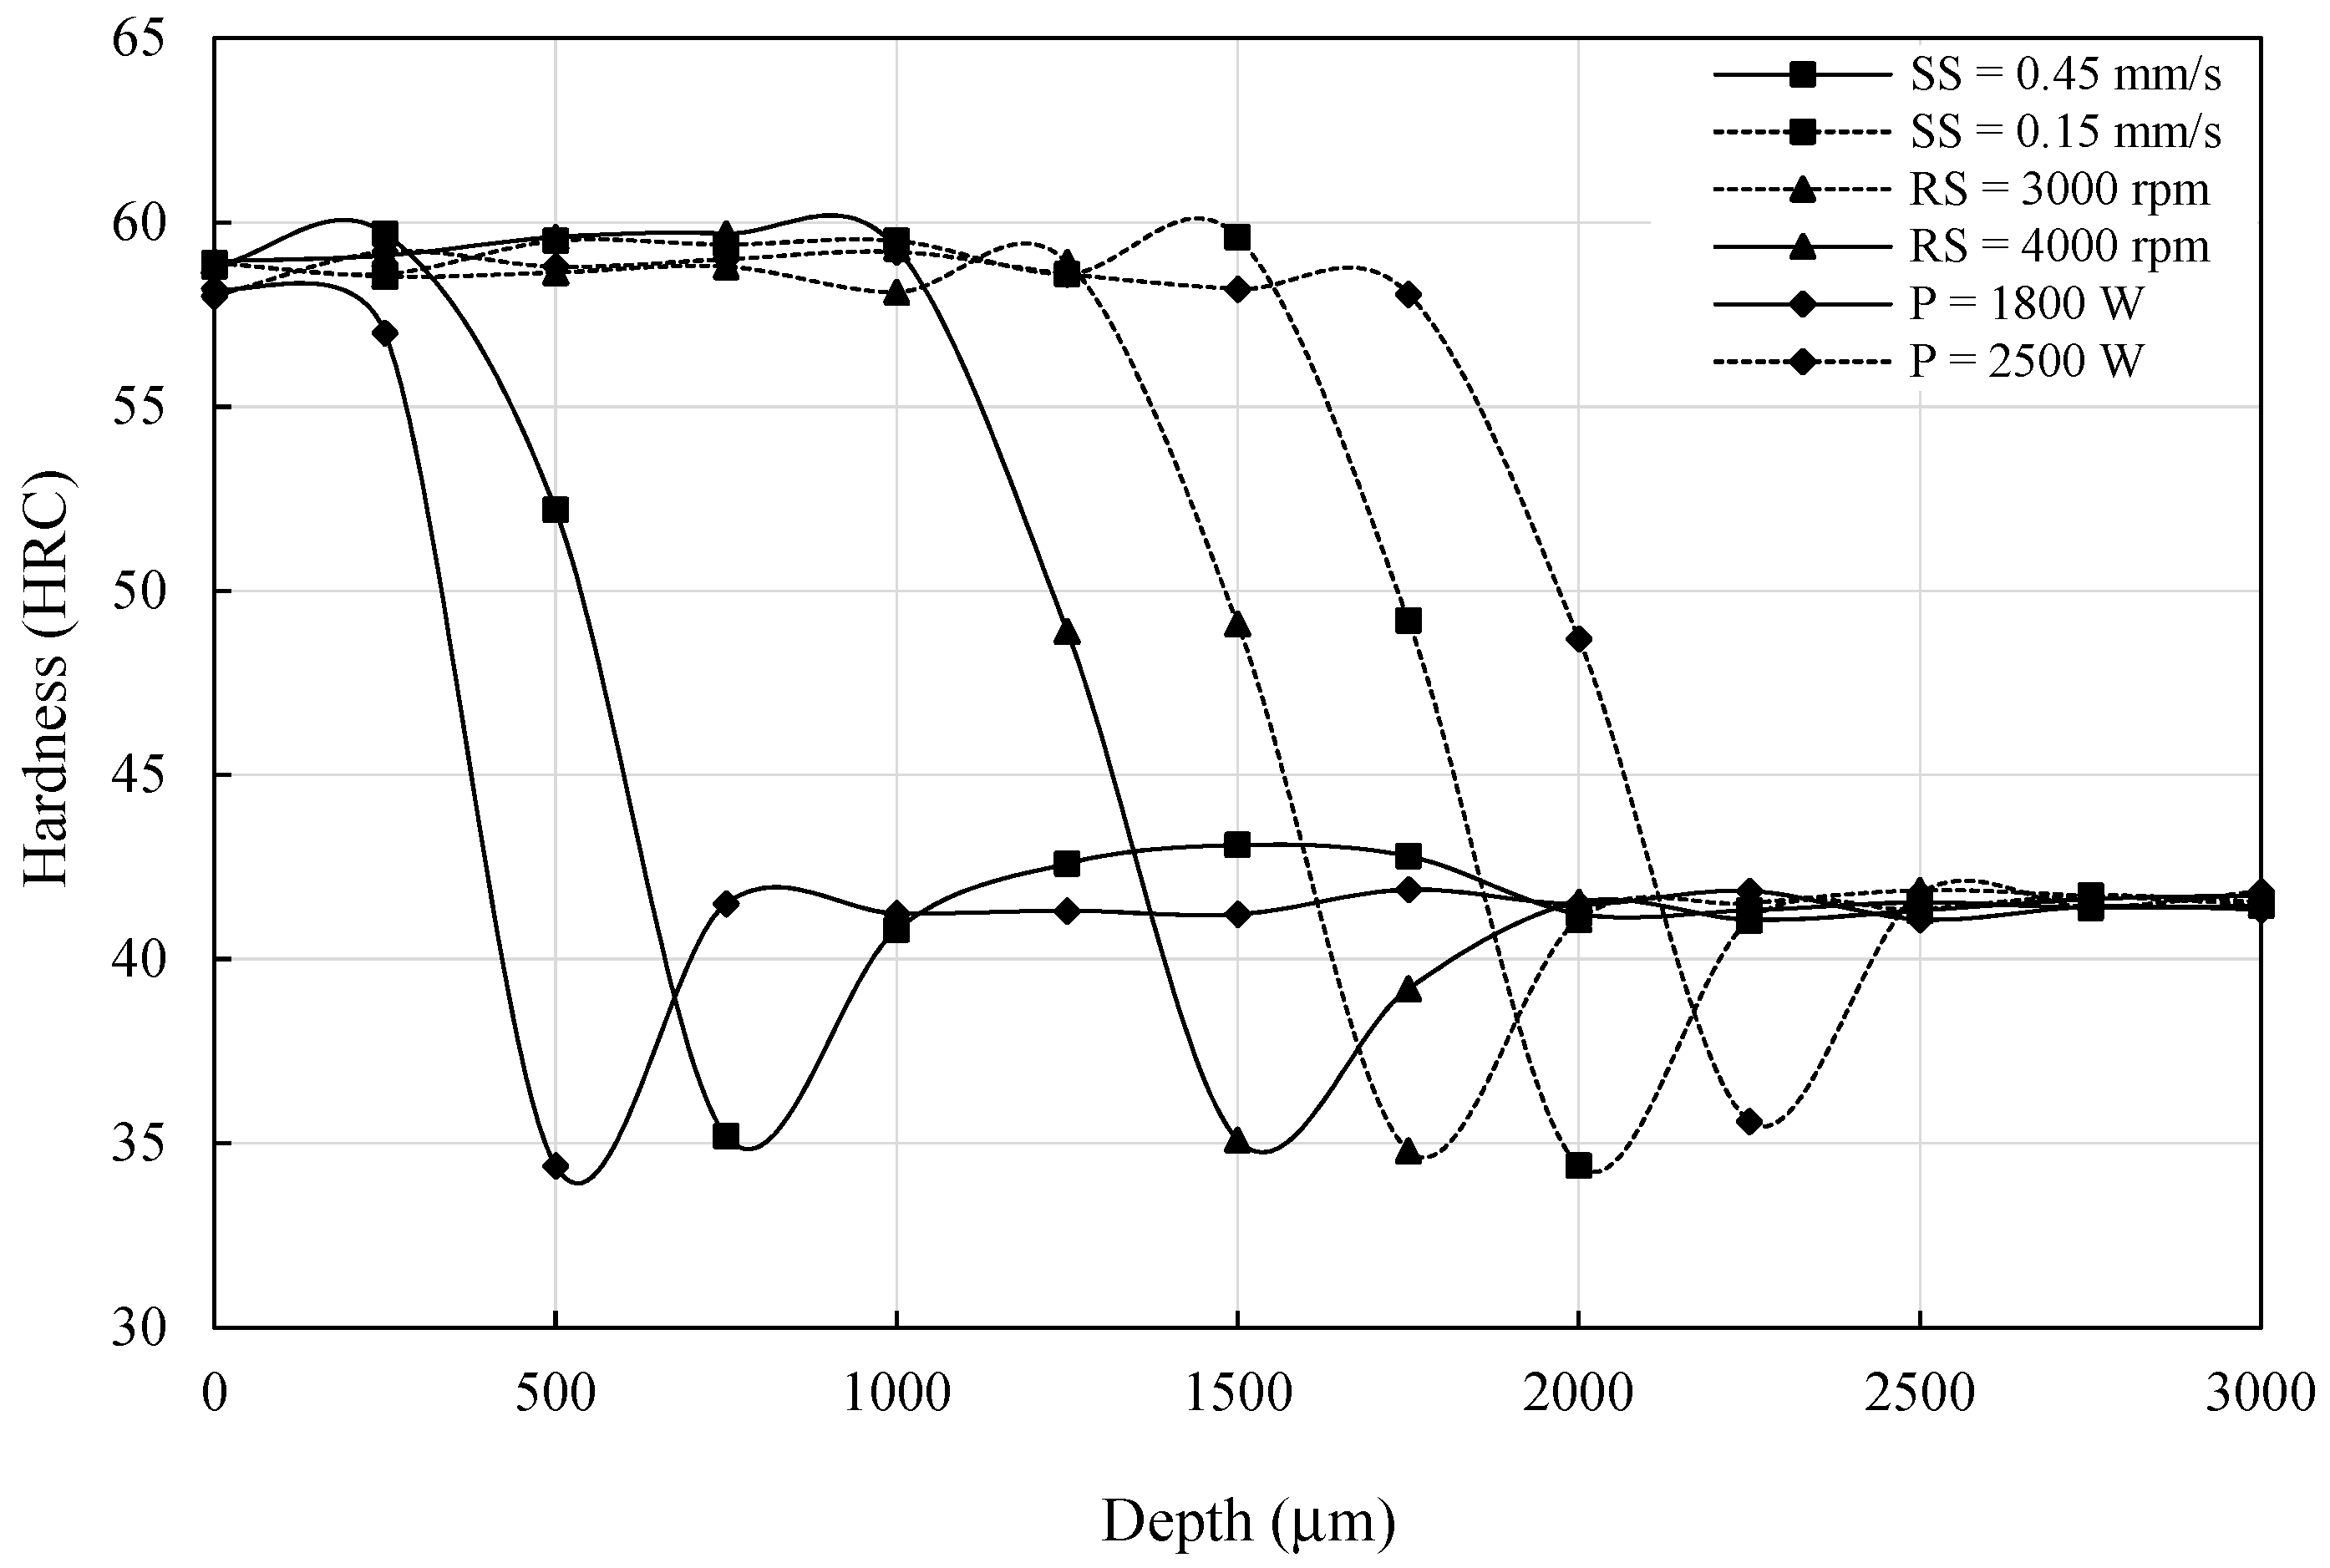
Figure 7 and
Figure 8 represent the hardness curves for typical preliminary tests representing the variation effects of SS, RS, and P, respectively. These hardness curves can be divided typically into three regions. Recognized by its high hardness compared to the part core, the first region was totally austenitized and transformed to martensite upon rapid cooling. The second region was identified by a radical decreasing in hardness before reaching the core hardness. This region was characterized by the hardness loss caused by a severe drop in hardness to reach initial hardness. This zone was considered as a mixture of hard and over-tempered martensite when the temperature was between Ac1 and Ac3. Finally, the third region corresponded to the zone not affected by the thermal flow. The case depth was then characterized by the first zone, called the hard zone [
27].
The experimental results show that the hardness remains relatively constant within the hardened depth before dropping off to reach the initial hardness value despite the variation of the process parameters. From these preliminary results, several observations can be made. The surface hardness value is similar in all cases through the preheating stage. As expected, decreasing the SS or the revolution speed results in increasing the hardened depth. However, increasing the power results in increasing the hardened depth. Using these preliminary experimental observations, the working limits of the process parameters to achieve the desired hardening conditions are selected. The selected (lower–upper) ranges for P, SS, and RS are (1900–2300 W), (0.25–0.45 mm/s), and (3000–4000 rpm), respectively. Other than the limits, the middle level is selected in order to evaluate the effect of the process parameters in the middle region. Consequently, one more level in the middle of each factor range is selected. The increasing of the quantity of levels will dramatically increase the number of experiments, which will be more material-, time-, and cost-consuming.
2.4. Design of Experiments
In any experimental investigation, the data collection method used is the basic ingredient to ensure the quality and the significance of the acquired data. Orthogonal arrays-based design of experiments is one of the most appropriate strategies that can lead to an efficient and robust design that can collect statistically significant data with the minimum number of repetitions [
28]. In the case of heat treatment, it is important to avoid the non-transformation to martensite as well as melting of the superficial layer. For this reason, the experimental investigation is started by defining the working limits of the process parameters using preliminary tests. The evaluation of the effect of the process parameters on the middle region and the possible nonlinearity in the process parameter effects justify the choice of three levels for each factor. As a result, three factors with three levels are considered.
Table 4 shows the factors and levels used in the experimental design. These factors are the laser power, the beam scanning speed, and the part revolution speed. The central values of the variation ranges of these factors represent the nominal values used to reach the nominal case depth of the hardness. The design that fits this problem corresponds to an L
9 matrix. The experimental design is shown in
Table 5. As the experiments are planned using an orthogonal design the estimate of the average effects of a given factor on various responses will not be biased.
3. Experimental Data Analysis
Three major statistical tools are used to analyze the produced experimental data: The graph of the average effects of each factor level on the mean hardened depth (bottom and top), the percent contribution of factors in the mean hardened depth variation extracted from the analysis of variance (ANOVA), and the correlation between the mean hardened depth and various factors. The percent contribution of an experimental factor represents the portion of the variation observed in the experimental data that is attributed to that specific factor. Typically, the total percent contribution of all considered experimental factors must add up to 100. The difference from 100 is credited to the contribution of other uncontrolled factors as well to experimental errors. Using these results, it is possible to extract some accurate and useful indicators on the best combination of the process parameters to consider for eventual predictive modeling.
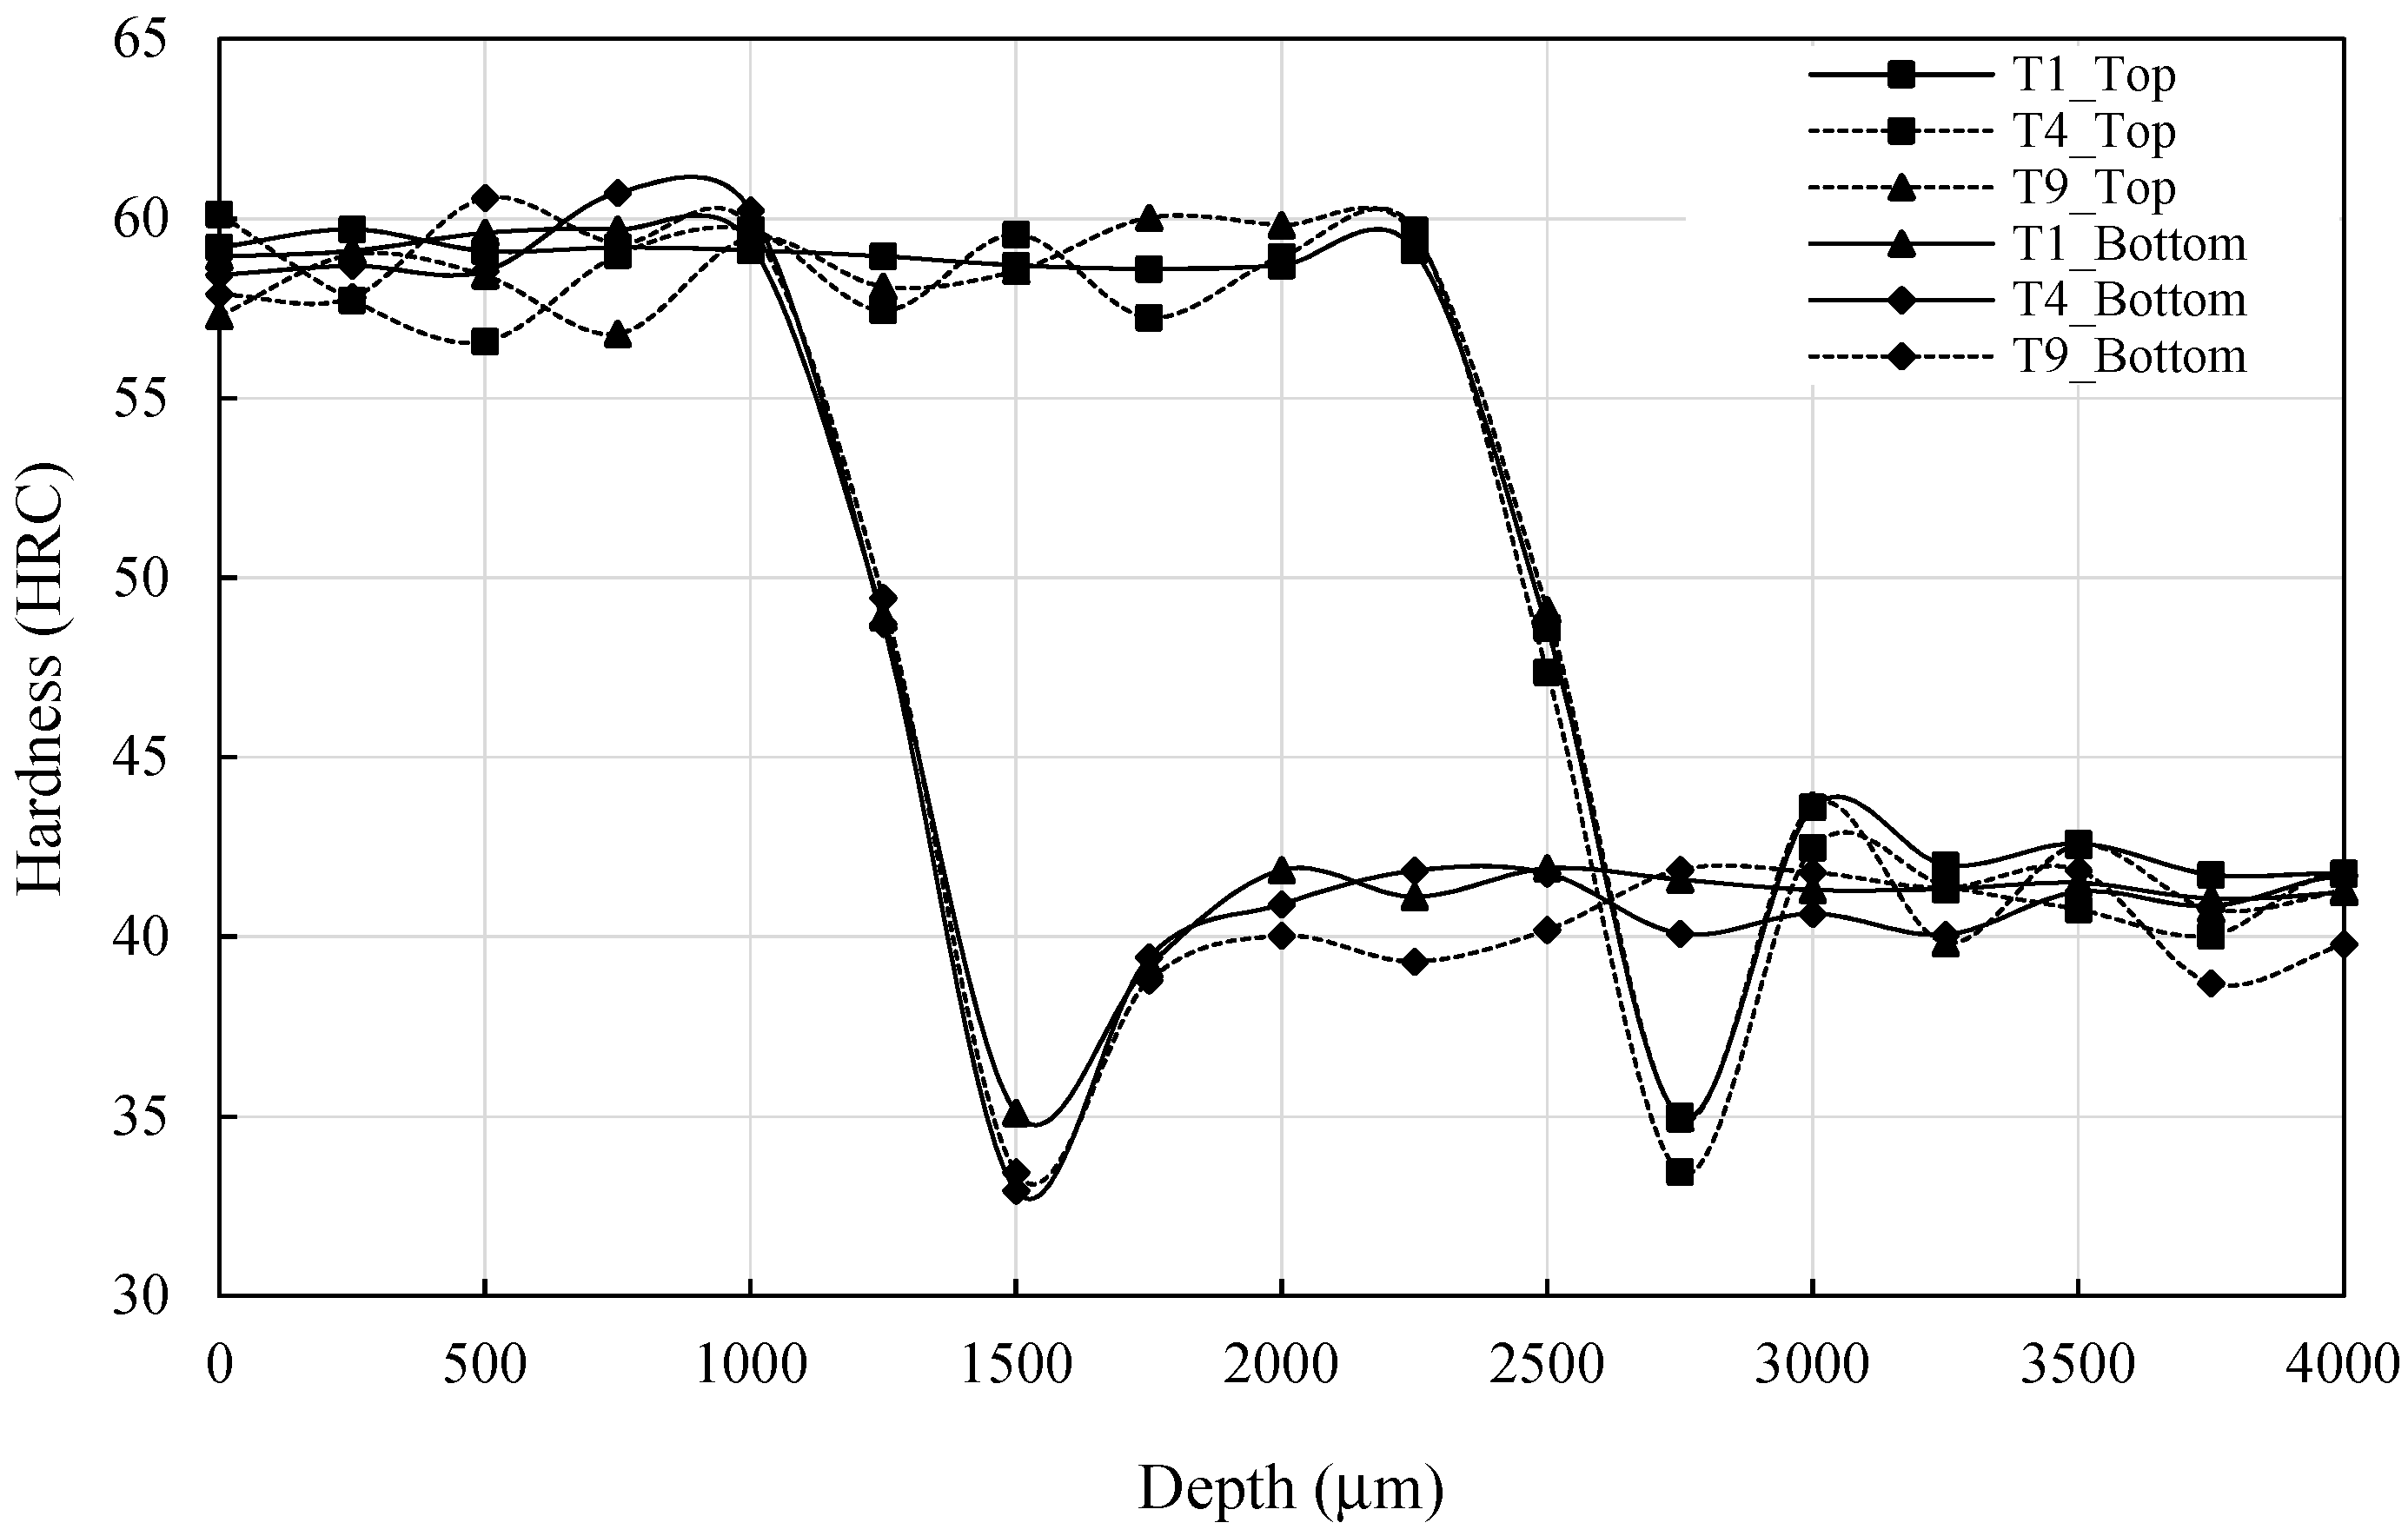
As the first observation of data indicates that the minimum values of the hardened depth (top and bottom) are obtained in test 3 using 1900 W, 0.45 mm/s and 4000 rpm for P, SS, and RS, respectively. The maximal values of the hardened depth (top and bottom) are obtained in test 8 using 2300 W, 0.35 mm/s and 3000 rpm for P, SS, and RS, respectively. The second observation indicates, as illustrated in
Figure 9, that T
1, T
4, and T
9 produce the same result in terms of hardness profile and hardened depth demonstrating that different process parameter combinations can lead to identical gear teeth top and bottom hardened depths, suggesting multiple options for an eventual cost and production optimization process. Finally, a strong correlation is observed between top and bottom hardened depths.
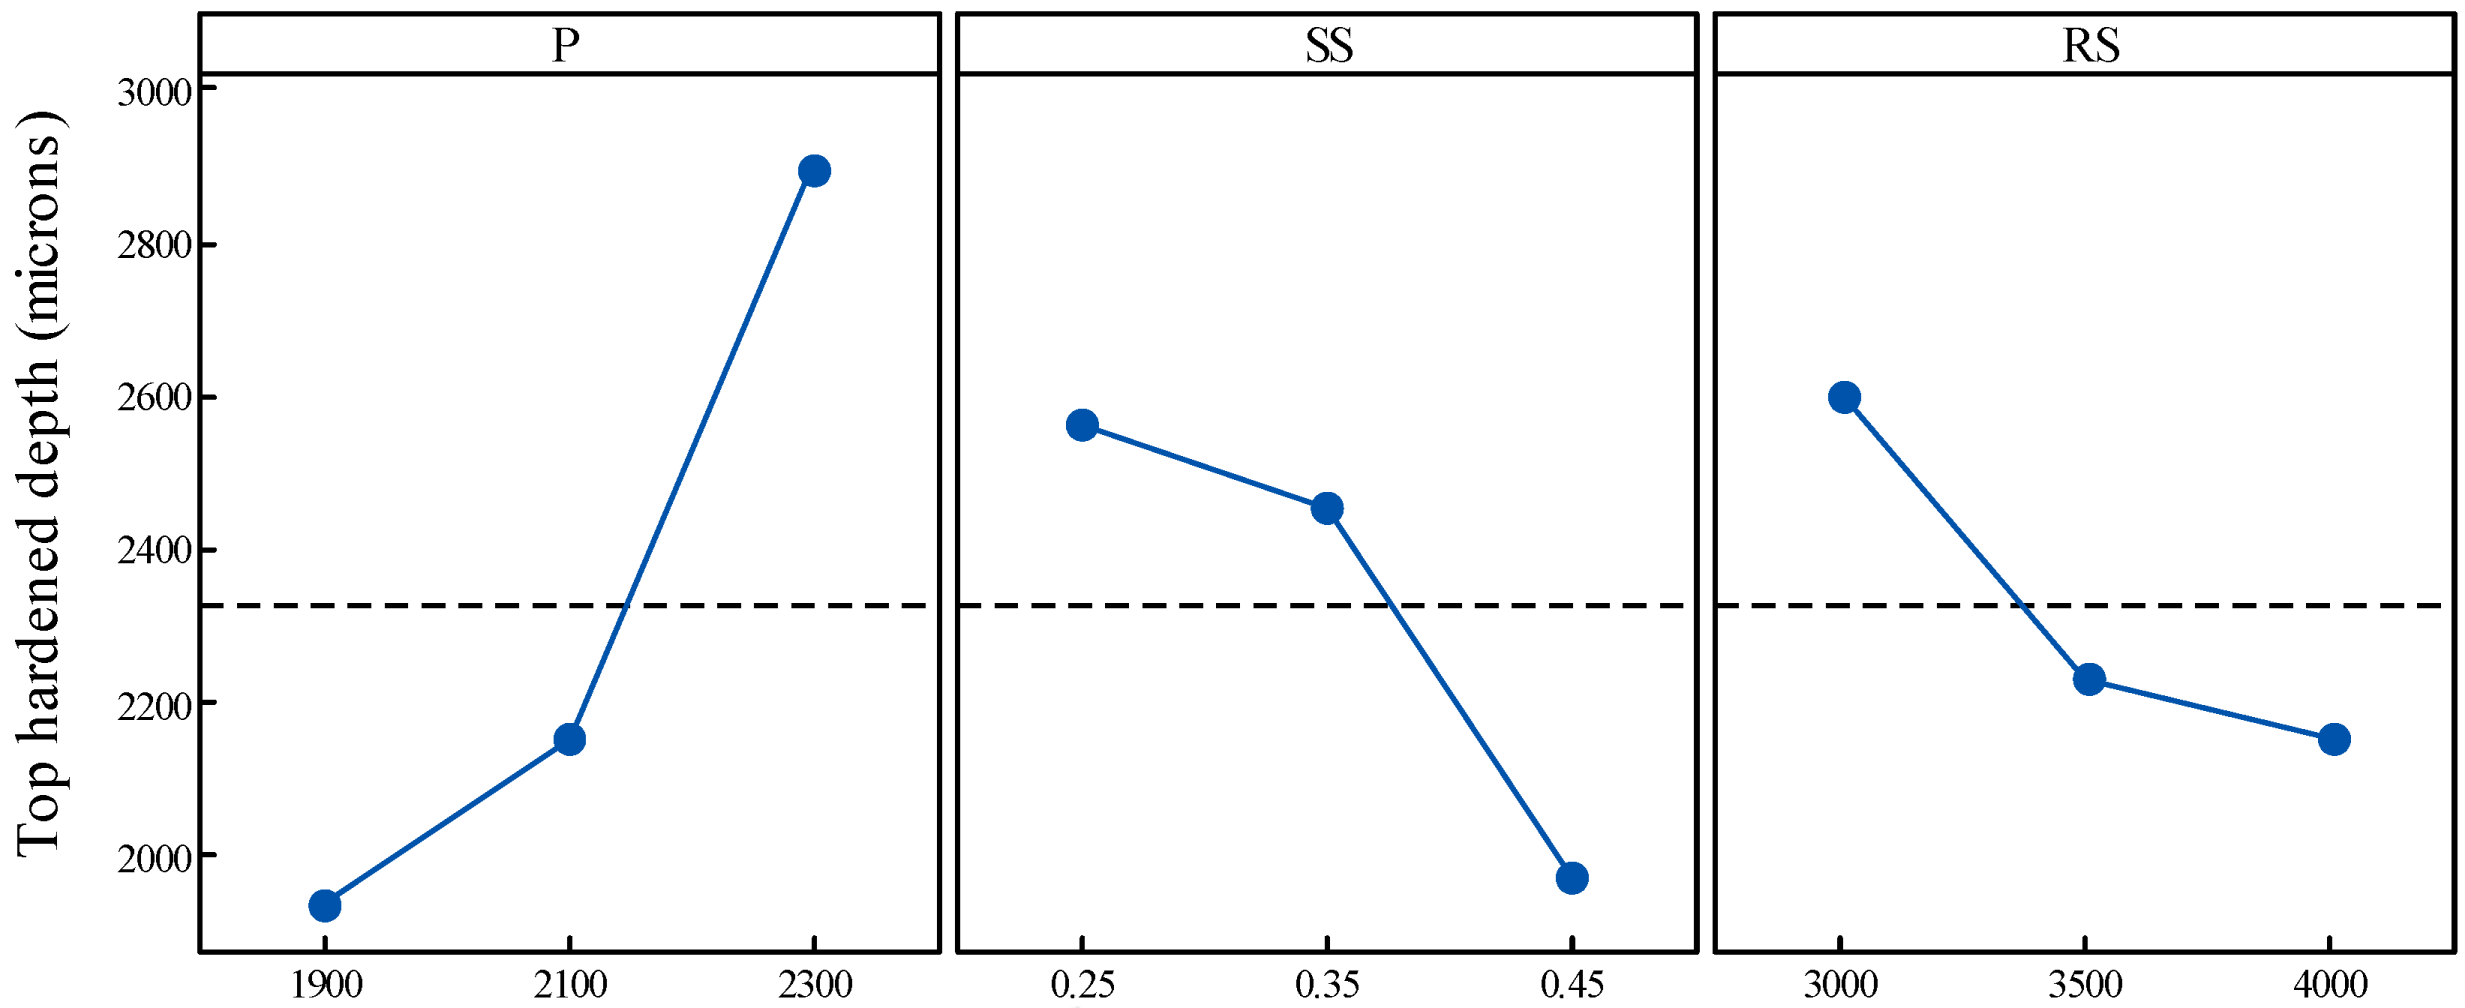
As indicated, the objective of ANOVA is to investigate whether the parameters and the interactions present significant effects on the hardened depth in order to identify the variables to be included in the prediction model. Extracted from ANOVA,
Figure 10 shows that the top hardened depth is affected at different degrees by the process parameters. The direction and the slope of each graph determine the effect of each of the three parameters. The factor most affecting the hardened depth is P. SS and RS have a lower impact. The results are in concordance with the observations made in the preliminary experimental results. It can be observed that the top hardened depth increases as P increases. However, the hardened depth decreases when the SS and RS increase. These results are anticipated, since increasing SS and RS reduces the heat transmitted from the laser beam to the part surface.
These results are confirmed by the average effect of each parameter in terms of percent contribution in the top hardened depth variation.
Table 6 reveals that the cumulative contributions of P, SS, and SR in the hardened depth variations represent more than 84%. P is the most significant parameter having the greatest effect (52.92%). The SS is the second most significant parameter with 20.04%, and RS is the least significant parameter with the smallest effect (11.27%). These results are confirmed by the correlation analysis between process parameters and hardened depths presented in
Table 7. The contribution of the interactions between the three parameters is less important, representing about 12.5%. However, it is surprising that P and SS interaction have a less significant effect with about 0.2%, which is less than the error contribution. Given the impact of the increasing SS on the power effect, SS interaction is assumed to be at the same level as RS.
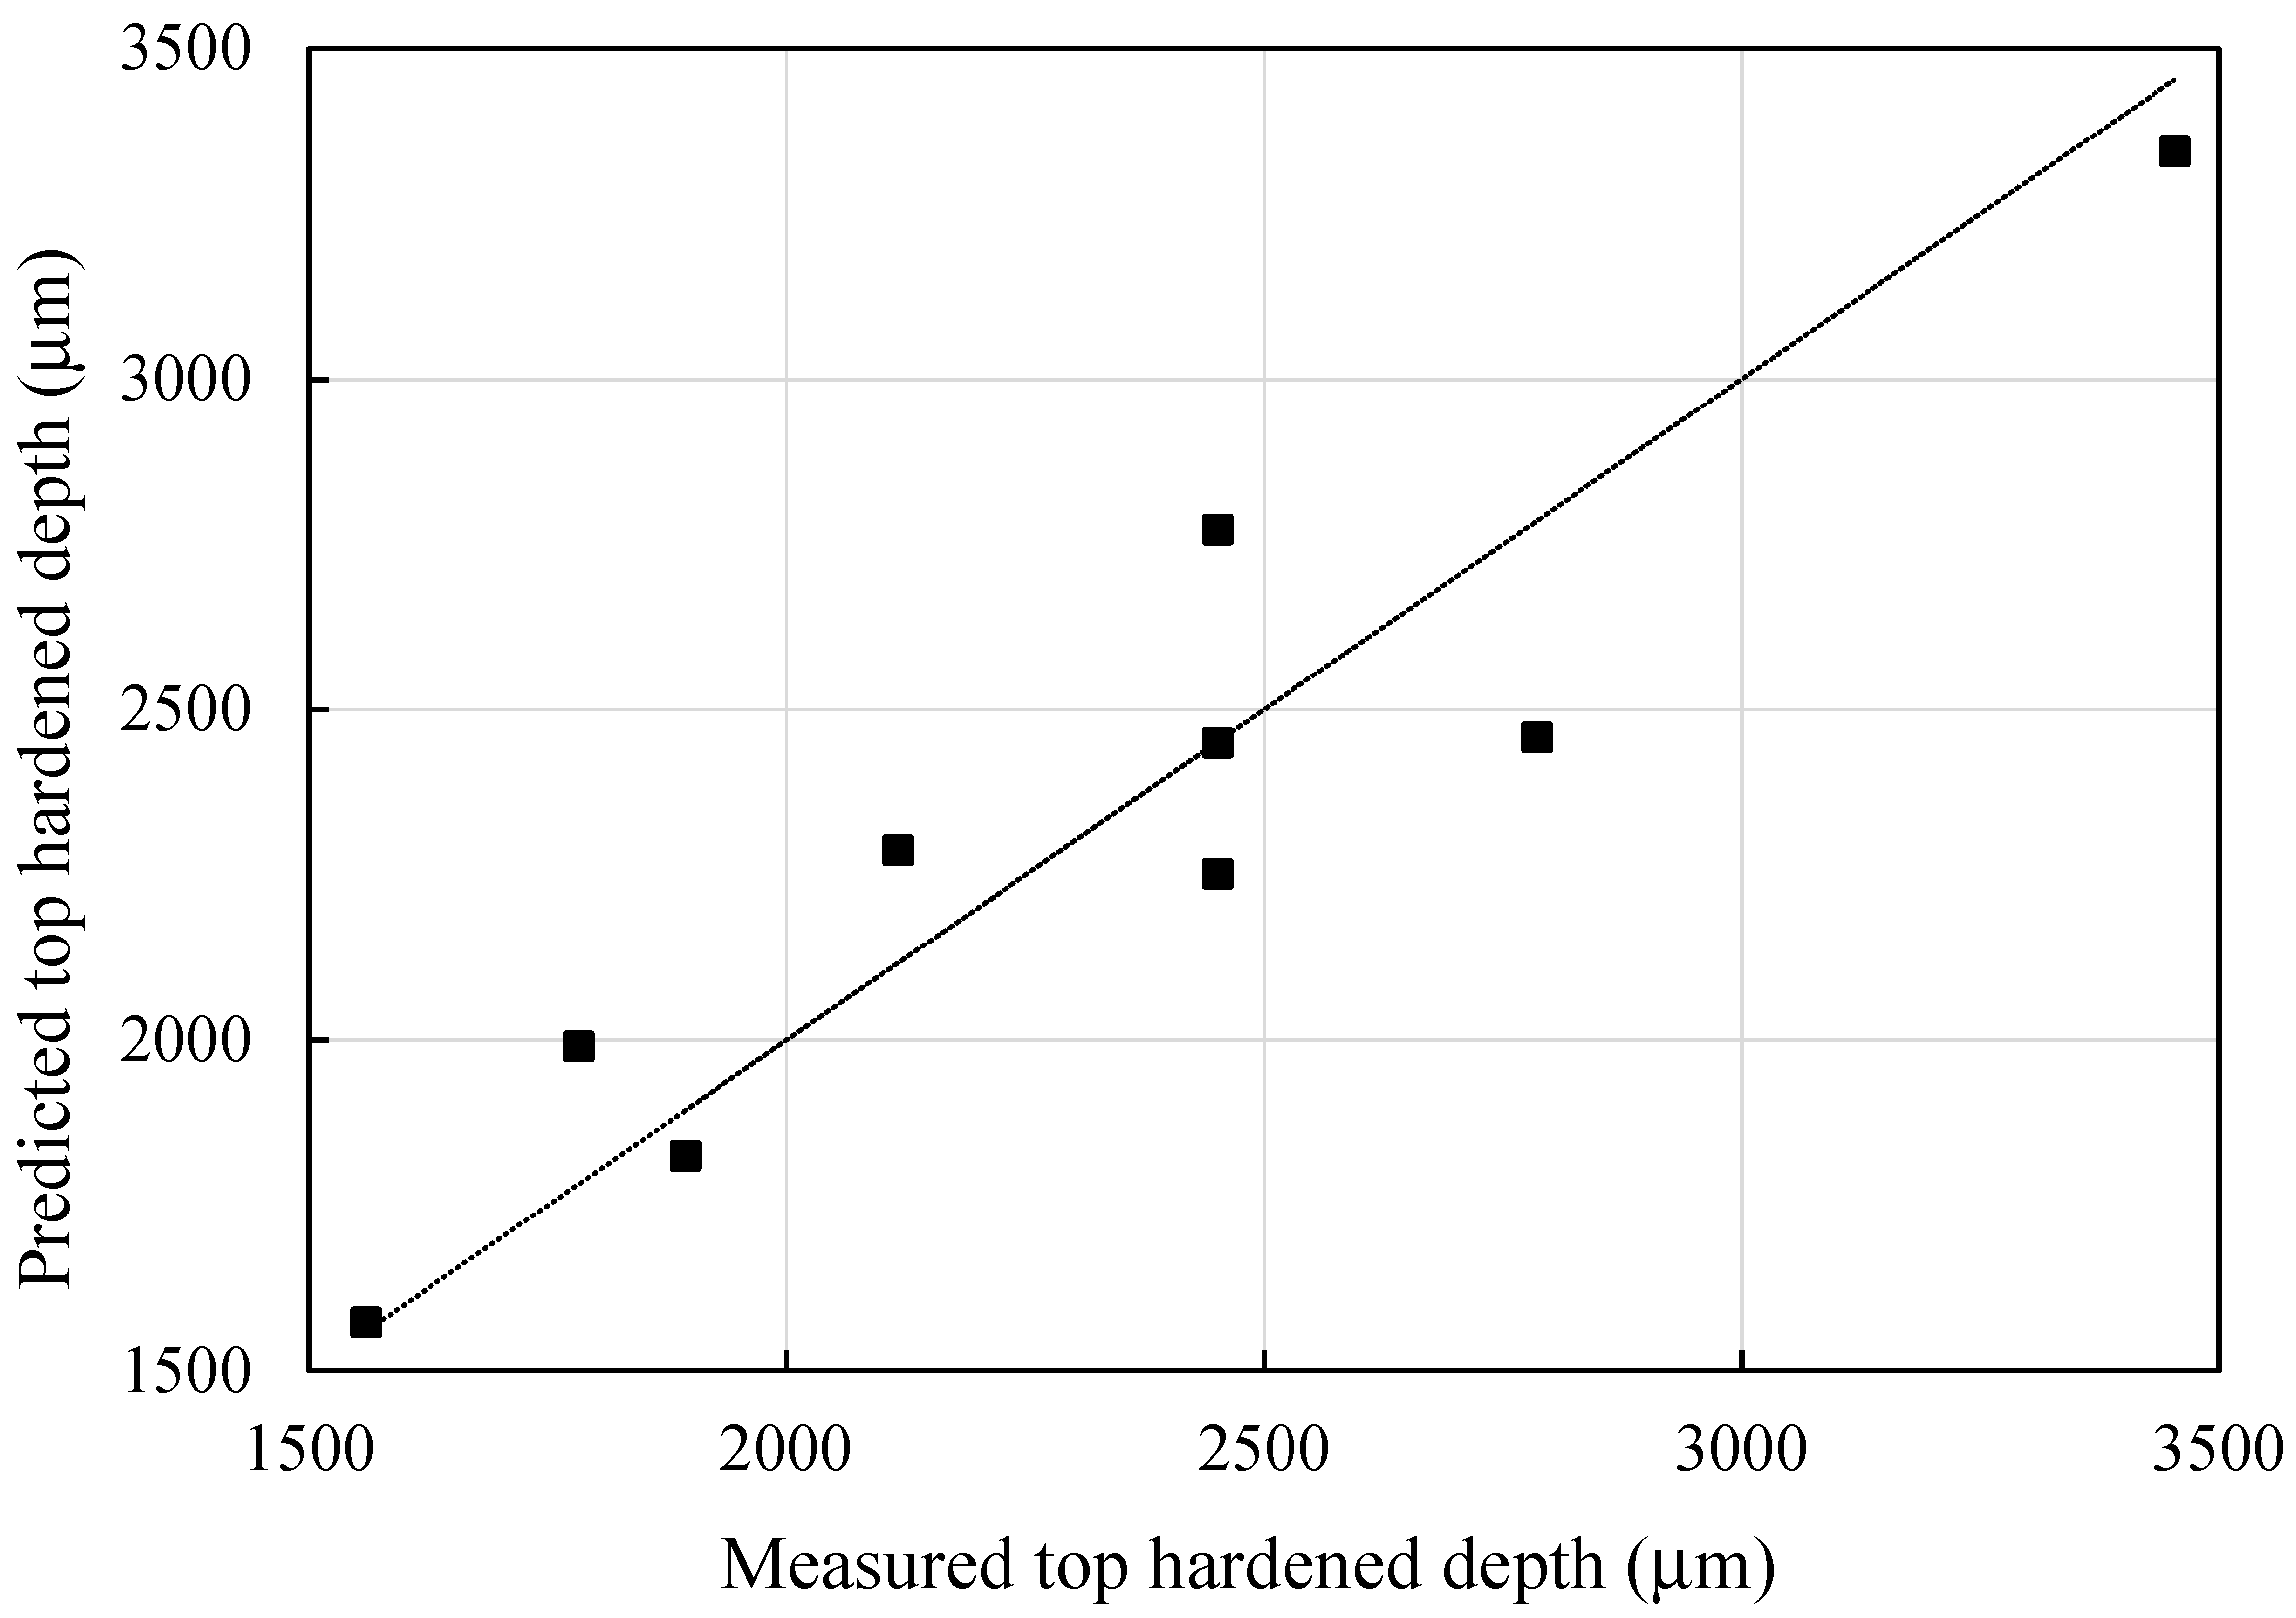
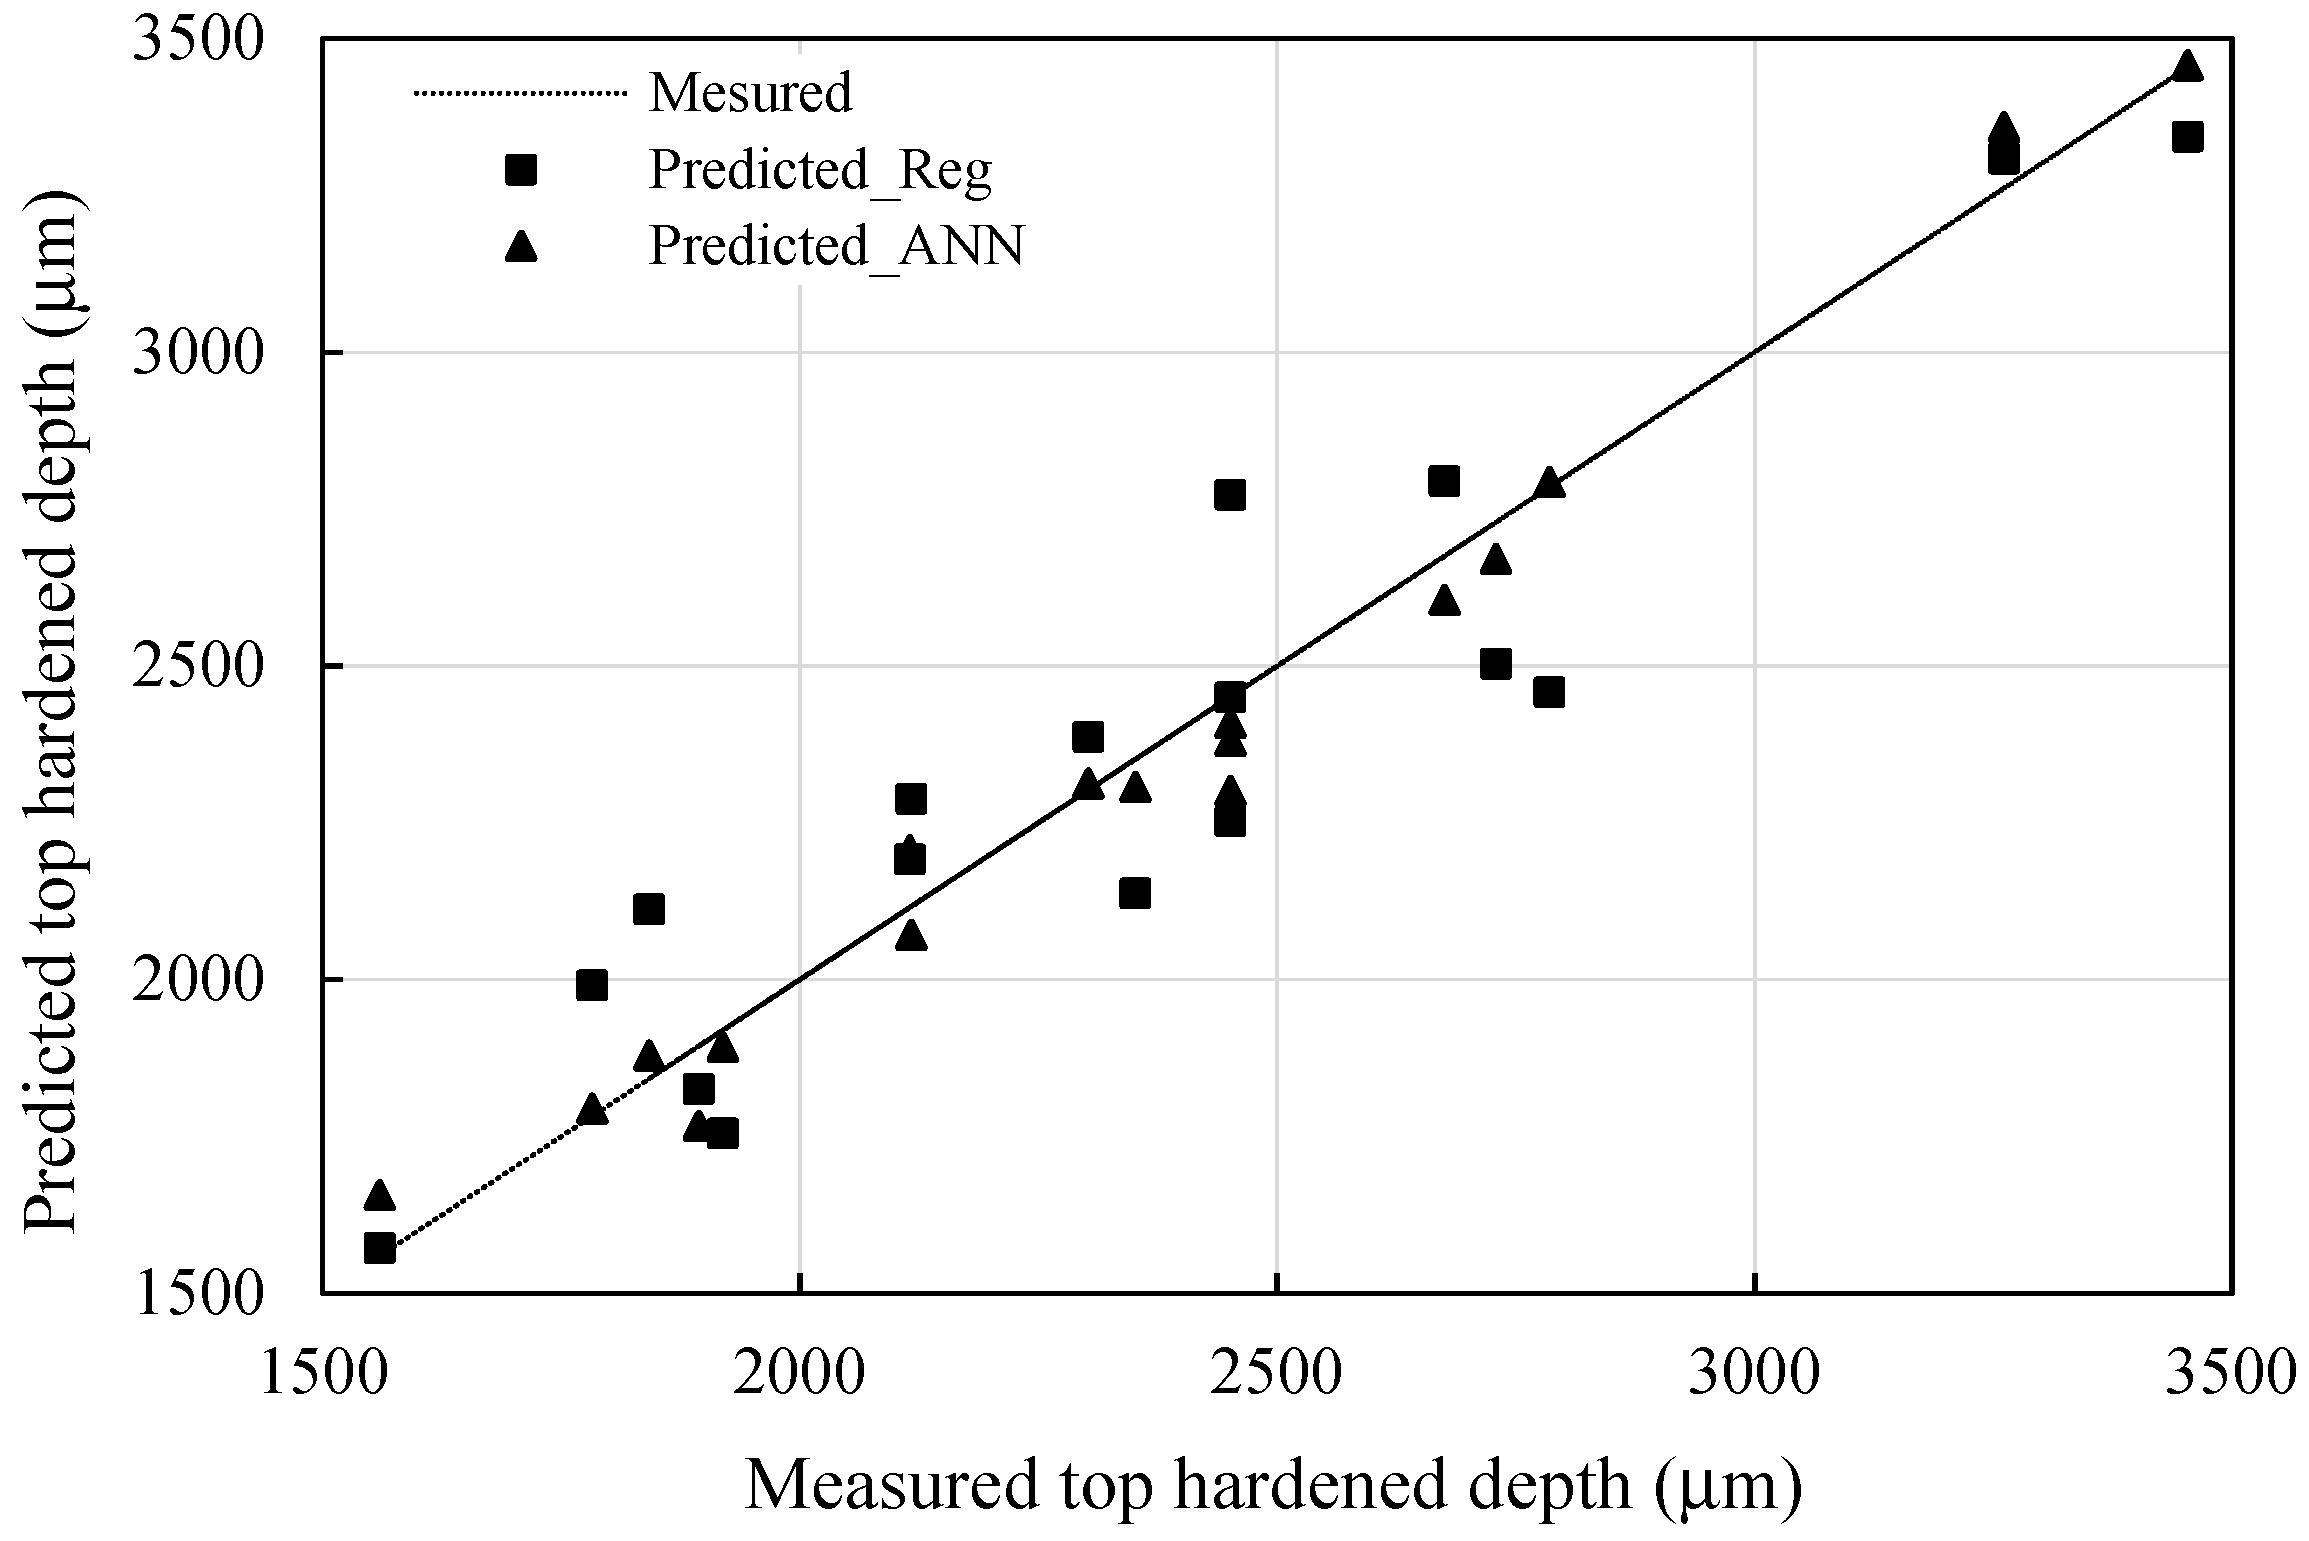
Globally, the total contributions of the parameters and the interactions exceed 96.5%, suggesting good experimental planning. The error remains within an acceptable level (3.15%), signifying that the most important process parameters influencing the hardened depth are all included in the experiments. These results suggest that there are many options to consider in building an efficient hardened depth (HD) estimation model. As an example, all the process parameters and the interactions are included in a regression model derived from ANOVA and proposed in Equation (1). The relationship between predicted and measured tooth top hardened depth is represented in
Figure 11.
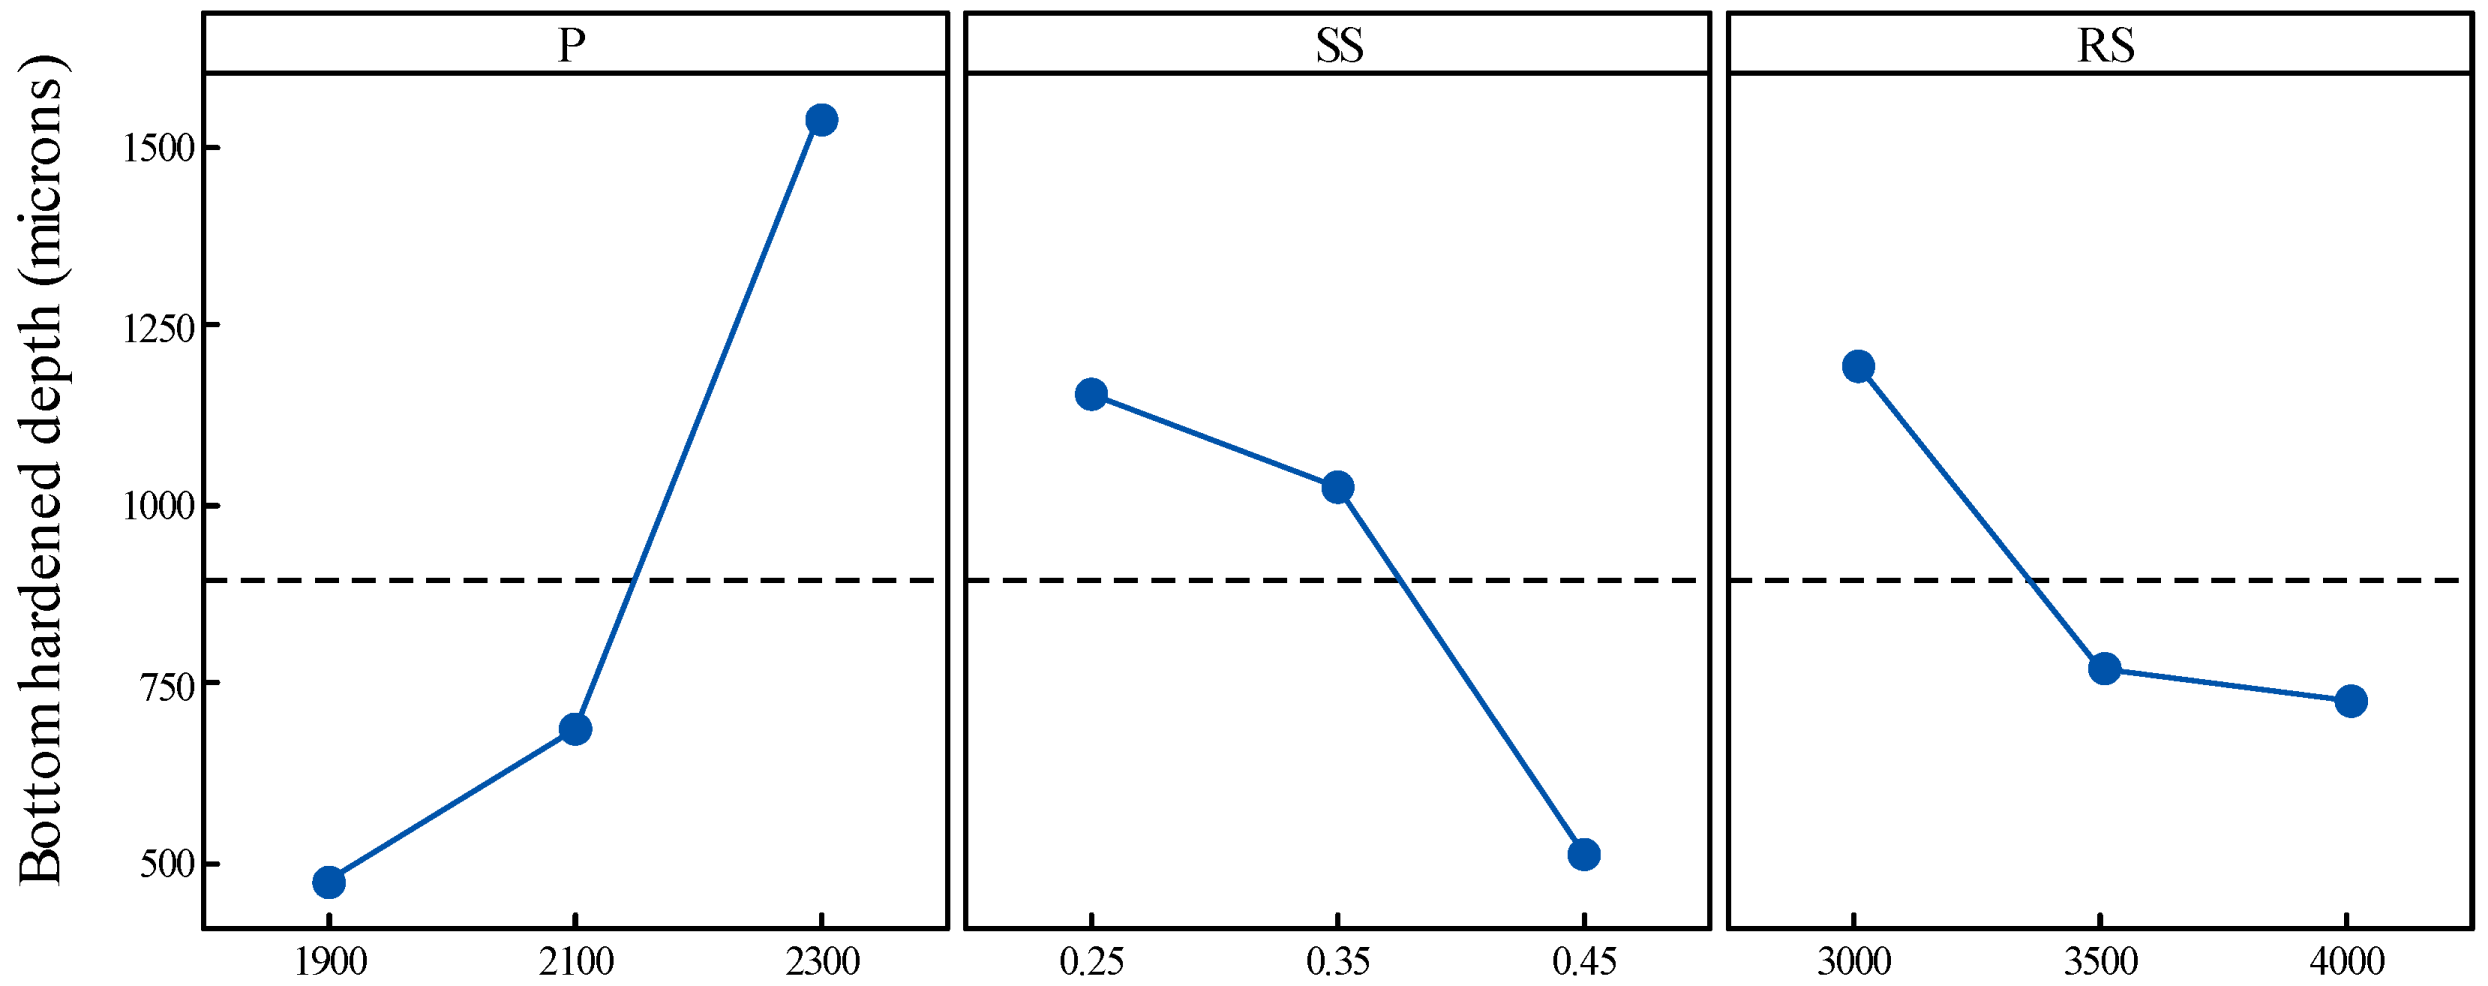
Given the strong correlation between top and bottom hardened depths, ANOVA led to the same types of results.
Figure 12 shows the average effects of the process parameters on the bottom hardened depth. Again, P is the most dominant factor. This observation is confirmed by the percent contribution.
Table 8 presents a detailed ANOVA. P has the greatest effect (52.08%). The SS is the second most significant parameter with 18.75% and RS is the least significant parameter with the smallest effect (10.08%). These results are confirmed by the correlation analysis between the process parameters and the hardened depths presented in
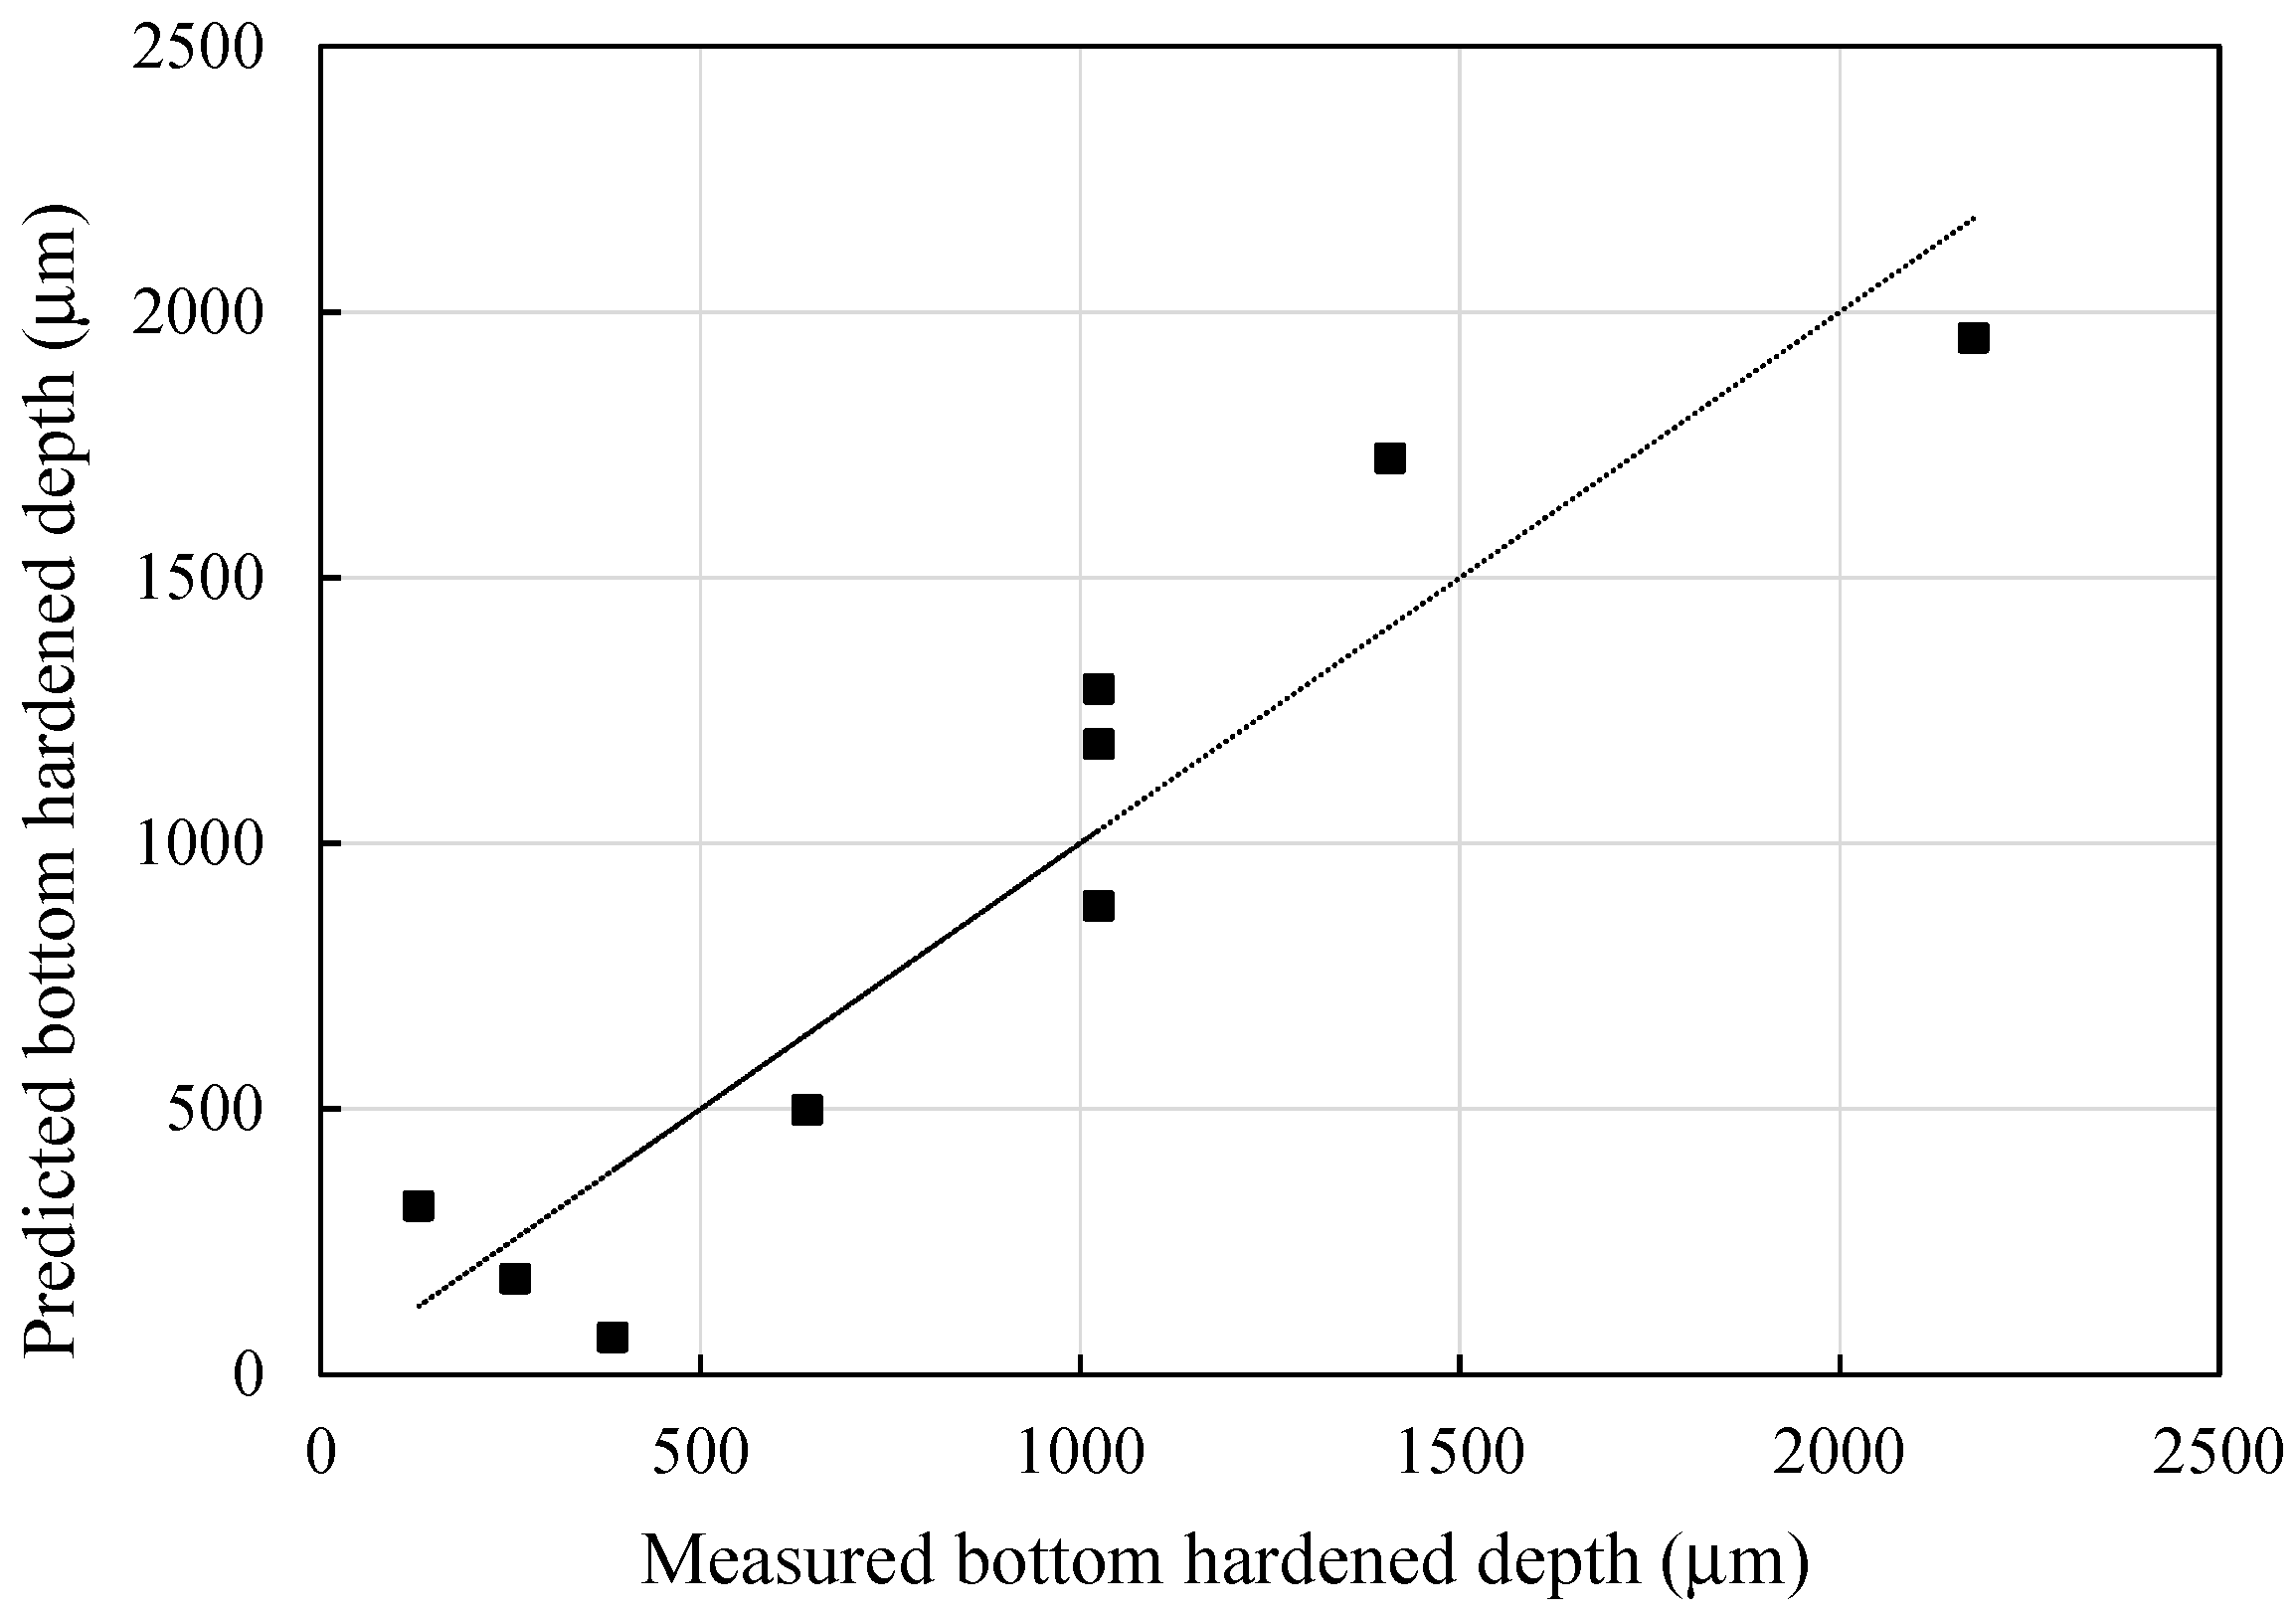
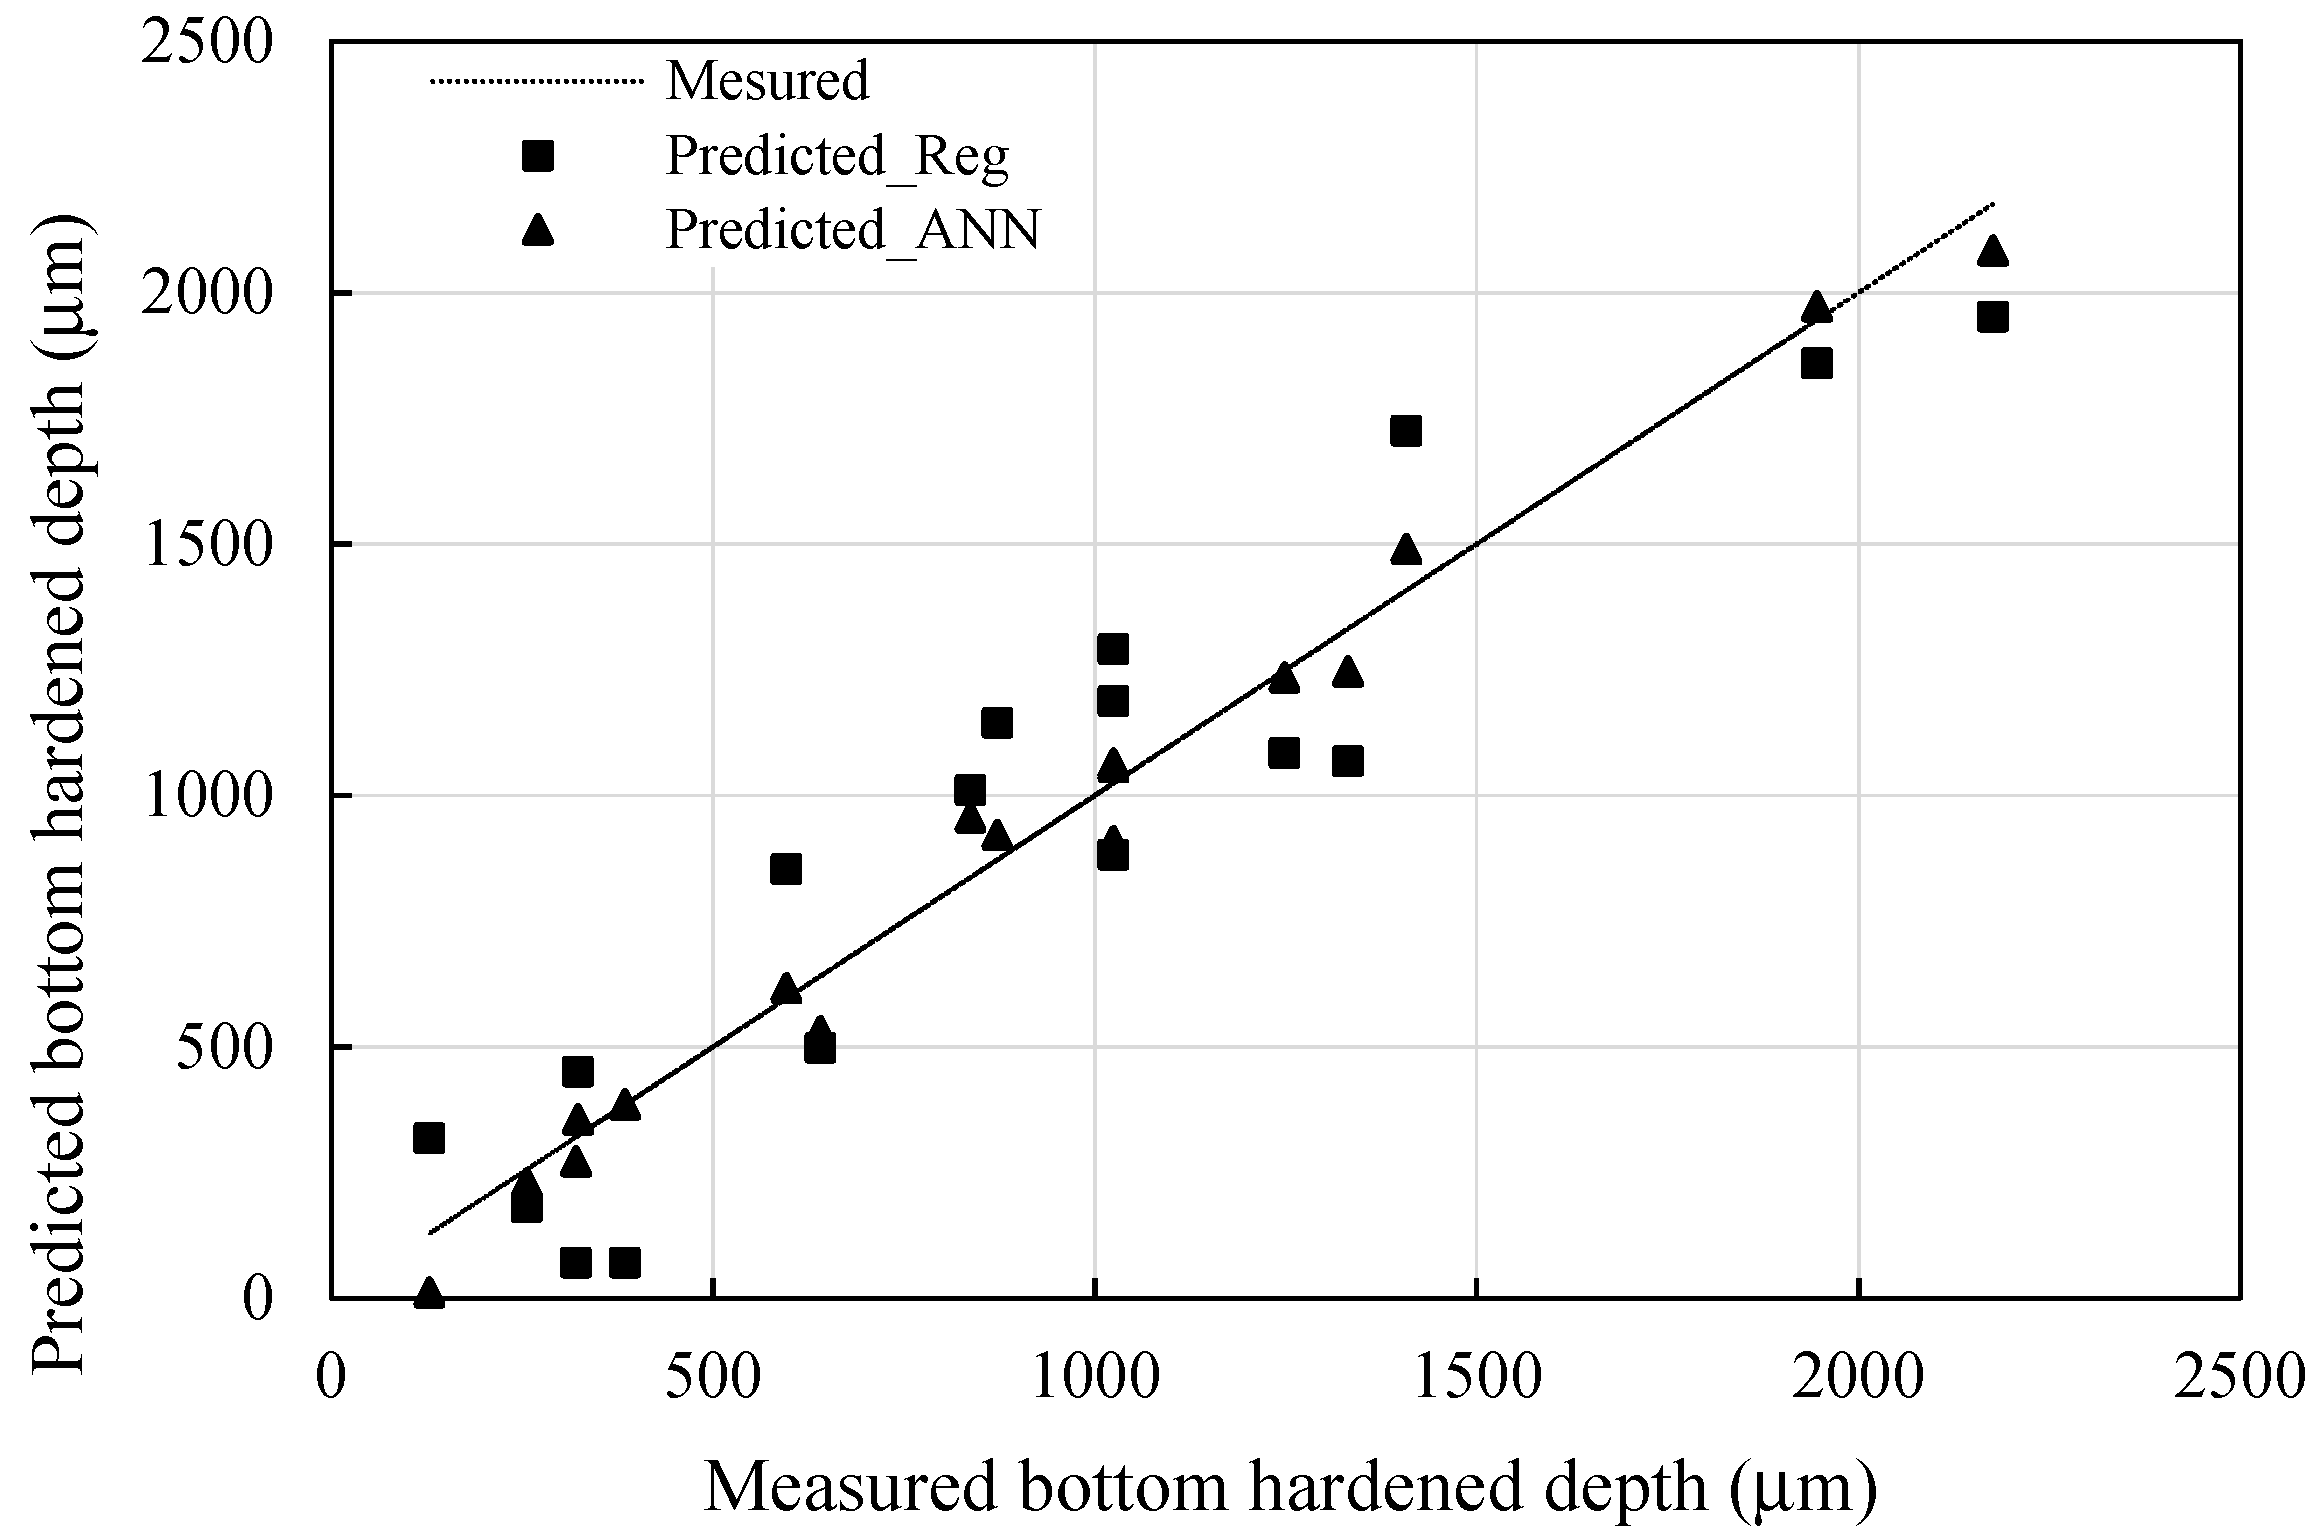
Table 7. The contribution of the interaction between the three parameters is less important, representing about 16%. Here again, P and SS interaction has a less significant contribution. The error remains within acceptable levels (2.90%) suggesting a good experimental design and planning. Accordingly, all the process parameters and the interactions are included in a regression model proposed in Equation (2). The relationship between predicted and measured tooth bottom hardened depth is represented in
Figure 13.
ANOVA is used to investigate whether the process parameters and the interactions have significant effects on the hardness profile and to identify the variables to include in the model. ANOVA is also used to estimate the significance of the regression model at 5% significance level. The model is considered significant if the significance probability value (p-value) is less than 0.05. Despite the F-value of 10.26 and 11.14 for top hardened depth and bottom hardened depth, respectively, suggesting that the models are significant, the p-values for the model are bigger than the significance level of 5%, and the model terms are statistically insignificant. The coefficients of determination used to measure the performance of the models do not exceed 87% and 88% for top and bottom hardened depths, respectively. These observations suggest that the regression approach is inappropriate for this problem.
In order to produce accurate and efficient models for hardened depth prediction, an alternative modeling approach able to handle variables exhibiting complex and nonlinear relationships is needed. Although several modeling techniques can be used to produce such a model, artificial neural networks (ANN) is an effective tool for this type of applications [
29,
30], thus ANN is proposed as an illustrative example for the hardened depth prediction model. Although many ANN models can be used in this application, the multilayer feedforward network seems to be one of the most convenient for its suppleness and simplicity. Before starting to train the ANN model, it is important to establish the number and the size of the hidden layers and adjust the training performance. The idea is to identify the relationship between the number of inputs, the hidden layer size, and the parameters to estimate. For this reason, several ANN architectures are studied. The best results are achieved using an architecture combining three inputs, one hidden layer with 10 neurons, and three outputs.
The experimental data from the L
9 design is used to train the ANN-based prediction model. The experimentation results suggest that the three process parameters have significant effects on the hardened depth. Consequently, P, SS, and RS are used as input to the ANN model. Moreover, to test the ANN-based prediction model, additional experimental data are produced for the model validation phase. The experimentation is built using an L
8 and the middle values of the factors considered in the L
9.
Table 9 shows the factors and levels used in the experimental design for the model validation.
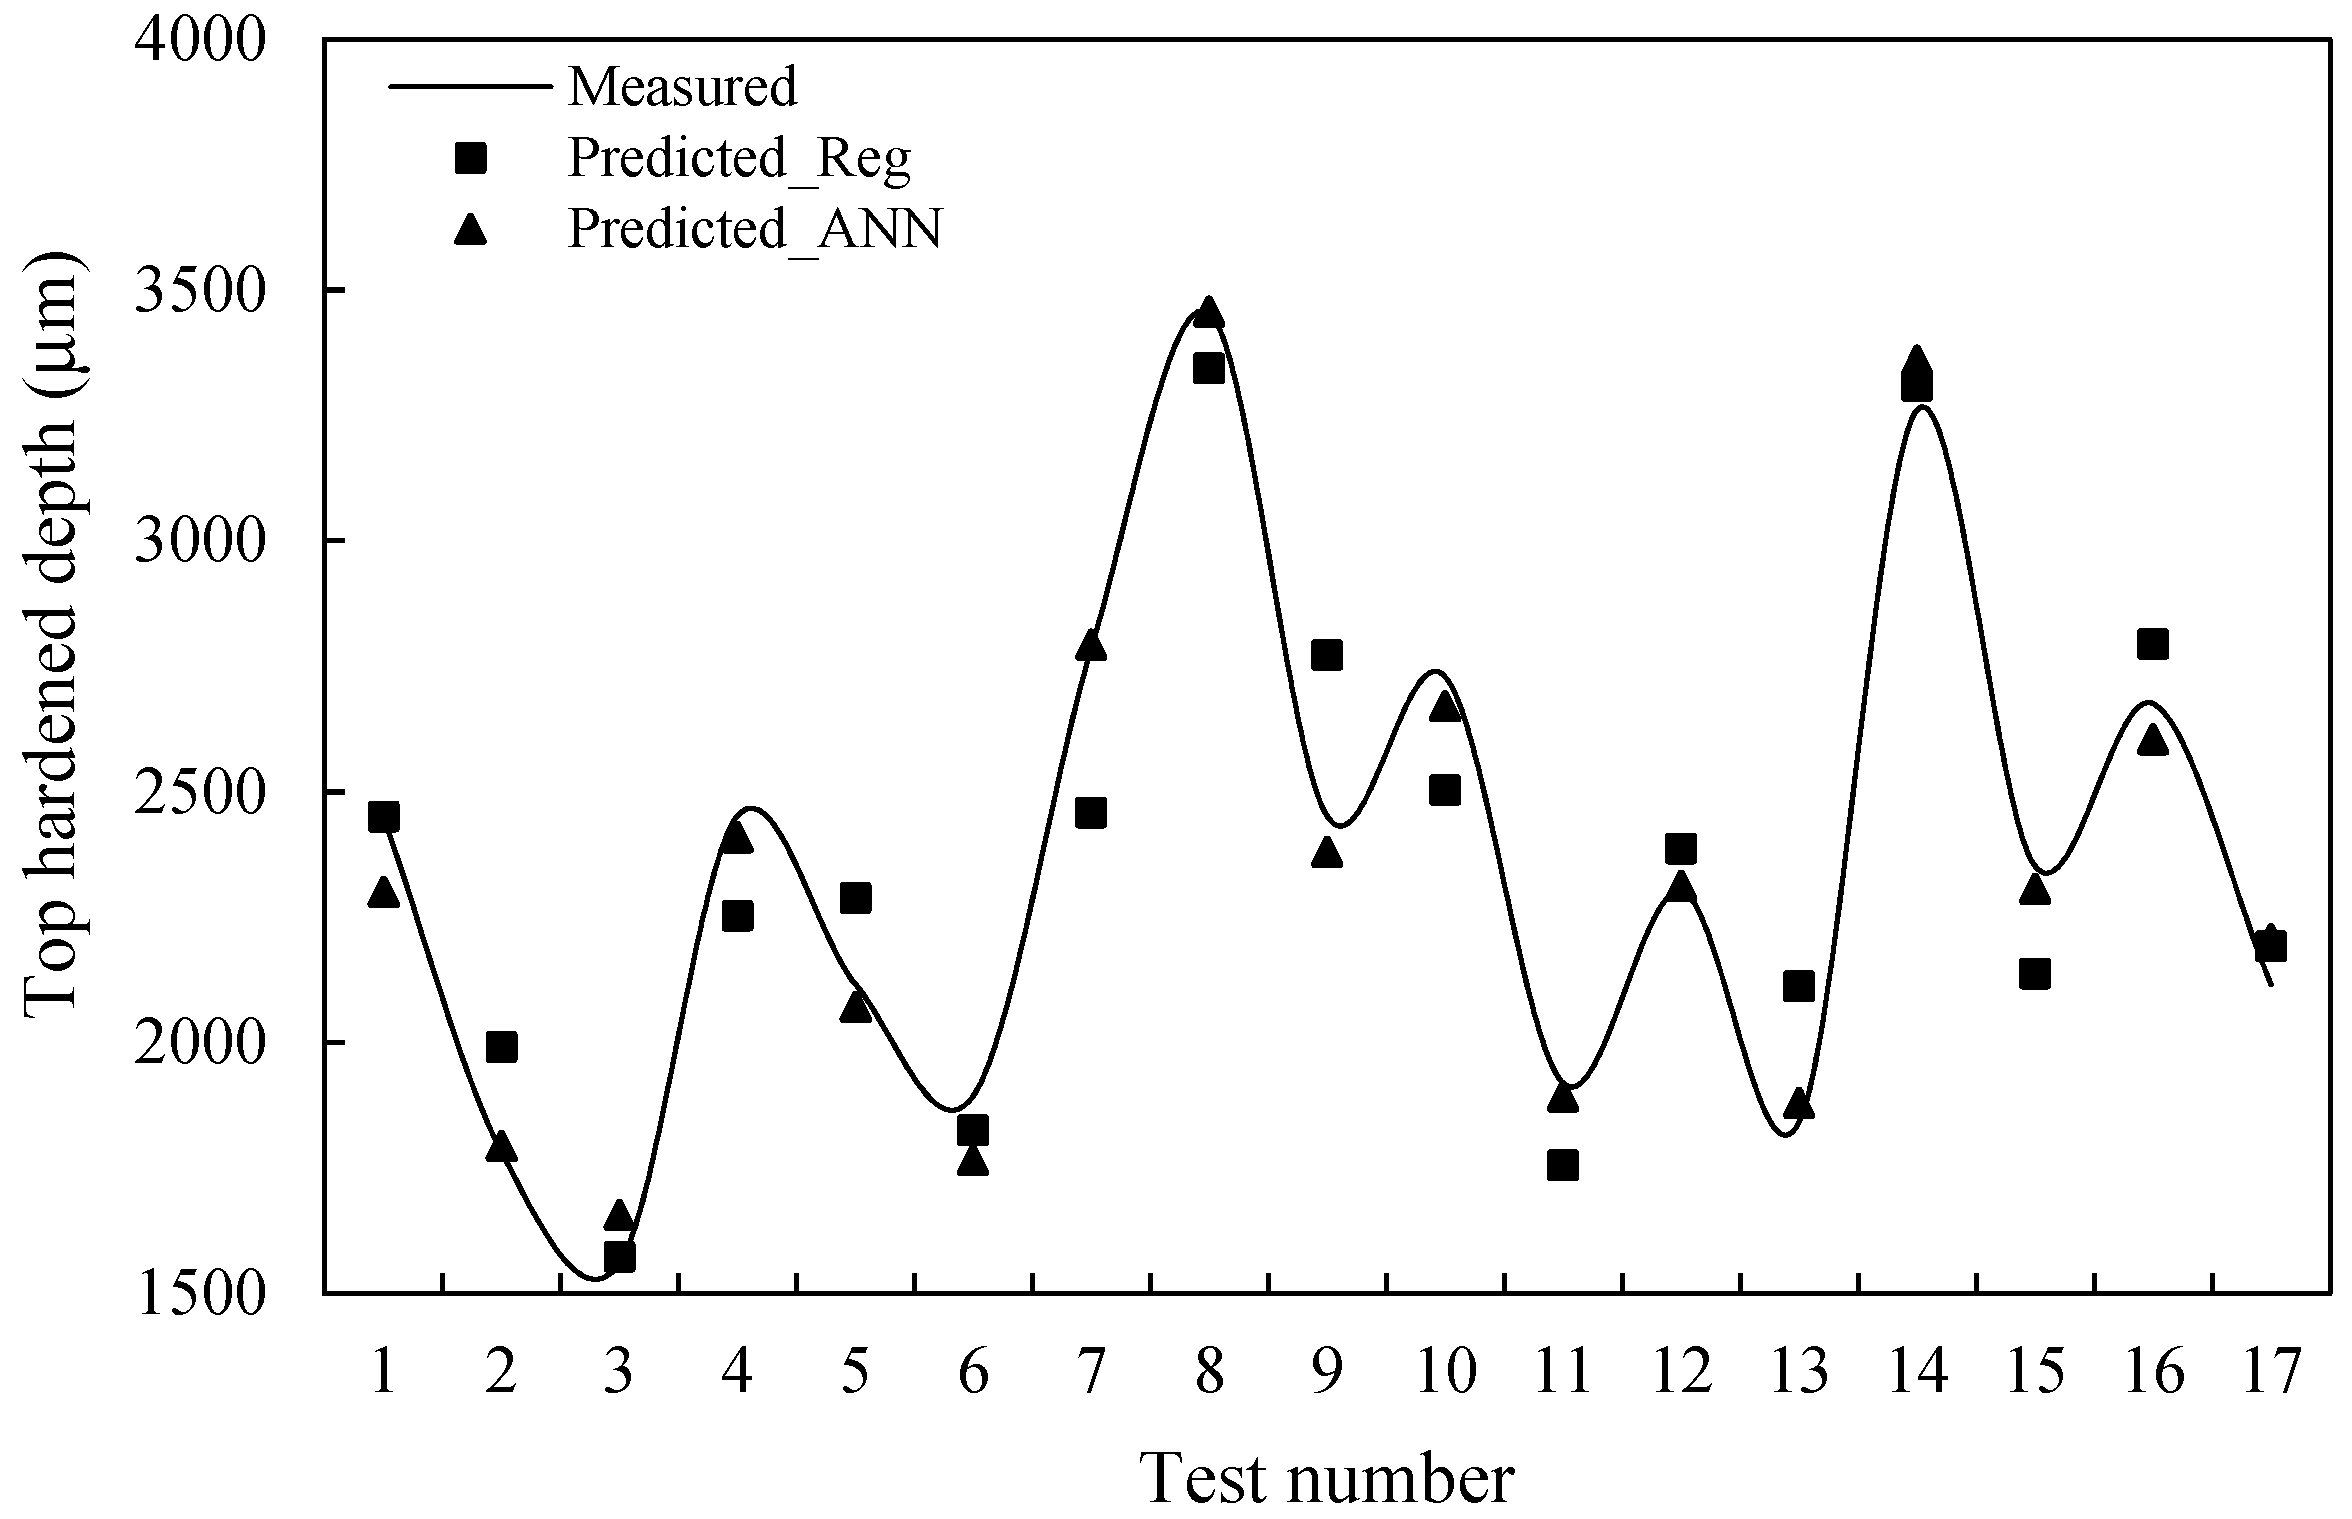
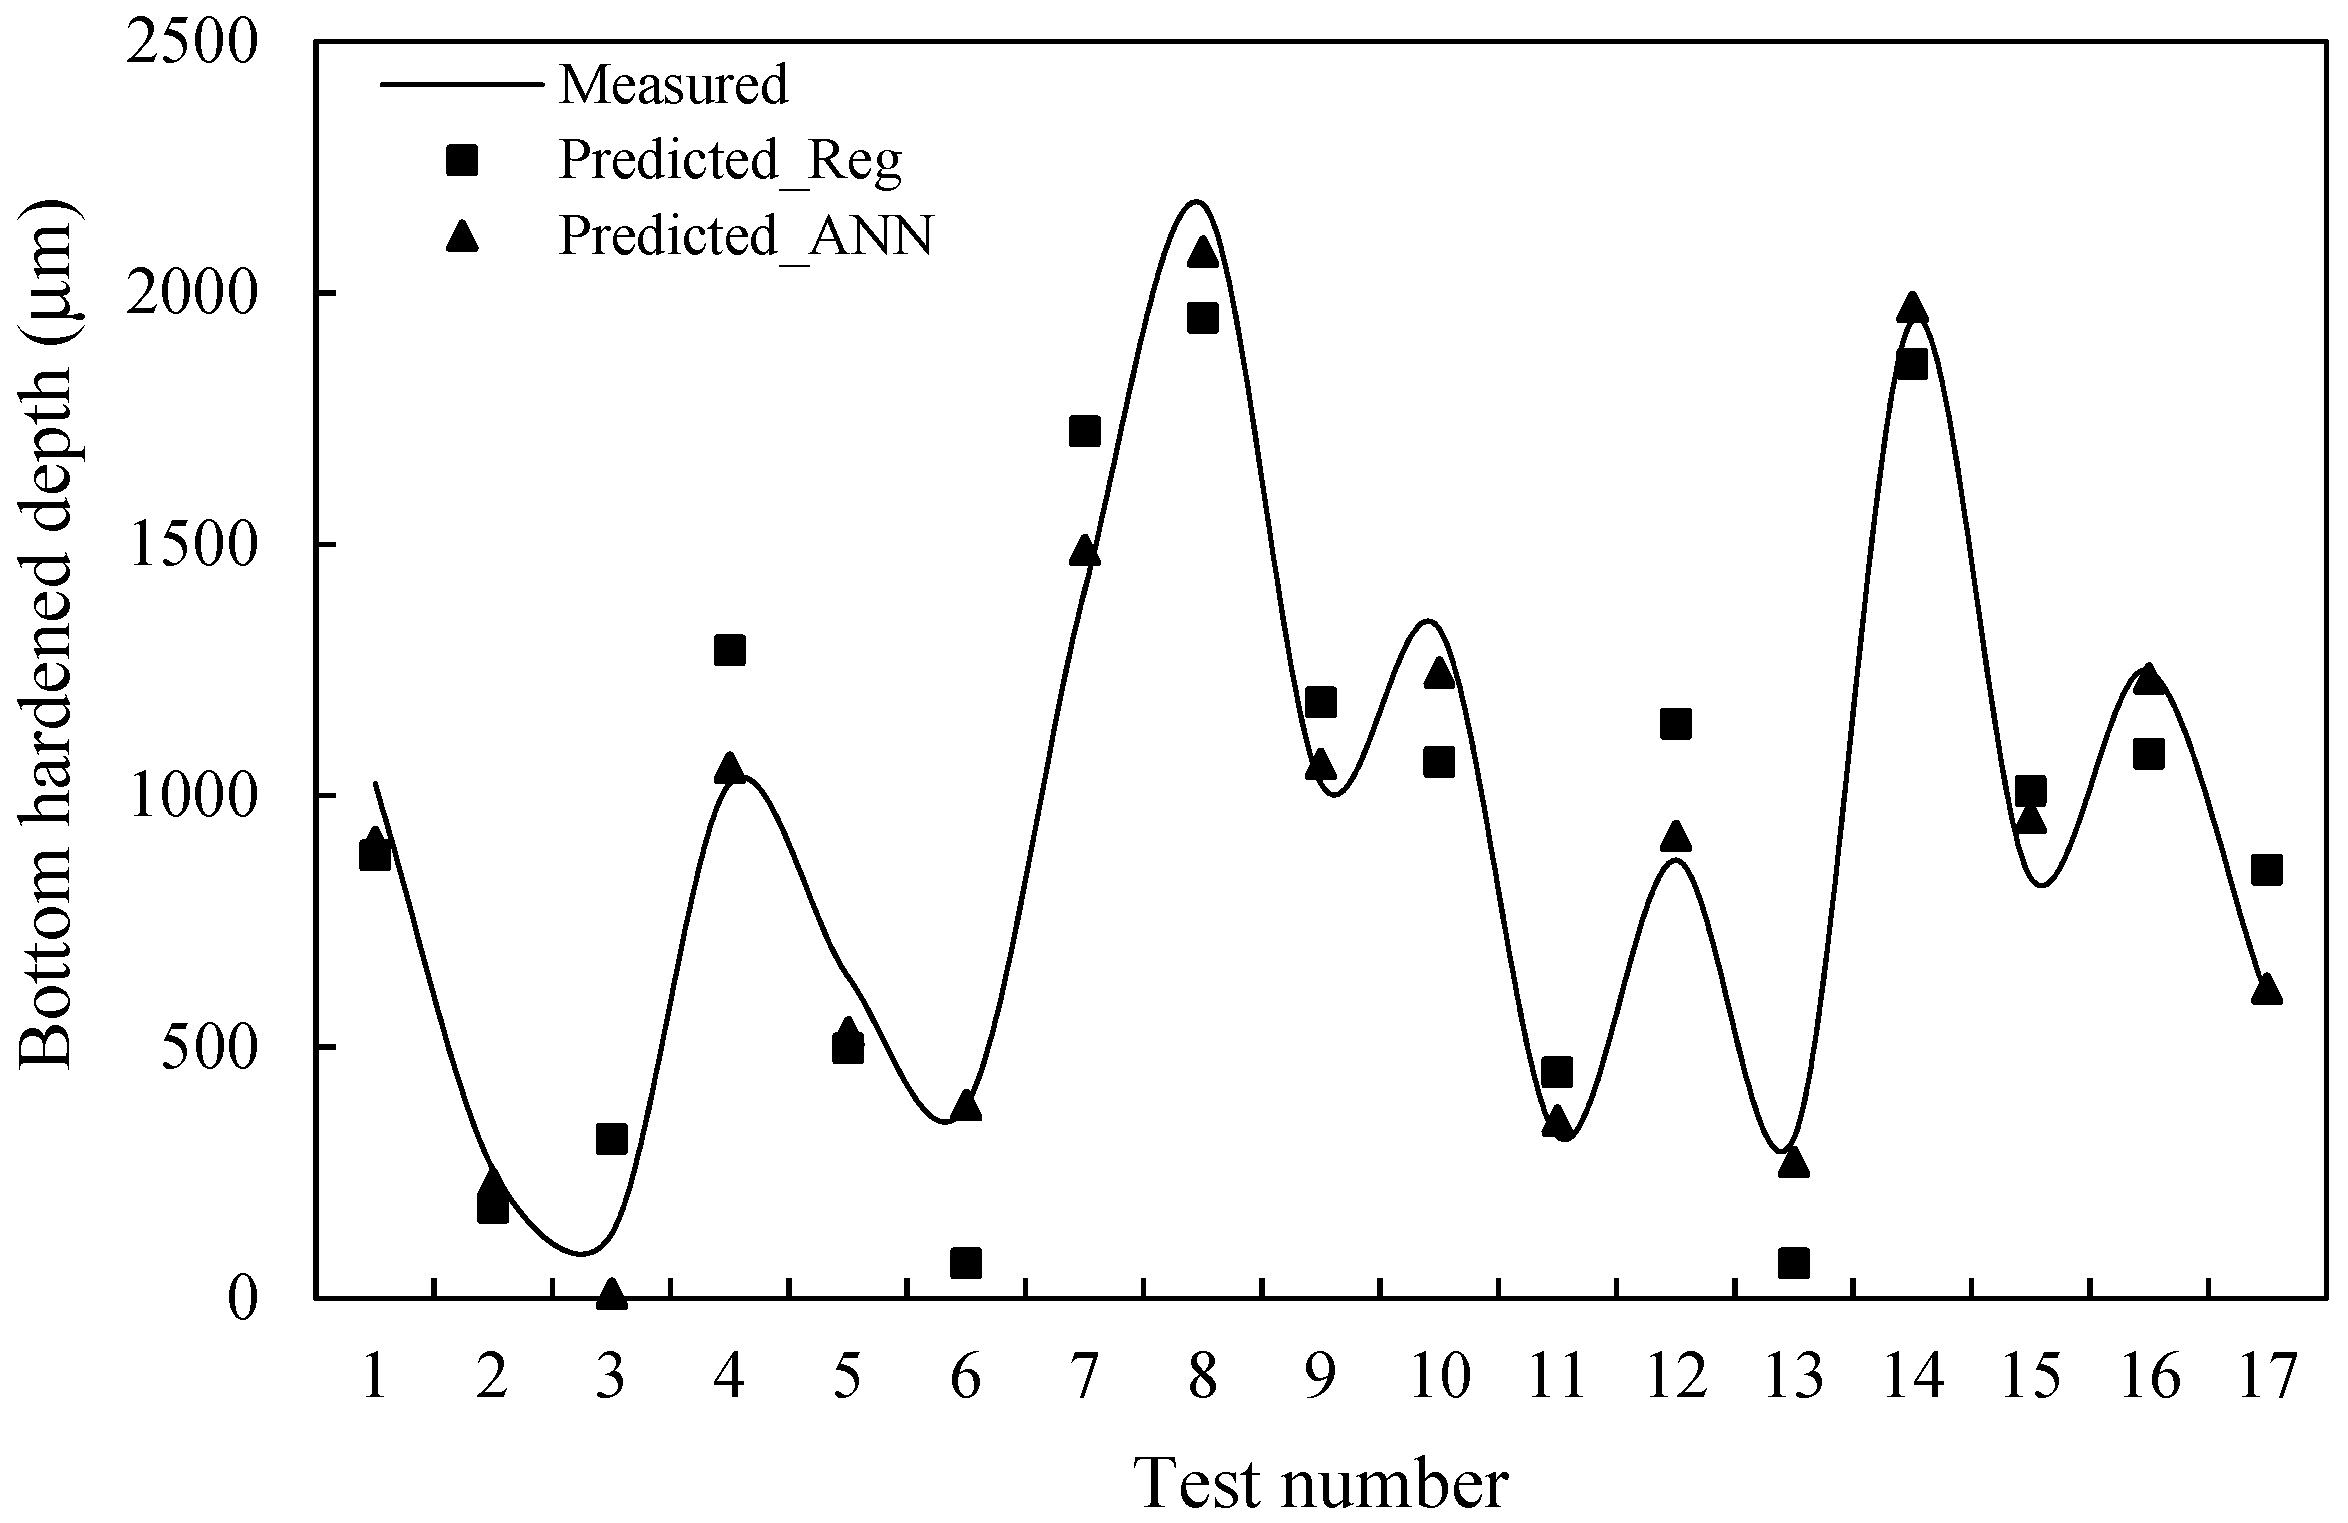
The measured and predicted hardened depths are shown in
Figure 14 and
Figure 15 for the regression and the ANN-based prediction models.
Figure 16 and
Figure 17 present the measured and the predicted curves fitting for tooth top and bottom hardened depth, respectively. These results demonstrate that the ANN presents more enhanced modeling performance than the regression. With a coefficient of determination at more than 98%, the modeling approach can be very effective in this case. Experimentation covering more factors and more levels for more training and validation data, as well as an improvement of the modeling conditions, can lead to more accurate and efficient prediction models.


